Fairview, AL Map & Demographics
Fairview Map
Fairview Overview
$23,377
PER CAPITA INCOME
$56,563
AVG FAMILY INCOME
$42,500
AVG HOUSEHOLD INCOME
29.2%
WAGE / INCOME GAP [ % ]
70.8¢/ $1
WAGE / INCOME GAP [ $ ]
$6,732
FAMILY INCOME DEFICIT
0.45
INEQUALITY / GINI INDEX
681
TOTAL POPULATION
394
MALE POPULATION
287
FEMALE POPULATION
137.28
MALES / 100 FEMALES
72.84
FEMALES / 100 MALES
35.3
MEDIAN AGE
3.5
AVG FAMILY SIZE
3.0
AVG HOUSEHOLD SIZE
255
LABOR FORCE [ PEOPLE ]
51.5%
PERCENT IN LABOR FORCE
11.4%
UNEMPLOYMENT RATE
Income in Fairview
Income Overview in Fairview
Per Capita Income in Fairview is $23,377, while median incomes of families and households are $56,563 and $42,500 respectively.
| Characteristic | Number | Measure |
| Per Capita Income | 681 | $23,377 |
| Median Family Income | 177 | $56,563 |
| Mean Family Income | 177 | $73,469 |
| Median Household Income | 224 | $42,500 |
| Mean Household Income | 224 | $64,280 |
| Income Deficit | 177 | $6,732 |
| Wage / Income Gap (%) | 681 | 29.18% |
| Wage / Income Gap ($) | 681 | 70.82¢ per $1 |
| Gini / Inequality Index | 681 | 0.45 |
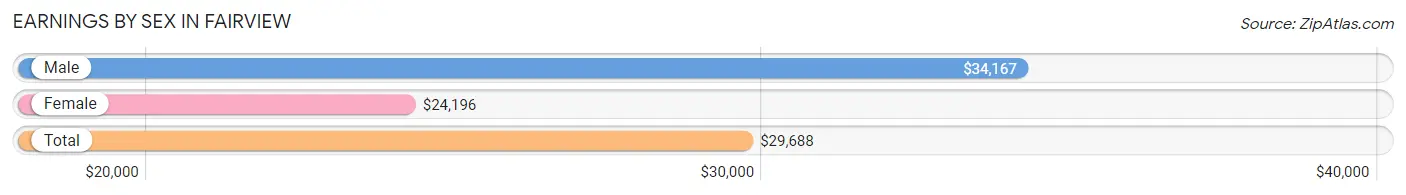
Earnings by Sex in Fairview
Average Earnings in Fairview are $29,688, $34,167 for men and $24,196 for women, a difference of 29.2%.
| Sex | Number | Average Earnings |
| Male | 138 (54.5%) | $34,167 |
| Female | 115 (45.5%) | $24,196 |
| Total | 253 (100.0%) | $29,688 |
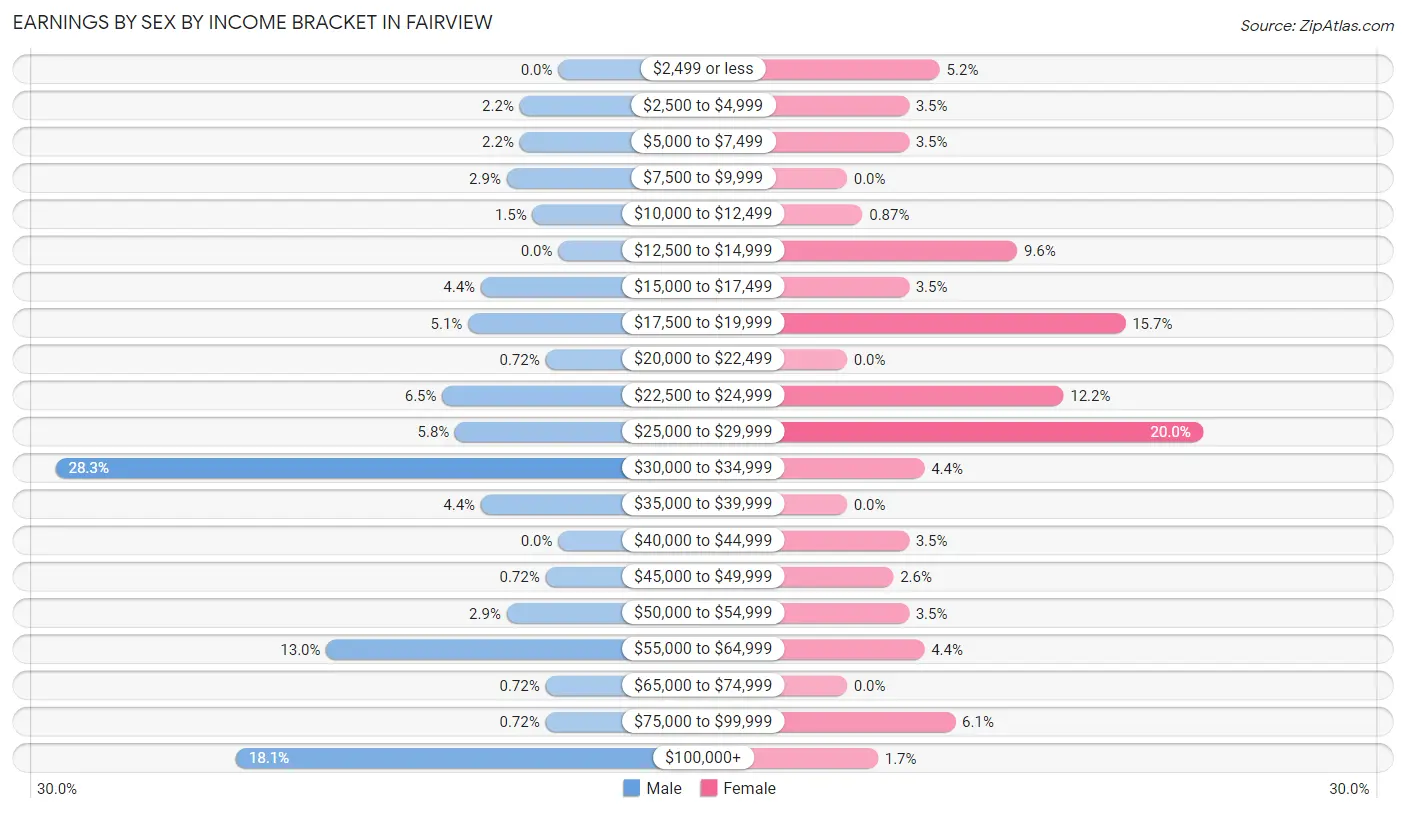
Earnings by Sex by Income Bracket in Fairview
The most common earnings brackets in Fairview are $30,000 to $34,999 for men (39 | 28.3%) and $25,000 to $29,999 for women (23 | 20.0%).
| Income | Male | Female |
| $2,499 or less | 0 (0.0%) | 6 (5.2%) |
| $2,500 to $4,999 | 3 (2.2%) | 4 (3.5%) |
| $5,000 to $7,499 | 3 (2.2%) | 4 (3.5%) |
| $7,500 to $9,999 | 4 (2.9%) | 0 (0.0%) |
| $10,000 to $12,499 | 2 (1.5%) | 1 (0.9%) |
| $12,500 to $14,999 | 0 (0.0%) | 11 (9.6%) |
| $15,000 to $17,499 | 6 (4.3%) | 4 (3.5%) |
| $17,500 to $19,999 | 7 (5.1%) | 18 (15.7%) |
| $20,000 to $22,499 | 1 (0.7%) | 0 (0.0%) |
| $22,500 to $24,999 | 9 (6.5%) | 14 (12.2%) |
| $25,000 to $29,999 | 8 (5.8%) | 23 (20.0%) |
| $30,000 to $34,999 | 39 (28.3%) | 5 (4.3%) |
| $35,000 to $39,999 | 6 (4.3%) | 0 (0.0%) |
| $40,000 to $44,999 | 0 (0.0%) | 4 (3.5%) |
| $45,000 to $49,999 | 1 (0.7%) | 3 (2.6%) |
| $50,000 to $54,999 | 4 (2.9%) | 4 (3.5%) |
| $55,000 to $64,999 | 18 (13.0%) | 5 (4.3%) |
| $65,000 to $74,999 | 1 (0.7%) | 0 (0.0%) |
| $75,000 to $99,999 | 1 (0.7%) | 7 (6.1%) |
| $100,000+ | 25 (18.1%) | 2 (1.7%) |
| Total | 138 (100.0%) | 115 (100.0%) |
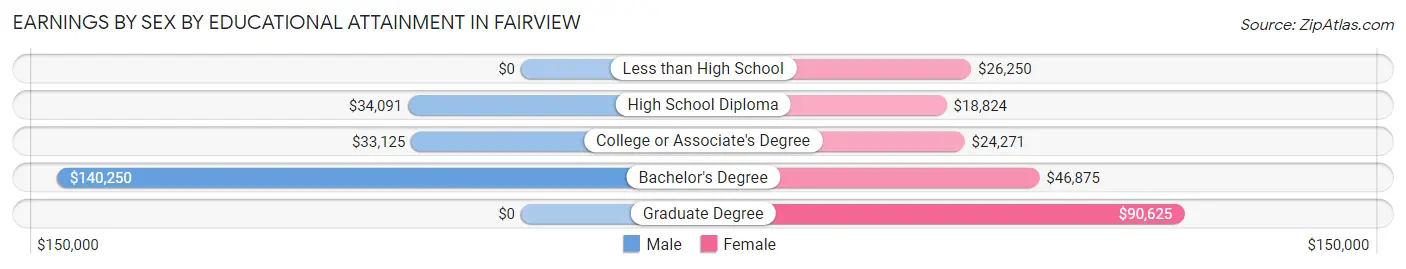
Earnings by Sex by Educational Attainment in Fairview
Average earnings in Fairview are $34,359 for men and $24,911 for women, a difference of 27.5%. Men with an educational attainment of bachelor's degree enjoy the highest average annual earnings of $140,250, while those with college or associate's degree education earn the least with $33,125. Women with an educational attainment of graduate degree earn the most with the average annual earnings of $90,625, while those with high school diploma education have the smallest earnings of $18,824.
| Educational Attainment | Male Income | Female Income |
| Less than High School | - | - |
| High School Diploma | $34,091 | $18,824 |
| College or Associate's Degree | $33,125 | $24,271 |
| Bachelor's Degree | $140,250 | $46,875 |
| Graduate Degree | - | - |
| Total | $34,359 | $24,911 |
Family Income in Fairview
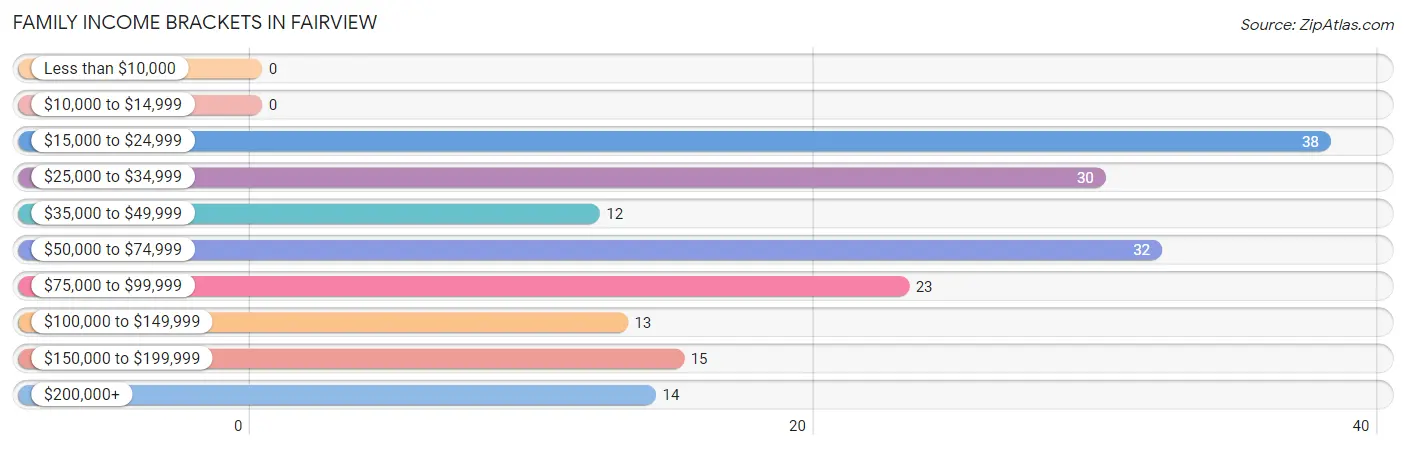
Family Income Brackets in Fairview
According to the Fairview family income data, there are 38 families falling into the $15,000 to $24,999 income range, which is the most common income bracket and makes up 21.5% of all families.
| Income Bracket | # Families | % Families |
| Less than $10,000 | 0 | 0.0% |
| $10,000 to $14,999 | 0 | 0.0% |
| $15,000 to $24,999 | 38 | 21.5% |
| $25,000 to $34,999 | 30 | 16.9% |
| $35,000 to $49,999 | 12 | 6.8% |
| $50,000 to $74,999 | 32 | 18.1% |
| $75,000 to $99,999 | 23 | 13.0% |
| $100,000 to $149,999 | 13 | 7.3% |
| $150,000 to $199,999 | 15 | 8.5% |
| $200,000+ | 14 | 7.9% |
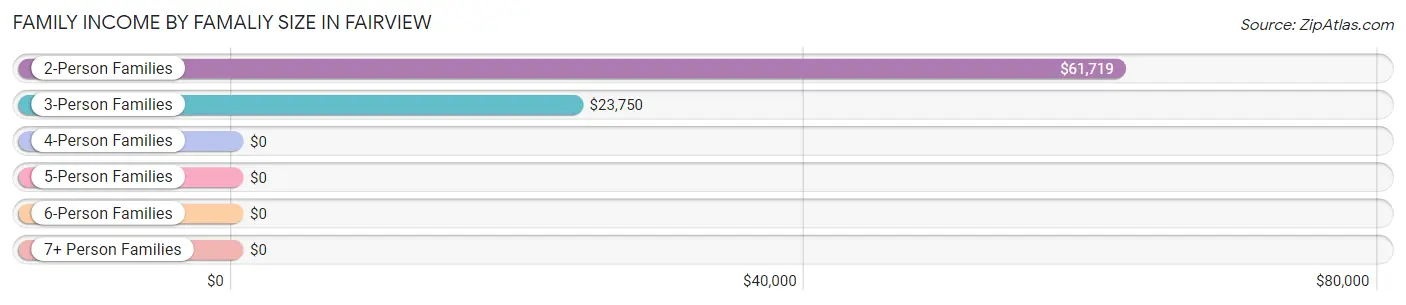
Family Income by Famaliy Size in Fairview
2-person families (93 | 52.5%) account for the highest median family income in Fairview with $61,719 per family, while 2-person families (93 | 52.5%) have the highest median income of $30,860 per family member.
| Income Bracket | # Families | Median Income |
| 2-Person Families | 93 (52.5%) | $61,719 |
| 3-Person Families | 33 (18.6%) | $23,750 |
| 4-Person Families | 27 (15.2%) | $0 |
| 5-Person Families | 20 (11.3%) | $0 |
| 6-Person Families | 0 (0.0%) | $0 |
| 7+ Person Families | 4 (2.3%) | $0 |
| Total | 177 (100.0%) | $56,563 |
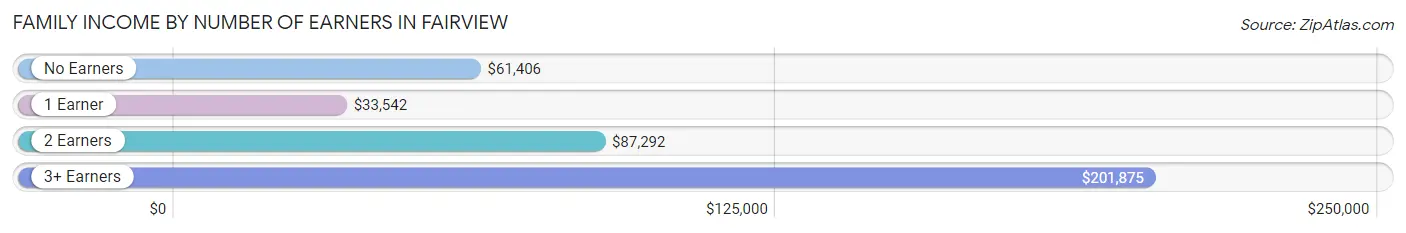
Family Income by Number of Earners in Fairview
The median family income in Fairview is $56,563, with families comprising 3+ earners (10) having the highest median family income of $201,875, while families with 1 earner (105) have the lowest median family income of $33,542, accounting for 5.7% and 59.3% of families, respectively.
| Number of Earners | # Families | Median Income |
| No Earners | 39 (22.0%) | $61,406 |
| 1 Earner | 105 (59.3%) | $33,542 |
| 2 Earners | 23 (13.0%) | $87,292 |
| 3+ Earners | 10 (5.7%) | $201,875 |
| Total | 177 (100.0%) | $56,563 |
Household Income in Fairview
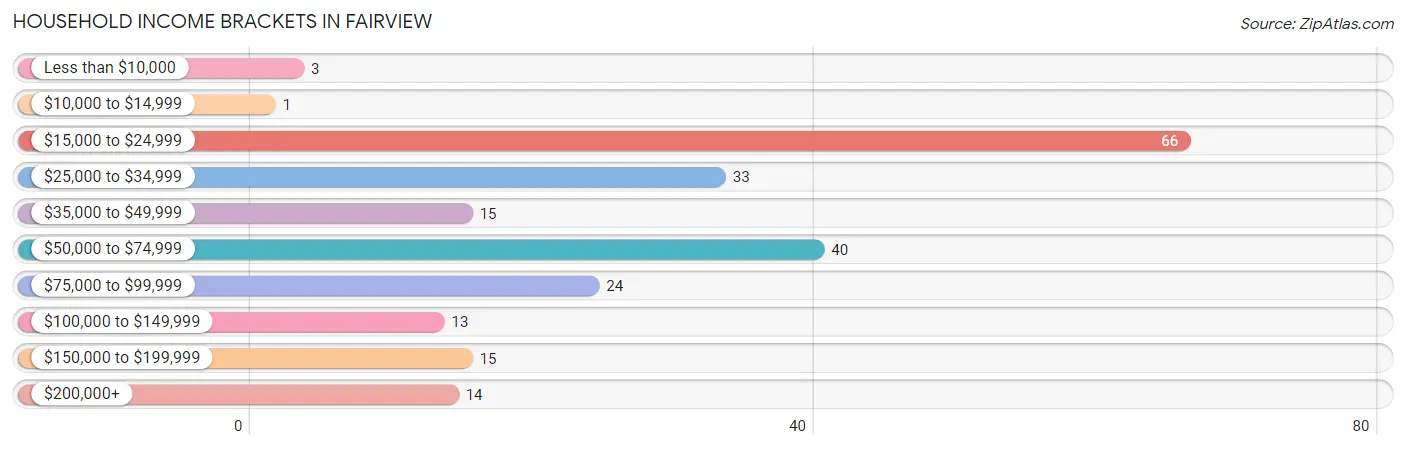
Household Income Brackets in Fairview
With 66 households falling in the category, the $15,000 to $24,999 income range is the most frequent in Fairview, accounting for 29.5% of all households. In contrast, only 1 households (0.4%) fall into the $10,000 to $14,999 income bracket, making it the least populous group.
| Income Bracket | # Households | % Households |
| Less than $10,000 | 3 | 1.3% |
| $10,000 to $14,999 | 1 | 0.4% |
| $15,000 to $24,999 | 66 | 29.5% |
| $25,000 to $34,999 | 33 | 14.7% |
| $35,000 to $49,999 | 15 | 6.7% |
| $50,000 to $74,999 | 40 | 17.9% |
| $75,000 to $99,999 | 24 | 10.7% |
| $100,000 to $149,999 | 13 | 5.8% |
| $150,000 to $199,999 | 15 | 6.7% |
| $200,000+ | 14 | 6.3% |
Household Income by Householder Age in Fairview
The median household income in Fairview is $42,500, with the highest median household income of $61,875 found in the 65+ years age bracket for the primary householder. A total of 76 households (33.9%) fall into this category. Meanwhile, the 15 to 24 years age bracket for the primary householder has the lowest median household income of $0, with 8 households (3.6%) in this group.
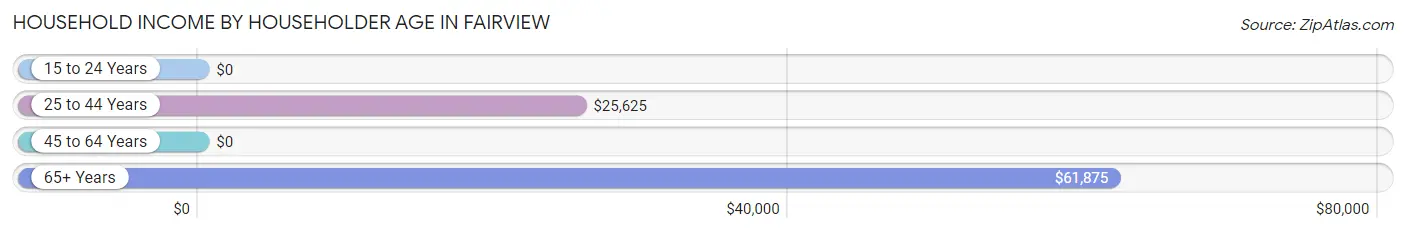
| Income Bracket | # Households | Median Income |
| 15 to 24 Years | 8 (3.6%) | $0 |
| 25 to 44 Years | 78 (34.8%) | $25,625 |
| 45 to 64 Years | 62 (27.7%) | $0 |
| 65+ Years | 76 (33.9%) | $61,875 |
| Total | 224 (100.0%) | $42,500 |
Poverty in Fairview
Income Below Poverty by Sex and Age in Fairview
With 27.2% poverty level for males and 24.0% for females among the residents of Fairview, 5 year old males and under 5 year old females are the most vulnerable to poverty, with 1 males (100.0%) and 12 females (60.0%) in their respective age groups living below the poverty level.
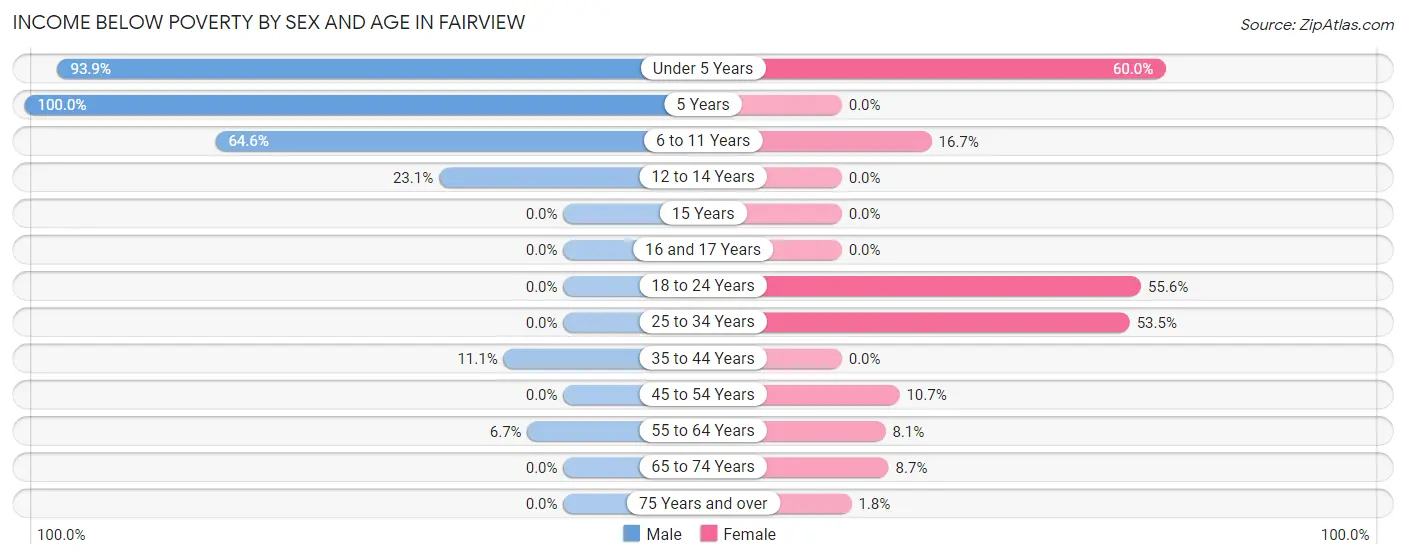
| Age Bracket | Male | Female |
| Under 5 Years | 46 (93.9%) | 12 (60.0%) |
| 5 Years | 1 (100.0%) | 0 (0.0%) |
| 6 to 11 Years | 51 (64.6%) | 2 (16.7%) |
| 12 to 14 Years | 3 (23.1%) | 0 (0.0%) |
| 15 Years | 0 (0.0%) | 0 (0.0%) |
| 16 and 17 Years | 0 (0.0%) | 0 (0.0%) |
| 18 to 24 Years | 0 (0.0%) | 15 (55.6%) |
| 25 to 34 Years | 0 (0.0%) | 31 (53.4%) |
| 35 to 44 Years | 3 (11.1%) | 0 (0.0%) |
| 45 to 54 Years | 0 (0.0%) | 3 (10.7%) |
| 55 to 64 Years | 3 (6.7%) | 3 (8.1%) |
| 65 to 74 Years | 0 (0.0%) | 2 (8.7%) |
| 75 Years and over | 0 (0.0%) | 1 (1.8%) |
| Total | 107 (27.2%) | 69 (24.0%) |
Income Above Poverty by Sex and Age in Fairview
According to the poverty statistics in Fairview, males aged 15 years and females aged 12 to 14 years are the age groups that are most secure financially, with 100.0% of males and 100.0% of females in these age groups living above the poverty line.
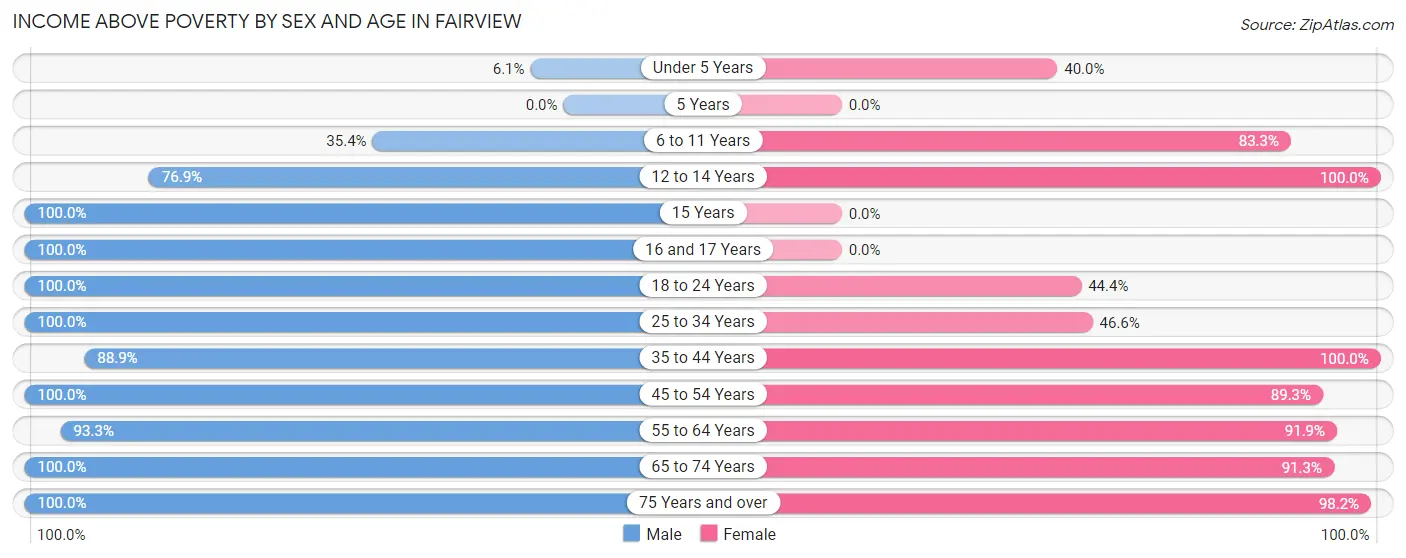
| Age Bracket | Male | Female |
| Under 5 Years | 3 (6.1%) | 8 (40.0%) |
| 5 Years | 0 (0.0%) | 0 (0.0%) |
| 6 to 11 Years | 28 (35.4%) | 10 (83.3%) |
| 12 to 14 Years | 10 (76.9%) | 9 (100.0%) |
| 15 Years | 3 (100.0%) | 0 (0.0%) |
| 16 and 17 Years | 6 (100.0%) | 0 (0.0%) |
| 18 to 24 Years | 9 (100.0%) | 12 (44.4%) |
| 25 to 34 Years | 50 (100.0%) | 27 (46.6%) |
| 35 to 44 Years | 24 (88.9%) | 17 (100.0%) |
| 45 to 54 Years | 26 (100.0%) | 25 (89.3%) |
| 55 to 64 Years | 42 (93.3%) | 34 (91.9%) |
| 65 to 74 Years | 54 (100.0%) | 21 (91.3%) |
| 75 Years and over | 32 (100.0%) | 55 (98.2%) |
| Total | 287 (72.8%) | 218 (76.0%) |
Income Below Poverty Among Married-Couple Families in Fairview
The poverty statistics for married-couple families in Fairview show that 5.0% or 6 of the total 121 families live below the poverty line. Families with 1 or 2 children have the highest poverty rate of 25.0%, comprising of 5 families. On the other hand, families with 3 or 4 children have the lowest poverty rate of 0.0%, which includes 0 families.
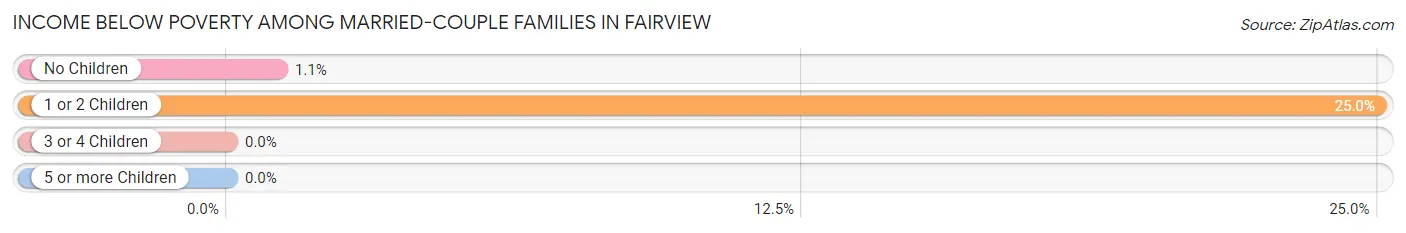
| Children | Above Poverty | Below Poverty |
| No Children | 91 (98.9%) | 1 (1.1%) |
| 1 or 2 Children | 15 (75.0%) | 5 (25.0%) |
| 3 or 4 Children | 5 (100.0%) | 0 (0.0%) |
| 5 or more Children | 4 (100.0%) | 0 (0.0%) |
| Total | 115 (95.0%) | 6 (5.0%) |
Income Below Poverty Among Single-Parent Households in Fairview
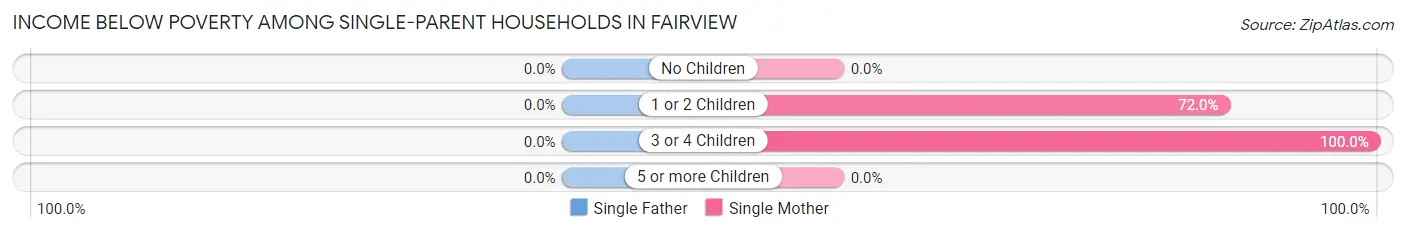
| Children | Single Father | Single Mother |
| No Children | 0 (0.0%) | 0 (0.0%) |
| 1 or 2 Children | 0 (0.0%) | 18 (72.0%) |
| 3 or 4 Children | 0 (0.0%) | 17 (100.0%) |
| 5 or more Children | 0 (0.0%) | 0 (0.0%) |
| Total | 0 (0.0%) | 35 (72.9%) |
Income Below Poverty Among Married-Couple vs Single-Parent Households in Fairview
The poverty data for Fairview shows that 6 of the married-couple family households (5.0%) and 35 of the single-parent households (62.5%) are living below the poverty level. Within the married-couple family households, those with 1 or 2 children have the highest poverty rate, with 5 households (25.0%) falling below the poverty line. Among the single-parent households, those with 3 or 4 children have the highest poverty rate, with 17 household (100.0%) living below poverty.
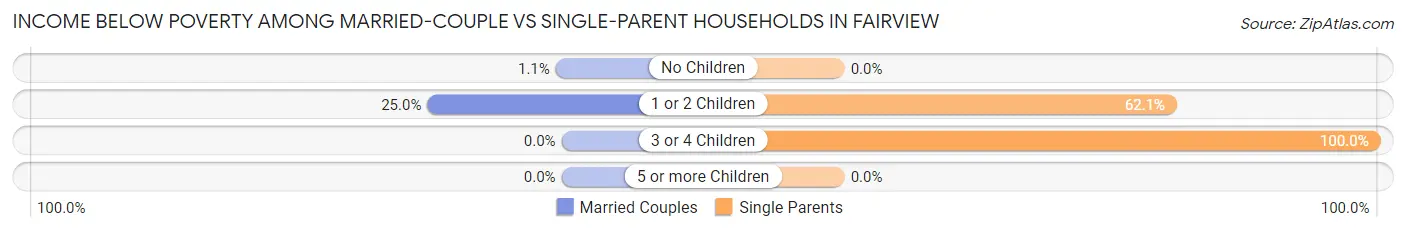
| Children | Married-Couple Families | Single-Parent Households |
| No Children | 1 (1.1%) | 0 (0.0%) |
| 1 or 2 Children | 5 (25.0%) | 18 (62.1%) |
| 3 or 4 Children | 0 (0.0%) | 17 (100.0%) |
| 5 or more Children | 0 (0.0%) | 0 (0.0%) |
| Total | 6 (5.0%) | 35 (62.5%) |
Race in Fairview
The most populous races in Fairview are White / Caucasian (591 | 86.8%), Hispanic or Latino (60 | 8.8%), and Native / Alaskan (38 | 5.6%).
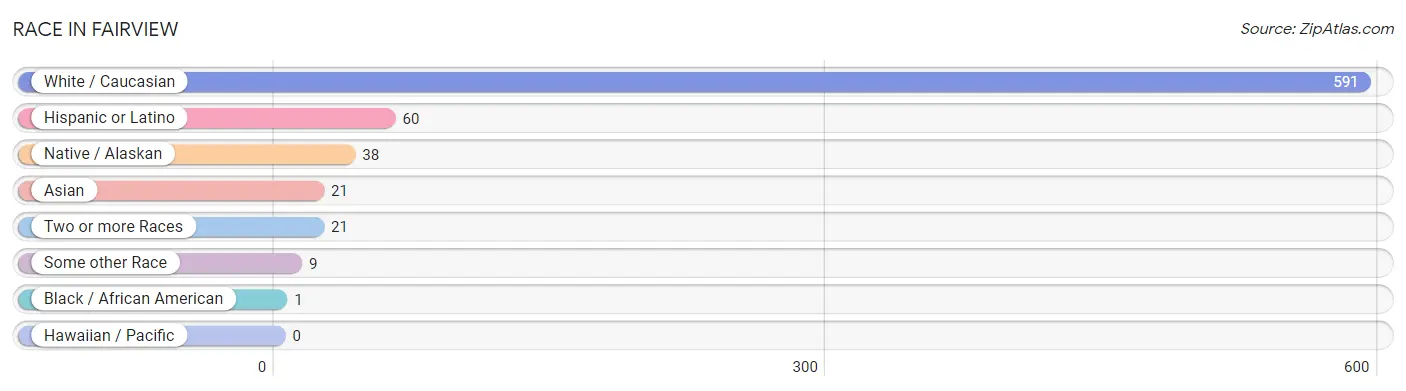
| Race | # Population | % Population |
| Asian | 21 | 3.1% |
| Black / African American | 1 | 0.2% |
| Hawaiian / Pacific | 0 | 0.0% |
| Hispanic or Latino | 60 | 8.8% |
| Native / Alaskan | 38 | 5.6% |
| White / Caucasian | 591 | 86.8% |
| Two or more Races | 21 | 3.1% |
| Some other Race | 9 | 1.3% |
| Total | 681 | 100.0% |
Ancestry in Fairview
The most populous ancestries reported in Fairview are English (139 | 20.4%), Irish (134 | 19.7%), German (105 | 15.4%), American (78 | 11.5%), and Mexican (60 | 8.8%), together accounting for 75.8% of all Fairview residents.
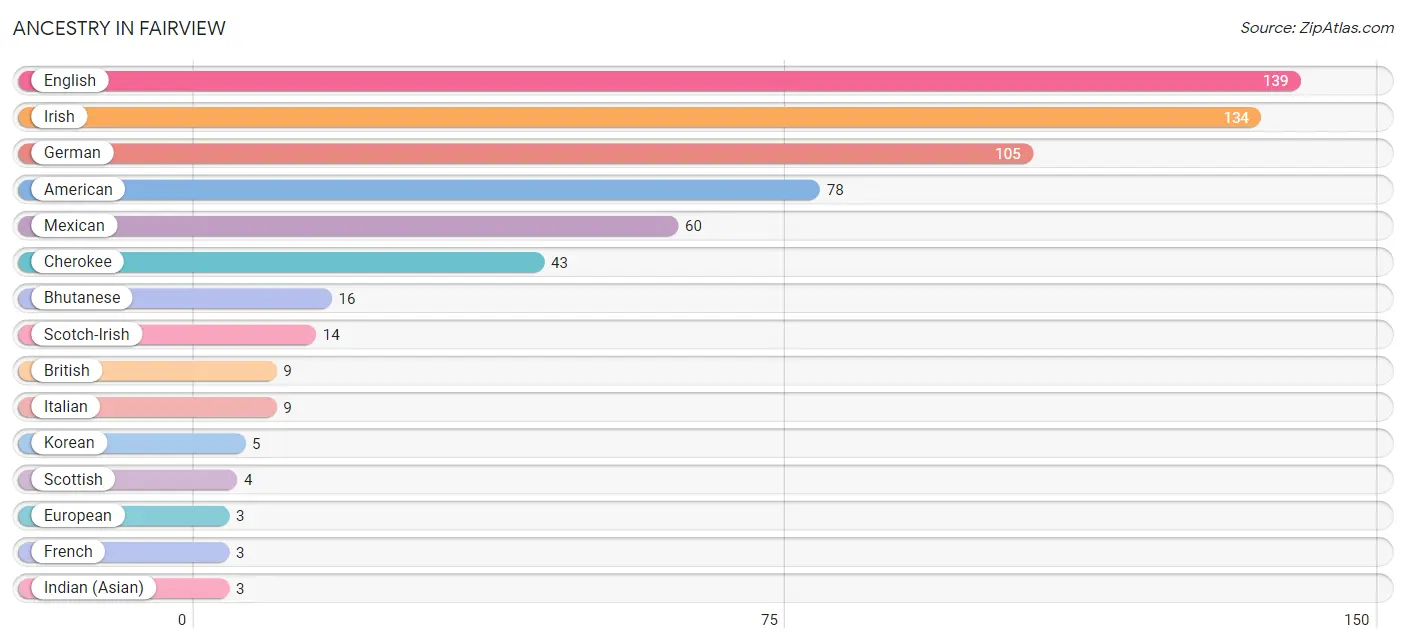
| Ancestry | # Population | % Population |
| American | 78 | 11.5% |
| Bhutanese | 16 | 2.4% |
| British | 9 | 1.3% |
| Cherokee | 43 | 6.3% |
| English | 139 | 20.4% |
| European | 3 | 0.4% |
| French | 3 | 0.4% |
| German | 105 | 15.4% |
| Indian (Asian) | 3 | 0.4% |
| Irish | 134 | 19.7% |
| Italian | 9 | 1.3% |
| Korean | 5 | 0.7% |
| Mexican | 60 | 8.8% |
| Scotch-Irish | 14 | 2.1% |
| Scottish | 4 | 0.6% |
| Swedish | 1 | 0.2% | View All 16 Rows |
Immigrants in Fairview
The most numerous immigrant groups reported in Fairview came from Central America (29 | 4.3%), Latin America (29 | 4.3%), Mexico (29 | 4.3%), Asia (21 | 3.1%), and Eastern Asia (19 | 2.8%), together accounting for 18.6% of all Fairview residents.
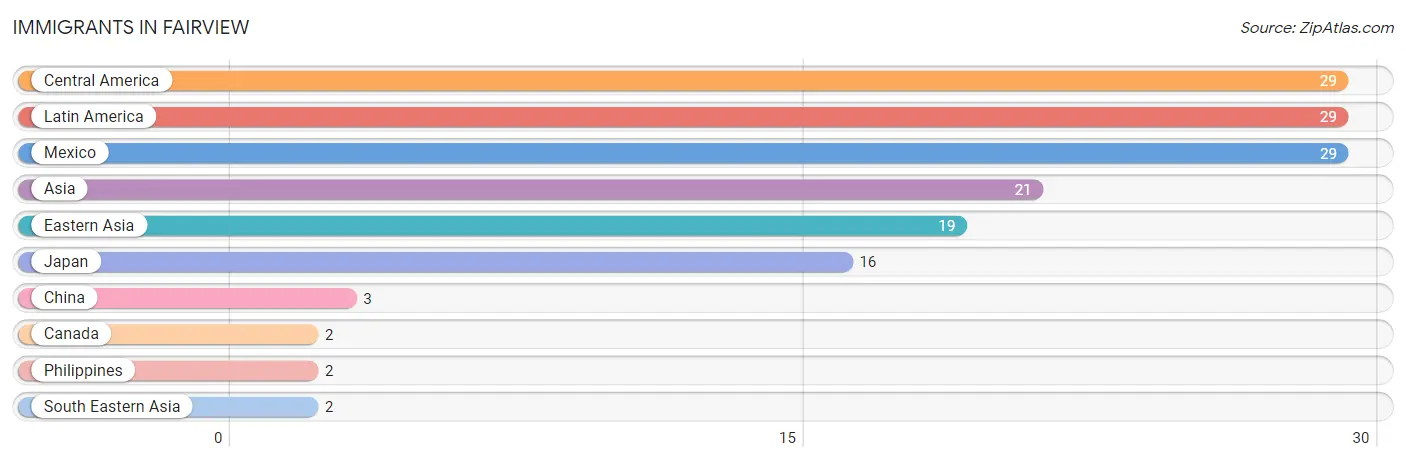
| Immigration Origin | # Population | % Population |
| Asia | 21 | 3.1% |
| Canada | 2 | 0.3% |
| Central America | 29 | 4.3% |
| China | 3 | 0.4% |
| Eastern Asia | 19 | 2.8% |
| Japan | 16 | 2.4% |
| Latin America | 29 | 4.3% |
| Mexico | 29 | 4.3% |
| Philippines | 2 | 0.3% |
| South Eastern Asia | 2 | 0.3% | View All 10 Rows |
Sex and Age in Fairview
Sex and Age in Fairview
The most populous age groups in Fairview are 5 to 9 Years (57 | 14.5%) for men and 30 to 34 Years (38 | 13.2%) for women.
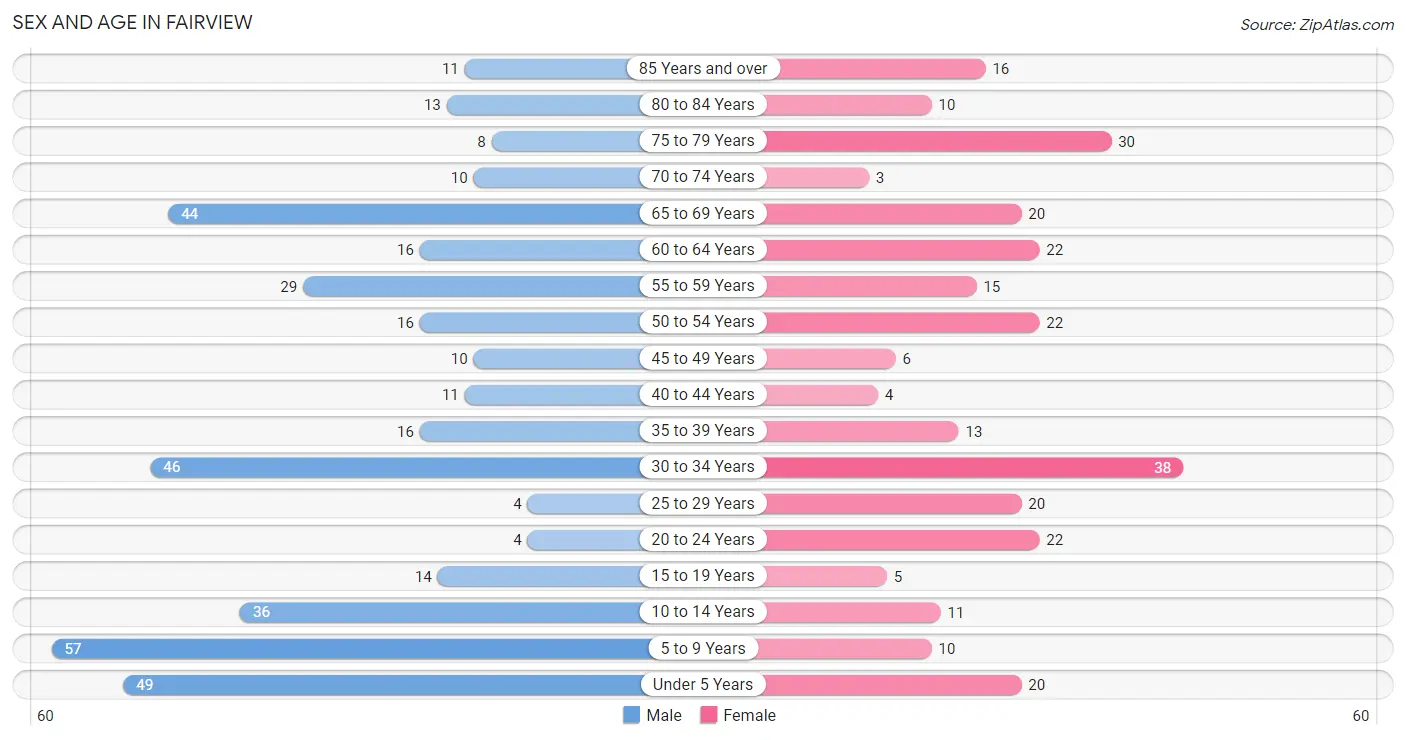
| Age Bracket | Male | Female |
| Under 5 Years | 49 (12.4%) | 20 (7.0%) |
| 5 to 9 Years | 57 (14.5%) | 10 (3.5%) |
| 10 to 14 Years | 36 (9.1%) | 11 (3.8%) |
| 15 to 19 Years | 14 (3.5%) | 5 (1.7%) |
| 20 to 24 Years | 4 (1.0%) | 22 (7.7%) |
| 25 to 29 Years | 4 (1.0%) | 20 (7.0%) |
| 30 to 34 Years | 46 (11.7%) | 38 (13.2%) |
| 35 to 39 Years | 16 (4.1%) | 13 (4.5%) |
| 40 to 44 Years | 11 (2.8%) | 4 (1.4%) |
| 45 to 49 Years | 10 (2.5%) | 6 (2.1%) |
| 50 to 54 Years | 16 (4.1%) | 22 (7.7%) |
| 55 to 59 Years | 29 (7.4%) | 15 (5.2%) |
| 60 to 64 Years | 16 (4.1%) | 22 (7.7%) |
| 65 to 69 Years | 44 (11.2%) | 20 (7.0%) |
| 70 to 74 Years | 10 (2.5%) | 3 (1.1%) |
| 75 to 79 Years | 8 (2.0%) | 30 (10.4%) |
| 80 to 84 Years | 13 (3.3%) | 10 (3.5%) |
| 85 Years and over | 11 (2.8%) | 16 (5.6%) |
| Total | 394 (100.0%) | 287 (100.0%) |
Families and Households in Fairview
Median Family Size in Fairview
The median family size in Fairview is 3.55 persons per family, with single female/mother families (48 | 27.1%) accounting for the largest median family size of 3.65 persons per family. On the other hand, single male/father families (8 | 4.5%) represent the smallest median family size with 2.25 persons per family.
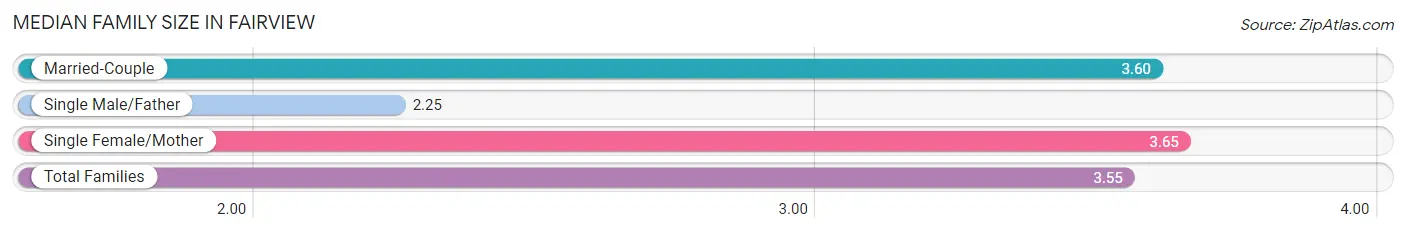
| Family Type | # Families | Family Size |
| Married-Couple | 121 (68.4%) | 3.60 |
| Single Male/Father | 8 (4.5%) | 2.25 |
| Single Female/Mother | 48 (27.1%) | 3.65 |
| Total Families | 177 (100.0%) | 3.55 |
Median Household Size in Fairview
The median household size in Fairview is 3.04 persons per household, with single female/mother households (48 | 21.4%) accounting for the largest median household size of 3.65 persons per household. non-family households (47 | 21.0%) represent the smallest median household size with 1.11 persons per household.
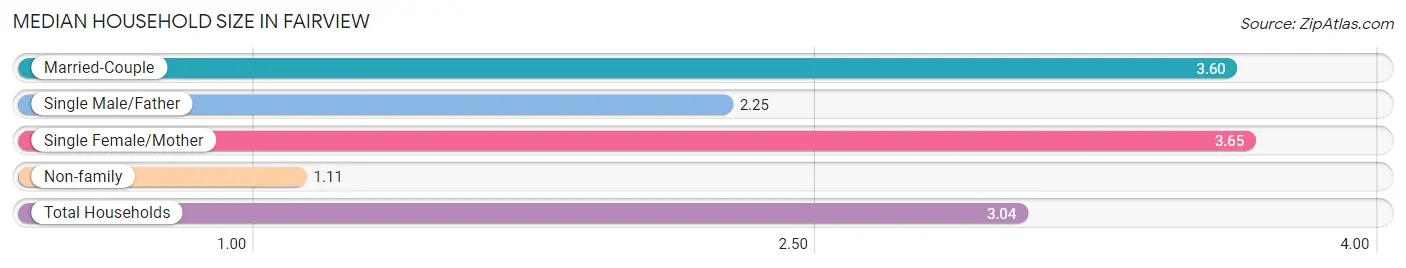
| Household Type | # Households | Household Size |
| Married-Couple | 121 (54.0%) | 3.60 |
| Single Male/Father | 8 (3.6%) | 2.25 |
| Single Female/Mother | 48 (21.4%) | 3.65 |
| Non-family | 47 (21.0%) | 1.11 |
| Total Households | 224 (100.0%) | 3.04 |
Household Size by Marriage Status in Fairview
Out of a total of 224 households in Fairview, 177 (79.0%) are family households, while 47 (21.0%) are nonfamily households. The most numerous type of family households are 2-person households, comprising 93, and the most common type of nonfamily households are 1-person households, comprising 43.
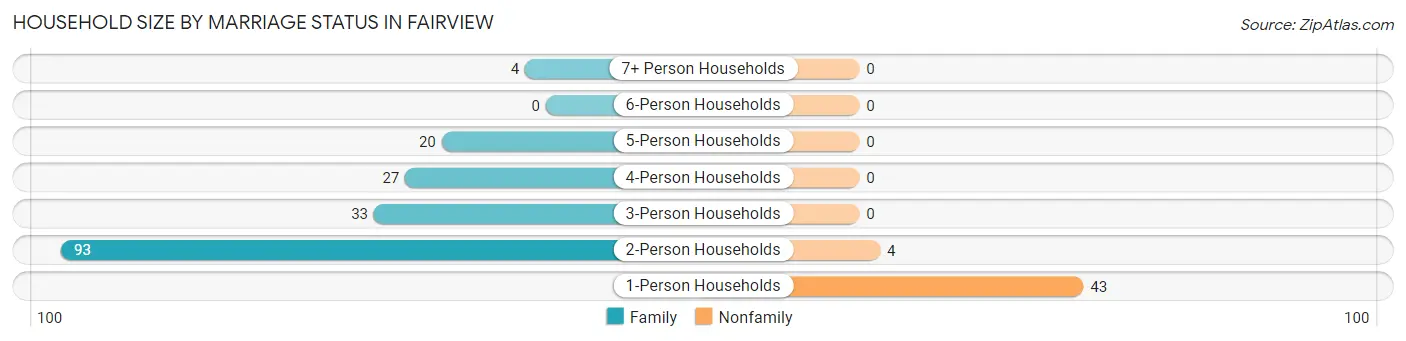
| Household Size | Family Households | Nonfamily Households |
| 1-Person Households | - | 43 (19.2%) |
| 2-Person Households | 93 (41.5%) | 4 (1.8%) |
| 3-Person Households | 33 (14.7%) | 0 (0.0%) |
| 4-Person Households | 27 (12.0%) | 0 (0.0%) |
| 5-Person Households | 20 (8.9%) | 0 (0.0%) |
| 6-Person Households | 0 (0.0%) | 0 (0.0%) |
| 7+ Person Households | 4 (1.8%) | 0 (0.0%) |
| Total | 177 (79.0%) | 47 (21.0%) |
Female Fertility in Fairview
Fertility by Age in Fairview
Average fertility rate in Fairview is 76.0 births per 1,000 women. Women in the age bracket of 20 to 34 years have the highest fertility rate with 113.0 births per 1,000 women. Women in the age bracket of 20 to 34 years acount for 100.0% of all women with births.
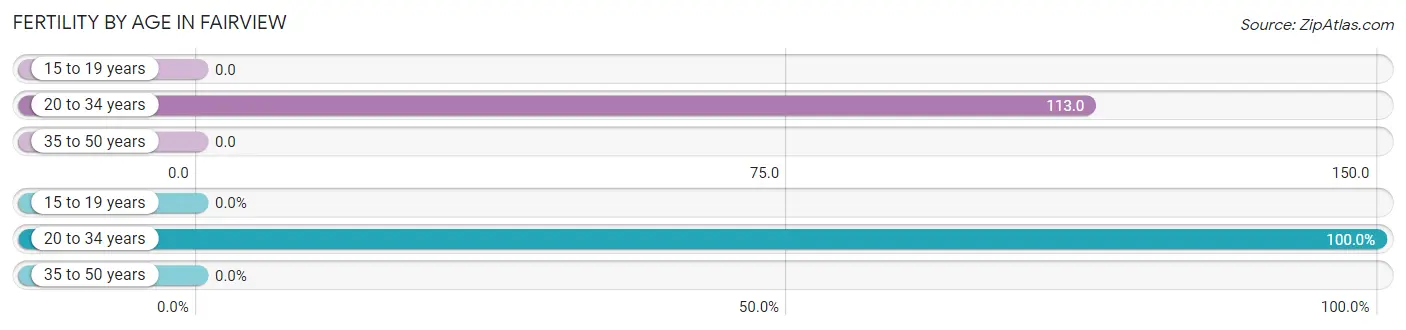
| Age Bracket | Women with Births | Births / 1,000 Women |
| 15 to 19 years | 0 (0.0%) | 0.0 |
| 20 to 34 years | 9 (100.0%) | 113.0 |
| 35 to 50 years | 0 (0.0%) | 0.0 |
| Total | 9 (100.0%) | 76.0 |
Fertility by Age by Marriage Status in Fairview
22.2% of women with births (9) in Fairview are married. The highest percentage of unmarried women with births falls into 20 to 34 years age bracket with 77.8% of them unmarried at the time of birth, while the lowest percentage of unmarried women with births belong to 20 to 34 years age bracket with 77.8% of them unmarried.
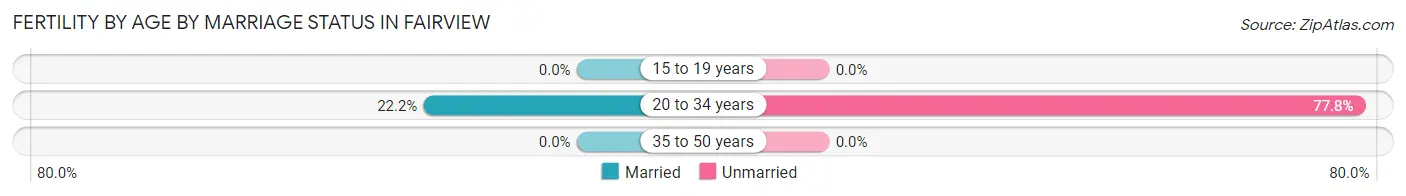
| Age Bracket | Married | Unmarried |
| 15 to 19 years | 0 (0.0%) | 0 (0.0%) |
| 20 to 34 years | 2 (22.2%) | 7 (77.8%) |
| 35 to 50 years | 0 (0.0%) | 0 (0.0%) |
| Total | 2 (22.2%) | 7 (77.8%) |
Fertility by Education in Fairview
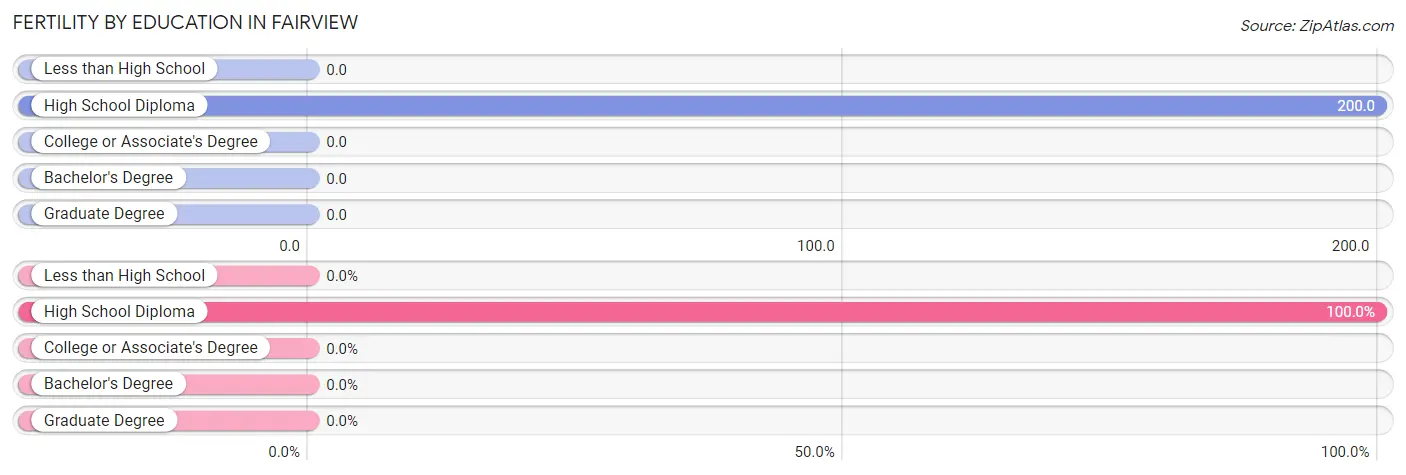
| Educational Attainment | Women with Births | Births / 1,000 Women |
| Less than High School | 0 (0.0%) | 0.0 |
| High School Diploma | 9 (100.0%) | 200.0 |
| College or Associate's Degree | 0 (0.0%) | 0.0 |
| Bachelor's Degree | 0 (0.0%) | 0.0 |
| Graduate Degree | 0 (0.0%) | 0.0 |
| Total | 9 (100.0%) | 76.0 |
Fertility by Education by Marriage Status in Fairview
77.8% of women with births in Fairview are unmarried. Women with the educational attainment of high school diploma are most likely to be married with 22.2% of them married at childbirth, while women with the educational attainment of high school diploma are least likely to be married with 77.8% of them unmarried at childbirth.
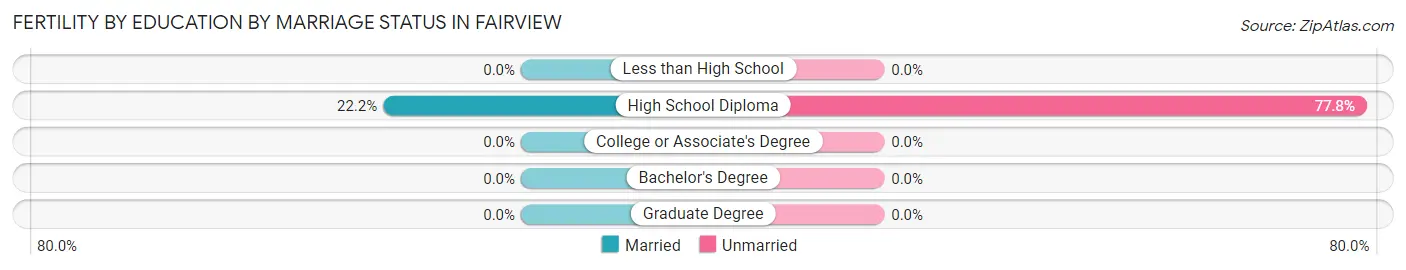
| Educational Attainment | Married | Unmarried |
| Less than High School | 0 (0.0%) | 0 (0.0%) |
| High School Diploma | 2 (22.2%) | 7 (77.8%) |
| College or Associate's Degree | 0 (0.0%) | 0 (0.0%) |
| Bachelor's Degree | 0 (0.0%) | 0 (0.0%) |
| Graduate Degree | 0 (0.0%) | 0 (0.0%) |
| Total | 2 (22.2%) | 7 (77.8%) |
Employment Characteristics in Fairview
Employment by Class of Employer in Fairview
Among the 226 employed individuals in Fairview, private company employees (152 | 67.3%), self-employed (not incorporated) (39 | 17.3%), and local government employees (15 | 6.6%) make up the most common classes of employment.
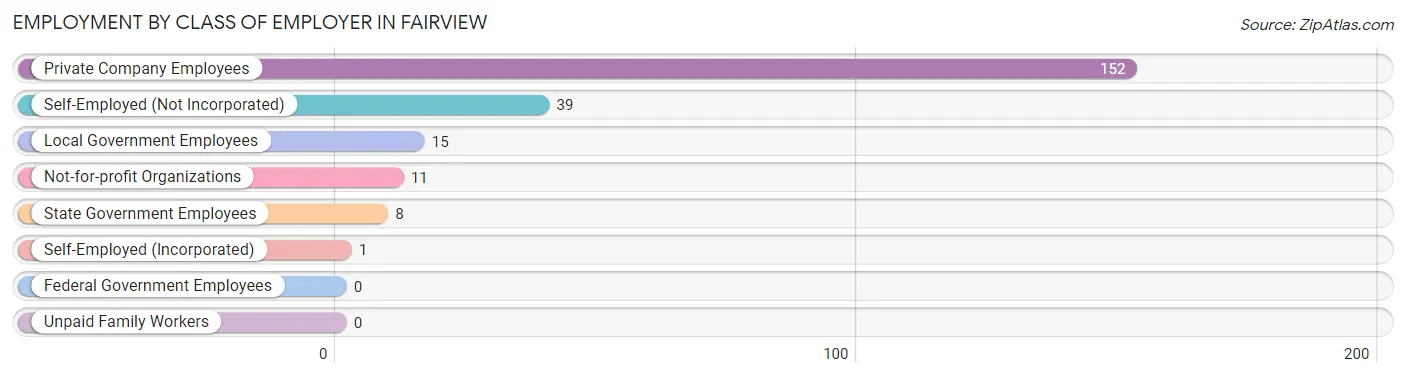
| Employer Class | # Employees | % Employees |
| Private Company Employees | 152 | 67.3% |
| Self-Employed (Incorporated) | 1 | 0.4% |
| Self-Employed (Not Incorporated) | 39 | 17.3% |
| Not-for-profit Organizations | 11 | 4.9% |
| Local Government Employees | 15 | 6.6% |
| State Government Employees | 8 | 3.5% |
| Federal Government Employees | 0 | 0.0% |
| Unpaid Family Workers | 0 | 0.0% |
| Total | 226 | 100.0% |
Employment Status by Age in Fairview
According to the labor force statistics for Fairview, out of the total population over 16 years of age (495), 51.5% or 255 individuals are in the labor force, with 11.4% or 29 of them unemployed. The age group with the highest labor force participation rate is 20 to 24 years, with 92.3% or 24 individuals in the labor force. Within the labor force, the 16 to 19 years age range has the highest percentage of unemployed individuals, with 50.0% or 6 of them being unemployed.
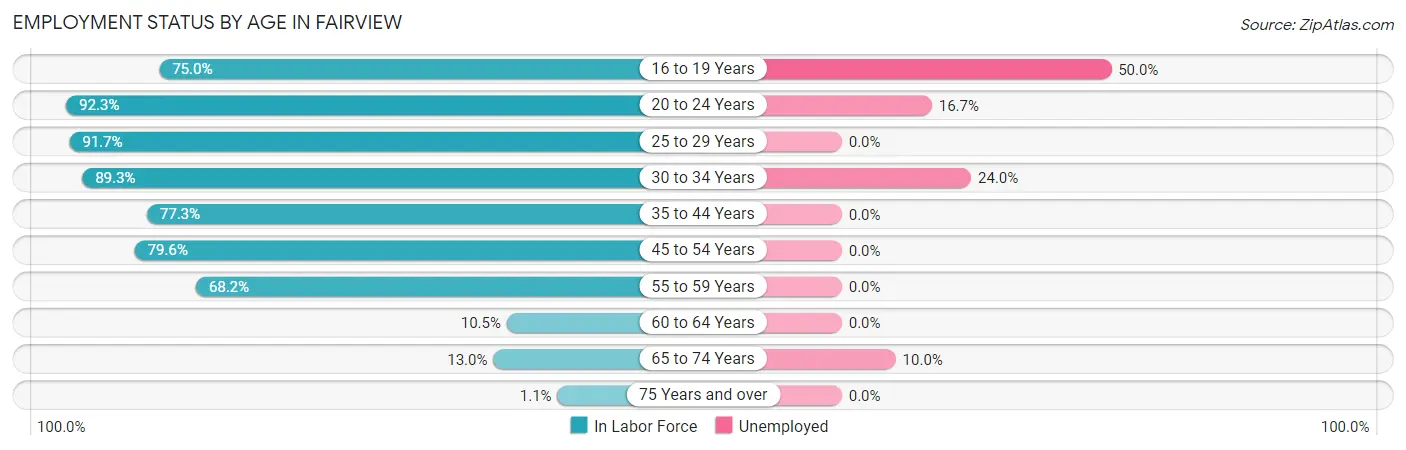
| Age Bracket | In Labor Force | Unemployed |
| 16 to 19 Years | 12 (75.0%) | 6 (50.0%) |
| 20 to 24 Years | 24 (92.3%) | 4 (16.7%) |
| 25 to 29 Years | 22 (91.7%) | 0 (0.0%) |
| 30 to 34 Years | 75 (89.3%) | 18 (24.0%) |
| 35 to 44 Years | 34 (77.3%) | 0 (0.0%) |
| 45 to 54 Years | 43 (79.6%) | 0 (0.0%) |
| 55 to 59 Years | 30 (68.2%) | 0 (0.0%) |
| 60 to 64 Years | 4 (10.5%) | 0 (0.0%) |
| 65 to 74 Years | 10 (13.0%) | 1 (10.0%) |
| 75 Years and over | 1 (1.1%) | 0 (0.0%) |
| Total | 255 (51.5%) | 29 (11.4%) |
Employment Status by Educational Attainment in Fairview
According to labor force statistics for Fairview, 72.2% of individuals (208) out of the total population between 25 and 64 years of age (288) are in the labor force, with 8.7% or 18 of them being unemployed. The group with the highest labor force participation rate are those with the educational attainment of bachelor's degree or higher, with 80.9% or 38 individuals in the labor force. Within the labor force, individuals with high school diploma education have the highest percentage of unemployment, with 18.6% or 18 of them being unemployed.
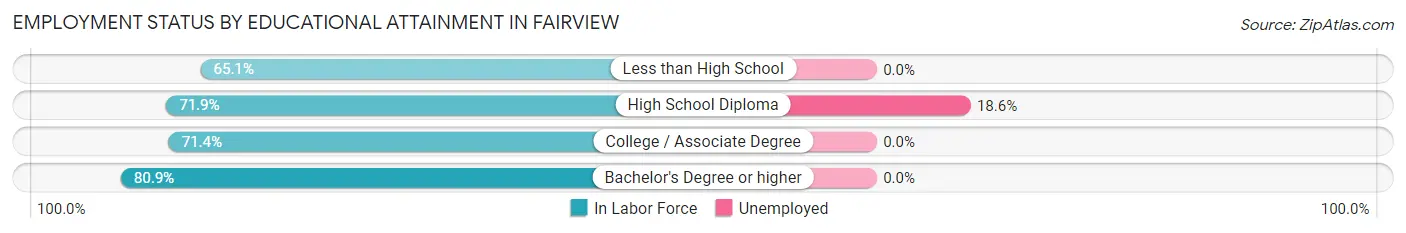
| Educational Attainment | In Labor Force | Unemployed |
| Less than High School | 28 (65.1%) | 0 (0.0%) |
| High School Diploma | 97 (71.9%) | 25 (18.6%) |
| College / Associate Degree | 45 (71.4%) | 0 (0.0%) |
| Bachelor's Degree or higher | 38 (80.9%) | 0 (0.0%) |
| Total | 208 (72.2%) | 25 (8.7%) |
Employment Occupations by Sex in Fairview
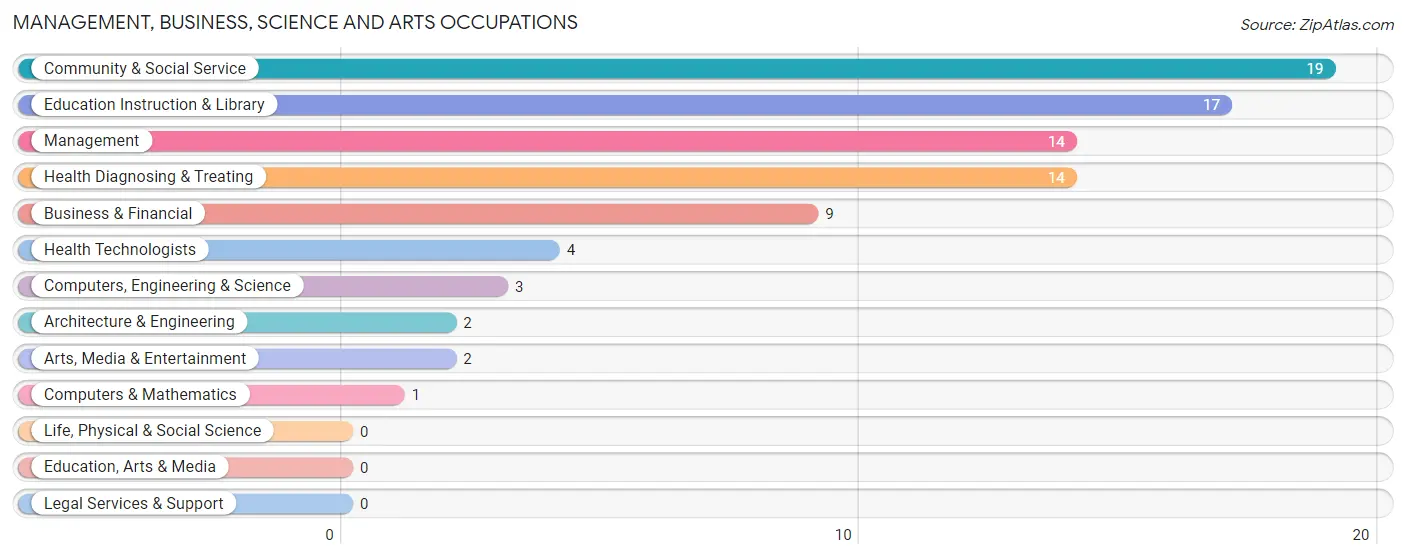
Management, Business, Science and Arts Occupations
The most common Management, Business, Science and Arts occupations in Fairview are Community & Social Service (19 | 8.4%), Education Instruction & Library (17 | 7.5%), Management (14 | 6.2%), Health Diagnosing & Treating (14 | 6.2%), and Business & Financial (9 | 4.0%).
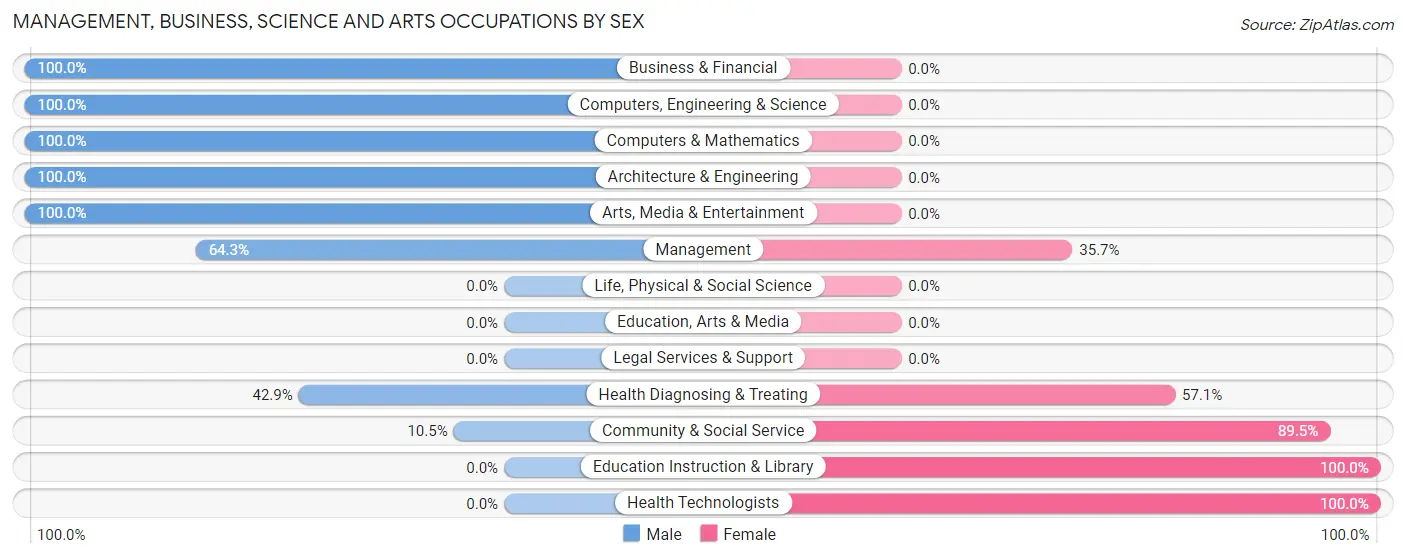
Management, Business, Science and Arts Occupations by Sex
Within the Management, Business, Science and Arts occupations in Fairview, the most male-oriented occupations are Business & Financial (100.0%), Computers, Engineering & Science (100.0%), and Computers & Mathematics (100.0%), while the most female-oriented occupations are Education Instruction & Library (100.0%), Health Technologists (100.0%), and Community & Social Service (89.5%).
| Occupation | Male | Female |
| Management | 9 (64.3%) | 5 (35.7%) |
| Business & Financial | 9 (100.0%) | 0 (0.0%) |
| Computers, Engineering & Science | 3 (100.0%) | 0 (0.0%) |
| Computers & Mathematics | 1 (100.0%) | 0 (0.0%) |
| Architecture & Engineering | 2 (100.0%) | 0 (0.0%) |
| Life, Physical & Social Science | 0 (0.0%) | 0 (0.0%) |
| Community & Social Service | 2 (10.5%) | 17 (89.5%) |
| Education, Arts & Media | 0 (0.0%) | 0 (0.0%) |
| Legal Services & Support | 0 (0.0%) | 0 (0.0%) |
| Education Instruction & Library | 0 (0.0%) | 17 (100.0%) |
| Arts, Media & Entertainment | 2 (100.0%) | 0 (0.0%) |
| Health Diagnosing & Treating | 6 (42.9%) | 8 (57.1%) |
| Health Technologists | 0 (0.0%) | 4 (100.0%) |
| Total (Category) | 29 (49.1%) | 30 (50.8%) |
| Total (Overall) | 134 (59.3%) | 92 (40.7%) |
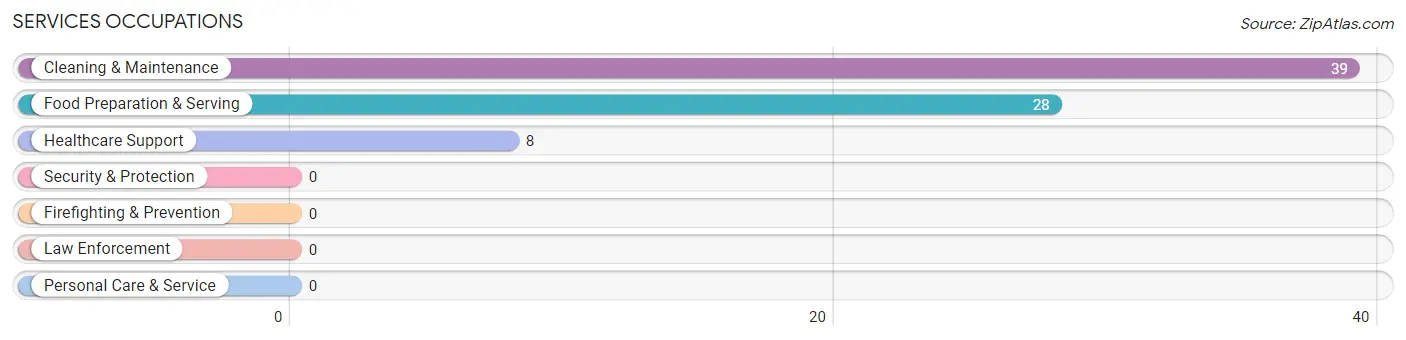
Services Occupations
The most common Services occupations in Fairview are Cleaning & Maintenance (39 | 17.3%), Food Preparation & Serving (28 | 12.4%), and Healthcare Support (8 | 3.5%).
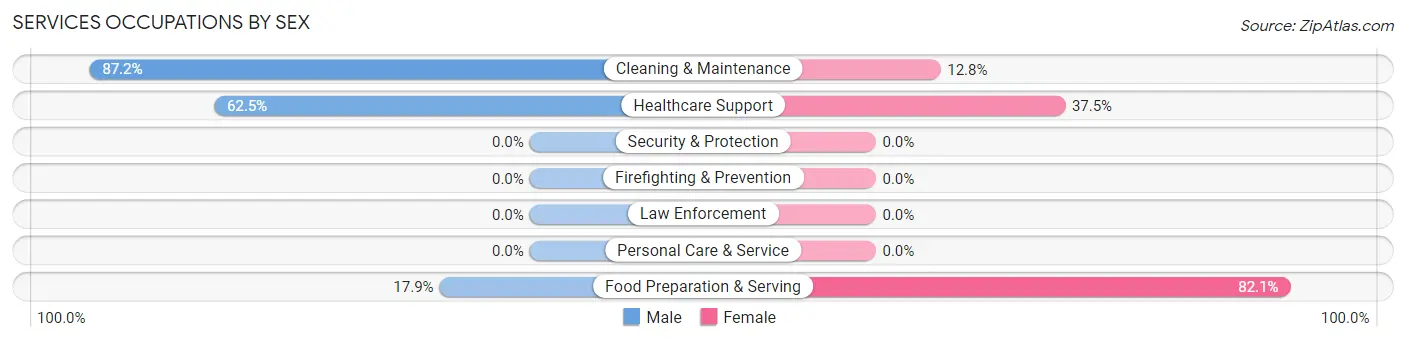
Services Occupations by Sex
Within the Services occupations in Fairview, the most male-oriented occupations are Cleaning & Maintenance (87.2%), Healthcare Support (62.5%), and Food Preparation & Serving (17.9%), while the most female-oriented occupations are Food Preparation & Serving (82.1%), Healthcare Support (37.5%), and Cleaning & Maintenance (12.8%).
| Occupation | Male | Female |
| Healthcare Support | 5 (62.5%) | 3 (37.5%) |
| Security & Protection | 0 (0.0%) | 0 (0.0%) |
| Firefighting & Prevention | 0 (0.0%) | 0 (0.0%) |
| Law Enforcement | 0 (0.0%) | 0 (0.0%) |
| Food Preparation & Serving | 5 (17.9%) | 23 (82.1%) |
| Cleaning & Maintenance | 34 (87.2%) | 5 (12.8%) |
| Personal Care & Service | 0 (0.0%) | 0 (0.0%) |
| Total (Category) | 44 (58.7%) | 31 (41.3%) |
| Total (Overall) | 134 (59.3%) | 92 (40.7%) |
Sales and Office Occupations
The most common Sales and Office occupations in Fairview are Office & Administration (22 | 9.7%), and Sales & Related (11 | 4.9%).
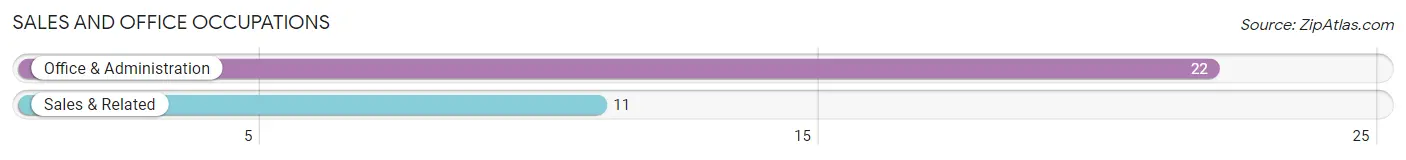
Sales and Office Occupations by Sex
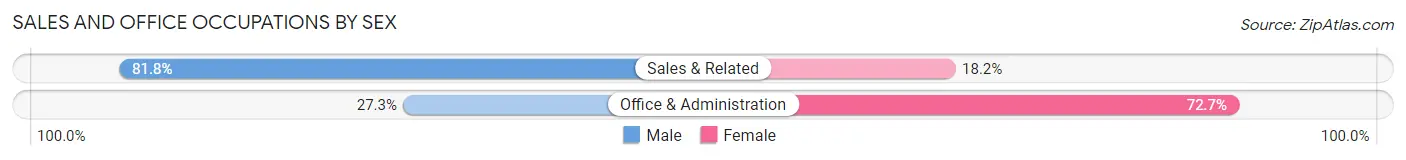
| Occupation | Male | Female |
| Sales & Related | 9 (81.8%) | 2 (18.2%) |
| Office & Administration | 6 (27.3%) | 16 (72.7%) |
| Total (Category) | 15 (45.5%) | 18 (54.5%) |
| Total (Overall) | 134 (59.3%) | 92 (40.7%) |
Natural Resources, Construction and Maintenance Occupations
The most common Natural Resources, Construction and Maintenance occupations in Fairview are Construction & Extraction (11 | 4.9%), Farming, Fishing & Forestry (9 | 4.0%), and Installation, Maintenance & Repair (6 | 2.6%).

Natural Resources, Construction and Maintenance Occupations by Sex
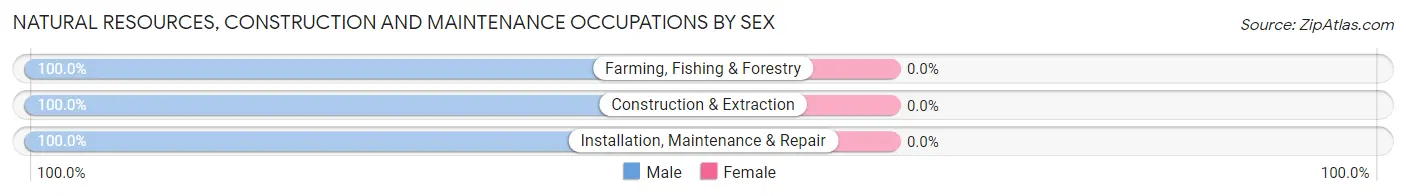
| Occupation | Male | Female |
| Farming, Fishing & Forestry | 9 (100.0%) | 0 (0.0%) |
| Construction & Extraction | 11 (100.0%) | 0 (0.0%) |
| Installation, Maintenance & Repair | 6 (100.0%) | 0 (0.0%) |
| Total (Category) | 26 (100.0%) | 0 (0.0%) |
| Total (Overall) | 134 (59.3%) | 92 (40.7%) |
Production, Transportation and Moving Occupations
The most common Production, Transportation and Moving occupations in Fairview are Production (16 | 7.1%), Material Moving (9 | 4.0%), and Transportation (8 | 3.5%).
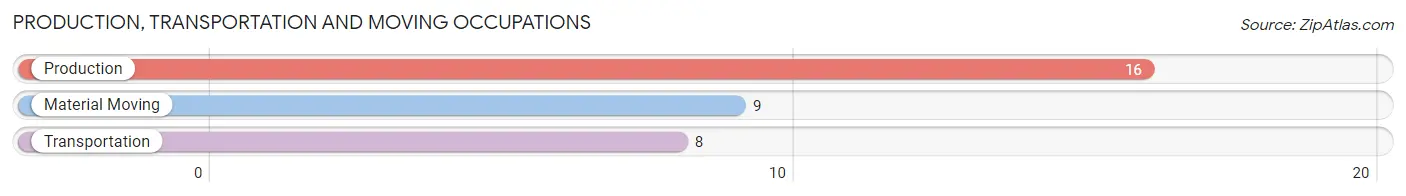
Production, Transportation and Moving Occupations by Sex
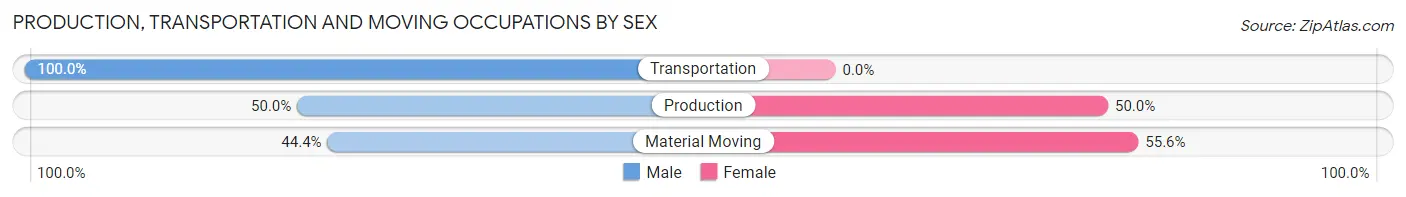
| Occupation | Male | Female |
| Production | 8 (50.0%) | 8 (50.0%) |
| Transportation | 8 (100.0%) | 0 (0.0%) |
| Material Moving | 4 (44.4%) | 5 (55.6%) |
| Total (Category) | 20 (60.6%) | 13 (39.4%) |
| Total (Overall) | 134 (59.3%) | 92 (40.7%) |
Employment Industries by Sex in Fairview
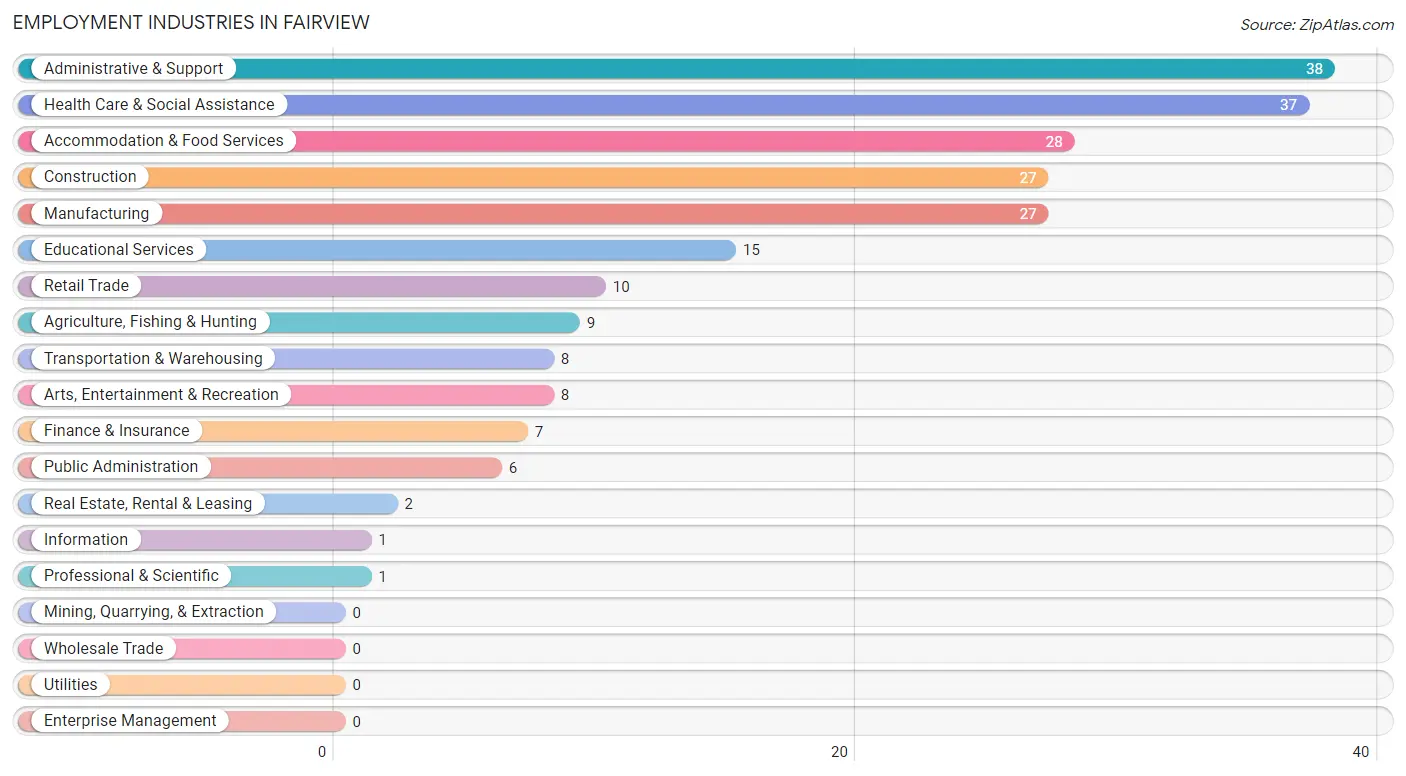
Employment Industries in Fairview
The major employment industries in Fairview include Administrative & Support (38 | 16.8%), Health Care & Social Assistance (37 | 16.4%), Accommodation & Food Services (28 | 12.4%), Construction (27 | 11.9%), and Manufacturing (27 | 11.9%).
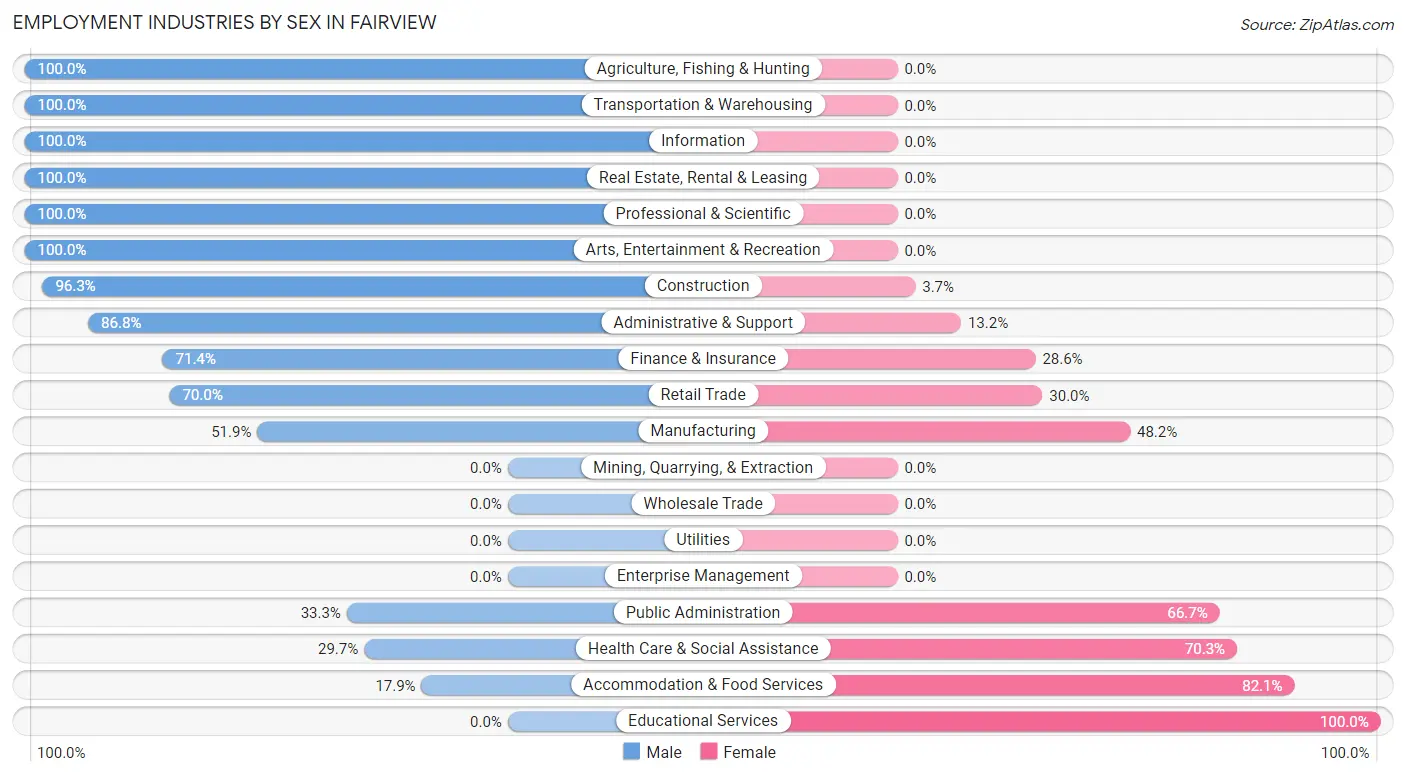
Employment Industries by Sex in Fairview
The Fairview industries that see more men than women are Agriculture, Fishing & Hunting (100.0%), Transportation & Warehousing (100.0%), and Information (100.0%), whereas the industries that tend to have a higher number of women are Educational Services (100.0%), Accommodation & Food Services (82.1%), and Health Care & Social Assistance (70.3%).
| Industry | Male | Female |
| Agriculture, Fishing & Hunting | 9 (100.0%) | 0 (0.0%) |
| Mining, Quarrying, & Extraction | 0 (0.0%) | 0 (0.0%) |
| Construction | 26 (96.3%) | 1 (3.7%) |
| Manufacturing | 14 (51.8%) | 13 (48.1%) |
| Wholesale Trade | 0 (0.0%) | 0 (0.0%) |
| Retail Trade | 7 (70.0%) | 3 (30.0%) |
| Transportation & Warehousing | 8 (100.0%) | 0 (0.0%) |
| Utilities | 0 (0.0%) | 0 (0.0%) |
| Information | 1 (100.0%) | 0 (0.0%) |
| Finance & Insurance | 5 (71.4%) | 2 (28.6%) |
| Real Estate, Rental & Leasing | 2 (100.0%) | 0 (0.0%) |
| Professional & Scientific | 1 (100.0%) | 0 (0.0%) |
| Enterprise Management | 0 (0.0%) | 0 (0.0%) |
| Administrative & Support | 33 (86.8%) | 5 (13.2%) |
| Educational Services | 0 (0.0%) | 15 (100.0%) |
| Health Care & Social Assistance | 11 (29.7%) | 26 (70.3%) |
| Arts, Entertainment & Recreation | 8 (100.0%) | 0 (0.0%) |
| Accommodation & Food Services | 5 (17.9%) | 23 (82.1%) |
| Public Administration | 2 (33.3%) | 4 (66.7%) |
| Total | 134 (59.3%) | 92 (40.7%) |
Education in Fairview
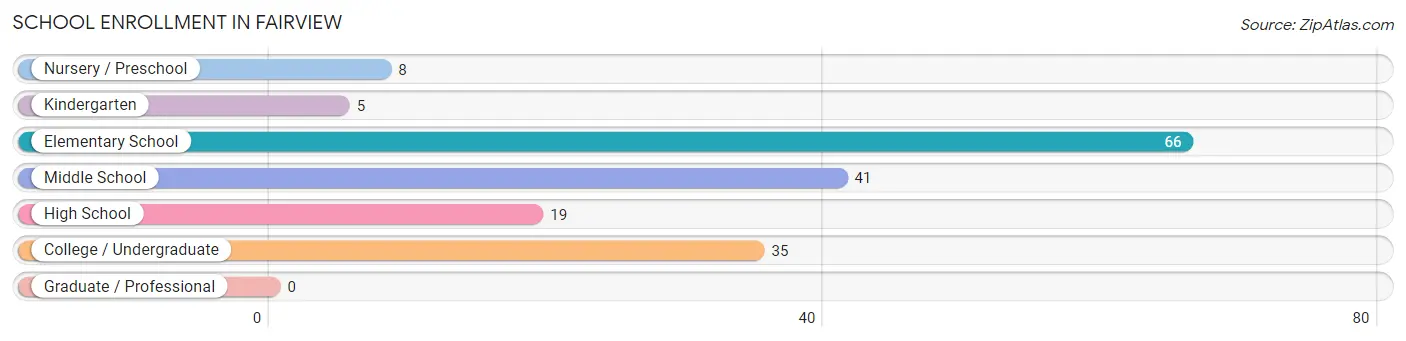
School Enrollment in Fairview
The most common levels of schooling among the 174 students in Fairview are elementary school (66 | 37.9%), middle school (41 | 23.6%), and college / undergraduate (35 | 20.1%).
| School Level | # Students | % Students |
| Nursery / Preschool | 8 | 4.6% |
| Kindergarten | 5 | 2.9% |
| Elementary School | 66 | 37.9% |
| Middle School | 41 | 23.6% |
| High School | 19 | 10.9% |
| College / Undergraduate | 35 | 20.1% |
| Graduate / Professional | 0 | 0.0% |
| Total | 174 | 100.0% |
School Enrollment by Age by Funding Source in Fairview
Out of a total of 174 students who are enrolled in schools in Fairview, 4 (2.3%) attend a private institution, while the remaining 170 (97.7%) are enrolled in public schools. The age group of 18 to 19 year olds has the highest likelihood of being enrolled in private schools, with 2 (20.0% in the age bracket) enrolled. Conversely, the age group of 3 to 4 year olds has the lowest likelihood of being enrolled in a private school, with 12 (100.0% in the age bracket) attending a public institution.
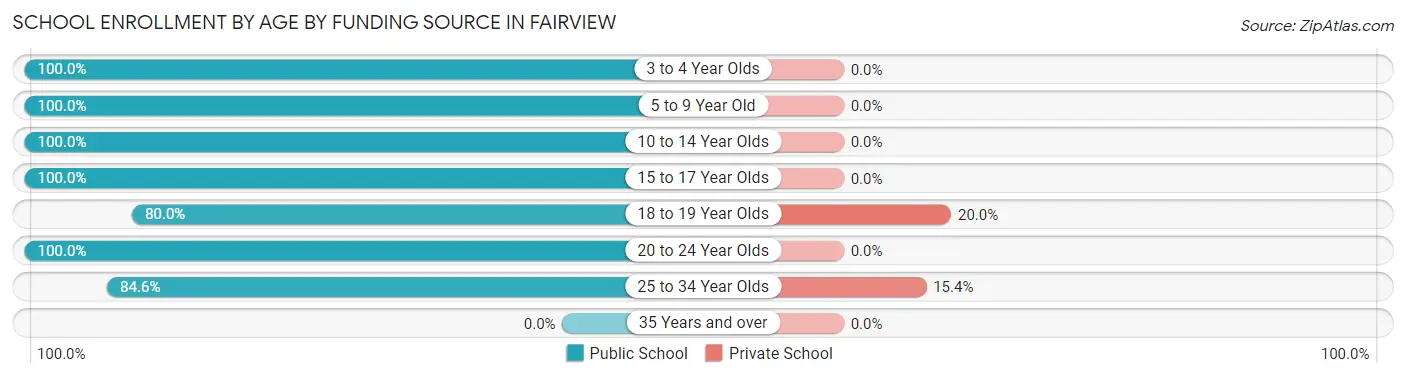
| Age Bracket | Public School | Private School |
| 3 to 4 Year Olds | 12 (100.0%) | 0 (0.0%) |
| 5 to 9 Year Old | 67 (100.0%) | 0 (0.0%) |
| 10 to 14 Year Olds | 45 (100.0%) | 0 (0.0%) |
| 15 to 17 Year Olds | 9 (100.0%) | 0 (0.0%) |
| 18 to 19 Year Olds | 8 (80.0%) | 2 (20.0%) |
| 20 to 24 Year Olds | 18 (100.0%) | 0 (0.0%) |
| 25 to 34 Year Olds | 11 (84.6%) | 2 (15.4%) |
| 35 Years and over | 0 (0.0%) | 0 (0.0%) |
| Total | 170 (97.7%) | 4 (2.3%) |
Educational Attainment by Field of Study in Fairview
Education (29 | 34.9%), literature & languages (14 | 16.9%), communications (10 | 12.0%), science & technology (9 | 10.8%), and social sciences (8 | 9.6%) are the most common fields of study among 83 individuals in Fairview who have obtained a bachelor's degree or higher.
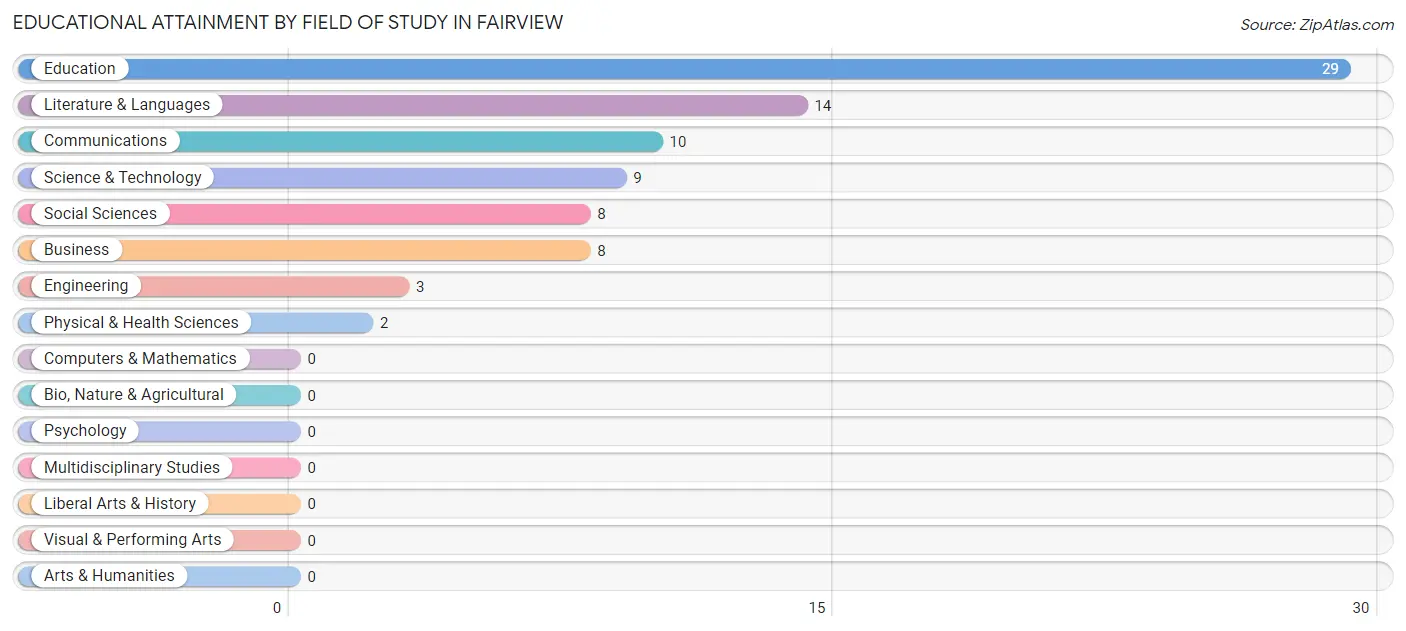
| Field of Study | # Graduates | % Graduates |
| Computers & Mathematics | 0 | 0.0% |
| Bio, Nature & Agricultural | 0 | 0.0% |
| Physical & Health Sciences | 2 | 2.4% |
| Psychology | 0 | 0.0% |
| Social Sciences | 8 | 9.6% |
| Engineering | 3 | 3.6% |
| Multidisciplinary Studies | 0 | 0.0% |
| Science & Technology | 9 | 10.8% |
| Business | 8 | 9.6% |
| Education | 29 | 34.9% |
| Literature & Languages | 14 | 16.9% |
| Liberal Arts & History | 0 | 0.0% |
| Visual & Performing Arts | 0 | 0.0% |
| Communications | 10 | 12.0% |
| Arts & Humanities | 0 | 0.0% |
| Total | 83 | 100.0% |
Transportation & Commute in Fairview
Vehicle Availability by Sex in Fairview
The most prevalent vehicle ownership categories in Fairview are males with 2 vehicles (57, accounting for 42.5%) and females with 2 vehicles (18, making up 62.0%).
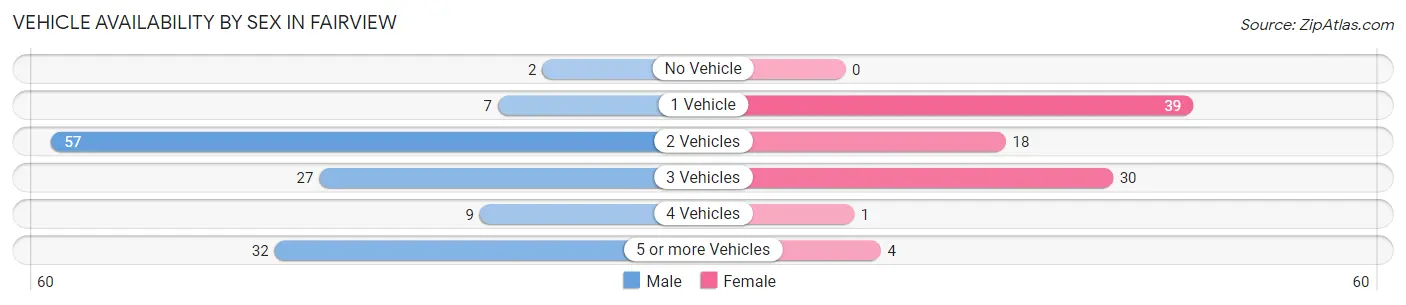
| Vehicles Available | Male | Female |
| No Vehicle | 2 (1.5%) | 0 (0.0%) |
| 1 Vehicle | 7 (5.2%) | 39 (42.4%) |
| 2 Vehicles | 57 (42.5%) | 18 (19.6%) |
| 3 Vehicles | 27 (20.2%) | 30 (32.6%) |
| 4 Vehicles | 9 (6.7%) | 1 (1.1%) |
| 5 or more Vehicles | 32 (23.9%) | 4 (4.3%) |
| Total | 134 (100.0%) | 92 (100.0%) |
Commute Time in Fairview
The most frequently occuring commute durations in Fairview are 15 to 19 minutes (56 commuters, 25.5%), 30 to 34 minutes (44 commuters, 20.0%), and 90 or more minutes (20 commuters, 9.1%).
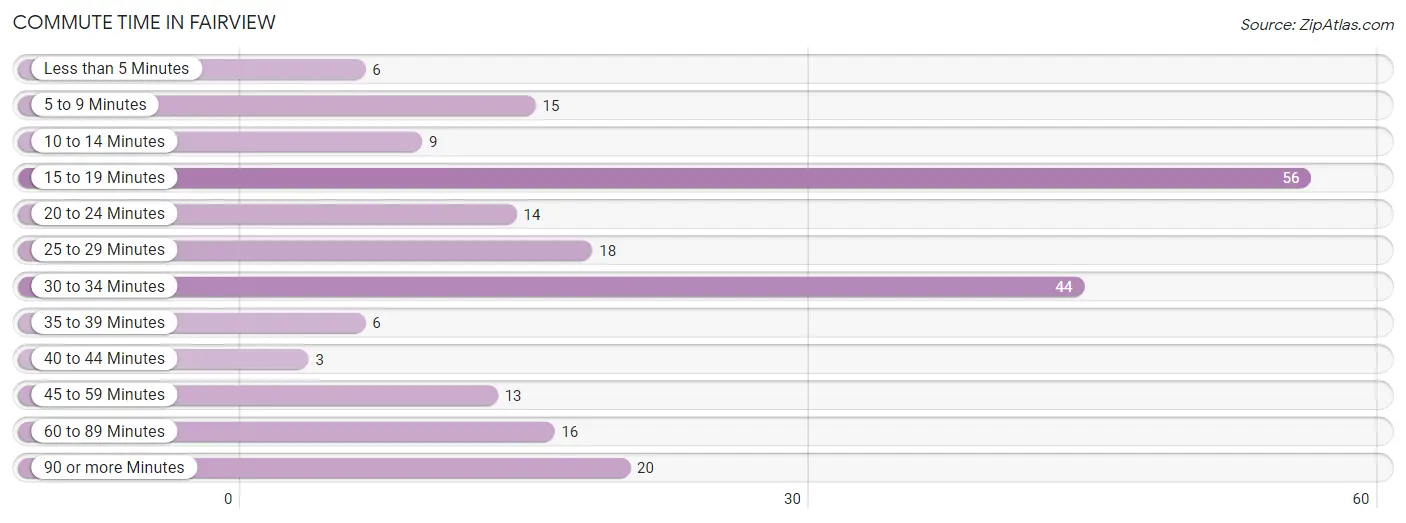
| Commute Time | # Commuters | % Commuters |
| Less than 5 Minutes | 6 | 2.7% |
| 5 to 9 Minutes | 15 | 6.8% |
| 10 to 14 Minutes | 9 | 4.1% |
| 15 to 19 Minutes | 56 | 25.5% |
| 20 to 24 Minutes | 14 | 6.4% |
| 25 to 29 Minutes | 18 | 8.2% |
| 30 to 34 Minutes | 44 | 20.0% |
| 35 to 39 Minutes | 6 | 2.7% |
| 40 to 44 Minutes | 3 | 1.4% |
| 45 to 59 Minutes | 13 | 5.9% |
| 60 to 89 Minutes | 16 | 7.3% |
| 90 or more Minutes | 20 | 9.1% |
Commute Time by Sex in Fairview
The most common commute times in Fairview are 15 to 19 minutes (46 commuters, 35.4%) for males and 30 to 34 minutes (24 commuters, 26.7%) for females.
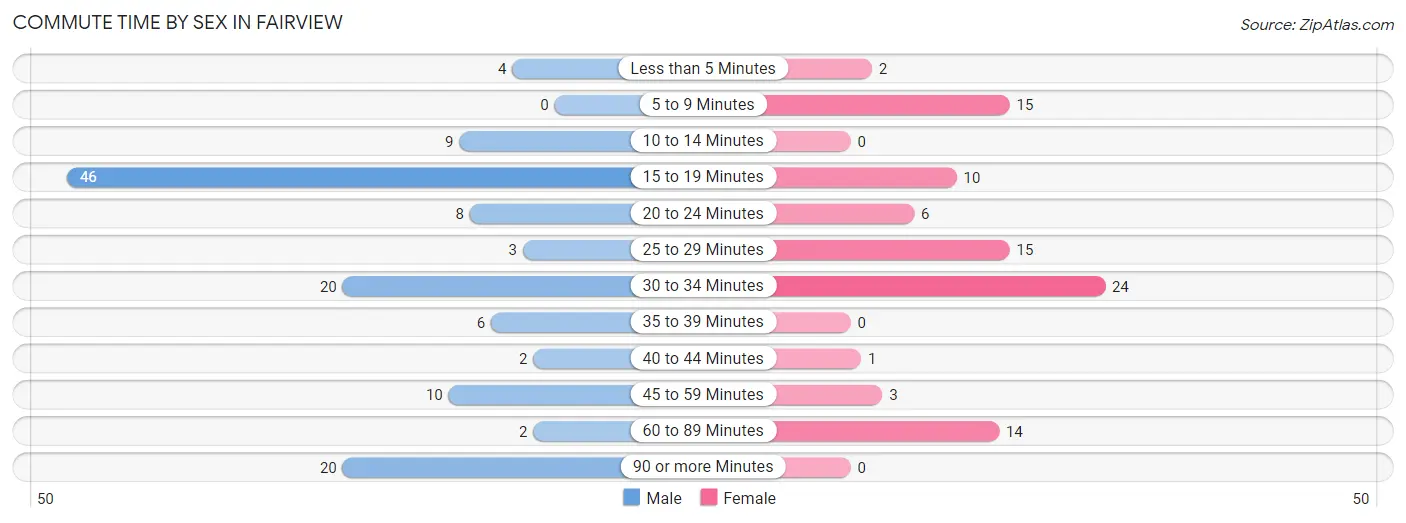
| Commute Time | Male | Female |
| Less than 5 Minutes | 4 (3.1%) | 2 (2.2%) |
| 5 to 9 Minutes | 0 (0.0%) | 15 (16.7%) |
| 10 to 14 Minutes | 9 (6.9%) | 0 (0.0%) |
| 15 to 19 Minutes | 46 (35.4%) | 10 (11.1%) |
| 20 to 24 Minutes | 8 (6.1%) | 6 (6.7%) |
| 25 to 29 Minutes | 3 (2.3%) | 15 (16.7%) |
| 30 to 34 Minutes | 20 (15.4%) | 24 (26.7%) |
| 35 to 39 Minutes | 6 (4.6%) | 0 (0.0%) |
| 40 to 44 Minutes | 2 (1.5%) | 1 (1.1%) |
| 45 to 59 Minutes | 10 (7.7%) | 3 (3.3%) |
| 60 to 89 Minutes | 2 (1.5%) | 14 (15.6%) |
| 90 or more Minutes | 20 (15.4%) | 0 (0.0%) |
Time of Departure to Work by Sex in Fairview
The most frequent times of departure to work in Fairview are 8:00 AM to 8:29 AM (34, 26.2%) for males and 6:30 AM to 6:59 AM (22, 24.4%) for females.
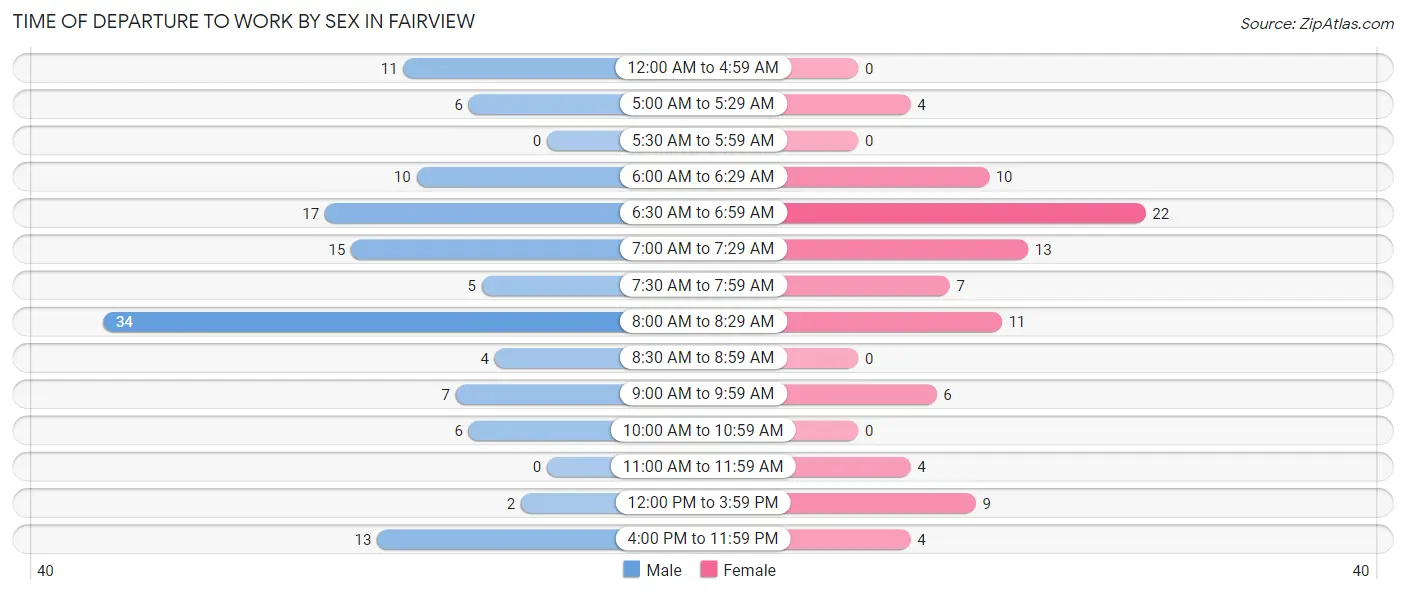
| Time of Departure | Male | Female |
| 12:00 AM to 4:59 AM | 11 (8.5%) | 0 (0.0%) |
| 5:00 AM to 5:29 AM | 6 (4.6%) | 4 (4.4%) |
| 5:30 AM to 5:59 AM | 0 (0.0%) | 0 (0.0%) |
| 6:00 AM to 6:29 AM | 10 (7.7%) | 10 (11.1%) |
| 6:30 AM to 6:59 AM | 17 (13.1%) | 22 (24.4%) |
| 7:00 AM to 7:29 AM | 15 (11.5%) | 13 (14.4%) |
| 7:30 AM to 7:59 AM | 5 (3.8%) | 7 (7.8%) |
| 8:00 AM to 8:29 AM | 34 (26.2%) | 11 (12.2%) |
| 8:30 AM to 8:59 AM | 4 (3.1%) | 0 (0.0%) |
| 9:00 AM to 9:59 AM | 7 (5.4%) | 6 (6.7%) |
| 10:00 AM to 10:59 AM | 6 (4.6%) | 0 (0.0%) |
| 11:00 AM to 11:59 AM | 0 (0.0%) | 4 (4.4%) |
| 12:00 PM to 3:59 PM | 2 (1.5%) | 9 (10.0%) |
| 4:00 PM to 11:59 PM | 13 (10.0%) | 4 (4.4%) |
| Total | 130 (100.0%) | 90 (100.0%) |
Housing Occupancy in Fairview
Occupancy by Ownership in Fairview
Of the total 224 dwellings in Fairview, owner-occupied units account for 143 (63.8%), while renter-occupied units make up 81 (36.2%).
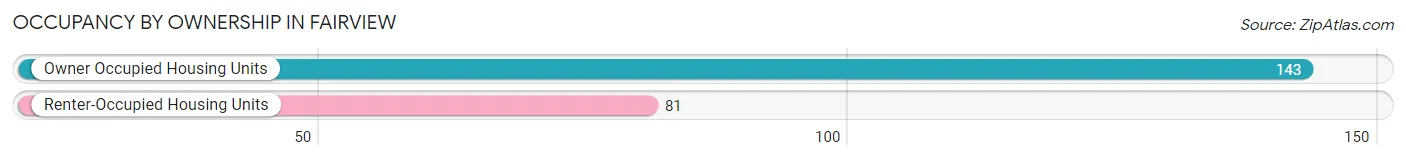
| Occupancy | # Housing Units | % Housing Units |
| Owner Occupied Housing Units | 143 | 63.8% |
| Renter-Occupied Housing Units | 81 | 36.2% |
| Total Occupied Housing Units | 224 | 100.0% |
Occupancy by Household Size in Fairview
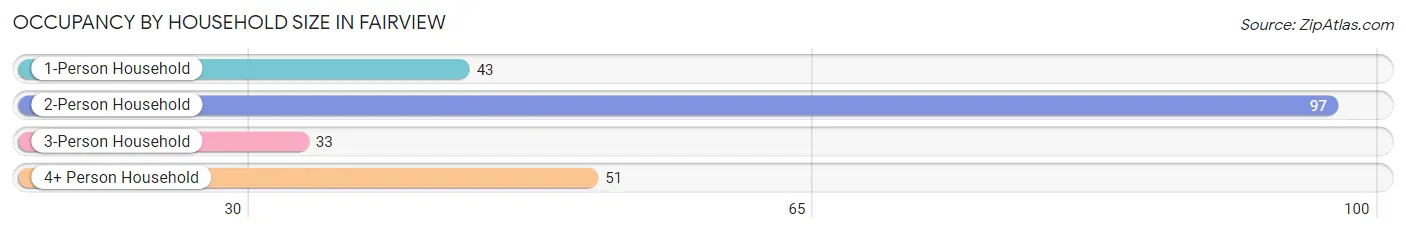
| Household Size | # Housing Units | % Housing Units |
| 1-Person Household | 43 | 19.2% |
| 2-Person Household | 97 | 43.3% |
| 3-Person Household | 33 | 14.7% |
| 4+ Person Household | 51 | 22.8% |
| Total Housing Units | 224 | 100.0% |
Occupancy by Ownership by Household Size in Fairview
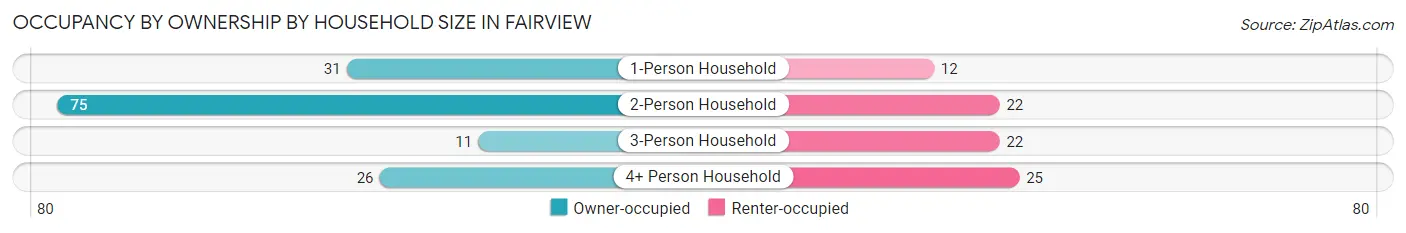
| Household Size | Owner-occupied | Renter-occupied |
| 1-Person Household | 31 (72.1%) | 12 (27.9%) |
| 2-Person Household | 75 (77.3%) | 22 (22.7%) |
| 3-Person Household | 11 (33.3%) | 22 (66.7%) |
| 4+ Person Household | 26 (51.0%) | 25 (49.0%) |
| Total Housing Units | 143 (63.8%) | 81 (36.2%) |
Occupancy by Educational Attainment in Fairview
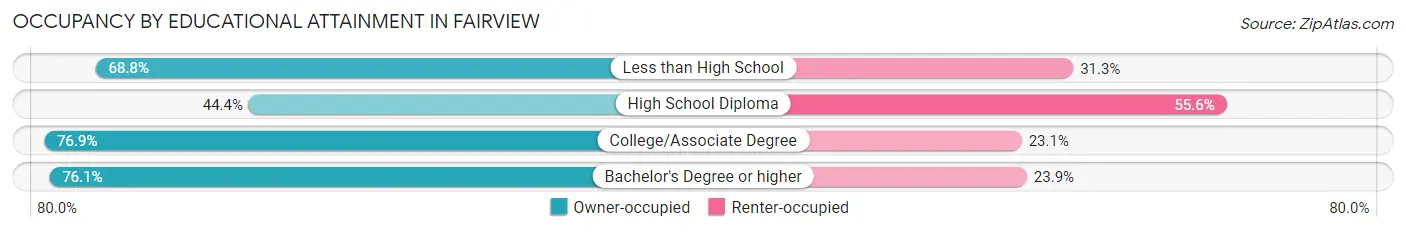
| Household Size | Owner-occupied | Renter-occupied |
| Less than High School | 22 (68.8%) | 10 (31.2%) |
| High School Diploma | 36 (44.4%) | 45 (55.6%) |
| College/Associate Degree | 50 (76.9%) | 15 (23.1%) |
| Bachelor's Degree or higher | 35 (76.1%) | 11 (23.9%) |
Occupancy by Age of Householder in Fairview
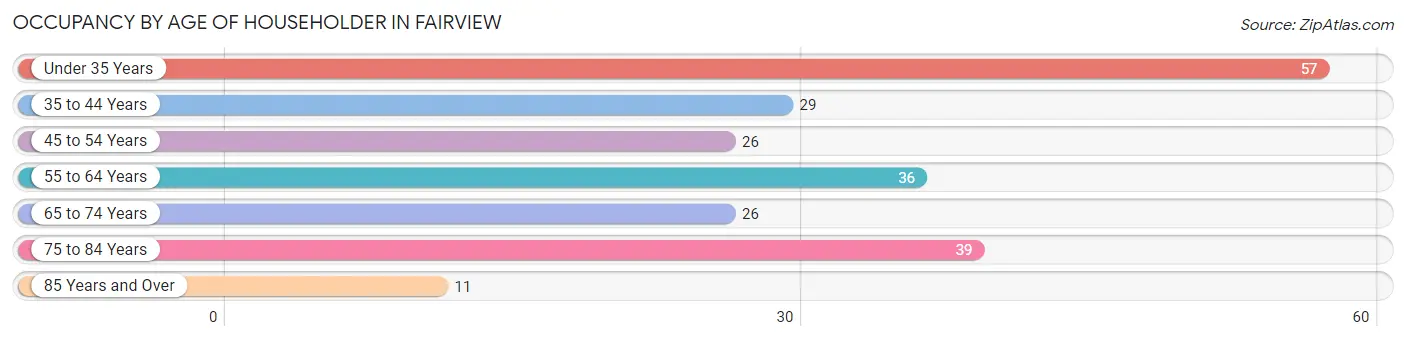
| Age Bracket | # Households | % Households |
| Under 35 Years | 57 | 25.5% |
| 35 to 44 Years | 29 | 13.0% |
| 45 to 54 Years | 26 | 11.6% |
| 55 to 64 Years | 36 | 16.1% |
| 65 to 74 Years | 26 | 11.6% |
| 75 to 84 Years | 39 | 17.4% |
| 85 Years and Over | 11 | 4.9% |
| Total | 224 | 100.0% |
Housing Finances in Fairview
Median Income by Occupancy in Fairview
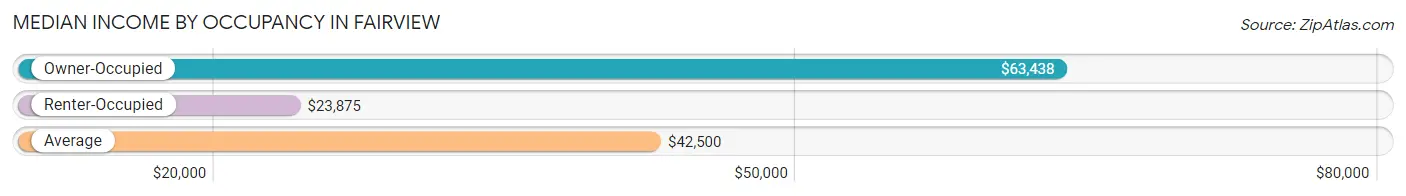
| Occupancy Type | # Households | Median Income |
| Owner-Occupied | 143 (63.8%) | $63,438 |
| Renter-Occupied | 81 (36.2%) | $23,875 |
| Average | 224 (100.0%) | $42,500 |
Occupancy by Householder Income Bracket in Fairview
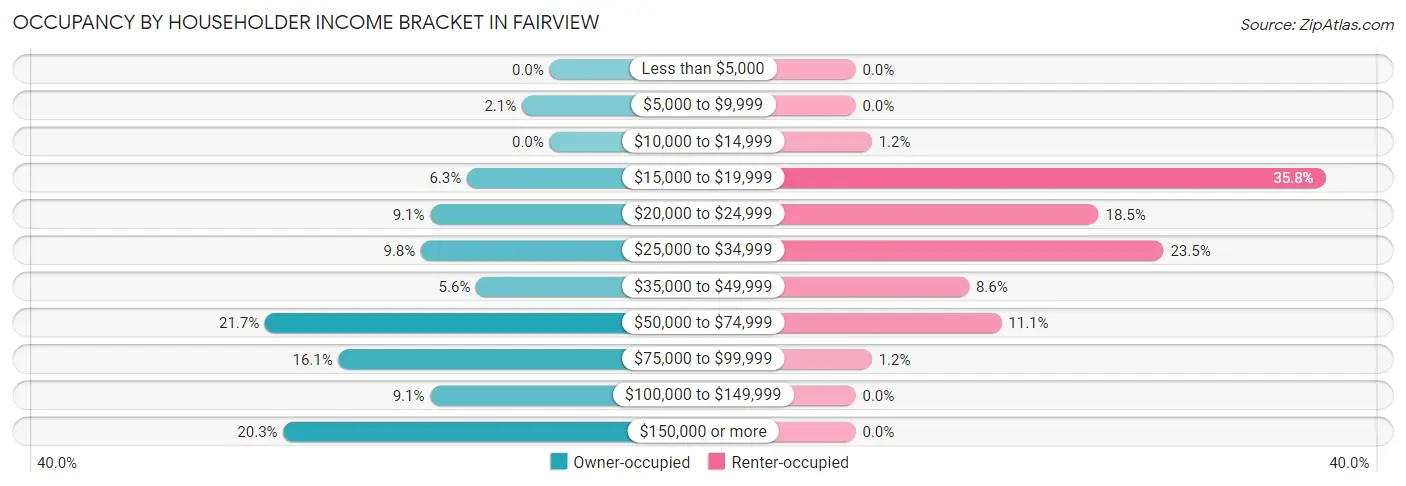
| Income Bracket | Owner-occupied | Renter-occupied |
| Less than $5,000 | 0 (0.0%) | 0 (0.0%) |
| $5,000 to $9,999 | 3 (2.1%) | 0 (0.0%) |
| $10,000 to $14,999 | 0 (0.0%) | 1 (1.2%) |
| $15,000 to $19,999 | 9 (6.3%) | 29 (35.8%) |
| $20,000 to $24,999 | 13 (9.1%) | 15 (18.5%) |
| $25,000 to $34,999 | 14 (9.8%) | 19 (23.5%) |
| $35,000 to $49,999 | 8 (5.6%) | 7 (8.6%) |
| $50,000 to $74,999 | 31 (21.7%) | 9 (11.1%) |
| $75,000 to $99,999 | 23 (16.1%) | 1 (1.2%) |
| $100,000 to $149,999 | 13 (9.1%) | 0 (0.0%) |
| $150,000 or more | 29 (20.3%) | 0 (0.0%) |
| Total | 143 (100.0%) | 81 (100.0%) |
Monthly Housing Cost Tiers in Fairview
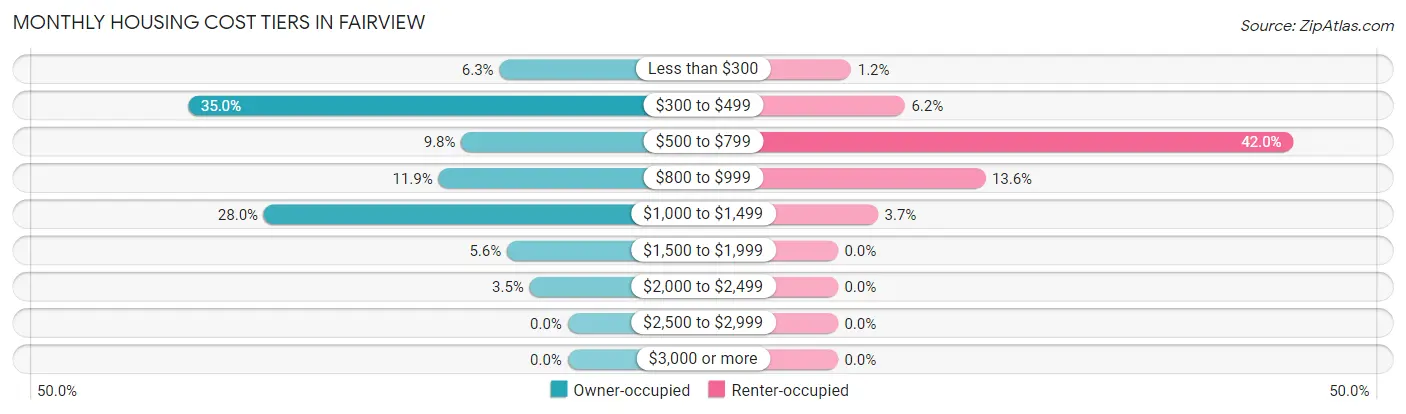
| Monthly Cost | Owner-occupied | Renter-occupied |
| Less than $300 | 9 (6.3%) | 1 (1.2%) |
| $300 to $499 | 50 (35.0%) | 5 (6.2%) |
| $500 to $799 | 14 (9.8%) | 34 (42.0%) |
| $800 to $999 | 17 (11.9%) | 11 (13.6%) |
| $1,000 to $1,499 | 40 (28.0%) | 3 (3.7%) |
| $1,500 to $1,999 | 8 (5.6%) | 0 (0.0%) |
| $2,000 to $2,499 | 5 (3.5%) | 0 (0.0%) |
| $2,500 to $2,999 | 0 (0.0%) | 0 (0.0%) |
| $3,000 or more | 0 (0.0%) | 0 (0.0%) |
| Total | 143 (100.0%) | 81 (100.0%) |
Physical Housing Characteristics in Fairview
Housing Structures in Fairview
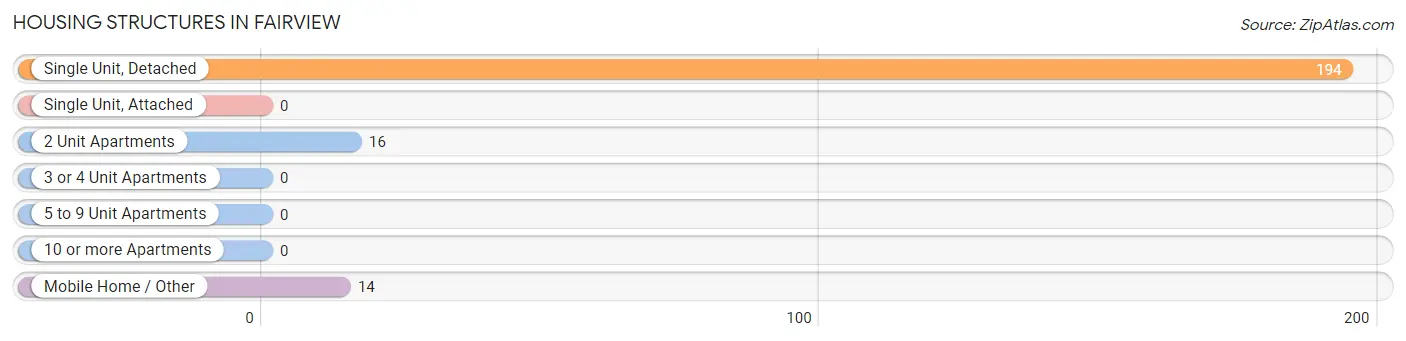
| Structure Type | # Housing Units | % Housing Units |
| Single Unit, Detached | 194 | 86.6% |
| Single Unit, Attached | 0 | 0.0% |
| 2 Unit Apartments | 16 | 7.1% |
| 3 or 4 Unit Apartments | 0 | 0.0% |
| 5 to 9 Unit Apartments | 0 | 0.0% |
| 10 or more Apartments | 0 | 0.0% |
| Mobile Home / Other | 14 | 6.2% |
| Total | 224 | 100.0% |
Housing Structures by Occupancy in Fairview
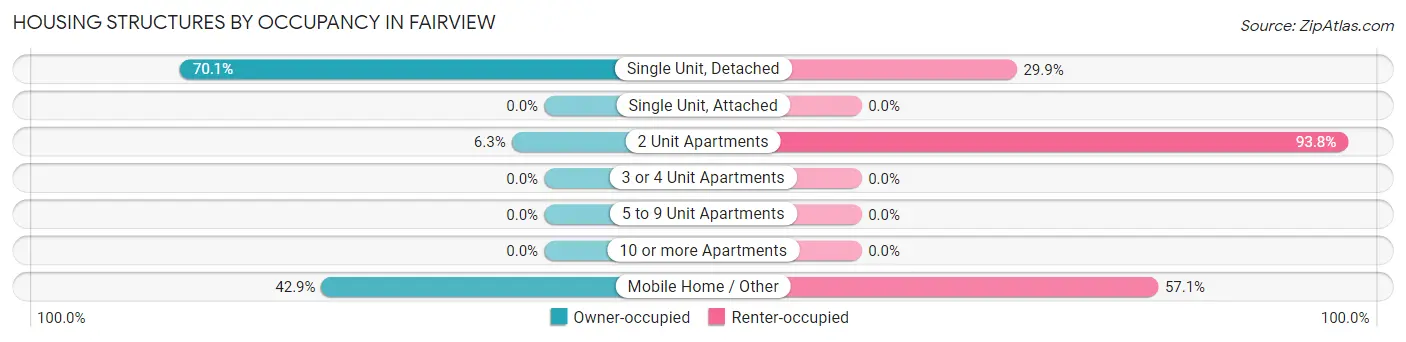
| Structure Type | Owner-occupied | Renter-occupied |
| Single Unit, Detached | 136 (70.1%) | 58 (29.9%) |
| Single Unit, Attached | 0 (0.0%) | 0 (0.0%) |
| 2 Unit Apartments | 1 (6.2%) | 15 (93.8%) |
| 3 or 4 Unit Apartments | 0 (0.0%) | 0 (0.0%) |
| 5 to 9 Unit Apartments | 0 (0.0%) | 0 (0.0%) |
| 10 or more Apartments | 0 (0.0%) | 0 (0.0%) |
| Mobile Home / Other | 6 (42.9%) | 8 (57.1%) |
| Total | 143 (63.8%) | 81 (36.2%) |
Housing Structures by Number of Rooms in Fairview
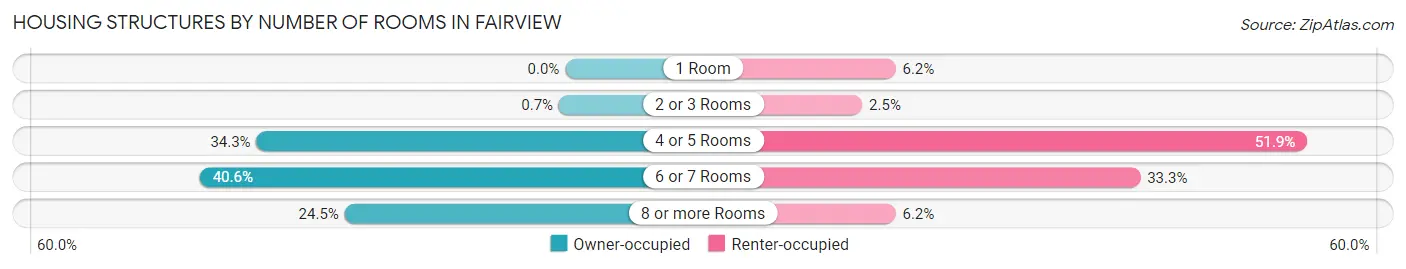
| Number of Rooms | Owner-occupied | Renter-occupied |
| 1 Room | 0 (0.0%) | 5 (6.2%) |
| 2 or 3 Rooms | 1 (0.7%) | 2 (2.5%) |
| 4 or 5 Rooms | 49 (34.3%) | 42 (51.8%) |
| 6 or 7 Rooms | 58 (40.6%) | 27 (33.3%) |
| 8 or more Rooms | 35 (24.5%) | 5 (6.2%) |
| Total | 143 (100.0%) | 81 (100.0%) |
Housing Structure by Heating Type in Fairview
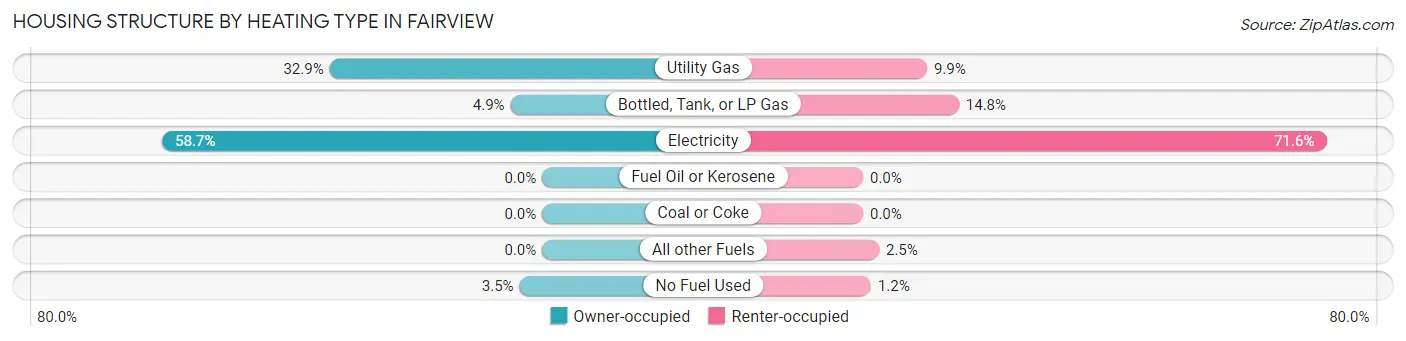
| Heating Type | Owner-occupied | Renter-occupied |
| Utility Gas | 47 (32.9%) | 8 (9.9%) |
| Bottled, Tank, or LP Gas | 7 (4.9%) | 12 (14.8%) |
| Electricity | 84 (58.7%) | 58 (71.6%) |
| Fuel Oil or Kerosene | 0 (0.0%) | 0 (0.0%) |
| Coal or Coke | 0 (0.0%) | 0 (0.0%) |
| All other Fuels | 0 (0.0%) | 2 (2.5%) |
| No Fuel Used | 5 (3.5%) | 1 (1.2%) |
| Total | 143 (100.0%) | 81 (100.0%) |
Household Vehicle Usage in Fairview
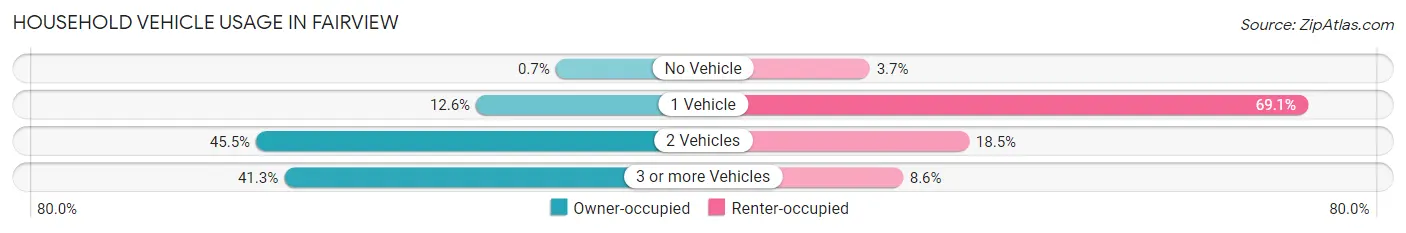
| Vehicles per Household | Owner-occupied | Renter-occupied |
| No Vehicle | 1 (0.7%) | 3 (3.7%) |
| 1 Vehicle | 18 (12.6%) | 56 (69.1%) |
| 2 Vehicles | 65 (45.5%) | 15 (18.5%) |
| 3 or more Vehicles | 59 (41.3%) | 7 (8.6%) |
| Total | 143 (100.0%) | 81 (100.0%) |
Real Estate & Mortgages in Fairview
Real Estate and Mortgage Overview in Fairview
| Characteristic | Without Mortgage | With Mortgage |
| Housing Units | 73 | 70 |
| Median Property Value | $198,200 | $212,500 |
| Median Household Income | $56,563 | $17 |
| Monthly Housing Costs | $403 | $0 |
| Real Estate Taxes | $394 | $1 |
Property Value by Mortgage Status in Fairview
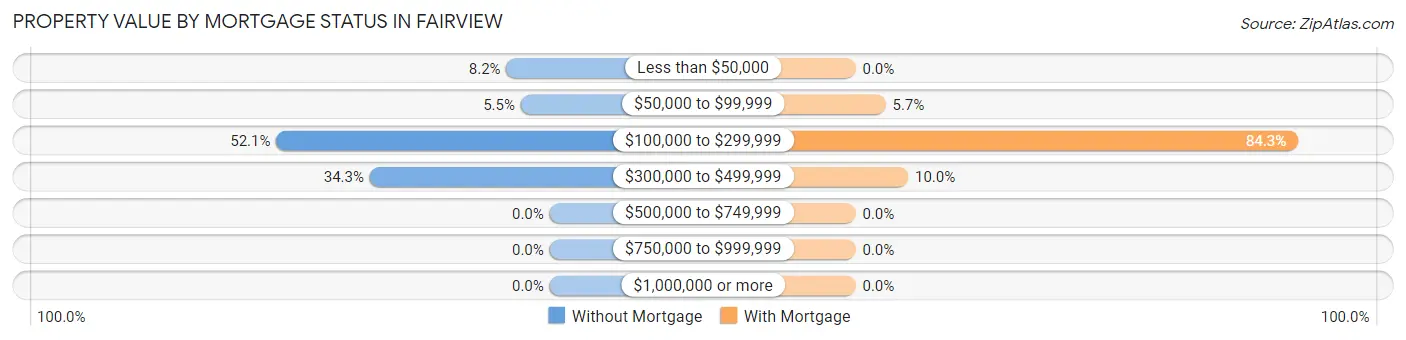
| Property Value | Without Mortgage | With Mortgage |
| Less than $50,000 | 6 (8.2%) | 0 (0.0%) |
| $50,000 to $99,999 | 4 (5.5%) | 4 (5.7%) |
| $100,000 to $299,999 | 38 (52.0%) | 59 (84.3%) |
| $300,000 to $499,999 | 25 (34.3%) | 7 (10.0%) |
| $500,000 to $749,999 | 0 (0.0%) | 0 (0.0%) |
| $750,000 to $999,999 | 0 (0.0%) | 0 (0.0%) |
| $1,000,000 or more | 0 (0.0%) | 0 (0.0%) |
| Total | 73 (100.0%) | 70 (100.0%) |
Household Income by Mortgage Status in Fairview
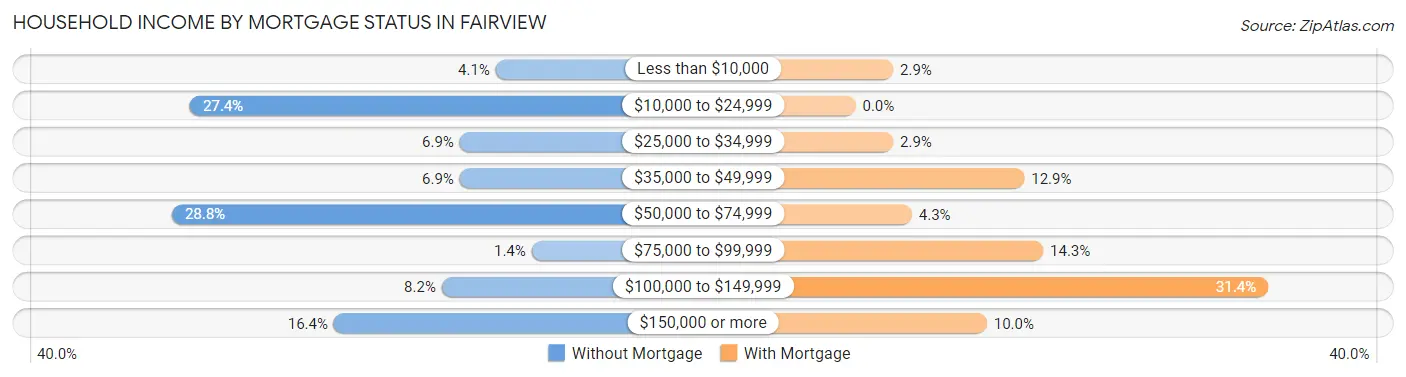
| Household Income | Without Mortgage | With Mortgage |
| Less than $10,000 | 3 (4.1%) | 2 (2.9%) |
| $10,000 to $24,999 | 20 (27.4%) | 0 (0.0%) |
| $25,000 to $34,999 | 5 (6.9%) | 2 (2.9%) |
| $35,000 to $49,999 | 5 (6.9%) | 9 (12.9%) |
| $50,000 to $74,999 | 21 (28.8%) | 3 (4.3%) |
| $75,000 to $99,999 | 1 (1.4%) | 10 (14.3%) |
| $100,000 to $149,999 | 6 (8.2%) | 22 (31.4%) |
| $150,000 or more | 12 (16.4%) | 7 (10.0%) |
| Total | 73 (100.0%) | 70 (100.0%) |
Property Value to Household Income Ratio in Fairview
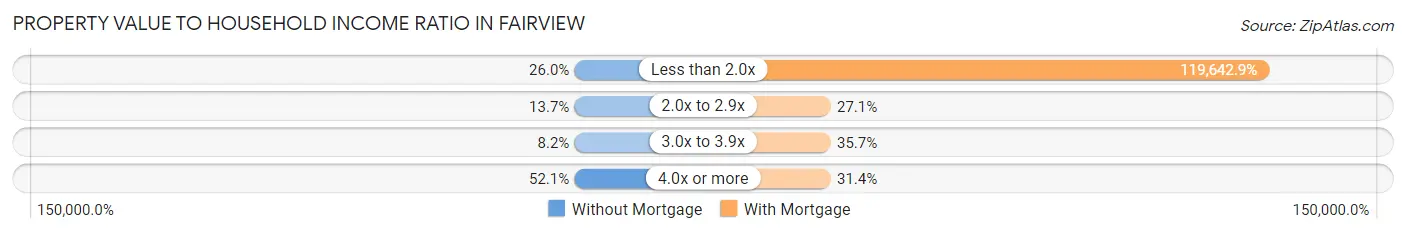
| Value-to-Income Ratio | Without Mortgage | With Mortgage |
| Less than 2.0x | 19 (26.0%) | 83,750 (119,642.9%) |
| 2.0x to 2.9x | 10 (13.7%) | 19 (27.1%) |
| 3.0x to 3.9x | 6 (8.2%) | 25 (35.7%) |
| 4.0x or more | 38 (52.0%) | 22 (31.4%) |
| Total | 73 (100.0%) | 70 (100.0%) |
Real Estate Taxes by Mortgage Status in Fairview
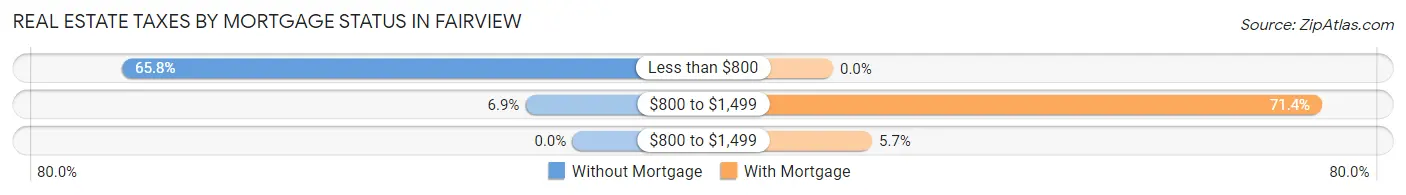
| Property Taxes | Without Mortgage | With Mortgage |
| Less than $800 | 48 (65.7%) | 0 (0.0%) |
| $800 to $1,499 | 5 (6.9%) | 50 (71.4%) |
| $800 to $1,499 | 0 (0.0%) | 4 (5.7%) |
| Total | 73 (100.0%) | 70 (100.0%) |
Health & Disability in Fairview
Health Insurance Coverage by Age in Fairview
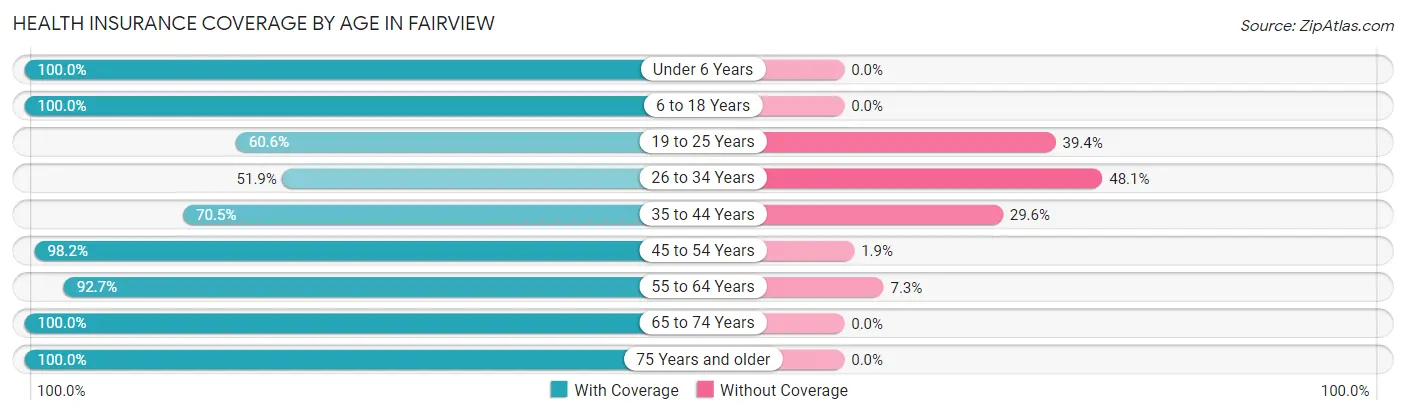
| Age Bracket | With Coverage | Without Coverage |
| Under 6 Years | 70 (100.0%) | 0 (0.0%) |
| 6 to 18 Years | 127 (100.0%) | 0 (0.0%) |
| 19 to 25 Years | 20 (60.6%) | 13 (39.4%) |
| 26 to 34 Years | 55 (51.9%) | 51 (48.1%) |
| 35 to 44 Years | 31 (70.5%) | 13 (29.5%) |
| 45 to 54 Years | 53 (98.2%) | 1 (1.8%) |
| 55 to 64 Years | 76 (92.7%) | 6 (7.3%) |
| 65 to 74 Years | 77 (100.0%) | 0 (0.0%) |
| 75 Years and older | 88 (100.0%) | 0 (0.0%) |
| Total | 597 (87.7%) | 84 (12.3%) |
Health Insurance Coverage by Citizenship Status in Fairview
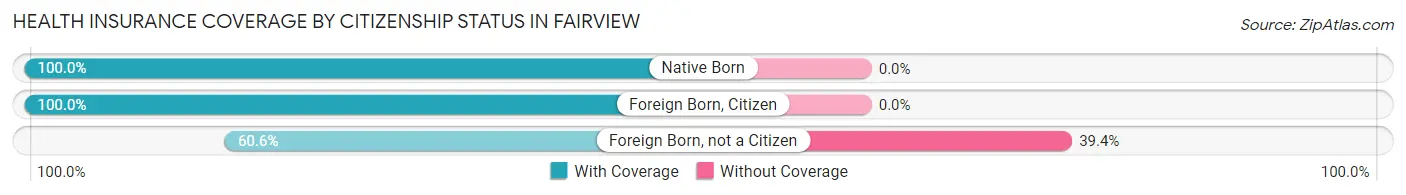
| Citizenship Status | With Coverage | Without Coverage |
| Native Born | 70 (100.0%) | 0 (0.0%) |
| Foreign Born, Citizen | 127 (100.0%) | 0 (0.0%) |
| Foreign Born, not a Citizen | 20 (60.6%) | 13 (39.4%) |
Health Insurance Coverage by Household Income in Fairview
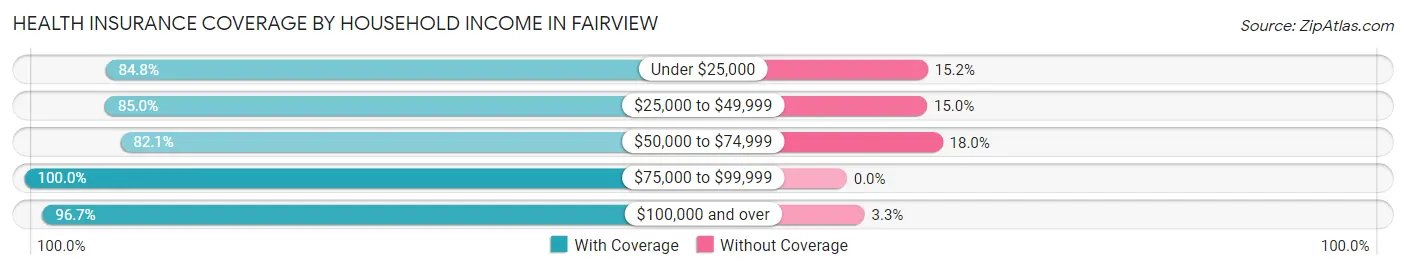
| Household Income | With Coverage | Without Coverage |
| Under $25,000 | 151 (84.8%) | 27 (15.2%) |
| $25,000 to $49,999 | 96 (85.0%) | 17 (15.0%) |
| $50,000 to $74,999 | 160 (82.1%) | 35 (17.9%) |
| $75,000 to $99,999 | 45 (100.0%) | 0 (0.0%) |
| $100,000 and over | 145 (96.7%) | 5 (3.3%) |
Public vs Private Health Insurance Coverage by Age in Fairview
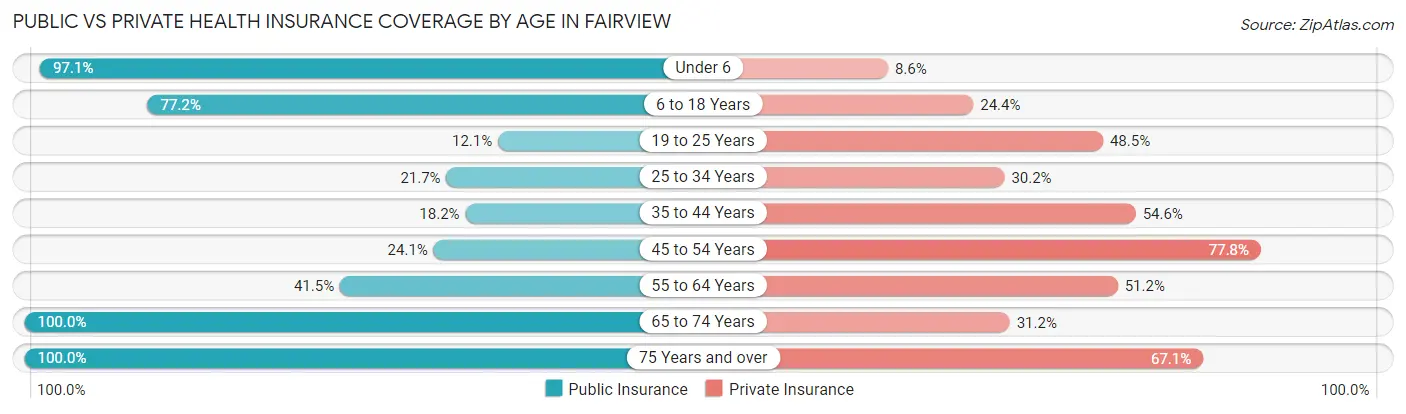
| Age Bracket | Public Insurance | Private Insurance |
| Under 6 | 68 (97.1%) | 6 (8.6%) |
| 6 to 18 Years | 98 (77.2%) | 31 (24.4%) |
| 19 to 25 Years | 4 (12.1%) | 16 (48.5%) |
| 25 to 34 Years | 23 (21.7%) | 32 (30.2%) |
| 35 to 44 Years | 8 (18.2%) | 24 (54.5%) |
| 45 to 54 Years | 13 (24.1%) | 42 (77.8%) |
| 55 to 64 Years | 34 (41.5%) | 42 (51.2%) |
| 65 to 74 Years | 77 (100.0%) | 24 (31.2%) |
| 75 Years and over | 88 (100.0%) | 59 (67.0%) |
| Total | 413 (60.7%) | 276 (40.5%) |
Disability Status by Sex by Age in Fairview
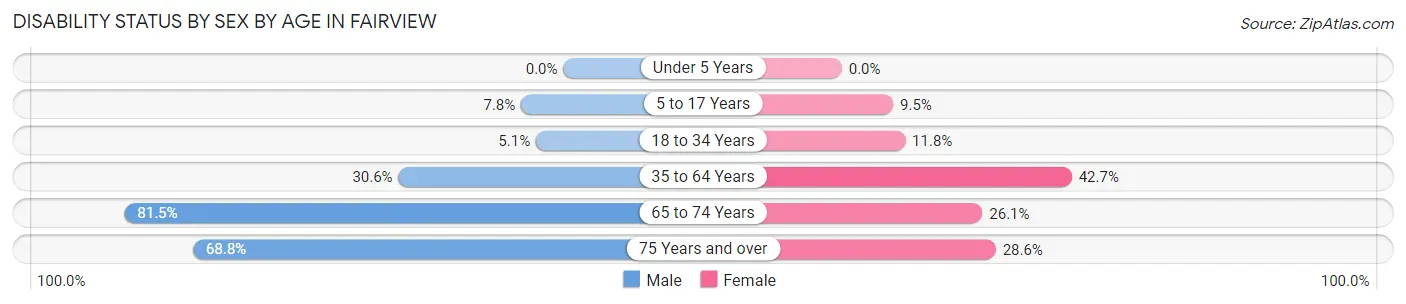
| Age Bracket | Male | Female |
| Under 5 Years | 0 (0.0%) | 0 (0.0%) |
| 5 to 17 Years | 8 (7.8%) | 2 (9.5%) |
| 18 to 34 Years | 3 (5.1%) | 10 (11.8%) |
| 35 to 64 Years | 30 (30.6%) | 35 (42.7%) |
| 65 to 74 Years | 44 (81.5%) | 6 (26.1%) |
| 75 Years and over | 22 (68.8%) | 16 (28.6%) |
Disability Class by Sex by Age in Fairview
Disability Class: Hearing Difficulty
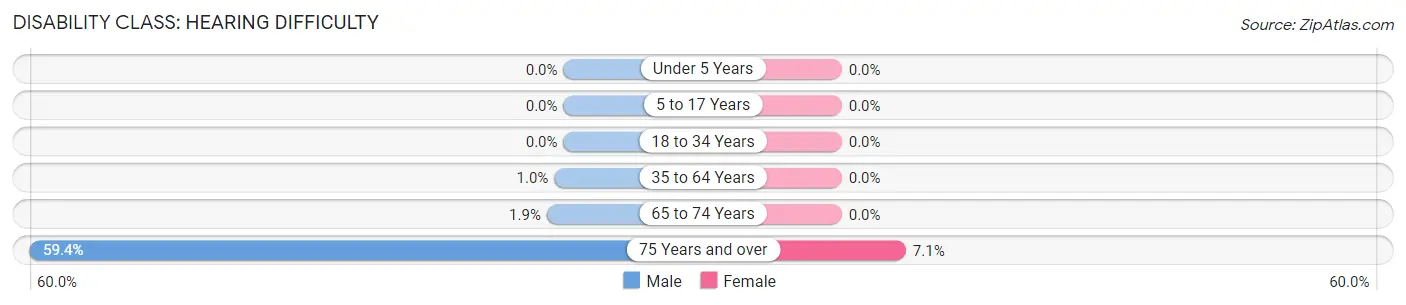
| Age Bracket | Male | Female |
| Under 5 Years | 0 (0.0%) | 0 (0.0%) |
| 5 to 17 Years | 0 (0.0%) | 0 (0.0%) |
| 18 to 34 Years | 0 (0.0%) | 0 (0.0%) |
| 35 to 64 Years | 1 (1.0%) | 0 (0.0%) |
| 65 to 74 Years | 1 (1.8%) | 0 (0.0%) |
| 75 Years and over | 19 (59.4%) | 4 (7.1%) |
Disability Class: Vision Difficulty
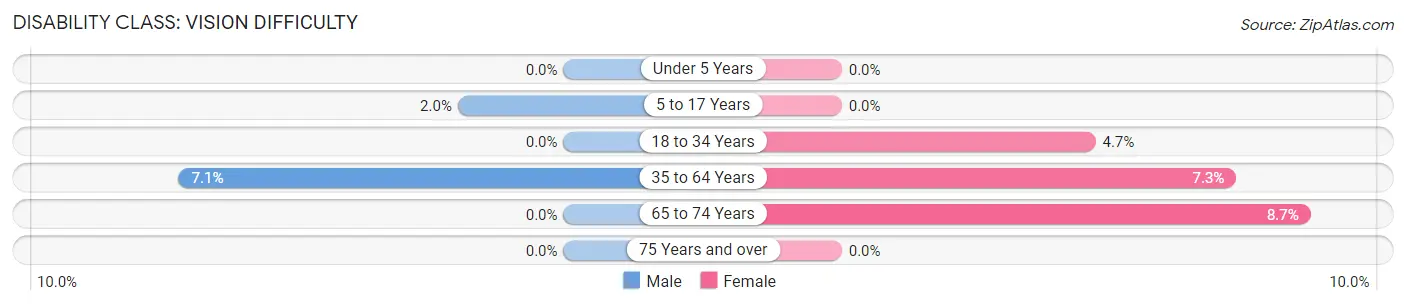
| Age Bracket | Male | Female |
| Under 5 Years | 0 (0.0%) | 0 (0.0%) |
| 5 to 17 Years | 2 (2.0%) | 0 (0.0%) |
| 18 to 34 Years | 0 (0.0%) | 4 (4.7%) |
| 35 to 64 Years | 7 (7.1%) | 6 (7.3%) |
| 65 to 74 Years | 0 (0.0%) | 2 (8.7%) |
| 75 Years and over | 0 (0.0%) | 0 (0.0%) |
Disability Class: Cognitive Difficulty
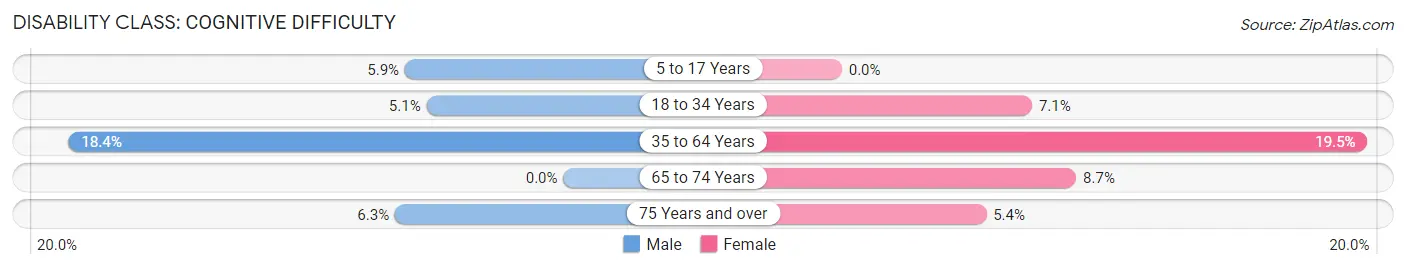
| Age Bracket | Male | Female |
| 5 to 17 Years | 6 (5.9%) | 0 (0.0%) |
| 18 to 34 Years | 3 (5.1%) | 6 (7.1%) |
| 35 to 64 Years | 18 (18.4%) | 16 (19.5%) |
| 65 to 74 Years | 0 (0.0%) | 2 (8.7%) |
| 75 Years and over | 2 (6.2%) | 3 (5.4%) |
Disability Class: Ambulatory Difficulty
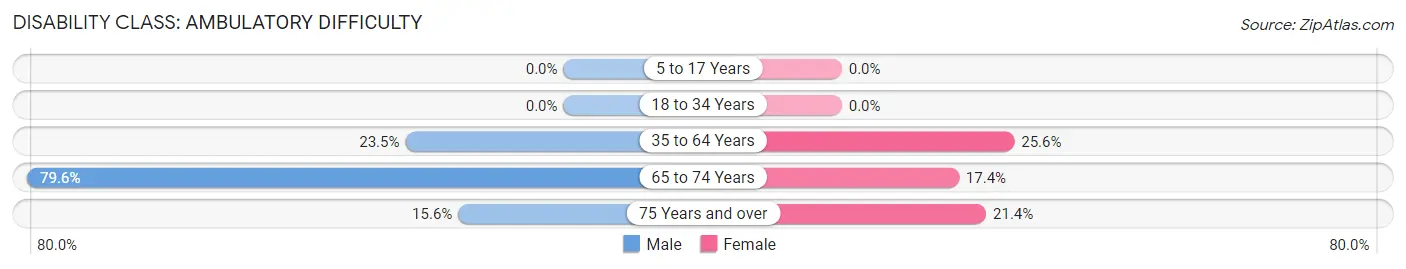
| Age Bracket | Male | Female |
| 5 to 17 Years | 0 (0.0%) | 0 (0.0%) |
| 18 to 34 Years | 0 (0.0%) | 0 (0.0%) |
| 35 to 64 Years | 23 (23.5%) | 21 (25.6%) |
| 65 to 74 Years | 43 (79.6%) | 4 (17.4%) |
| 75 Years and over | 5 (15.6%) | 12 (21.4%) |
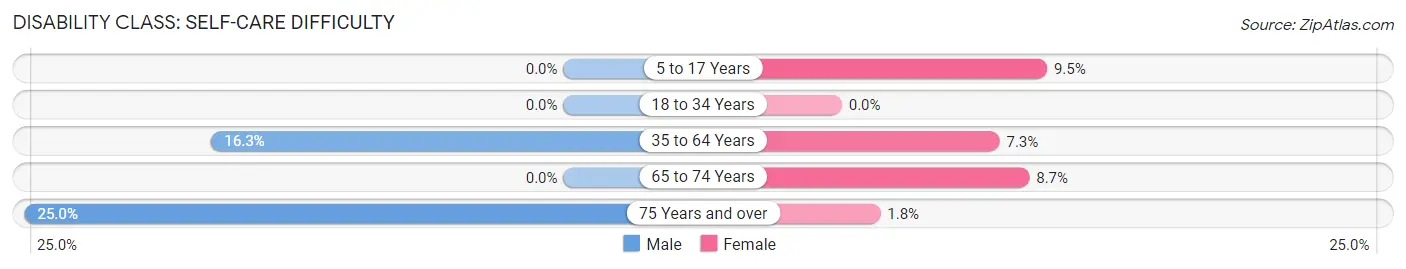
Disability Class: Self-Care Difficulty
| Age Bracket | Male | Female |
| 5 to 17 Years | 0 (0.0%) | 2 (9.5%) |
| 18 to 34 Years | 0 (0.0%) | 0 (0.0%) |
| 35 to 64 Years | 16 (16.3%) | 6 (7.3%) |
| 65 to 74 Years | 0 (0.0%) | 2 (8.7%) |
| 75 Years and over | 8 (25.0%) | 1 (1.8%) |
Technology Access in Fairview
Computing Device Access in Fairview
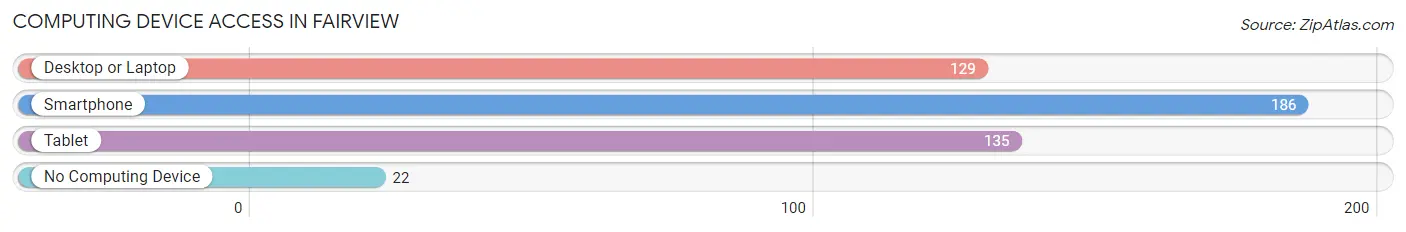
| Device Type | # Households | % Households |
| Desktop or Laptop | 129 | 57.6% |
| Smartphone | 186 | 83.0% |
| Tablet | 135 | 60.3% |
| No Computing Device | 22 | 9.8% |
| Total | 224 | 100.0% |
Internet Access in Fairview
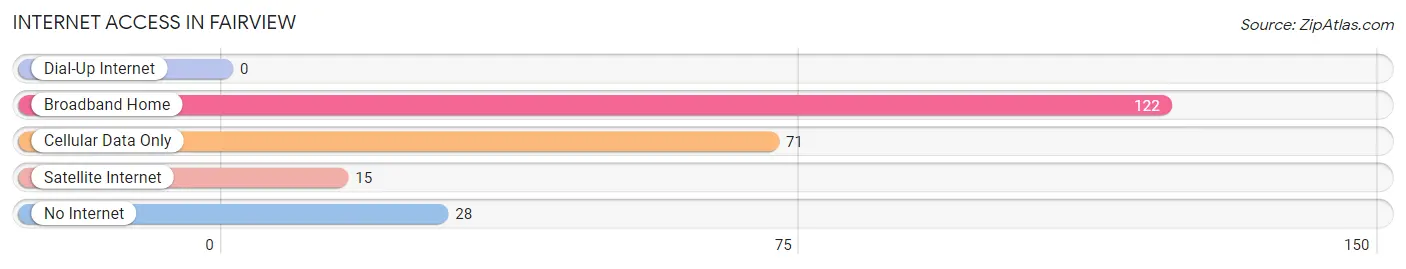
| Internet Type | # Households | % Households |
| Dial-Up Internet | 0 | 0.0% |
| Broadband Home | 122 | 54.5% |
| Cellular Data Only | 71 | 31.7% |
| Satellite Internet | 15 | 6.7% |
| No Internet | 28 | 12.5% |
| Total | 224 | 100.0% |
Fairview Summary
Introduction
Fairview is a small town located in the state of Alabama, United States. It is situated in the northwest corner of the state, in the foothills of the Appalachian Mountains. The town has a population of approximately 1,000 people and is part of the Cullman County. Fairview is known for its rural charm and its close proximity to the larger cities of Birmingham and Huntsville.
History
Fairview was founded in 1837 by a group of settlers from North Carolina. The town was originally known as “Fairview Crossroads” due to its location at the intersection of two major roads. The town was officially incorporated in 1845 and was named after the nearby Fairview Mountain.
In the late 19th century, Fairview was a thriving agricultural community. The town was home to several cotton gins, sawmills, and gristmills. The town also had a thriving business district, with several stores, banks, and other businesses.
In the early 20th century, Fairview began to decline as the local economy shifted away from agriculture. The town’s population began to decline as well, and by the 1950s, the population had dropped to just over 500 people.
Geography
Fairview is located in the northwest corner of Alabama, in the foothills of the Appalachian Mountains. The town is situated at the intersection of two major roads, US Highway 278 and Alabama State Route 69. The town is located approximately 30 miles north of Birmingham and 40 miles south of Huntsville.
The terrain around Fairview is mostly hilly and forested, with several small streams and creeks running through the area. The town is located in the Black Warrior River watershed, and the nearby Black Warrior River is a popular destination for fishing and boating.
Economy
Fairview’s economy is largely based on agriculture and tourism. The town is home to several farms, which produce a variety of crops, including cotton, corn, soybeans, and hay. The town also has several small businesses, including restaurants, convenience stores, and gas stations.
The town is also a popular destination for tourists, who come to enjoy the rural charm and the nearby attractions, such as the Black Warrior River and the nearby state parks.
Demographics
As of the 2010 census, Fairview had a population of 1,000 people. The racial makeup of the town was 97.2% White, 0.7% African American, 0.3% Native American, 0.2% Asian, and 1.6% from other races. The median household income was $35,000, and the median age was 40 years.
Conclusion
Fairview is a small town located in the northwest corner of Alabama. The town has a population of approximately 1,000 people and is known for its rural charm and its close proximity to the larger cities of Birmingham and Huntsville. The town’s economy is largely based on agriculture and tourism, and the town is a popular destination for tourists who come to enjoy the rural charm and the nearby attractions.
Common Questions
What is Per Capita Income in Fairview?
Per Capita income in Fairview is $23,377.
What is the Median Family Income in Fairview?
Median Family Income in Fairview is $56,563.
What is the Median Household income in Fairview?
Median Household Income in Fairview is $42,500.
What is Income or Wage Gap in Fairview?
Income or Wage Gap in Fairview is 29.2%.
Women in Fairview earn 70.8 cents for every dollar earned by a man.
What is Family Income Deficit in Fairview?
Family Income Deficit in Fairview is $6,732.
Families that are below poverty line in Fairview earn $6,732 less on average than the poverty threshold level.
What is Inequality or Gini Index in Fairview?
Inequality or Gini Index in Fairview is 0.45.
What is the Total Population of Fairview?
Total Population of Fairview is 681.
What is the Total Male Population of Fairview?
Total Male Population of Fairview is 394.
What is the Total Female Population of Fairview?
Total Female Population of Fairview is 287.
What is the Ratio of Males per 100 Females in Fairview?
There are 137.28 Males per 100 Females in Fairview.
What is the Ratio of Females per 100 Males in Fairview?
There are 72.84 Females per 100 Males in Fairview.
What is the Median Population Age in Fairview?
Median Population Age in Fairview is 35.3 Years.
What is the Average Family Size in Fairview
Average Family Size in Fairview is 3.5 People.
What is the Average Household Size in Fairview
Average Household Size in Fairview is 3.0 People.
How Large is the Labor Force in Fairview?
There are 255 People in the Labor Forcein in Fairview.
What is the Percentage of People in the Labor Force in Fairview?
51.5% of People are in the Labor Force in Fairview.
What is the Unemployment Rate in Fairview?
Unemployment Rate in Fairview is 11.4%.