Riverview, AL Map & Demographics
Riverview Map
Riverview Overview
$16,639
PER CAPITA INCOME
$37,750
AVG FAMILY INCOME
$36,250
AVG HOUSEHOLD INCOME
0.48
INEQUALITY / GINI INDEX
197
TOTAL POPULATION
104
MALE POPULATION
93
FEMALE POPULATION
111.83
MALES / 100 FEMALES
89.42
FEMALES / 100 MALES
37.3
MEDIAN AGE
5.8
AVG FAMILY SIZE
4.1
AVG HOUSEHOLD SIZE
49
LABOR FORCE [ PEOPLE ]
39.8%
PERCENT IN LABOR FORCE
Income in Riverview
Income Overview in Riverview
Per Capita Income in Riverview is $16,639, while median incomes of families and households are $37,750 and $36,250 respectively.
| Characteristic | Number | Measure |
| Per Capita Income | 197 | $16,639 |
| Median Family Income | 31 | $37,750 |
| Mean Family Income | 31 | $58,681 |
| Median Household Income | 48 | $36,250 |
| Mean Household Income | 48 | $50,877 |
| Income Deficit | 31 | $0 |
| Wage / Income Gap (%) | 197 | 0.00% |
| Wage / Income Gap ($) | 197 | 100.00¢ per $1 |
| Gini / Inequality Index | 197 | 0.48 |
Earnings by Sex in Riverview
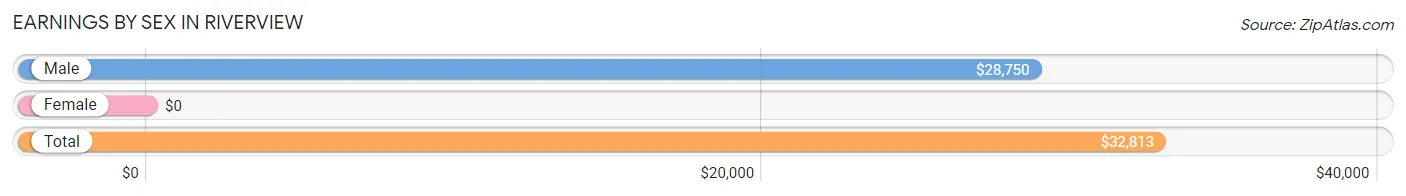
| Sex | Number | Average Earnings |
| Male | 32 (62.7%) | $28,750 |
| Female | 19 (37.2%) | $0 |
| Total | 51 (100.0%) | $32,813 |
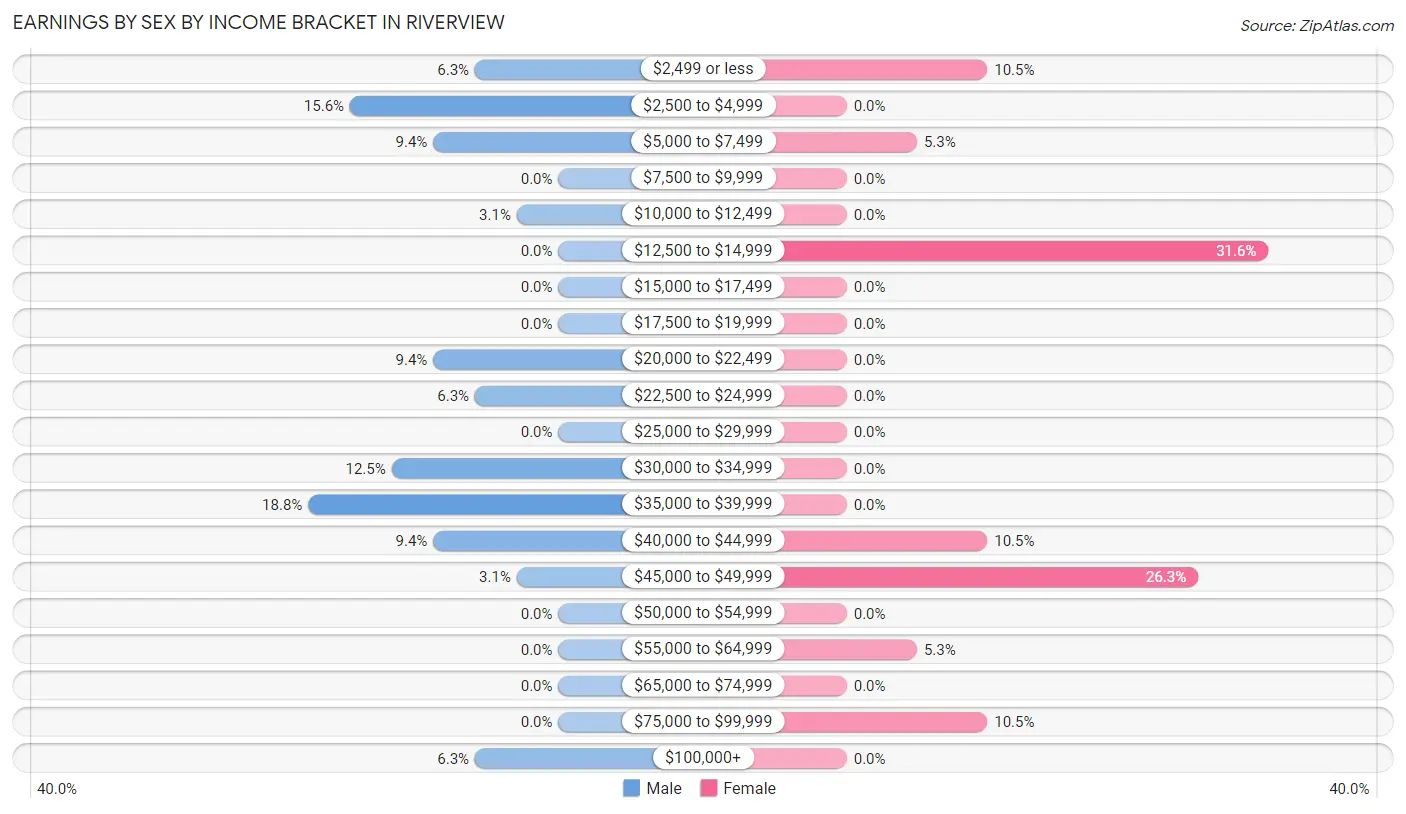
Earnings by Sex by Income Bracket in Riverview
The most common earnings brackets in Riverview are $35,000 to $39,999 for men (6 | 18.8%) and $12,500 to $14,999 for women (6 | 31.6%).
| Income | Male | Female |
| $2,499 or less | 2 (6.2%) | 2 (10.5%) |
| $2,500 to $4,999 | 5 (15.6%) | 0 (0.0%) |
| $5,000 to $7,499 | 3 (9.4%) | 1 (5.3%) |
| $7,500 to $9,999 | 0 (0.0%) | 0 (0.0%) |
| $10,000 to $12,499 | 1 (3.1%) | 0 (0.0%) |
| $12,500 to $14,999 | 0 (0.0%) | 6 (31.6%) |
| $15,000 to $17,499 | 0 (0.0%) | 0 (0.0%) |
| $17,500 to $19,999 | 0 (0.0%) | 0 (0.0%) |
| $20,000 to $22,499 | 3 (9.4%) | 0 (0.0%) |
| $22,500 to $24,999 | 2 (6.2%) | 0 (0.0%) |
| $25,000 to $29,999 | 0 (0.0%) | 0 (0.0%) |
| $30,000 to $34,999 | 4 (12.5%) | 0 (0.0%) |
| $35,000 to $39,999 | 6 (18.8%) | 0 (0.0%) |
| $40,000 to $44,999 | 3 (9.4%) | 2 (10.5%) |
| $45,000 to $49,999 | 1 (3.1%) | 5 (26.3%) |
| $50,000 to $54,999 | 0 (0.0%) | 0 (0.0%) |
| $55,000 to $64,999 | 0 (0.0%) | 1 (5.3%) |
| $65,000 to $74,999 | 0 (0.0%) | 0 (0.0%) |
| $75,000 to $99,999 | 0 (0.0%) | 2 (10.5%) |
| $100,000+ | 2 (6.2%) | 0 (0.0%) |
| Total | 32 (100.0%) | 19 (100.0%) |
Earnings by Sex by Educational Attainment in Riverview
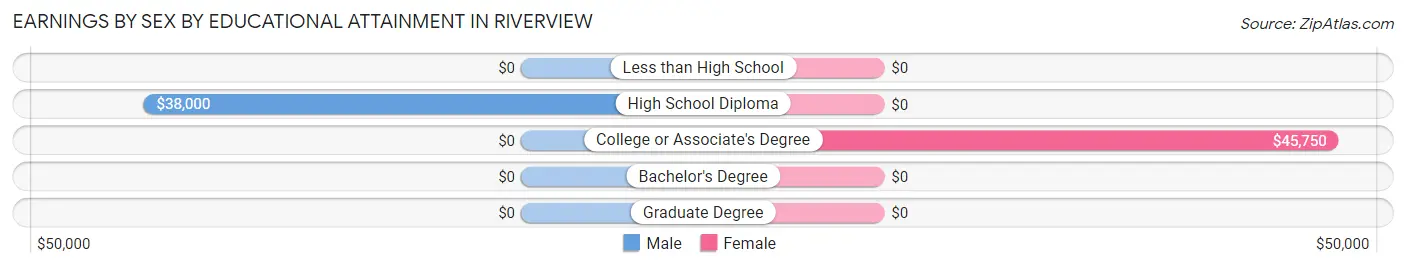
| Educational Attainment | Male Income | Female Income |
| Less than High School | - | - |
| High School Diploma | $38,000 | $0 |
| College or Associate's Degree | - | - |
| Bachelor's Degree | - | - |
| Graduate Degree | - | - |
| Total | $34,688 | $0 |
Family Income in Riverview
Family Income Brackets in Riverview
According to the Riverview family income data, there are 12 families falling into the $25,000 to $34,999 income range, which is the most common income bracket and makes up 38.7% of all families.
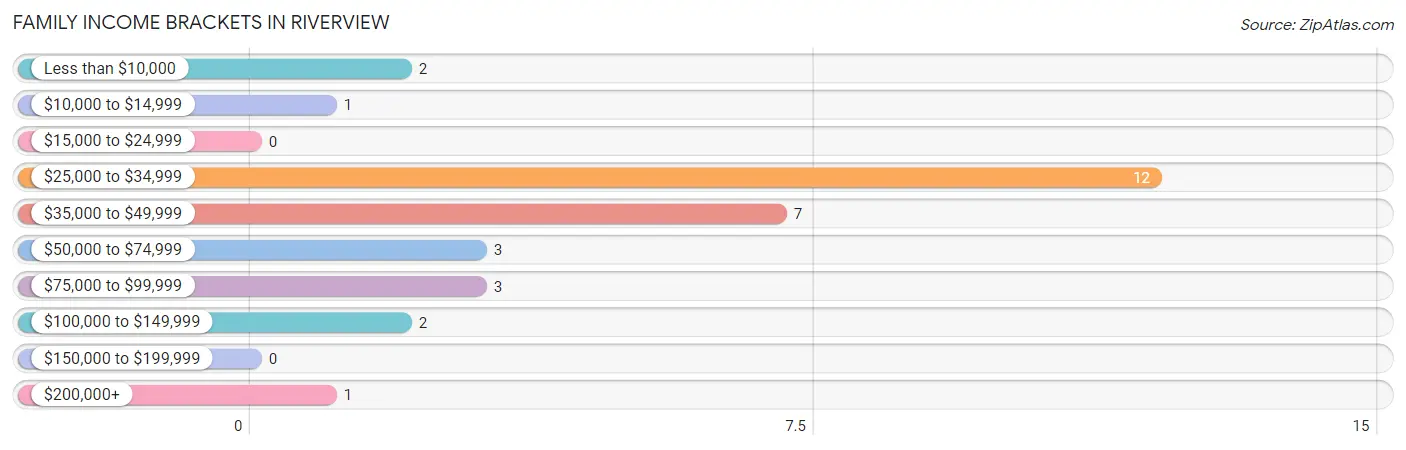
| Income Bracket | # Families | % Families |
| Less than $10,000 | 2 | 6.5% |
| $10,000 to $14,999 | 1 | 3.2% |
| $15,000 to $24,999 | 0 | 0.0% |
| $25,000 to $34,999 | 12 | 38.7% |
| $35,000 to $49,999 | 7 | 22.6% |
| $50,000 to $74,999 | 3 | 9.7% |
| $75,000 to $99,999 | 3 | 9.7% |
| $100,000 to $149,999 | 2 | 6.5% |
| $150,000 to $199,999 | 0 | 0.0% |
| $200,000+ | 1 | 3.2% |
Family Income by Famaliy Size in Riverview
2-person families (12 | 38.7%) account for the highest median family income in Riverview with $39,000 per family, while 2-person families (12 | 38.7%) have the highest median income of $19,500 per family member.
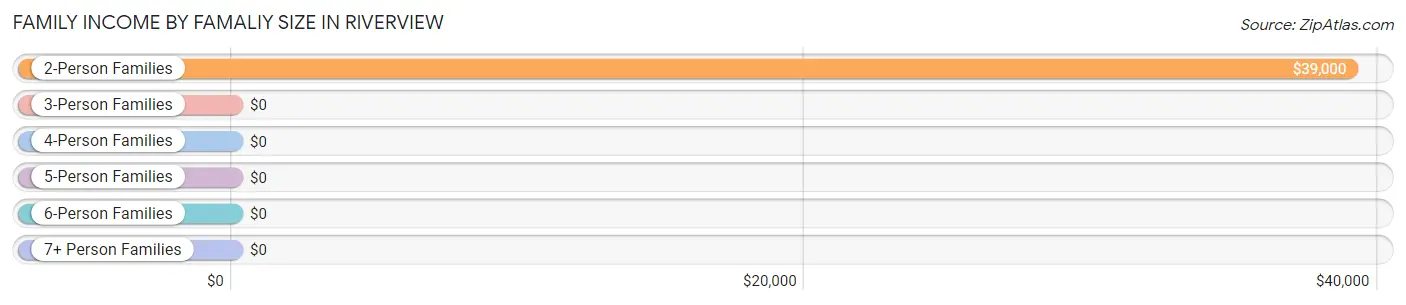
| Income Bracket | # Families | Median Income |
| 2-Person Families | 12 (38.7%) | $39,000 |
| 3-Person Families | 7 (22.6%) | $0 |
| 4-Person Families | 8 (25.8%) | $0 |
| 5-Person Families | 3 (9.7%) | $0 |
| 6-Person Families | 1 (3.2%) | $0 |
| 7+ Person Families | 0 (0.0%) | $0 |
| Total | 31 (100.0%) | $37,750 |
Family Income by Number of Earners in Riverview
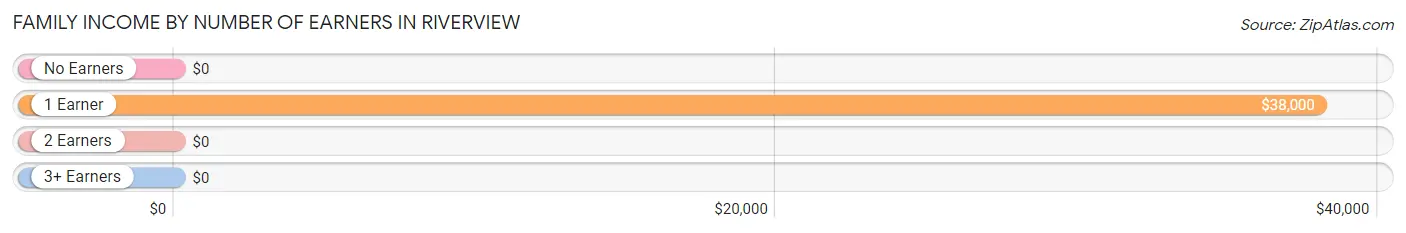
| Number of Earners | # Families | Median Income |
| No Earners | 8 (25.8%) | $0 |
| 1 Earner | 14 (45.2%) | $38,000 |
| 2 Earners | 8 (25.8%) | $0 |
| 3+ Earners | 1 (3.2%) | $0 |
| Total | 31 (100.0%) | $37,750 |
Household Income in Riverview
Household Income Brackets in Riverview
With 13 households falling in the category, the $25,000 to $34,999 income range is the most frequent in Riverview, accounting for 27.1% of all households.
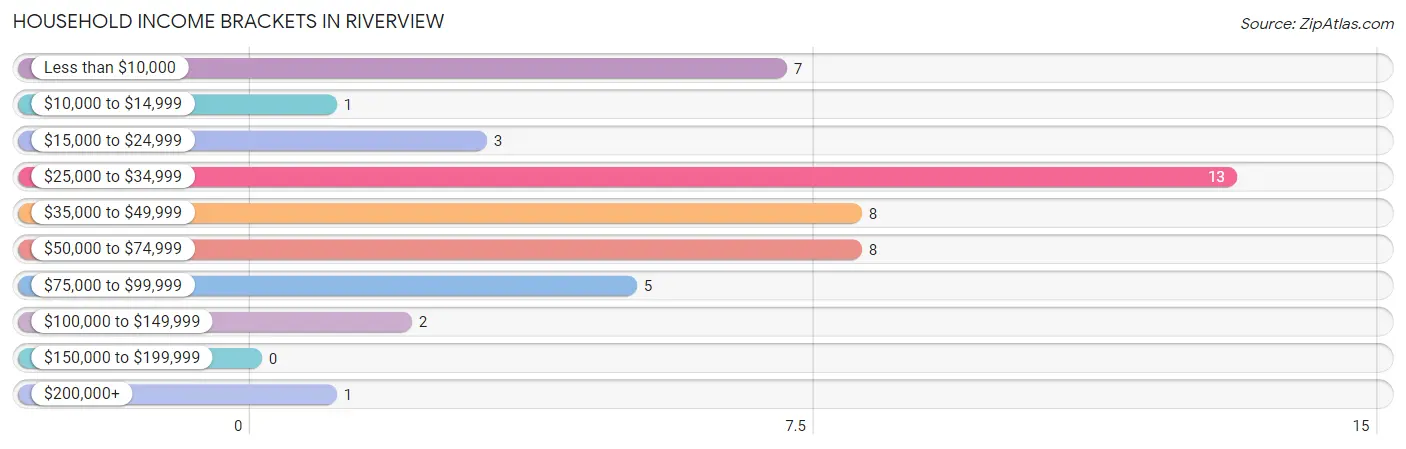
| Income Bracket | # Households | % Households |
| Less than $10,000 | 7 | 14.6% |
| $10,000 to $14,999 | 1 | 2.1% |
| $15,000 to $24,999 | 3 | 6.3% |
| $25,000 to $34,999 | 13 | 27.1% |
| $35,000 to $49,999 | 8 | 16.7% |
| $50,000 to $74,999 | 8 | 16.7% |
| $75,000 to $99,999 | 5 | 10.4% |
| $100,000 to $149,999 | 2 | 4.2% |
| $150,000 to $199,999 | 0 | 0.0% |
| $200,000+ | 1 | 2.1% |
Household Income by Householder Age in Riverview
The median household income in Riverview is $36,250, with the highest median household income of $38,750 found in the 65+ years age bracket for the primary householder. A total of 22 households (45.8%) fall into this category.
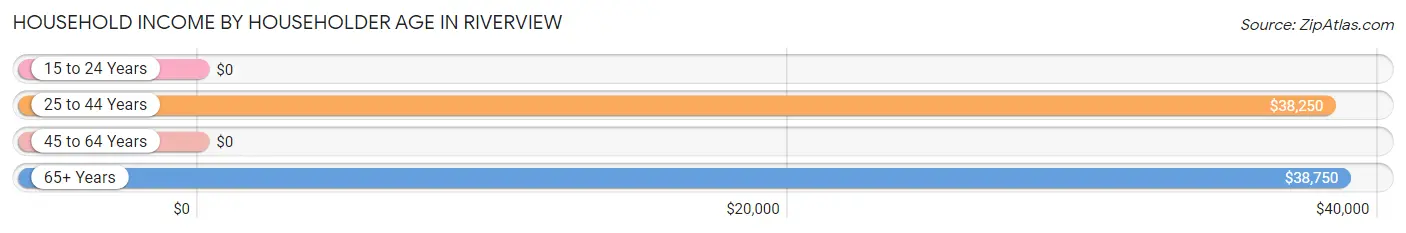
| Income Bracket | # Households | Median Income |
| 15 to 24 Years | 0 (0.0%) | $0 |
| 25 to 44 Years | 13 (27.1%) | $38,250 |
| 45 to 64 Years | 13 (27.1%) | $0 |
| 65+ Years | 22 (45.8%) | $38,750 |
| Total | 48 (100.0%) | $36,250 |
Poverty in Riverview
Income Below Poverty by Sex and Age in Riverview
With 47.1% poverty level for males and 33.3% for females among the residents of Riverview, 55 to 64 year old males and 12 to 14 year old females are the most vulnerable to poverty, with 2 males (100.0%) and 7 females (100.0%) in their respective age groups living below the poverty level.
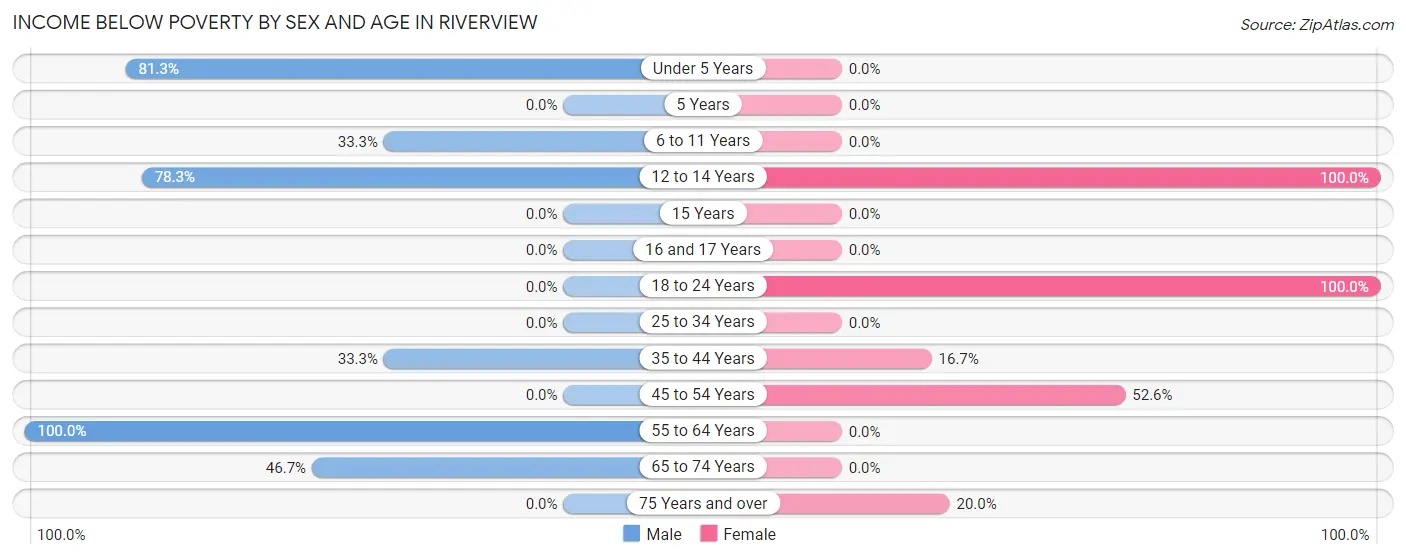
| Age Bracket | Male | Female |
| Under 5 Years | 13 (81.2%) | 0 (0.0%) |
| 5 Years | 0 (0.0%) | 0 (0.0%) |
| 6 to 11 Years | 6 (33.3%) | 0 (0.0%) |
| 12 to 14 Years | 18 (78.3%) | 7 (100.0%) |
| 15 Years | 0 (0.0%) | 0 (0.0%) |
| 16 and 17 Years | 0 (0.0%) | 0 (0.0%) |
| 18 to 24 Years | 0 (0.0%) | 1 (100.0%) |
| 25 to 34 Years | 0 (0.0%) | 0 (0.0%) |
| 35 to 44 Years | 3 (33.3%) | 1 (16.7%) |
| 45 to 54 Years | 0 (0.0%) | 20 (52.6%) |
| 55 to 64 Years | 2 (100.0%) | 0 (0.0%) |
| 65 to 74 Years | 7 (46.7%) | 0 (0.0%) |
| 75 Years and over | 0 (0.0%) | 2 (20.0%) |
| Total | 49 (47.1%) | 31 (33.3%) |
Income Above Poverty by Sex and Age in Riverview
According to the poverty statistics in Riverview, males aged 16 and 17 years and females aged 6 to 11 years are the age groups that are most secure financially, with 100.0% of males and 100.0% of females in these age groups living above the poverty line.
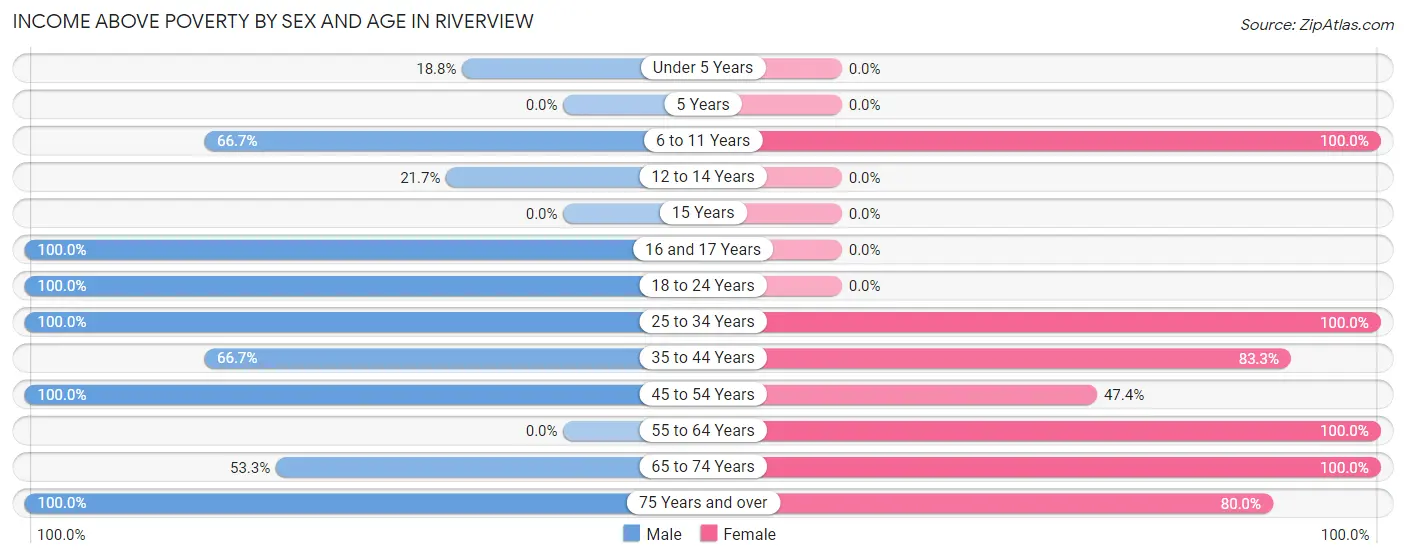
| Age Bracket | Male | Female |
| Under 5 Years | 3 (18.8%) | 0 (0.0%) |
| 5 Years | 0 (0.0%) | 0 (0.0%) |
| 6 to 11 Years | 12 (66.7%) | 10 (100.0%) |
| 12 to 14 Years | 5 (21.7%) | 0 (0.0%) |
| 15 Years | 0 (0.0%) | 0 (0.0%) |
| 16 and 17 Years | 5 (100.0%) | 0 (0.0%) |
| 18 to 24 Years | 4 (100.0%) | 0 (0.0%) |
| 25 to 34 Years | 8 (100.0%) | 4 (100.0%) |
| 35 to 44 Years | 6 (66.7%) | 5 (83.3%) |
| 45 to 54 Years | 1 (100.0%) | 18 (47.4%) |
| 55 to 64 Years | 0 (0.0%) | 1 (100.0%) |
| 65 to 74 Years | 8 (53.3%) | 16 (100.0%) |
| 75 Years and over | 3 (100.0%) | 8 (80.0%) |
| Total | 55 (52.9%) | 62 (66.7%) |
Income Below Poverty Among Married-Couple Families in Riverview
The poverty statistics for married-couple families in Riverview show that 4.5% or 1 of the total 22 families live below the poverty line. Families with 3 or 4 children have the highest poverty rate of 25.0%, comprising of 1 families. On the other hand, families with no children have the lowest poverty rate of 0.0%, which includes 0 families.
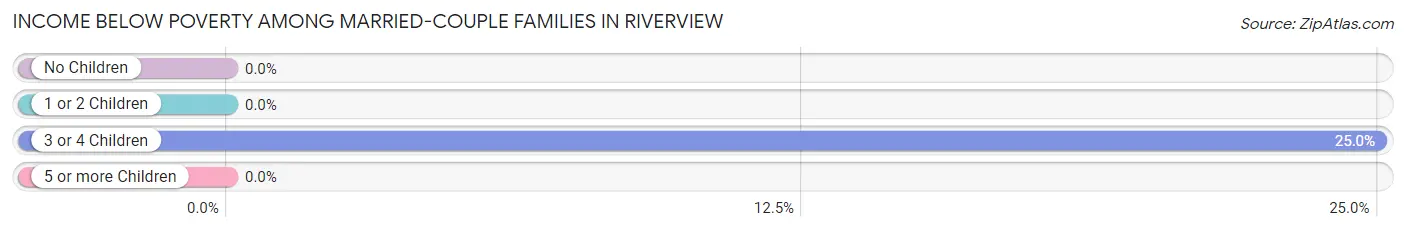
| Children | Above Poverty | Below Poverty |
| No Children | 12 (100.0%) | 0 (0.0%) |
| 1 or 2 Children | 6 (100.0%) | 0 (0.0%) |
| 3 or 4 Children | 3 (75.0%) | 1 (25.0%) |
| 5 or more Children | 0 (0.0%) | 0 (0.0%) |
| Total | 21 (95.5%) | 1 (4.5%) |
Income Below Poverty Among Single-Parent Households in Riverview
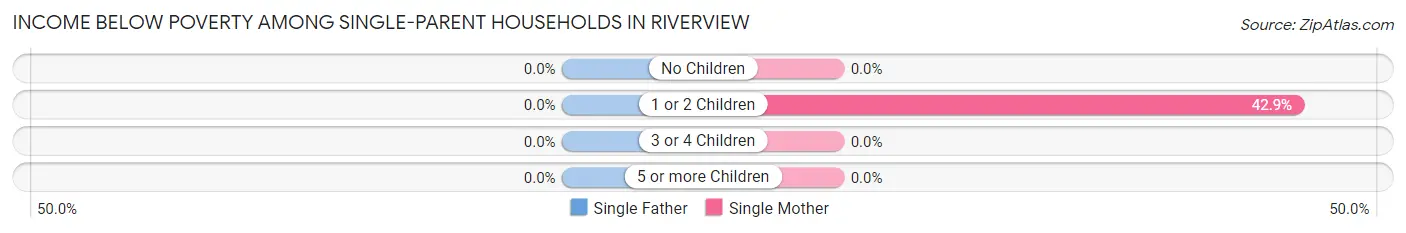
| Children | Single Father | Single Mother |
| No Children | 0 (0.0%) | 0 (0.0%) |
| 1 or 2 Children | 0 (0.0%) | 3 (42.9%) |
| 3 or 4 Children | 0 (0.0%) | 0 (0.0%) |
| 5 or more Children | 0 (0.0%) | 0 (0.0%) |
| Total | 0 (0.0%) | 3 (37.5%) |
Income Below Poverty Among Married-Couple vs Single-Parent Households in Riverview
The poverty data for Riverview shows that 1 of the married-couple family households (4.5%) and 3 of the single-parent households (33.3%) are living below the poverty level. Within the married-couple family households, those with 3 or 4 children have the highest poverty rate, with 1 households (25.0%) falling below the poverty line. Among the single-parent households, those with 1 or 2 children have the highest poverty rate, with 3 household (42.9%) living below poverty.
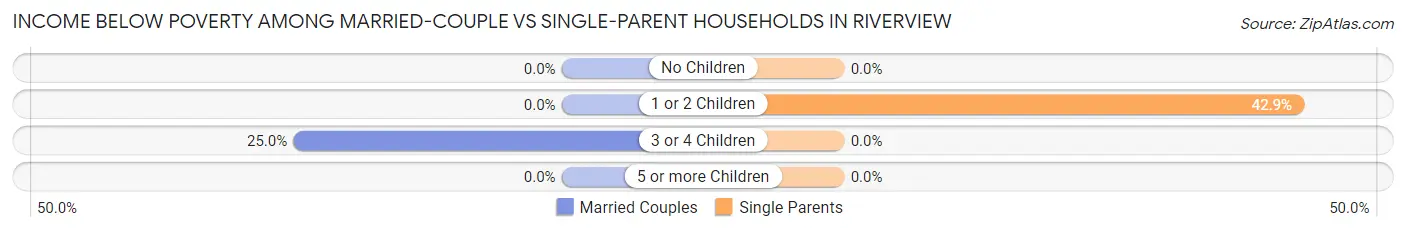
| Children | Married-Couple Families | Single-Parent Households |
| No Children | 0 (0.0%) | 0 (0.0%) |
| 1 or 2 Children | 0 (0.0%) | 3 (42.9%) |
| 3 or 4 Children | 1 (25.0%) | 0 (0.0%) |
| 5 or more Children | 0 (0.0%) | 0 (0.0%) |
| Total | 1 (4.5%) | 3 (33.3%) |
Race in Riverview
The most populous races in Riverview are White / Caucasian (194 | 98.5%), Hispanic or Latino (21 | 10.7%), and Some other Race (3 | 1.5%).
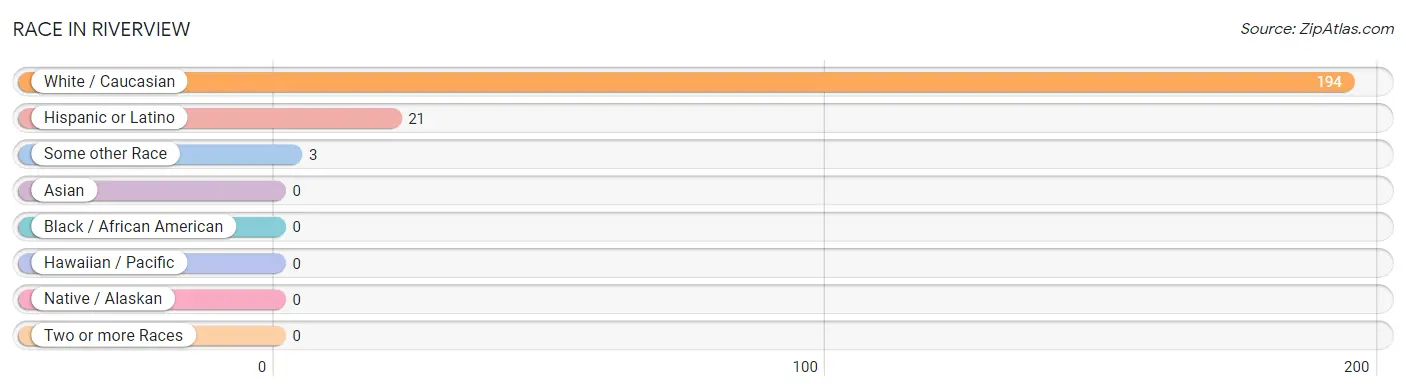
| Race | # Population | % Population |
| Asian | 0 | 0.0% |
| Black / African American | 0 | 0.0% |
| Hawaiian / Pacific | 0 | 0.0% |
| Hispanic or Latino | 21 | 10.7% |
| Native / Alaskan | 0 | 0.0% |
| White / Caucasian | 194 | 98.5% |
| Two or more Races | 0 | 0.0% |
| Some other Race | 3 | 1.5% |
| Total | 197 | 100.0% |
Ancestry in Riverview
The most populous ancestries reported in Riverview are French (47 | 23.9%), American (24 | 12.2%), Mexican (21 | 10.7%), English (11 | 5.6%), and Scandinavian (10 | 5.1%), together accounting for 57.4% of all Riverview residents.
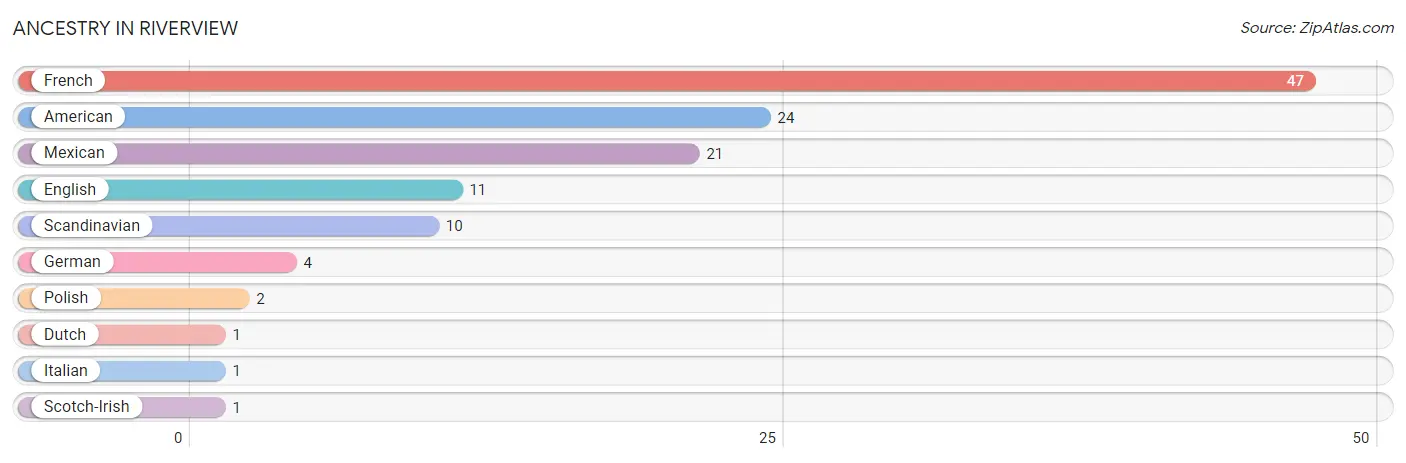
| Ancestry | # Population | % Population |
| American | 24 | 12.2% |
| Dutch | 1 | 0.5% |
| English | 11 | 5.6% |
| French | 47 | 23.9% |
| German | 4 | 2.0% |
| Italian | 1 | 0.5% |
| Mexican | 21 | 10.7% |
| Polish | 2 | 1.0% |
| Scandinavian | 10 | 5.1% |
| Scotch-Irish | 1 | 0.5% | View All 10 Rows |
Immigrants in Riverview
The most numerous immigrant groups reported in Riverview came from Central America (3 | 1.5%), Latin America (3 | 1.5%), and Mexico (3 | 1.5%), together accounting for 4.6% of all Riverview residents.
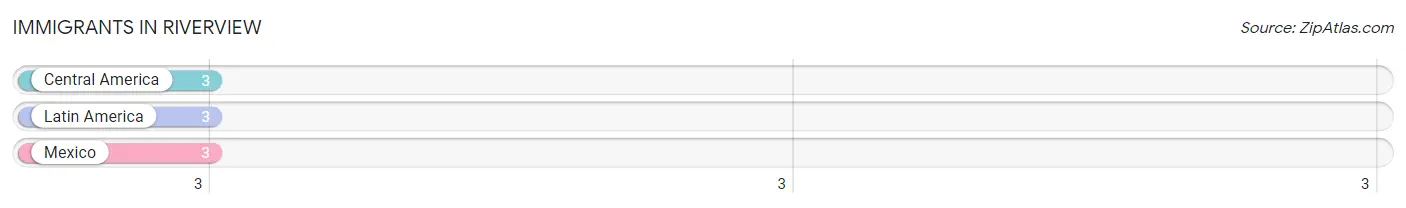
| Immigration Origin | # Population | % Population |
| Central America | 3 | 1.5% |
| Latin America | 3 | 1.5% |
| Mexico | 3 | 1.5% | View All 3 Rows |
Sex and Age in Riverview
Sex and Age in Riverview
The most populous age groups in Riverview are 10 to 14 Years (36 | 34.6%) for men and 45 to 49 Years (35 | 37.6%) for women.
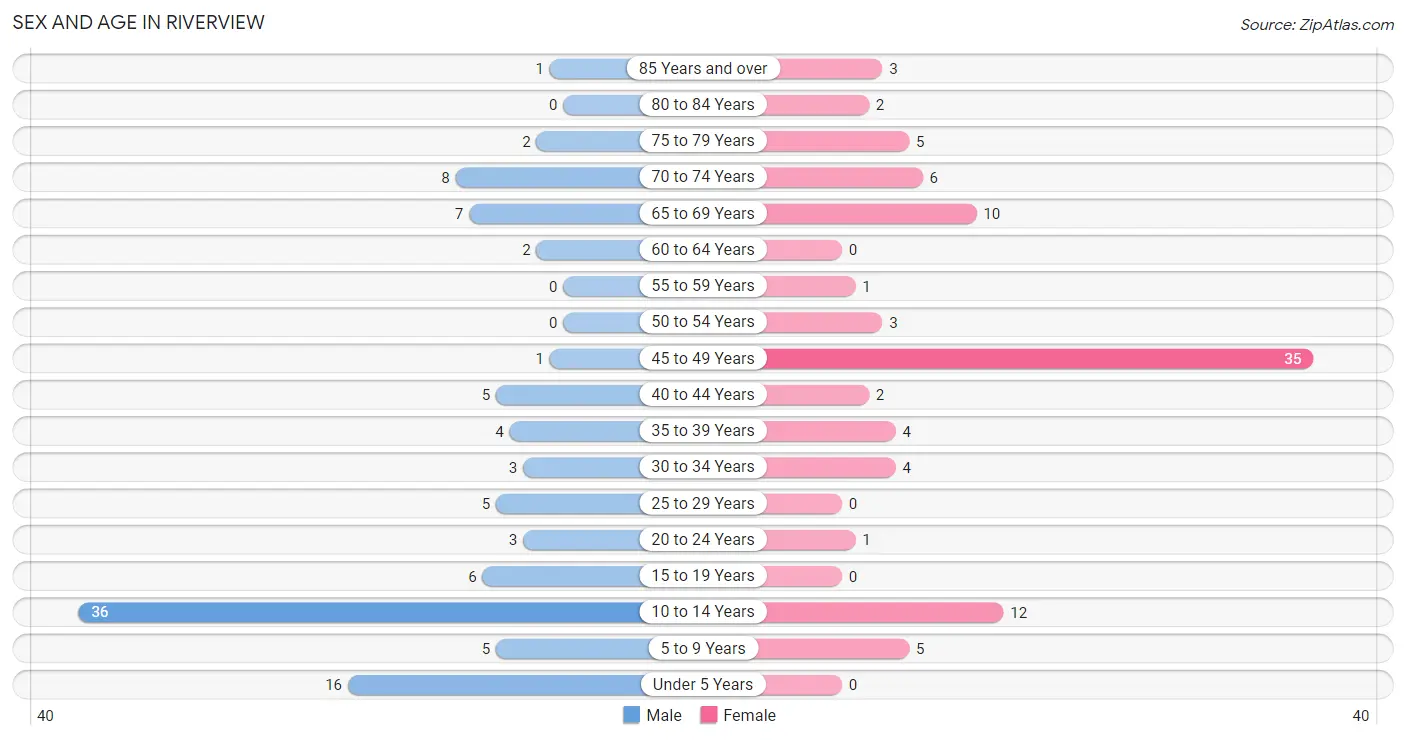
| Age Bracket | Male | Female |
| Under 5 Years | 16 (15.4%) | 0 (0.0%) |
| 5 to 9 Years | 5 (4.8%) | 5 (5.4%) |
| 10 to 14 Years | 36 (34.6%) | 12 (12.9%) |
| 15 to 19 Years | 6 (5.8%) | 0 (0.0%) |
| 20 to 24 Years | 3 (2.9%) | 1 (1.1%) |
| 25 to 29 Years | 5 (4.8%) | 0 (0.0%) |
| 30 to 34 Years | 3 (2.9%) | 4 (4.3%) |
| 35 to 39 Years | 4 (3.8%) | 4 (4.3%) |
| 40 to 44 Years | 5 (4.8%) | 2 (2.1%) |
| 45 to 49 Years | 1 (1.0%) | 35 (37.6%) |
| 50 to 54 Years | 0 (0.0%) | 3 (3.2%) |
| 55 to 59 Years | 0 (0.0%) | 1 (1.1%) |
| 60 to 64 Years | 2 (1.9%) | 0 (0.0%) |
| 65 to 69 Years | 7 (6.7%) | 10 (10.7%) |
| 70 to 74 Years | 8 (7.7%) | 6 (6.5%) |
| 75 to 79 Years | 2 (1.9%) | 5 (5.4%) |
| 80 to 84 Years | 0 (0.0%) | 2 (2.1%) |
| 85 Years and over | 1 (1.0%) | 3 (3.2%) |
| Total | 104 (100.0%) | 93 (100.0%) |
Families and Households in Riverview
Median Family Size in Riverview
The median family size in Riverview is 5.81 persons per family, with single male/father families (1 | 3.2%) accounting for the largest median family size of 10 persons per family. On the other hand, married-couple families (22 | 71.0%) represent the smallest median family size with 4.59 persons per family.
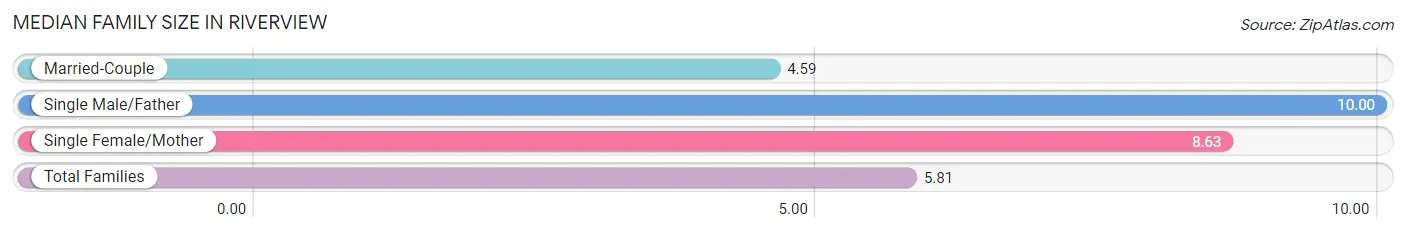
| Family Type | # Families | Family Size |
| Married-Couple | 22 (71.0%) | 4.59 |
| Single Male/Father | 1 (3.2%) | 10.00 |
| Single Female/Mother | 8 (25.8%) | 8.63 |
| Total Families | 31 (100.0%) | 5.81 |
Median Household Size in Riverview
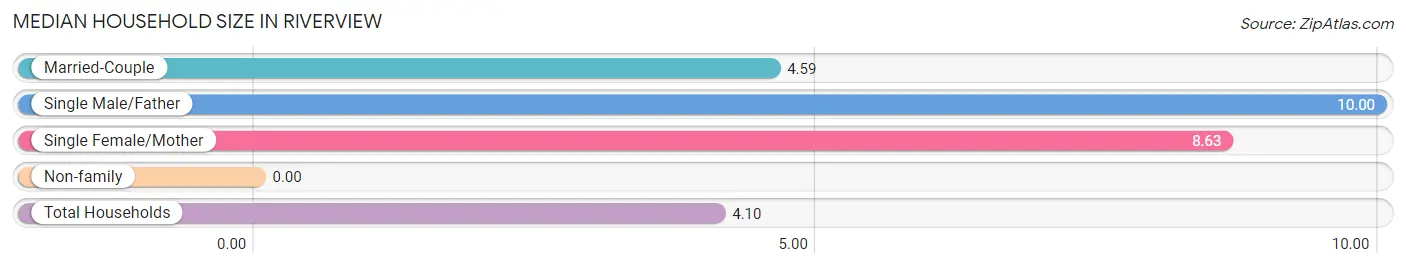
| Household Type | # Households | Household Size |
| Married-Couple | 22 (45.8%) | 4.59 |
| Single Male/Father | 1 (2.1%) | 10.00 |
| Single Female/Mother | 8 (16.7%) | 8.63 |
| Non-family | 17 (35.4%) | - |
| Total Households | 48 (100.0%) | 4.10 |
Household Size by Marriage Status in Riverview
Out of a total of 48 households in Riverview, 31 (64.6%) are family households, while 17 (35.4%) are nonfamily households. The most numerous type of family households are 2-person households, comprising 12, and the most common type of nonfamily households are 1-person households, comprising 17.
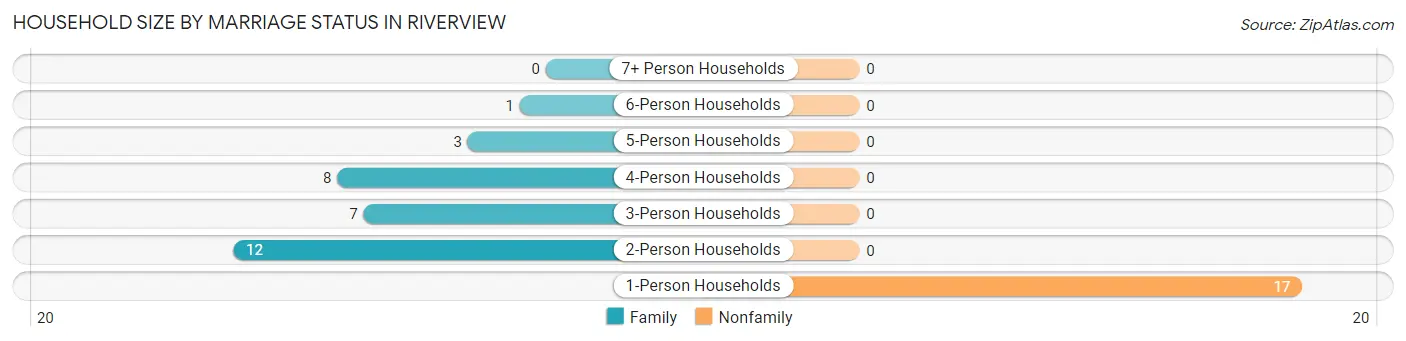
| Household Size | Family Households | Nonfamily Households |
| 1-Person Households | - | 17 (35.4%) |
| 2-Person Households | 12 (25.0%) | 0 (0.0%) |
| 3-Person Households | 7 (14.6%) | 0 (0.0%) |
| 4-Person Households | 8 (16.7%) | 0 (0.0%) |
| 5-Person Households | 3 (6.2%) | 0 (0.0%) |
| 6-Person Households | 1 (2.1%) | 0 (0.0%) |
| 7+ Person Households | 0 (0.0%) | 0 (0.0%) |
| Total | 31 (64.6%) | 17 (35.4%) |
Female Fertility in Riverview
Fertility by Age in Riverview
| Age Bracket | Women with Births | Births / 1,000 Women |
| 15 to 19 years | 0 (0.0%) | 0.0 |
| 20 to 34 years | 0 (0.0%) | 0.0 |
| 35 to 50 years | 0 (0.0%) | 0.0 |
| Total | 0 (0.0%) | 0.0 |
Fertility by Age by Marriage Status in Riverview
| Age Bracket | Married | Unmarried |
| 15 to 19 years | 0 (0.0%) | 0 (0.0%) |
| 20 to 34 years | 0 (0.0%) | 0 (0.0%) |
| 35 to 50 years | 0 (0.0%) | 0 (0.0%) |
| Total | 0 (0.0%) | 0 (0.0%) |
Fertility by Education in Riverview
| Educational Attainment | Women with Births | Births / 1,000 Women |
| Less than High School | 0 (0.0%) | 0.0 |
| High School Diploma | 0 (0.0%) | 0.0 |
| College or Associate's Degree | 0 (0.0%) | 0.0 |
| Bachelor's Degree | 0 (0.0%) | 0.0 |
| Graduate Degree | 0 (0.0%) | 0.0 |
| Total | 0 (0.0%) | 0.0 |
Fertility by Education by Marriage Status in Riverview
| Educational Attainment | Married | Unmarried |
| Less than High School | 0 (0.0%) | 0 (0.0%) |
| High School Diploma | 0 (0.0%) | 0 (0.0%) |
| College or Associate's Degree | 0 (0.0%) | 0 (0.0%) |
| Bachelor's Degree | 0 (0.0%) | 0 (0.0%) |
| Graduate Degree | 0 (0.0%) | 0 (0.0%) |
| Total | 0 (0.0%) | 0 (0.0%) |
Employment Characteristics in Riverview
Employment by Class of Employer in Riverview
Among the 49 employed individuals in Riverview, private company employees (23 | 46.9%), local government employees (15 | 30.6%), and not-for-profit organizations (4 | 8.2%) make up the most common classes of employment.
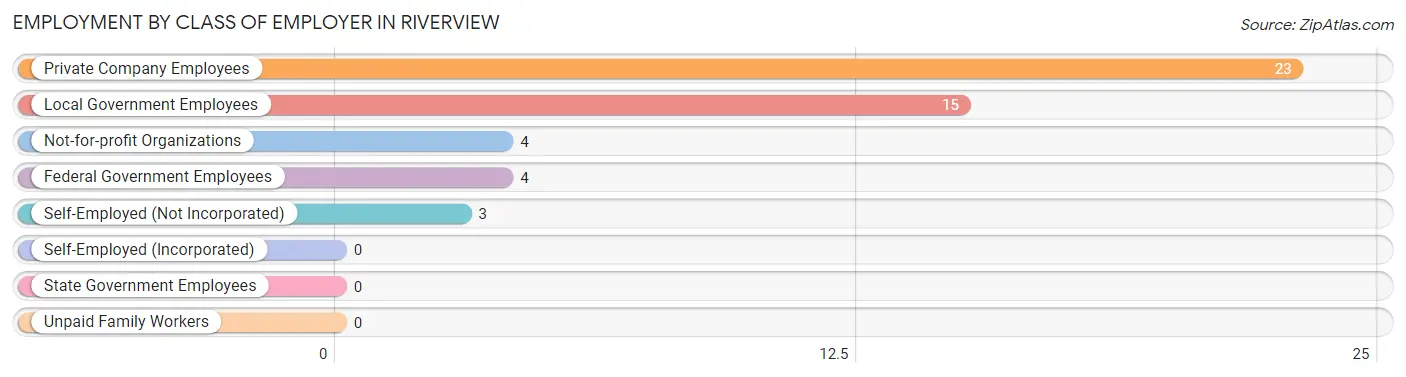
| Employer Class | # Employees | % Employees |
| Private Company Employees | 23 | 46.9% |
| Self-Employed (Incorporated) | 0 | 0.0% |
| Self-Employed (Not Incorporated) | 3 | 6.1% |
| Not-for-profit Organizations | 4 | 8.2% |
| Local Government Employees | 15 | 30.6% |
| State Government Employees | 0 | 0.0% |
| Federal Government Employees | 4 | 8.2% |
| Unpaid Family Workers | 0 | 0.0% |
| Total | 49 | 100.0% |
Employment Status by Age in Riverview
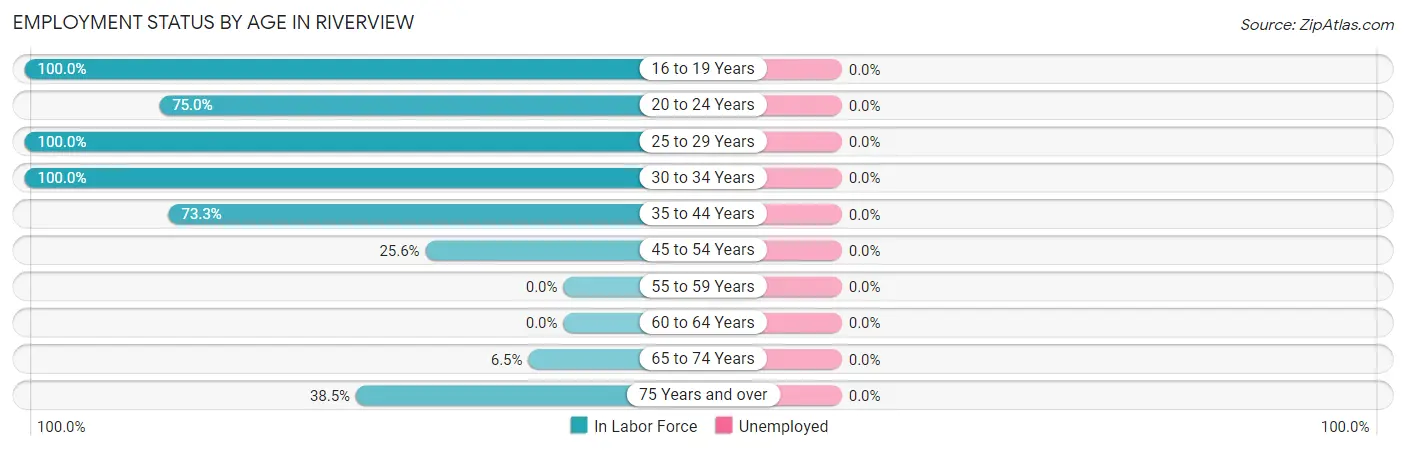
| Age Bracket | In Labor Force | Unemployed |
| 16 to 19 Years | 6 (100.0%) | 0 (0.0%) |
| 20 to 24 Years | 3 (75.0%) | 0 (0.0%) |
| 25 to 29 Years | 5 (100.0%) | 0 (0.0%) |
| 30 to 34 Years | 7 (100.0%) | 0 (0.0%) |
| 35 to 44 Years | 11 (73.3%) | 0 (0.0%) |
| 45 to 54 Years | 10 (25.6%) | 0 (0.0%) |
| 55 to 59 Years | 0 (0.0%) | 0 (0.0%) |
| 60 to 64 Years | 0 (0.0%) | 0 (0.0%) |
| 65 to 74 Years | 2 (6.5%) | 0 (0.0%) |
| 75 Years and over | 5 (38.5%) | 0 (0.0%) |
| Total | 49 (39.8%) | 0 (0.0%) |
Employment Status by Educational Attainment in Riverview
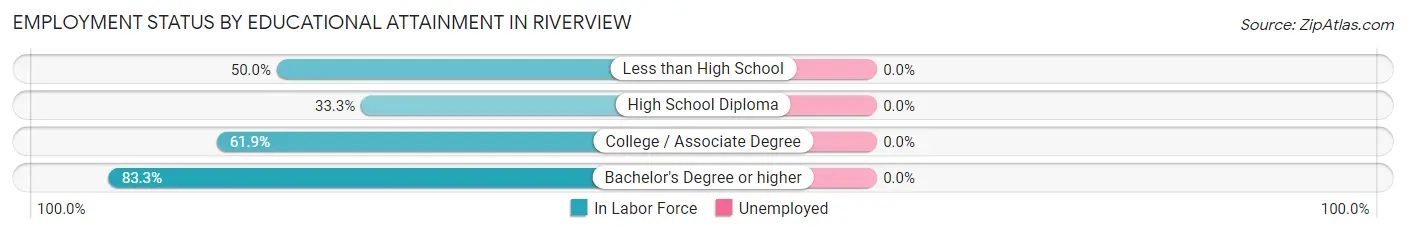
| Educational Attainment | In Labor Force | Unemployed |
| Less than High School | 3 (50.0%) | 0 (0.0%) |
| High School Diploma | 12 (33.3%) | 0 (0.0%) |
| College / Associate Degree | 13 (61.9%) | 0 (0.0%) |
| Bachelor's Degree or higher | 5 (83.3%) | 0 (0.0%) |
| Total | 33 (47.8%) | 0 (0.0%) |
Employment Occupations by Sex in Riverview
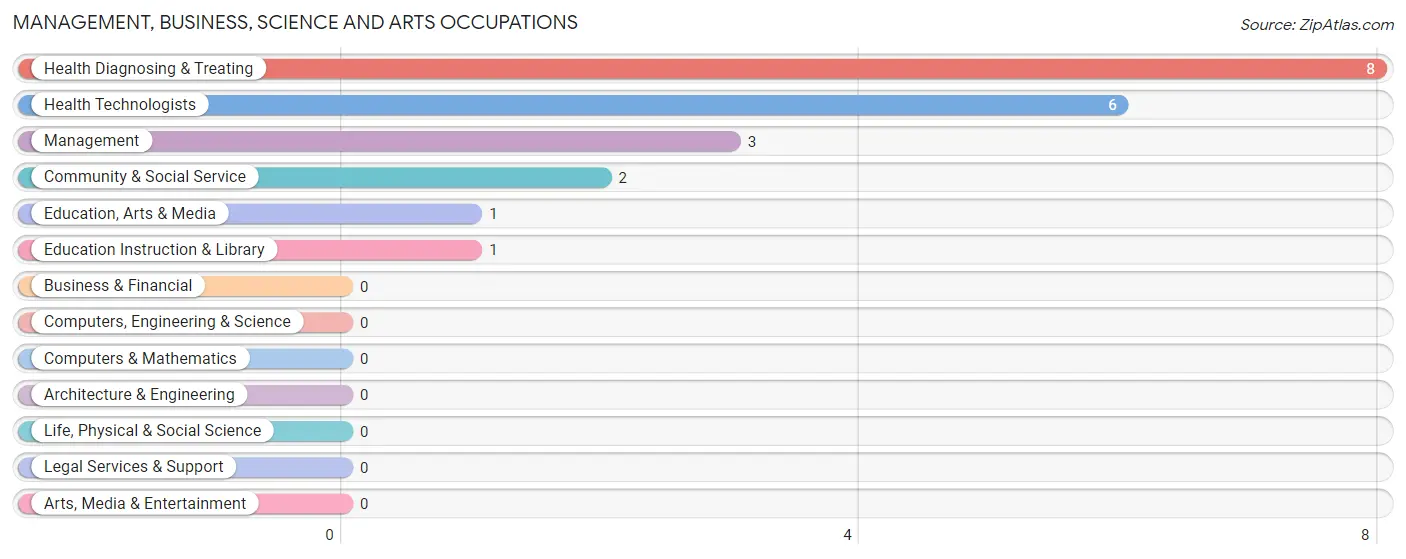
Management, Business, Science and Arts Occupations
The most common Management, Business, Science and Arts occupations in Riverview are Health Diagnosing & Treating (8 | 16.3%), Health Technologists (6 | 12.2%), Management (3 | 6.1%), Community & Social Service (2 | 4.1%), and Education, Arts & Media (1 | 2.0%).
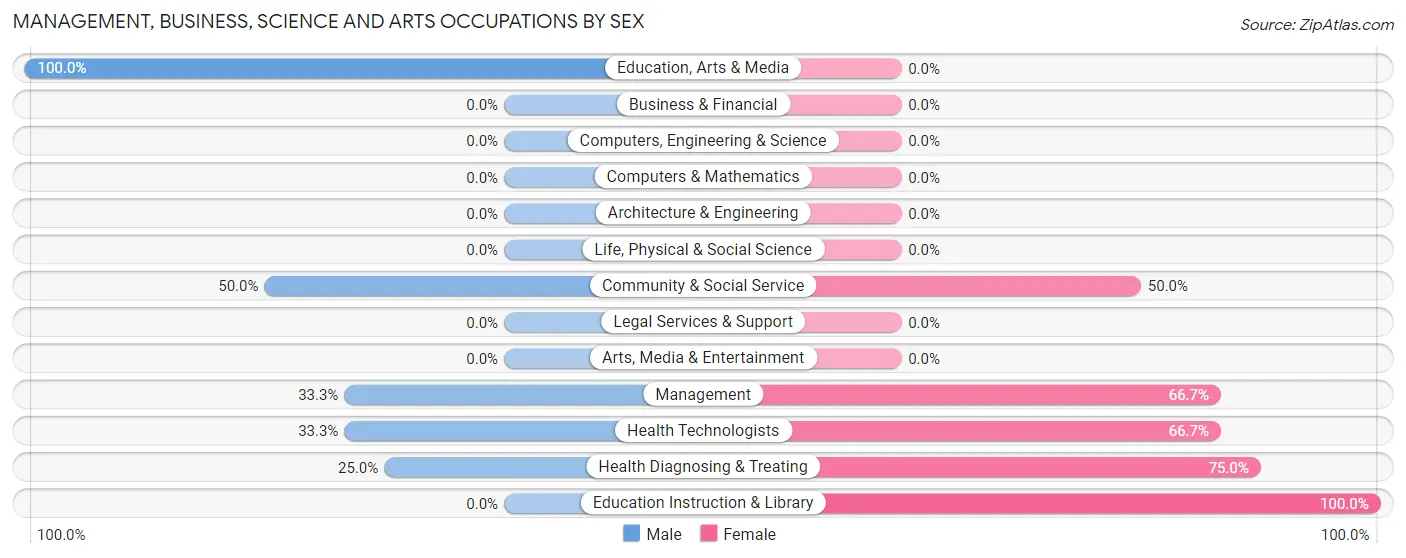
Management, Business, Science and Arts Occupations by Sex
Within the Management, Business, Science and Arts occupations in Riverview, the most male-oriented occupations are Education, Arts & Media (100.0%), Community & Social Service (50.0%), and Management (33.3%), while the most female-oriented occupations are Education Instruction & Library (100.0%), Health Diagnosing & Treating (75.0%), and Management (66.7%).
| Occupation | Male | Female |
| Management | 1 (33.3%) | 2 (66.7%) |
| Business & Financial | 0 (0.0%) | 0 (0.0%) |
| Computers, Engineering & Science | 0 (0.0%) | 0 (0.0%) |
| Computers & Mathematics | 0 (0.0%) | 0 (0.0%) |
| Architecture & Engineering | 0 (0.0%) | 0 (0.0%) |
| Life, Physical & Social Science | 0 (0.0%) | 0 (0.0%) |
| Community & Social Service | 1 (50.0%) | 1 (50.0%) |
| Education, Arts & Media | 1 (100.0%) | 0 (0.0%) |
| Legal Services & Support | 0 (0.0%) | 0 (0.0%) |
| Education Instruction & Library | 0 (0.0%) | 1 (100.0%) |
| Arts, Media & Entertainment | 0 (0.0%) | 0 (0.0%) |
| Health Diagnosing & Treating | 2 (25.0%) | 6 (75.0%) |
| Health Technologists | 2 (33.3%) | 4 (66.7%) |
| Total (Category) | 4 (30.8%) | 9 (69.2%) |
| Total (Overall) | 30 (61.2%) | 19 (38.8%) |
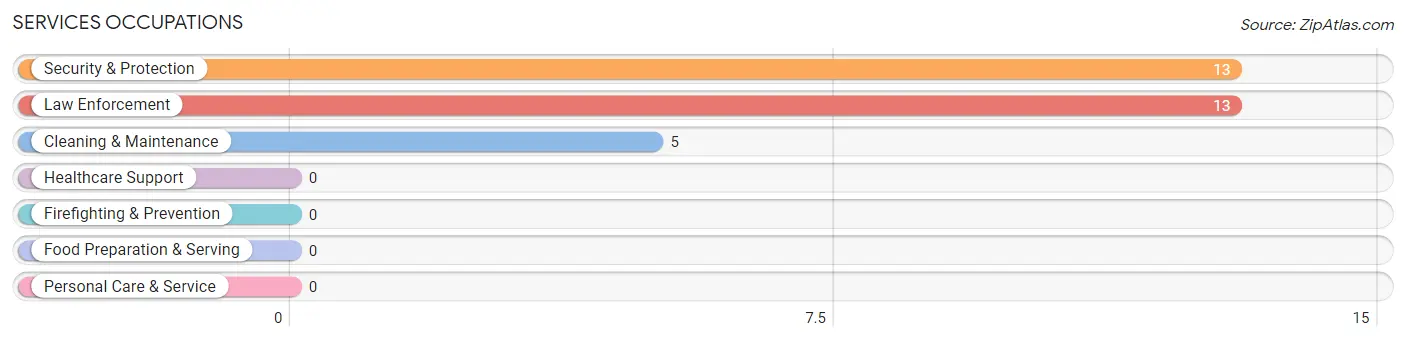
Services Occupations
The most common Services occupations in Riverview are Security & Protection (13 | 26.5%), Law Enforcement (13 | 26.5%), and Cleaning & Maintenance (5 | 10.2%).
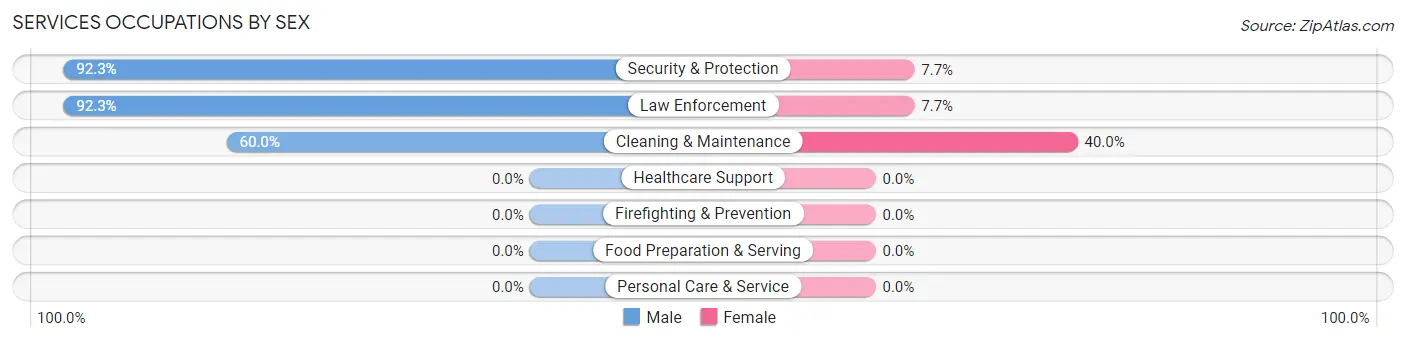
Services Occupations by Sex
Within the Services occupations in Riverview, the most male-oriented occupations are Security & Protection (92.3%), Law Enforcement (92.3%), and Cleaning & Maintenance (60.0%), while the most female-oriented occupations are Cleaning & Maintenance (40.0%), Security & Protection (7.7%), and Law Enforcement (7.7%).
| Occupation | Male | Female |
| Healthcare Support | 0 (0.0%) | 0 (0.0%) |
| Security & Protection | 12 (92.3%) | 1 (7.7%) |
| Firefighting & Prevention | 0 (0.0%) | 0 (0.0%) |
| Law Enforcement | 12 (92.3%) | 1 (7.7%) |
| Food Preparation & Serving | 0 (0.0%) | 0 (0.0%) |
| Cleaning & Maintenance | 3 (60.0%) | 2 (40.0%) |
| Personal Care & Service | 0 (0.0%) | 0 (0.0%) |
| Total (Category) | 15 (83.3%) | 3 (16.7%) |
| Total (Overall) | 30 (61.2%) | 19 (38.8%) |
Sales and Office Occupations
The most common Sales and Office occupations in Riverview are Sales & Related (9 | 18.4%), and Office & Administration (2 | 4.1%).
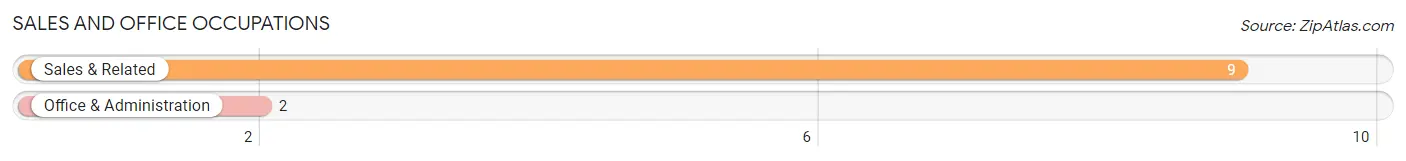
Sales and Office Occupations by Sex

| Occupation | Male | Female |
| Sales & Related | 8 (88.9%) | 1 (11.1%) |
| Office & Administration | 0 (0.0%) | 2 (100.0%) |
| Total (Category) | 8 (72.7%) | 3 (27.3%) |
| Total (Overall) | 30 (61.2%) | 19 (38.8%) |
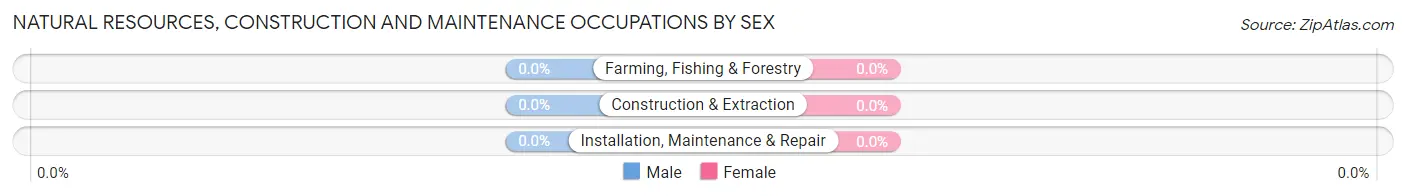
Natural Resources, Construction and Maintenance Occupations

Natural Resources, Construction and Maintenance Occupations by Sex
| Occupation | Male | Female |
| Farming, Fishing & Forestry | 0 (0.0%) | 0 (0.0%) |
| Construction & Extraction | 0 (0.0%) | 0 (0.0%) |
| Installation, Maintenance & Repair | 0 (0.0%) | 0 (0.0%) |
| Total (Category) | 0 (0.0%) | 0 (0.0%) |
| Total (Overall) | 30 (61.2%) | 19 (38.8%) |
Production, Transportation and Moving Occupations
The most common Production, Transportation and Moving occupations in Riverview are , and Production (7 | 14.3%).
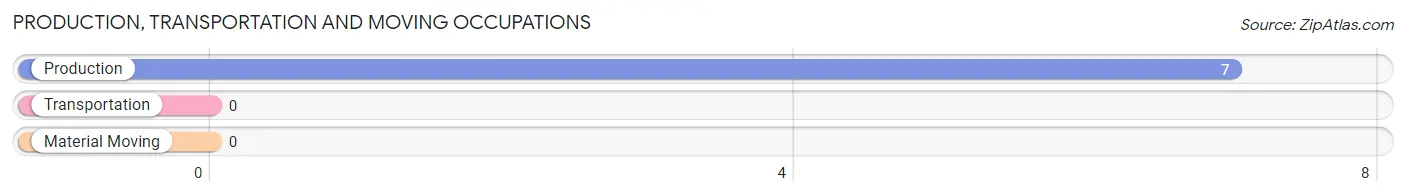
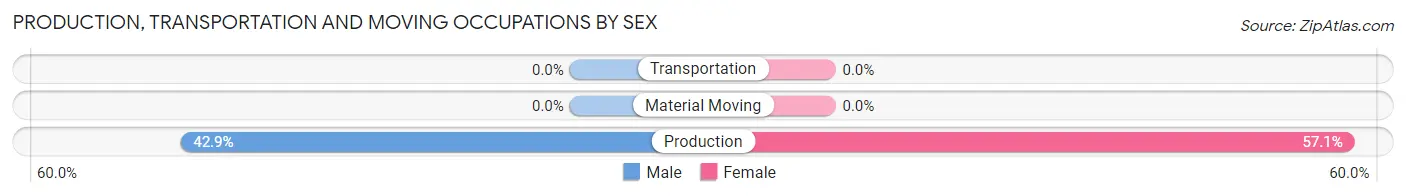
Production, Transportation and Moving Occupations by Sex
| Occupation | Male | Female |
| Production | 3 (42.9%) | 4 (57.1%) |
| Transportation | 0 (0.0%) | 0 (0.0%) |
| Material Moving | 0 (0.0%) | 0 (0.0%) |
| Total (Category) | 3 (42.9%) | 4 (57.1%) |
| Total (Overall) | 30 (61.2%) | 19 (38.8%) |
Employment Industries by Sex in Riverview
Employment Industries in Riverview
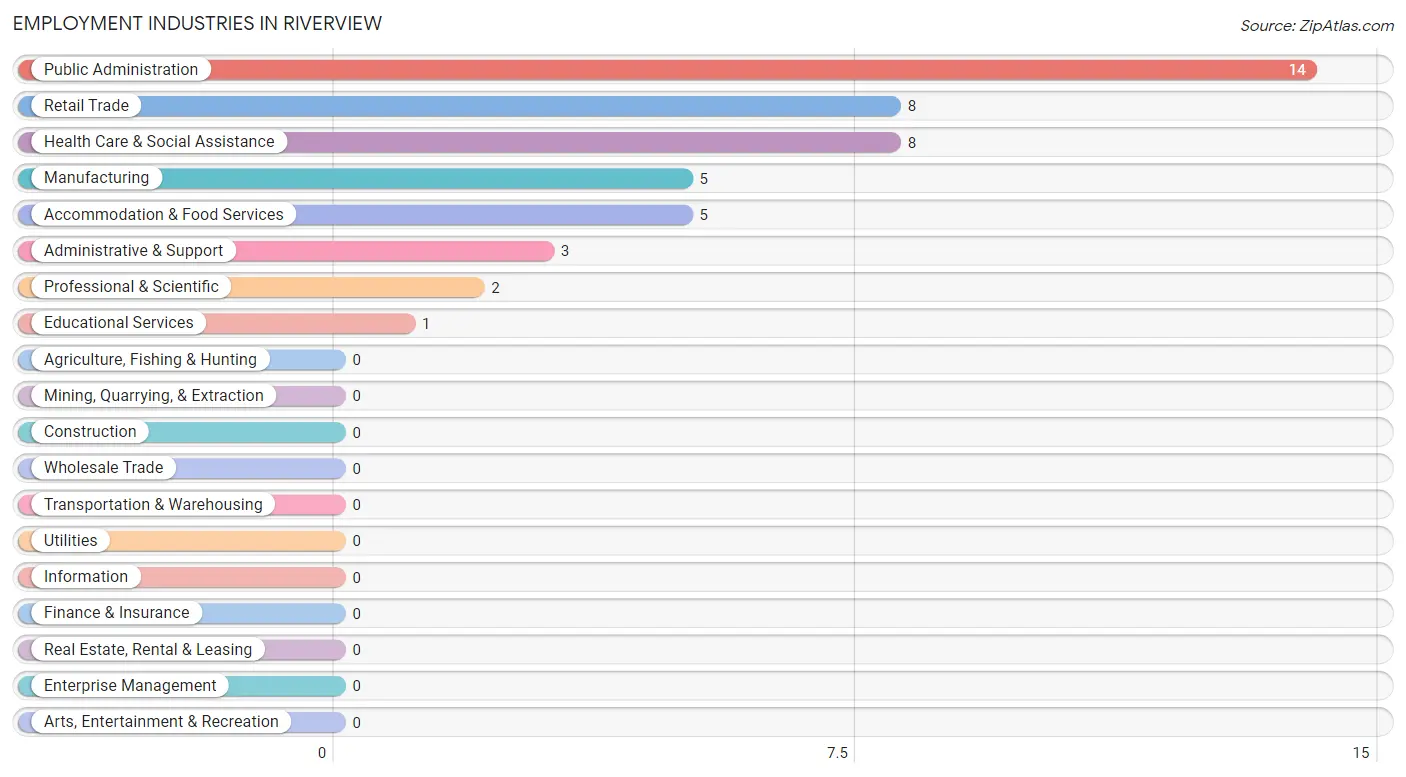
The major employment industries in Riverview include Public Administration (14 | 28.6%), Retail Trade (8 | 16.3%), Health Care & Social Assistance (8 | 16.3%), Manufacturing (5 | 10.2%), and Accommodation & Food Services (5 | 10.2%).
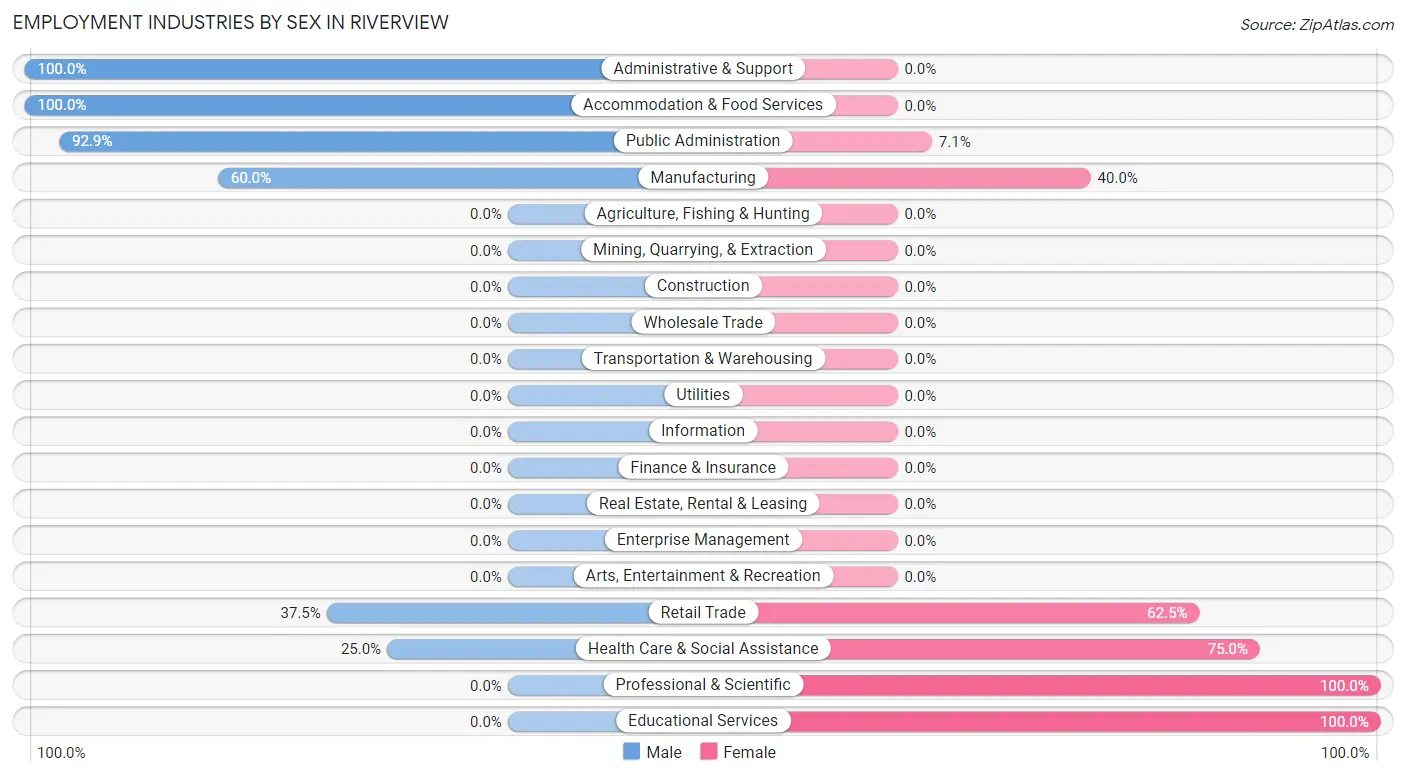
Employment Industries by Sex in Riverview
The Riverview industries that see more men than women are Administrative & Support (100.0%), Accommodation & Food Services (100.0%), and Public Administration (92.9%), whereas the industries that tend to have a higher number of women are Professional & Scientific (100.0%), Educational Services (100.0%), and Health Care & Social Assistance (75.0%).
| Industry | Male | Female |
| Agriculture, Fishing & Hunting | 0 (0.0%) | 0 (0.0%) |
| Mining, Quarrying, & Extraction | 0 (0.0%) | 0 (0.0%) |
| Construction | 0 (0.0%) | 0 (0.0%) |
| Manufacturing | 3 (60.0%) | 2 (40.0%) |
| Wholesale Trade | 0 (0.0%) | 0 (0.0%) |
| Retail Trade | 3 (37.5%) | 5 (62.5%) |
| Transportation & Warehousing | 0 (0.0%) | 0 (0.0%) |
| Utilities | 0 (0.0%) | 0 (0.0%) |
| Information | 0 (0.0%) | 0 (0.0%) |
| Finance & Insurance | 0 (0.0%) | 0 (0.0%) |
| Real Estate, Rental & Leasing | 0 (0.0%) | 0 (0.0%) |
| Professional & Scientific | 0 (0.0%) | 2 (100.0%) |
| Enterprise Management | 0 (0.0%) | 0 (0.0%) |
| Administrative & Support | 3 (100.0%) | 0 (0.0%) |
| Educational Services | 0 (0.0%) | 1 (100.0%) |
| Health Care & Social Assistance | 2 (25.0%) | 6 (75.0%) |
| Arts, Entertainment & Recreation | 0 (0.0%) | 0 (0.0%) |
| Accommodation & Food Services | 5 (100.0%) | 0 (0.0%) |
| Public Administration | 13 (92.9%) | 1 (7.1%) |
| Total | 30 (61.2%) | 19 (38.8%) |
Education in Riverview
School Enrollment in Riverview
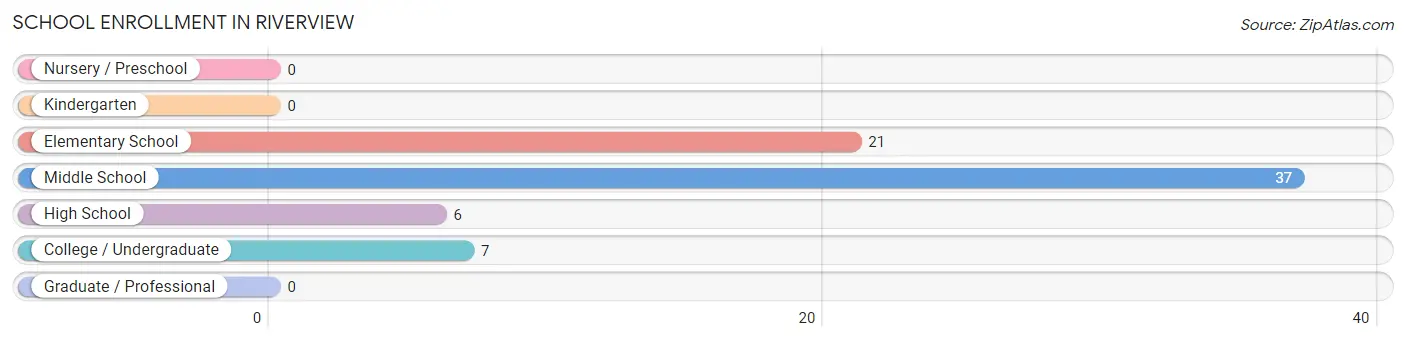
The most common levels of schooling among the 71 students in Riverview are middle school (37 | 52.1%), elementary school (21 | 29.6%), and college / undergraduate (7 | 9.9%).
| School Level | # Students | % Students |
| Nursery / Preschool | 0 | 0.0% |
| Kindergarten | 0 | 0.0% |
| Elementary School | 21 | 29.6% |
| Middle School | 37 | 52.1% |
| High School | 6 | 8.5% |
| College / Undergraduate | 7 | 9.9% |
| Graduate / Professional | 0 | 0.0% |
| Total | 71 | 100.0% |
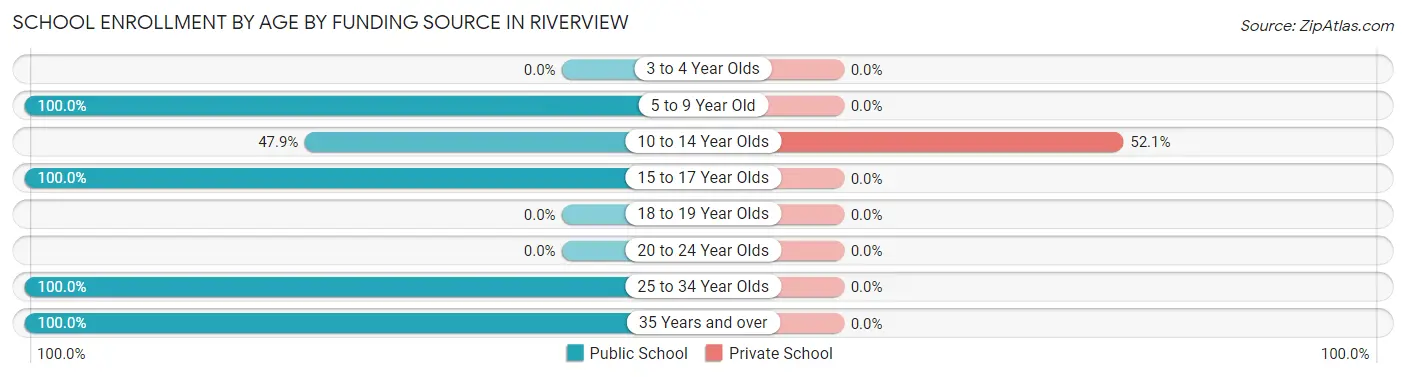
School Enrollment by Age by Funding Source in Riverview
Out of a total of 71 students who are enrolled in schools in Riverview, 25 (35.2%) attend a private institution, while the remaining 46 (64.8%) are enrolled in public schools. The age group of 10 to 14 year olds has the highest likelihood of being enrolled in private schools, with 25 (52.1% in the age bracket) enrolled. Conversely, the age group of 5 to 9 year old has the lowest likelihood of being enrolled in a private school, with 10 (100.0% in the age bracket) attending a public institution.
| Age Bracket | Public School | Private School |
| 3 to 4 Year Olds | 0 (0.0%) | 0 (0.0%) |
| 5 to 9 Year Old | 10 (100.0%) | 0 (0.0%) |
| 10 to 14 Year Olds | 23 (47.9%) | 25 (52.1%) |
| 15 to 17 Year Olds | 5 (100.0%) | 0 (0.0%) |
| 18 to 19 Year Olds | 0 (0.0%) | 0 (0.0%) |
| 20 to 24 Year Olds | 0 (0.0%) | 0 (0.0%) |
| 25 to 34 Year Olds | 7 (100.0%) | 0 (0.0%) |
| 35 Years and over | 1 (100.0%) | 0 (0.0%) |
| Total | 46 (64.8%) | 25 (35.2%) |
Educational Attainment by Field of Study in Riverview
Education (4 | 25.0%), arts & humanities (4 | 25.0%), science & technology (3 | 18.8%), psychology (2 | 12.5%), and liberal arts & history (2 | 12.5%) are the most common fields of study among 16 individuals in Riverview who have obtained a bachelor's degree or higher.
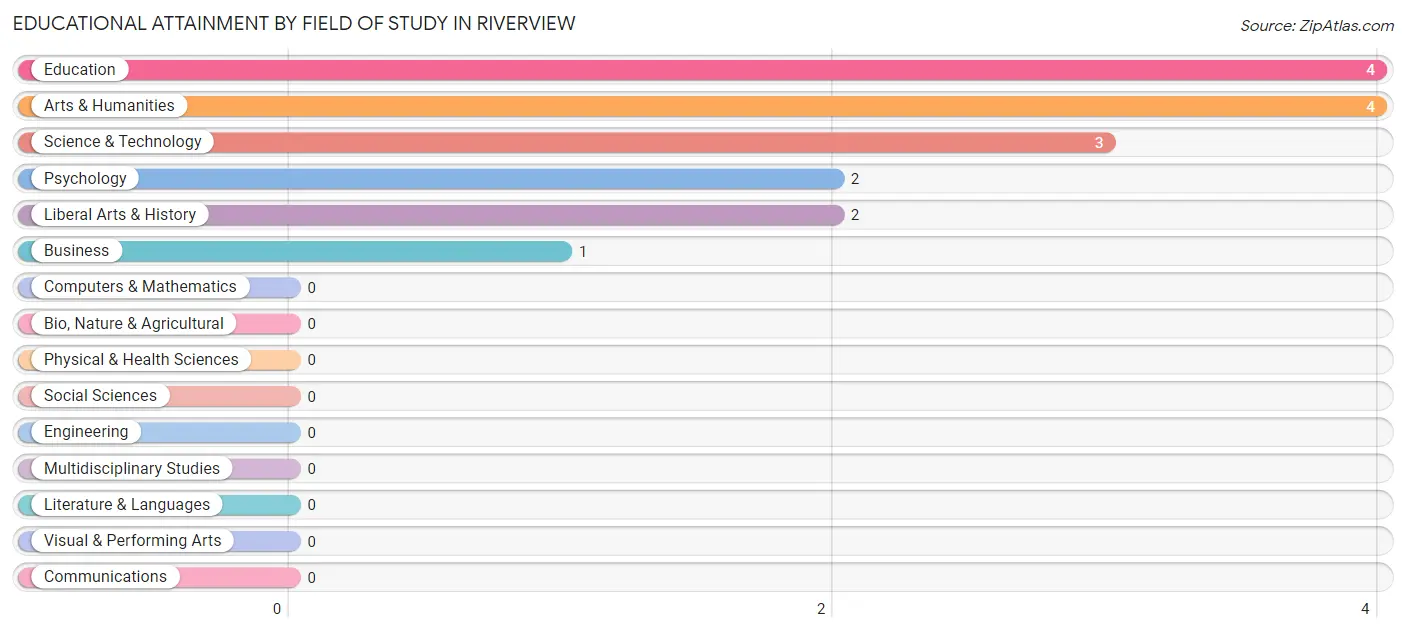
| Field of Study | # Graduates | % Graduates |
| Computers & Mathematics | 0 | 0.0% |
| Bio, Nature & Agricultural | 0 | 0.0% |
| Physical & Health Sciences | 0 | 0.0% |
| Psychology | 2 | 12.5% |
| Social Sciences | 0 | 0.0% |
| Engineering | 0 | 0.0% |
| Multidisciplinary Studies | 0 | 0.0% |
| Science & Technology | 3 | 18.8% |
| Business | 1 | 6.2% |
| Education | 4 | 25.0% |
| Literature & Languages | 0 | 0.0% |
| Liberal Arts & History | 2 | 12.5% |
| Visual & Performing Arts | 0 | 0.0% |
| Communications | 0 | 0.0% |
| Arts & Humanities | 4 | 25.0% |
| Total | 16 | 100.0% |
Transportation & Commute in Riverview
Vehicle Availability by Sex in Riverview
The most prevalent vehicle ownership categories in Riverview are males with 2 vehicles (21, accounting for 70.0%) and females with 2 vehicles (8, making up 110.5%).
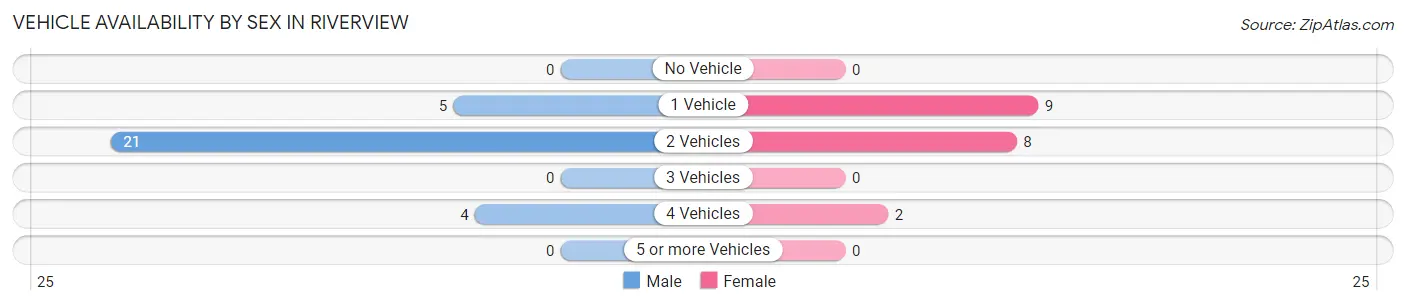
| Vehicles Available | Male | Female |
| No Vehicle | 0 (0.0%) | 0 (0.0%) |
| 1 Vehicle | 5 (16.7%) | 9 (47.4%) |
| 2 Vehicles | 21 (70.0%) | 8 (42.1%) |
| 3 Vehicles | 0 (0.0%) | 0 (0.0%) |
| 4 Vehicles | 4 (13.3%) | 2 (10.5%) |
| 5 or more Vehicles | 0 (0.0%) | 0 (0.0%) |
| Total | 30 (100.0%) | 19 (100.0%) |
Commute Time in Riverview
The most frequently occuring commute durations in Riverview are 10 to 14 minutes (13 commuters, 30.9%), 30 to 34 minutes (12 commuters, 28.6%), and 45 to 59 minutes (6 commuters, 14.3%).
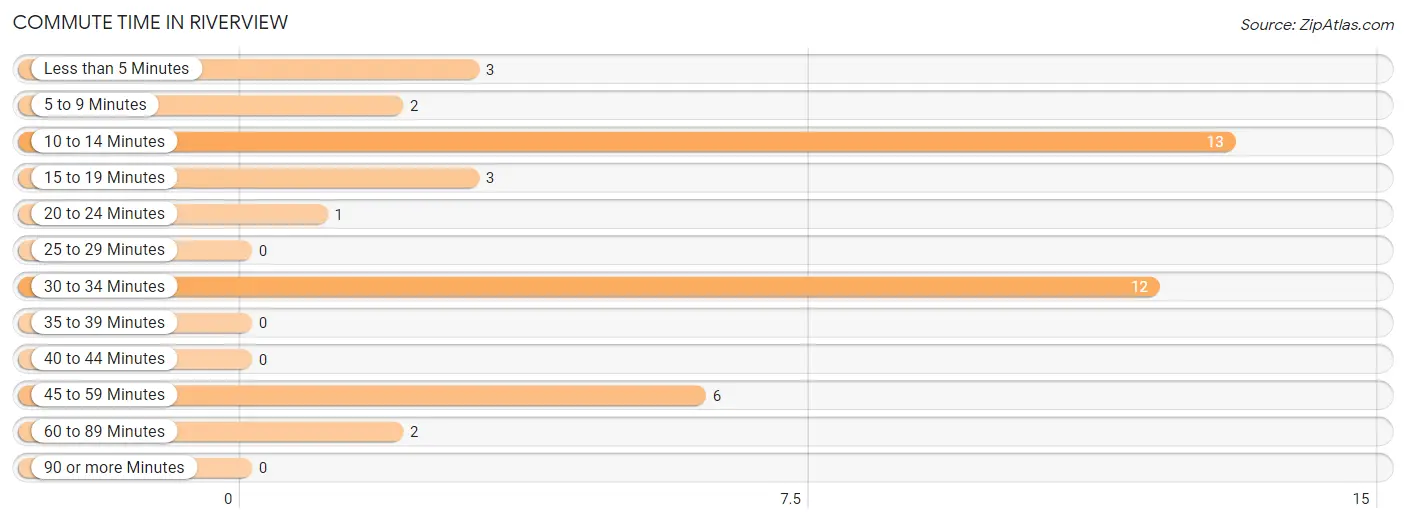
| Commute Time | # Commuters | % Commuters |
| Less than 5 Minutes | 3 | 7.1% |
| 5 to 9 Minutes | 2 | 4.8% |
| 10 to 14 Minutes | 13 | 30.9% |
| 15 to 19 Minutes | 3 | 7.1% |
| 20 to 24 Minutes | 1 | 2.4% |
| 25 to 29 Minutes | 0 | 0.0% |
| 30 to 34 Minutes | 12 | 28.6% |
| 35 to 39 Minutes | 0 | 0.0% |
| 40 to 44 Minutes | 0 | 0.0% |
| 45 to 59 Minutes | 6 | 14.3% |
| 60 to 89 Minutes | 2 | 4.8% |
| 90 or more Minutes | 0 | 0.0% |
Commute Time by Sex in Riverview
The most common commute times in Riverview are 30 to 34 minutes (10 commuters, 37.0%) for males and 10 to 14 minutes (6 commuters, 40.0%) for females.
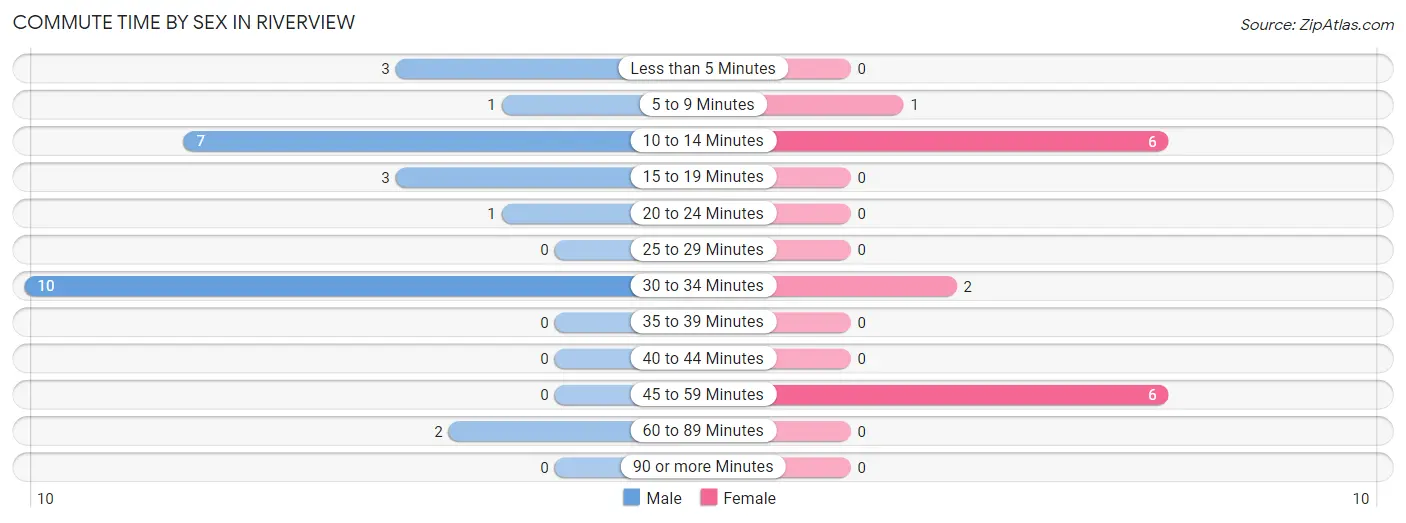
| Commute Time | Male | Female |
| Less than 5 Minutes | 3 (11.1%) | 0 (0.0%) |
| 5 to 9 Minutes | 1 (3.7%) | 1 (6.7%) |
| 10 to 14 Minutes | 7 (25.9%) | 6 (40.0%) |
| 15 to 19 Minutes | 3 (11.1%) | 0 (0.0%) |
| 20 to 24 Minutes | 1 (3.7%) | 0 (0.0%) |
| 25 to 29 Minutes | 0 (0.0%) | 0 (0.0%) |
| 30 to 34 Minutes | 10 (37.0%) | 2 (13.3%) |
| 35 to 39 Minutes | 0 (0.0%) | 0 (0.0%) |
| 40 to 44 Minutes | 0 (0.0%) | 0 (0.0%) |
| 45 to 59 Minutes | 0 (0.0%) | 6 (40.0%) |
| 60 to 89 Minutes | 2 (7.4%) | 0 (0.0%) |
| 90 or more Minutes | 0 (0.0%) | 0 (0.0%) |
Time of Departure to Work by Sex in Riverview
The most frequent times of departure to work in Riverview are 7:00 AM to 7:29 AM (11, 40.7%) for males and 6:00 AM to 6:29 AM (6, 40.0%) for females.
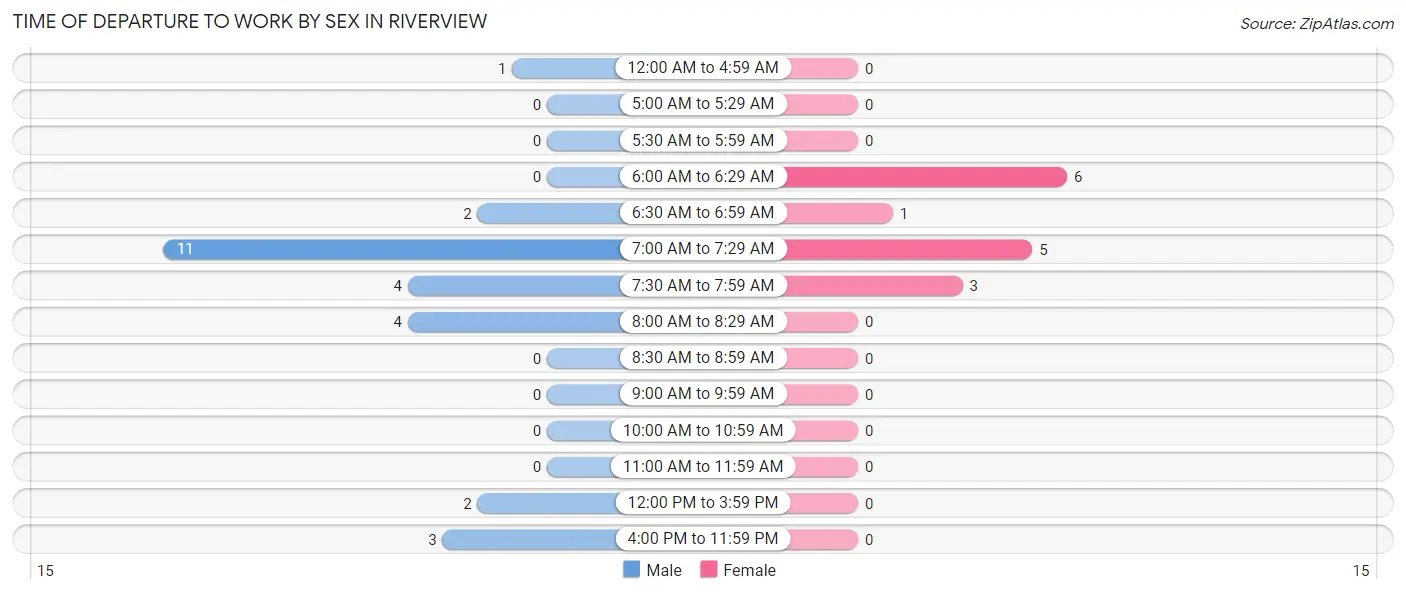
| Time of Departure | Male | Female |
| 12:00 AM to 4:59 AM | 1 (3.7%) | 0 (0.0%) |
| 5:00 AM to 5:29 AM | 0 (0.0%) | 0 (0.0%) |
| 5:30 AM to 5:59 AM | 0 (0.0%) | 0 (0.0%) |
| 6:00 AM to 6:29 AM | 0 (0.0%) | 6 (40.0%) |
| 6:30 AM to 6:59 AM | 2 (7.4%) | 1 (6.7%) |
| 7:00 AM to 7:29 AM | 11 (40.7%) | 5 (33.3%) |
| 7:30 AM to 7:59 AM | 4 (14.8%) | 3 (20.0%) |
| 8:00 AM to 8:29 AM | 4 (14.8%) | 0 (0.0%) |
| 8:30 AM to 8:59 AM | 0 (0.0%) | 0 (0.0%) |
| 9:00 AM to 9:59 AM | 0 (0.0%) | 0 (0.0%) |
| 10:00 AM to 10:59 AM | 0 (0.0%) | 0 (0.0%) |
| 11:00 AM to 11:59 AM | 0 (0.0%) | 0 (0.0%) |
| 12:00 PM to 3:59 PM | 2 (7.4%) | 0 (0.0%) |
| 4:00 PM to 11:59 PM | 3 (11.1%) | 0 (0.0%) |
| Total | 27 (100.0%) | 15 (100.0%) |
Housing Occupancy in Riverview
Occupancy by Ownership in Riverview
Of the total 48 dwellings in Riverview, owner-occupied units account for 41 (85.4%), while renter-occupied units make up 7 (14.6%).
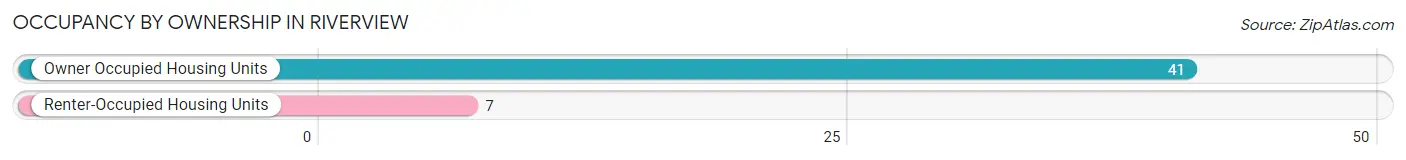
| Occupancy | # Housing Units | % Housing Units |
| Owner Occupied Housing Units | 41 | 85.4% |
| Renter-Occupied Housing Units | 7 | 14.6% |
| Total Occupied Housing Units | 48 | 100.0% |
Occupancy by Household Size in Riverview
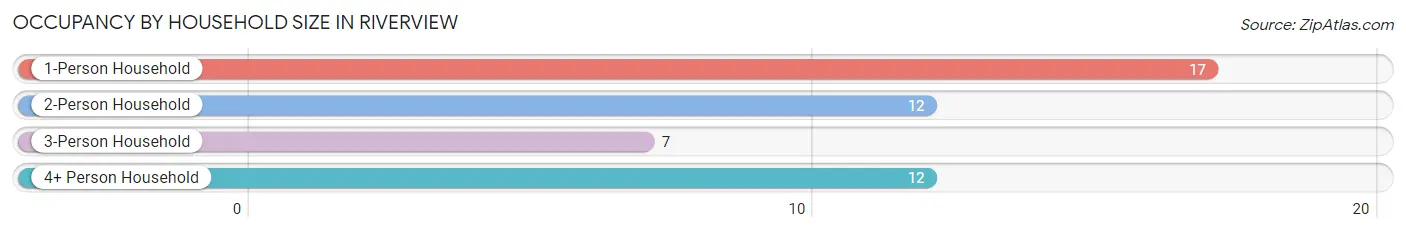
| Household Size | # Housing Units | % Housing Units |
| 1-Person Household | 17 | 35.4% |
| 2-Person Household | 12 | 25.0% |
| 3-Person Household | 7 | 14.6% |
| 4+ Person Household | 12 | 25.0% |
| Total Housing Units | 48 | 100.0% |
Occupancy by Ownership by Household Size in Riverview
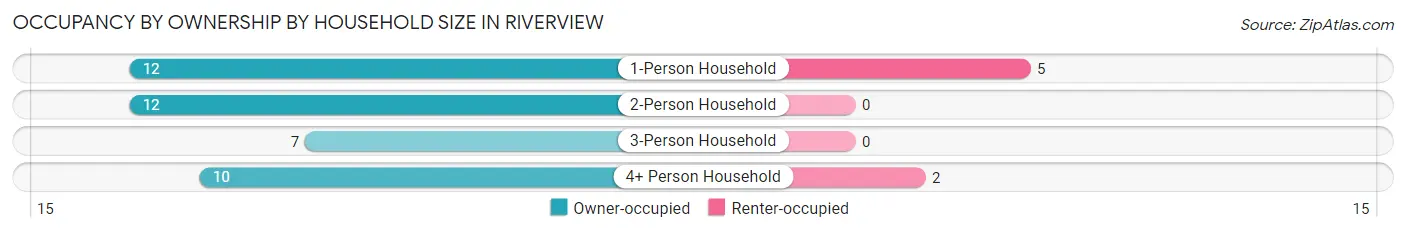
| Household Size | Owner-occupied | Renter-occupied |
| 1-Person Household | 12 (70.6%) | 5 (29.4%) |
| 2-Person Household | 12 (100.0%) | 0 (0.0%) |
| 3-Person Household | 7 (100.0%) | 0 (0.0%) |
| 4+ Person Household | 10 (83.3%) | 2 (16.7%) |
| Total Housing Units | 41 (85.4%) | 7 (14.6%) |
Occupancy by Educational Attainment in Riverview
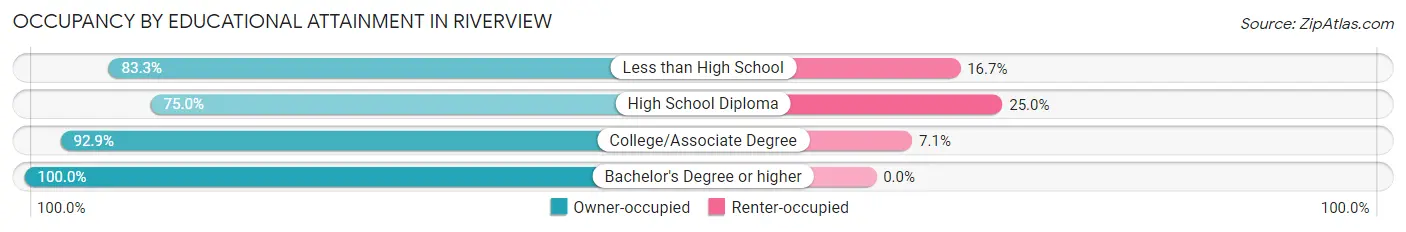
| Household Size | Owner-occupied | Renter-occupied |
| Less than High School | 5 (83.3%) | 1 (16.7%) |
| High School Diploma | 15 (75.0%) | 5 (25.0%) |
| College/Associate Degree | 13 (92.9%) | 1 (7.1%) |
| Bachelor's Degree or higher | 8 (100.0%) | 0 (0.0%) |
Occupancy by Age of Householder in Riverview
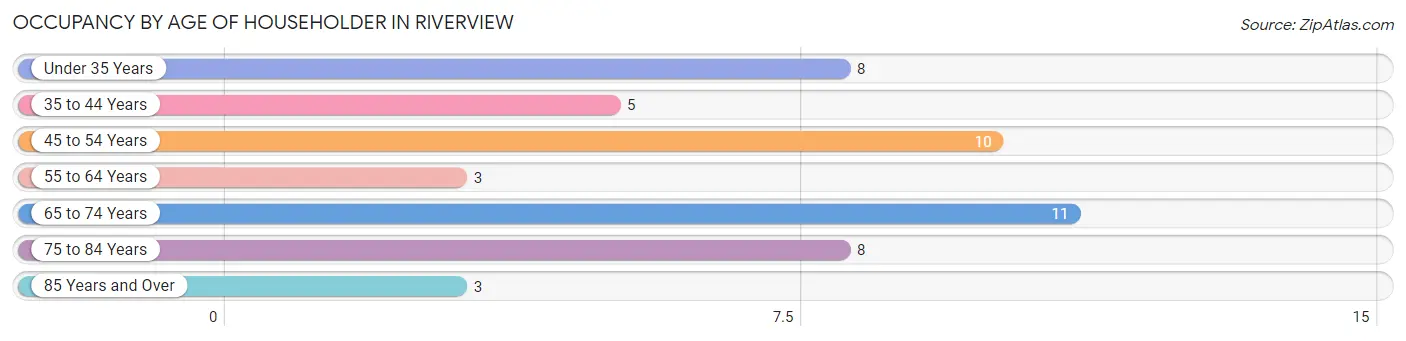
| Age Bracket | # Households | % Households |
| Under 35 Years | 8 | 16.7% |
| 35 to 44 Years | 5 | 10.4% |
| 45 to 54 Years | 10 | 20.8% |
| 55 to 64 Years | 3 | 6.2% |
| 65 to 74 Years | 11 | 22.9% |
| 75 to 84 Years | 8 | 16.7% |
| 85 Years and Over | 3 | 6.2% |
| Total | 48 | 100.0% |
Housing Finances in Riverview
Median Income by Occupancy in Riverview
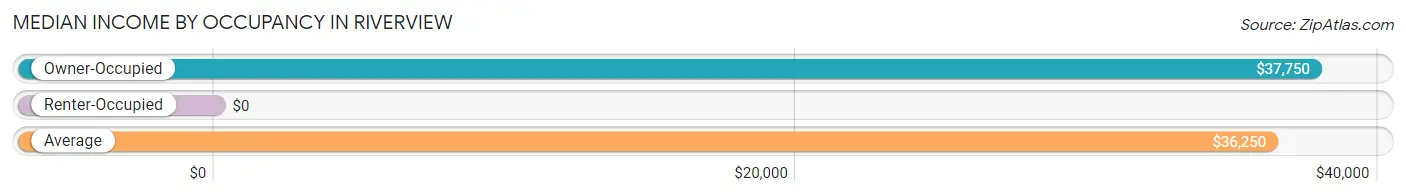
| Occupancy Type | # Households | Median Income |
| Owner-Occupied | 41 (85.4%) | $37,750 |
| Renter-Occupied | 7 (14.6%) | $0 |
| Average | 48 (100.0%) | $36,250 |
Occupancy by Householder Income Bracket in Riverview
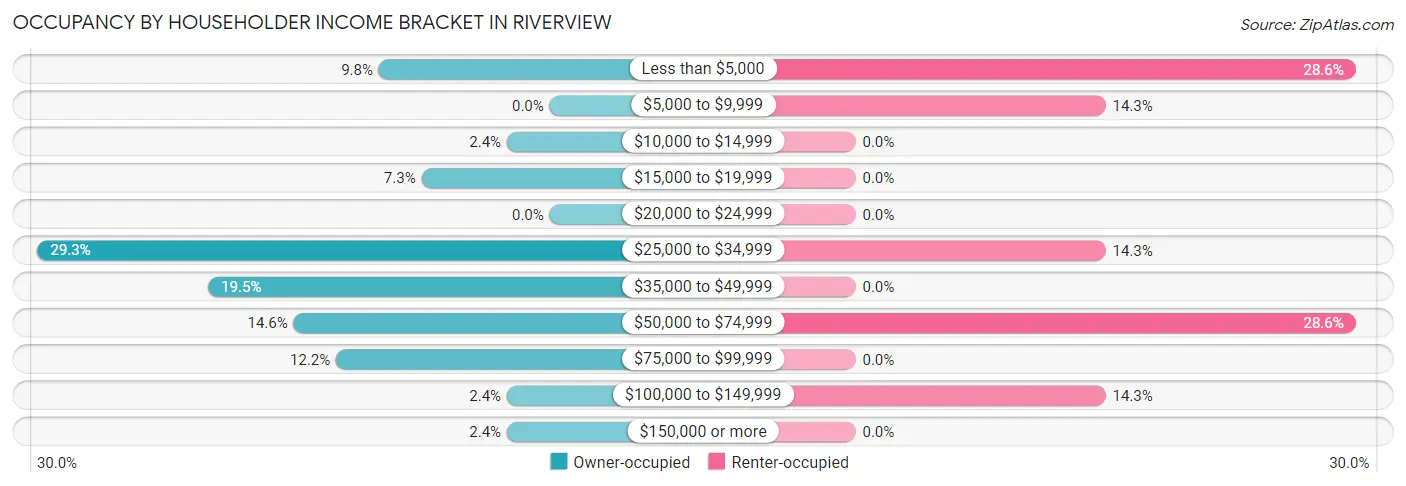
| Income Bracket | Owner-occupied | Renter-occupied |
| Less than $5,000 | 4 (9.8%) | 2 (28.6%) |
| $5,000 to $9,999 | 0 (0.0%) | 1 (14.3%) |
| $10,000 to $14,999 | 1 (2.4%) | 0 (0.0%) |
| $15,000 to $19,999 | 3 (7.3%) | 0 (0.0%) |
| $20,000 to $24,999 | 0 (0.0%) | 0 (0.0%) |
| $25,000 to $34,999 | 12 (29.3%) | 1 (14.3%) |
| $35,000 to $49,999 | 8 (19.5%) | 0 (0.0%) |
| $50,000 to $74,999 | 6 (14.6%) | 2 (28.6%) |
| $75,000 to $99,999 | 5 (12.2%) | 0 (0.0%) |
| $100,000 to $149,999 | 1 (2.4%) | 1 (14.3%) |
| $150,000 or more | 1 (2.4%) | 0 (0.0%) |
| Total | 41 (100.0%) | 7 (100.0%) |
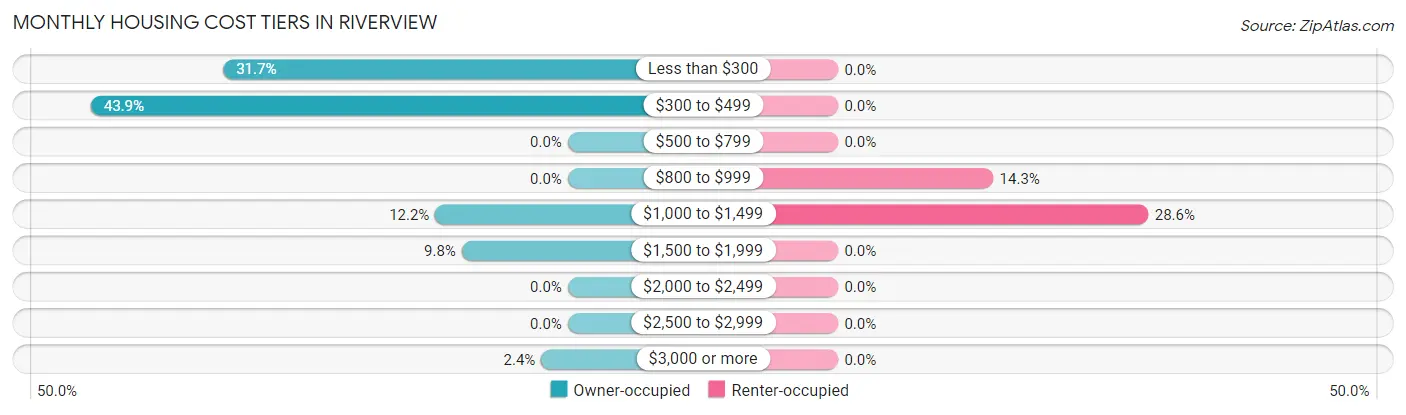
Monthly Housing Cost Tiers in Riverview
| Monthly Cost | Owner-occupied | Renter-occupied |
| Less than $300 | 13 (31.7%) | 0 (0.0%) |
| $300 to $499 | 18 (43.9%) | 0 (0.0%) |
| $500 to $799 | 0 (0.0%) | 0 (0.0%) |
| $800 to $999 | 0 (0.0%) | 1 (14.3%) |
| $1,000 to $1,499 | 5 (12.2%) | 2 (28.6%) |
| $1,500 to $1,999 | 4 (9.8%) | 0 (0.0%) |
| $2,000 to $2,499 | 0 (0.0%) | 0 (0.0%) |
| $2,500 to $2,999 | 0 (0.0%) | 0 (0.0%) |
| $3,000 or more | 1 (2.4%) | 0 (0.0%) |
| Total | 41 (100.0%) | 7 (100.0%) |
Physical Housing Characteristics in Riverview
Housing Structures in Riverview
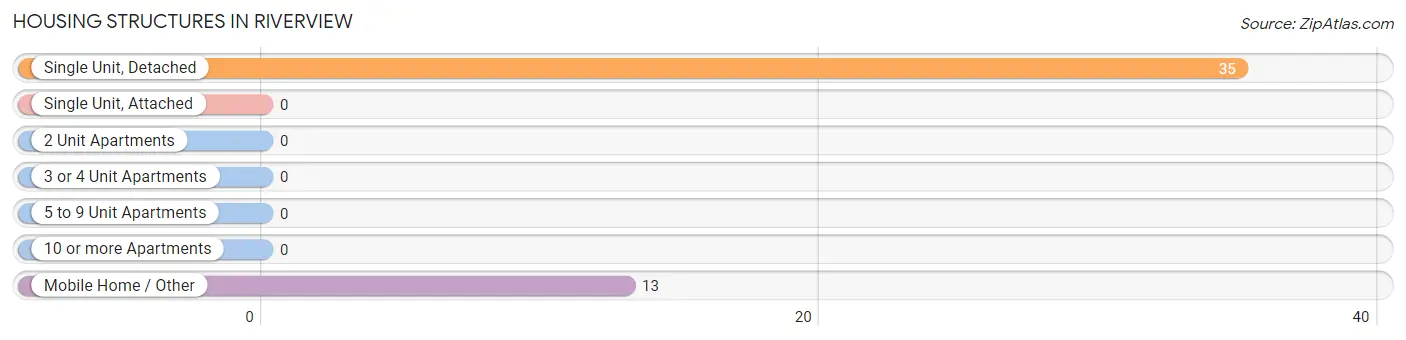
| Structure Type | # Housing Units | % Housing Units |
| Single Unit, Detached | 35 | 72.9% |
| Single Unit, Attached | 0 | 0.0% |
| 2 Unit Apartments | 0 | 0.0% |
| 3 or 4 Unit Apartments | 0 | 0.0% |
| 5 to 9 Unit Apartments | 0 | 0.0% |
| 10 or more Apartments | 0 | 0.0% |
| Mobile Home / Other | 13 | 27.1% |
| Total | 48 | 100.0% |
Housing Structures by Occupancy in Riverview
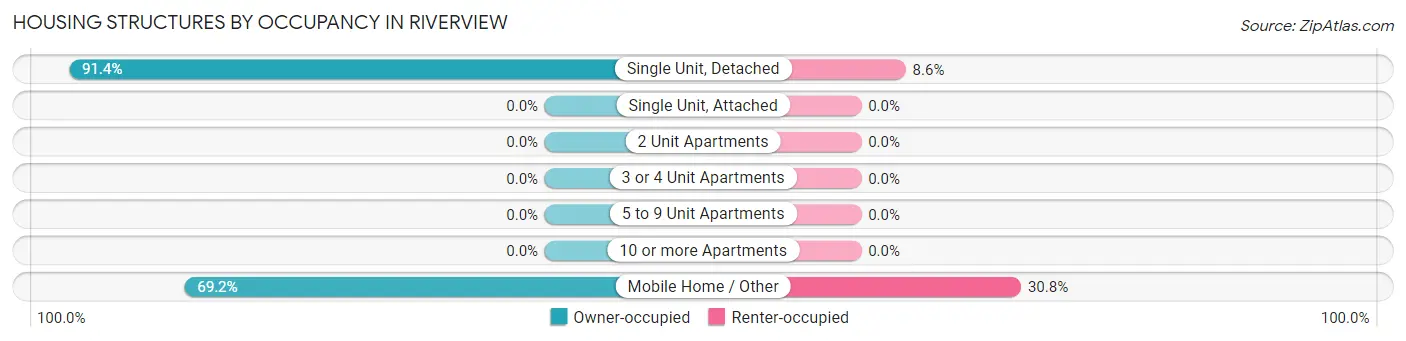
| Structure Type | Owner-occupied | Renter-occupied |
| Single Unit, Detached | 32 (91.4%) | 3 (8.6%) |
| Single Unit, Attached | 0 (0.0%) | 0 (0.0%) |
| 2 Unit Apartments | 0 (0.0%) | 0 (0.0%) |
| 3 or 4 Unit Apartments | 0 (0.0%) | 0 (0.0%) |
| 5 to 9 Unit Apartments | 0 (0.0%) | 0 (0.0%) |
| 10 or more Apartments | 0 (0.0%) | 0 (0.0%) |
| Mobile Home / Other | 9 (69.2%) | 4 (30.8%) |
| Total | 41 (85.4%) | 7 (14.6%) |
Housing Structures by Number of Rooms in Riverview
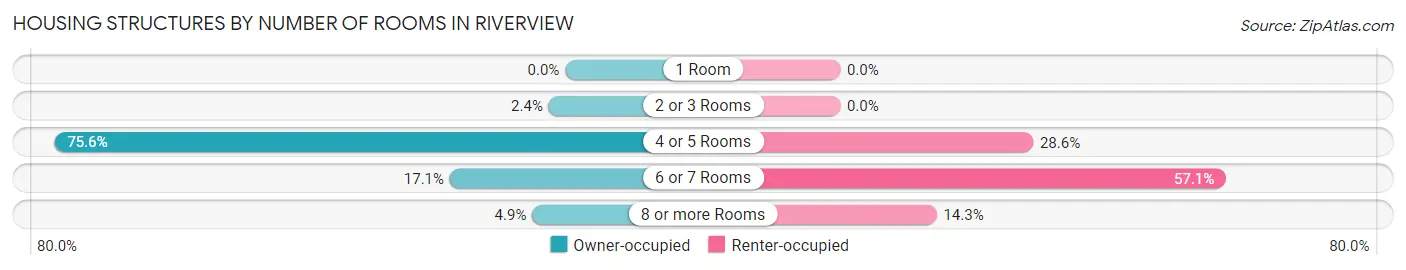
| Number of Rooms | Owner-occupied | Renter-occupied |
| 1 Room | 0 (0.0%) | 0 (0.0%) |
| 2 or 3 Rooms | 1 (2.4%) | 0 (0.0%) |
| 4 or 5 Rooms | 31 (75.6%) | 2 (28.6%) |
| 6 or 7 Rooms | 7 (17.1%) | 4 (57.1%) |
| 8 or more Rooms | 2 (4.9%) | 1 (14.3%) |
| Total | 41 (100.0%) | 7 (100.0%) |
Housing Structure by Heating Type in Riverview
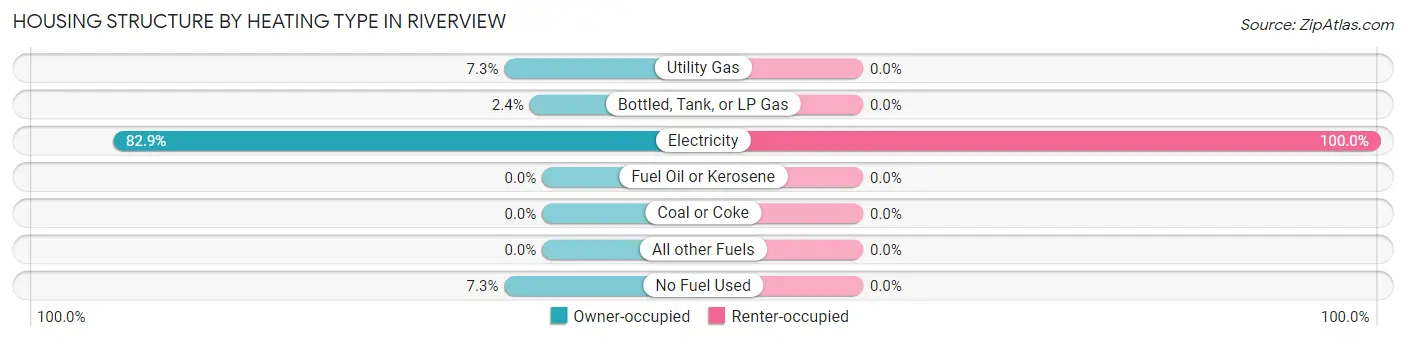
| Heating Type | Owner-occupied | Renter-occupied |
| Utility Gas | 3 (7.3%) | 0 (0.0%) |
| Bottled, Tank, or LP Gas | 1 (2.4%) | 0 (0.0%) |
| Electricity | 34 (82.9%) | 7 (100.0%) |
| Fuel Oil or Kerosene | 0 (0.0%) | 0 (0.0%) |
| Coal or Coke | 0 (0.0%) | 0 (0.0%) |
| All other Fuels | 0 (0.0%) | 0 (0.0%) |
| No Fuel Used | 3 (7.3%) | 0 (0.0%) |
| Total | 41 (100.0%) | 7 (100.0%) |
Household Vehicle Usage in Riverview
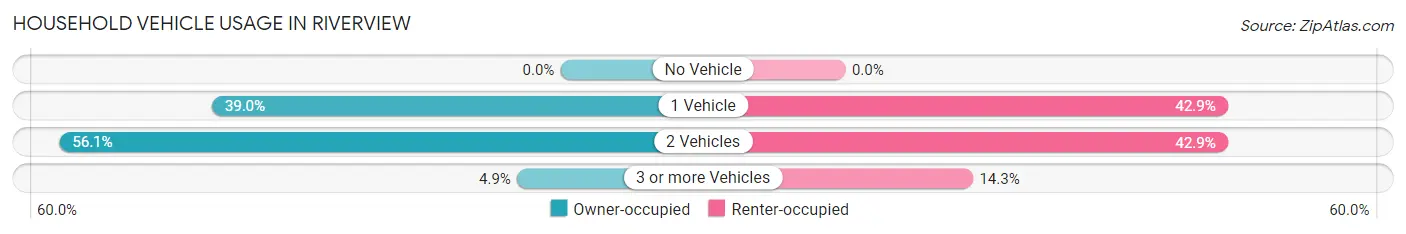
| Vehicles per Household | Owner-occupied | Renter-occupied |
| No Vehicle | 0 (0.0%) | 0 (0.0%) |
| 1 Vehicle | 16 (39.0%) | 3 (42.9%) |
| 2 Vehicles | 23 (56.1%) | 3 (42.9%) |
| 3 or more Vehicles | 2 (4.9%) | 1 (14.3%) |
| Total | 41 (100.0%) | 7 (100.0%) |
Real Estate & Mortgages in Riverview
Real Estate and Mortgage Overview in Riverview
| Characteristic | Without Mortgage | With Mortgage |
| Housing Units | 31 | 10 |
| Median Property Value | $84,200 | $0 |
| Median Household Income | $34,375 | $1 |
| Monthly Housing Costs | $321 | $1 |
| Real Estate Taxes | $300 | $0 |
Property Value by Mortgage Status in Riverview
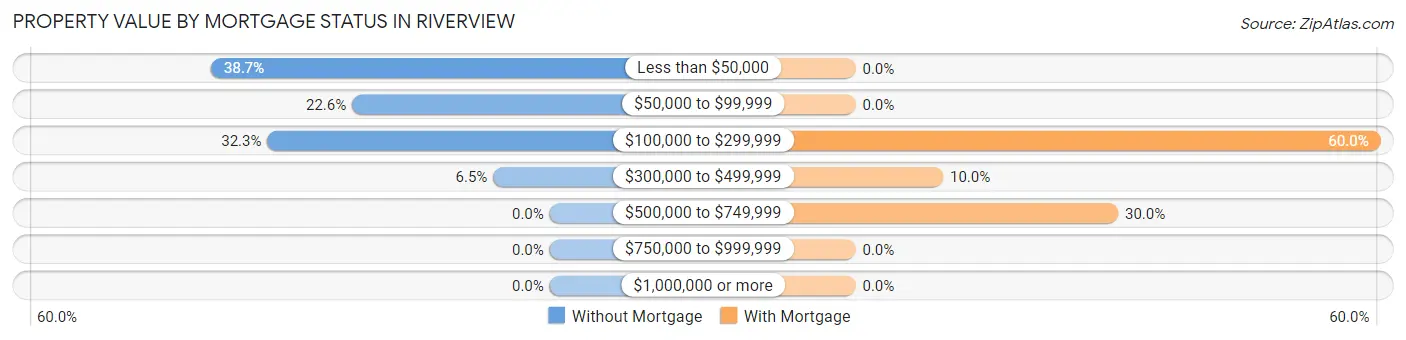
| Property Value | Without Mortgage | With Mortgage |
| Less than $50,000 | 12 (38.7%) | 0 (0.0%) |
| $50,000 to $99,999 | 7 (22.6%) | 0 (0.0%) |
| $100,000 to $299,999 | 10 (32.3%) | 6 (60.0%) |
| $300,000 to $499,999 | 2 (6.5%) | 1 (10.0%) |
| $500,000 to $749,999 | 0 (0.0%) | 3 (30.0%) |
| $750,000 to $999,999 | 0 (0.0%) | 0 (0.0%) |
| $1,000,000 or more | 0 (0.0%) | 0 (0.0%) |
| Total | 31 (100.0%) | 10 (100.0%) |
Household Income by Mortgage Status in Riverview
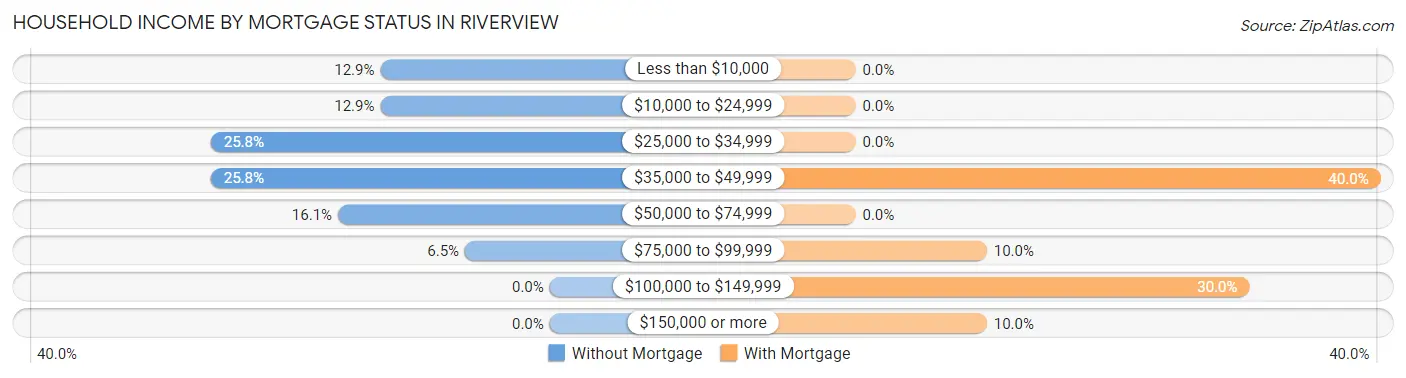
| Household Income | Without Mortgage | With Mortgage |
| Less than $10,000 | 4 (12.9%) | 0 (0.0%) |
| $10,000 to $24,999 | 4 (12.9%) | 0 (0.0%) |
| $25,000 to $34,999 | 8 (25.8%) | 0 (0.0%) |
| $35,000 to $49,999 | 8 (25.8%) | 4 (40.0%) |
| $50,000 to $74,999 | 5 (16.1%) | 0 (0.0%) |
| $75,000 to $99,999 | 2 (6.5%) | 1 (10.0%) |
| $100,000 to $149,999 | 0 (0.0%) | 3 (30.0%) |
| $150,000 or more | 0 (0.0%) | 1 (10.0%) |
| Total | 31 (100.0%) | 10 (100.0%) |
Property Value to Household Income Ratio in Riverview
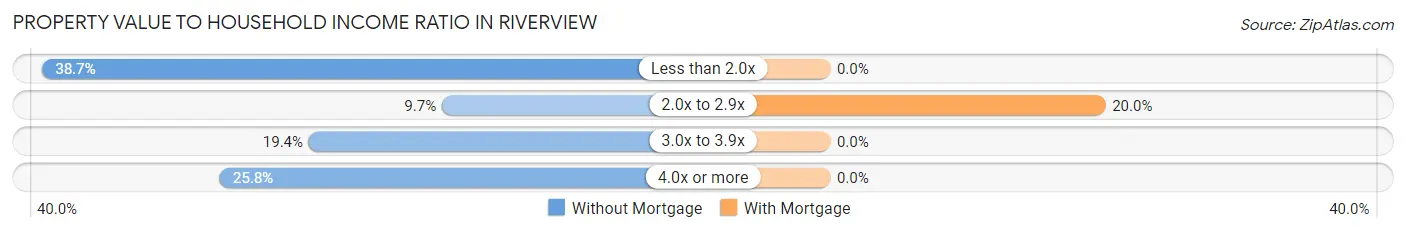
| Value-to-Income Ratio | Without Mortgage | With Mortgage |
| Less than 2.0x | 12 (38.7%) | 0 (0.0%) |
| 2.0x to 2.9x | 3 (9.7%) | 2 (20.0%) |
| 3.0x to 3.9x | 6 (19.4%) | 0 (0.0%) |
| 4.0x or more | 8 (25.8%) | 0 (0.0%) |
| Total | 31 (100.0%) | 10 (100.0%) |
Real Estate Taxes by Mortgage Status in Riverview
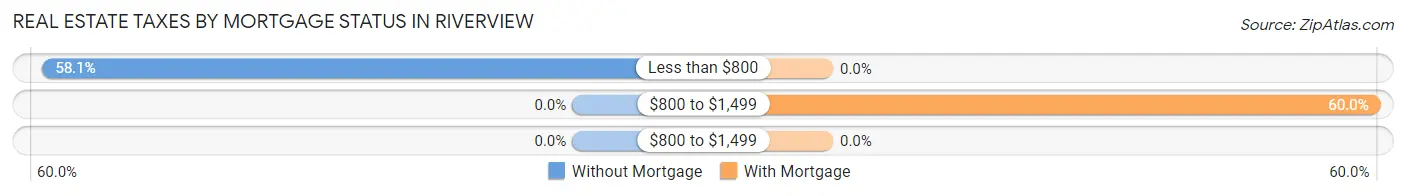
| Property Taxes | Without Mortgage | With Mortgage |
| Less than $800 | 18 (58.1%) | 0 (0.0%) |
| $800 to $1,499 | 0 (0.0%) | 6 (60.0%) |
| $800 to $1,499 | 0 (0.0%) | 0 (0.0%) |
| Total | 31 (100.0%) | 10 (100.0%) |
Health & Disability in Riverview
Health Insurance Coverage by Age in Riverview
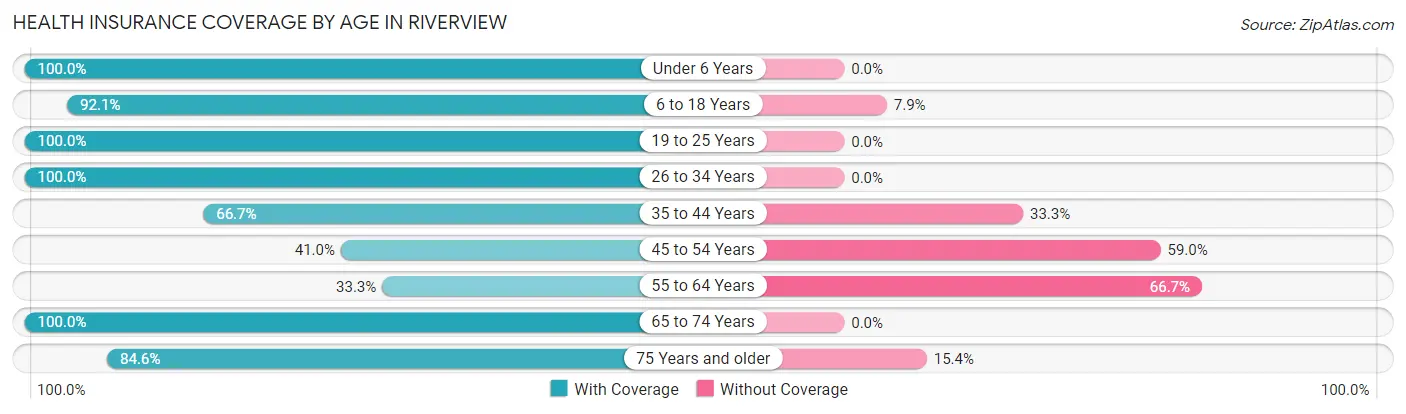
| Age Bracket | With Coverage | Without Coverage |
| Under 6 Years | 16 (100.0%) | 0 (0.0%) |
| 6 to 18 Years | 58 (92.1%) | 5 (7.9%) |
| 19 to 25 Years | 5 (100.0%) | 0 (0.0%) |
| 26 to 34 Years | 12 (100.0%) | 0 (0.0%) |
| 35 to 44 Years | 10 (66.7%) | 5 (33.3%) |
| 45 to 54 Years | 16 (41.0%) | 23 (59.0%) |
| 55 to 64 Years | 1 (33.3%) | 2 (66.7%) |
| 65 to 74 Years | 31 (100.0%) | 0 (0.0%) |
| 75 Years and older | 11 (84.6%) | 2 (15.4%) |
| Total | 160 (81.2%) | 37 (18.8%) |
Health Insurance Coverage by Citizenship Status in Riverview
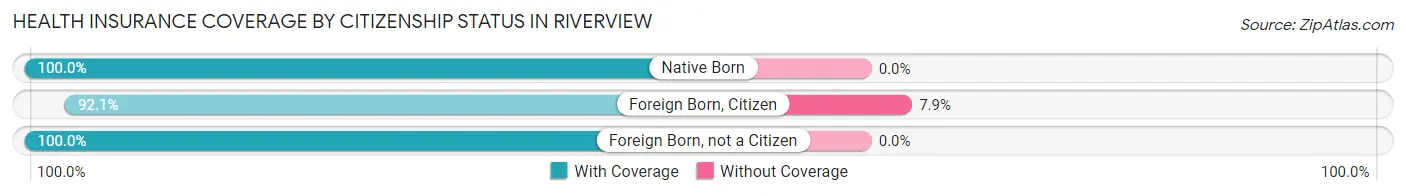
| Citizenship Status | With Coverage | Without Coverage |
| Native Born | 16 (100.0%) | 0 (0.0%) |
| Foreign Born, Citizen | 58 (92.1%) | 5 (7.9%) |
| Foreign Born, not a Citizen | 5 (100.0%) | 0 (0.0%) |
Health Insurance Coverage by Household Income in Riverview
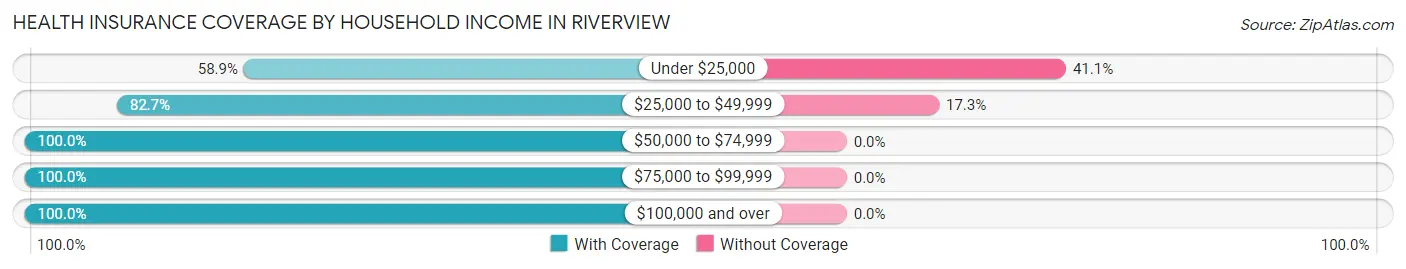
| Household Income | With Coverage | Without Coverage |
| Under $25,000 | 33 (58.9%) | 23 (41.1%) |
| $25,000 to $49,999 | 67 (82.7%) | 14 (17.3%) |
| $50,000 to $74,999 | 19 (100.0%) | 0 (0.0%) |
| $75,000 to $99,999 | 22 (100.0%) | 0 (0.0%) |
| $100,000 and over | 19 (100.0%) | 0 (0.0%) |
Public vs Private Health Insurance Coverage by Age in Riverview
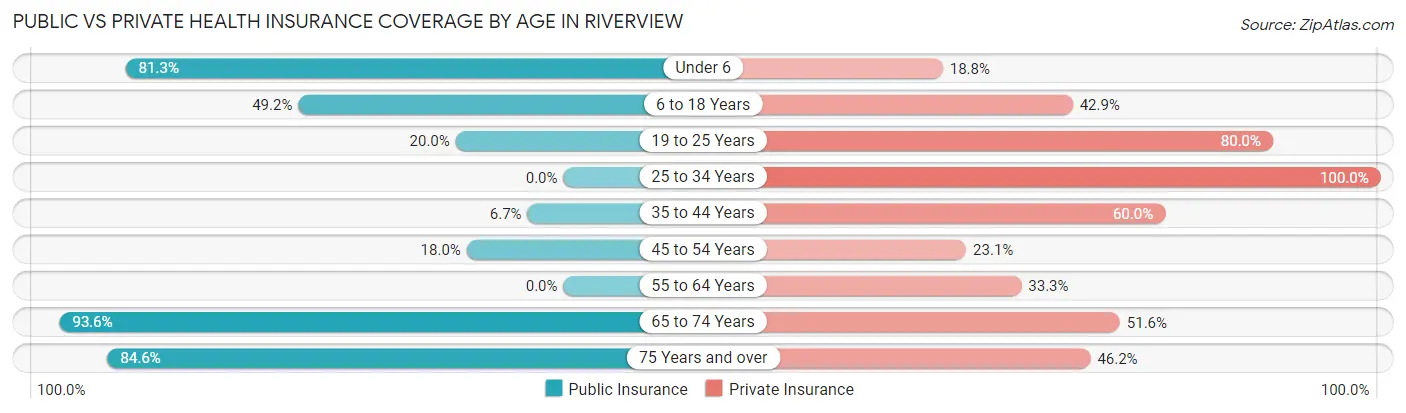
| Age Bracket | Public Insurance | Private Insurance |
| Under 6 | 13 (81.2%) | 3 (18.8%) |
| 6 to 18 Years | 31 (49.2%) | 27 (42.9%) |
| 19 to 25 Years | 1 (20.0%) | 4 (80.0%) |
| 25 to 34 Years | 0 (0.0%) | 12 (100.0%) |
| 35 to 44 Years | 1 (6.7%) | 9 (60.0%) |
| 45 to 54 Years | 7 (17.9%) | 9 (23.1%) |
| 55 to 64 Years | 0 (0.0%) | 1 (33.3%) |
| 65 to 74 Years | 29 (93.5%) | 16 (51.6%) |
| 75 Years and over | 11 (84.6%) | 6 (46.2%) |
| Total | 93 (47.2%) | 87 (44.2%) |
Disability Status by Sex by Age in Riverview
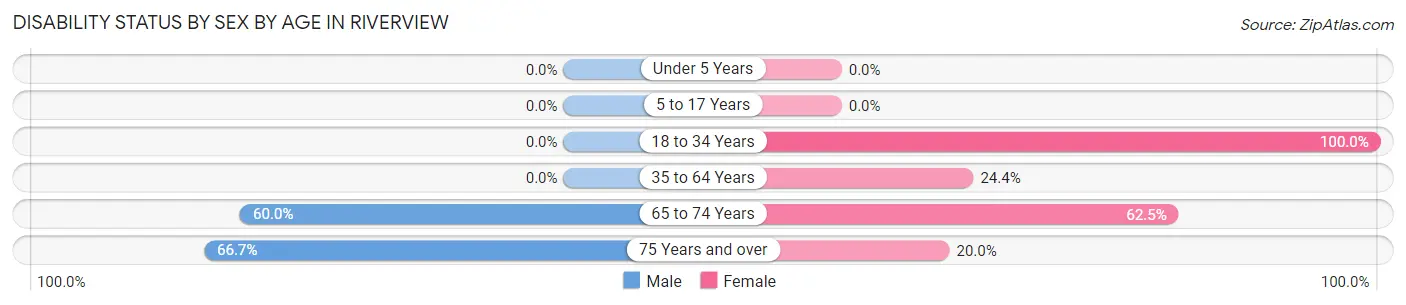
| Age Bracket | Male | Female |
| Under 5 Years | 0 (0.0%) | 0 (0.0%) |
| 5 to 17 Years | 0 (0.0%) | 0 (0.0%) |
| 18 to 34 Years | 0 (0.0%) | 5 (100.0%) |
| 35 to 64 Years | 0 (0.0%) | 11 (24.4%) |
| 65 to 74 Years | 9 (60.0%) | 10 (62.5%) |
| 75 Years and over | 2 (66.7%) | 2 (20.0%) |
Disability Class by Sex by Age in Riverview
Disability Class: Hearing Difficulty
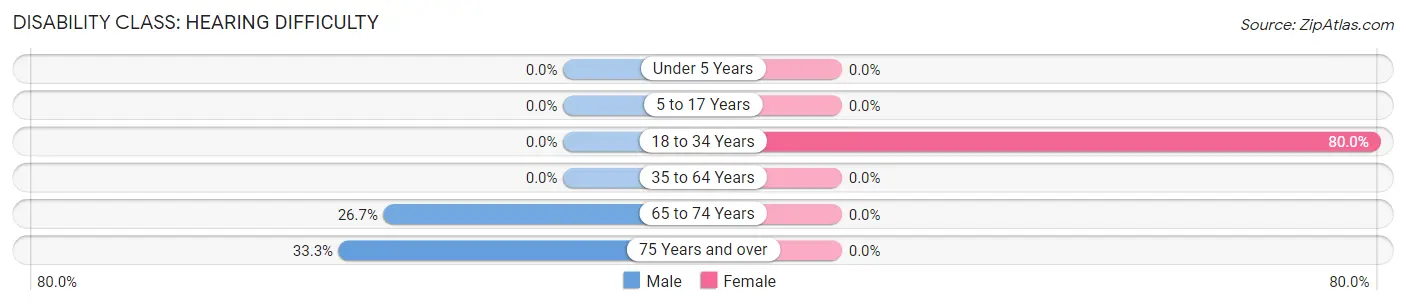
| Age Bracket | Male | Female |
| Under 5 Years | 0 (0.0%) | 0 (0.0%) |
| 5 to 17 Years | 0 (0.0%) | 0 (0.0%) |
| 18 to 34 Years | 0 (0.0%) | 4 (80.0%) |
| 35 to 64 Years | 0 (0.0%) | 0 (0.0%) |
| 65 to 74 Years | 4 (26.7%) | 0 (0.0%) |
| 75 Years and over | 1 (33.3%) | 0 (0.0%) |
Disability Class: Vision Difficulty
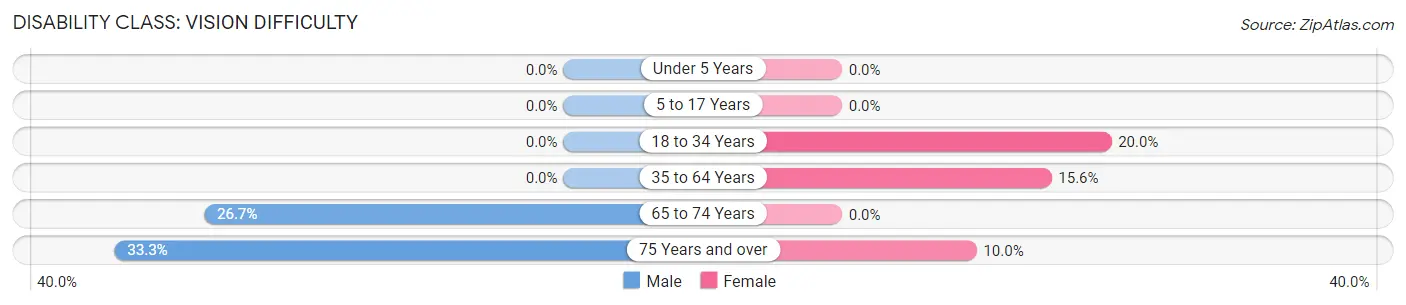
| Age Bracket | Male | Female |
| Under 5 Years | 0 (0.0%) | 0 (0.0%) |
| 5 to 17 Years | 0 (0.0%) | 0 (0.0%) |
| 18 to 34 Years | 0 (0.0%) | 1 (20.0%) |
| 35 to 64 Years | 0 (0.0%) | 7 (15.6%) |
| 65 to 74 Years | 4 (26.7%) | 0 (0.0%) |
| 75 Years and over | 1 (33.3%) | 1 (10.0%) |
Disability Class: Cognitive Difficulty
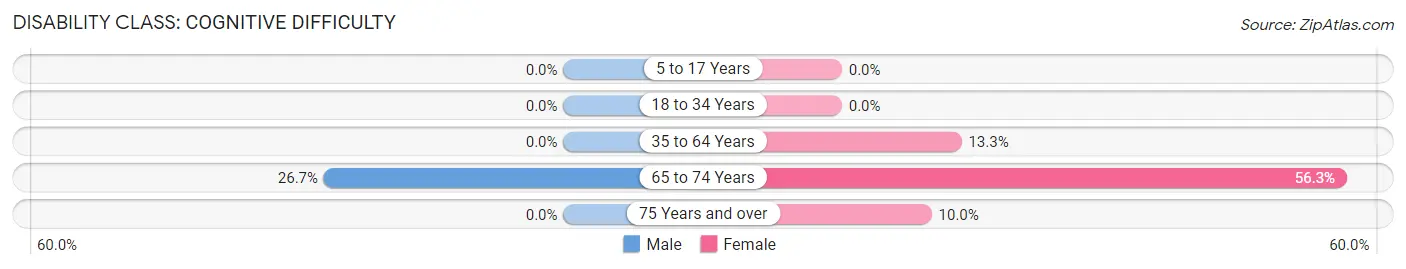
| Age Bracket | Male | Female |
| 5 to 17 Years | 0 (0.0%) | 0 (0.0%) |
| 18 to 34 Years | 0 (0.0%) | 0 (0.0%) |
| 35 to 64 Years | 0 (0.0%) | 6 (13.3%) |
| 65 to 74 Years | 4 (26.7%) | 9 (56.2%) |
| 75 Years and over | 0 (0.0%) | 1 (10.0%) |
Disability Class: Ambulatory Difficulty
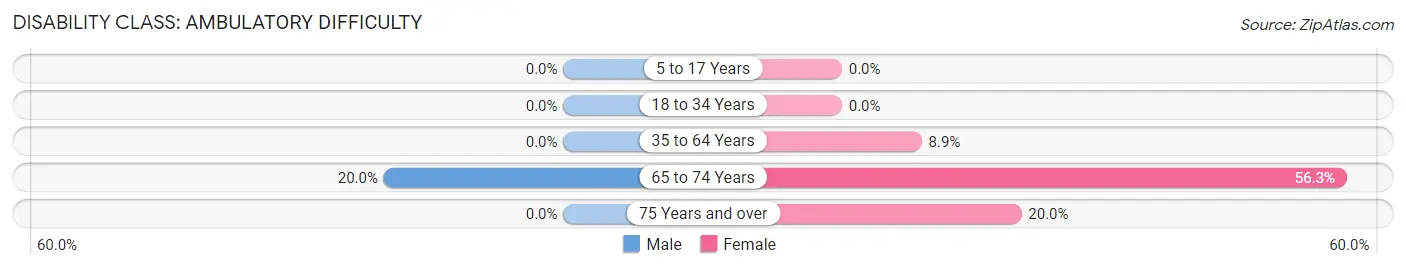
| Age Bracket | Male | Female |
| 5 to 17 Years | 0 (0.0%) | 0 (0.0%) |
| 18 to 34 Years | 0 (0.0%) | 0 (0.0%) |
| 35 to 64 Years | 0 (0.0%) | 4 (8.9%) |
| 65 to 74 Years | 3 (20.0%) | 9 (56.2%) |
| 75 Years and over | 0 (0.0%) | 2 (20.0%) |
Disability Class: Self-Care Difficulty
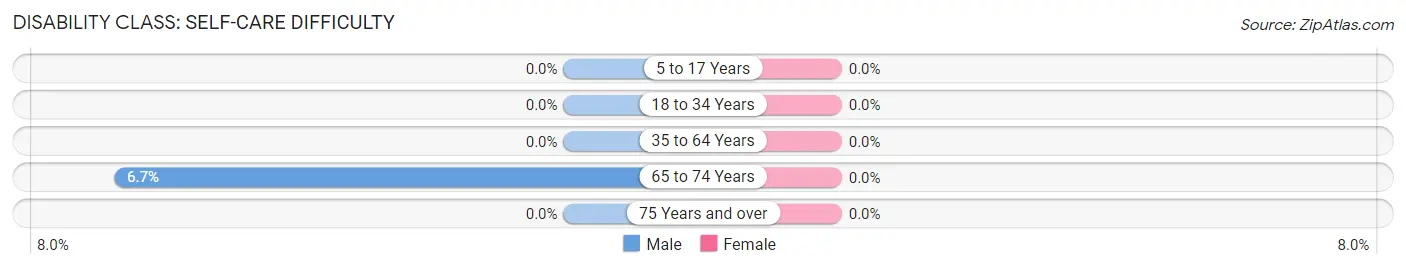
| Age Bracket | Male | Female |
| 5 to 17 Years | 0 (0.0%) | 0 (0.0%) |
| 18 to 34 Years | 0 (0.0%) | 0 (0.0%) |
| 35 to 64 Years | 0 (0.0%) | 0 (0.0%) |
| 65 to 74 Years | 1 (6.7%) | 0 (0.0%) |
| 75 Years and over | 0 (0.0%) | 0 (0.0%) |
Technology Access in Riverview
Computing Device Access in Riverview
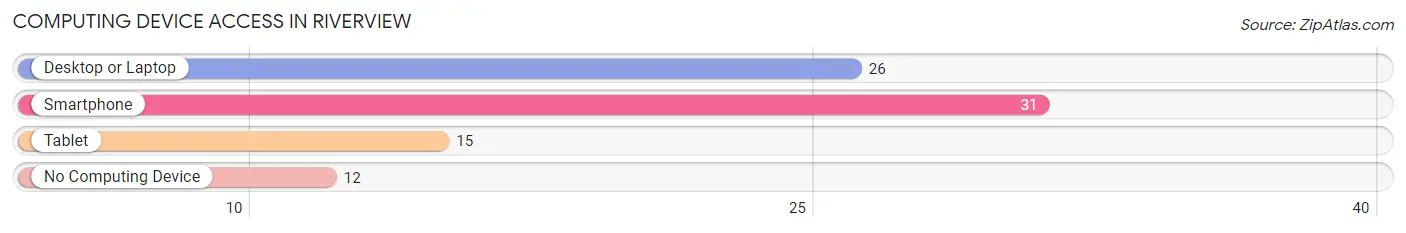
| Device Type | # Households | % Households |
| Desktop or Laptop | 26 | 54.2% |
| Smartphone | 31 | 64.6% |
| Tablet | 15 | 31.2% |
| No Computing Device | 12 | 25.0% |
| Total | 48 | 100.0% |
Internet Access in Riverview
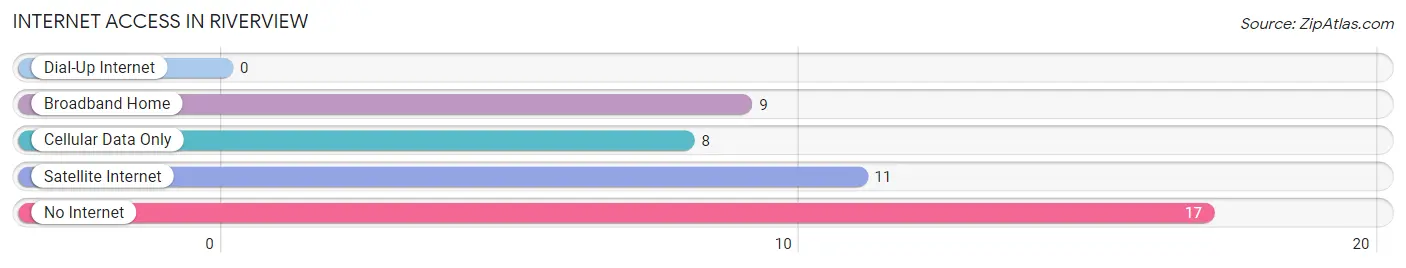
| Internet Type | # Households | % Households |
| Dial-Up Internet | 0 | 0.0% |
| Broadband Home | 9 | 18.8% |
| Cellular Data Only | 8 | 16.7% |
| Satellite Internet | 11 | 22.9% |
| No Internet | 17 | 35.4% |
| Total | 48 | 100.0% |
Riverview Summary
Riverview, AL is a small town located in the northwest corner of Alabama, in the foothills of the Appalachian Mountains. It is situated on the banks of the Tennessee River, and is part of the larger Huntsville-Decatur-Albertville metropolitan area. The town has a population of just over 1,000 people, and is known for its rural charm and small-town atmosphere.
History
The area that is now Riverview, AL was first settled in the early 1800s by settlers from the Carolinas and Virginia. The town was originally known as “Riverview” due to its location on the Tennessee River. The town was officially incorporated in 1887, and the first post office was established in 1891.
In the early 1900s, Riverview was a thriving agricultural community, with cotton, corn, and tobacco being the main crops. The town also had a number of small businesses, including a general store, a blacksmith shop, and a grist mill.
In the 1950s, Riverview began to experience a decline in population as many of its residents moved away in search of better economic opportunities. The town’s population continued to decline until the late 1990s, when it began to experience a resurgence.
Geography
Riverview, AL is located in the northwest corner of Alabama, in the foothills of the Appalachian Mountains. The town is situated on the banks of the Tennessee River, and is part of the larger Huntsville-Decatur-Albertville metropolitan area. The town is located approximately 25 miles north of Huntsville, and is accessible via US Highway 431.
The town is situated at an elevation of approximately 800 feet above sea level, and has a humid subtropical climate. The average annual temperature is around 70 degrees Fahrenheit, and the average annual precipitation is around 50 inches.
Economy
The economy of Riverview, AL is largely based on agriculture and tourism. The town is home to a number of small farms, which produce a variety of crops, including cotton, corn, and tobacco. The town also has a number of small businesses, including a general store, a blacksmith shop, and a grist mill.
In recent years, the town has also become a popular tourist destination, due to its rural charm and small-town atmosphere. The town is home to a number of historic sites, including the Riverview Historic District, which is listed on the National Register of Historic Places.
Demographics
As of the 2010 census, the population of Riverview, AL was 1,072. The racial makeup of the town was 95.3% White, 2.2% African American, 0.3% Native American, 0.2% Asian, 0.1% Pacific Islander, 0.7% from other races, and 1.4% from two or more races. Hispanic or Latino of any race were 1.7% of the population.
The median household income in Riverview, AL was $37,500, and the median family income was $45,000. The per capita income for the town was $18,000. Approximately 15.3% of the population was below the poverty line.
Common Questions
What is Per Capita Income in Riverview?
Per Capita income in Riverview is $16,639.
What is the Median Family Income in Riverview?
Median Family Income in Riverview is $37,750.
What is the Median Household income in Riverview?
Median Household Income in Riverview is $36,250.
What is Inequality or Gini Index in Riverview?
Inequality or Gini Index in Riverview is 0.48.
What is the Total Population of Riverview?
Total Population of Riverview is 197.
What is the Total Male Population of Riverview?
Total Male Population of Riverview is 104.
What is the Total Female Population of Riverview?
Total Female Population of Riverview is 93.
What is the Ratio of Males per 100 Females in Riverview?
There are 111.83 Males per 100 Females in Riverview.
What is the Ratio of Females per 100 Males in Riverview?
There are 89.42 Females per 100 Males in Riverview.
What is the Median Population Age in Riverview?
Median Population Age in Riverview is 37.3 Years.
What is the Average Family Size in Riverview
Average Family Size in Riverview is 5.8 People.
What is the Average Household Size in Riverview
Average Household Size in Riverview is 4.1 People.
How Large is the Labor Force in Riverview?
There are 49 People in the Labor Forcein in Riverview.
What is the Percentage of People in the Labor Force in Riverview?
39.8% of People are in the Labor Force in Riverview.