Libertyville, AL Map & Demographics
Libertyville Map
Libertyville Overview
$43,761
PER CAPITA INCOME
$77,375
AVG FAMILY INCOME
$76,875
AVG HOUSEHOLD INCOME
0.44
INEQUALITY / GINI INDEX
111
TOTAL POPULATION
52
MALE POPULATION
59
FEMALE POPULATION
88.14
MALES / 100 FEMALES
113.46
FEMALES / 100 MALES
38.8
MEDIAN AGE
3.1
AVG FAMILY SIZE
2.6
AVG HOUSEHOLD SIZE
60
LABOR FORCE [ PEOPLE ]
69.0%
PERCENT IN LABOR FORCE
Income in Libertyville
Income Overview in Libertyville
Per Capita Income in Libertyville is $43,761, while median incomes of families and households are $77,375 and $76,875 respectively.
| Characteristic | Number | Measure |
| Per Capita Income | 111 | $43,761 |
| Median Family Income | 33 | $77,375 |
| Mean Family Income | 33 | $128,233 |
| Median Household Income | 43 | $76,875 |
| Mean Household Income | 43 | $108,019 |
| Income Deficit | 33 | $0 |
| Wage / Income Gap (%) | 111 | 0.00% |
| Wage / Income Gap ($) | 111 | 100.00¢ per $1 |
| Gini / Inequality Index | 111 | 0.44 |
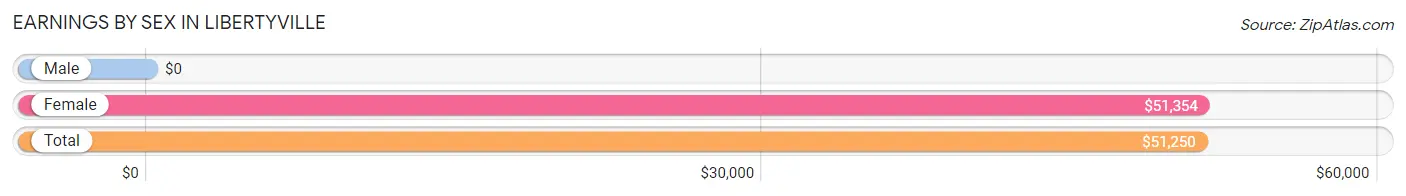
Earnings by Sex in Libertyville
| Sex | Number | Average Earnings |
| Male | 31 (51.7%) | $0 |
| Female | 29 (48.3%) | $51,354 |
| Total | 60 (100.0%) | $51,250 |
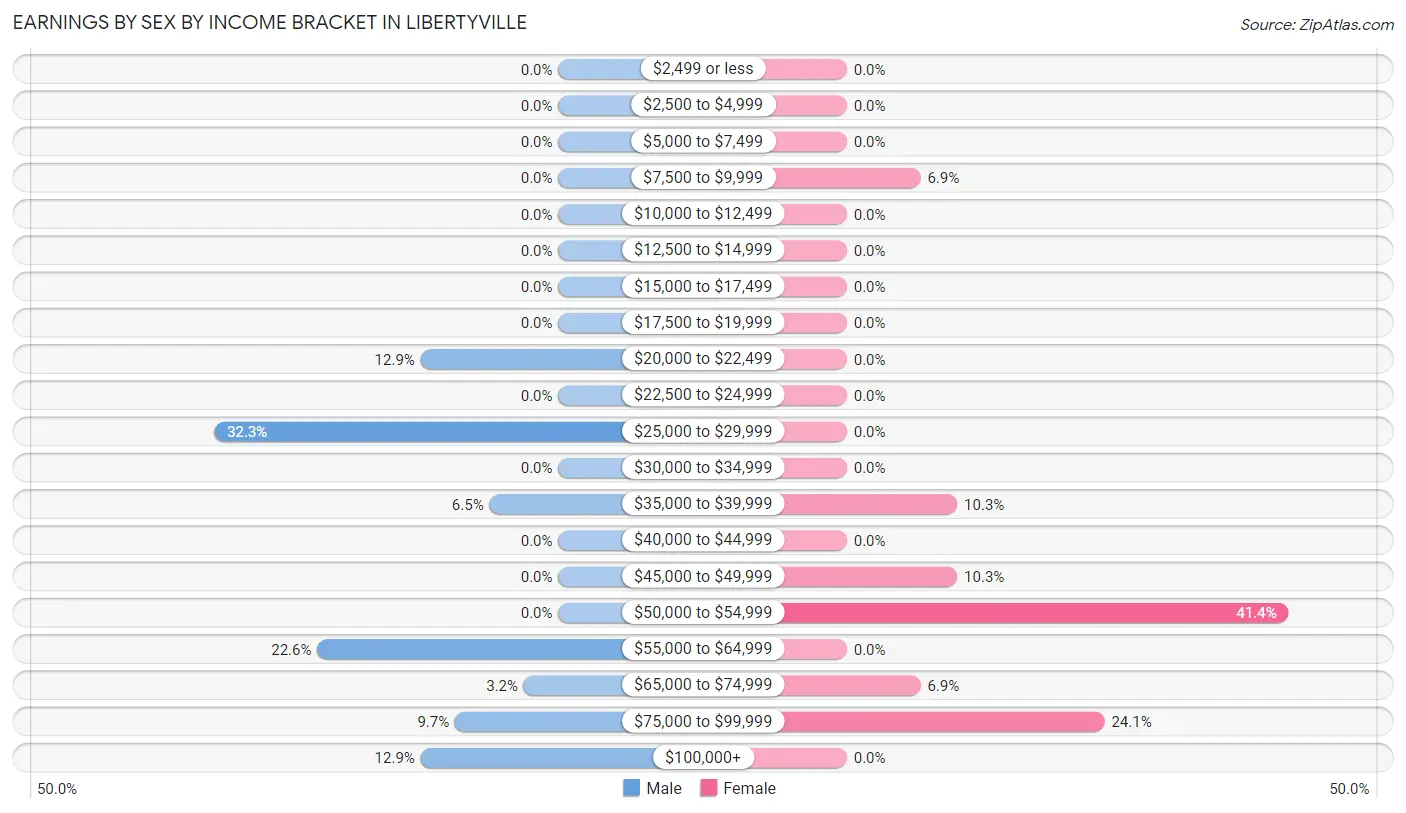
Earnings by Sex by Income Bracket in Libertyville
The most common earnings brackets in Libertyville are $25,000 to $29,999 for men (10 | 32.3%) and $50,000 to $54,999 for women (12 | 41.4%).
| Income | Male | Female |
| $2,499 or less | 0 (0.0%) | 0 (0.0%) |
| $2,500 to $4,999 | 0 (0.0%) | 0 (0.0%) |
| $5,000 to $7,499 | 0 (0.0%) | 0 (0.0%) |
| $7,500 to $9,999 | 0 (0.0%) | 2 (6.9%) |
| $10,000 to $12,499 | 0 (0.0%) | 0 (0.0%) |
| $12,500 to $14,999 | 0 (0.0%) | 0 (0.0%) |
| $15,000 to $17,499 | 0 (0.0%) | 0 (0.0%) |
| $17,500 to $19,999 | 0 (0.0%) | 0 (0.0%) |
| $20,000 to $22,499 | 4 (12.9%) | 0 (0.0%) |
| $22,500 to $24,999 | 0 (0.0%) | 0 (0.0%) |
| $25,000 to $29,999 | 10 (32.3%) | 0 (0.0%) |
| $30,000 to $34,999 | 0 (0.0%) | 0 (0.0%) |
| $35,000 to $39,999 | 2 (6.5%) | 3 (10.3%) |
| $40,000 to $44,999 | 0 (0.0%) | 0 (0.0%) |
| $45,000 to $49,999 | 0 (0.0%) | 3 (10.3%) |
| $50,000 to $54,999 | 0 (0.0%) | 12 (41.4%) |
| $55,000 to $64,999 | 7 (22.6%) | 0 (0.0%) |
| $65,000 to $74,999 | 1 (3.2%) | 2 (6.9%) |
| $75,000 to $99,999 | 3 (9.7%) | 7 (24.1%) |
| $100,000+ | 4 (12.9%) | 0 (0.0%) |
| Total | 31 (100.0%) | 29 (100.0%) |
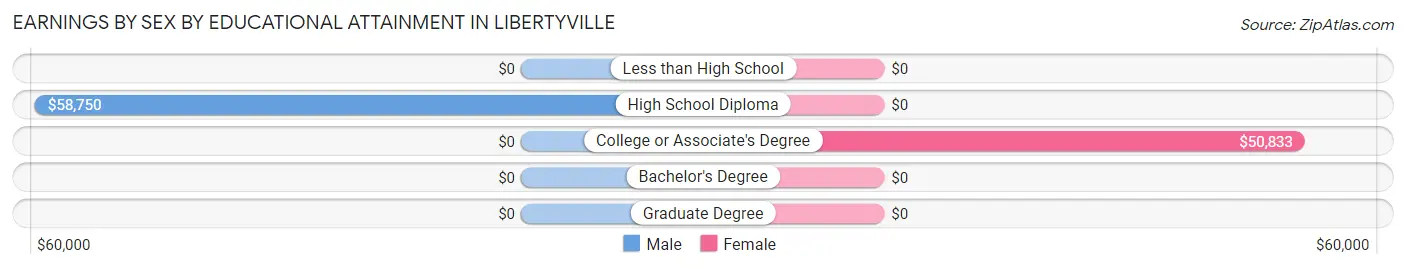
Earnings by Sex by Educational Attainment in Libertyville
Average earnings in Libertyville are $58,036 for men and $51,354 for women, a difference of 11.5%. Men with an educational attainment of high school diploma enjoy the highest average annual earnings of $58,750, while those with high school diploma education earn the least with $58,750. Women with an educational attainment of college or associate's degree earn the most with the average annual earnings of $50,833, while those with college or associate's degree education have the smallest earnings of $50,833.
| Educational Attainment | Male Income | Female Income |
| Less than High School | - | - |
| High School Diploma | $58,750 | $0 |
| College or Associate's Degree | - | - |
| Bachelor's Degree | - | - |
| Graduate Degree | - | - |
| Total | $58,036 | $51,354 |
Family Income in Libertyville
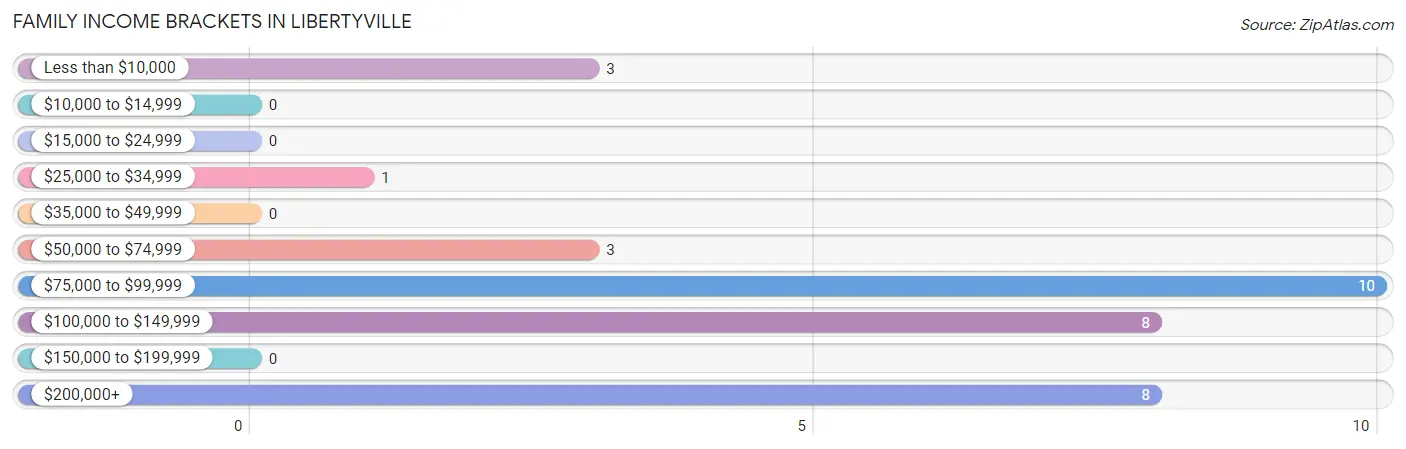
Family Income Brackets in Libertyville
According to the Libertyville family income data, there are 10 families falling into the $75,000 to $99,999 income range, which is the most common income bracket and makes up 30.3% of all families.
| Income Bracket | # Families | % Families |
| Less than $10,000 | 3 | 9.1% |
| $10,000 to $14,999 | 0 | 0.0% |
| $15,000 to $24,999 | 0 | 0.0% |
| $25,000 to $34,999 | 1 | 3.0% |
| $35,000 to $49,999 | 0 | 0.0% |
| $50,000 to $74,999 | 3 | 9.1% |
| $75,000 to $99,999 | 10 | 30.3% |
| $100,000 to $149,999 | 8 | 24.2% |
| $150,000 to $199,999 | 0 | 0.0% |
| $200,000+ | 8 | 24.2% |
Family Income by Famaliy Size in Libertyville
| Income Bracket | # Families | Median Income |
| 2-Person Families | 7 (21.2%) | $0 |
| 3-Person Families | 21 (63.6%) | $0 |
| 4-Person Families | 5 (15.1%) | $0 |
| 5-Person Families | 0 (0.0%) | $0 |
| 6-Person Families | 0 (0.0%) | $0 |
| 7+ Person Families | 0 (0.0%) | $0 |
| Total | 33 (100.0%) | $77,375 |
Family Income by Number of Earners in Libertyville
| Number of Earners | # Families | Median Income |
| No Earners | 4 (12.1%) | $0 |
| 1 Earner | 4 (12.1%) | $0 |
| 2 Earners | 25 (75.8%) | $0 |
| 3+ Earners | 0 (0.0%) | $0 |
| Total | 33 (100.0%) | $77,375 |
Household Income in Libertyville
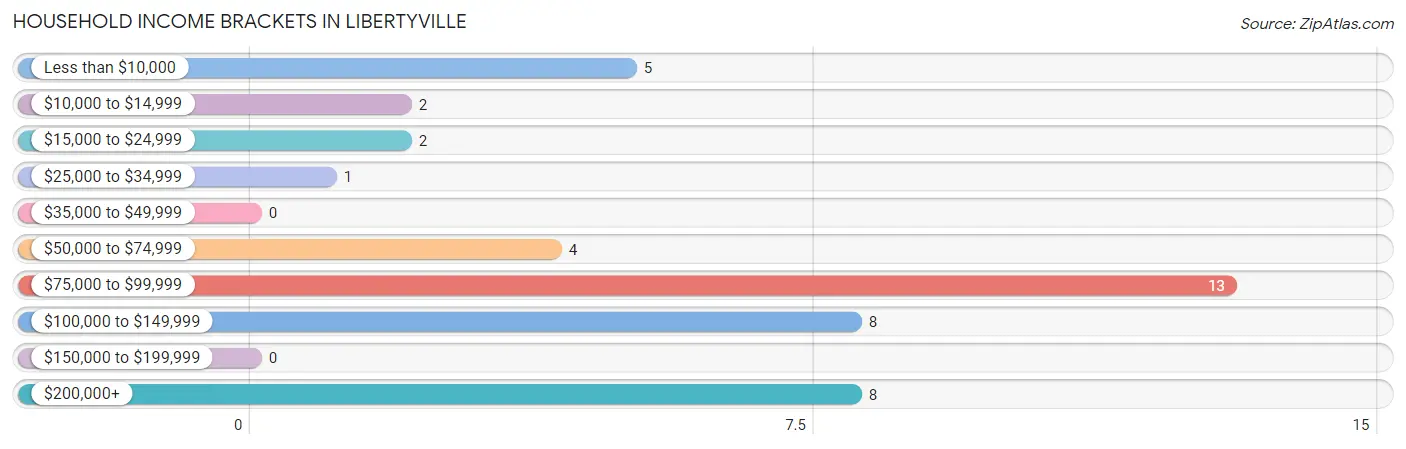
Household Income Brackets in Libertyville
With 13 households falling in the category, the $75,000 to $99,999 income range is the most frequent in Libertyville, accounting for 30.2% of all households.
| Income Bracket | # Households | % Households |
| Less than $10,000 | 5 | 11.6% |
| $10,000 to $14,999 | 2 | 4.7% |
| $15,000 to $24,999 | 2 | 4.7% |
| $25,000 to $34,999 | 1 | 2.3% |
| $35,000 to $49,999 | 0 | 0.0% |
| $50,000 to $74,999 | 4 | 9.3% |
| $75,000 to $99,999 | 13 | 30.2% |
| $100,000 to $149,999 | 8 | 18.6% |
| $150,000 to $199,999 | 0 | 0.0% |
| $200,000+ | 8 | 18.6% |
Household Income by Householder Age in Libertyville
The median household income in Libertyville is $76,875, with the highest median household income of $90,417 found in the 65+ years age bracket for the primary householder. A total of 7 households (16.3%) fall into this category.
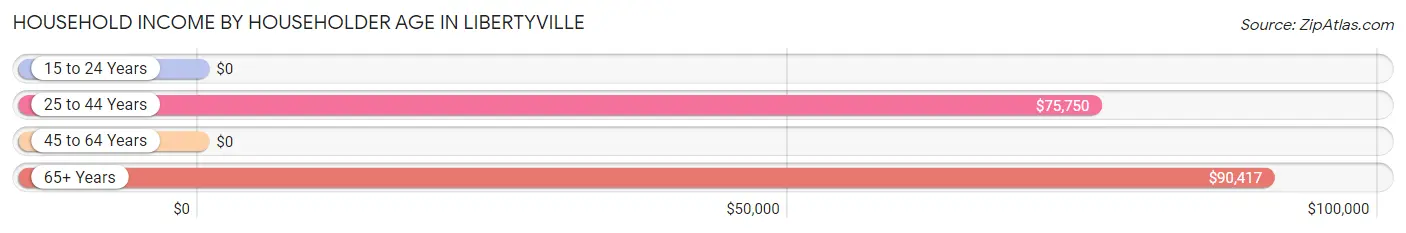
| Income Bracket | # Households | Median Income |
| 15 to 24 Years | 0 (0.0%) | $0 |
| 25 to 44 Years | 14 (32.6%) | $75,750 |
| 45 to 64 Years | 22 (51.2%) | $0 |
| 65+ Years | 7 (16.3%) | $90,417 |
| Total | 43 (100.0%) | $76,875 |
Poverty in Libertyville
Income Below Poverty by Sex and Age in Libertyville
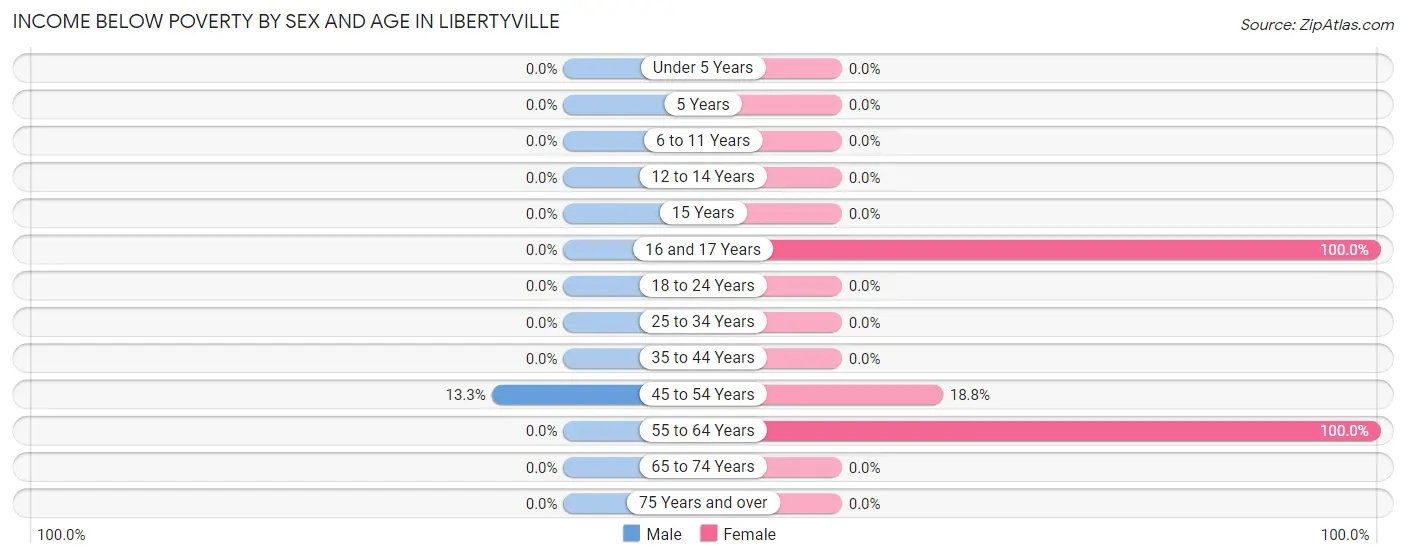
With 3.8% poverty level for males and 13.6% for females among the residents of Libertyville, 45 to 54 year old males and 16 and 17 year old females are the most vulnerable to poverty, with 2 males (13.3%) and 3 females (100.0%) in their respective age groups living below the poverty level.
| Age Bracket | Male | Female |
| Under 5 Years | 0 (0.0%) | 0 (0.0%) |
| 5 Years | 0 (0.0%) | 0 (0.0%) |
| 6 to 11 Years | 0 (0.0%) | 0 (0.0%) |
| 12 to 14 Years | 0 (0.0%) | 0 (0.0%) |
| 15 Years | 0 (0.0%) | 0 (0.0%) |
| 16 and 17 Years | 0 (0.0%) | 3 (100.0%) |
| 18 to 24 Years | 0 (0.0%) | 0 (0.0%) |
| 25 to 34 Years | 0 (0.0%) | 0 (0.0%) |
| 35 to 44 Years | 0 (0.0%) | 0 (0.0%) |
| 45 to 54 Years | 2 (13.3%) | 3 (18.8%) |
| 55 to 64 Years | 0 (0.0%) | 2 (100.0%) |
| 65 to 74 Years | 0 (0.0%) | 0 (0.0%) |
| 75 Years and over | 0 (0.0%) | 0 (0.0%) |
| Total | 2 (3.8%) | 8 (13.6%) |
Income Above Poverty by Sex and Age in Libertyville
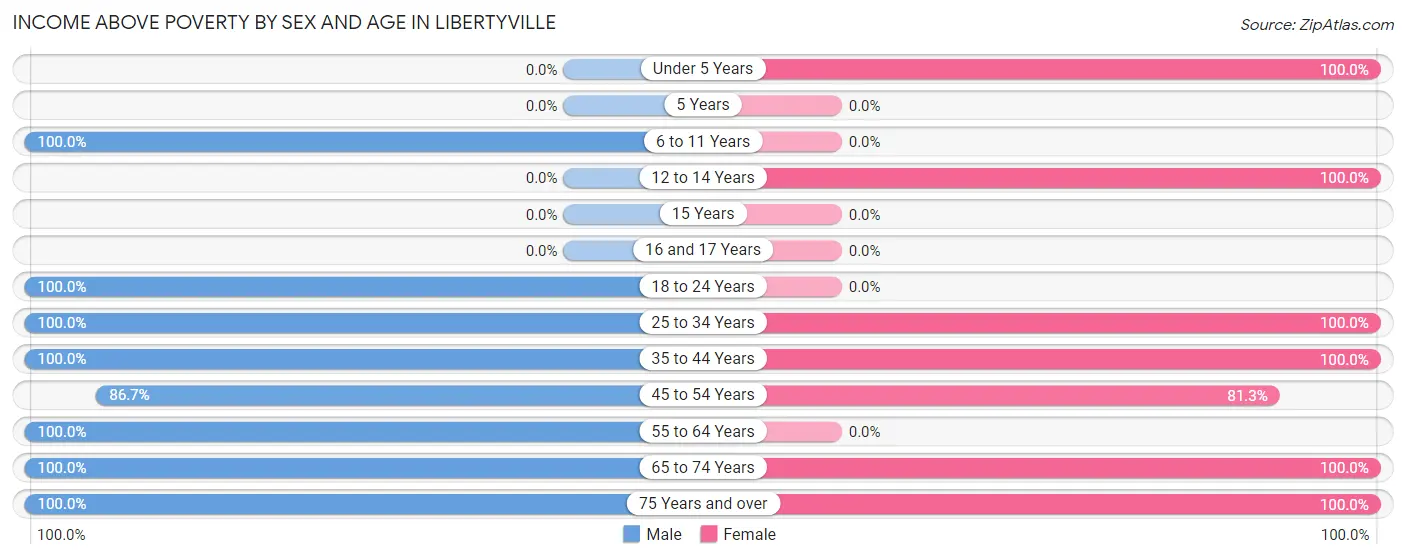
According to the poverty statistics in Libertyville, males aged 6 to 11 years and females aged under 5 years are the age groups that are most secure financially, with 100.0% of males and 100.0% of females in these age groups living above the poverty line.
| Age Bracket | Male | Female |
| Under 5 Years | 0 (0.0%) | 10 (100.0%) |
| 5 Years | 0 (0.0%) | 0 (0.0%) |
| 6 to 11 Years | 9 (100.0%) | 0 (0.0%) |
| 12 to 14 Years | 0 (0.0%) | 5 (100.0%) |
| 15 Years | 0 (0.0%) | 0 (0.0%) |
| 16 and 17 Years | 0 (0.0%) | 0 (0.0%) |
| 18 to 24 Years | 4 (100.0%) | 0 (0.0%) |
| 25 to 34 Years | 10 (100.0%) | 12 (100.0%) |
| 35 to 44 Years | 1 (100.0%) | 6 (100.0%) |
| 45 to 54 Years | 13 (86.7%) | 13 (81.2%) |
| 55 to 64 Years | 6 (100.0%) | 0 (0.0%) |
| 65 to 74 Years | 2 (100.0%) | 2 (100.0%) |
| 75 Years and over | 5 (100.0%) | 3 (100.0%) |
| Total | 50 (96.2%) | 51 (86.4%) |
Income Below Poverty Among Married-Couple Families in Libertyville
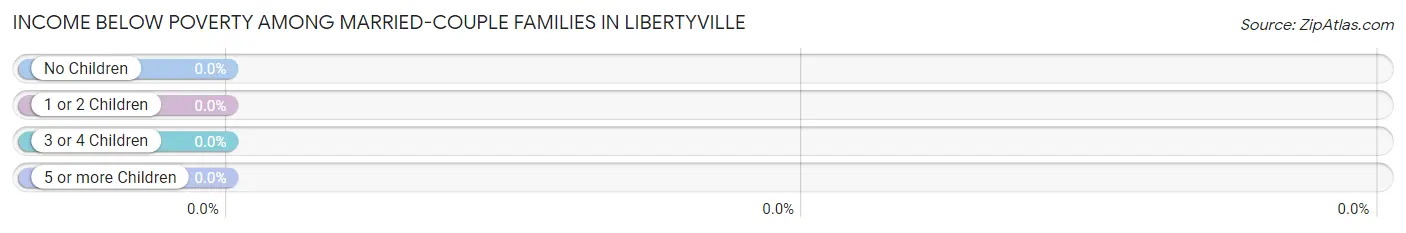
| Children | Above Poverty | Below Poverty |
| No Children | 7 (100.0%) | 0 (0.0%) |
| 1 or 2 Children | 20 (100.0%) | 0 (0.0%) |
| 3 or 4 Children | 0 (0.0%) | 0 (0.0%) |
| 5 or more Children | 0 (0.0%) | 0 (0.0%) |
| Total | 27 (100.0%) | 0 (0.0%) |
Income Below Poverty Among Single-Parent Households in Libertyville
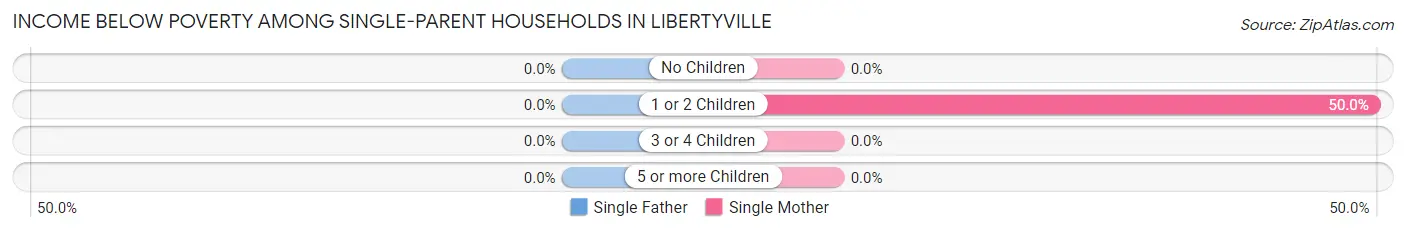
| Children | Single Father | Single Mother |
| No Children | 0 (0.0%) | 0 (0.0%) |
| 1 or 2 Children | 0 (0.0%) | 3 (50.0%) |
| 3 or 4 Children | 0 (0.0%) | 0 (0.0%) |
| 5 or more Children | 0 (0.0%) | 0 (0.0%) |
| Total | 0 (0.0%) | 3 (50.0%) |
Income Below Poverty Among Married-Couple vs Single-Parent Households in Libertyville
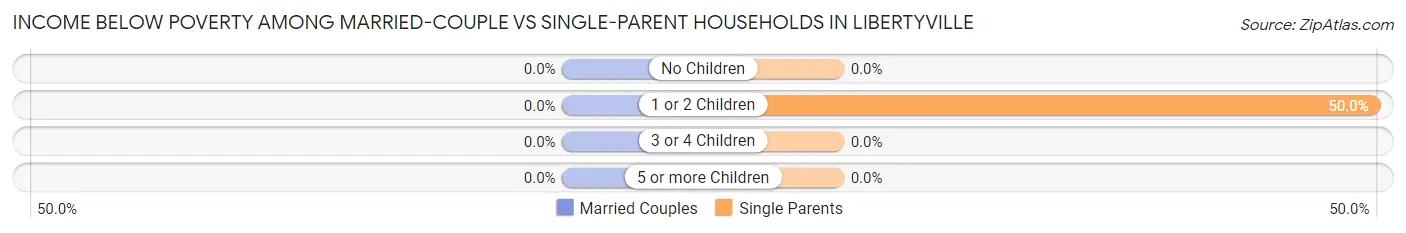
| Children | Married-Couple Families | Single-Parent Households |
| No Children | 0 (0.0%) | 0 (0.0%) |
| 1 or 2 Children | 0 (0.0%) | 3 (50.0%) |
| 3 or 4 Children | 0 (0.0%) | 0 (0.0%) |
| 5 or more Children | 0 (0.0%) | 0 (0.0%) |
| Total | 0 (0.0%) | 3 (50.0%) |
Race in Libertyville
The most populous races in Libertyville are White / Caucasian (104 | 93.7%), Two or more Races (7 | 6.3%), and Hispanic or Latino (1 | 0.9%).
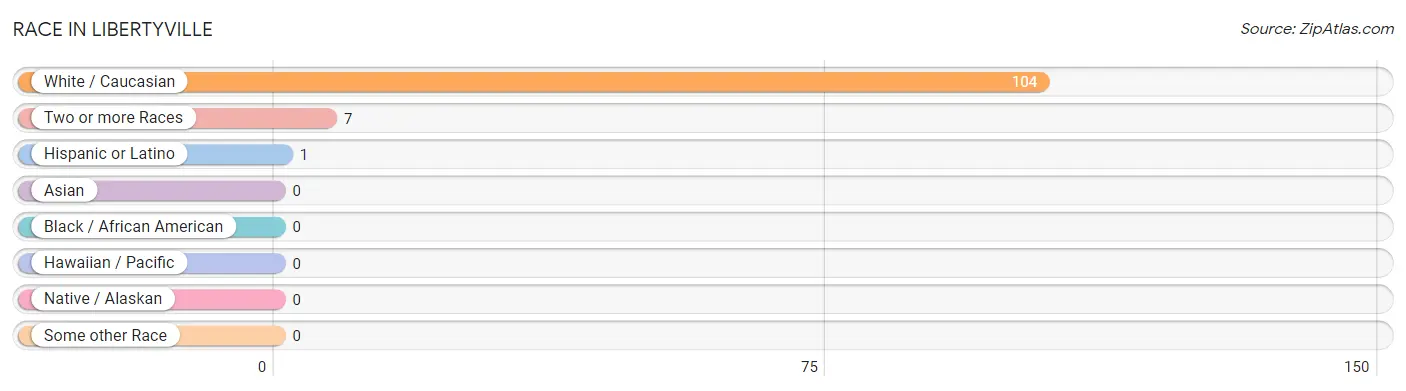
| Race | # Population | % Population |
| Asian | 0 | 0.0% |
| Black / African American | 0 | 0.0% |
| Hawaiian / Pacific | 0 | 0.0% |
| Hispanic or Latino | 1 | 0.9% |
| Native / Alaskan | 0 | 0.0% |
| White / Caucasian | 104 | 93.7% |
| Two or more Races | 7 | 6.3% |
| Some other Race | 0 | 0.0% |
| Total | 111 | 100.0% |
Ancestry in Libertyville
The most populous ancestries reported in Libertyville are French (7 | 6.3%), Cherokee (6 | 5.4%), Irish (6 | 5.4%), American (5 | 4.5%), and German (5 | 4.5%), together accounting for 26.1% of all Libertyville residents.
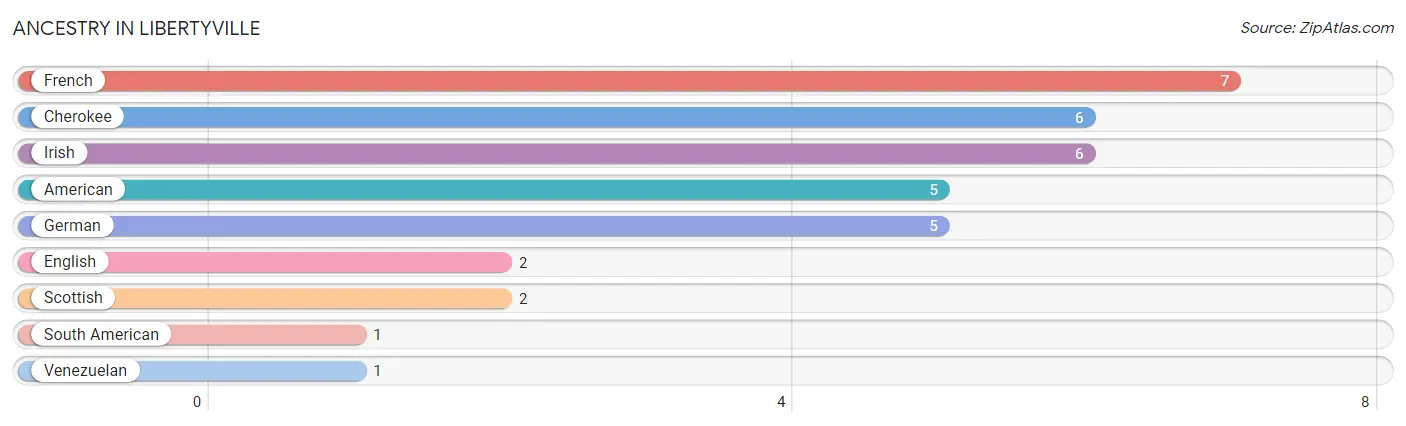
| Ancestry | # Population | % Population |
| American | 5 | 4.5% |
| Cherokee | 6 | 5.4% |
| English | 2 | 1.8% |
| French | 7 | 6.3% |
| German | 5 | 4.5% |
| Irish | 6 | 5.4% |
| Scottish | 2 | 1.8% |
| South American | 1 | 0.9% |
| Venezuelan | 1 | 0.9% | View All 9 Rows |
Immigrants in Libertyville
The most numerous immigrant groups reported in Libertyville came from Latin America (1 | 0.9%), South America (1 | 0.9%), and Venezuela (1 | 0.9%), together accounting for 2.7% of all Libertyville residents.
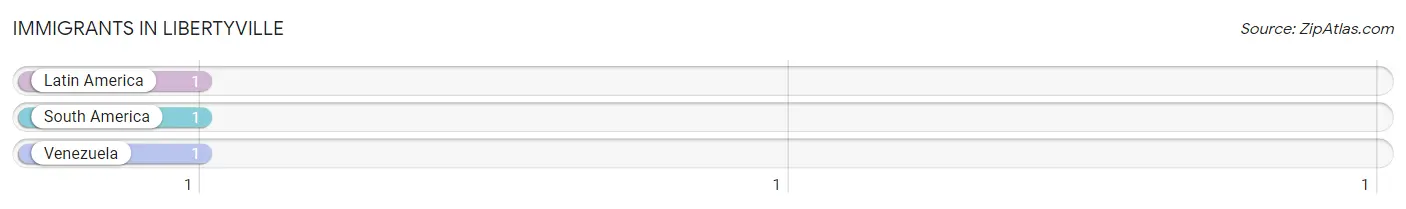
| Immigration Origin | # Population | % Population |
| Latin America | 1 | 0.9% |
| South America | 1 | 0.9% |
| Venezuela | 1 | 0.9% | View All 3 Rows |
Sex and Age in Libertyville
Sex and Age in Libertyville
The most populous age groups in Libertyville are 25 to 29 Years (10 | 19.2%) for men and 30 to 34 Years (12 | 20.3%) for women.
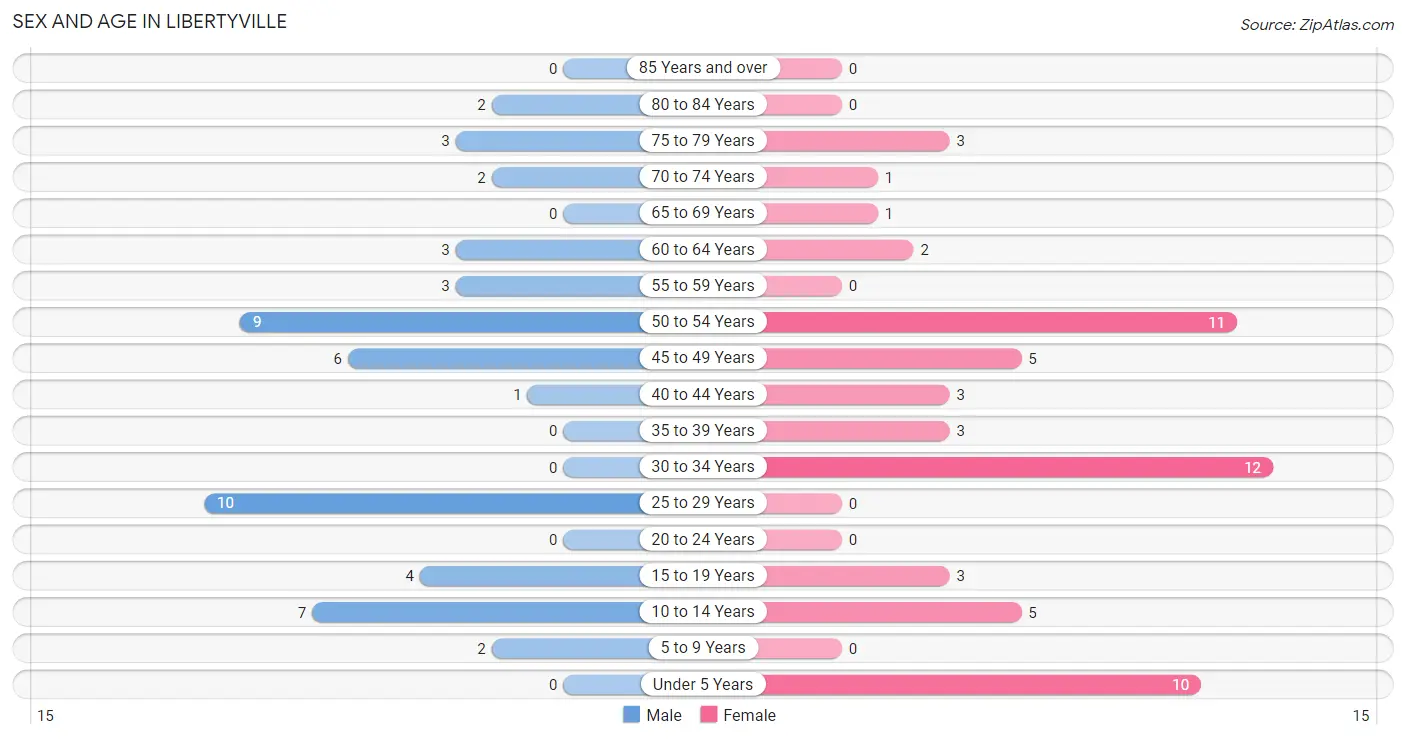
| Age Bracket | Male | Female |
| Under 5 Years | 0 (0.0%) | 10 (17.0%) |
| 5 to 9 Years | 2 (3.8%) | 0 (0.0%) |
| 10 to 14 Years | 7 (13.5%) | 5 (8.5%) |
| 15 to 19 Years | 4 (7.7%) | 3 (5.1%) |
| 20 to 24 Years | 0 (0.0%) | 0 (0.0%) |
| 25 to 29 Years | 10 (19.2%) | 0 (0.0%) |
| 30 to 34 Years | 0 (0.0%) | 12 (20.3%) |
| 35 to 39 Years | 0 (0.0%) | 3 (5.1%) |
| 40 to 44 Years | 1 (1.9%) | 3 (5.1%) |
| 45 to 49 Years | 6 (11.5%) | 5 (8.5%) |
| 50 to 54 Years | 9 (17.3%) | 11 (18.6%) |
| 55 to 59 Years | 3 (5.8%) | 0 (0.0%) |
| 60 to 64 Years | 3 (5.8%) | 2 (3.4%) |
| 65 to 69 Years | 0 (0.0%) | 1 (1.7%) |
| 70 to 74 Years | 2 (3.8%) | 1 (1.7%) |
| 75 to 79 Years | 3 (5.8%) | 3 (5.1%) |
| 80 to 84 Years | 2 (3.8%) | 0 (0.0%) |
| 85 Years and over | 0 (0.0%) | 0 (0.0%) |
| Total | 52 (100.0%) | 59 (100.0%) |
Families and Households in Libertyville
Median Family Size in Libertyville
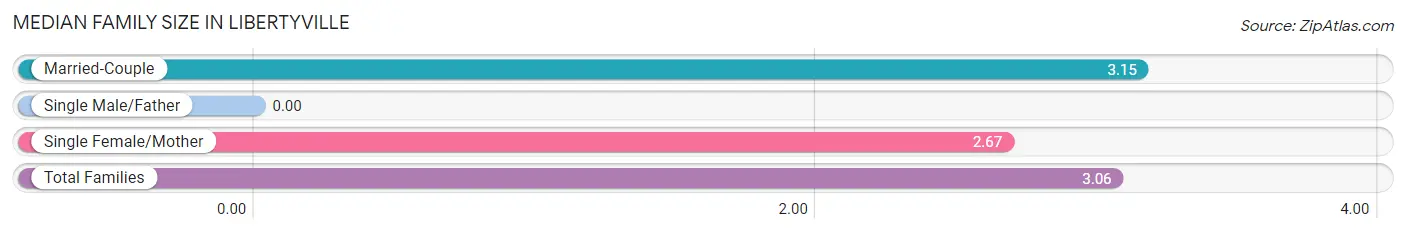
| Family Type | # Families | Family Size |
| Married-Couple | 27 (81.8%) | 3.15 |
| Single Male/Father | 0 (0.0%) | - |
| Single Female/Mother | 6 (18.2%) | 2.67 |
| Total Families | 33 (100.0%) | 3.06 |
Median Household Size in Libertyville
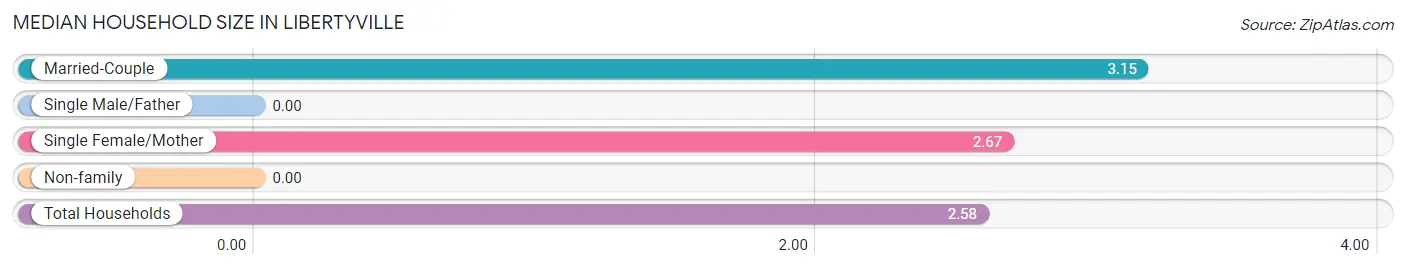
| Household Type | # Households | Household Size |
| Married-Couple | 27 (62.8%) | 3.15 |
| Single Male/Father | 0 (0.0%) | - |
| Single Female/Mother | 6 (14.0%) | 2.67 |
| Non-family | 10 (23.3%) | - |
| Total Households | 43 (100.0%) | 2.58 |
Household Size by Marriage Status in Libertyville
Out of a total of 43 households in Libertyville, 33 (76.7%) are family households, while 10 (23.3%) are nonfamily households. The most numerous type of family households are 3-person households, comprising 21, and the most common type of nonfamily households are 1-person households, comprising 10.
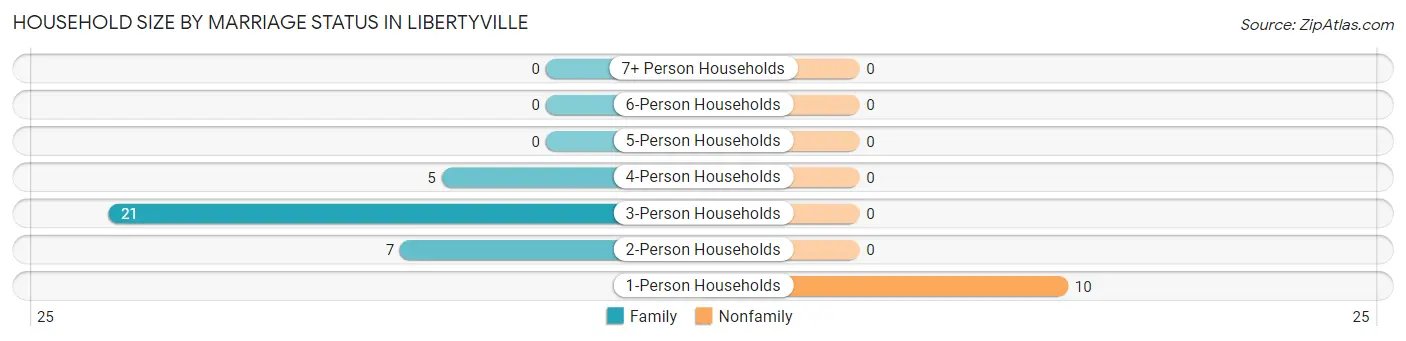
| Household Size | Family Households | Nonfamily Households |
| 1-Person Households | - | 10 (23.3%) |
| 2-Person Households | 7 (16.3%) | 0 (0.0%) |
| 3-Person Households | 21 (48.8%) | 0 (0.0%) |
| 4-Person Households | 5 (11.6%) | 0 (0.0%) |
| 5-Person Households | 0 (0.0%) | 0 (0.0%) |
| 6-Person Households | 0 (0.0%) | 0 (0.0%) |
| 7+ Person Households | 0 (0.0%) | 0 (0.0%) |
| Total | 33 (76.7%) | 10 (23.3%) |
Female Fertility in Libertyville
Fertility by Age in Libertyville
| Age Bracket | Women with Births | Births / 1,000 Women |
| 15 to 19 years | 0 (0.0%) | 0.0 |
| 20 to 34 years | 0 (0.0%) | 0.0 |
| 35 to 50 years | 0 (0.0%) | 0.0 |
| Total | 0 (0.0%) | 0.0 |
Fertility by Age by Marriage Status in Libertyville
| Age Bracket | Married | Unmarried |
| 15 to 19 years | 0 (0.0%) | 0 (0.0%) |
| 20 to 34 years | 0 (0.0%) | 0 (0.0%) |
| 35 to 50 years | 0 (0.0%) | 0 (0.0%) |
| Total | 0 (0.0%) | 0 (0.0%) |
Fertility by Education in Libertyville
| Educational Attainment | Women with Births | Births / 1,000 Women |
| Less than High School | 0 (0.0%) | 0.0 |
| High School Diploma | 0 (0.0%) | 0.0 |
| College or Associate's Degree | 0 (0.0%) | 0.0 |
| Bachelor's Degree | 0 (0.0%) | 0.0 |
| Graduate Degree | 0 (0.0%) | 0.0 |
| Total | 0 (0.0%) | 0.0 |
Fertility by Education by Marriage Status in Libertyville
| Educational Attainment | Married | Unmarried |
| Less than High School | 0 (0.0%) | 0 (0.0%) |
| High School Diploma | 0 (0.0%) | 0 (0.0%) |
| College or Associate's Degree | 0 (0.0%) | 0 (0.0%) |
| Bachelor's Degree | 0 (0.0%) | 0 (0.0%) |
| Graduate Degree | 0 (0.0%) | 0 (0.0%) |
| Total | 0 (0.0%) | 0 (0.0%) |
Employment Characteristics in Libertyville
Employment by Class of Employer in Libertyville
Among the 60 employed individuals in Libertyville, private company employees (46 | 76.7%), self-employed (not incorporated) (12 | 20.0%), and federal government employees (2 | 3.3%) make up the most common classes of employment.
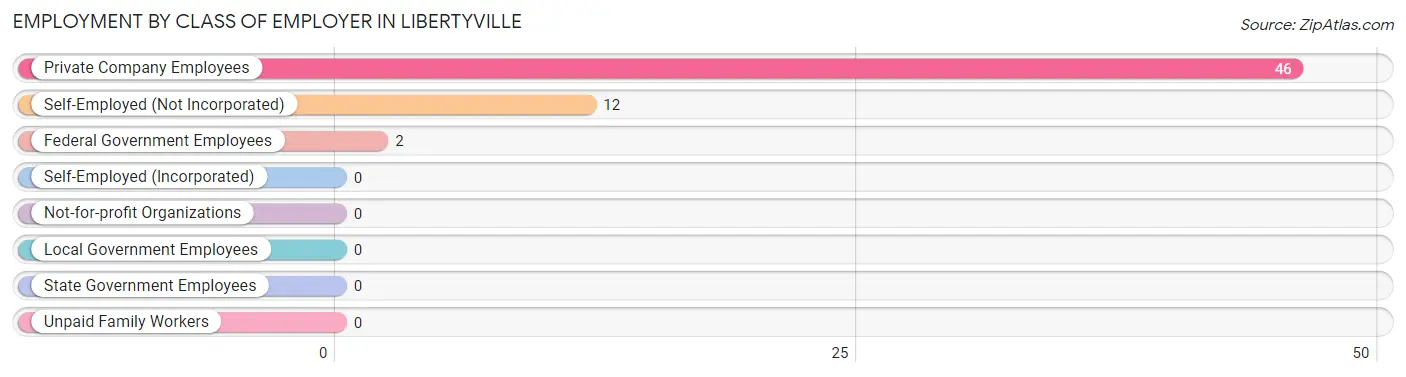
| Employer Class | # Employees | % Employees |
| Private Company Employees | 46 | 76.7% |
| Self-Employed (Incorporated) | 0 | 0.0% |
| Self-Employed (Not Incorporated) | 12 | 20.0% |
| Not-for-profit Organizations | 0 | 0.0% |
| Local Government Employees | 0 | 0.0% |
| State Government Employees | 0 | 0.0% |
| Federal Government Employees | 2 | 3.3% |
| Unpaid Family Workers | 0 | 0.0% |
| Total | 60 | 100.0% |
Employment Status by Age in Libertyville
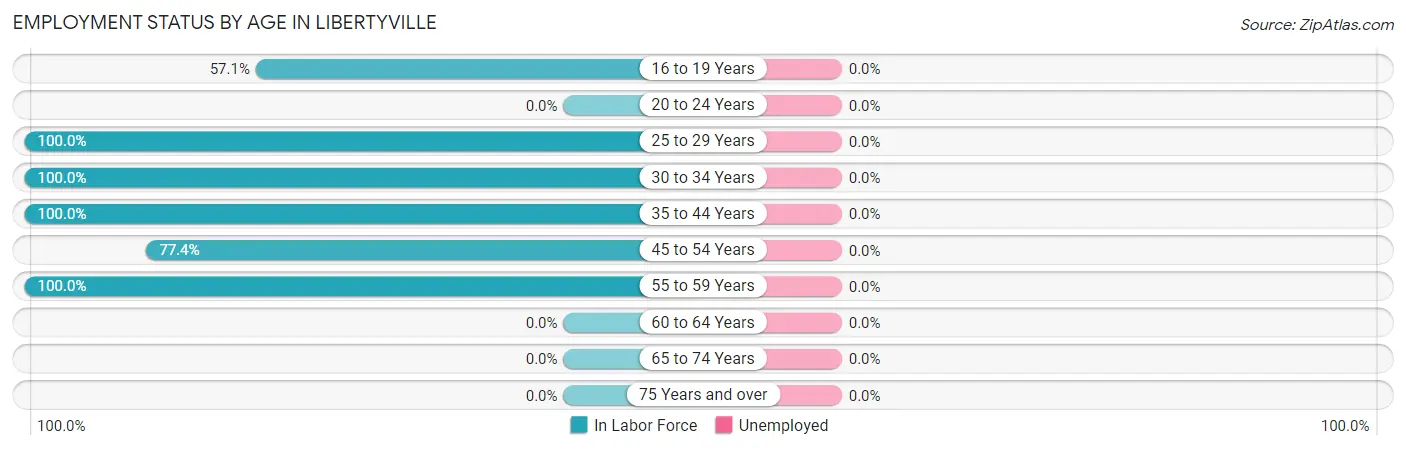
| Age Bracket | In Labor Force | Unemployed |
| 16 to 19 Years | 4 (57.1%) | 0 (0.0%) |
| 20 to 24 Years | 0 (0.0%) | 0 (0.0%) |
| 25 to 29 Years | 10 (100.0%) | 0 (0.0%) |
| 30 to 34 Years | 12 (100.0%) | 0 (0.0%) |
| 35 to 44 Years | 7 (100.0%) | 0 (0.0%) |
| 45 to 54 Years | 24 (77.4%) | 0 (0.0%) |
| 55 to 59 Years | 3 (100.0%) | 0 (0.0%) |
| 60 to 64 Years | 0 (0.0%) | 0 (0.0%) |
| 65 to 74 Years | 0 (0.0%) | 0 (0.0%) |
| 75 Years and over | 0 (0.0%) | 0 (0.0%) |
| Total | 60 (69.0%) | 0 (0.0%) |
Employment Status by Educational Attainment in Libertyville
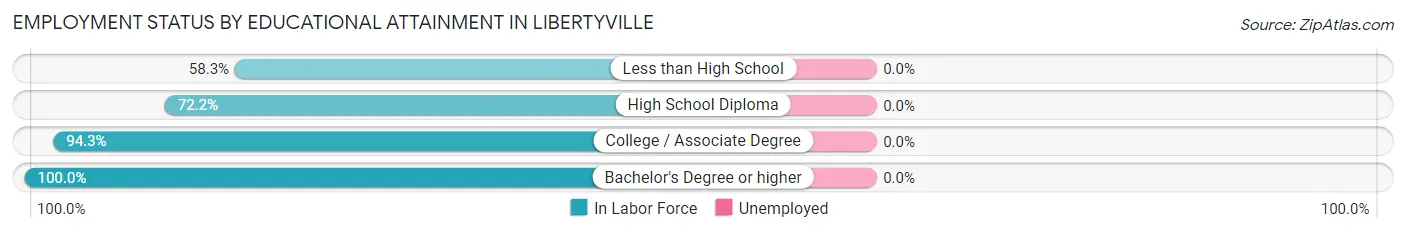
| Educational Attainment | In Labor Force | Unemployed |
| Less than High School | 7 (58.3%) | 0 (0.0%) |
| High School Diploma | 13 (72.2%) | 0 (0.0%) |
| College / Associate Degree | 33 (94.3%) | 0 (0.0%) |
| Bachelor's Degree or higher | 3 (100.0%) | 0 (0.0%) |
| Total | 56 (82.4%) | 0 (0.0%) |
Employment Occupations by Sex in Libertyville
Management, Business, Science and Arts Occupations
The most common Management, Business, Science and Arts occupations in Libertyville are Business & Financial (2 | 3.4%), Computers, Engineering & Science (2 | 3.4%), and Architecture & Engineering (2 | 3.4%).
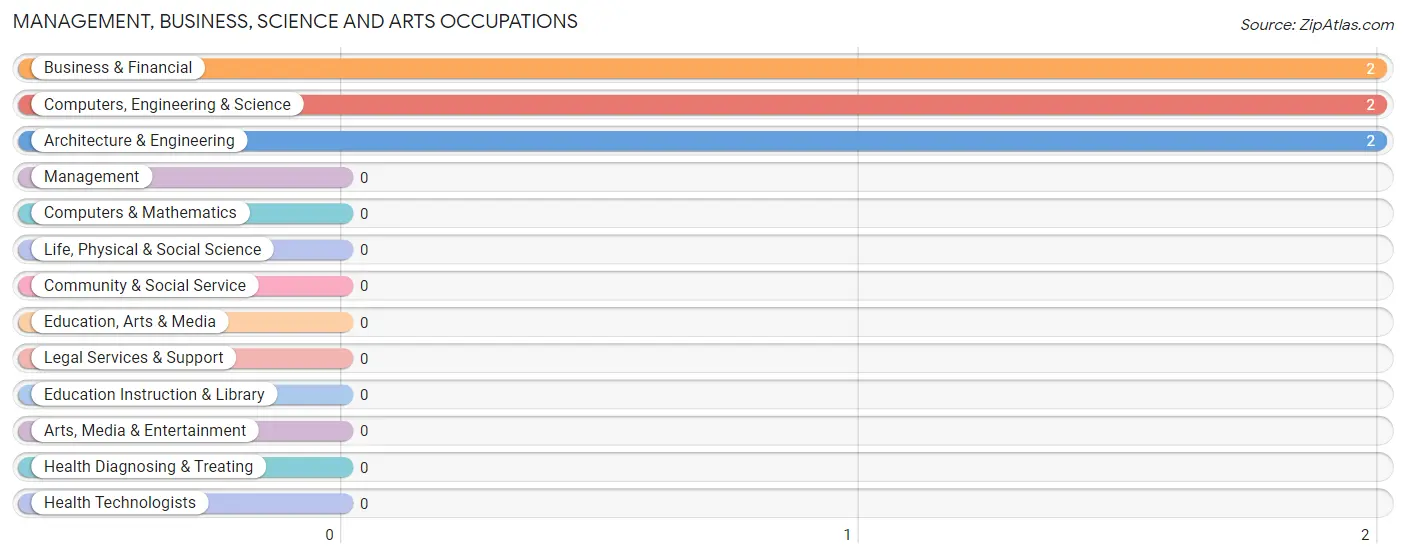
Management, Business, Science and Arts Occupations by Sex
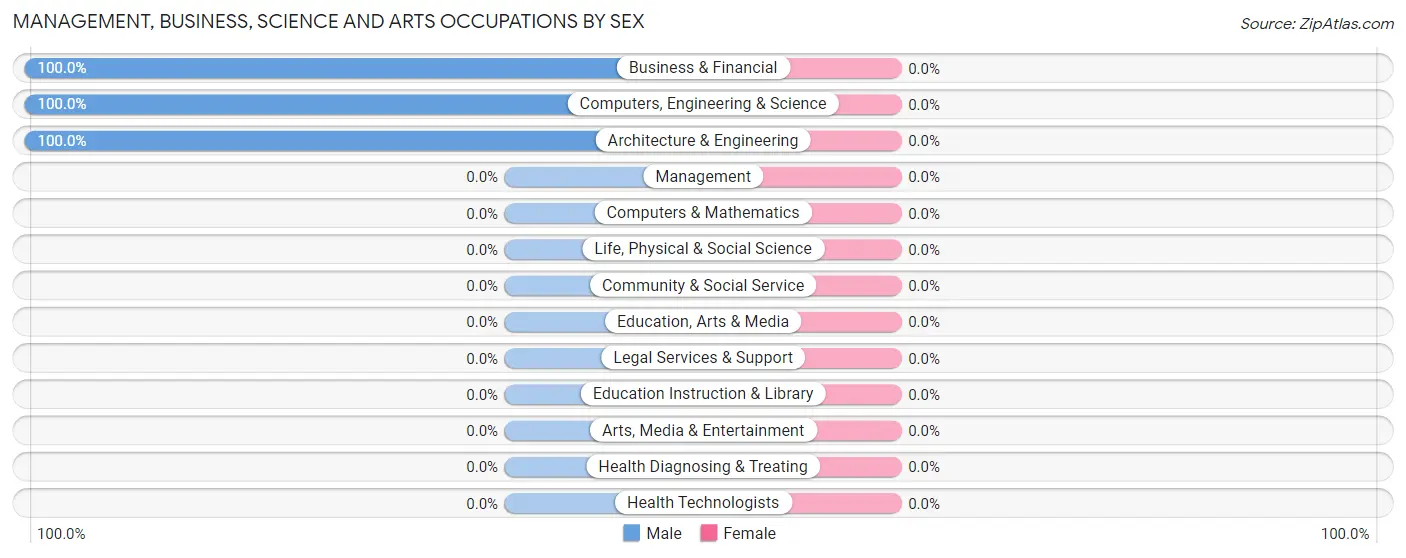
| Occupation | Male | Female |
| Management | 0 (0.0%) | 0 (0.0%) |
| Business & Financial | 2 (100.0%) | 0 (0.0%) |
| Computers, Engineering & Science | 2 (100.0%) | 0 (0.0%) |
| Computers & Mathematics | 0 (0.0%) | 0 (0.0%) |
| Architecture & Engineering | 2 (100.0%) | 0 (0.0%) |
| Life, Physical & Social Science | 0 (0.0%) | 0 (0.0%) |
| Community & Social Service | 0 (0.0%) | 0 (0.0%) |
| Education, Arts & Media | 0 (0.0%) | 0 (0.0%) |
| Legal Services & Support | 0 (0.0%) | 0 (0.0%) |
| Education Instruction & Library | 0 (0.0%) | 0 (0.0%) |
| Arts, Media & Entertainment | 0 (0.0%) | 0 (0.0%) |
| Health Diagnosing & Treating | 0 (0.0%) | 0 (0.0%) |
| Health Technologists | 0 (0.0%) | 0 (0.0%) |
| Total (Category) | 4 (100.0%) | 0 (0.0%) |
| Total (Overall) | 30 (50.8%) | 29 (49.1%) |
Services Occupations
The most common Services occupations in Libertyville are , and Healthcare Support (3 | 5.1%).
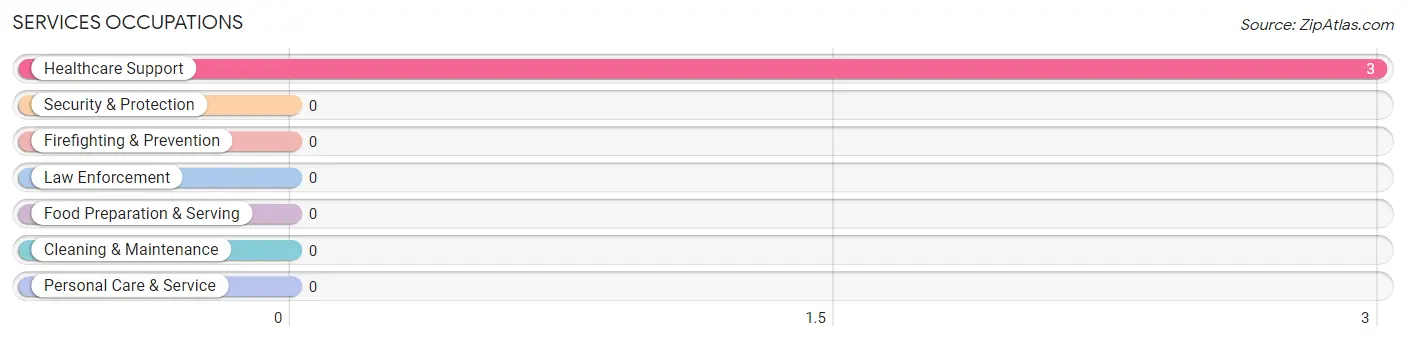
Services Occupations by Sex
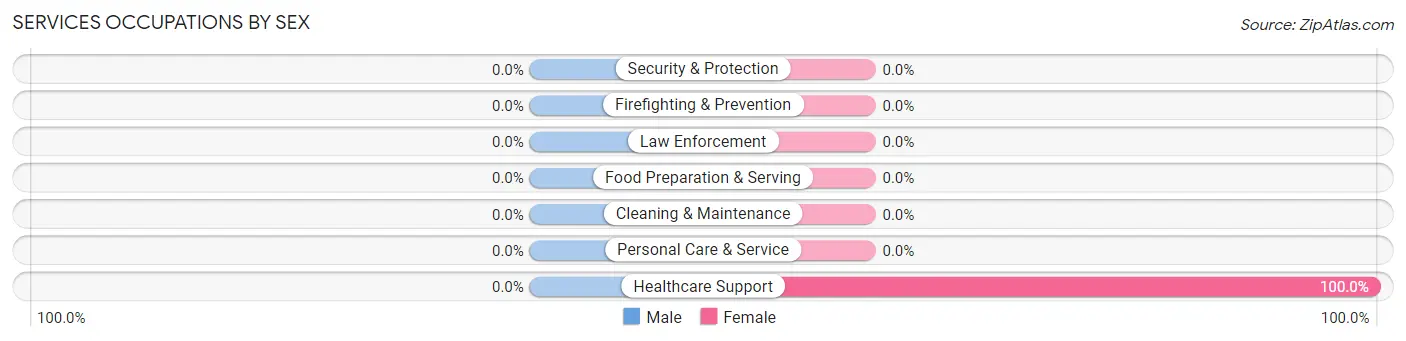
| Occupation | Male | Female |
| Healthcare Support | 0 (0.0%) | 3 (100.0%) |
| Security & Protection | 0 (0.0%) | 0 (0.0%) |
| Firefighting & Prevention | 0 (0.0%) | 0 (0.0%) |
| Law Enforcement | 0 (0.0%) | 0 (0.0%) |
| Food Preparation & Serving | 0 (0.0%) | 0 (0.0%) |
| Cleaning & Maintenance | 0 (0.0%) | 0 (0.0%) |
| Personal Care & Service | 0 (0.0%) | 0 (0.0%) |
| Total (Category) | 0 (0.0%) | 3 (100.0%) |
| Total (Overall) | 30 (50.8%) | 29 (49.1%) |
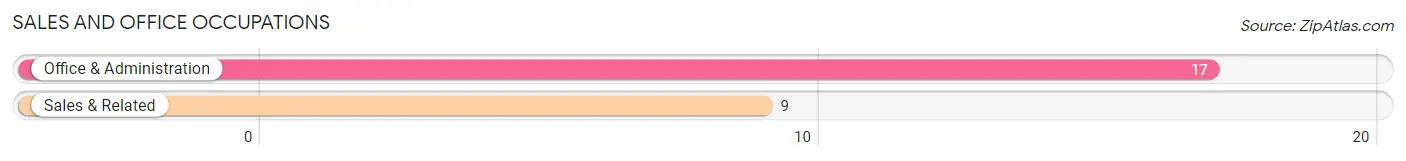
Sales and Office Occupations
The most common Sales and Office occupations in Libertyville are Office & Administration (17 | 28.8%), and Sales & Related (9 | 15.2%).
Sales and Office Occupations by Sex

| Occupation | Male | Female |
| Sales & Related | 0 (0.0%) | 9 (100.0%) |
| Office & Administration | 0 (0.0%) | 17 (100.0%) |
| Total (Category) | 0 (0.0%) | 26 (100.0%) |
| Total (Overall) | 30 (50.8%) | 29 (49.1%) |
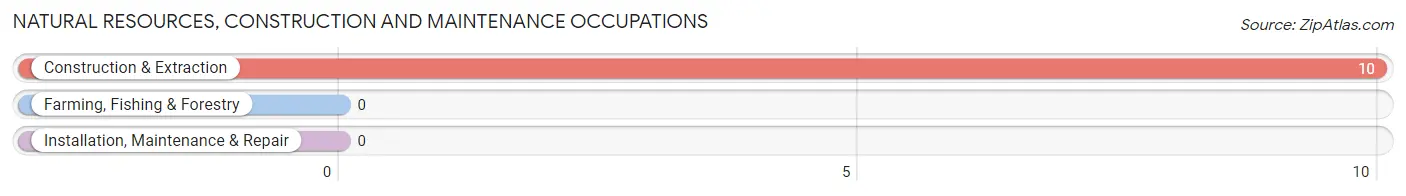
Natural Resources, Construction and Maintenance Occupations
The most common Natural Resources, Construction and Maintenance occupations in Libertyville are , and Construction & Extraction (10 | 17.0%).
Natural Resources, Construction and Maintenance Occupations by Sex

| Occupation | Male | Female |
| Farming, Fishing & Forestry | 0 (0.0%) | 0 (0.0%) |
| Construction & Extraction | 10 (100.0%) | 0 (0.0%) |
| Installation, Maintenance & Repair | 0 (0.0%) | 0 (0.0%) |
| Total (Category) | 10 (100.0%) | 0 (0.0%) |
| Total (Overall) | 30 (50.8%) | 29 (49.1%) |
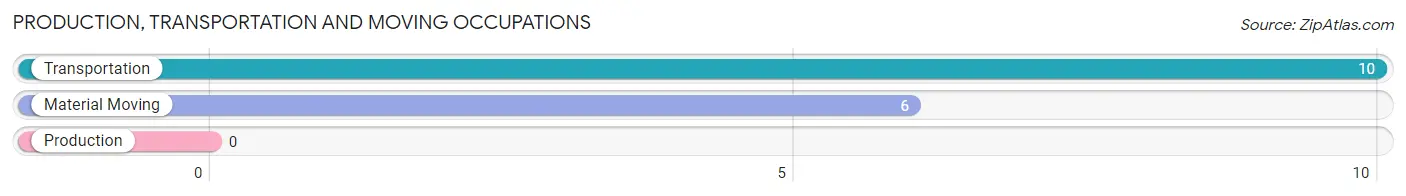
Production, Transportation and Moving Occupations
The most common Production, Transportation and Moving occupations in Libertyville are Transportation (10 | 17.0%), and Material Moving (6 | 10.2%).
Production, Transportation and Moving Occupations by Sex
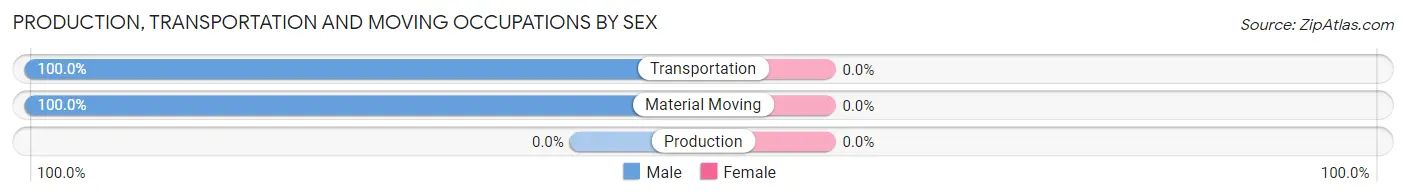
| Occupation | Male | Female |
| Production | 0 (0.0%) | 0 (0.0%) |
| Transportation | 10 (100.0%) | 0 (0.0%) |
| Material Moving | 6 (100.0%) | 0 (0.0%) |
| Total (Category) | 16 (100.0%) | 0 (0.0%) |
| Total (Overall) | 30 (50.8%) | 29 (49.1%) |
Employment Industries by Sex in Libertyville
Employment Industries in Libertyville
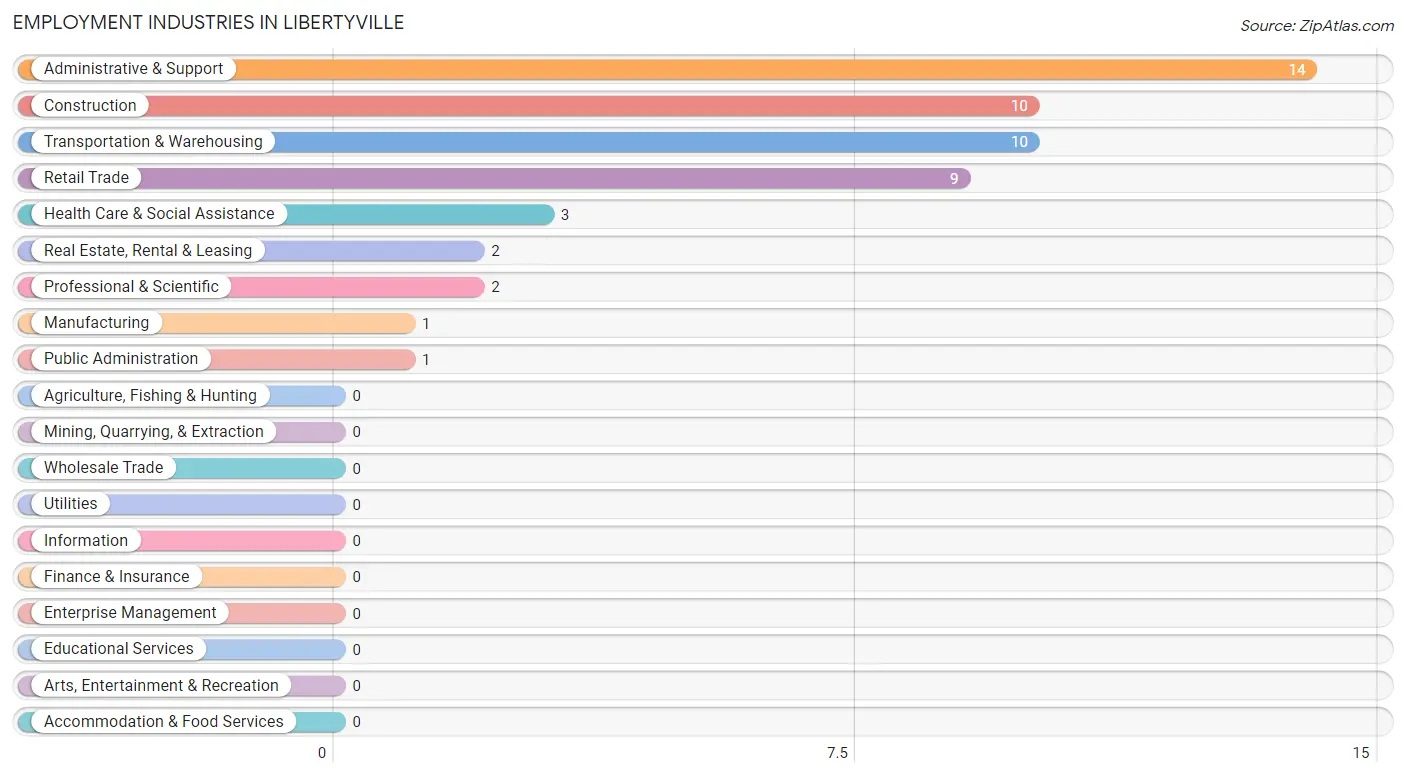
The major employment industries in Libertyville include Administrative & Support (14 | 23.7%), Construction (10 | 17.0%), Transportation & Warehousing (10 | 17.0%), Retail Trade (9 | 15.2%), and Health Care & Social Assistance (3 | 5.1%).
Employment Industries by Sex in Libertyville
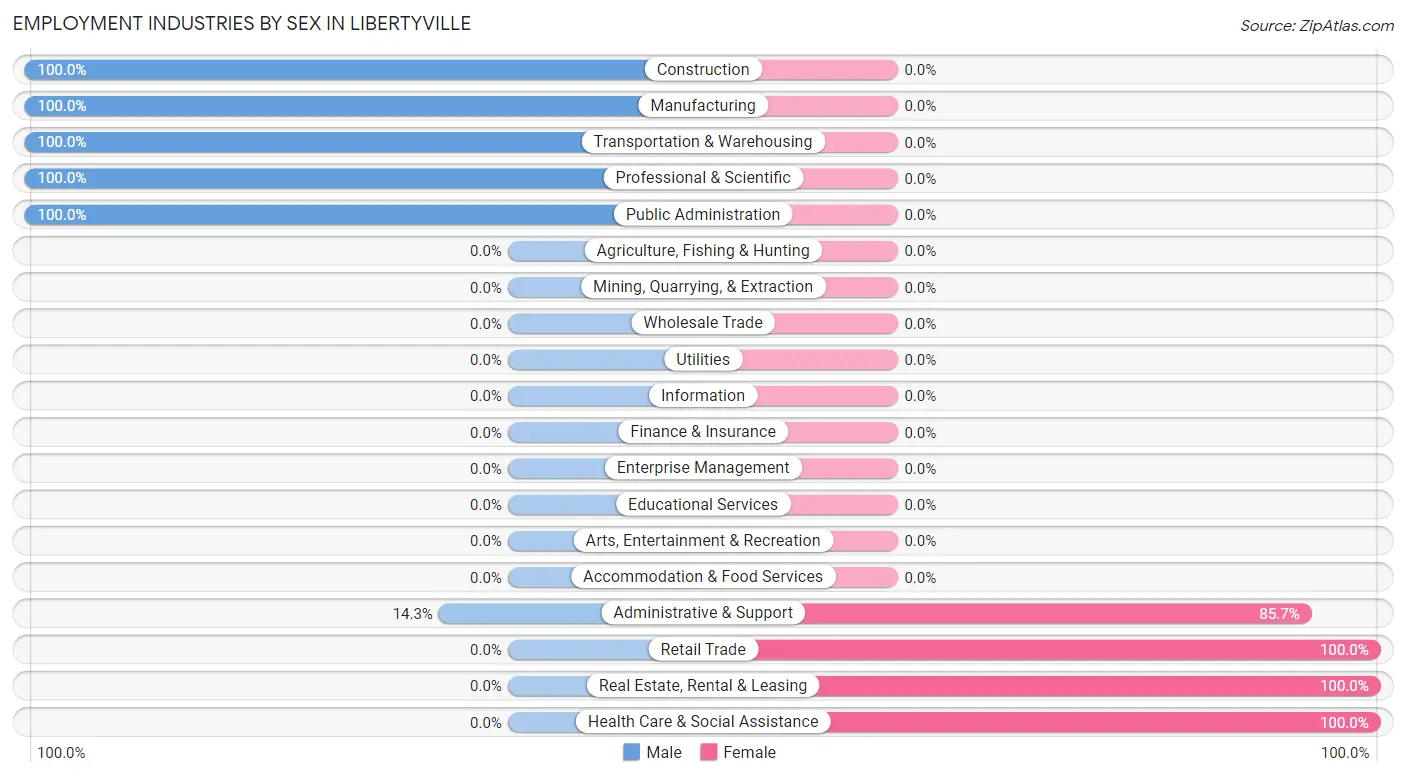
The Libertyville industries that see more men than women are Construction (100.0%), Manufacturing (100.0%), and Transportation & Warehousing (100.0%), whereas the industries that tend to have a higher number of women are Retail Trade (100.0%), Real Estate, Rental & Leasing (100.0%), and Health Care & Social Assistance (100.0%).
| Industry | Male | Female |
| Agriculture, Fishing & Hunting | 0 (0.0%) | 0 (0.0%) |
| Mining, Quarrying, & Extraction | 0 (0.0%) | 0 (0.0%) |
| Construction | 10 (100.0%) | 0 (0.0%) |
| Manufacturing | 1 (100.0%) | 0 (0.0%) |
| Wholesale Trade | 0 (0.0%) | 0 (0.0%) |
| Retail Trade | 0 (0.0%) | 9 (100.0%) |
| Transportation & Warehousing | 10 (100.0%) | 0 (0.0%) |
| Utilities | 0 (0.0%) | 0 (0.0%) |
| Information | 0 (0.0%) | 0 (0.0%) |
| Finance & Insurance | 0 (0.0%) | 0 (0.0%) |
| Real Estate, Rental & Leasing | 0 (0.0%) | 2 (100.0%) |
| Professional & Scientific | 2 (100.0%) | 0 (0.0%) |
| Enterprise Management | 0 (0.0%) | 0 (0.0%) |
| Administrative & Support | 2 (14.3%) | 12 (85.7%) |
| Educational Services | 0 (0.0%) | 0 (0.0%) |
| Health Care & Social Assistance | 0 (0.0%) | 3 (100.0%) |
| Arts, Entertainment & Recreation | 0 (0.0%) | 0 (0.0%) |
| Accommodation & Food Services | 0 (0.0%) | 0 (0.0%) |
| Public Administration | 1 (100.0%) | 0 (0.0%) |
| Total | 30 (50.8%) | 29 (49.1%) |
Education in Libertyville
School Enrollment in Libertyville
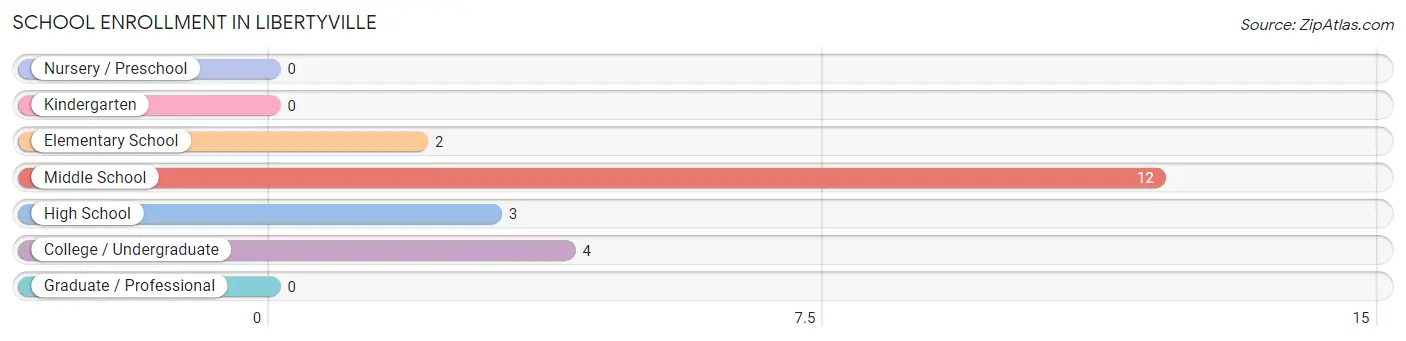
The most common levels of schooling among the 21 students in Libertyville are middle school (12 | 57.1%), college / undergraduate (4 | 19.1%), and high school (3 | 14.3%).
| School Level | # Students | % Students |
| Nursery / Preschool | 0 | 0.0% |
| Kindergarten | 0 | 0.0% |
| Elementary School | 2 | 9.5% |
| Middle School | 12 | 57.1% |
| High School | 3 | 14.3% |
| College / Undergraduate | 4 | 19.1% |
| Graduate / Professional | 0 | 0.0% |
| Total | 21 | 100.0% |
School Enrollment by Age by Funding Source in Libertyville
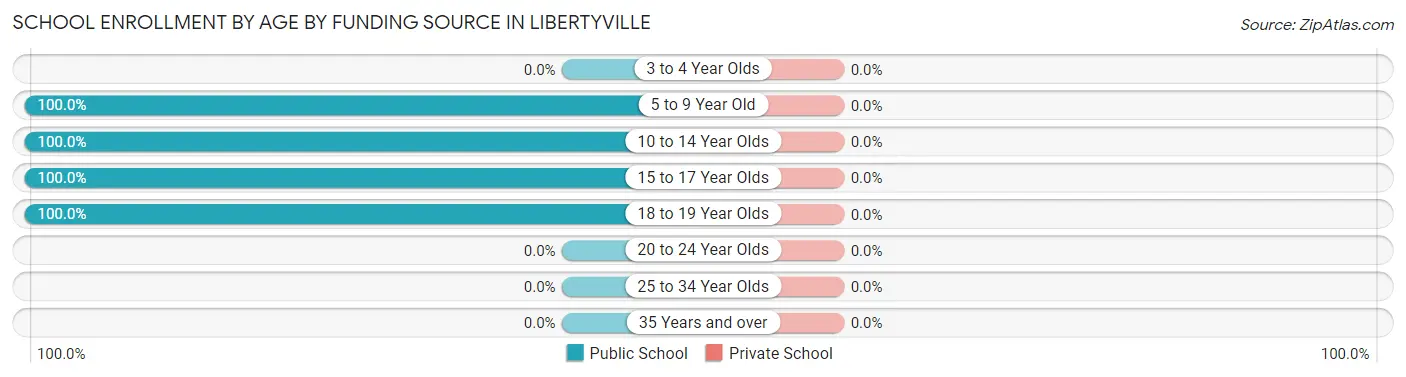
| Age Bracket | Public School | Private School |
| 3 to 4 Year Olds | 0 (0.0%) | 0 (0.0%) |
| 5 to 9 Year Old | 2 (100.0%) | 0 (0.0%) |
| 10 to 14 Year Olds | 12 (100.0%) | 0 (0.0%) |
| 15 to 17 Year Olds | 3 (100.0%) | 0 (0.0%) |
| 18 to 19 Year Olds | 4 (100.0%) | 0 (0.0%) |
| 20 to 24 Year Olds | 0 (0.0%) | 0 (0.0%) |
| 25 to 34 Year Olds | 0 (0.0%) | 0 (0.0%) |
| 35 Years and over | 0 (0.0%) | 0 (0.0%) |
| Total | 21 (100.0%) | 0 (0.0%) |
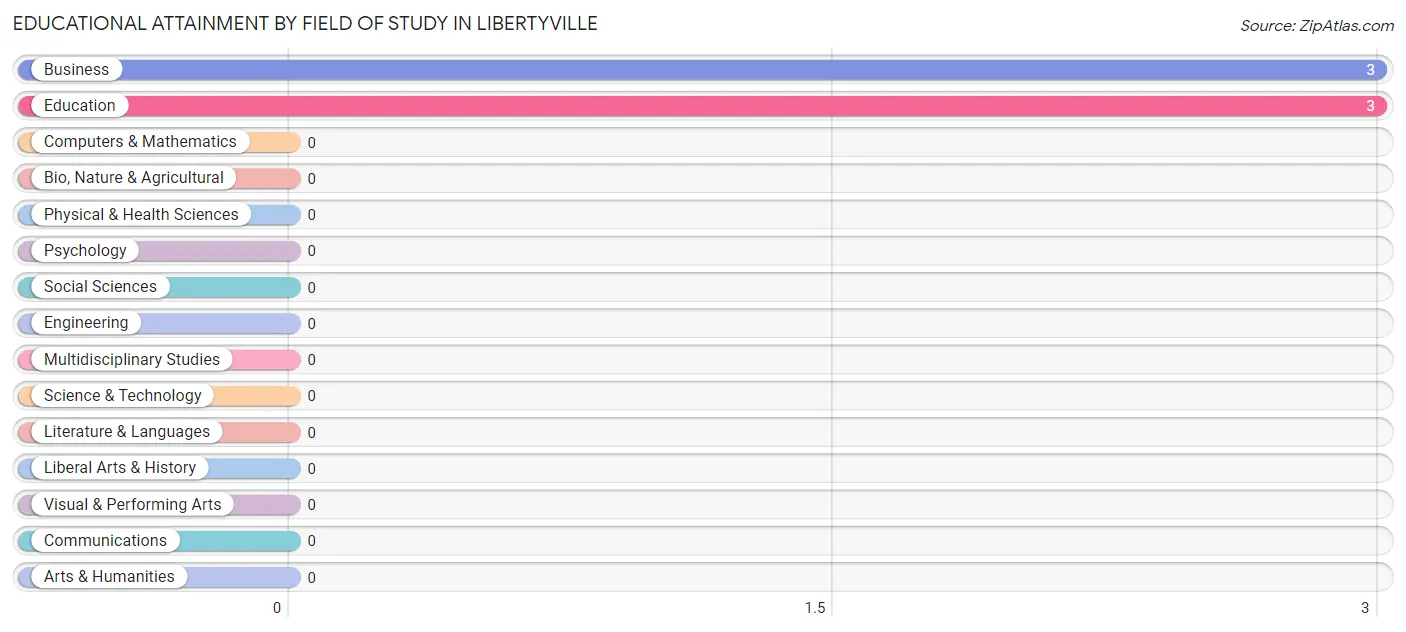
Educational Attainment by Field of Study in Libertyville
Business (3 | 50.0%), and education (3 | 50.0%) are the most common fields of study among 6 individuals in Libertyville who have obtained a bachelor's degree or higher.
| Field of Study | # Graduates | % Graduates |
| Computers & Mathematics | 0 | 0.0% |
| Bio, Nature & Agricultural | 0 | 0.0% |
| Physical & Health Sciences | 0 | 0.0% |
| Psychology | 0 | 0.0% |
| Social Sciences | 0 | 0.0% |
| Engineering | 0 | 0.0% |
| Multidisciplinary Studies | 0 | 0.0% |
| Science & Technology | 0 | 0.0% |
| Business | 3 | 50.0% |
| Education | 3 | 50.0% |
| Literature & Languages | 0 | 0.0% |
| Liberal Arts & History | 0 | 0.0% |
| Visual & Performing Arts | 0 | 0.0% |
| Communications | 0 | 0.0% |
| Arts & Humanities | 0 | 0.0% |
| Total | 6 | 100.0% |
Transportation & Commute in Libertyville
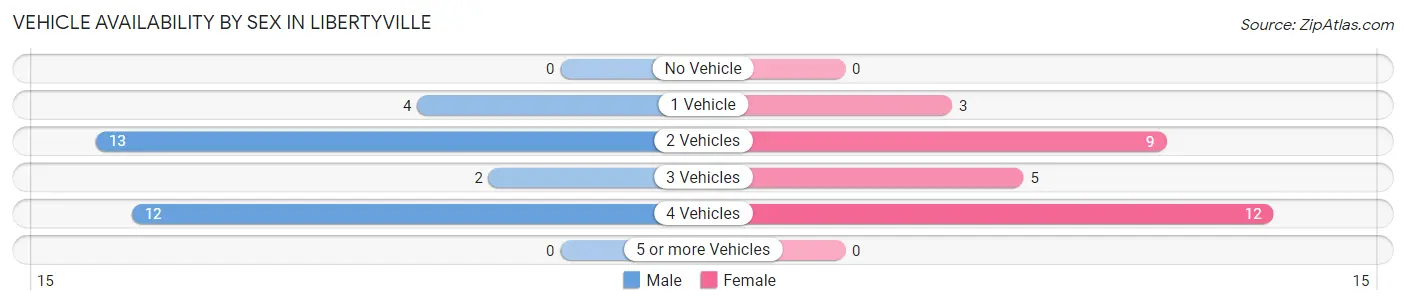
Vehicle Availability by Sex in Libertyville
The most prevalent vehicle ownership categories in Libertyville are males with 2 vehicles (13, accounting for 41.9%) and females with 2 vehicles (9, making up 44.8%).
| Vehicles Available | Male | Female |
| No Vehicle | 0 (0.0%) | 0 (0.0%) |
| 1 Vehicle | 4 (12.9%) | 3 (10.3%) |
| 2 Vehicles | 13 (41.9%) | 9 (31.0%) |
| 3 Vehicles | 2 (6.5%) | 5 (17.2%) |
| 4 Vehicles | 12 (38.7%) | 12 (41.4%) |
| 5 or more Vehicles | 0 (0.0%) | 0 (0.0%) |
| Total | 31 (100.0%) | 29 (100.0%) |
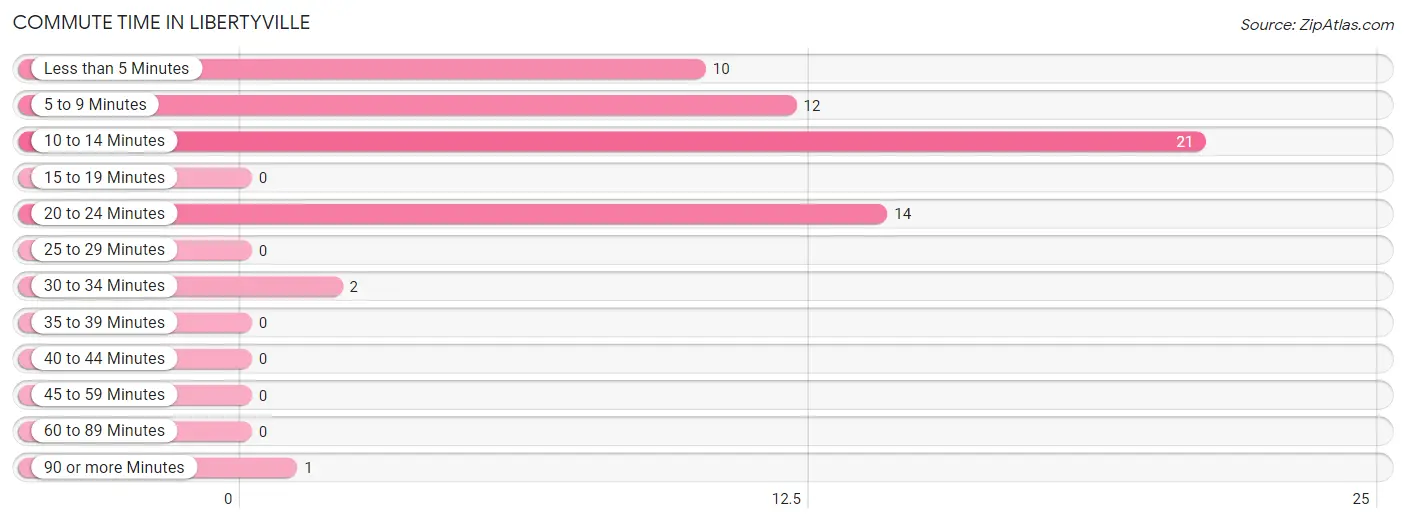
Commute Time in Libertyville
The most frequently occuring commute durations in Libertyville are 10 to 14 minutes (21 commuters, 35.0%), 20 to 24 minutes (14 commuters, 23.3%), and 5 to 9 minutes (12 commuters, 20.0%).
| Commute Time | # Commuters | % Commuters |
| Less than 5 Minutes | 10 | 16.7% |
| 5 to 9 Minutes | 12 | 20.0% |
| 10 to 14 Minutes | 21 | 35.0% |
| 15 to 19 Minutes | 0 | 0.0% |
| 20 to 24 Minutes | 14 | 23.3% |
| 25 to 29 Minutes | 0 | 0.0% |
| 30 to 34 Minutes | 2 | 3.3% |
| 35 to 39 Minutes | 0 | 0.0% |
| 40 to 44 Minutes | 0 | 0.0% |
| 45 to 59 Minutes | 0 | 0.0% |
| 60 to 89 Minutes | 0 | 0.0% |
| 90 or more Minutes | 1 | 1.7% |
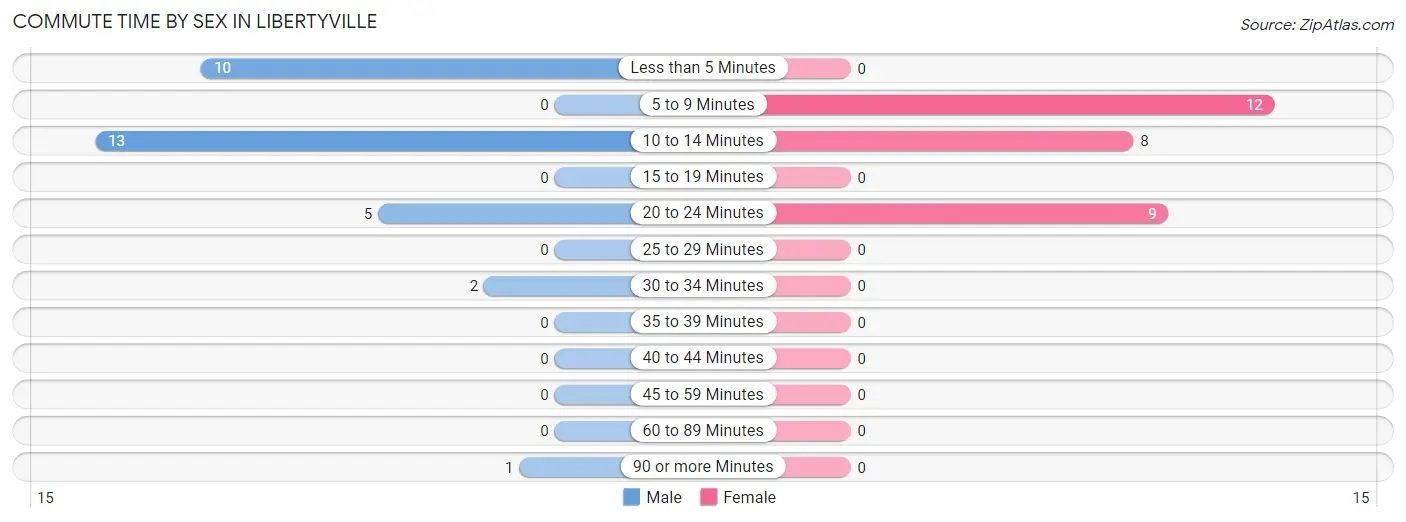
Commute Time by Sex in Libertyville
The most common commute times in Libertyville are 10 to 14 minutes (13 commuters, 41.9%) for males and 5 to 9 minutes (12 commuters, 41.4%) for females.
| Commute Time | Male | Female |
| Less than 5 Minutes | 10 (32.3%) | 0 (0.0%) |
| 5 to 9 Minutes | 0 (0.0%) | 12 (41.4%) |
| 10 to 14 Minutes | 13 (41.9%) | 8 (27.6%) |
| 15 to 19 Minutes | 0 (0.0%) | 0 (0.0%) |
| 20 to 24 Minutes | 5 (16.1%) | 9 (31.0%) |
| 25 to 29 Minutes | 0 (0.0%) | 0 (0.0%) |
| 30 to 34 Minutes | 2 (6.5%) | 0 (0.0%) |
| 35 to 39 Minutes | 0 (0.0%) | 0 (0.0%) |
| 40 to 44 Minutes | 0 (0.0%) | 0 (0.0%) |
| 45 to 59 Minutes | 0 (0.0%) | 0 (0.0%) |
| 60 to 89 Minutes | 0 (0.0%) | 0 (0.0%) |
| 90 or more Minutes | 1 (3.2%) | 0 (0.0%) |
Time of Departure to Work by Sex in Libertyville
The most frequent times of departure to work in Libertyville are 6:30 AM to 6:59 AM (12, 38.7%) for males and 8:00 AM to 8:29 AM (19, 65.5%) for females.
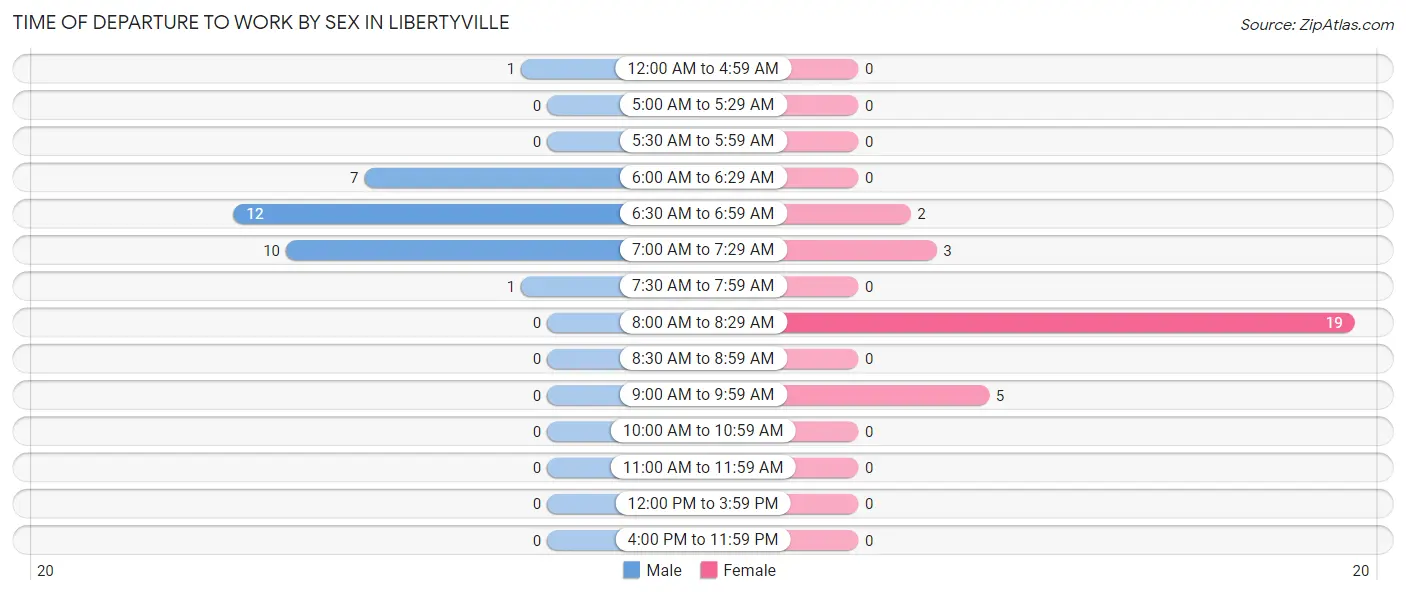
| Time of Departure | Male | Female |
| 12:00 AM to 4:59 AM | 1 (3.2%) | 0 (0.0%) |
| 5:00 AM to 5:29 AM | 0 (0.0%) | 0 (0.0%) |
| 5:30 AM to 5:59 AM | 0 (0.0%) | 0 (0.0%) |
| 6:00 AM to 6:29 AM | 7 (22.6%) | 0 (0.0%) |
| 6:30 AM to 6:59 AM | 12 (38.7%) | 2 (6.9%) |
| 7:00 AM to 7:29 AM | 10 (32.3%) | 3 (10.3%) |
| 7:30 AM to 7:59 AM | 1 (3.2%) | 0 (0.0%) |
| 8:00 AM to 8:29 AM | 0 (0.0%) | 19 (65.5%) |
| 8:30 AM to 8:59 AM | 0 (0.0%) | 0 (0.0%) |
| 9:00 AM to 9:59 AM | 0 (0.0%) | 5 (17.2%) |
| 10:00 AM to 10:59 AM | 0 (0.0%) | 0 (0.0%) |
| 11:00 AM to 11:59 AM | 0 (0.0%) | 0 (0.0%) |
| 12:00 PM to 3:59 PM | 0 (0.0%) | 0 (0.0%) |
| 4:00 PM to 11:59 PM | 0 (0.0%) | 0 (0.0%) |
| Total | 31 (100.0%) | 29 (100.0%) |
Housing Occupancy in Libertyville
Occupancy by Ownership in Libertyville
Of the total 43 dwellings in Libertyville, owner-occupied units account for 36 (83.7%), while renter-occupied units make up 7 (16.3%).
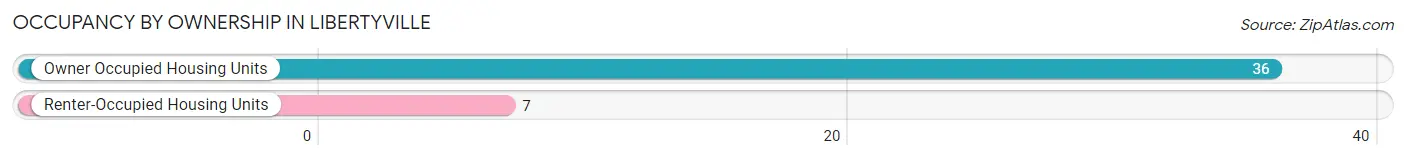
| Occupancy | # Housing Units | % Housing Units |
| Owner Occupied Housing Units | 36 | 83.7% |
| Renter-Occupied Housing Units | 7 | 16.3% |
| Total Occupied Housing Units | 43 | 100.0% |
Occupancy by Household Size in Libertyville
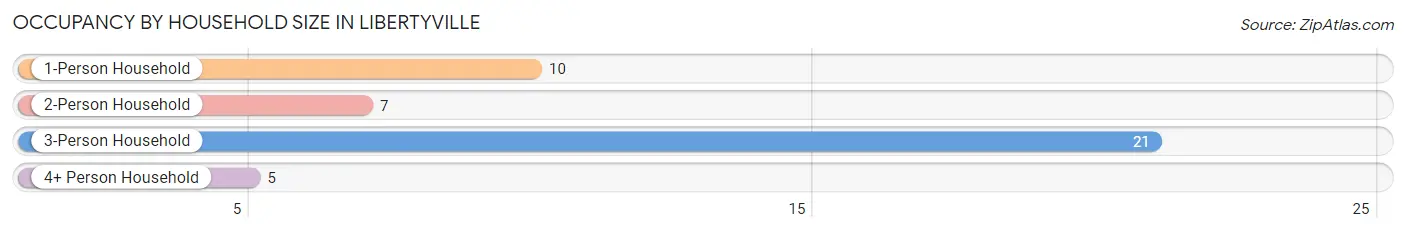
| Household Size | # Housing Units | % Housing Units |
| 1-Person Household | 10 | 23.3% |
| 2-Person Household | 7 | 16.3% |
| 3-Person Household | 21 | 48.8% |
| 4+ Person Household | 5 | 11.6% |
| Total Housing Units | 43 | 100.0% |
Occupancy by Ownership by Household Size in Libertyville
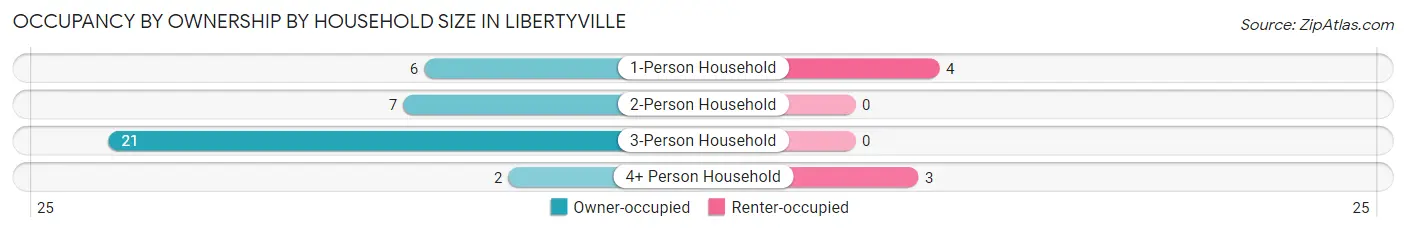
| Household Size | Owner-occupied | Renter-occupied |
| 1-Person Household | 6 (60.0%) | 4 (40.0%) |
| 2-Person Household | 7 (100.0%) | 0 (0.0%) |
| 3-Person Household | 21 (100.0%) | 0 (0.0%) |
| 4+ Person Household | 2 (40.0%) | 3 (60.0%) |
| Total Housing Units | 36 (83.7%) | 7 (16.3%) |
Occupancy by Educational Attainment in Libertyville
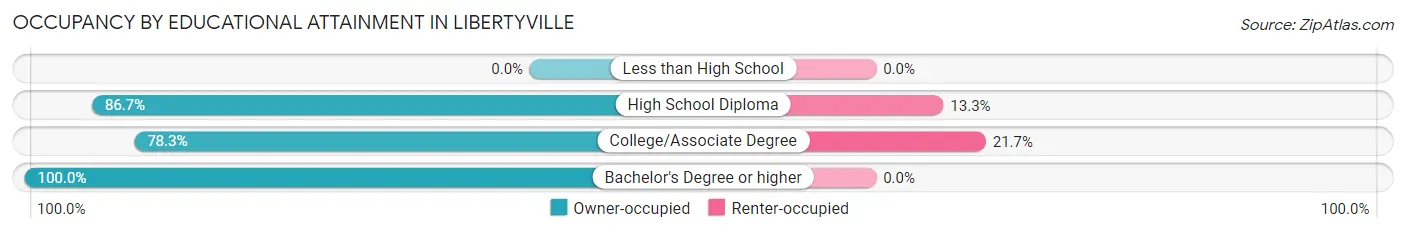
| Household Size | Owner-occupied | Renter-occupied |
| Less than High School | 0 (0.0%) | 0 (0.0%) |
| High School Diploma | 13 (86.7%) | 2 (13.3%) |
| College/Associate Degree | 18 (78.3%) | 5 (21.7%) |
| Bachelor's Degree or higher | 5 (100.0%) | 0 (0.0%) |
Occupancy by Age of Householder in Libertyville
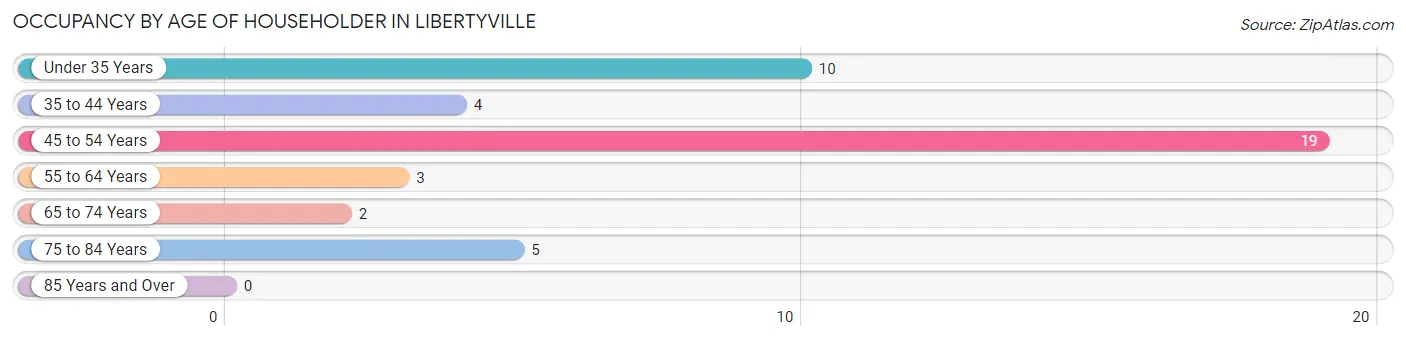
| Age Bracket | # Households | % Households |
| Under 35 Years | 10 | 23.3% |
| 35 to 44 Years | 4 | 9.3% |
| 45 to 54 Years | 19 | 44.2% |
| 55 to 64 Years | 3 | 7.0% |
| 65 to 74 Years | 2 | 4.6% |
| 75 to 84 Years | 5 | 11.6% |
| 85 Years and Over | 0 | 0.0% |
| Total | 43 | 100.0% |
Housing Finances in Libertyville
Median Income by Occupancy in Libertyville
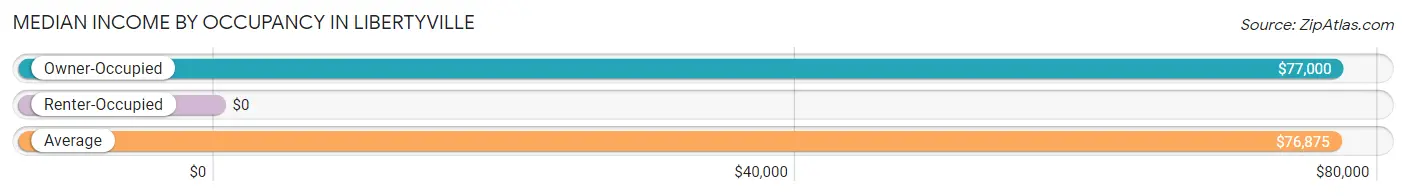
| Occupancy Type | # Households | Median Income |
| Owner-Occupied | 36 (83.7%) | $77,000 |
| Renter-Occupied | 7 (16.3%) | $0 |
| Average | 43 (100.0%) | $76,875 |
Occupancy by Householder Income Bracket in Libertyville
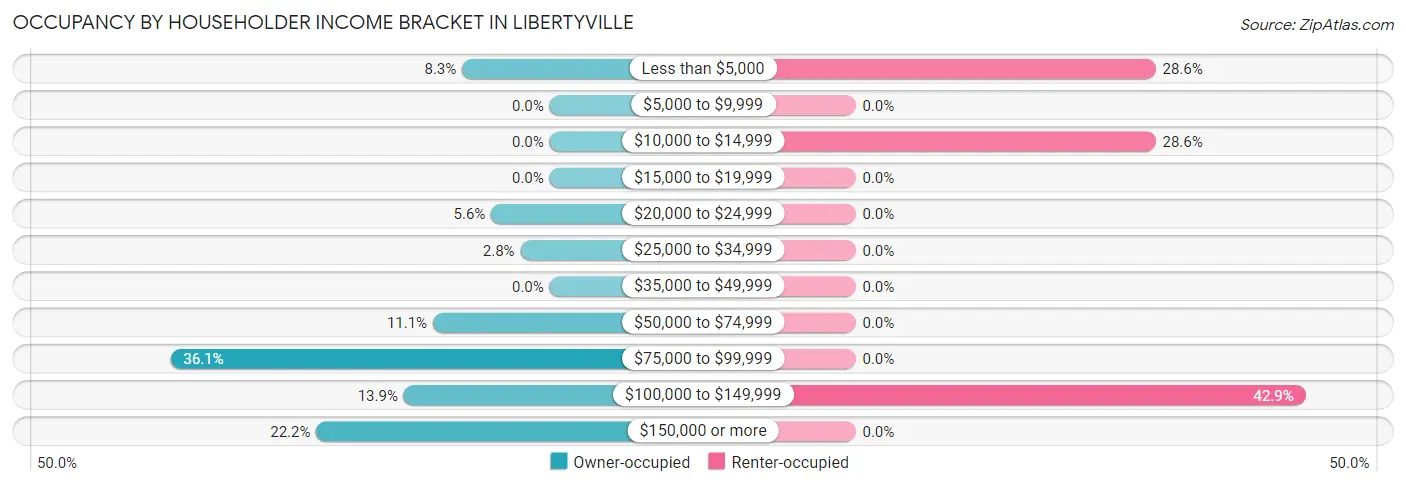
| Income Bracket | Owner-occupied | Renter-occupied |
| Less than $5,000 | 3 (8.3%) | 2 (28.6%) |
| $5,000 to $9,999 | 0 (0.0%) | 0 (0.0%) |
| $10,000 to $14,999 | 0 (0.0%) | 2 (28.6%) |
| $15,000 to $19,999 | 0 (0.0%) | 0 (0.0%) |
| $20,000 to $24,999 | 2 (5.6%) | 0 (0.0%) |
| $25,000 to $34,999 | 1 (2.8%) | 0 (0.0%) |
| $35,000 to $49,999 | 0 (0.0%) | 0 (0.0%) |
| $50,000 to $74,999 | 4 (11.1%) | 0 (0.0%) |
| $75,000 to $99,999 | 13 (36.1%) | 0 (0.0%) |
| $100,000 to $149,999 | 5 (13.9%) | 3 (42.9%) |
| $150,000 or more | 8 (22.2%) | 0 (0.0%) |
| Total | 36 (100.0%) | 7 (100.0%) |
Monthly Housing Cost Tiers in Libertyville
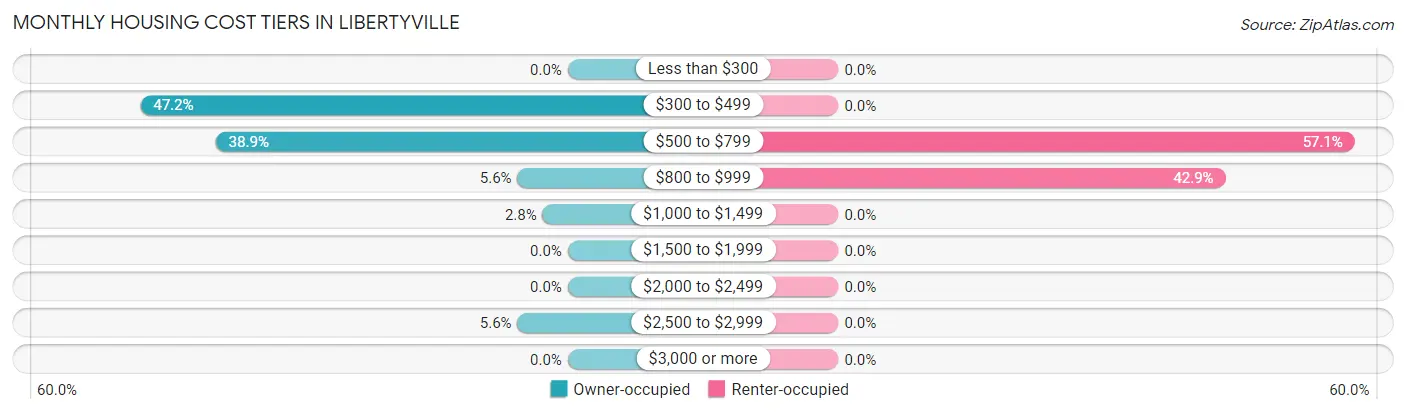
| Monthly Cost | Owner-occupied | Renter-occupied |
| Less than $300 | 0 (0.0%) | 0 (0.0%) |
| $300 to $499 | 17 (47.2%) | 0 (0.0%) |
| $500 to $799 | 14 (38.9%) | 4 (57.1%) |
| $800 to $999 | 2 (5.6%) | 3 (42.9%) |
| $1,000 to $1,499 | 1 (2.8%) | 0 (0.0%) |
| $1,500 to $1,999 | 0 (0.0%) | 0 (0.0%) |
| $2,000 to $2,499 | 0 (0.0%) | 0 (0.0%) |
| $2,500 to $2,999 | 2 (5.6%) | 0 (0.0%) |
| $3,000 or more | 0 (0.0%) | 0 (0.0%) |
| Total | 36 (100.0%) | 7 (100.0%) |
Physical Housing Characteristics in Libertyville
Housing Structures in Libertyville
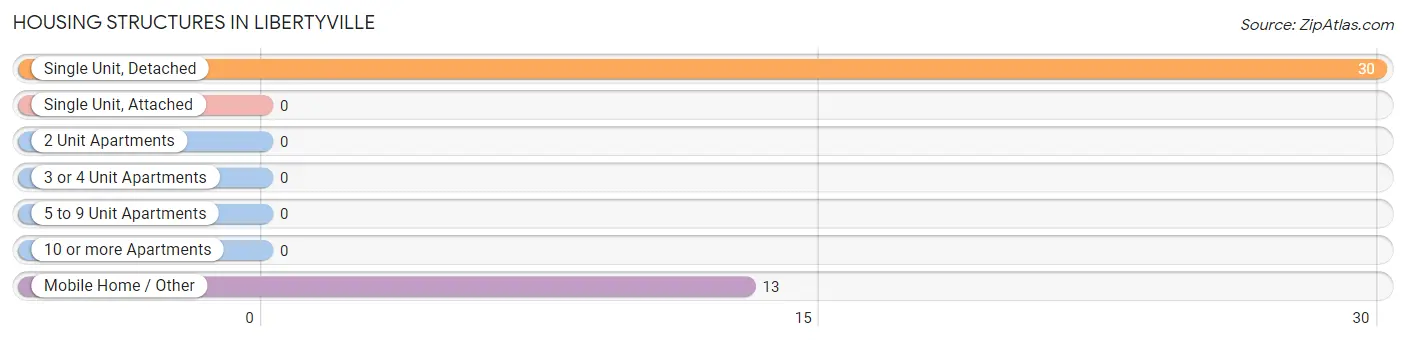
| Structure Type | # Housing Units | % Housing Units |
| Single Unit, Detached | 30 | 69.8% |
| Single Unit, Attached | 0 | 0.0% |
| 2 Unit Apartments | 0 | 0.0% |
| 3 or 4 Unit Apartments | 0 | 0.0% |
| 5 to 9 Unit Apartments | 0 | 0.0% |
| 10 or more Apartments | 0 | 0.0% |
| Mobile Home / Other | 13 | 30.2% |
| Total | 43 | 100.0% |
Housing Structures by Occupancy in Libertyville
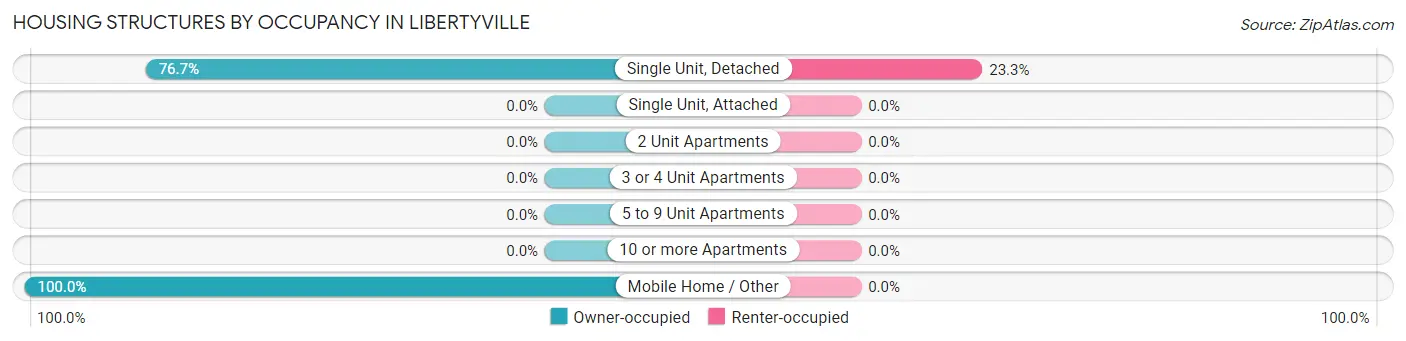
| Structure Type | Owner-occupied | Renter-occupied |
| Single Unit, Detached | 23 (76.7%) | 7 (23.3%) |
| Single Unit, Attached | 0 (0.0%) | 0 (0.0%) |
| 2 Unit Apartments | 0 (0.0%) | 0 (0.0%) |
| 3 or 4 Unit Apartments | 0 (0.0%) | 0 (0.0%) |
| 5 to 9 Unit Apartments | 0 (0.0%) | 0 (0.0%) |
| 10 or more Apartments | 0 (0.0%) | 0 (0.0%) |
| Mobile Home / Other | 13 (100.0%) | 0 (0.0%) |
| Total | 36 (83.7%) | 7 (16.3%) |
Housing Structures by Number of Rooms in Libertyville
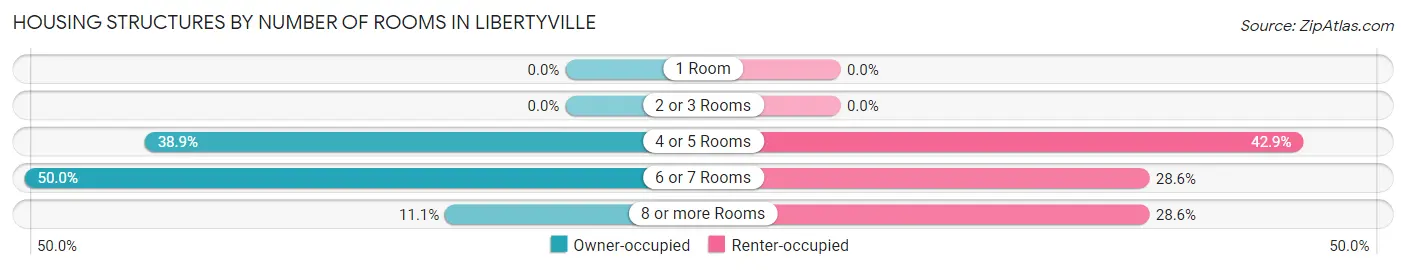
| Number of Rooms | Owner-occupied | Renter-occupied |
| 1 Room | 0 (0.0%) | 0 (0.0%) |
| 2 or 3 Rooms | 0 (0.0%) | 0 (0.0%) |
| 4 or 5 Rooms | 14 (38.9%) | 3 (42.9%) |
| 6 or 7 Rooms | 18 (50.0%) | 2 (28.6%) |
| 8 or more Rooms | 4 (11.1%) | 2 (28.6%) |
| Total | 36 (100.0%) | 7 (100.0%) |
Housing Structure by Heating Type in Libertyville
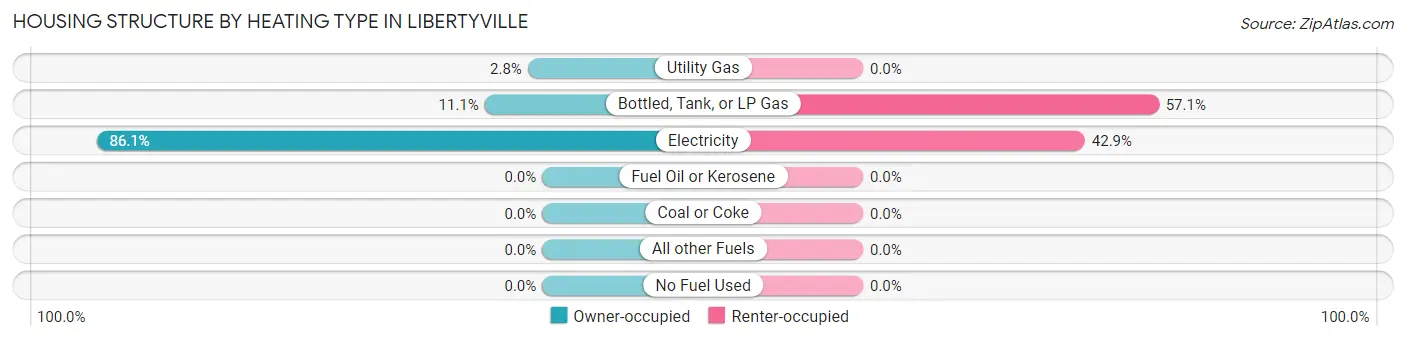
| Heating Type | Owner-occupied | Renter-occupied |
| Utility Gas | 1 (2.8%) | 0 (0.0%) |
| Bottled, Tank, or LP Gas | 4 (11.1%) | 4 (57.1%) |
| Electricity | 31 (86.1%) | 3 (42.9%) |
| Fuel Oil or Kerosene | 0 (0.0%) | 0 (0.0%) |
| Coal or Coke | 0 (0.0%) | 0 (0.0%) |
| All other Fuels | 0 (0.0%) | 0 (0.0%) |
| No Fuel Used | 0 (0.0%) | 0 (0.0%) |
| Total | 36 (100.0%) | 7 (100.0%) |
Household Vehicle Usage in Libertyville
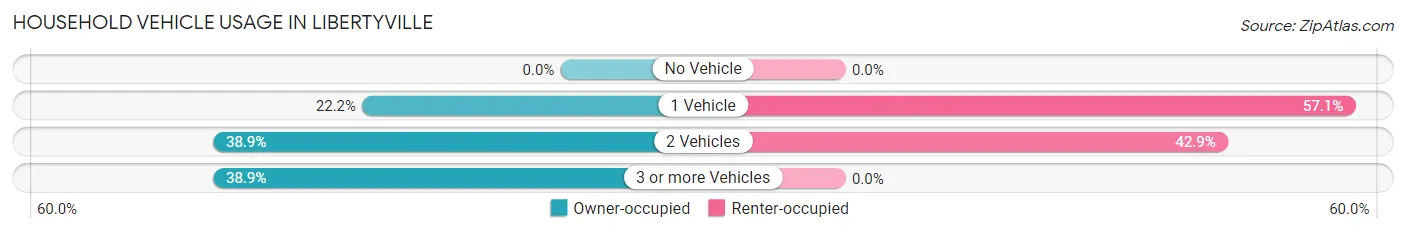
| Vehicles per Household | Owner-occupied | Renter-occupied |
| No Vehicle | 0 (0.0%) | 0 (0.0%) |
| 1 Vehicle | 8 (22.2%) | 4 (57.1%) |
| 2 Vehicles | 14 (38.9%) | 3 (42.9%) |
| 3 or more Vehicles | 14 (38.9%) | 0 (0.0%) |
| Total | 36 (100.0%) | 7 (100.0%) |
Real Estate & Mortgages in Libertyville
Real Estate and Mortgage Overview in Libertyville
| Characteristic | Without Mortgage | With Mortgage |
| Housing Units | 18 | 18 |
| Median Property Value | - | - |
| Median Household Income | - | - |
| Monthly Housing Costs | $370 | $0 |
| Real Estate Taxes | $199 | $0 |
Property Value by Mortgage Status in Libertyville
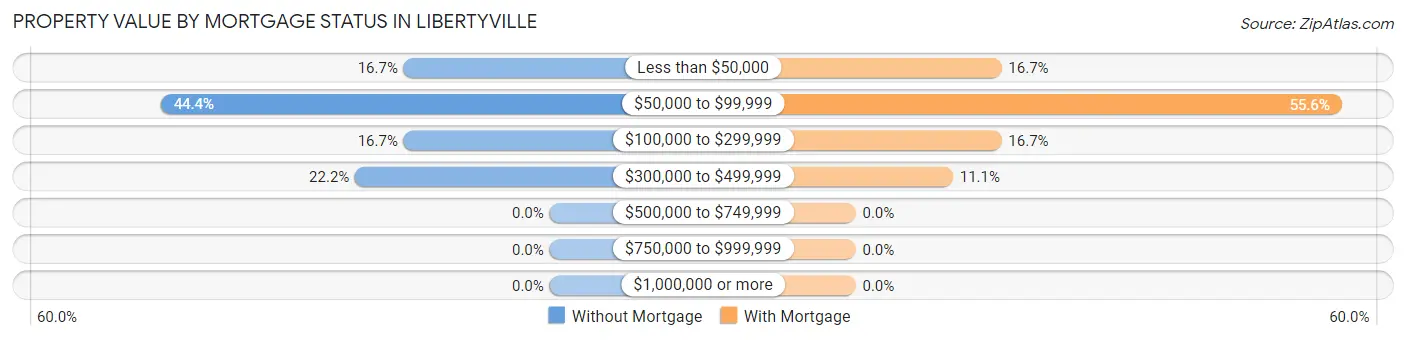
| Property Value | Without Mortgage | With Mortgage |
| Less than $50,000 | 3 (16.7%) | 3 (16.7%) |
| $50,000 to $99,999 | 8 (44.4%) | 10 (55.6%) |
| $100,000 to $299,999 | 3 (16.7%) | 3 (16.7%) |
| $300,000 to $499,999 | 4 (22.2%) | 2 (11.1%) |
| $500,000 to $749,999 | 0 (0.0%) | 0 (0.0%) |
| $750,000 to $999,999 | 0 (0.0%) | 0 (0.0%) |
| $1,000,000 or more | 0 (0.0%) | 0 (0.0%) |
| Total | 18 (100.0%) | 18 (100.0%) |
Household Income by Mortgage Status in Libertyville
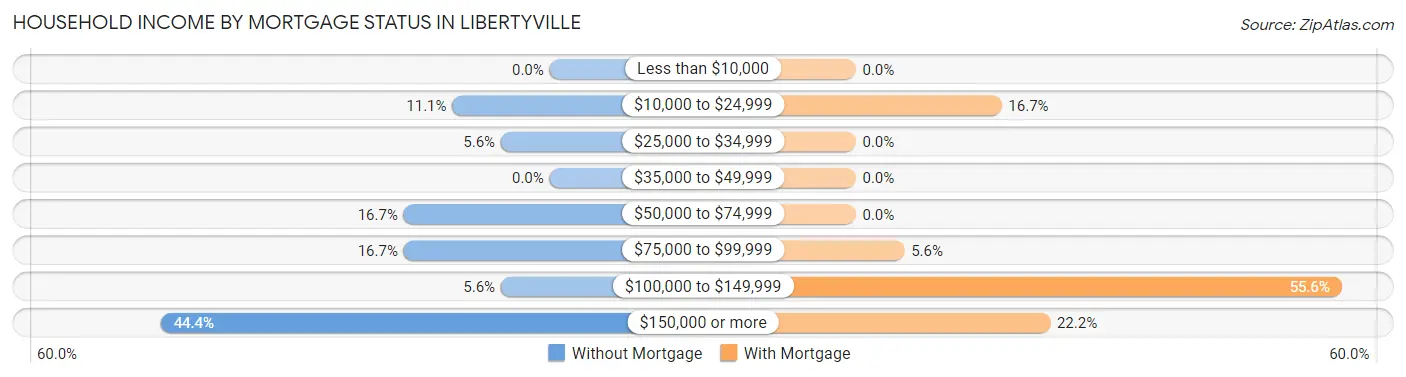
| Household Income | Without Mortgage | With Mortgage |
| Less than $10,000 | 0 (0.0%) | 0 (0.0%) |
| $10,000 to $24,999 | 2 (11.1%) | 3 (16.7%) |
| $25,000 to $34,999 | 1 (5.6%) | 0 (0.0%) |
| $35,000 to $49,999 | 0 (0.0%) | 0 (0.0%) |
| $50,000 to $74,999 | 3 (16.7%) | 0 (0.0%) |
| $75,000 to $99,999 | 3 (16.7%) | 1 (5.6%) |
| $100,000 to $149,999 | 1 (5.6%) | 10 (55.6%) |
| $150,000 or more | 8 (44.4%) | 4 (22.2%) |
| Total | 18 (100.0%) | 18 (100.0%) |
Property Value to Household Income Ratio in Libertyville
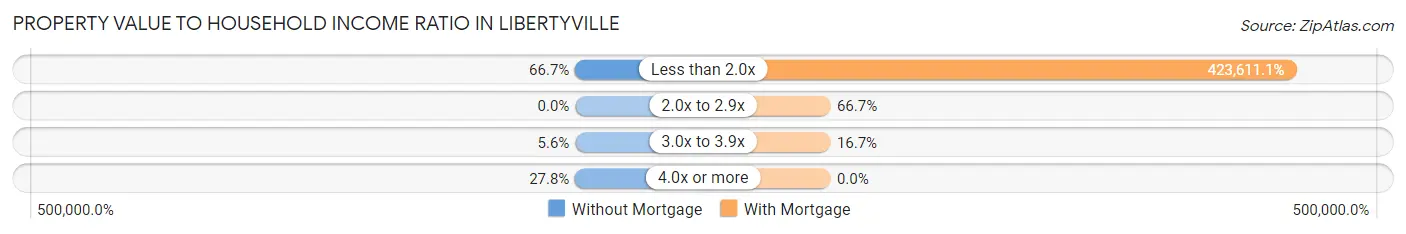
| Value-to-Income Ratio | Without Mortgage | With Mortgage |
| Less than 2.0x | 12 (66.7%) | 76,250 (423,611.1%) |
| 2.0x to 2.9x | 0 (0.0%) | 12 (66.7%) |
| 3.0x to 3.9x | 1 (5.6%) | 3 (16.7%) |
| 4.0x or more | 5 (27.8%) | 0 (0.0%) |
| Total | 18 (100.0%) | 18 (100.0%) |
Real Estate Taxes by Mortgage Status in Libertyville
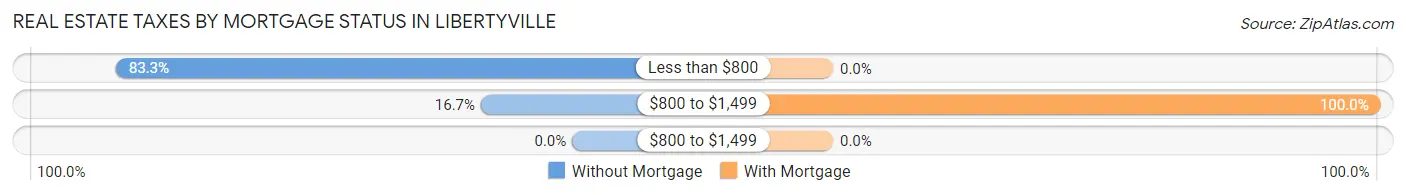
| Property Taxes | Without Mortgage | With Mortgage |
| Less than $800 | 15 (83.3%) | 0 (0.0%) |
| $800 to $1,499 | 3 (16.7%) | 18 (100.0%) |
| $800 to $1,499 | 0 (0.0%) | 0 (0.0%) |
| Total | 18 (100.0%) | 18 (100.0%) |
Health & Disability in Libertyville
Health Insurance Coverage by Age in Libertyville
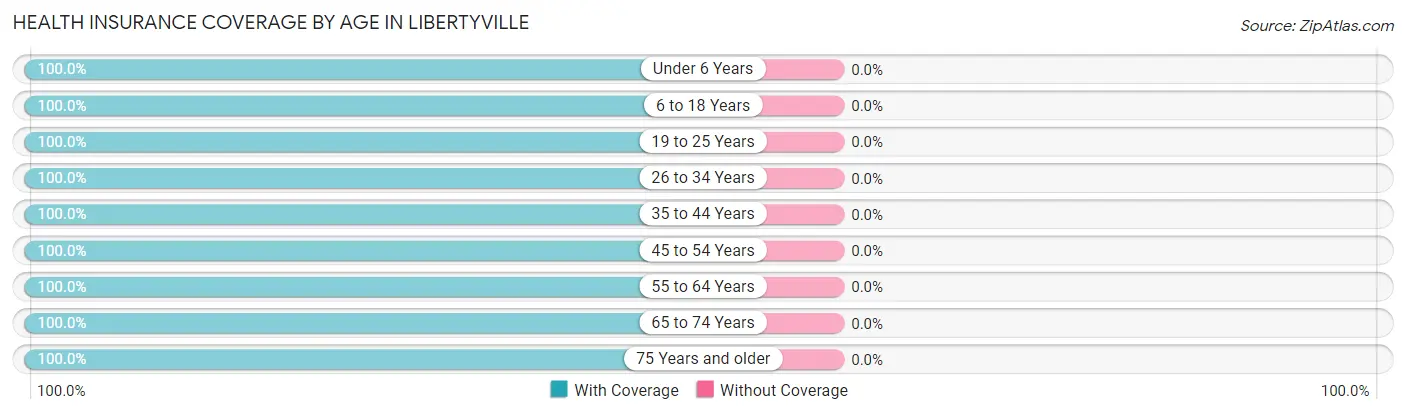
| Age Bracket | With Coverage | Without Coverage |
| Under 6 Years | 10 (100.0%) | 0 (0.0%) |
| 6 to 18 Years | 17 (100.0%) | 0 (0.0%) |
| 19 to 25 Years | 4 (100.0%) | 0 (0.0%) |
| 26 to 34 Years | 22 (100.0%) | 0 (0.0%) |
| 35 to 44 Years | 6 (100.0%) | 0 (0.0%) |
| 45 to 54 Years | 31 (100.0%) | 0 (0.0%) |
| 55 to 64 Years | 8 (100.0%) | 0 (0.0%) |
| 65 to 74 Years | 4 (100.0%) | 0 (0.0%) |
| 75 Years and older | 8 (100.0%) | 0 (0.0%) |
| Total | 110 (100.0%) | 0 (0.0%) |
Health Insurance Coverage by Citizenship Status in Libertyville
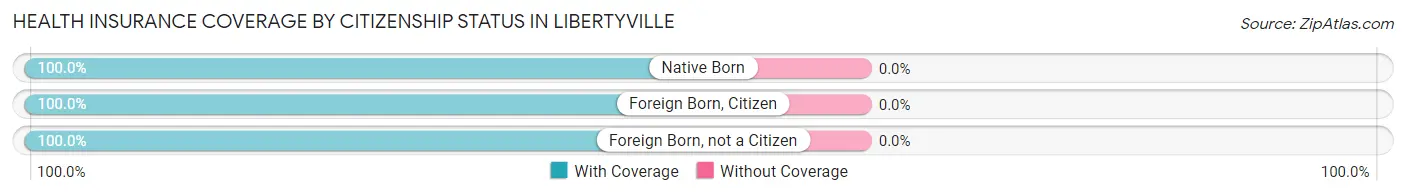
| Citizenship Status | With Coverage | Without Coverage |
| Native Born | 10 (100.0%) | 0 (0.0%) |
| Foreign Born, Citizen | 17 (100.0%) | 0 (0.0%) |
| Foreign Born, not a Citizen | 4 (100.0%) | 0 (0.0%) |
Health Insurance Coverage by Household Income in Libertyville
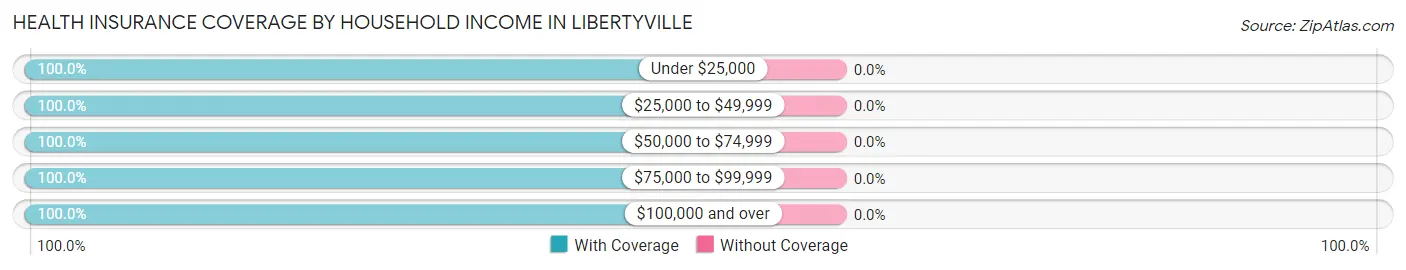
| Household Income | With Coverage | Without Coverage |
| Under $25,000 | 12 (100.0%) | 0 (0.0%) |
| $25,000 to $49,999 | 2 (100.0%) | 0 (0.0%) |
| $50,000 to $74,999 | 10 (100.0%) | 0 (0.0%) |
| $75,000 to $99,999 | 35 (100.0%) | 0 (0.0%) |
| $100,000 and over | 51 (100.0%) | 0 (0.0%) |
Public vs Private Health Insurance Coverage by Age in Libertyville
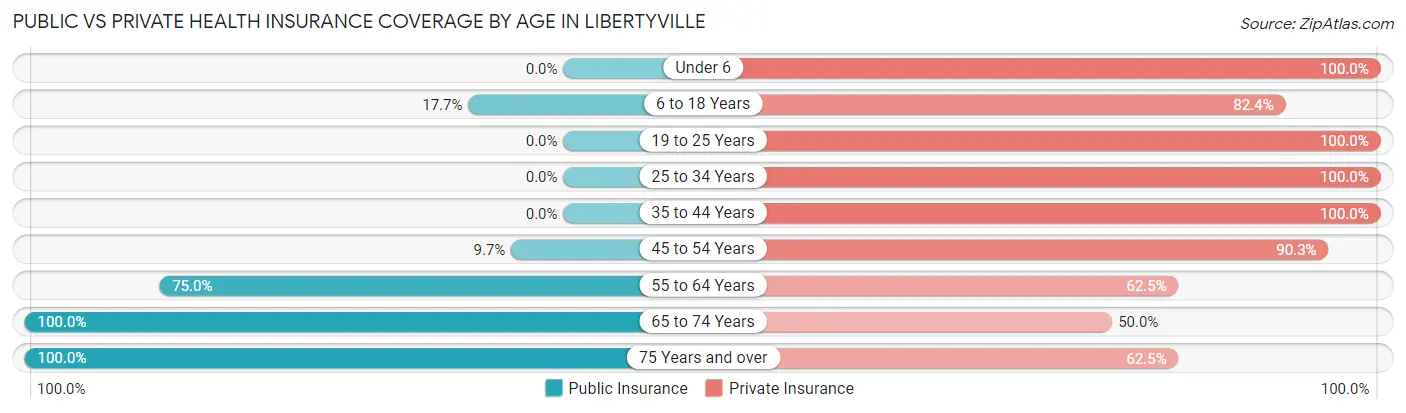
| Age Bracket | Public Insurance | Private Insurance |
| Under 6 | 0 (0.0%) | 10 (100.0%) |
| 6 to 18 Years | 3 (17.6%) | 14 (82.4%) |
| 19 to 25 Years | 0 (0.0%) | 4 (100.0%) |
| 25 to 34 Years | 0 (0.0%) | 22 (100.0%) |
| 35 to 44 Years | 0 (0.0%) | 6 (100.0%) |
| 45 to 54 Years | 3 (9.7%) | 28 (90.3%) |
| 55 to 64 Years | 6 (75.0%) | 5 (62.5%) |
| 65 to 74 Years | 4 (100.0%) | 2 (50.0%) |
| 75 Years and over | 8 (100.0%) | 5 (62.5%) |
| Total | 24 (21.8%) | 96 (87.3%) |
Disability Status by Sex by Age in Libertyville
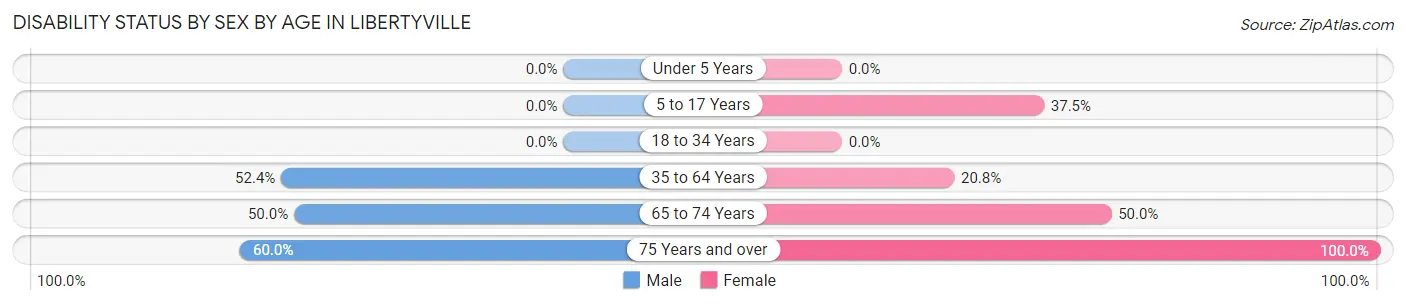
| Age Bracket | Male | Female |
| Under 5 Years | 0 (0.0%) | 0 (0.0%) |
| 5 to 17 Years | 0 (0.0%) | 3 (37.5%) |
| 18 to 34 Years | 0 (0.0%) | 0 (0.0%) |
| 35 to 64 Years | 11 (52.4%) | 5 (20.8%) |
| 65 to 74 Years | 1 (50.0%) | 1 (50.0%) |
| 75 Years and over | 3 (60.0%) | 3 (100.0%) |
Disability Class by Sex by Age in Libertyville
Disability Class: Hearing Difficulty
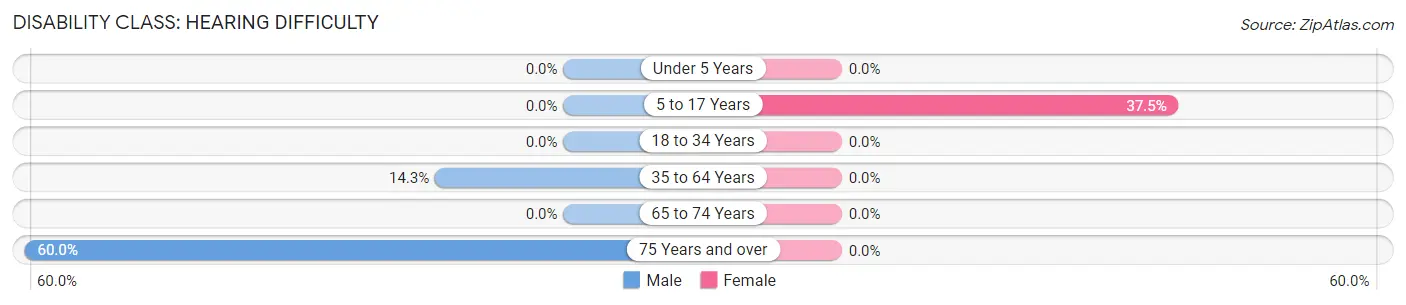
| Age Bracket | Male | Female |
| Under 5 Years | 0 (0.0%) | 0 (0.0%) |
| 5 to 17 Years | 0 (0.0%) | 3 (37.5%) |
| 18 to 34 Years | 0 (0.0%) | 0 (0.0%) |
| 35 to 64 Years | 3 (14.3%) | 0 (0.0%) |
| 65 to 74 Years | 0 (0.0%) | 0 (0.0%) |
| 75 Years and over | 3 (60.0%) | 0 (0.0%) |
Disability Class: Vision Difficulty
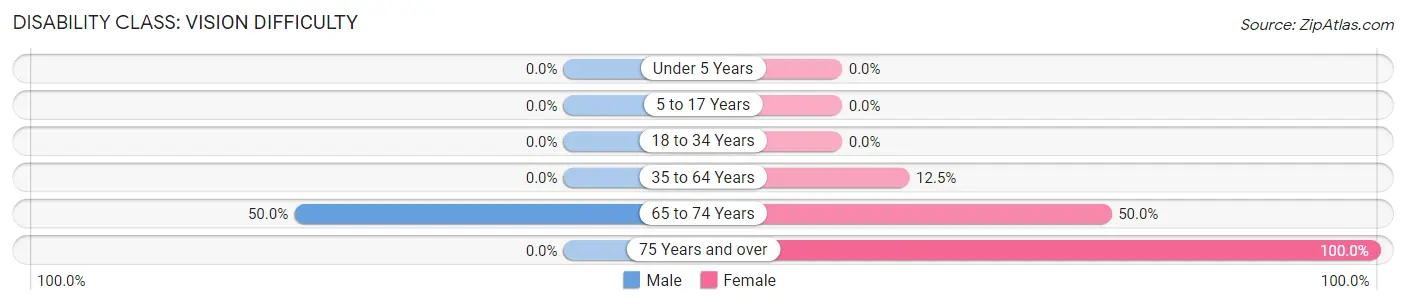
| Age Bracket | Male | Female |
| Under 5 Years | 0 (0.0%) | 0 (0.0%) |
| 5 to 17 Years | 0 (0.0%) | 0 (0.0%) |
| 18 to 34 Years | 0 (0.0%) | 0 (0.0%) |
| 35 to 64 Years | 0 (0.0%) | 3 (12.5%) |
| 65 to 74 Years | 1 (50.0%) | 1 (50.0%) |
| 75 Years and over | 0 (0.0%) | 3 (100.0%) |
Disability Class: Cognitive Difficulty
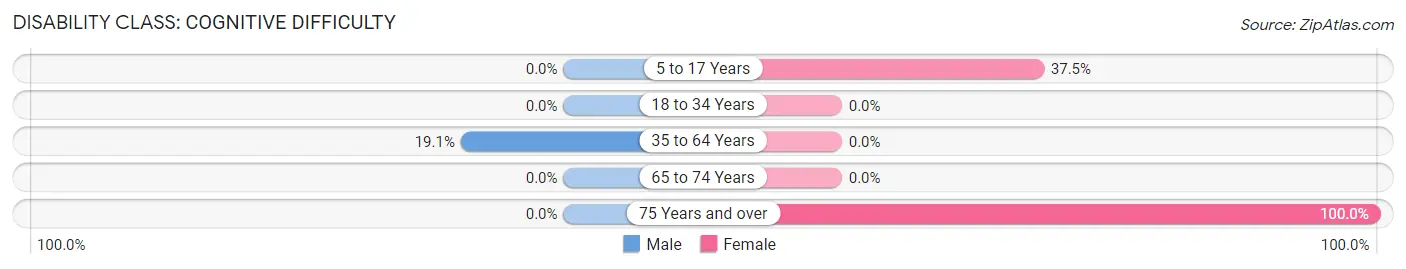
| Age Bracket | Male | Female |
| 5 to 17 Years | 0 (0.0%) | 3 (37.5%) |
| 18 to 34 Years | 0 (0.0%) | 0 (0.0%) |
| 35 to 64 Years | 4 (19.1%) | 0 (0.0%) |
| 65 to 74 Years | 0 (0.0%) | 0 (0.0%) |
| 75 Years and over | 0 (0.0%) | 3 (100.0%) |
Disability Class: Ambulatory Difficulty
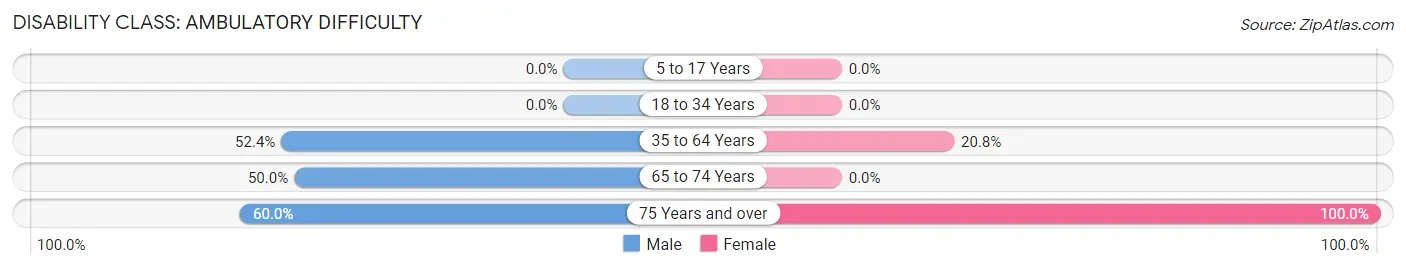
| Age Bracket | Male | Female |
| 5 to 17 Years | 0 (0.0%) | 0 (0.0%) |
| 18 to 34 Years | 0 (0.0%) | 0 (0.0%) |
| 35 to 64 Years | 11 (52.4%) | 5 (20.8%) |
| 65 to 74 Years | 1 (50.0%) | 0 (0.0%) |
| 75 Years and over | 3 (60.0%) | 3 (100.0%) |
Disability Class: Self-Care Difficulty
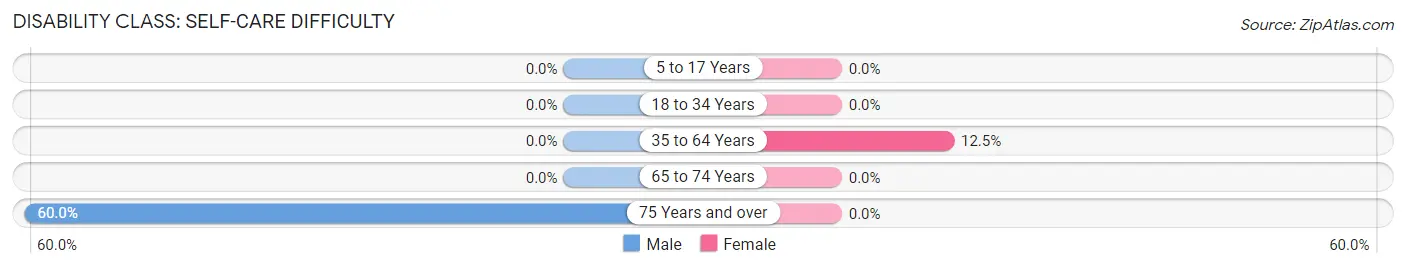
| Age Bracket | Male | Female |
| 5 to 17 Years | 0 (0.0%) | 0 (0.0%) |
| 18 to 34 Years | 0 (0.0%) | 0 (0.0%) |
| 35 to 64 Years | 0 (0.0%) | 3 (12.5%) |
| 65 to 74 Years | 0 (0.0%) | 0 (0.0%) |
| 75 Years and over | 3 (60.0%) | 0 (0.0%) |
Technology Access in Libertyville
Computing Device Access in Libertyville
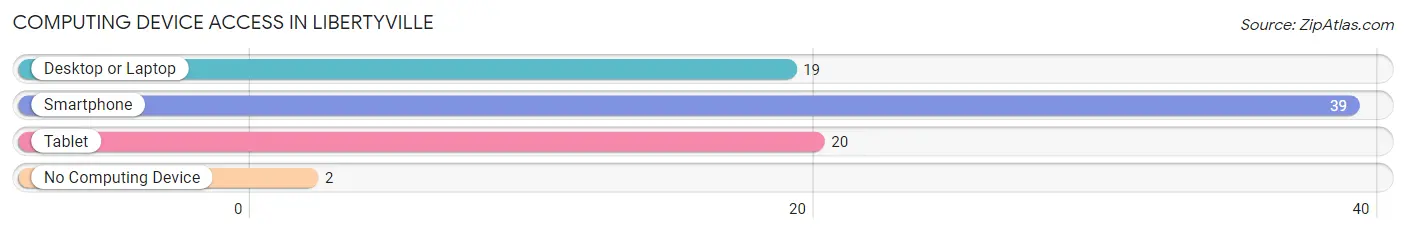
| Device Type | # Households | % Households |
| Desktop or Laptop | 19 | 44.2% |
| Smartphone | 39 | 90.7% |
| Tablet | 20 | 46.5% |
| No Computing Device | 2 | 4.6% |
| Total | 43 | 100.0% |
Internet Access in Libertyville
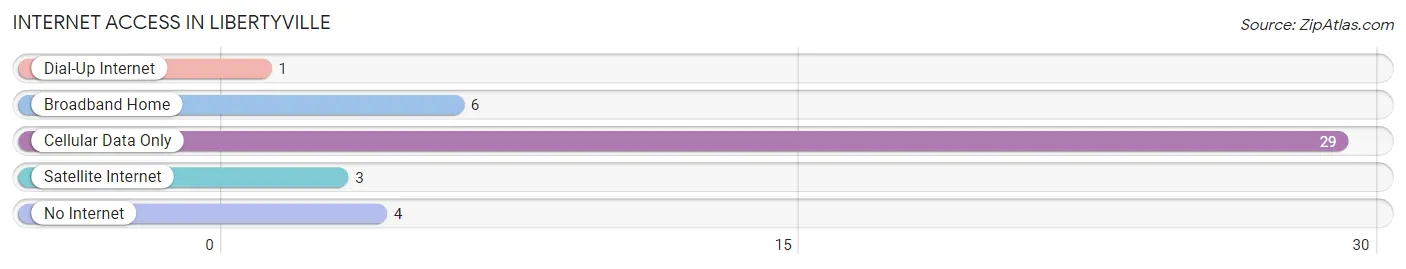
| Internet Type | # Households | % Households |
| Dial-Up Internet | 1 | 2.3% |
| Broadband Home | 6 | 14.0% |
| Cellular Data Only | 29 | 67.4% |
| Satellite Internet | 3 | 7.0% |
| No Internet | 4 | 9.3% |
| Total | 43 | 100.0% |
Libertyville Summary
Libertyville is a small town located in the state of Alabama, in the United States. It is situated in the northwest corner of the state, in the foothills of the Appalachian Mountains. The town is located in the county of Marshall, and is part of the Huntsville-Decatur Combined Statistical Area. The population of Libertyville was estimated to be 1,845 in the year 2020.
Geography
Libertyville is located in the northwest corner of the state of Alabama, in the foothills of the Appalachian Mountains. The town is situated in the county of Marshall, and is part of the Huntsville-Decatur Combined Statistical Area. The town is located at an elevation of 845 feet above sea level. The town is located in the Tennessee Valley, and is surrounded by the towns of Guntersville, Albertville, and Arab. The town is located near the Tennessee River, and is approximately 30 miles from the city of Huntsville.
Climate
Libertyville has a humid subtropical climate, with hot summers and mild winters. The average temperature in the summer months is around 80 degrees Fahrenheit, while the average temperature in the winter months is around 50 degrees Fahrenheit. The town receives an average of 48 inches of precipitation per year, with most of the precipitation occurring in the spring and summer months.
Demographics
As of the 2020 census, the population of Libertyville was estimated to be 1,845. The racial makeup of the town was 94.2% White, 2.2% African American, 0.3% Native American, 0.7% Asian, 0.1% Pacific Islander, 0.7% from other races, and 1.9% from two or more races. Hispanic or Latino of any race were 2.2% of the population.
Economy
The economy of Libertyville is largely based on agriculture and manufacturing. The town is home to several small businesses, including a grocery store, a hardware store, and a few restaurants. The town is also home to a number of small farms, which produce a variety of crops, including corn, soybeans, and cotton. The town is also home to a number of manufacturing companies, which produce a variety of products, including furniture, clothing, and automotive parts.
History
Libertyville was founded in 1818 by settlers from North Carolina. The town was named after the Liberty family, who were among the first settlers in the area. The town was originally a farming community, and the main crops grown in the area were corn, cotton, and tobacco. In the late 19th century, the town began to grow and develop, and several businesses were established in the area. The town was incorporated in 1891, and the population of the town began to grow steadily. In the early 20th century, the town began to experience a period of economic growth, and several new businesses were established in the area. The town continued to grow and develop throughout the 20th century, and today it is a thriving small town with a strong economy.
Common Questions
What is Per Capita Income in Libertyville?
Per Capita income in Libertyville is $43,761.
What is the Median Family Income in Libertyville?
Median Family Income in Libertyville is $77,375.
What is the Median Household income in Libertyville?
Median Household Income in Libertyville is $76,875.
What is Inequality or Gini Index in Libertyville?
Inequality or Gini Index in Libertyville is 0.44.
What is the Total Population of Libertyville?
Total Population of Libertyville is 111.
What is the Total Male Population of Libertyville?
Total Male Population of Libertyville is 52.
What is the Total Female Population of Libertyville?
Total Female Population of Libertyville is 59.
What is the Ratio of Males per 100 Females in Libertyville?
There are 88.14 Males per 100 Females in Libertyville.
What is the Ratio of Females per 100 Males in Libertyville?
There are 113.46 Females per 100 Males in Libertyville.
What is the Median Population Age in Libertyville?
Median Population Age in Libertyville is 38.8 Years.
What is the Average Family Size in Libertyville
Average Family Size in Libertyville is 3.1 People.
What is the Average Household Size in Libertyville
Average Household Size in Libertyville is 2.6 People.
How Large is the Labor Force in Libertyville?
There are 60 People in the Labor Forcein in Libertyville.
What is the Percentage of People in the Labor Force in Libertyville?
69.0% of People are in the Labor Force in Libertyville.