Sweet Water, AL Map & Demographics
Sweet Water Map
Sweet Water Overview
$44,634
PER CAPITA INCOME
$128,750
AVG FAMILY INCOME
$78,750
AVG HOUSEHOLD INCOME
0.57
INEQUALITY / GINI INDEX
239
TOTAL POPULATION
127
MALE POPULATION
112
FEMALE POPULATION
113.39
MALES / 100 FEMALES
88.19
FEMALES / 100 MALES
40.5
MEDIAN AGE
3.2
AVG FAMILY SIZE
2.6
AVG HOUSEHOLD SIZE
114
LABOR FORCE [ PEOPLE ]
57.6%
PERCENT IN LABOR FORCE
9.6%
UNEMPLOYMENT RATE
Sweet Water Zip Codes
Sweet Water Area Codes
Income in Sweet Water
Income Overview in Sweet Water
Per Capita Income in Sweet Water is $44,634, while median incomes of families and households are $128,750 and $78,750 respectively.
| Characteristic | Number | Measure |
| Per Capita Income | 239 | $44,634 |
| Median Family Income | 66 | $128,750 |
| Mean Family Income | 66 | $213,106 |
| Median Household Income | 93 | $78,750 |
| Mean Household Income | 93 | $161,384 |
| Income Deficit | 66 | $0 |
| Wage / Income Gap (%) | 239 | 0.00% |
| Wage / Income Gap ($) | 239 | 100.00¢ per $1 |
| Gini / Inequality Index | 239 | 0.57 |
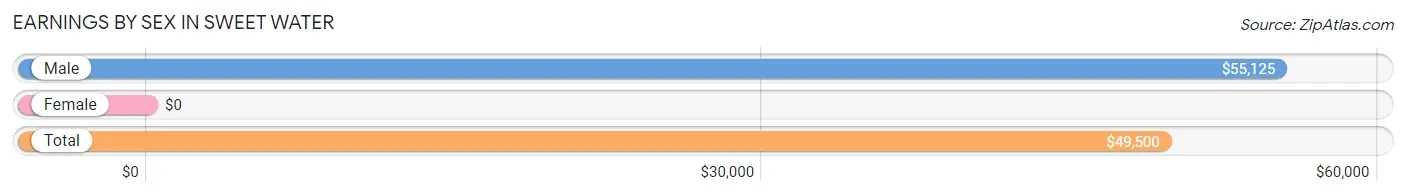
Earnings by Sex in Sweet Water
| Sex | Number | Average Earnings |
| Male | 73 (60.8%) | $55,125 |
| Female | 47 (39.2%) | $0 |
| Total | 120 (100.0%) | $49,500 |
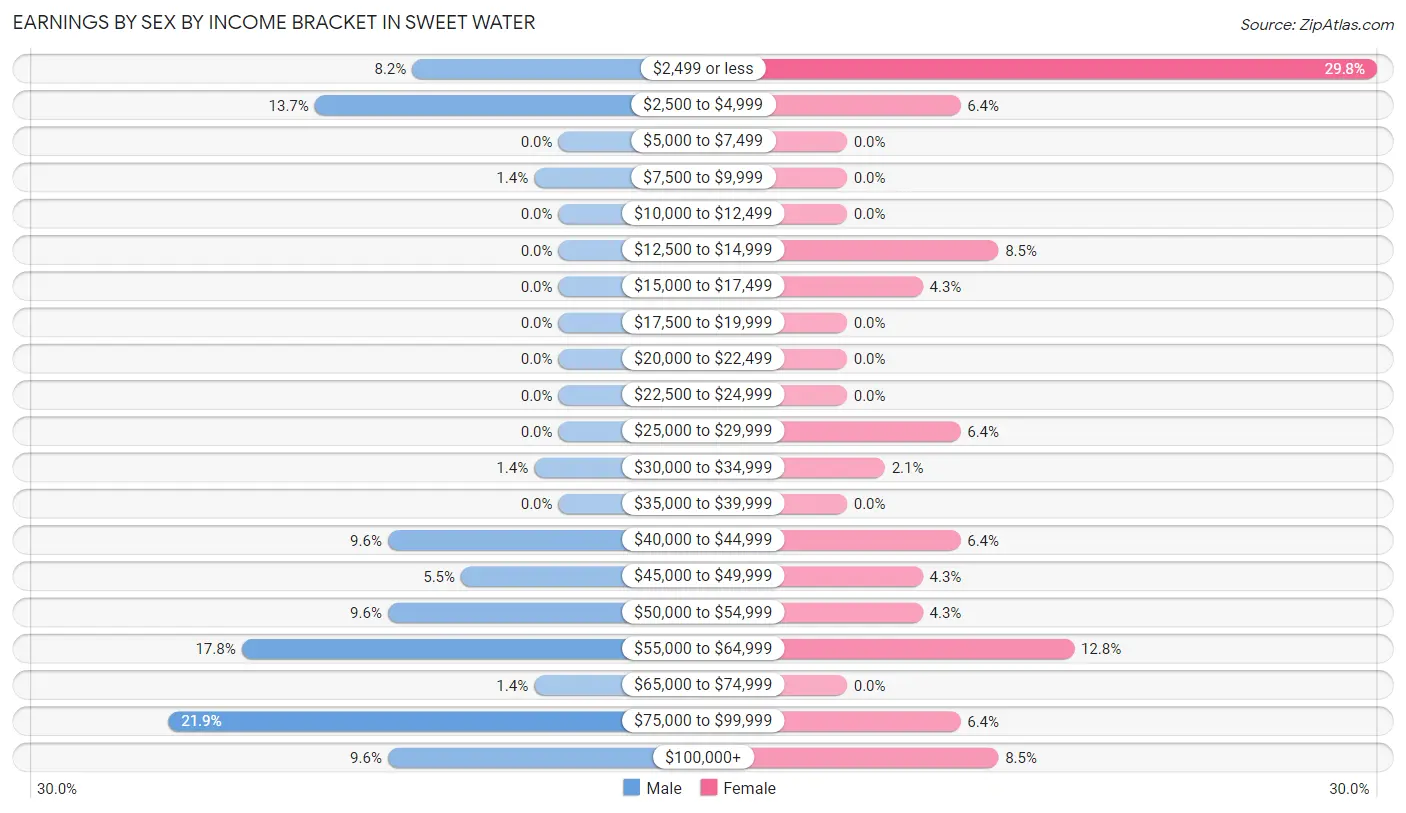
Earnings by Sex by Income Bracket in Sweet Water
The most common earnings brackets in Sweet Water are $75,000 to $99,999 for men (16 | 21.9%) and $2,499 or less for women (14 | 29.8%).
| Income | Male | Female |
| $2,499 or less | 6 (8.2%) | 14 (29.8%) |
| $2,500 to $4,999 | 10 (13.7%) | 3 (6.4%) |
| $5,000 to $7,499 | 0 (0.0%) | 0 (0.0%) |
| $7,500 to $9,999 | 1 (1.4%) | 0 (0.0%) |
| $10,000 to $12,499 | 0 (0.0%) | 0 (0.0%) |
| $12,500 to $14,999 | 0 (0.0%) | 4 (8.5%) |
| $15,000 to $17,499 | 0 (0.0%) | 2 (4.3%) |
| $17,500 to $19,999 | 0 (0.0%) | 0 (0.0%) |
| $20,000 to $22,499 | 0 (0.0%) | 0 (0.0%) |
| $22,500 to $24,999 | 0 (0.0%) | 0 (0.0%) |
| $25,000 to $29,999 | 0 (0.0%) | 3 (6.4%) |
| $30,000 to $34,999 | 1 (1.4%) | 1 (2.1%) |
| $35,000 to $39,999 | 0 (0.0%) | 0 (0.0%) |
| $40,000 to $44,999 | 7 (9.6%) | 3 (6.4%) |
| $45,000 to $49,999 | 4 (5.5%) | 2 (4.3%) |
| $50,000 to $54,999 | 7 (9.6%) | 2 (4.3%) |
| $55,000 to $64,999 | 13 (17.8%) | 6 (12.8%) |
| $65,000 to $74,999 | 1 (1.4%) | 0 (0.0%) |
| $75,000 to $99,999 | 16 (21.9%) | 3 (6.4%) |
| $100,000+ | 7 (9.6%) | 4 (8.5%) |
| Total | 73 (100.0%) | 47 (100.0%) |
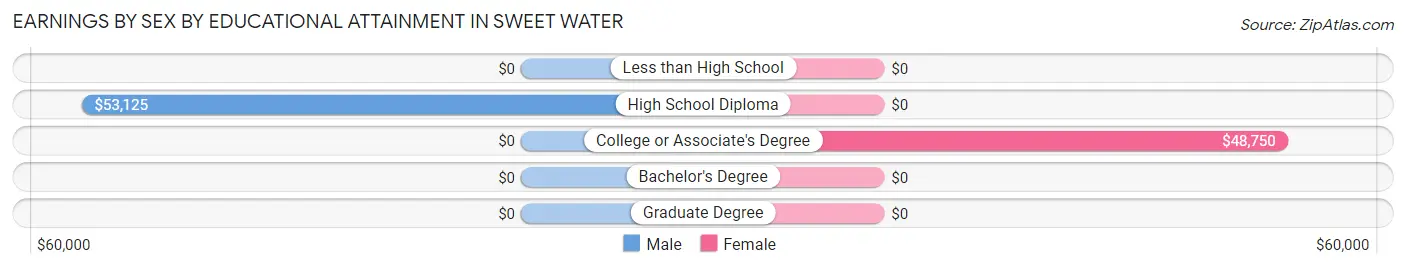
Earnings by Sex by Educational Attainment in Sweet Water
Average earnings in Sweet Water are $56,250 for men and $48,125 for women, a difference of 14.4%. Men with an educational attainment of high school diploma enjoy the highest average annual earnings of $53,125, while those with high school diploma education earn the least with $53,125. Women with an educational attainment of college or associate's degree earn the most with the average annual earnings of $48,750, while those with college or associate's degree education have the smallest earnings of $48,750.
| Educational Attainment | Male Income | Female Income |
| Less than High School | - | - |
| High School Diploma | $53,125 | $0 |
| College or Associate's Degree | - | - |
| Bachelor's Degree | - | - |
| Graduate Degree | - | - |
| Total | $56,250 | $48,125 |
Family Income in Sweet Water
Family Income Brackets in Sweet Water
According to the Sweet Water family income data, there are 18 families falling into the $150,000 to $199,999 income range, which is the most common income bracket and makes up 27.3% of all families.
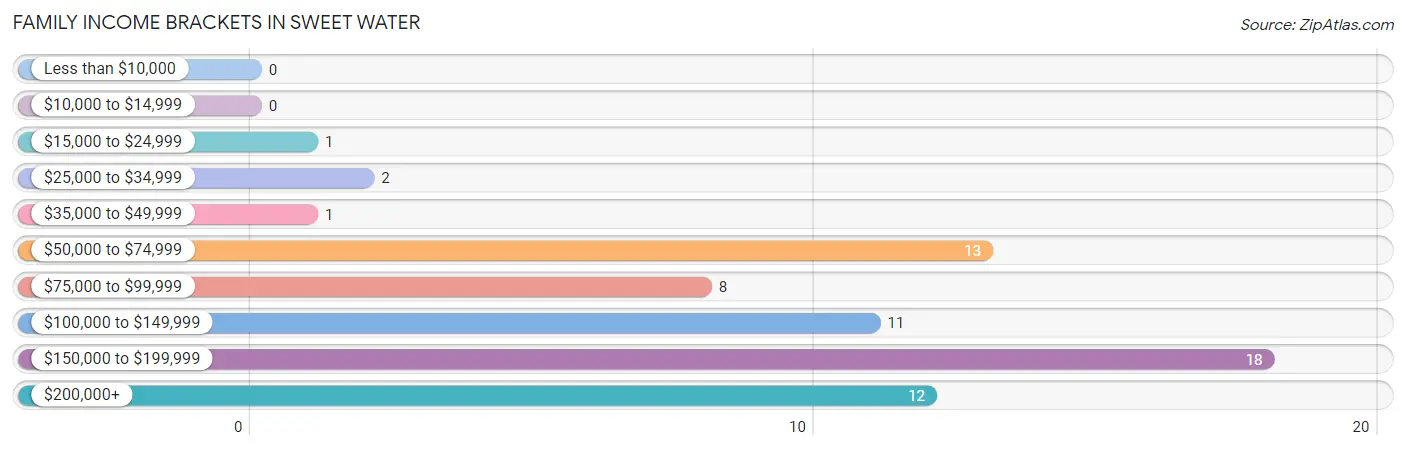
| Income Bracket | # Families | % Families |
| Less than $10,000 | 0 | 0.0% |
| $10,000 to $14,999 | 0 | 0.0% |
| $15,000 to $24,999 | 1 | 1.5% |
| $25,000 to $34,999 | 2 | 3.0% |
| $35,000 to $49,999 | 1 | 1.5% |
| $50,000 to $74,999 | 13 | 19.7% |
| $75,000 to $99,999 | 8 | 12.1% |
| $100,000 to $149,999 | 11 | 16.7% |
| $150,000 to $199,999 | 18 | 27.3% |
| $200,000+ | 12 | 18.2% |
Family Income by Famaliy Size in Sweet Water
3-person families (22 | 33.3%) account for the highest median family income in Sweet Water with $150,769 per family, while 3-person families (22 | 33.3%) have the highest median income of $50,256 per family member.
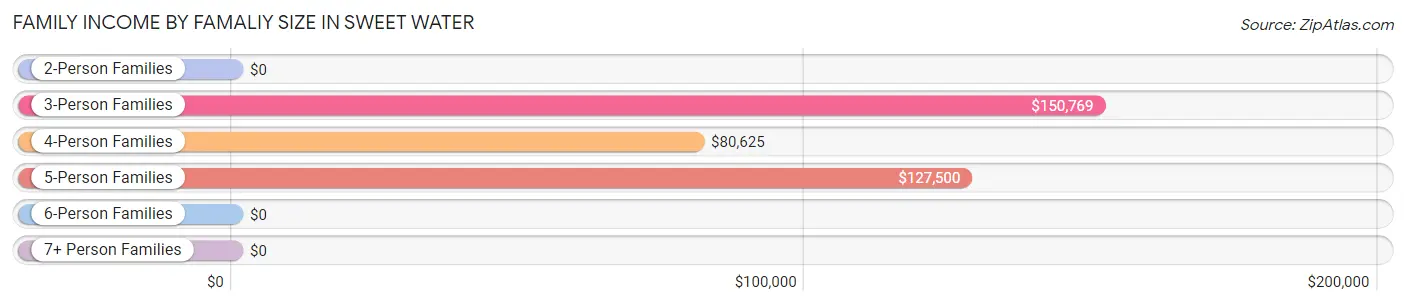
| Income Bracket | # Families | Median Income |
| 2-Person Families | 29 (43.9%) | $0 |
| 3-Person Families | 22 (33.3%) | $150,769 |
| 4-Person Families | 9 (13.6%) | $80,625 |
| 5-Person Families | 6 (9.1%) | $127,500 |
| 6-Person Families | 0 (0.0%) | $0 |
| 7+ Person Families | 0 (0.0%) | $0 |
| Total | 66 (100.0%) | $128,750 |
Family Income by Number of Earners in Sweet Water
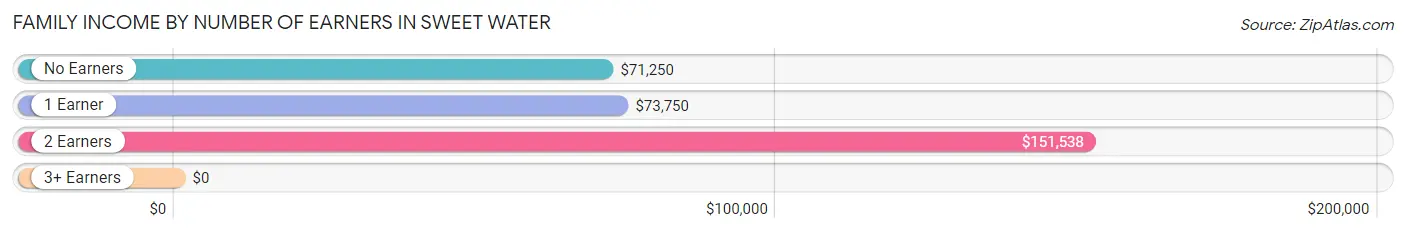
| Number of Earners | # Families | Median Income |
| No Earners | 13 (19.7%) | $71,250 |
| 1 Earner | 6 (9.1%) | $73,750 |
| 2 Earners | 40 (60.6%) | $151,538 |
| 3+ Earners | 7 (10.6%) | $0 |
| Total | 66 (100.0%) | $128,750 |
Household Income in Sweet Water
Household Income Brackets in Sweet Water
With 18 households falling in the category, the $35,000 to $49,999 income range is the most frequent in Sweet Water, accounting for 19.4% of all households. In contrast, only 2 households (2.1%) fall into the less than $10,000 income bracket, making it the least populous group.
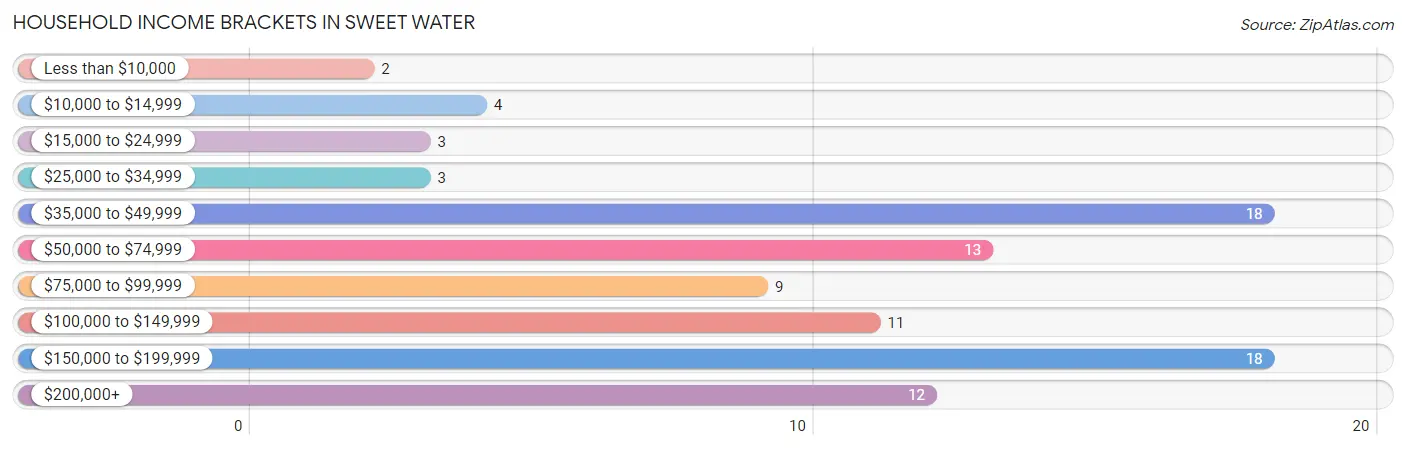
| Income Bracket | # Households | % Households |
| Less than $10,000 | 2 | 2.2% |
| $10,000 to $14,999 | 4 | 4.3% |
| $15,000 to $24,999 | 3 | 3.2% |
| $25,000 to $34,999 | 3 | 3.2% |
| $35,000 to $49,999 | 18 | 19.4% |
| $50,000 to $74,999 | 13 | 14.0% |
| $75,000 to $99,999 | 9 | 9.7% |
| $100,000 to $149,999 | 11 | 11.8% |
| $150,000 to $199,999 | 18 | 19.4% |
| $200,000+ | 12 | 12.9% |
Household Income by Householder Age in Sweet Water
The median household income in Sweet Water is $78,750, with the highest median household income of $150,192 found in the 45 to 64 years age bracket for the primary householder. A total of 48 households (51.6%) fall into this category. Meanwhile, the 15 to 24 years age bracket for the primary householder has the lowest median household income of $0, with 1 households (1.1%) in this group.
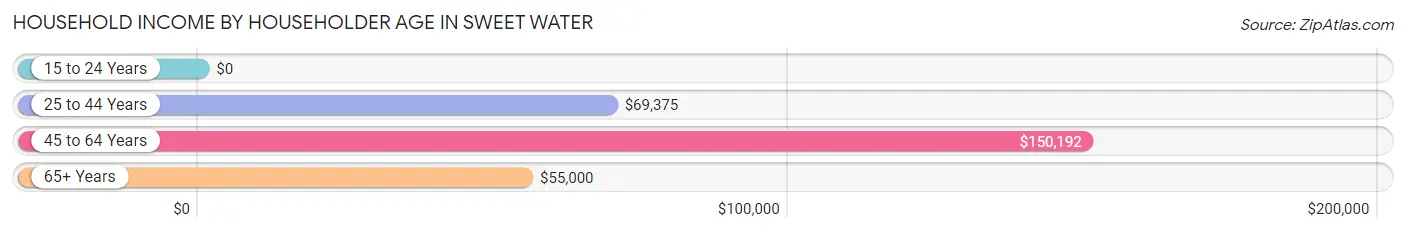
| Income Bracket | # Households | Median Income |
| 15 to 24 Years | 1 (1.1%) | $0 |
| 25 to 44 Years | 24 (25.8%) | $69,375 |
| 45 to 64 Years | 48 (51.6%) | $150,192 |
| 65+ Years | 20 (21.5%) | $55,000 |
| Total | 93 (100.0%) | $78,750 |
Poverty in Sweet Water
Income Below Poverty by Sex and Age in Sweet Water
With 2.4% poverty level for males and 4.5% for females among the residents of Sweet Water, 55 to 64 year old males and 55 to 64 year old females are the most vulnerable to poverty, with 1 males (9.1%) and 5 females (41.7%) in their respective age groups living below the poverty level.
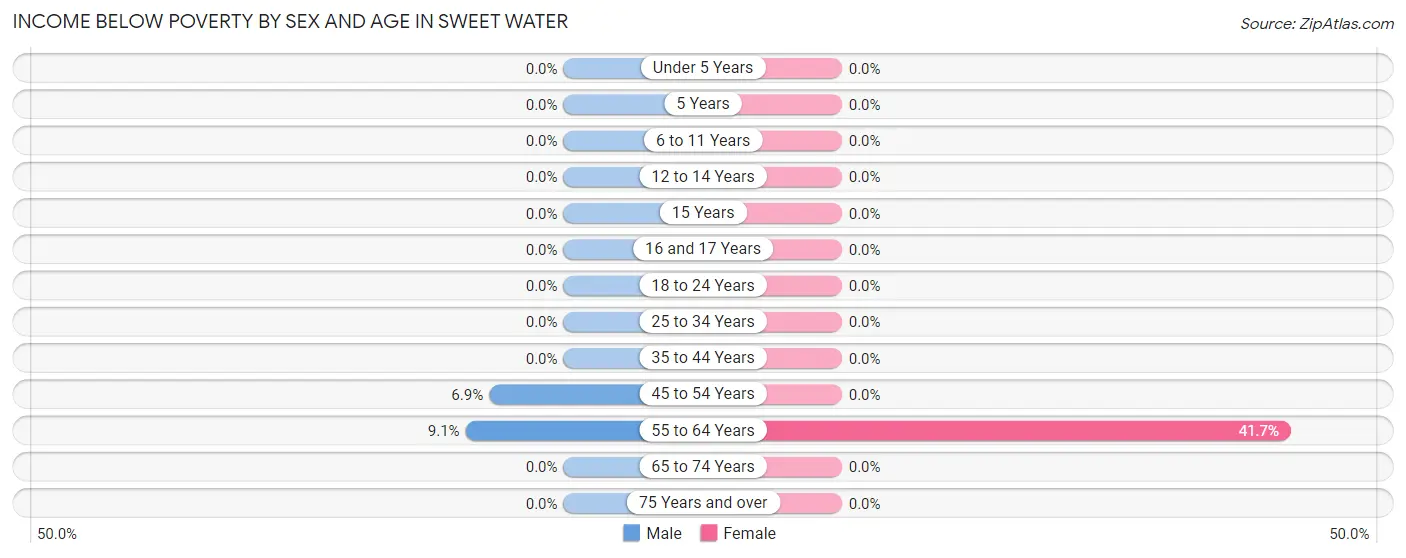
| Age Bracket | Male | Female |
| Under 5 Years | 0 (0.0%) | 0 (0.0%) |
| 5 Years | 0 (0.0%) | 0 (0.0%) |
| 6 to 11 Years | 0 (0.0%) | 0 (0.0%) |
| 12 to 14 Years | 0 (0.0%) | 0 (0.0%) |
| 15 Years | 0 (0.0%) | 0 (0.0%) |
| 16 and 17 Years | 0 (0.0%) | 0 (0.0%) |
| 18 to 24 Years | 0 (0.0%) | 0 (0.0%) |
| 25 to 34 Years | 0 (0.0%) | 0 (0.0%) |
| 35 to 44 Years | 0 (0.0%) | 0 (0.0%) |
| 45 to 54 Years | 2 (6.9%) | 0 (0.0%) |
| 55 to 64 Years | 1 (9.1%) | 5 (41.7%) |
| 65 to 74 Years | 0 (0.0%) | 0 (0.0%) |
| 75 Years and over | 0 (0.0%) | 0 (0.0%) |
| Total | 3 (2.4%) | 5 (4.5%) |
Income Above Poverty by Sex and Age in Sweet Water
According to the poverty statistics in Sweet Water, males aged under 5 years and females aged under 5 years are the age groups that are most secure financially, with 100.0% of males and 100.0% of females in these age groups living above the poverty line.
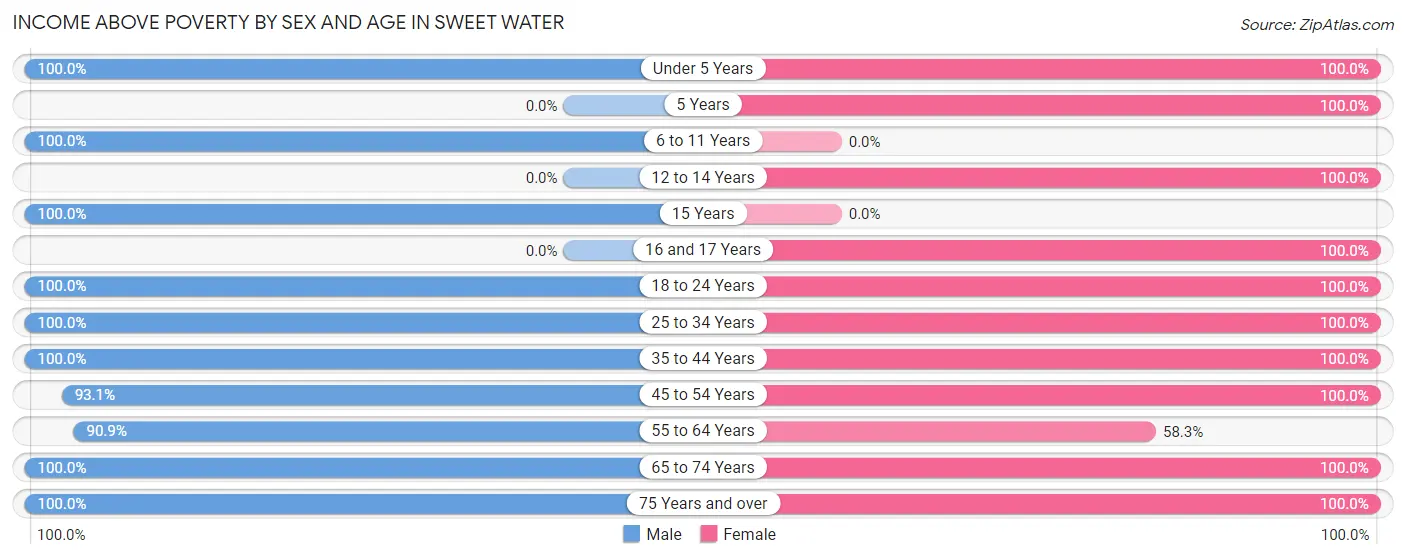
| Age Bracket | Male | Female |
| Under 5 Years | 8 (100.0%) | 8 (100.0%) |
| 5 Years | 0 (0.0%) | 3 (100.0%) |
| 6 to 11 Years | 6 (100.0%) | 0 (0.0%) |
| 12 to 14 Years | 0 (0.0%) | 12 (100.0%) |
| 15 Years | 4 (100.0%) | 0 (0.0%) |
| 16 and 17 Years | 0 (0.0%) | 5 (100.0%) |
| 18 to 24 Years | 20 (100.0%) | 23 (100.0%) |
| 25 to 34 Years | 3 (100.0%) | 11 (100.0%) |
| 35 to 44 Years | 27 (100.0%) | 9 (100.0%) |
| 45 to 54 Years | 27 (93.1%) | 15 (100.0%) |
| 55 to 64 Years | 10 (90.9%) | 7 (58.3%) |
| 65 to 74 Years | 5 (100.0%) | 4 (100.0%) |
| 75 Years and over | 14 (100.0%) | 10 (100.0%) |
| Total | 124 (97.6%) | 107 (95.5%) |
Income Below Poverty Among Married-Couple Families in Sweet Water
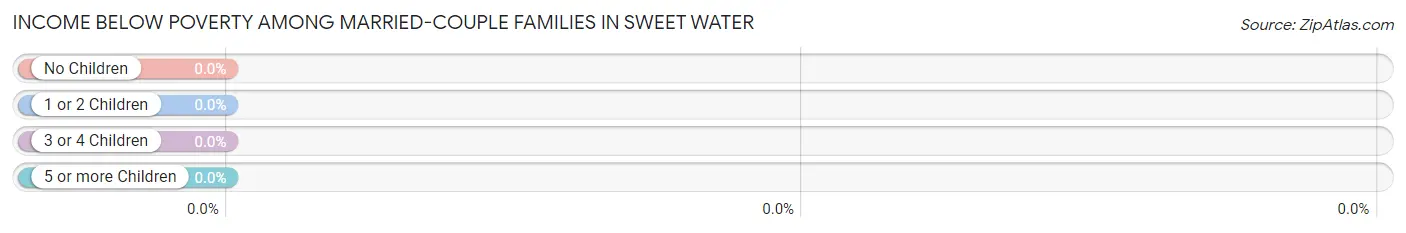
| Children | Above Poverty | Below Poverty |
| No Children | 36 (100.0%) | 0 (0.0%) |
| 1 or 2 Children | 24 (100.0%) | 0 (0.0%) |
| 3 or 4 Children | 3 (100.0%) | 0 (0.0%) |
| 5 or more Children | 0 (0.0%) | 0 (0.0%) |
| Total | 63 (100.0%) | 0 (0.0%) |
Income Below Poverty Among Single-Parent Households in Sweet Water
| Children | Single Father | Single Mother |
| No Children | 0 (0.0%) | 0 (0.0%) |
| 1 or 2 Children | 0 (0.0%) | 0 (0.0%) |
| 3 or 4 Children | 0 (0.0%) | 0 (0.0%) |
| 5 or more Children | 0 (0.0%) | 0 (0.0%) |
| Total | 0 (0.0%) | 0 (0.0%) |
Income Below Poverty Among Married-Couple vs Single-Parent Households in Sweet Water
| Children | Married-Couple Families | Single-Parent Households |
| No Children | 0 (0.0%) | 0 (0.0%) |
| 1 or 2 Children | 0 (0.0%) | 0 (0.0%) |
| 3 or 4 Children | 0 (0.0%) | 0 (0.0%) |
| 5 or more Children | 0 (0.0%) | 0 (0.0%) |
| Total | 0 (0.0%) | 0 (0.0%) |
Race in Sweet Water
The most populous races in Sweet Water are White / Caucasian (235 | 98.3%), and Black / African American (4 | 1.7%).
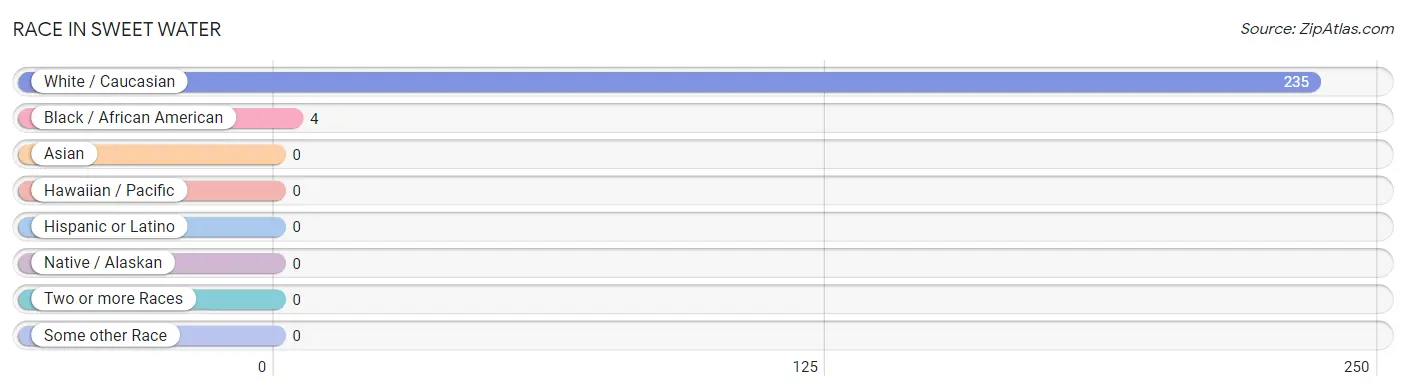
| Race | # Population | % Population |
| Asian | 0 | 0.0% |
| Black / African American | 4 | 1.7% |
| Hawaiian / Pacific | 0 | 0.0% |
| Hispanic or Latino | 0 | 0.0% |
| Native / Alaskan | 0 | 0.0% |
| White / Caucasian | 235 | 98.3% |
| Two or more Races | 0 | 0.0% |
| Some other Race | 0 | 0.0% |
| Total | 239 | 100.0% |
Ancestry in Sweet Water
The most populous ancestries reported in Sweet Water are American (50 | 20.9%), English (18 | 7.5%), Irish (15 | 6.3%), Scottish (15 | 6.3%), and German (6 | 2.5%), together accounting for 43.5% of all Sweet Water residents.
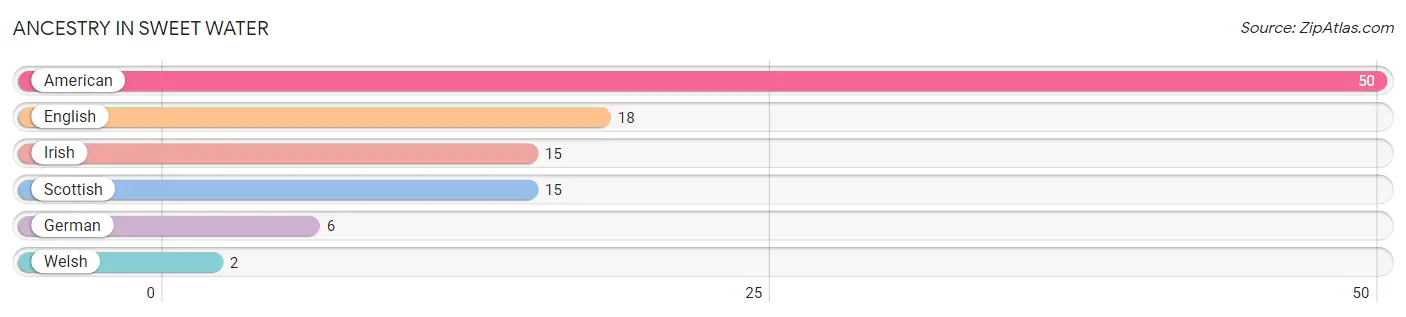
| Ancestry | # Population | % Population |
| American | 50 | 20.9% |
| English | 18 | 7.5% |
| German | 6 | 2.5% |
| Irish | 15 | 6.3% |
| Scottish | 15 | 6.3% |
| Welsh | 2 | 0.8% | View All 6 Rows |
Immigrants in Sweet Water

| Immigration Origin | # Population | % Population | View All 0 Rows |
Sex and Age in Sweet Water
Sex and Age in Sweet Water
The most populous age groups in Sweet Water are 50 to 54 Years (26 | 20.5%) for men and 15 to 19 Years (28 | 25.0%) for women.
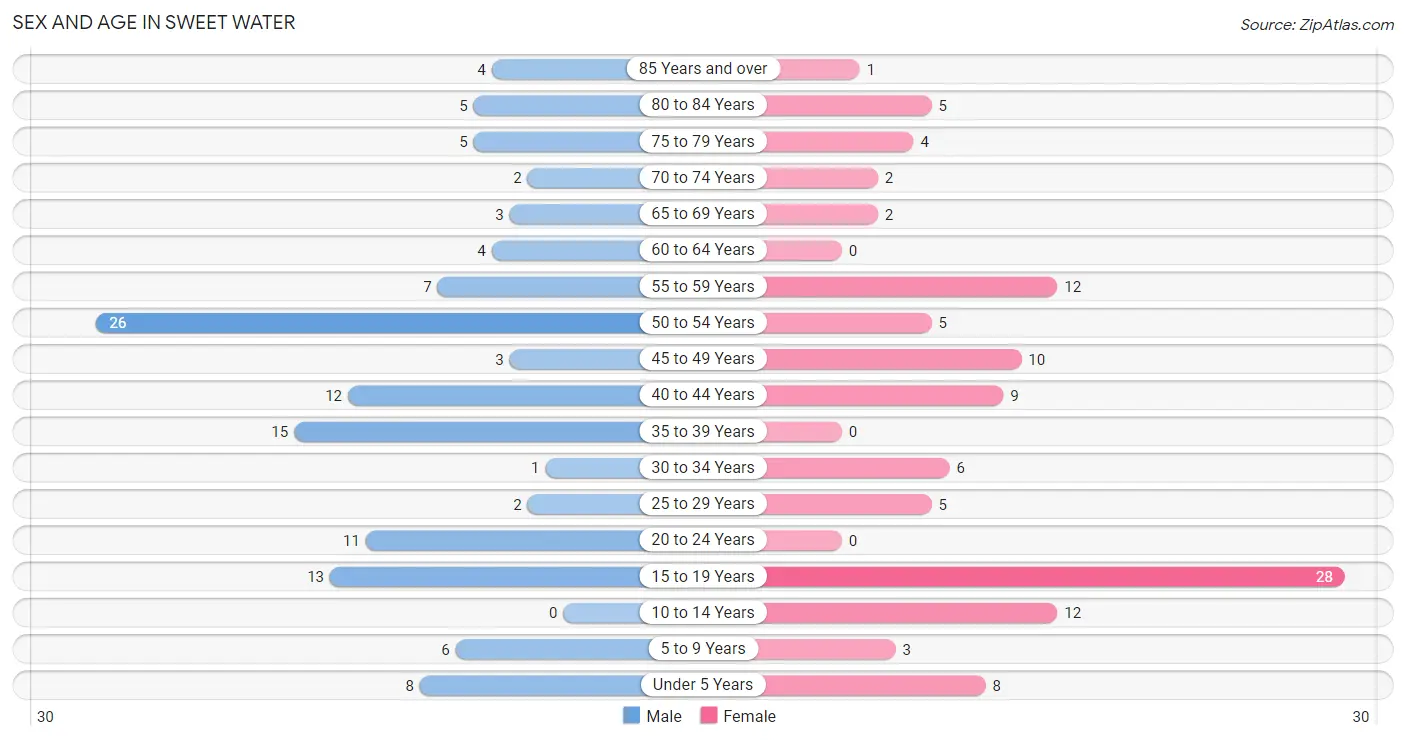
| Age Bracket | Male | Female |
| Under 5 Years | 8 (6.3%) | 8 (7.1%) |
| 5 to 9 Years | 6 (4.7%) | 3 (2.7%) |
| 10 to 14 Years | 0 (0.0%) | 12 (10.7%) |
| 15 to 19 Years | 13 (10.2%) | 28 (25.0%) |
| 20 to 24 Years | 11 (8.7%) | 0 (0.0%) |
| 25 to 29 Years | 2 (1.6%) | 5 (4.5%) |
| 30 to 34 Years | 1 (0.8%) | 6 (5.4%) |
| 35 to 39 Years | 15 (11.8%) | 0 (0.0%) |
| 40 to 44 Years | 12 (9.5%) | 9 (8.0%) |
| 45 to 49 Years | 3 (2.4%) | 10 (8.9%) |
| 50 to 54 Years | 26 (20.5%) | 5 (4.5%) |
| 55 to 59 Years | 7 (5.5%) | 12 (10.7%) |
| 60 to 64 Years | 4 (3.2%) | 0 (0.0%) |
| 65 to 69 Years | 3 (2.4%) | 2 (1.8%) |
| 70 to 74 Years | 2 (1.6%) | 2 (1.8%) |
| 75 to 79 Years | 5 (3.9%) | 4 (3.6%) |
| 80 to 84 Years | 5 (3.9%) | 5 (4.5%) |
| 85 Years and over | 4 (3.2%) | 1 (0.9%) |
| Total | 127 (100.0%) | 112 (100.0%) |
Families and Households in Sweet Water
Median Family Size in Sweet Water
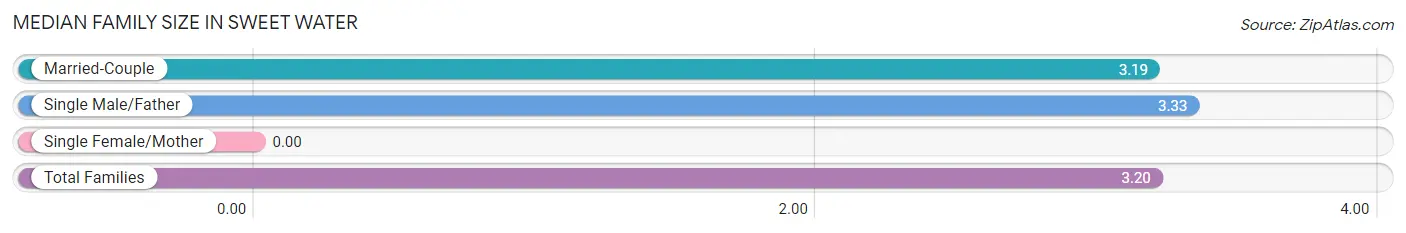
| Family Type | # Families | Family Size |
| Married-Couple | 63 (95.5%) | 3.19 |
| Single Male/Father | 3 (4.5%) | 3.33 |
| Single Female/Mother | 0 (0.0%) | - |
| Total Families | 66 (100.0%) | 3.20 |
Median Household Size in Sweet Water
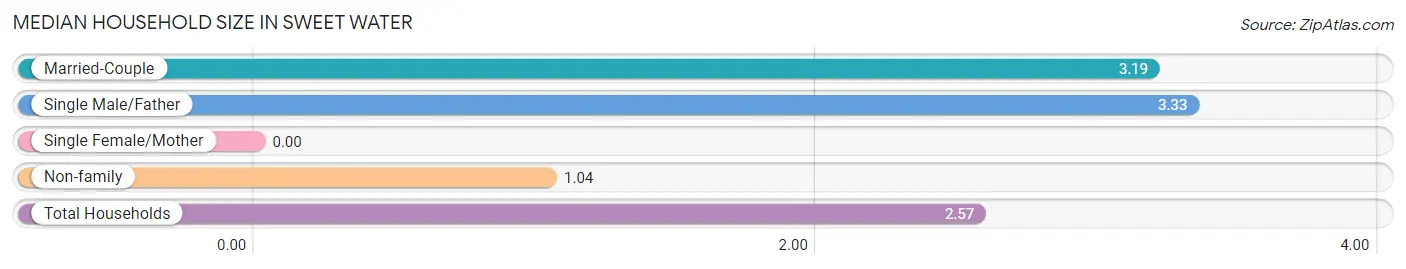
| Household Type | # Households | Household Size |
| Married-Couple | 63 (67.7%) | 3.19 |
| Single Male/Father | 3 (3.2%) | 3.33 |
| Single Female/Mother | 0 (0.0%) | - |
| Non-family | 27 (29.0%) | 1.04 |
| Total Households | 93 (100.0%) | 2.57 |
Household Size by Marriage Status in Sweet Water
Out of a total of 93 households in Sweet Water, 66 (71.0%) are family households, while 27 (29.0%) are nonfamily households. The most numerous type of family households are 2-person households, comprising 29, and the most common type of nonfamily households are 1-person households, comprising 26.
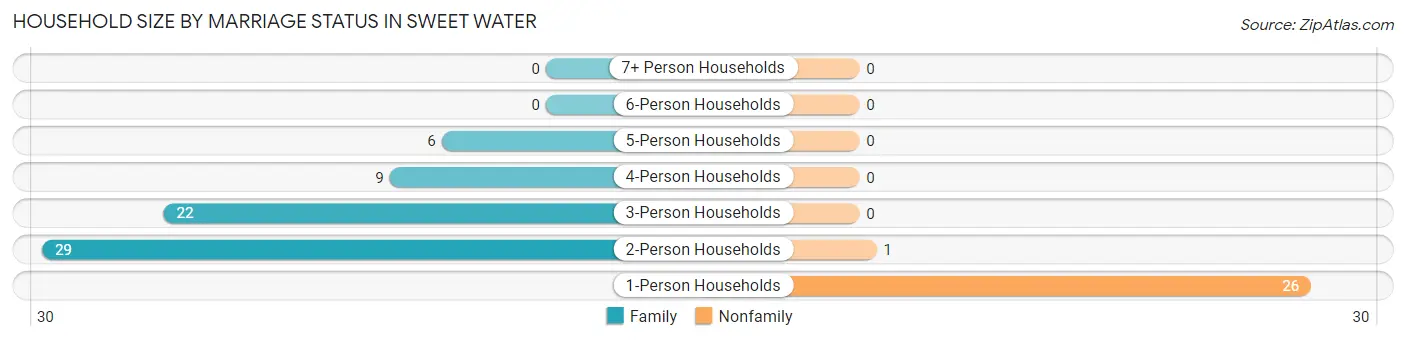
| Household Size | Family Households | Nonfamily Households |
| 1-Person Households | - | 26 (28.0%) |
| 2-Person Households | 29 (31.2%) | 1 (1.1%) |
| 3-Person Households | 22 (23.7%) | 0 (0.0%) |
| 4-Person Households | 9 (9.7%) | 0 (0.0%) |
| 5-Person Households | 6 (6.5%) | 0 (0.0%) |
| 6-Person Households | 0 (0.0%) | 0 (0.0%) |
| 7+ Person Households | 0 (0.0%) | 0 (0.0%) |
| Total | 66 (71.0%) | 27 (29.0%) |
Female Fertility in Sweet Water
Fertility by Age in Sweet Water
Average fertility rate in Sweet Water is 241.0 births per 1,000 women. Women in the age bracket of 20 to 34 years have the highest fertility rate with 455.0 births per 1,000 women. Women in the age bracket of 15 to 19 years acount for 64.3% of all women with births.
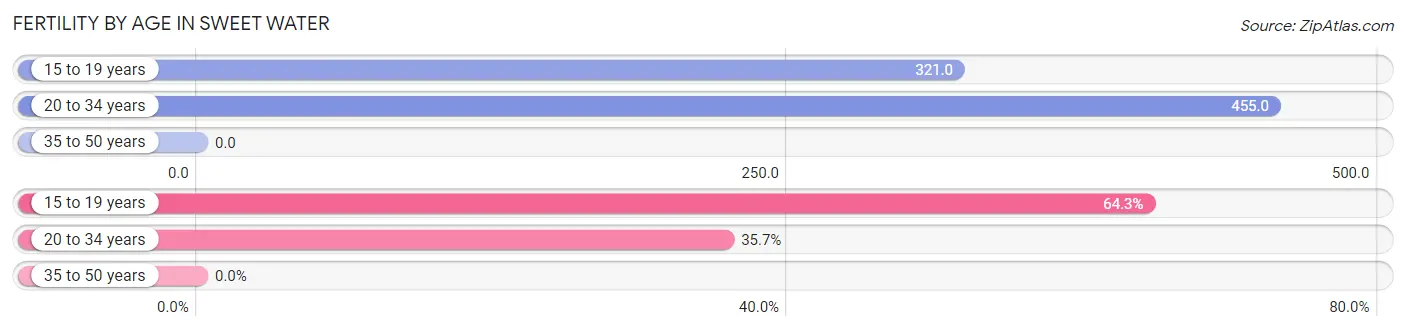
| Age Bracket | Women with Births | Births / 1,000 Women |
| 15 to 19 years | 9 (64.3%) | 321.0 |
| 20 to 34 years | 5 (35.7%) | 455.0 |
| 35 to 50 years | 0 (0.0%) | 0.0 |
| Total | 14 (100.0%) | 241.0 |
Fertility by Age by Marriage Status in Sweet Water
35.7% of women with births (14) in Sweet Water are married. The highest percentage of unmarried women with births falls into 15 to 19 years age bracket with 100.0% of them unmarried at the time of birth, while the lowest percentage of unmarried women with births belong to 20 to 34 years age bracket with 0.0% of them unmarried.
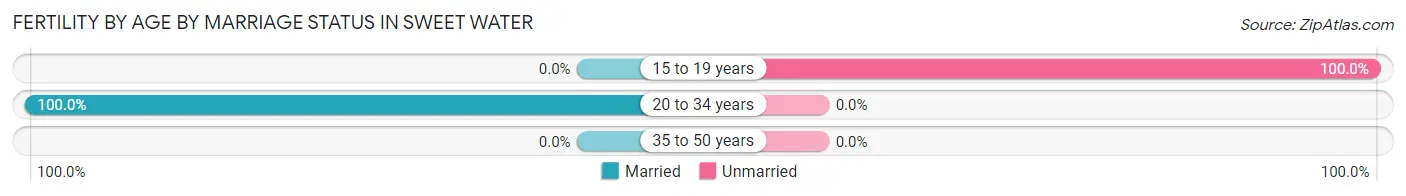
| Age Bracket | Married | Unmarried |
| 15 to 19 years | 0 (0.0%) | 9 (100.0%) |
| 20 to 34 years | 5 (100.0%) | 0 (0.0%) |
| 35 to 50 years | 0 (0.0%) | 0 (0.0%) |
| Total | 5 (35.7%) | 9 (64.3%) |
Fertility by Education in Sweet Water
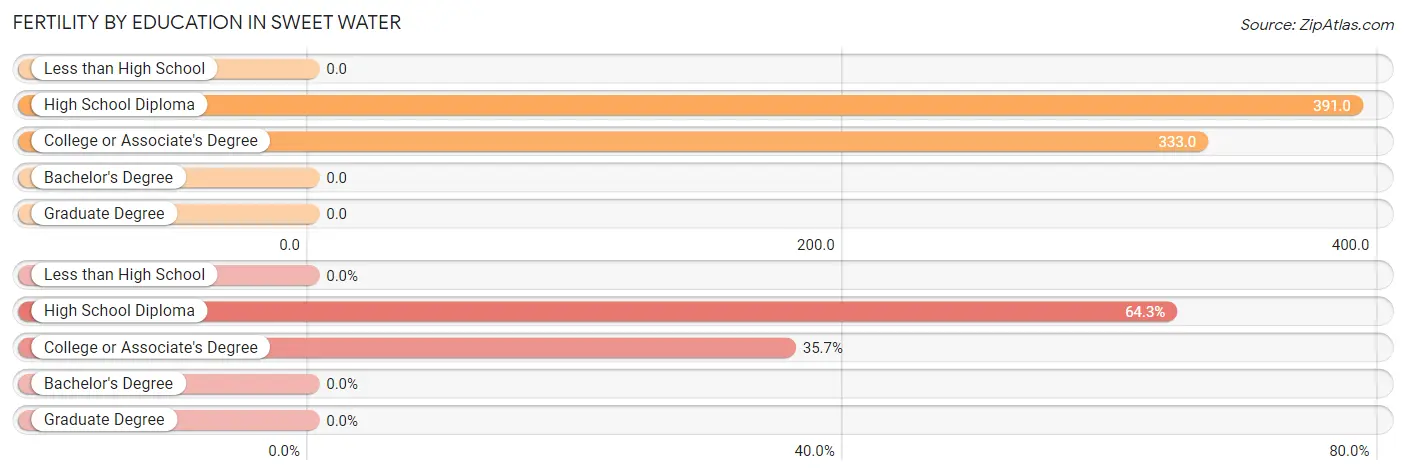
| Educational Attainment | Women with Births | Births / 1,000 Women |
| Less than High School | 0 (0.0%) | 0.0 |
| High School Diploma | 9 (64.3%) | 391.0 |
| College or Associate's Degree | 5 (35.7%) | 333.0 |
| Bachelor's Degree | 0 (0.0%) | 0.0 |
| Graduate Degree | 0 (0.0%) | 0.0 |
| Total | 14 (100.0%) | 241.0 |
Fertility by Education by Marriage Status in Sweet Water
64.3% of women with births in Sweet Water are unmarried. Women with the educational attainment of college or associate's degree are most likely to be married with 100.0% of them married at childbirth, while women with the educational attainment of high school diploma are least likely to be married with 100.0% of them unmarried at childbirth.
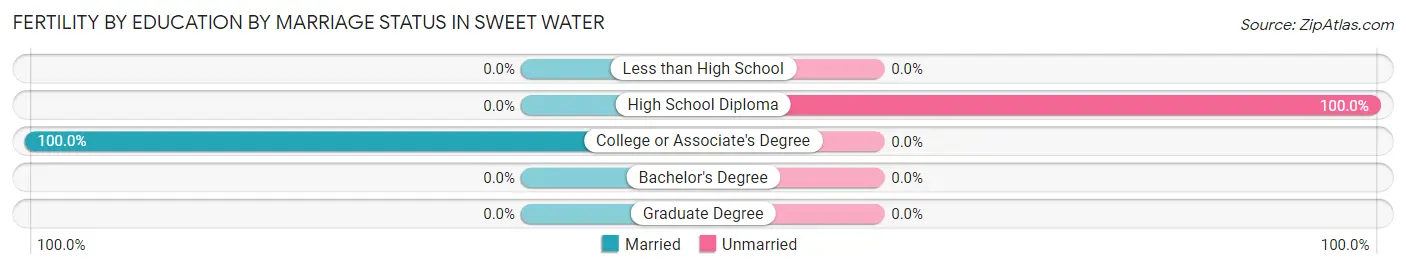
| Educational Attainment | Married | Unmarried |
| Less than High School | 0 (0.0%) | 0 (0.0%) |
| High School Diploma | 0 (0.0%) | 9 (100.0%) |
| College or Associate's Degree | 5 (100.0%) | 0 (0.0%) |
| Bachelor's Degree | 0 (0.0%) | 0 (0.0%) |
| Graduate Degree | 0 (0.0%) | 0 (0.0%) |
| Total | 5 (35.7%) | 9 (64.3%) |
Employment Characteristics in Sweet Water
Employment by Class of Employer in Sweet Water
Among the 103 employed individuals in Sweet Water, private company employees (60 | 58.3%), local government employees (24 | 23.3%), and state government employees (12 | 11.7%) make up the most common classes of employment.
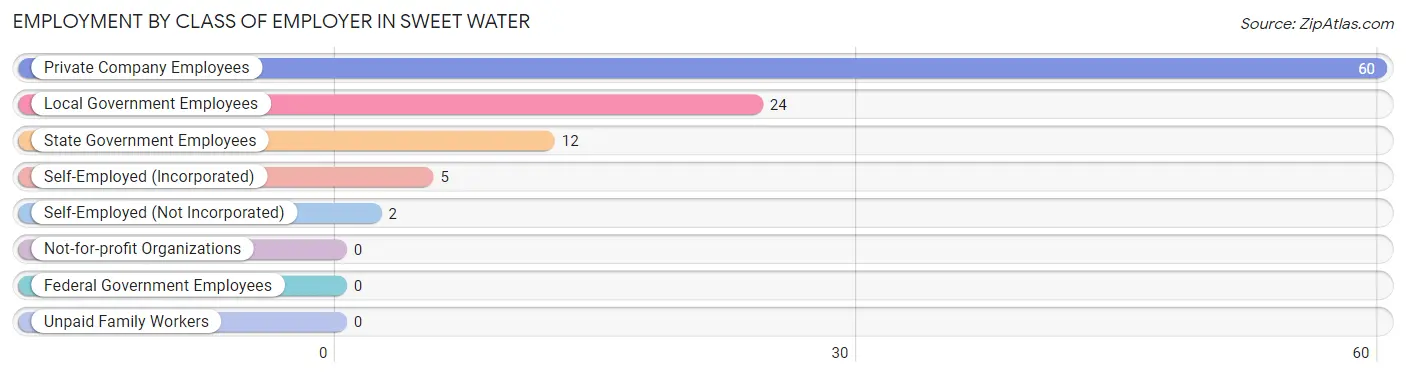
| Employer Class | # Employees | % Employees |
| Private Company Employees | 60 | 58.3% |
| Self-Employed (Incorporated) | 5 | 4.9% |
| Self-Employed (Not Incorporated) | 2 | 1.9% |
| Not-for-profit Organizations | 0 | 0.0% |
| Local Government Employees | 24 | 23.3% |
| State Government Employees | 12 | 11.7% |
| Federal Government Employees | 0 | 0.0% |
| Unpaid Family Workers | 0 | 0.0% |
| Total | 103 | 100.0% |
Employment Status by Age in Sweet Water
According to the labor force statistics for Sweet Water, out of the total population over 16 years of age (198), 57.6% or 114 individuals are in the labor force, with 9.6% or 11 of them unemployed. The age group with the highest labor force participation rate is 20 to 24 years, with 100.0% or 11 individuals in the labor force. Within the labor force, the 16 to 19 years age range has the highest percentage of unemployed individuals, with 100.0% or 11 of them being unemployed.
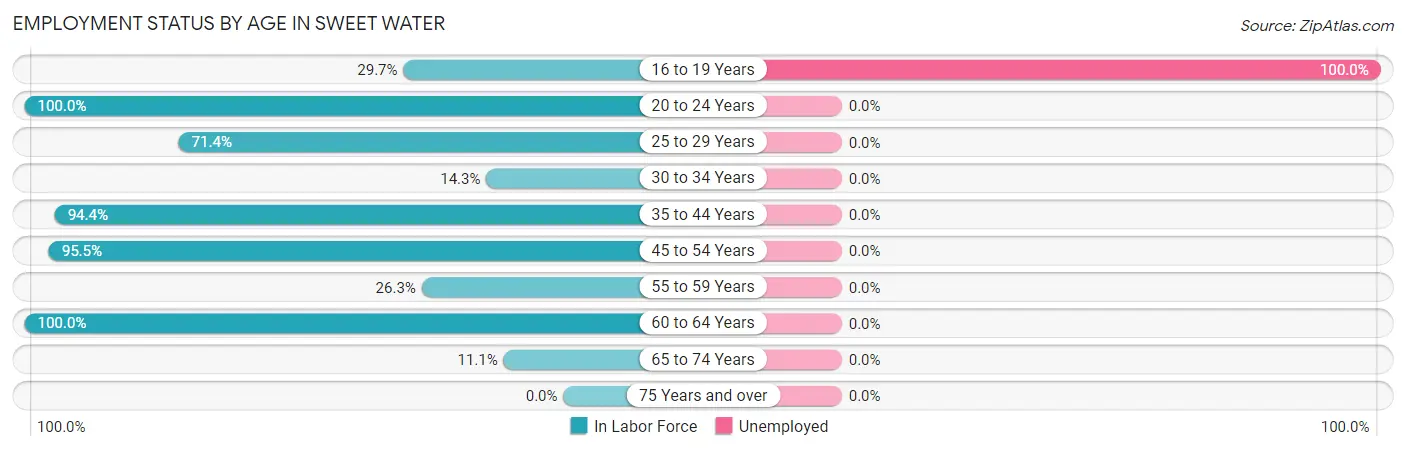
| Age Bracket | In Labor Force | Unemployed |
| 16 to 19 Years | 11 (29.7%) | 11 (100.0%) |
| 20 to 24 Years | 11 (100.0%) | 0 (0.0%) |
| 25 to 29 Years | 5 (71.4%) | 0 (0.0%) |
| 30 to 34 Years | 1 (14.3%) | 0 (0.0%) |
| 35 to 44 Years | 34 (94.4%) | 0 (0.0%) |
| 45 to 54 Years | 42 (95.5%) | 0 (0.0%) |
| 55 to 59 Years | 5 (26.3%) | 0 (0.0%) |
| 60 to 64 Years | 4 (100.0%) | 0 (0.0%) |
| 65 to 74 Years | 1 (11.1%) | 0 (0.0%) |
| 75 Years and over | 0 (0.0%) | 0 (0.0%) |
| Total | 114 (57.6%) | 11 (9.6%) |
Employment Status by Educational Attainment in Sweet Water
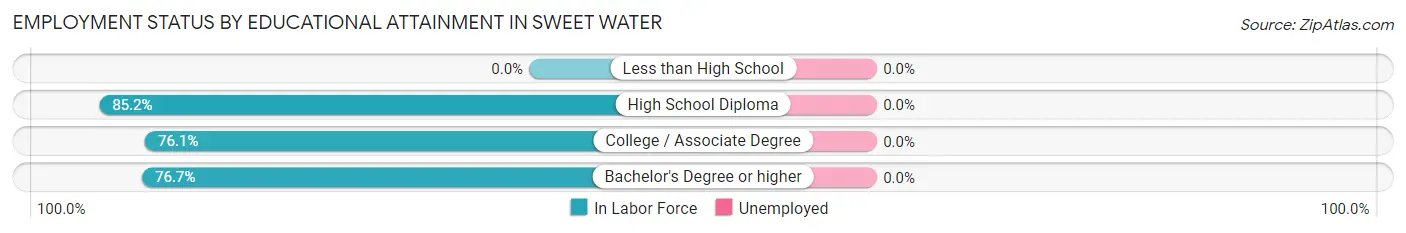
| Educational Attainment | In Labor Force | Unemployed |
| Less than High School | 0 (0.0%) | 0 (0.0%) |
| High School Diploma | 23 (85.2%) | 0 (0.0%) |
| College / Associate Degree | 35 (76.1%) | 0 (0.0%) |
| Bachelor's Degree or higher | 33 (76.7%) | 0 (0.0%) |
| Total | 91 (77.8%) | 0 (0.0%) |
Employment Occupations by Sex in Sweet Water
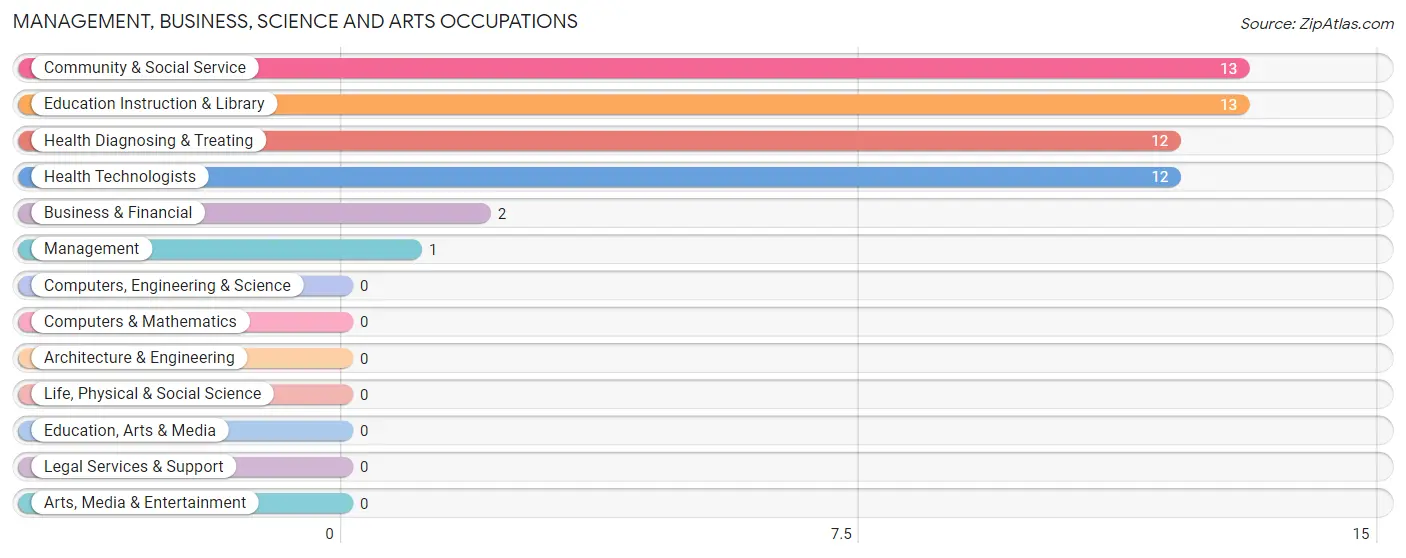
Management, Business, Science and Arts Occupations
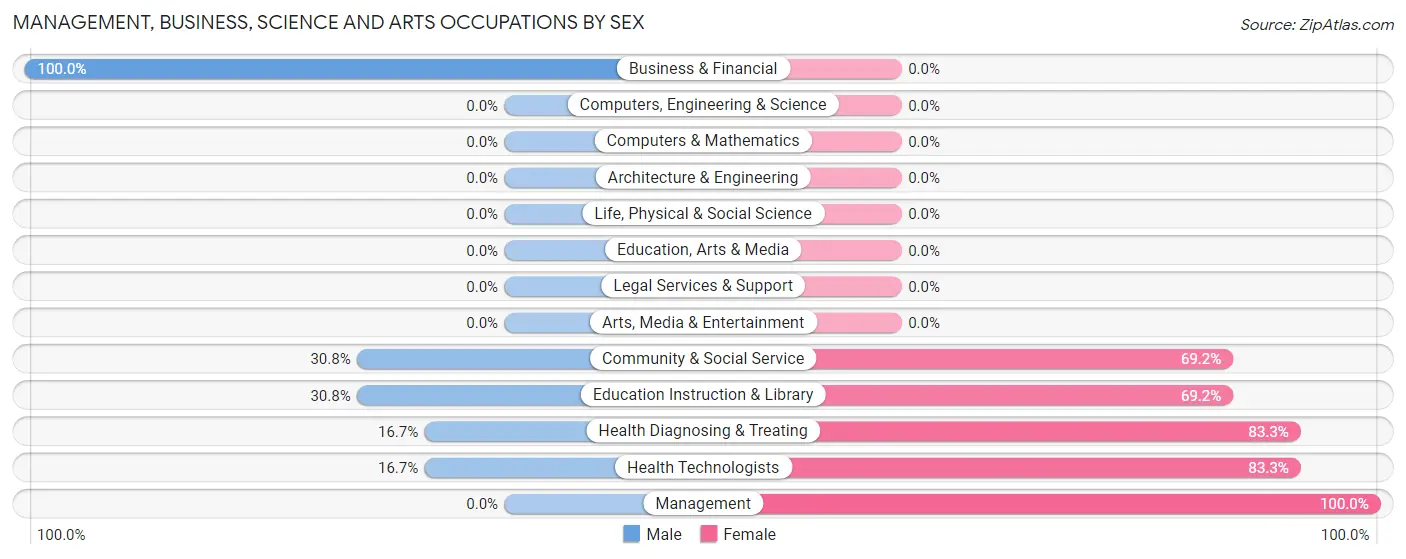
The most common Management, Business, Science and Arts occupations in Sweet Water are Community & Social Service (13 | 12.6%), Education Instruction & Library (13 | 12.6%), Health Diagnosing & Treating (12 | 11.7%), Health Technologists (12 | 11.7%), and Business & Financial (2 | 1.9%).
Management, Business, Science and Arts Occupations by Sex
Within the Management, Business, Science and Arts occupations in Sweet Water, the most male-oriented occupations are Business & Financial (100.0%), Community & Social Service (30.8%), and Education Instruction & Library (30.8%), while the most female-oriented occupations are Management (100.0%), Health Diagnosing & Treating (83.3%), and Health Technologists (83.3%).
| Occupation | Male | Female |
| Management | 0 (0.0%) | 1 (100.0%) |
| Business & Financial | 2 (100.0%) | 0 (0.0%) |
| Computers, Engineering & Science | 0 (0.0%) | 0 (0.0%) |
| Computers & Mathematics | 0 (0.0%) | 0 (0.0%) |
| Architecture & Engineering | 0 (0.0%) | 0 (0.0%) |
| Life, Physical & Social Science | 0 (0.0%) | 0 (0.0%) |
| Community & Social Service | 4 (30.8%) | 9 (69.2%) |
| Education, Arts & Media | 0 (0.0%) | 0 (0.0%) |
| Legal Services & Support | 0 (0.0%) | 0 (0.0%) |
| Education Instruction & Library | 4 (30.8%) | 9 (69.2%) |
| Arts, Media & Entertainment | 0 (0.0%) | 0 (0.0%) |
| Health Diagnosing & Treating | 2 (16.7%) | 10 (83.3%) |
| Health Technologists | 2 (16.7%) | 10 (83.3%) |
| Total (Category) | 8 (28.6%) | 20 (71.4%) |
| Total (Overall) | 73 (70.9%) | 30 (29.1%) |
Services Occupations
Services Occupations by Sex
| Occupation | Male | Female |
| Healthcare Support | 0 (0.0%) | 0 (0.0%) |
| Security & Protection | 0 (0.0%) | 0 (0.0%) |
| Firefighting & Prevention | 0 (0.0%) | 0 (0.0%) |
| Law Enforcement | 0 (0.0%) | 0 (0.0%) |
| Food Preparation & Serving | 0 (0.0%) | 0 (0.0%) |
| Cleaning & Maintenance | 0 (0.0%) | 0 (0.0%) |
| Personal Care & Service | 0 (0.0%) | 0 (0.0%) |
| Total (Category) | 0 (0.0%) | 0 (0.0%) |
| Total (Overall) | 73 (70.9%) | 30 (29.1%) |
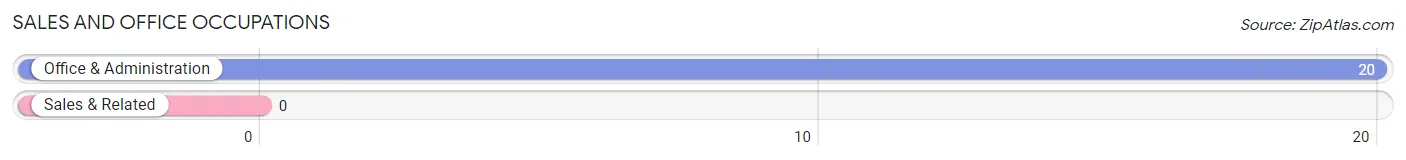
Sales and Office Occupations
The most common Sales and Office occupations in Sweet Water are , and Office & Administration (20 | 19.4%).
Sales and Office Occupations by Sex
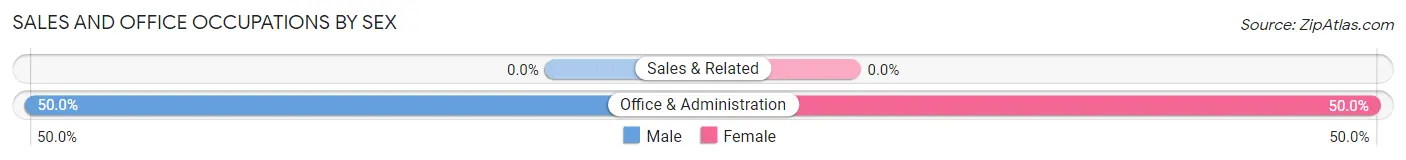
| Occupation | Male | Female |
| Sales & Related | 0 (0.0%) | 0 (0.0%) |
| Office & Administration | 10 (50.0%) | 10 (50.0%) |
| Total (Category) | 10 (50.0%) | 10 (50.0%) |
| Total (Overall) | 73 (70.9%) | 30 (29.1%) |
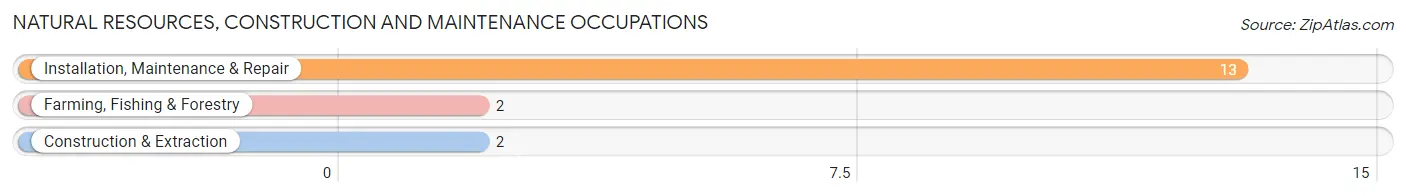
Natural Resources, Construction and Maintenance Occupations
The most common Natural Resources, Construction and Maintenance occupations in Sweet Water are Installation, Maintenance & Repair (13 | 12.6%), Farming, Fishing & Forestry (2 | 1.9%), and Construction & Extraction (2 | 1.9%).
Natural Resources, Construction and Maintenance Occupations by Sex
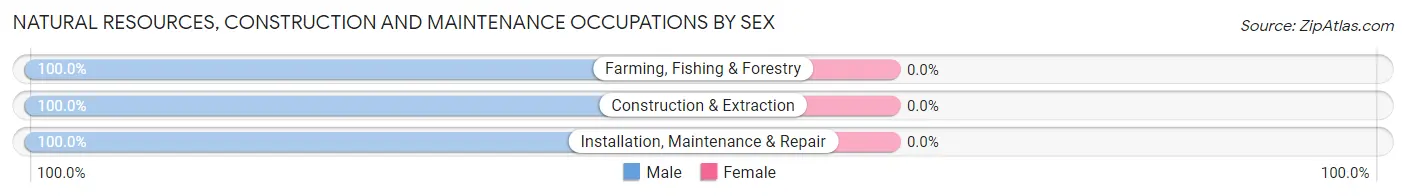
| Occupation | Male | Female |
| Farming, Fishing & Forestry | 2 (100.0%) | 0 (0.0%) |
| Construction & Extraction | 2 (100.0%) | 0 (0.0%) |
| Installation, Maintenance & Repair | 13 (100.0%) | 0 (0.0%) |
| Total (Category) | 17 (100.0%) | 0 (0.0%) |
| Total (Overall) | 73 (70.9%) | 30 (29.1%) |
Production, Transportation and Moving Occupations
The most common Production, Transportation and Moving occupations in Sweet Water are Material Moving (19 | 18.4%), Transportation (13 | 12.6%), and Production (6 | 5.8%).
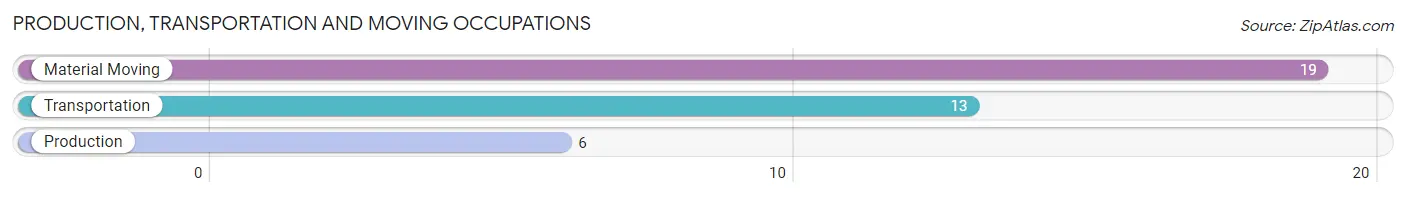
Production, Transportation and Moving Occupations by Sex
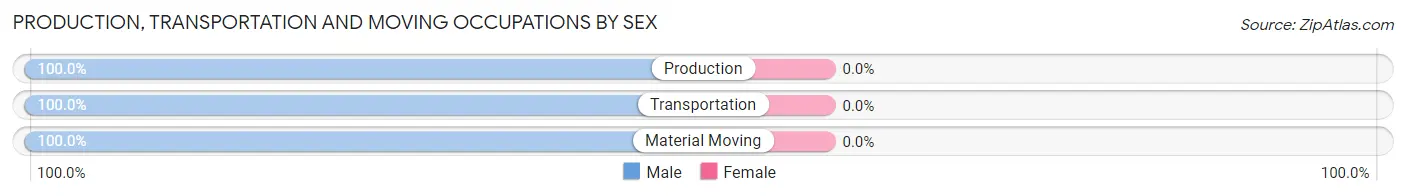
| Occupation | Male | Female |
| Production | 6 (100.0%) | 0 (0.0%) |
| Transportation | 13 (100.0%) | 0 (0.0%) |
| Material Moving | 19 (100.0%) | 0 (0.0%) |
| Total (Category) | 38 (100.0%) | 0 (0.0%) |
| Total (Overall) | 73 (70.9%) | 30 (29.1%) |
Employment Industries by Sex in Sweet Water
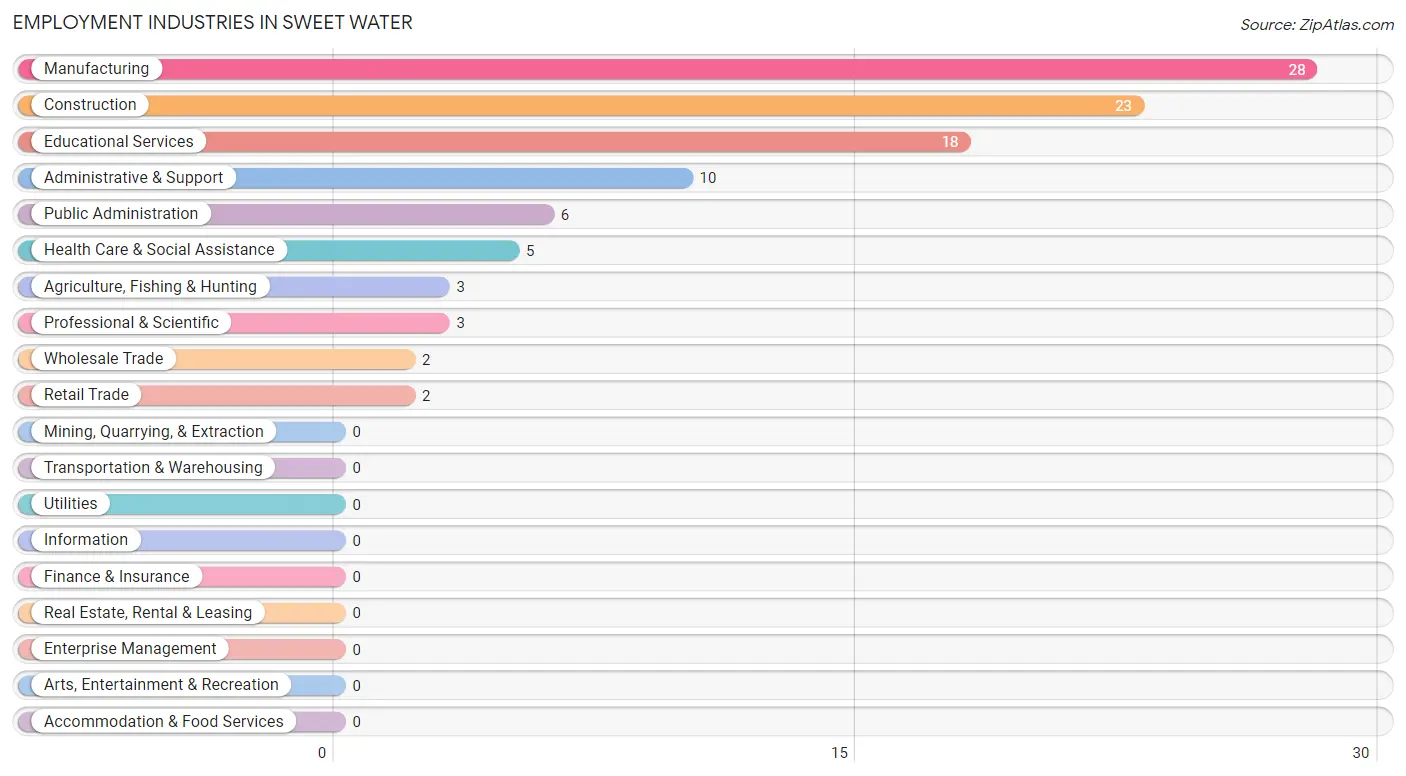
Employment Industries in Sweet Water
The major employment industries in Sweet Water include Manufacturing (28 | 27.2%), Construction (23 | 22.3%), Educational Services (18 | 17.5%), Administrative & Support (10 | 9.7%), and Public Administration (6 | 5.8%).
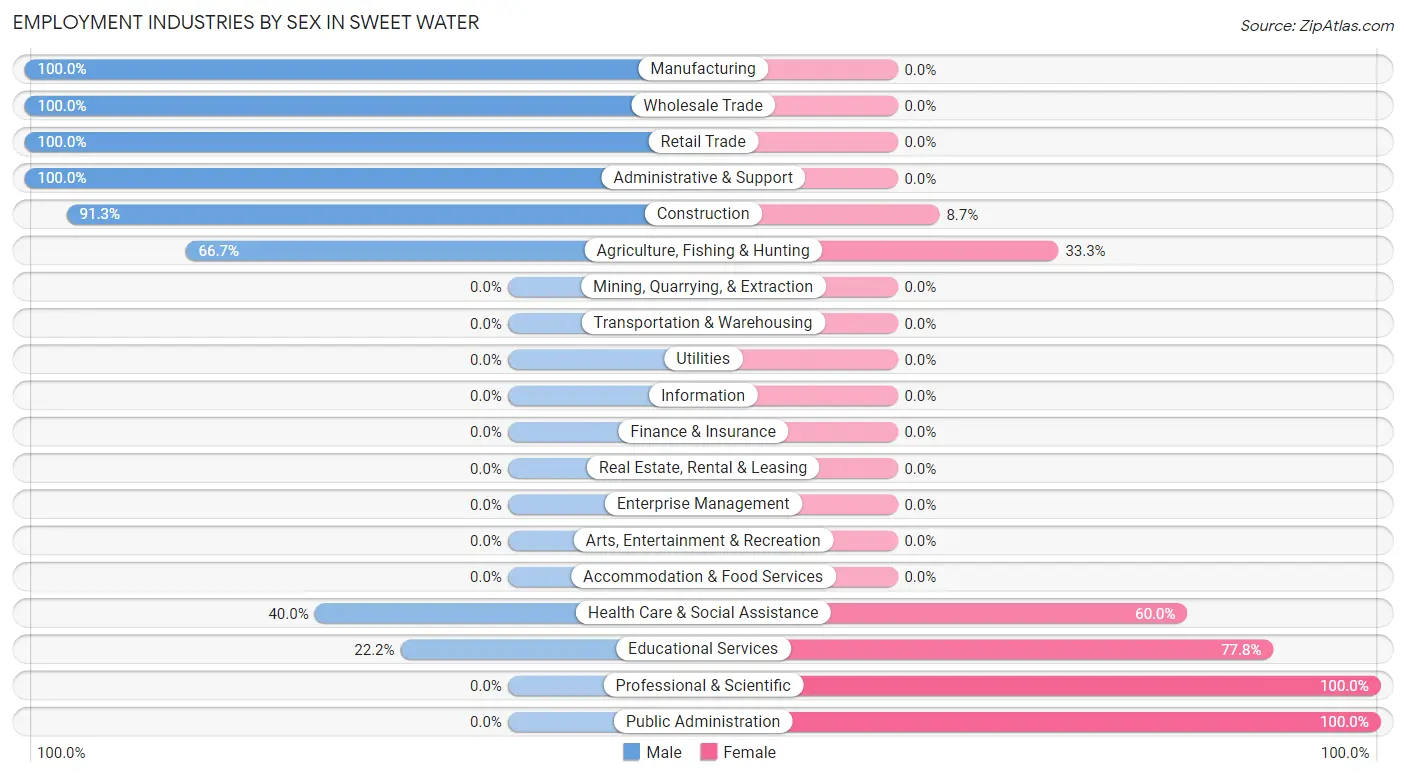
Employment Industries by Sex in Sweet Water
The Sweet Water industries that see more men than women are Manufacturing (100.0%), Wholesale Trade (100.0%), and Retail Trade (100.0%), whereas the industries that tend to have a higher number of women are Professional & Scientific (100.0%), Public Administration (100.0%), and Educational Services (77.8%).
| Industry | Male | Female |
| Agriculture, Fishing & Hunting | 2 (66.7%) | 1 (33.3%) |
| Mining, Quarrying, & Extraction | 0 (0.0%) | 0 (0.0%) |
| Construction | 21 (91.3%) | 2 (8.7%) |
| Manufacturing | 28 (100.0%) | 0 (0.0%) |
| Wholesale Trade | 2 (100.0%) | 0 (0.0%) |
| Retail Trade | 2 (100.0%) | 0 (0.0%) |
| Transportation & Warehousing | 0 (0.0%) | 0 (0.0%) |
| Utilities | 0 (0.0%) | 0 (0.0%) |
| Information | 0 (0.0%) | 0 (0.0%) |
| Finance & Insurance | 0 (0.0%) | 0 (0.0%) |
| Real Estate, Rental & Leasing | 0 (0.0%) | 0 (0.0%) |
| Professional & Scientific | 0 (0.0%) | 3 (100.0%) |
| Enterprise Management | 0 (0.0%) | 0 (0.0%) |
| Administrative & Support | 10 (100.0%) | 0 (0.0%) |
| Educational Services | 4 (22.2%) | 14 (77.8%) |
| Health Care & Social Assistance | 2 (40.0%) | 3 (60.0%) |
| Arts, Entertainment & Recreation | 0 (0.0%) | 0 (0.0%) |
| Accommodation & Food Services | 0 (0.0%) | 0 (0.0%) |
| Public Administration | 0 (0.0%) | 6 (100.0%) |
| Total | 73 (70.9%) | 30 (29.1%) |
Education in Sweet Water
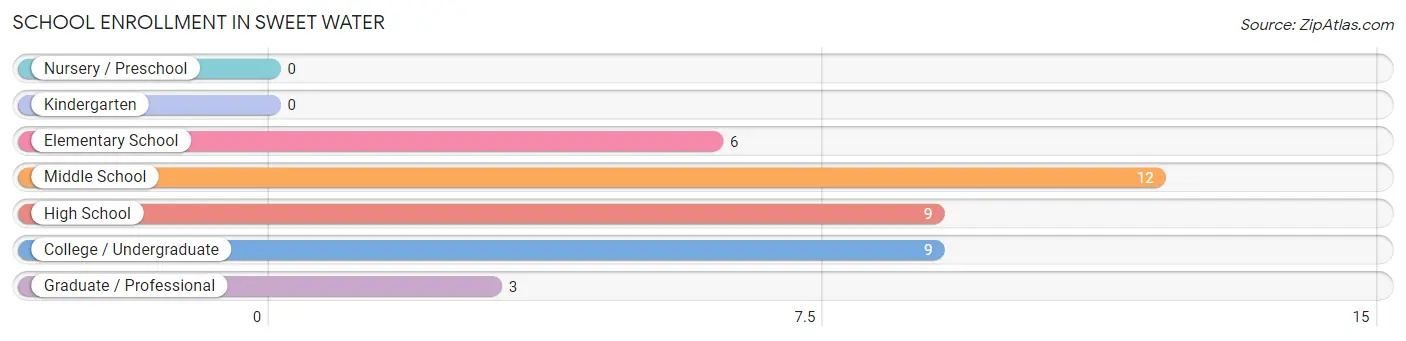
School Enrollment in Sweet Water
The most common levels of schooling among the 39 students in Sweet Water are middle school (12 | 30.8%), high school (9 | 23.1%), and college / undergraduate (9 | 23.1%).
| School Level | # Students | % Students |
| Nursery / Preschool | 0 | 0.0% |
| Kindergarten | 0 | 0.0% |
| Elementary School | 6 | 15.4% |
| Middle School | 12 | 30.8% |
| High School | 9 | 23.1% |
| College / Undergraduate | 9 | 23.1% |
| Graduate / Professional | 3 | 7.7% |
| Total | 39 | 100.0% |
School Enrollment by Age by Funding Source in Sweet Water
Out of a total of 39 students who are enrolled in schools in Sweet Water, 5 (12.8%) attend a private institution, while the remaining 34 (87.2%) are enrolled in public schools. The age group of 5 to 9 year old has the highest likelihood of being enrolled in private schools, with 2 (33.3% in the age bracket) enrolled. Conversely, the age group of 15 to 17 year olds has the lowest likelihood of being enrolled in a private school, with 9 (100.0% in the age bracket) attending a public institution.
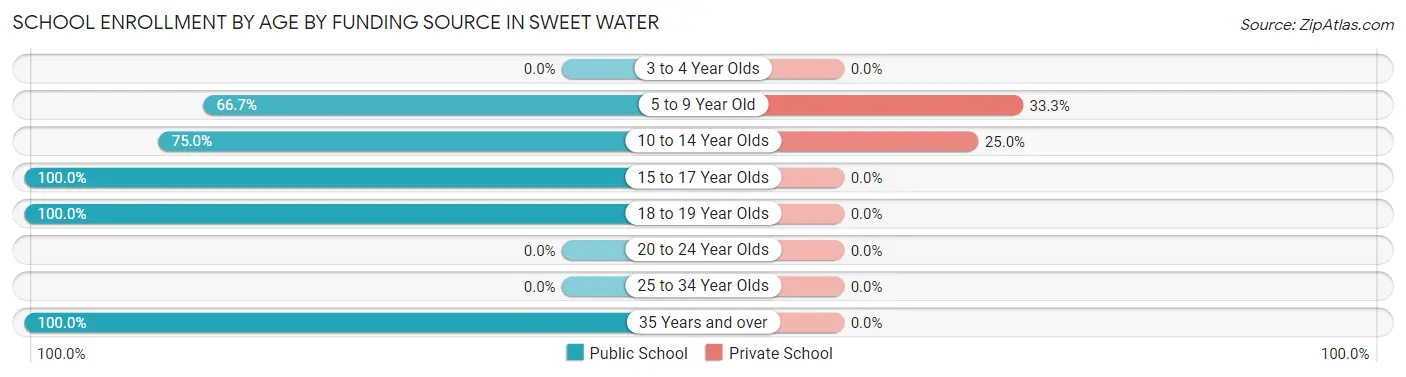
| Age Bracket | Public School | Private School |
| 3 to 4 Year Olds | 0 (0.0%) | 0 (0.0%) |
| 5 to 9 Year Old | 4 (66.7%) | 2 (33.3%) |
| 10 to 14 Year Olds | 9 (75.0%) | 3 (25.0%) |
| 15 to 17 Year Olds | 9 (100.0%) | 0 (0.0%) |
| 18 to 19 Year Olds | 9 (100.0%) | 0 (0.0%) |
| 20 to 24 Year Olds | 0 (0.0%) | 0 (0.0%) |
| 25 to 34 Year Olds | 0 (0.0%) | 0 (0.0%) |
| 35 Years and over | 3 (100.0%) | 0 (0.0%) |
| Total | 34 (87.2%) | 5 (12.8%) |
Educational Attainment by Field of Study in Sweet Water
Education (26 | 48.1%), science & technology (9 | 16.7%), computers & mathematics (6 | 11.1%), liberal arts & history (4 | 7.4%), and visual & performing arts (4 | 7.4%) are the most common fields of study among 54 individuals in Sweet Water who have obtained a bachelor's degree or higher.
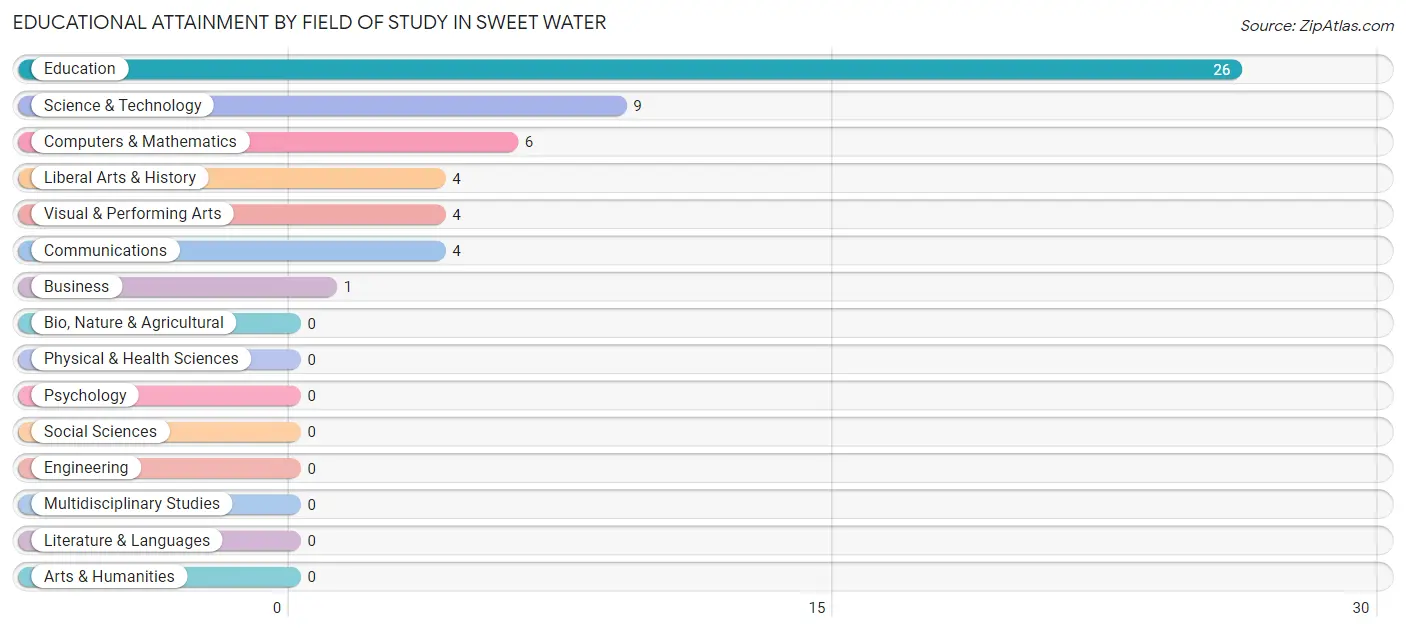
| Field of Study | # Graduates | % Graduates |
| Computers & Mathematics | 6 | 11.1% |
| Bio, Nature & Agricultural | 0 | 0.0% |
| Physical & Health Sciences | 0 | 0.0% |
| Psychology | 0 | 0.0% |
| Social Sciences | 0 | 0.0% |
| Engineering | 0 | 0.0% |
| Multidisciplinary Studies | 0 | 0.0% |
| Science & Technology | 9 | 16.7% |
| Business | 1 | 1.8% |
| Education | 26 | 48.1% |
| Literature & Languages | 0 | 0.0% |
| Liberal Arts & History | 4 | 7.4% |
| Visual & Performing Arts | 4 | 7.4% |
| Communications | 4 | 7.4% |
| Arts & Humanities | 0 | 0.0% |
| Total | 54 | 100.0% |
Transportation & Commute in Sweet Water
Vehicle Availability by Sex in Sweet Water
The most prevalent vehicle ownership categories in Sweet Water are males with 3 vehicles (29, accounting for 39.7%) and females with 3 vehicles (15, making up 96.7%).
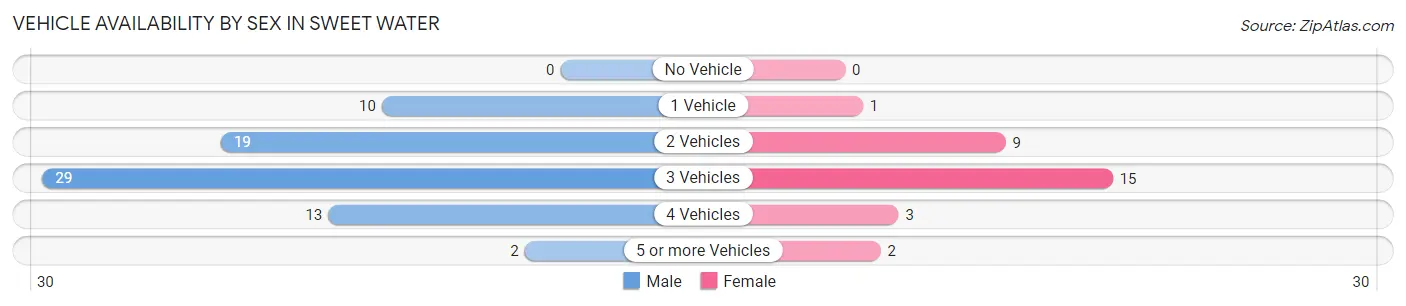
| Vehicles Available | Male | Female |
| No Vehicle | 0 (0.0%) | 0 (0.0%) |
| 1 Vehicle | 10 (13.7%) | 1 (3.3%) |
| 2 Vehicles | 19 (26.0%) | 9 (30.0%) |
| 3 Vehicles | 29 (39.7%) | 15 (50.0%) |
| 4 Vehicles | 13 (17.8%) | 3 (10.0%) |
| 5 or more Vehicles | 2 (2.7%) | 2 (6.7%) |
| Total | 73 (100.0%) | 30 (100.0%) |
Commute Time in Sweet Water
The most frequently occuring commute durations in Sweet Water are 5 to 9 minutes (18 commuters, 18.2%), 25 to 29 minutes (16 commuters, 16.2%), and 35 to 39 minutes (15 commuters, 15.1%).
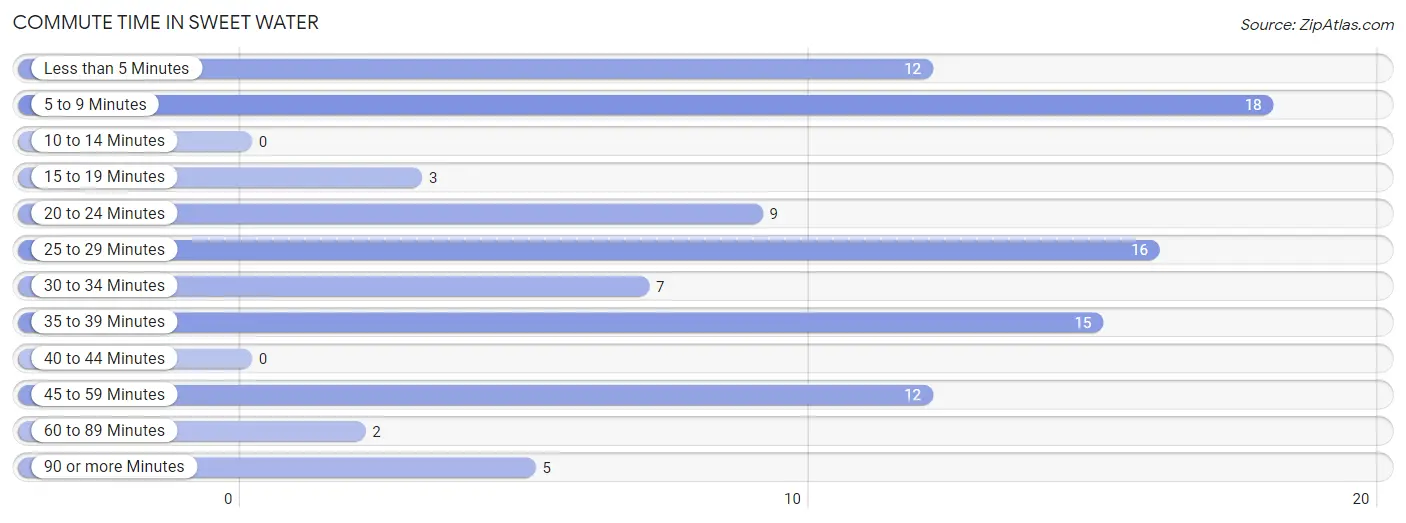
| Commute Time | # Commuters | % Commuters |
| Less than 5 Minutes | 12 | 12.1% |
| 5 to 9 Minutes | 18 | 18.2% |
| 10 to 14 Minutes | 0 | 0.0% |
| 15 to 19 Minutes | 3 | 3.0% |
| 20 to 24 Minutes | 9 | 9.1% |
| 25 to 29 Minutes | 16 | 16.2% |
| 30 to 34 Minutes | 7 | 7.1% |
| 35 to 39 Minutes | 15 | 15.1% |
| 40 to 44 Minutes | 0 | 0.0% |
| 45 to 59 Minutes | 12 | 12.1% |
| 60 to 89 Minutes | 2 | 2.0% |
| 90 or more Minutes | 5 | 5.1% |
Commute Time by Sex in Sweet Water
The most common commute times in Sweet Water are 25 to 29 minutes (16 commuters, 22.2%) for males and less than 5 minutes (8 commuters, 29.6%) for females.
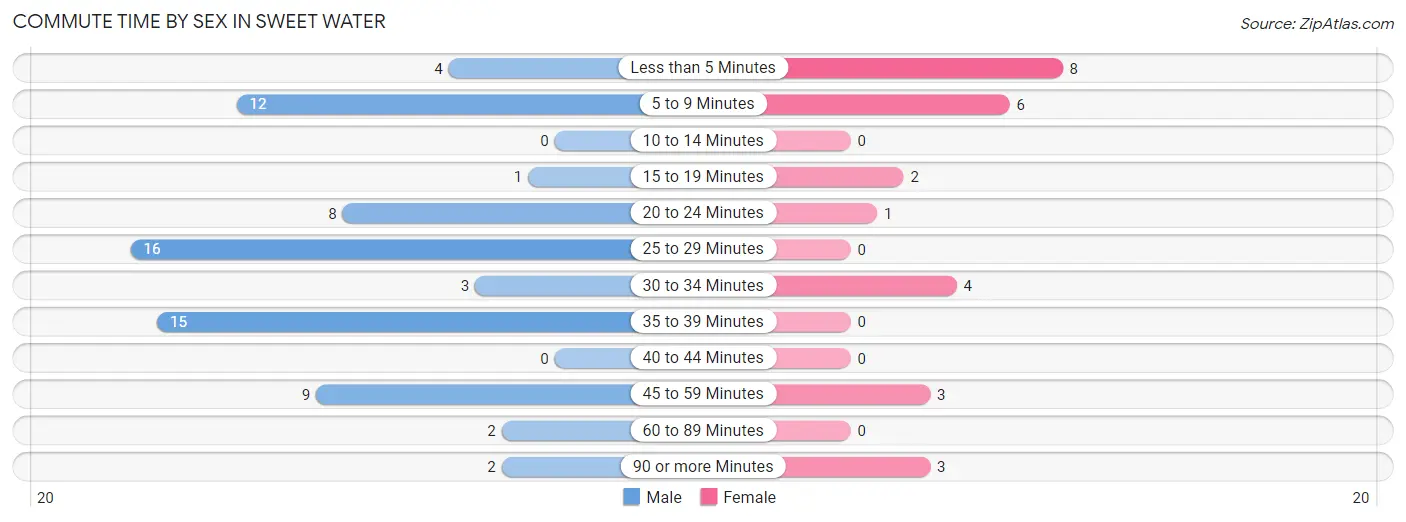
| Commute Time | Male | Female |
| Less than 5 Minutes | 4 (5.6%) | 8 (29.6%) |
| 5 to 9 Minutes | 12 (16.7%) | 6 (22.2%) |
| 10 to 14 Minutes | 0 (0.0%) | 0 (0.0%) |
| 15 to 19 Minutes | 1 (1.4%) | 2 (7.4%) |
| 20 to 24 Minutes | 8 (11.1%) | 1 (3.7%) |
| 25 to 29 Minutes | 16 (22.2%) | 0 (0.0%) |
| 30 to 34 Minutes | 3 (4.2%) | 4 (14.8%) |
| 35 to 39 Minutes | 15 (20.8%) | 0 (0.0%) |
| 40 to 44 Minutes | 0 (0.0%) | 0 (0.0%) |
| 45 to 59 Minutes | 9 (12.5%) | 3 (11.1%) |
| 60 to 89 Minutes | 2 (2.8%) | 0 (0.0%) |
| 90 or more Minutes | 2 (2.8%) | 3 (11.1%) |
Time of Departure to Work by Sex in Sweet Water
The most frequent times of departure to work in Sweet Water are 6:00 AM to 6:29 AM (25, 34.7%) for males and 7:00 AM to 7:29 AM (14, 51.8%) for females.
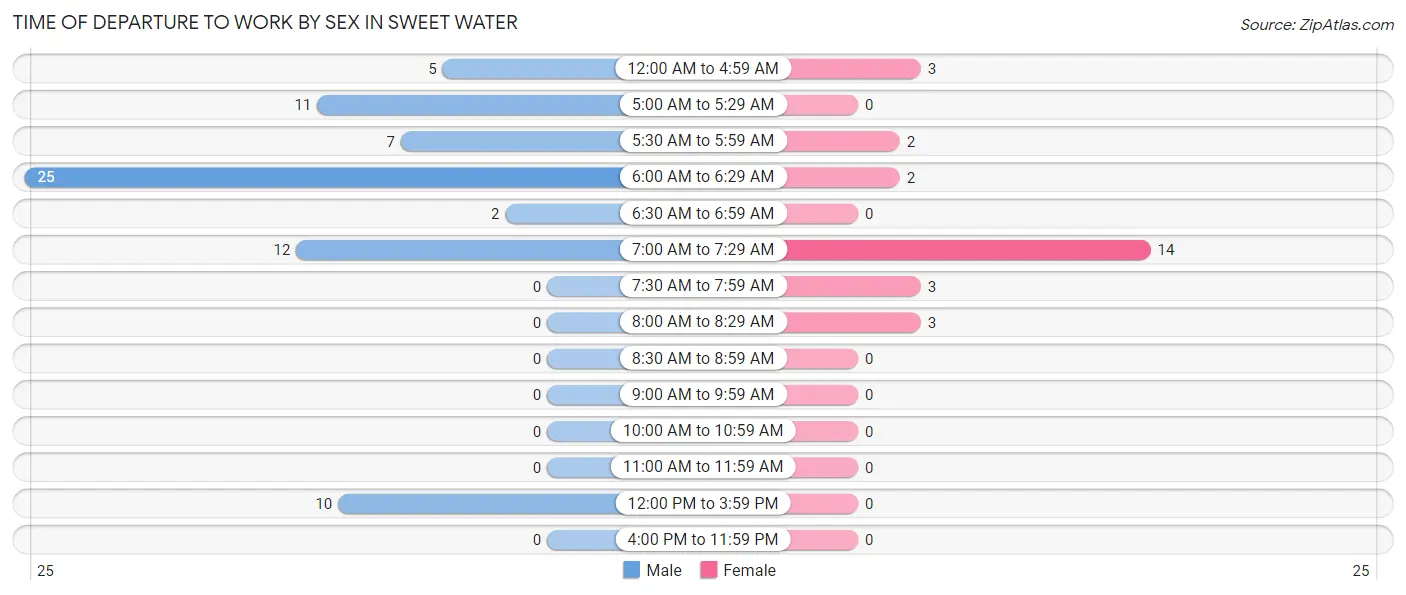
| Time of Departure | Male | Female |
| 12:00 AM to 4:59 AM | 5 (6.9%) | 3 (11.1%) |
| 5:00 AM to 5:29 AM | 11 (15.3%) | 0 (0.0%) |
| 5:30 AM to 5:59 AM | 7 (9.7%) | 2 (7.4%) |
| 6:00 AM to 6:29 AM | 25 (34.7%) | 2 (7.4%) |
| 6:30 AM to 6:59 AM | 2 (2.8%) | 0 (0.0%) |
| 7:00 AM to 7:29 AM | 12 (16.7%) | 14 (51.8%) |
| 7:30 AM to 7:59 AM | 0 (0.0%) | 3 (11.1%) |
| 8:00 AM to 8:29 AM | 0 (0.0%) | 3 (11.1%) |
| 8:30 AM to 8:59 AM | 0 (0.0%) | 0 (0.0%) |
| 9:00 AM to 9:59 AM | 0 (0.0%) | 0 (0.0%) |
| 10:00 AM to 10:59 AM | 0 (0.0%) | 0 (0.0%) |
| 11:00 AM to 11:59 AM | 0 (0.0%) | 0 (0.0%) |
| 12:00 PM to 3:59 PM | 10 (13.9%) | 0 (0.0%) |
| 4:00 PM to 11:59 PM | 0 (0.0%) | 0 (0.0%) |
| Total | 72 (100.0%) | 27 (100.0%) |
Housing Occupancy in Sweet Water
Occupancy by Ownership in Sweet Water
Of the total 93 dwellings in Sweet Water, owner-occupied units account for 88 (94.6%), while renter-occupied units make up 5 (5.4%).
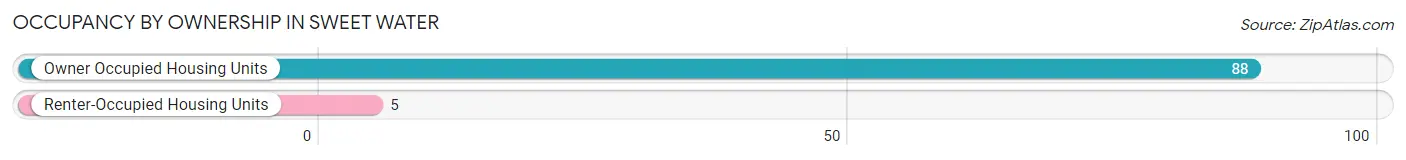
| Occupancy | # Housing Units | % Housing Units |
| Owner Occupied Housing Units | 88 | 94.6% |
| Renter-Occupied Housing Units | 5 | 5.4% |
| Total Occupied Housing Units | 93 | 100.0% |
Occupancy by Household Size in Sweet Water
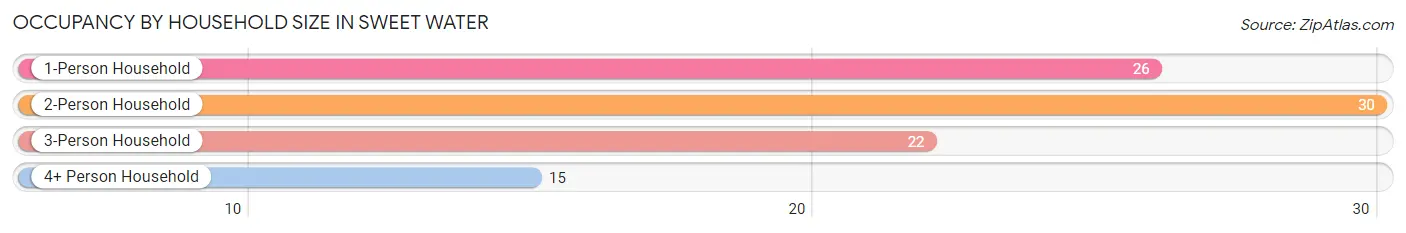
| Household Size | # Housing Units | % Housing Units |
| 1-Person Household | 26 | 28.0% |
| 2-Person Household | 30 | 32.3% |
| 3-Person Household | 22 | 23.7% |
| 4+ Person Household | 15 | 16.1% |
| Total Housing Units | 93 | 100.0% |
Occupancy by Ownership by Household Size in Sweet Water
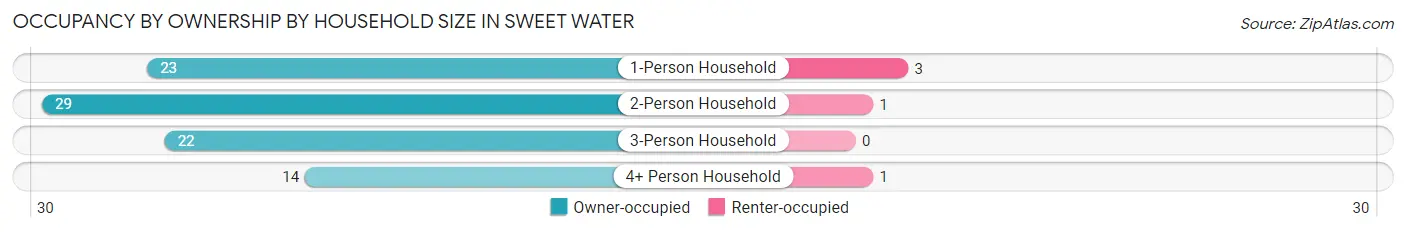
| Household Size | Owner-occupied | Renter-occupied |
| 1-Person Household | 23 (88.5%) | 3 (11.5%) |
| 2-Person Household | 29 (96.7%) | 1 (3.3%) |
| 3-Person Household | 22 (100.0%) | 0 (0.0%) |
| 4+ Person Household | 14 (93.3%) | 1 (6.7%) |
| Total Housing Units | 88 (94.6%) | 5 (5.4%) |
Occupancy by Educational Attainment in Sweet Water
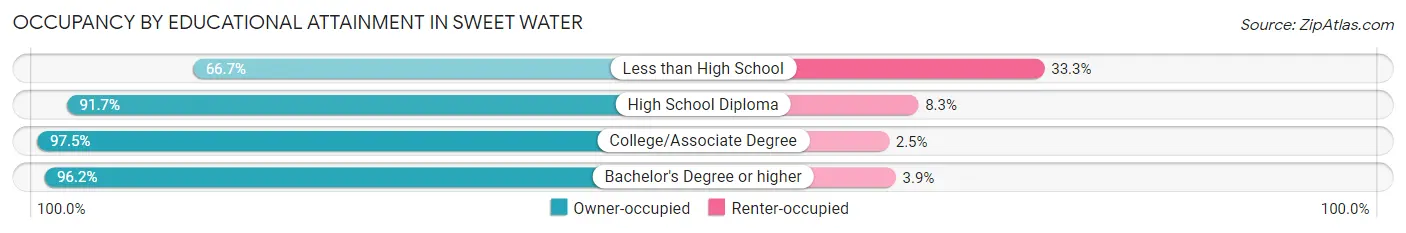
| Household Size | Owner-occupied | Renter-occupied |
| Less than High School | 2 (66.7%) | 1 (33.3%) |
| High School Diploma | 22 (91.7%) | 2 (8.3%) |
| College/Associate Degree | 39 (97.5%) | 1 (2.5%) |
| Bachelor's Degree or higher | 25 (96.2%) | 1 (3.8%) |
Occupancy by Age of Householder in Sweet Water
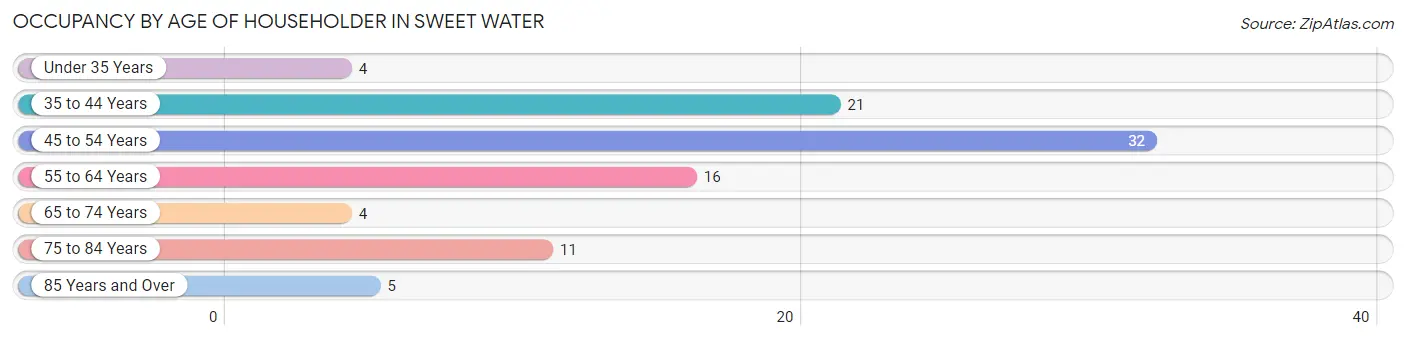
| Age Bracket | # Households | % Households |
| Under 35 Years | 4 | 4.3% |
| 35 to 44 Years | 21 | 22.6% |
| 45 to 54 Years | 32 | 34.4% |
| 55 to 64 Years | 16 | 17.2% |
| 65 to 74 Years | 4 | 4.3% |
| 75 to 84 Years | 11 | 11.8% |
| 85 Years and Over | 5 | 5.4% |
| Total | 93 | 100.0% |
Housing Finances in Sweet Water
Median Income by Occupancy in Sweet Water
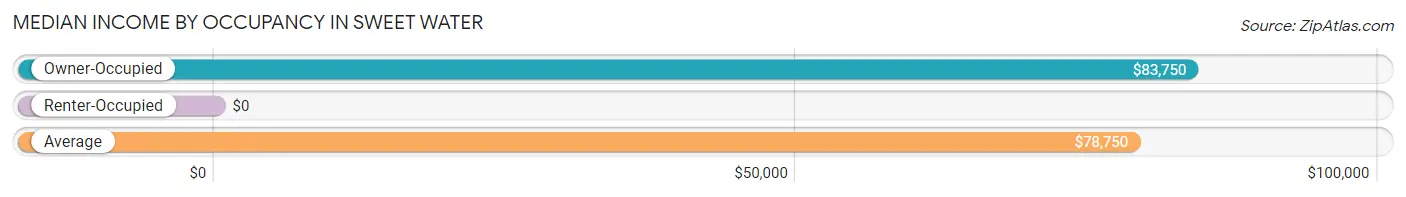
| Occupancy Type | # Households | Median Income |
| Owner-Occupied | 88 (94.6%) | $83,750 |
| Renter-Occupied | 5 (5.4%) | $0 |
| Average | 93 (100.0%) | $78,750 |
Occupancy by Householder Income Bracket in Sweet Water
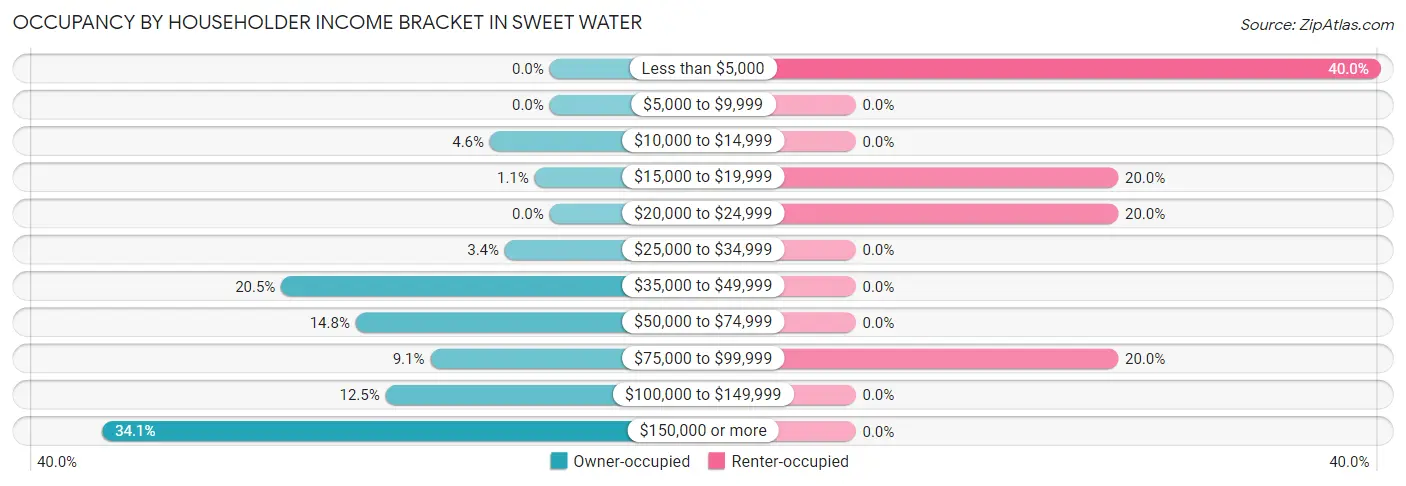
| Income Bracket | Owner-occupied | Renter-occupied |
| Less than $5,000 | 0 (0.0%) | 2 (40.0%) |
| $5,000 to $9,999 | 0 (0.0%) | 0 (0.0%) |
| $10,000 to $14,999 | 4 (4.5%) | 0 (0.0%) |
| $15,000 to $19,999 | 1 (1.1%) | 1 (20.0%) |
| $20,000 to $24,999 | 0 (0.0%) | 1 (20.0%) |
| $25,000 to $34,999 | 3 (3.4%) | 0 (0.0%) |
| $35,000 to $49,999 | 18 (20.4%) | 0 (0.0%) |
| $50,000 to $74,999 | 13 (14.8%) | 0 (0.0%) |
| $75,000 to $99,999 | 8 (9.1%) | 1 (20.0%) |
| $100,000 to $149,999 | 11 (12.5%) | 0 (0.0%) |
| $150,000 or more | 30 (34.1%) | 0 (0.0%) |
| Total | 88 (100.0%) | 5 (100.0%) |
Monthly Housing Cost Tiers in Sweet Water
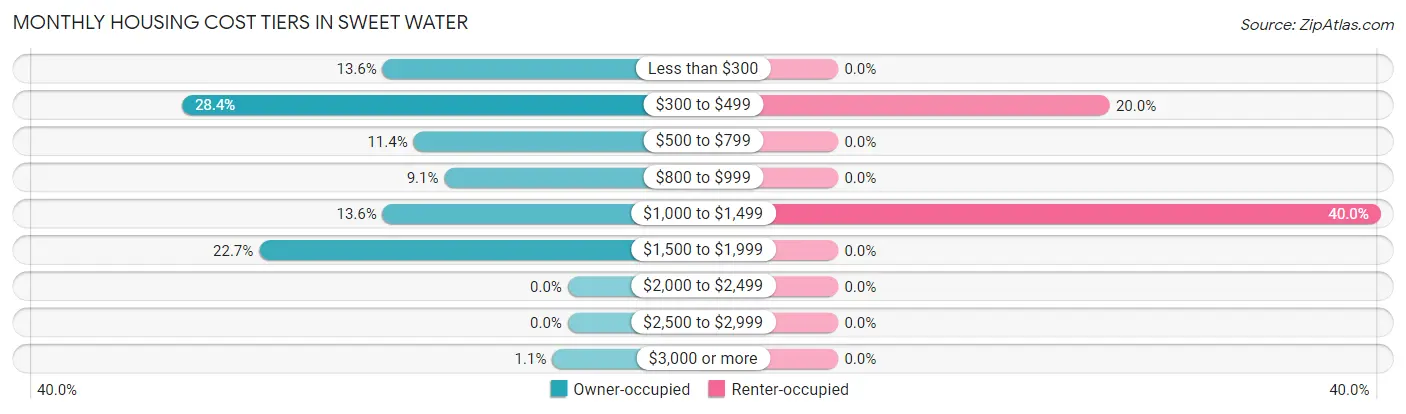
| Monthly Cost | Owner-occupied | Renter-occupied |
| Less than $300 | 12 (13.6%) | 0 (0.0%) |
| $300 to $499 | 25 (28.4%) | 1 (20.0%) |
| $500 to $799 | 10 (11.4%) | 0 (0.0%) |
| $800 to $999 | 8 (9.1%) | 0 (0.0%) |
| $1,000 to $1,499 | 12 (13.6%) | 2 (40.0%) |
| $1,500 to $1,999 | 20 (22.7%) | 0 (0.0%) |
| $2,000 to $2,499 | 0 (0.0%) | 0 (0.0%) |
| $2,500 to $2,999 | 0 (0.0%) | 0 (0.0%) |
| $3,000 or more | 1 (1.1%) | 0 (0.0%) |
| Total | 88 (100.0%) | 5 (100.0%) |
Physical Housing Characteristics in Sweet Water
Housing Structures in Sweet Water
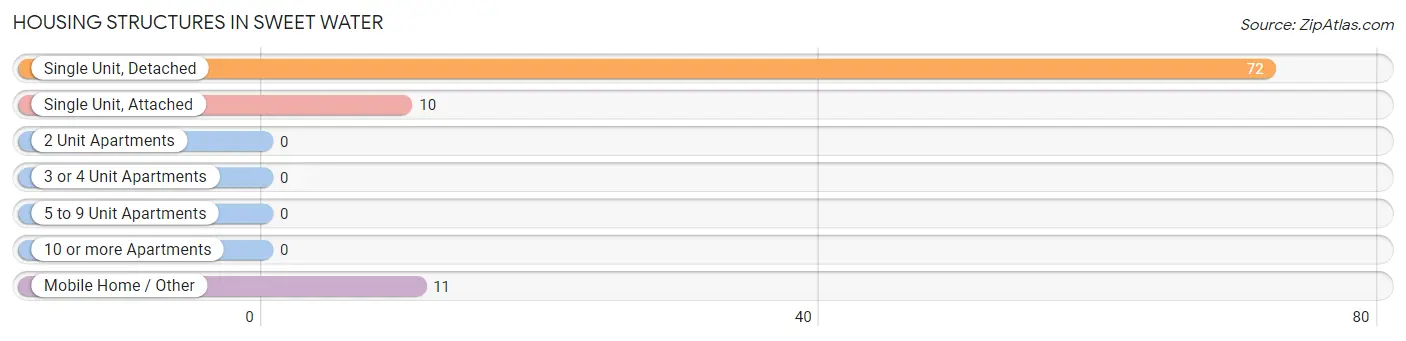
| Structure Type | # Housing Units | % Housing Units |
| Single Unit, Detached | 72 | 77.4% |
| Single Unit, Attached | 10 | 10.7% |
| 2 Unit Apartments | 0 | 0.0% |
| 3 or 4 Unit Apartments | 0 | 0.0% |
| 5 to 9 Unit Apartments | 0 | 0.0% |
| 10 or more Apartments | 0 | 0.0% |
| Mobile Home / Other | 11 | 11.8% |
| Total | 93 | 100.0% |
Housing Structures by Occupancy in Sweet Water
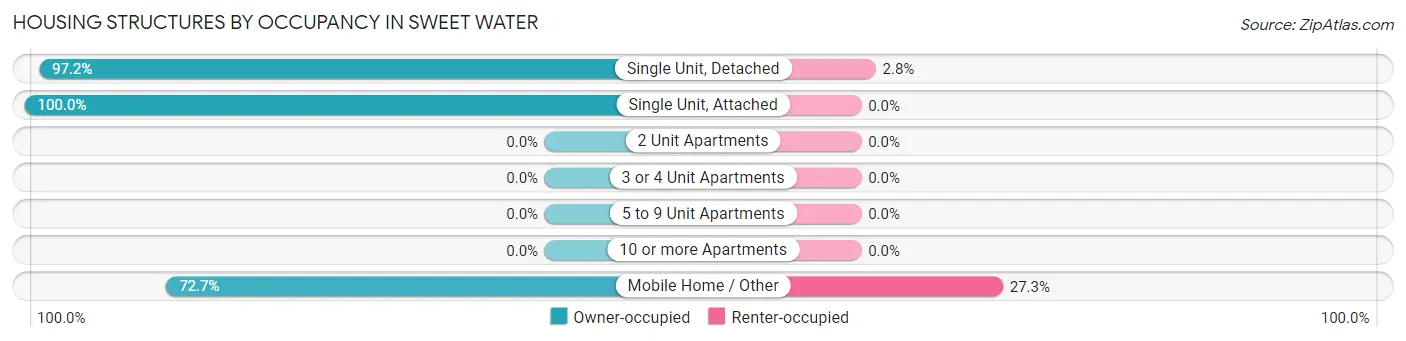
| Structure Type | Owner-occupied | Renter-occupied |
| Single Unit, Detached | 70 (97.2%) | 2 (2.8%) |
| Single Unit, Attached | 10 (100.0%) | 0 (0.0%) |
| 2 Unit Apartments | 0 (0.0%) | 0 (0.0%) |
| 3 or 4 Unit Apartments | 0 (0.0%) | 0 (0.0%) |
| 5 to 9 Unit Apartments | 0 (0.0%) | 0 (0.0%) |
| 10 or more Apartments | 0 (0.0%) | 0 (0.0%) |
| Mobile Home / Other | 8 (72.7%) | 3 (27.3%) |
| Total | 88 (94.6%) | 5 (5.4%) |
Housing Structures by Number of Rooms in Sweet Water
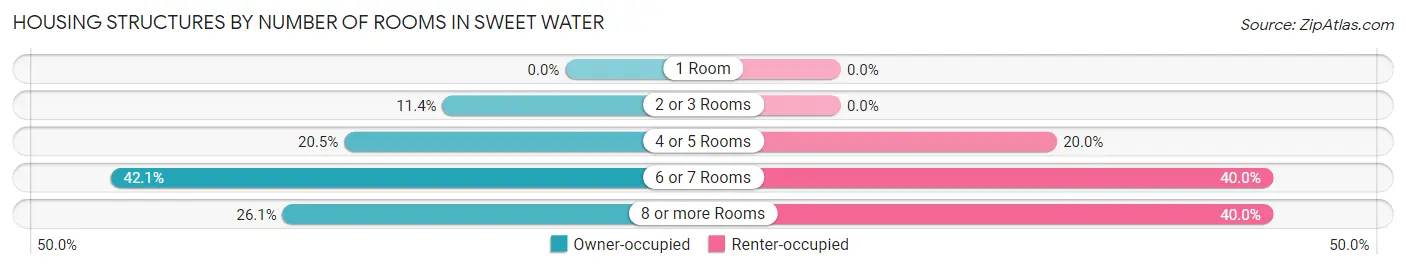
| Number of Rooms | Owner-occupied | Renter-occupied |
| 1 Room | 0 (0.0%) | 0 (0.0%) |
| 2 or 3 Rooms | 10 (11.4%) | 0 (0.0%) |
| 4 or 5 Rooms | 18 (20.4%) | 1 (20.0%) |
| 6 or 7 Rooms | 37 (42.0%) | 2 (40.0%) |
| 8 or more Rooms | 23 (26.1%) | 2 (40.0%) |
| Total | 88 (100.0%) | 5 (100.0%) |
Housing Structure by Heating Type in Sweet Water
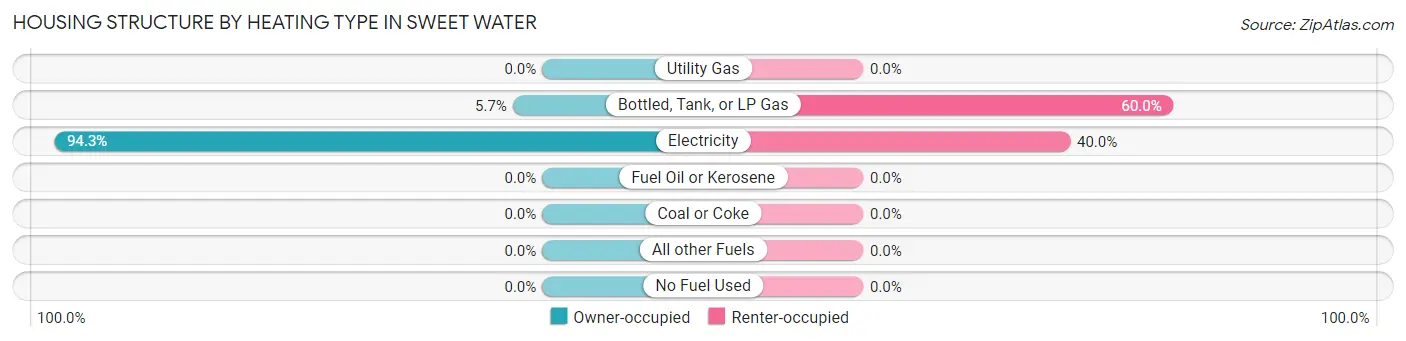
| Heating Type | Owner-occupied | Renter-occupied |
| Utility Gas | 0 (0.0%) | 0 (0.0%) |
| Bottled, Tank, or LP Gas | 5 (5.7%) | 3 (60.0%) |
| Electricity | 83 (94.3%) | 2 (40.0%) |
| Fuel Oil or Kerosene | 0 (0.0%) | 0 (0.0%) |
| Coal or Coke | 0 (0.0%) | 0 (0.0%) |
| All other Fuels | 0 (0.0%) | 0 (0.0%) |
| No Fuel Used | 0 (0.0%) | 0 (0.0%) |
| Total | 88 (100.0%) | 5 (100.0%) |
Household Vehicle Usage in Sweet Water
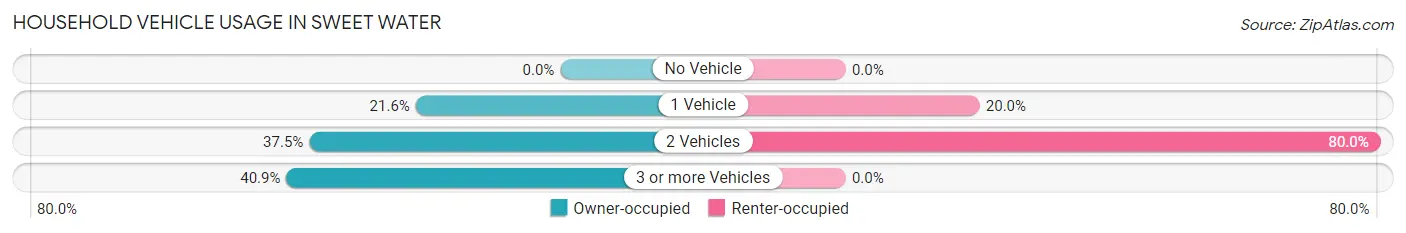
| Vehicles per Household | Owner-occupied | Renter-occupied |
| No Vehicle | 0 (0.0%) | 0 (0.0%) |
| 1 Vehicle | 19 (21.6%) | 1 (20.0%) |
| 2 Vehicles | 33 (37.5%) | 4 (80.0%) |
| 3 or more Vehicles | 36 (40.9%) | 0 (0.0%) |
| Total | 88 (100.0%) | 5 (100.0%) |
Real Estate & Mortgages in Sweet Water
Real Estate and Mortgage Overview in Sweet Water
| Characteristic | Without Mortgage | With Mortgage |
| Housing Units | 49 | 39 |
| Median Property Value | $154,200 | $203,600 |
| Median Household Income | $66,875 | $18 |
| Monthly Housing Costs | $426 | $0 |
| Real Estate Taxes | $470 | $1 |
Property Value by Mortgage Status in Sweet Water
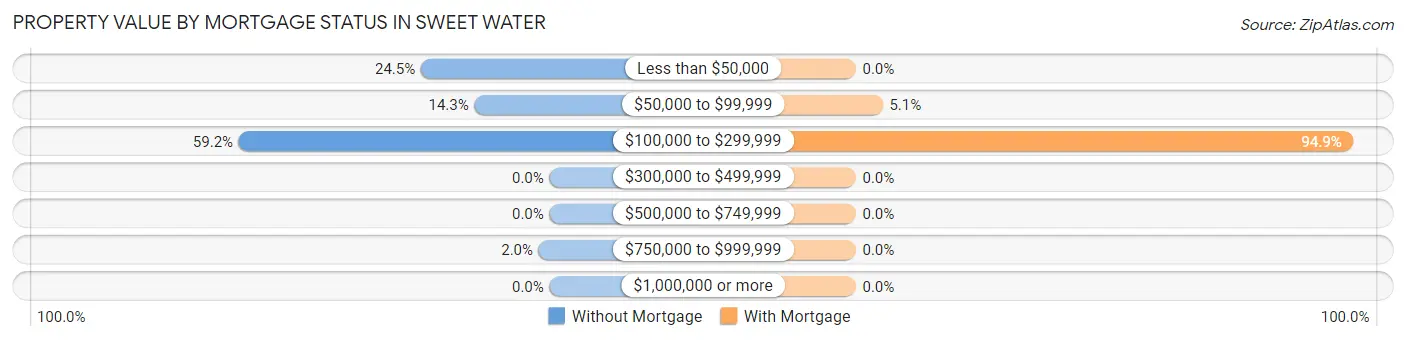
| Property Value | Without Mortgage | With Mortgage |
| Less than $50,000 | 12 (24.5%) | 0 (0.0%) |
| $50,000 to $99,999 | 7 (14.3%) | 2 (5.1%) |
| $100,000 to $299,999 | 29 (59.2%) | 37 (94.9%) |
| $300,000 to $499,999 | 0 (0.0%) | 0 (0.0%) |
| $500,000 to $749,999 | 0 (0.0%) | 0 (0.0%) |
| $750,000 to $999,999 | 1 (2.0%) | 0 (0.0%) |
| $1,000,000 or more | 0 (0.0%) | 0 (0.0%) |
| Total | 49 (100.0%) | 39 (100.0%) |
Household Income by Mortgage Status in Sweet Water
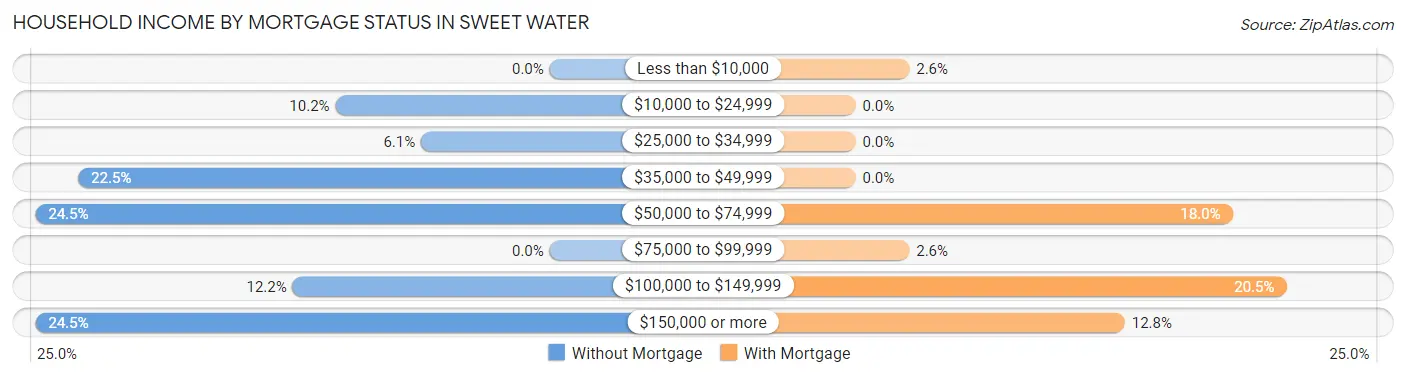
| Household Income | Without Mortgage | With Mortgage |
| Less than $10,000 | 0 (0.0%) | 1 (2.6%) |
| $10,000 to $24,999 | 5 (10.2%) | 0 (0.0%) |
| $25,000 to $34,999 | 3 (6.1%) | 0 (0.0%) |
| $35,000 to $49,999 | 11 (22.5%) | 0 (0.0%) |
| $50,000 to $74,999 | 12 (24.5%) | 7 (17.9%) |
| $75,000 to $99,999 | 0 (0.0%) | 1 (2.6%) |
| $100,000 to $149,999 | 6 (12.2%) | 8 (20.5%) |
| $150,000 or more | 12 (24.5%) | 5 (12.8%) |
| Total | 49 (100.0%) | 39 (100.0%) |
Property Value to Household Income Ratio in Sweet Water
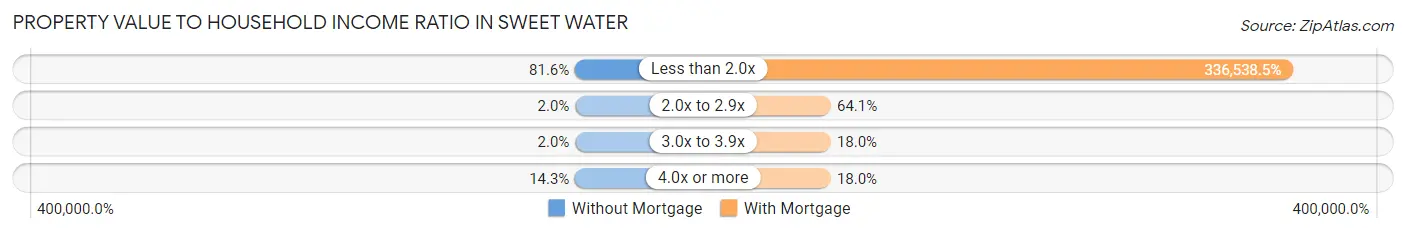
| Value-to-Income Ratio | Without Mortgage | With Mortgage |
| Less than 2.0x | 40 (81.6%) | 131,250 (336,538.5%) |
| 2.0x to 2.9x | 1 (2.0%) | 25 (64.1%) |
| 3.0x to 3.9x | 1 (2.0%) | 7 (17.9%) |
| 4.0x or more | 7 (14.3%) | 7 (17.9%) |
| Total | 49 (100.0%) | 39 (100.0%) |
Real Estate Taxes by Mortgage Status in Sweet Water
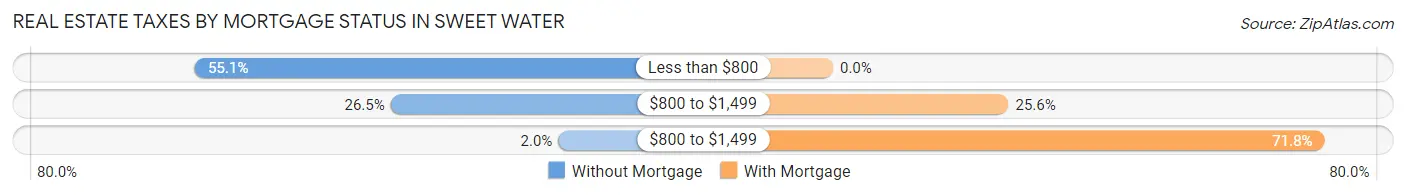
| Property Taxes | Without Mortgage | With Mortgage |
| Less than $800 | 27 (55.1%) | 0 (0.0%) |
| $800 to $1,499 | 13 (26.5%) | 10 (25.6%) |
| $800 to $1,499 | 1 (2.0%) | 28 (71.8%) |
| Total | 49 (100.0%) | 39 (100.0%) |
Health & Disability in Sweet Water
Health Insurance Coverage by Age in Sweet Water
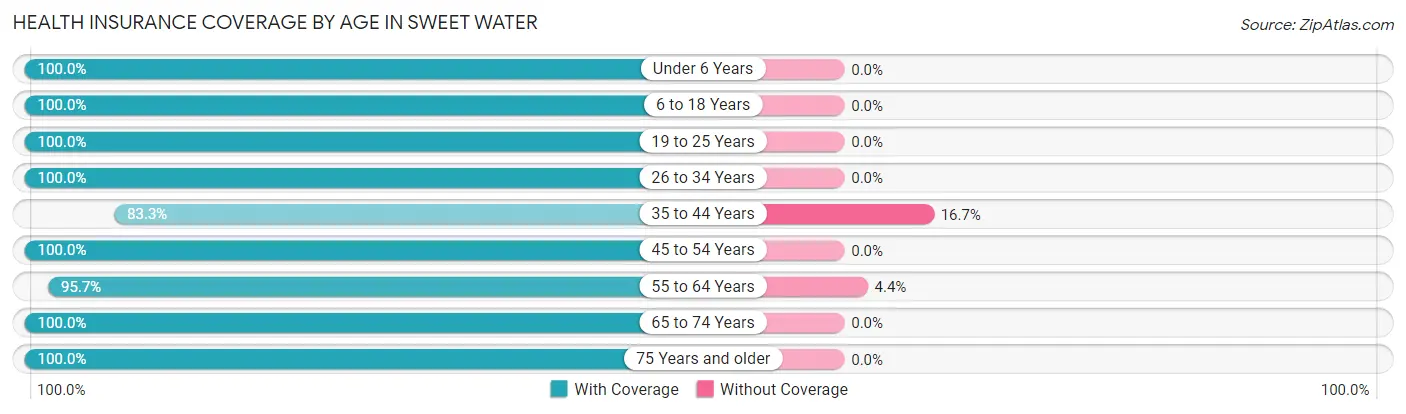
| Age Bracket | With Coverage | Without Coverage |
| Under 6 Years | 19 (100.0%) | 0 (0.0%) |
| 6 to 18 Years | 36 (100.0%) | 0 (0.0%) |
| 19 to 25 Years | 34 (100.0%) | 0 (0.0%) |
| 26 to 34 Years | 14 (100.0%) | 0 (0.0%) |
| 35 to 44 Years | 30 (83.3%) | 6 (16.7%) |
| 45 to 54 Years | 44 (100.0%) | 0 (0.0%) |
| 55 to 64 Years | 22 (95.7%) | 1 (4.3%) |
| 65 to 74 Years | 9 (100.0%) | 0 (0.0%) |
| 75 Years and older | 24 (100.0%) | 0 (0.0%) |
| Total | 232 (97.1%) | 7 (2.9%) |
Health Insurance Coverage by Citizenship Status in Sweet Water
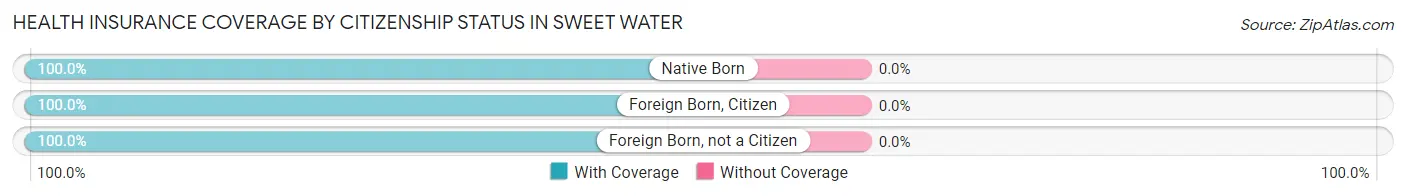
| Citizenship Status | With Coverage | Without Coverage |
| Native Born | 19 (100.0%) | 0 (0.0%) |
| Foreign Born, Citizen | 36 (100.0%) | 0 (0.0%) |
| Foreign Born, not a Citizen | 34 (100.0%) | 0 (0.0%) |
Health Insurance Coverage by Household Income in Sweet Water
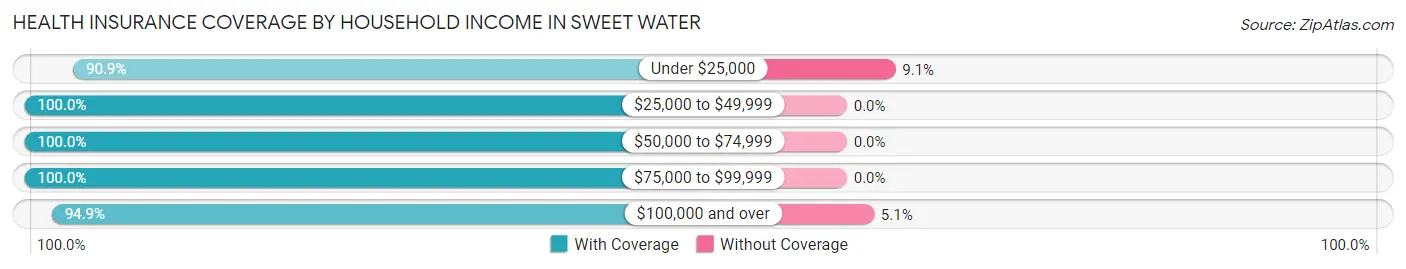
| Household Income | With Coverage | Without Coverage |
| Under $25,000 | 10 (90.9%) | 1 (9.1%) |
| $25,000 to $49,999 | 25 (100.0%) | 0 (0.0%) |
| $50,000 to $74,999 | 45 (100.0%) | 0 (0.0%) |
| $75,000 to $99,999 | 40 (100.0%) | 0 (0.0%) |
| $100,000 and over | 112 (94.9%) | 6 (5.1%) |
Public vs Private Health Insurance Coverage by Age in Sweet Water
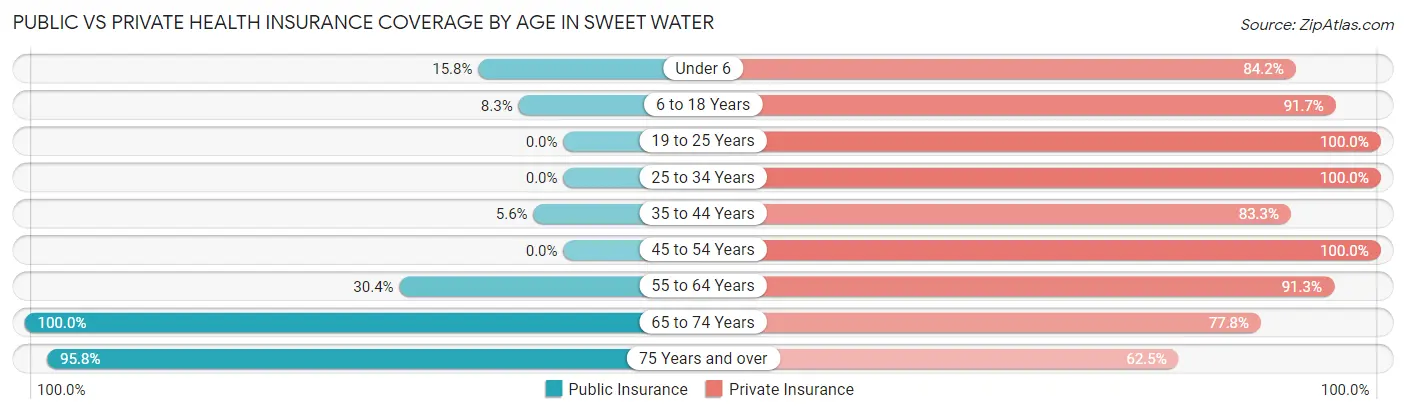
| Age Bracket | Public Insurance | Private Insurance |
| Under 6 | 3 (15.8%) | 16 (84.2%) |
| 6 to 18 Years | 3 (8.3%) | 33 (91.7%) |
| 19 to 25 Years | 0 (0.0%) | 34 (100.0%) |
| 25 to 34 Years | 0 (0.0%) | 14 (100.0%) |
| 35 to 44 Years | 2 (5.6%) | 30 (83.3%) |
| 45 to 54 Years | 0 (0.0%) | 44 (100.0%) |
| 55 to 64 Years | 7 (30.4%) | 21 (91.3%) |
| 65 to 74 Years | 9 (100.0%) | 7 (77.8%) |
| 75 Years and over | 23 (95.8%) | 15 (62.5%) |
| Total | 47 (19.7%) | 214 (89.5%) |
Disability Status by Sex by Age in Sweet Water
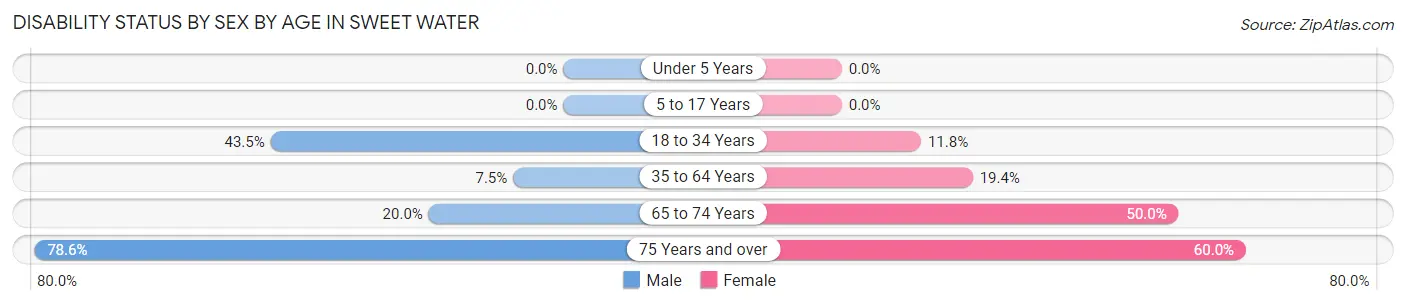
| Age Bracket | Male | Female |
| Under 5 Years | 0 (0.0%) | 0 (0.0%) |
| 5 to 17 Years | 0 (0.0%) | 0 (0.0%) |
| 18 to 34 Years | 10 (43.5%) | 4 (11.8%) |
| 35 to 64 Years | 5 (7.5%) | 7 (19.4%) |
| 65 to 74 Years | 1 (20.0%) | 2 (50.0%) |
| 75 Years and over | 11 (78.6%) | 6 (60.0%) |
Disability Class by Sex by Age in Sweet Water
Disability Class: Hearing Difficulty
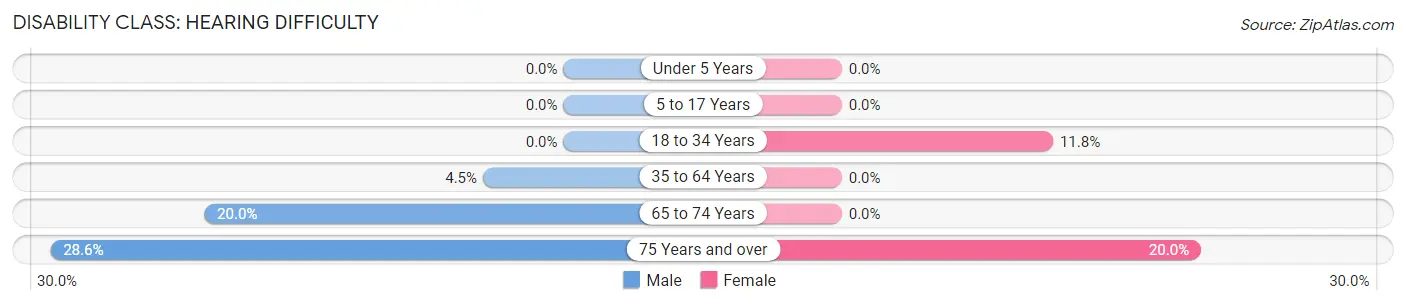
| Age Bracket | Male | Female |
| Under 5 Years | 0 (0.0%) | 0 (0.0%) |
| 5 to 17 Years | 0 (0.0%) | 0 (0.0%) |
| 18 to 34 Years | 0 (0.0%) | 4 (11.8%) |
| 35 to 64 Years | 3 (4.5%) | 0 (0.0%) |
| 65 to 74 Years | 1 (20.0%) | 0 (0.0%) |
| 75 Years and over | 4 (28.6%) | 2 (20.0%) |
Disability Class: Vision Difficulty
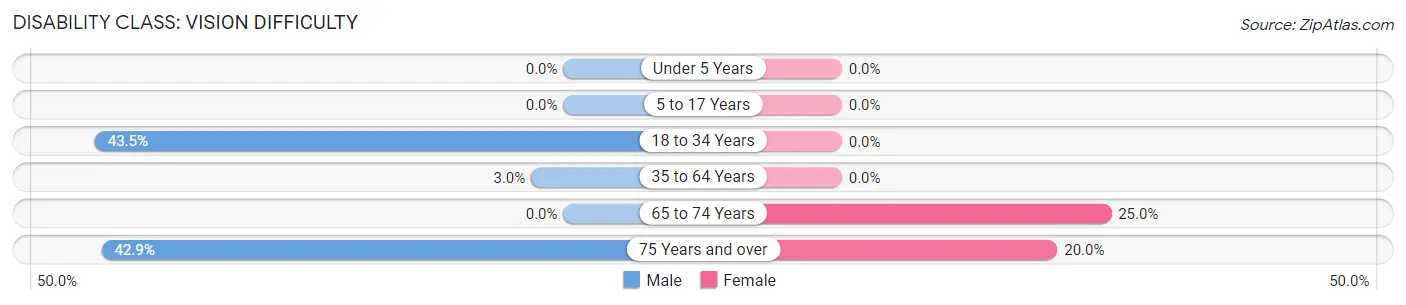
| Age Bracket | Male | Female |
| Under 5 Years | 0 (0.0%) | 0 (0.0%) |
| 5 to 17 Years | 0 (0.0%) | 0 (0.0%) |
| 18 to 34 Years | 10 (43.5%) | 0 (0.0%) |
| 35 to 64 Years | 2 (3.0%) | 0 (0.0%) |
| 65 to 74 Years | 0 (0.0%) | 1 (25.0%) |
| 75 Years and over | 6 (42.9%) | 2 (20.0%) |
Disability Class: Cognitive Difficulty
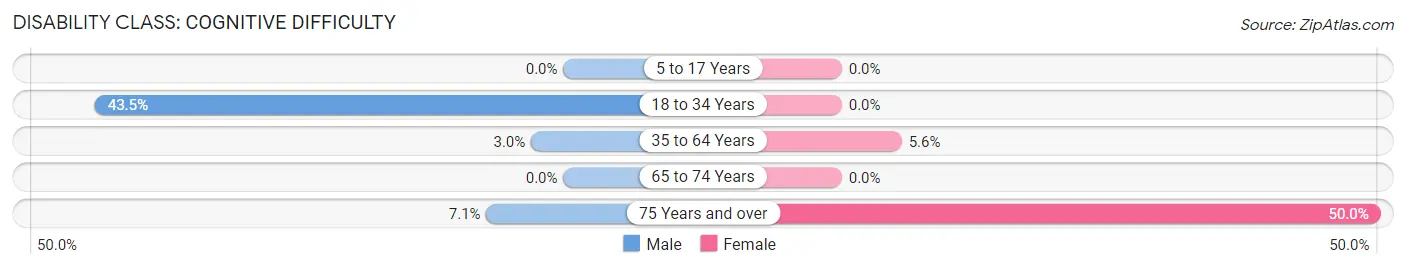
| Age Bracket | Male | Female |
| 5 to 17 Years | 0 (0.0%) | 0 (0.0%) |
| 18 to 34 Years | 10 (43.5%) | 0 (0.0%) |
| 35 to 64 Years | 2 (3.0%) | 2 (5.6%) |
| 65 to 74 Years | 0 (0.0%) | 0 (0.0%) |
| 75 Years and over | 1 (7.1%) | 5 (50.0%) |
Disability Class: Ambulatory Difficulty
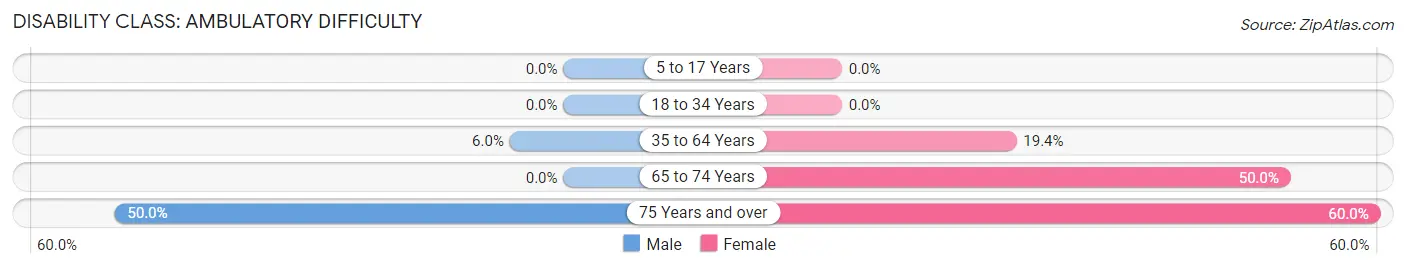
| Age Bracket | Male | Female |
| 5 to 17 Years | 0 (0.0%) | 0 (0.0%) |
| 18 to 34 Years | 0 (0.0%) | 0 (0.0%) |
| 35 to 64 Years | 4 (6.0%) | 7 (19.4%) |
| 65 to 74 Years | 0 (0.0%) | 2 (50.0%) |
| 75 Years and over | 7 (50.0%) | 6 (60.0%) |
Disability Class: Self-Care Difficulty
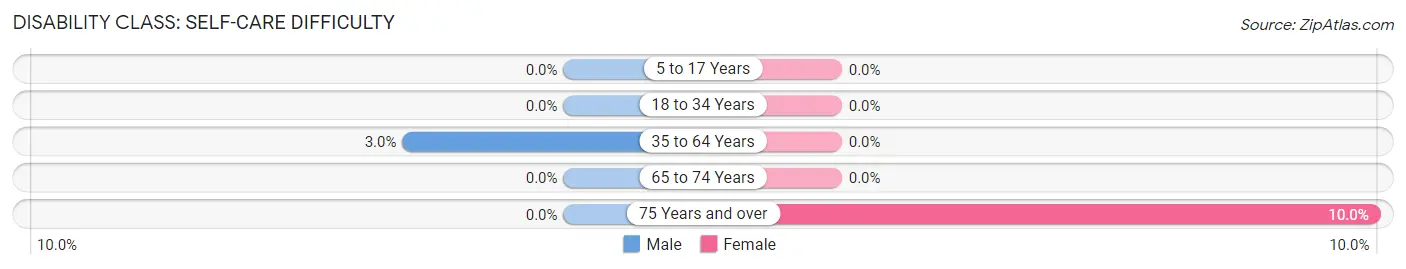
| Age Bracket | Male | Female |
| 5 to 17 Years | 0 (0.0%) | 0 (0.0%) |
| 18 to 34 Years | 0 (0.0%) | 0 (0.0%) |
| 35 to 64 Years | 2 (3.0%) | 0 (0.0%) |
| 65 to 74 Years | 0 (0.0%) | 0 (0.0%) |
| 75 Years and over | 0 (0.0%) | 1 (10.0%) |
Technology Access in Sweet Water
Computing Device Access in Sweet Water
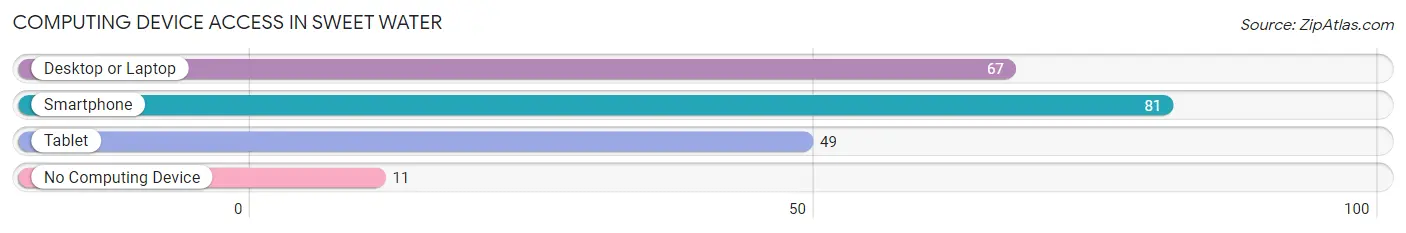
| Device Type | # Households | % Households |
| Desktop or Laptop | 67 | 72.0% |
| Smartphone | 81 | 87.1% |
| Tablet | 49 | 52.7% |
| No Computing Device | 11 | 11.8% |
| Total | 93 | 100.0% |
Internet Access in Sweet Water
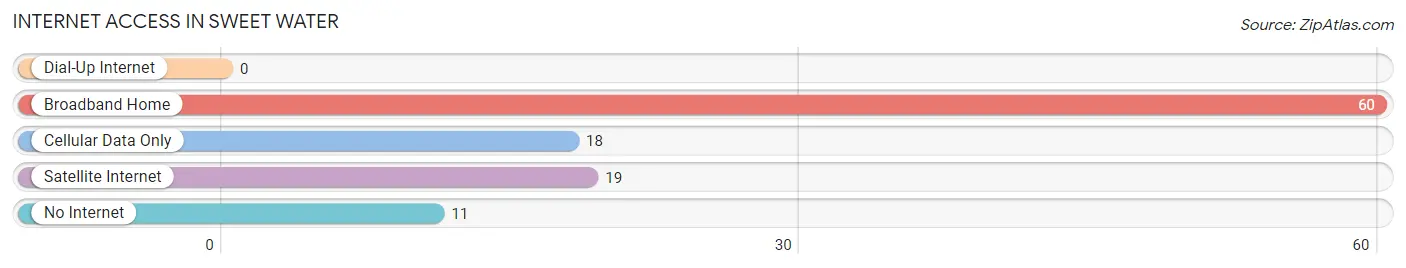
| Internet Type | # Households | % Households |
| Dial-Up Internet | 0 | 0.0% |
| Broadband Home | 60 | 64.5% |
| Cellular Data Only | 18 | 19.4% |
| Satellite Internet | 19 | 20.4% |
| No Internet | 11 | 11.8% |
| Total | 93 | 100.0% |
Sweet Water Summary
Water, Alabama is a small town located in the southeastern corner of the state, in the Black Belt region. It is situated in the Mobile-Tensaw Delta, a large wetland area that is home to a variety of wildlife. The town is located on the banks of the Tombigbee River, and is part of the Mobile metropolitan area.
History
The area that is now Sweet Water was first settled in the early 1800s by settlers from the Creek Nation. The town was originally known as “Creek Stand”, and was a trading post for the Creek people. In 1819, the town was renamed “Sweet Water”, after the nearby creek of the same name.
In the late 1800s, the town began to grow as a result of the timber industry. The town was home to several sawmills, and the timber industry provided employment for many of the town’s residents.
In the early 1900s, the town began to experience a decline in population as the timber industry began to decline. In the 1950s, the town was revitalized by the construction of the Tennessee-Tombigbee Waterway, which provided a new source of economic activity.
Geography
Sweet Water is located in the southeastern corner of Alabama, in the Black Belt region. It is situated in the Mobile-Tensaw Delta, a large wetland area that is home to a variety of wildlife. The town is located on the banks of the Tombigbee River, and is part of the Mobile metropolitan area.
The town has a total area of 1.2 square miles, all of which is land. The town is located at an elevation of approximately 200 feet above sea level.
Economy
The economy of Sweet Water is largely based on agriculture and timber. The town is home to several farms, and the timber industry is still an important part of the local economy.
The town is also home to several small businesses, including restaurants, retail stores, and service providers.
Demographics
As of the 2010 census, Sweet Water had a population of 1,093. The racial makeup of the town was 79.3% White, 17.7% African American, 0.3% Native American, 0.2% Asian, 0.1% Pacific Islander, and 2.4% from other races. Hispanic or Latino of any race were 1.7% of the population.
The median household income in Sweet Water was $31,250, and the median family income was $37,500. The per capita income for the town was $15,945. About 17.2% of families and 20.2% of the population were below the poverty line, including 28.3% of those under age 18 and 11.3% of those age 65 or over.
Common Questions
What is Per Capita Income in Sweet Water?
Per Capita income in Sweet Water is $44,634.
What is the Median Family Income in Sweet Water?
Median Family Income in Sweet Water is $128,750.
What is the Median Household income in Sweet Water?
Median Household Income in Sweet Water is $78,750.
What is Inequality or Gini Index in Sweet Water?
Inequality or Gini Index in Sweet Water is 0.57.
What is the Total Population of Sweet Water?
Total Population of Sweet Water is 239.
What is the Total Male Population of Sweet Water?
Total Male Population of Sweet Water is 127.
What is the Total Female Population of Sweet Water?
Total Female Population of Sweet Water is 112.
What is the Ratio of Males per 100 Females in Sweet Water?
There are 113.39 Males per 100 Females in Sweet Water.
What is the Ratio of Females per 100 Males in Sweet Water?
There are 88.19 Females per 100 Males in Sweet Water.
What is the Median Population Age in Sweet Water?
Median Population Age in Sweet Water is 40.5 Years.
What is the Average Family Size in Sweet Water
Average Family Size in Sweet Water is 3.2 People.
What is the Average Household Size in Sweet Water
Average Household Size in Sweet Water is 2.6 People.
How Large is the Labor Force in Sweet Water?
There are 114 People in the Labor Forcein in Sweet Water.
What is the Percentage of People in the Labor Force in Sweet Water?
57.6% of People are in the Labor Force in Sweet Water.
What is the Unemployment Rate in Sweet Water?
Unemployment Rate in Sweet Water is 9.6%.