Glencoe, AL Map & Demographics
Glencoe Map
Glencoe Overview
$33,056
PER CAPITA INCOME
$91,319
AVG FAMILY INCOME
$68,893
AVG HOUSEHOLD INCOME
45.4%
WAGE / INCOME GAP [ % ]
54.6¢/ $1
WAGE / INCOME GAP [ $ ]
0.42
INEQUALITY / GINI INDEX
5,343
TOTAL POPULATION
2,450
MALE POPULATION
2,893
FEMALE POPULATION
84.69
MALES / 100 FEMALES
118.08
FEMALES / 100 MALES
43.2
MEDIAN AGE
3.2
AVG FAMILY SIZE
2.7
AVG HOUSEHOLD SIZE
2,524
LABOR FORCE [ PEOPLE ]
59.9%
PERCENT IN LABOR FORCE
1.5%
UNEMPLOYMENT RATE
Glencoe Area Codes
Income in Glencoe
Income Overview in Glencoe
Per Capita Income in Glencoe is $33,056, while median incomes of families and households are $91,319 and $68,893 respectively.
| Characteristic | Number | Measure |
| Per Capita Income | 5,343 | $33,056 |
| Median Family Income | 1,394 | $91,319 |
| Mean Family Income | 1,394 | $106,800 |
| Median Household Income | 1,950 | $68,893 |
| Mean Household Income | 1,950 | $86,592 |
| Income Deficit | 1,394 | $0 |
| Wage / Income Gap (%) | 5,343 | 45.37% |
| Wage / Income Gap ($) | 5,343 | 54.63¢ per $1 |
| Gini / Inequality Index | 5,343 | 0.42 |
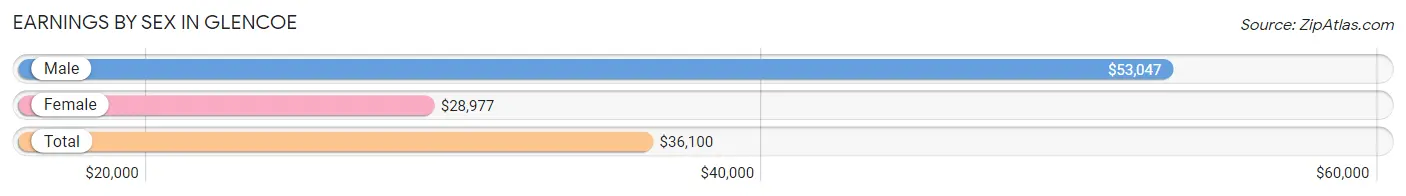
Earnings by Sex in Glencoe
Average Earnings in Glencoe are $36,100, $53,047 for men and $28,977 for women, a difference of 45.4%.
| Sex | Number | Average Earnings |
| Male | 1,294 (50.1%) | $53,047 |
| Female | 1,289 (49.9%) | $28,977 |
| Total | 2,583 (100.0%) | $36,100 |
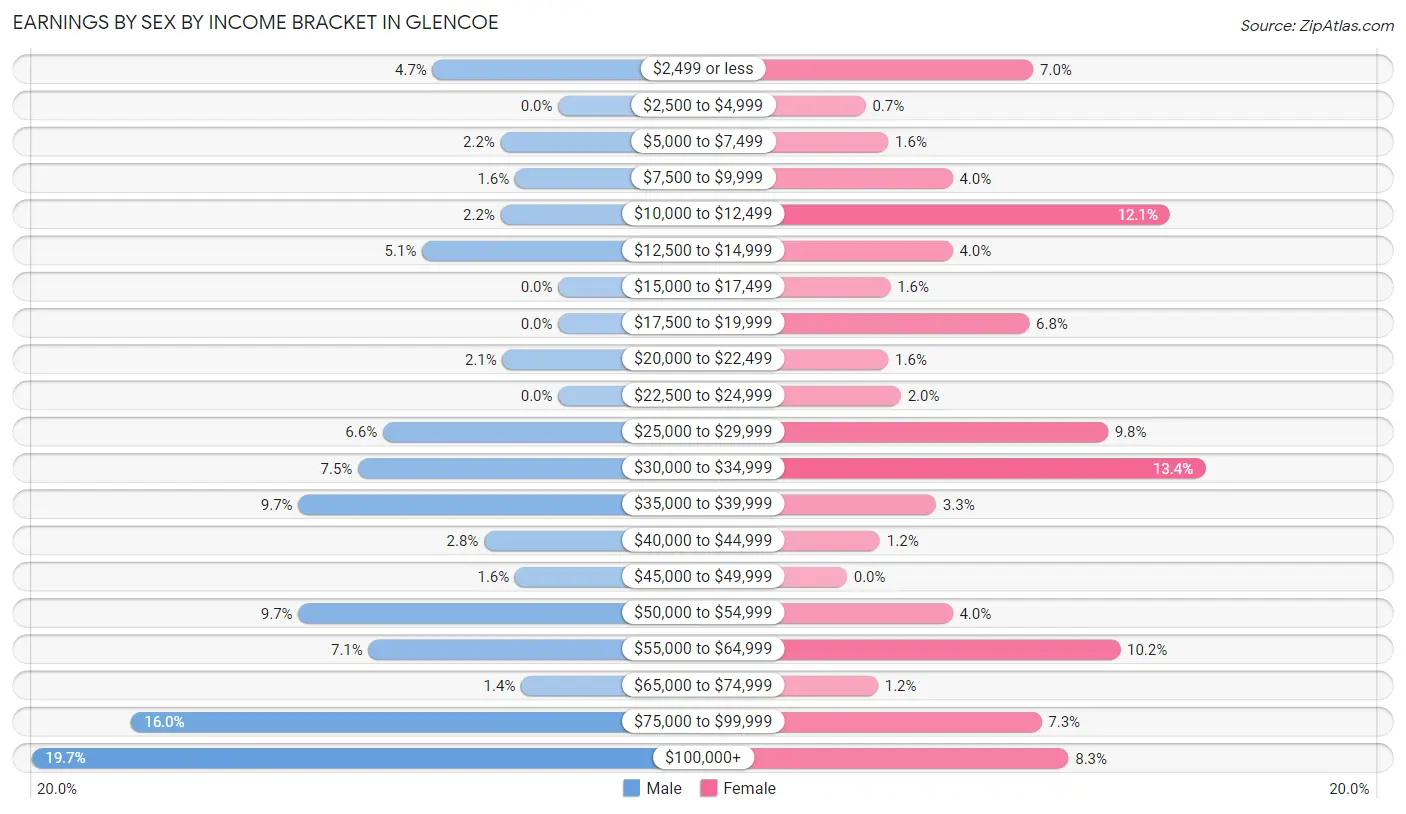
Earnings by Sex by Income Bracket in Glencoe
The most common earnings brackets in Glencoe are $100,000+ for men (255 | 19.7%) and $30,000 to $34,999 for women (173 | 13.4%).
| Income | Male | Female |
| $2,499 or less | 61 (4.7%) | 90 (7.0%) |
| $2,500 to $4,999 | 0 (0.0%) | 9 (0.7%) |
| $5,000 to $7,499 | 28 (2.2%) | 20 (1.5%) |
| $7,500 to $9,999 | 21 (1.6%) | 51 (4.0%) |
| $10,000 to $12,499 | 28 (2.2%) | 156 (12.1%) |
| $12,500 to $14,999 | 66 (5.1%) | 51 (4.0%) |
| $15,000 to $17,499 | 0 (0.0%) | 21 (1.6%) |
| $17,500 to $19,999 | 0 (0.0%) | 88 (6.8%) |
| $20,000 to $22,499 | 27 (2.1%) | 20 (1.5%) |
| $22,500 to $24,999 | 0 (0.0%) | 26 (2.0%) |
| $25,000 to $29,999 | 85 (6.6%) | 126 (9.8%) |
| $30,000 to $34,999 | 97 (7.5%) | 173 (13.4%) |
| $35,000 to $39,999 | 126 (9.7%) | 43 (3.3%) |
| $40,000 to $44,999 | 36 (2.8%) | 16 (1.2%) |
| $45,000 to $49,999 | 21 (1.6%) | 0 (0.0%) |
| $50,000 to $54,999 | 126 (9.7%) | 51 (4.0%) |
| $55,000 to $64,999 | 92 (7.1%) | 132 (10.2%) |
| $65,000 to $74,999 | 18 (1.4%) | 15 (1.2%) |
| $75,000 to $99,999 | 207 (16.0%) | 94 (7.3%) |
| $100,000+ | 255 (19.7%) | 107 (8.3%) |
| Total | 1,294 (100.0%) | 1,289 (100.0%) |
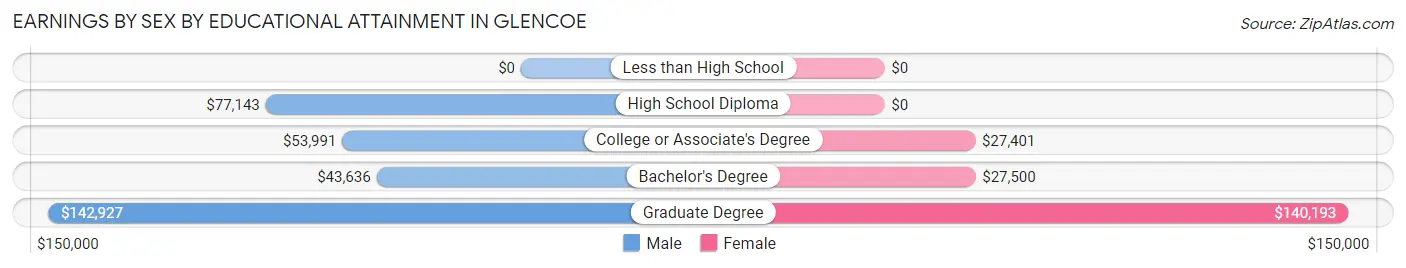
Earnings by Sex by Educational Attainment in Glencoe
Average earnings in Glencoe are $60,179 for men and $32,584 for women, a difference of 45.9%. Men with an educational attainment of graduate degree enjoy the highest average annual earnings of $142,927, while those with bachelor's degree education earn the least with $43,636. Women with an educational attainment of graduate degree earn the most with the average annual earnings of $140,193, while those with college or associate's degree education have the smallest earnings of $27,401.
| Educational Attainment | Male Income | Female Income |
| Less than High School | - | - |
| High School Diploma | $77,143 | $0 |
| College or Associate's Degree | $53,991 | $27,401 |
| Bachelor's Degree | $43,636 | $27,500 |
| Graduate Degree | $142,927 | $140,193 |
| Total | $60,179 | $32,584 |
Family Income in Glencoe
Family Income Brackets in Glencoe
According to the Glencoe family income data, there are 322 families falling into the $100,000 to $149,999 income range, which is the most common income bracket and makes up 23.1% of all families.
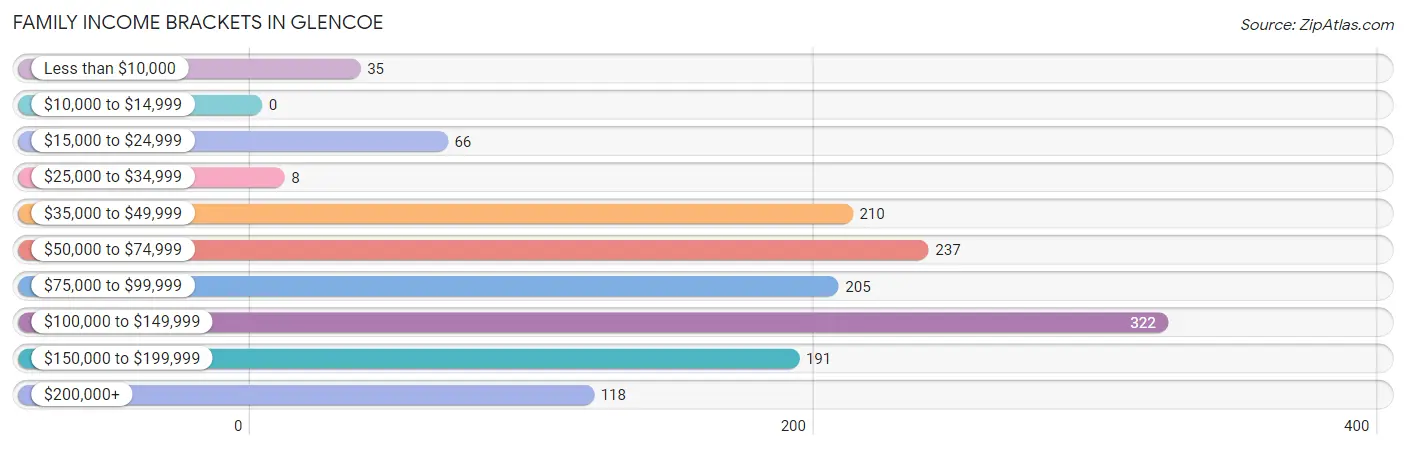
| Income Bracket | # Families | % Families |
| Less than $10,000 | 35 | 2.5% |
| $10,000 to $14,999 | 0 | 0.0% |
| $15,000 to $24,999 | 66 | 4.7% |
| $25,000 to $34,999 | 8 | 0.6% |
| $35,000 to $49,999 | 210 | 15.1% |
| $50,000 to $74,999 | 237 | 17.0% |
| $75,000 to $99,999 | 205 | 14.7% |
| $100,000 to $149,999 | 322 | 23.1% |
| $150,000 to $199,999 | 191 | 13.7% |
| $200,000+ | 118 | 8.5% |
Family Income by Famaliy Size in Glencoe
5-person families (116 | 8.3%) account for the highest median family income in Glencoe with $196,220 per family, while 5-person families (116 | 8.3%) have the highest median income of $39,244 per family member.
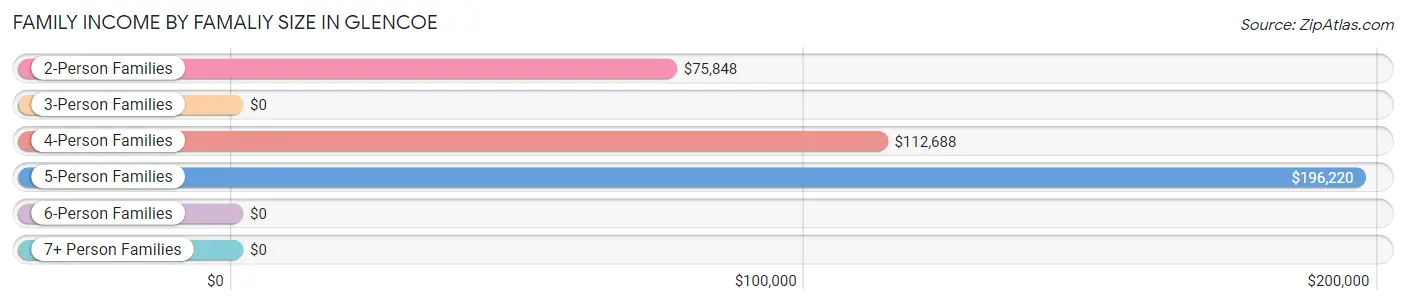
| Income Bracket | # Families | Median Income |
| 2-Person Families | 675 (48.4%) | $75,848 |
| 3-Person Families | 261 (18.7%) | $0 |
| 4-Person Families | 298 (21.4%) | $112,688 |
| 5-Person Families | 116 (8.3%) | $196,220 |
| 6-Person Families | 44 (3.2%) | $0 |
| 7+ Person Families | 0 (0.0%) | $0 |
| Total | 1,394 (100.0%) | $91,319 |
Family Income by Number of Earners in Glencoe
The median family income in Glencoe is $91,319, with families comprising 3+ earners (58) having the highest median family income of $185,132, while families with no earners (220) have the lowest median family income of $53,409, accounting for 4.2% and 15.8% of families, respectively.
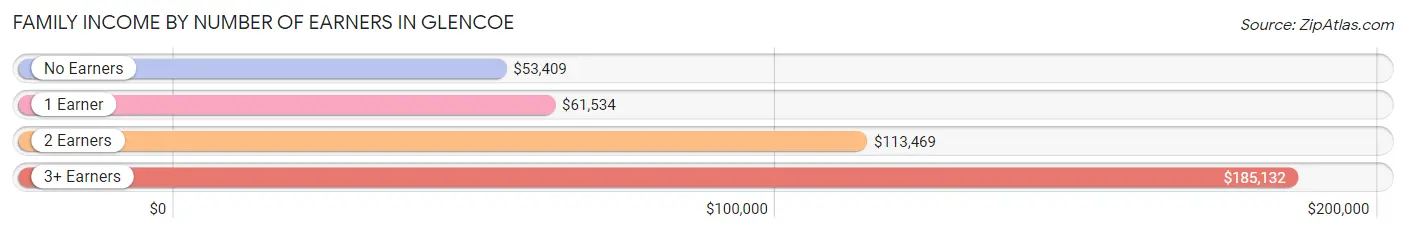
| Number of Earners | # Families | Median Income |
| No Earners | 220 (15.8%) | $53,409 |
| 1 Earner | 309 (22.2%) | $61,534 |
| 2 Earners | 807 (57.9%) | $113,469 |
| 3+ Earners | 58 (4.2%) | $185,132 |
| Total | 1,394 (100.0%) | $91,319 |
Household Income in Glencoe
Household Income Brackets in Glencoe
With 369 households falling in the category, the $35,000 to $49,999 income range is the most frequent in Glencoe, accounting for 18.9% of all households. In contrast, only 23 households (1.2%) fall into the $10,000 to $14,999 income bracket, making it the least populous group.
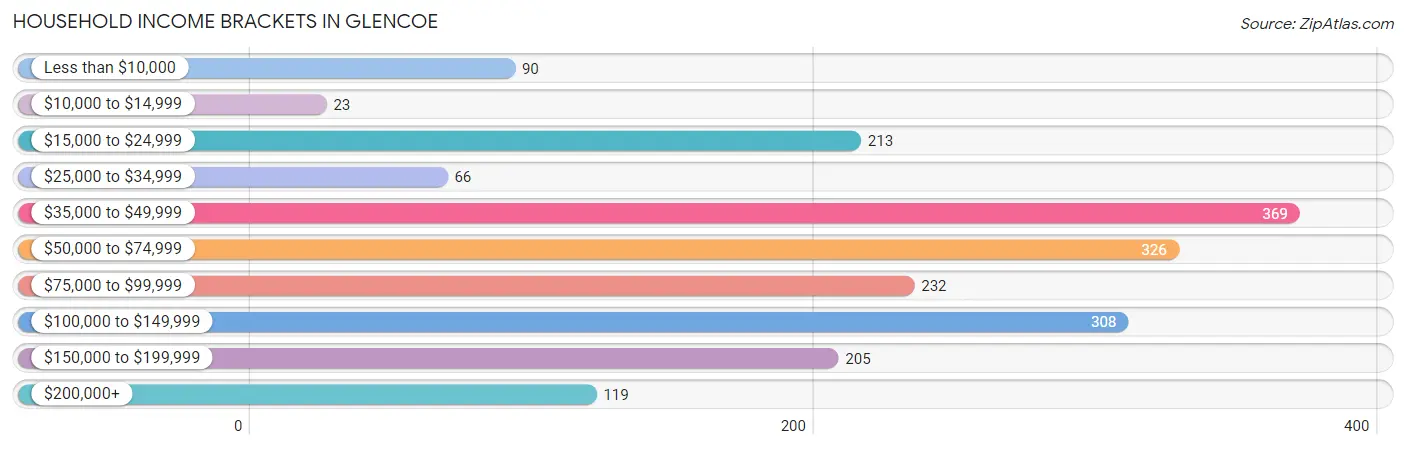
| Income Bracket | # Households | % Households |
| Less than $10,000 | 90 | 4.6% |
| $10,000 to $14,999 | 23 | 1.2% |
| $15,000 to $24,999 | 213 | 10.9% |
| $25,000 to $34,999 | 66 | 3.4% |
| $35,000 to $49,999 | 369 | 18.9% |
| $50,000 to $74,999 | 326 | 16.7% |
| $75,000 to $99,999 | 232 | 11.9% |
| $100,000 to $149,999 | 308 | 15.8% |
| $150,000 to $199,999 | 205 | 10.5% |
| $200,000+ | 119 | 6.1% |
Household Income by Householder Age in Glencoe
The median household income in Glencoe is $68,893, with the highest median household income of $113,781 found in the 25 to 44 years age bracket for the primary householder. A total of 455 households (23.3%) fall into this category. Meanwhile, the 15 to 24 years age bracket for the primary householder has the lowest median household income of $0, with 30 households (1.5%) in this group.
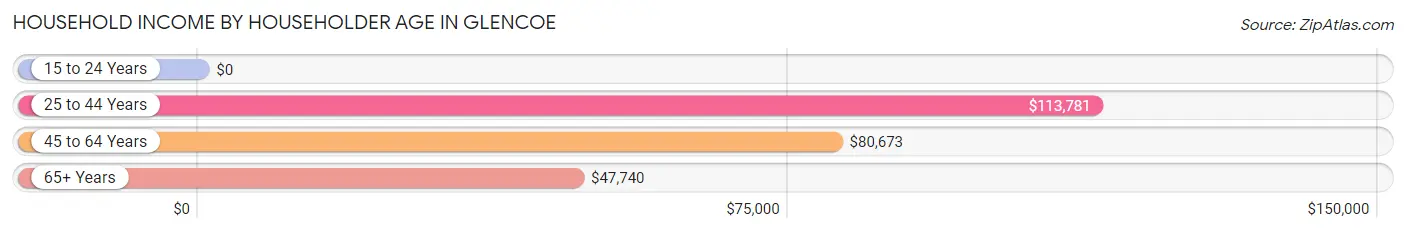
| Income Bracket | # Households | Median Income |
| 15 to 24 Years | 30 (1.5%) | $0 |
| 25 to 44 Years | 455 (23.3%) | $113,781 |
| 45 to 64 Years | 868 (44.5%) | $80,673 |
| 65+ Years | 597 (30.6%) | $47,740 |
| Total | 1,950 (100.0%) | $68,893 |
Poverty in Glencoe
Income Below Poverty by Sex and Age in Glencoe
With 3.9% poverty level for males and 8.0% for females among the residents of Glencoe, 15 year old males and 18 to 24 year old females are the most vulnerable to poverty, with 12 males (100.0%) and 57 females (58.8%) in their respective age groups living below the poverty level.
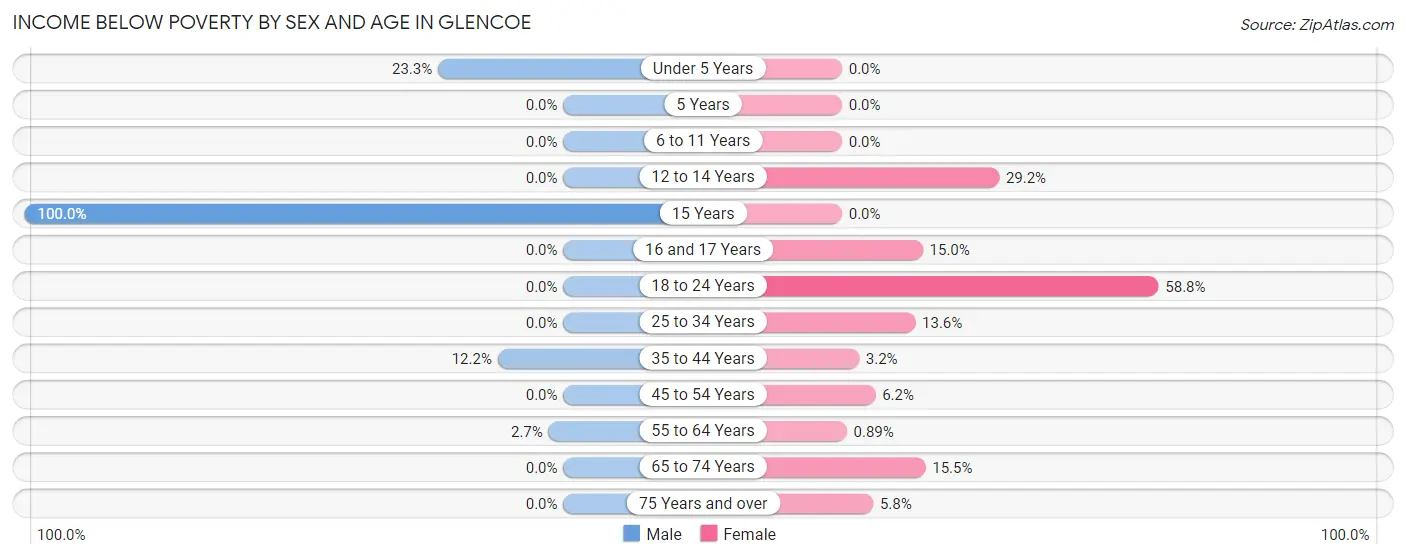
| Age Bracket | Male | Female |
| Under 5 Years | 30 (23.3%) | 0 (0.0%) |
| 5 Years | 0 (0.0%) | 0 (0.0%) |
| 6 to 11 Years | 0 (0.0%) | 0 (0.0%) |
| 12 to 14 Years | 0 (0.0%) | 14 (29.2%) |
| 15 Years | 12 (100.0%) | 0 (0.0%) |
| 16 and 17 Years | 0 (0.0%) | 12 (15.0%) |
| 18 to 24 Years | 0 (0.0%) | 57 (58.8%) |
| 25 to 34 Years | 0 (0.0%) | 40 (13.6%) |
| 35 to 44 Years | 43 (12.2%) | 13 (3.2%) |
| 45 to 54 Years | 0 (0.0%) | 16 (6.2%) |
| 55 to 64 Years | 8 (2.7%) | 5 (0.9%) |
| 65 to 74 Years | 0 (0.0%) | 53 (15.5%) |
| 75 Years and over | 0 (0.0%) | 18 (5.8%) |
| Total | 93 (3.9%) | 228 (8.0%) |
Income Above Poverty by Sex and Age in Glencoe
According to the poverty statistics in Glencoe, males aged 6 to 11 years and females aged under 5 years are the age groups that are most secure financially, with 100.0% of males and 100.0% of females in these age groups living above the poverty line.
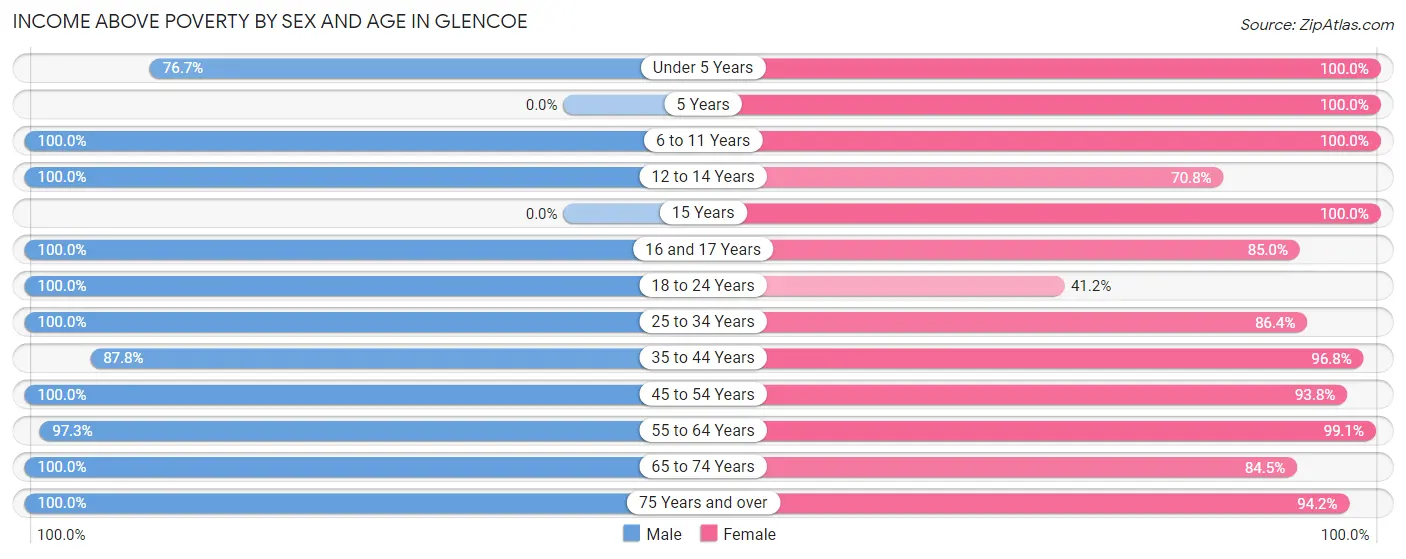
| Age Bracket | Male | Female |
| Under 5 Years | 99 (76.7%) | 151 (100.0%) |
| 5 Years | 0 (0.0%) | 6 (100.0%) |
| 6 to 11 Years | 183 (100.0%) | 230 (100.0%) |
| 12 to 14 Years | 270 (100.0%) | 34 (70.8%) |
| 15 Years | 0 (0.0%) | 55 (100.0%) |
| 16 and 17 Years | 148 (100.0%) | 68 (85.0%) |
| 18 to 24 Years | 168 (100.0%) | 40 (41.2%) |
| 25 to 34 Years | 208 (100.0%) | 254 (86.4%) |
| 35 to 44 Years | 310 (87.8%) | 399 (96.8%) |
| 45 to 54 Years | 153 (100.0%) | 242 (93.8%) |
| 55 to 64 Years | 284 (97.3%) | 556 (99.1%) |
| 65 to 74 Years | 315 (100.0%) | 289 (84.5%) |
| 75 Years and over | 164 (100.0%) | 293 (94.2%) |
| Total | 2,302 (96.1%) | 2,617 (92.0%) |
Income Below Poverty Among Married-Couple Families in Glencoe
The poverty statistics for married-couple families in Glencoe show that 1.0% or 12 of the total 1,151 families live below the poverty line. Families with 1 or 2 children have the highest poverty rate of 4.1%, comprising of 12 families. On the other hand, families with no children have the lowest poverty rate of 0.0%, which includes 0 families.
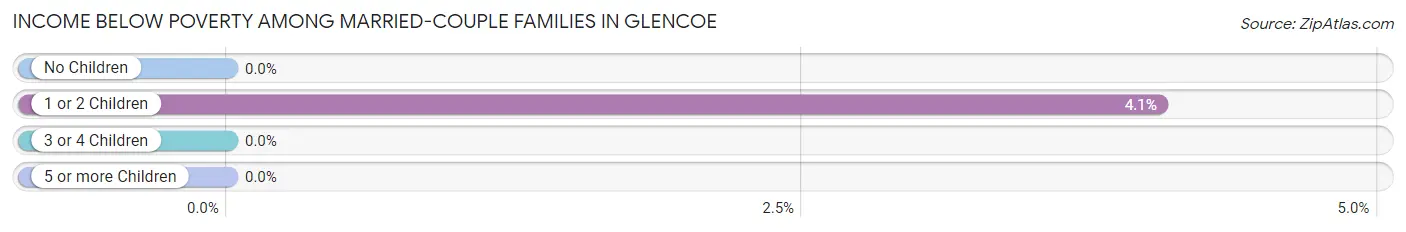
| Children | Above Poverty | Below Poverty |
| No Children | 699 (100.0%) | 0 (0.0%) |
| 1 or 2 Children | 284 (96.0%) | 12 (4.1%) |
| 3 or 4 Children | 156 (100.0%) | 0 (0.0%) |
| 5 or more Children | 0 (0.0%) | 0 (0.0%) |
| Total | 1,139 (99.0%) | 12 (1.0%) |
Income Below Poverty Among Single-Parent Households in Glencoe
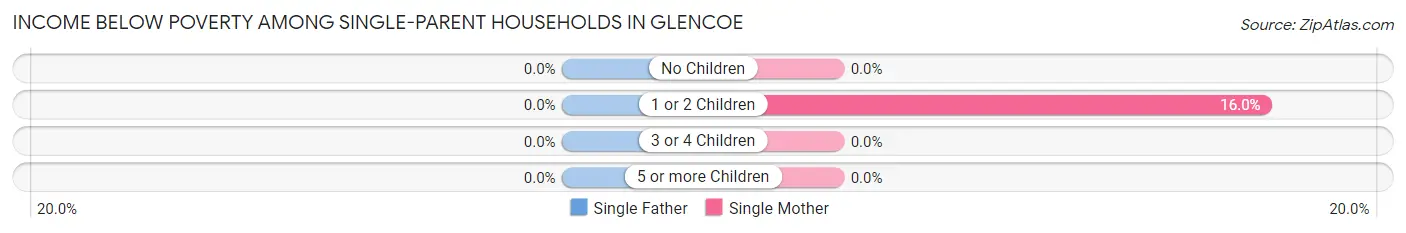
| Children | Single Father | Single Mother |
| No Children | 0 (0.0%) | 0 (0.0%) |
| 1 or 2 Children | 0 (0.0%) | 23 (16.0%) |
| 3 or 4 Children | 0 (0.0%) | 0 (0.0%) |
| 5 or more Children | 0 (0.0%) | 0 (0.0%) |
| Total | 0 (0.0%) | 23 (11.0%) |
Income Below Poverty Among Married-Couple vs Single-Parent Households in Glencoe
The poverty data for Glencoe shows that 12 of the married-couple family households (1.0%) and 23 of the single-parent households (9.5%) are living below the poverty level. Within the married-couple family households, those with 1 or 2 children have the highest poverty rate, with 12 households (4.1%) falling below the poverty line. Among the single-parent households, those with 1 or 2 children have the highest poverty rate, with 23 household (13.0%) living below poverty.
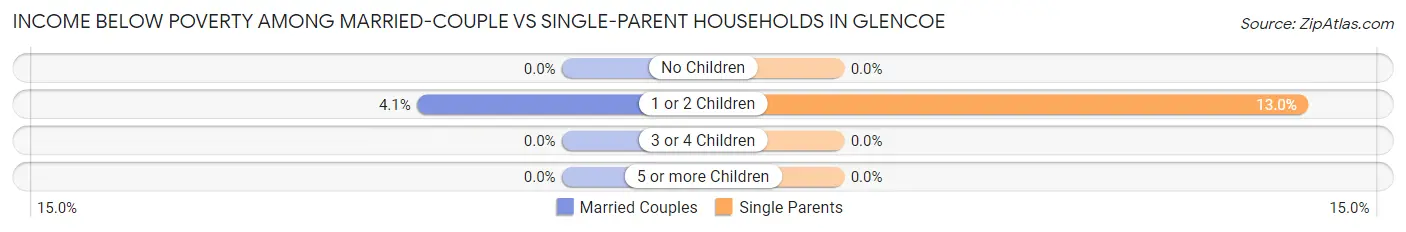
| Children | Married-Couple Families | Single-Parent Households |
| No Children | 0 (0.0%) | 0 (0.0%) |
| 1 or 2 Children | 12 (4.1%) | 23 (13.0%) |
| 3 or 4 Children | 0 (0.0%) | 0 (0.0%) |
| 5 or more Children | 0 (0.0%) | 0 (0.0%) |
| Total | 12 (1.0%) | 23 (9.5%) |
Race in Glencoe
The most populous races in Glencoe are White / Caucasian (4,950 | 92.6%), Black / African American (142 | 2.7%), and Two or more Races (122 | 2.3%).
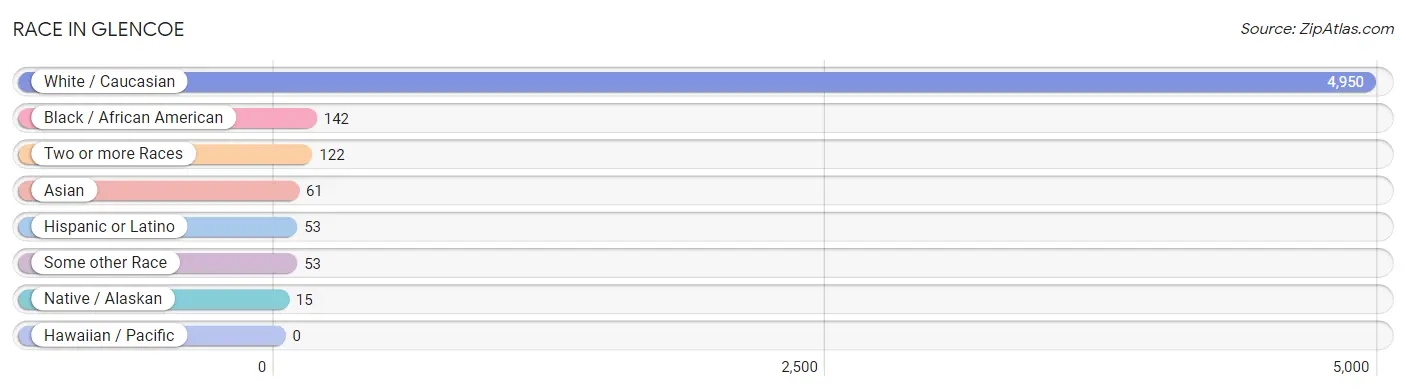
| Race | # Population | % Population |
| Asian | 61 | 1.1% |
| Black / African American | 142 | 2.7% |
| Hawaiian / Pacific | 0 | 0.0% |
| Hispanic or Latino | 53 | 1.0% |
| Native / Alaskan | 15 | 0.3% |
| White / Caucasian | 4,950 | 92.6% |
| Two or more Races | 122 | 2.3% |
| Some other Race | 53 | 1.0% |
| Total | 5,343 | 100.0% |
Ancestry in Glencoe
The most populous ancestries reported in Glencoe are American (2,025 | 37.9%), Irish (424 | 7.9%), English (417 | 7.8%), German (289 | 5.4%), and Korean (105 | 2.0%), together accounting for 61.0% of all Glencoe residents.
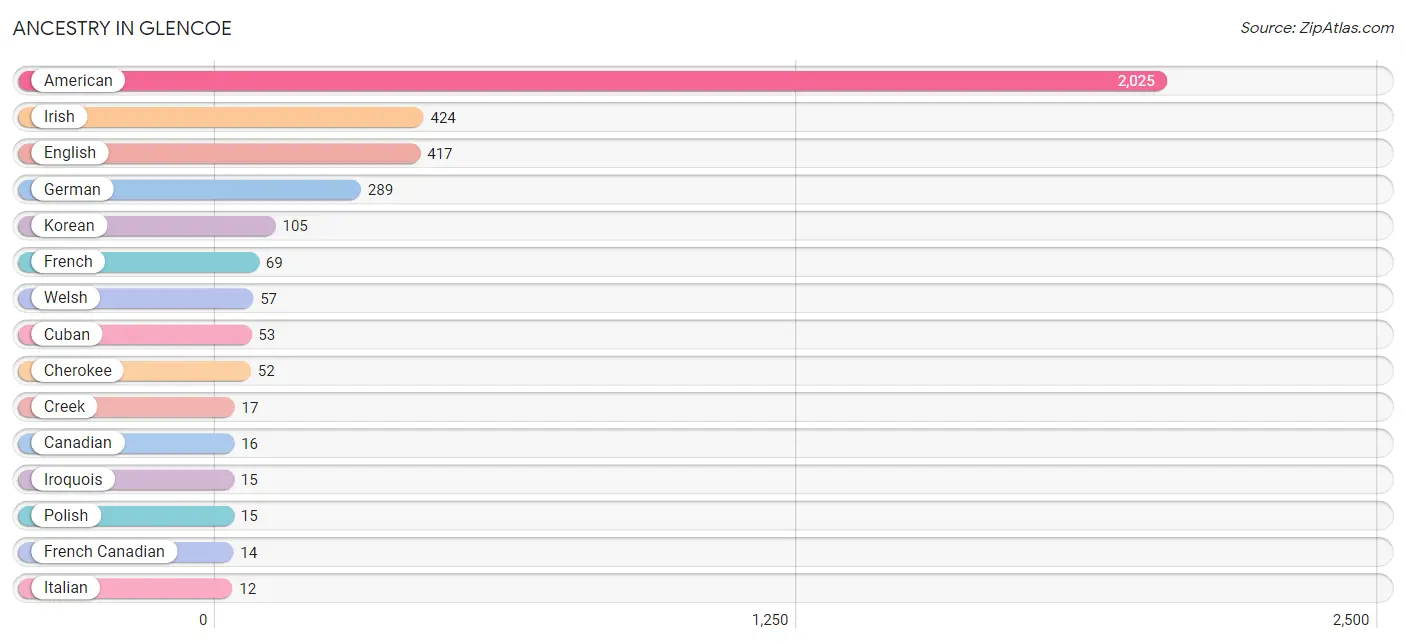
| Ancestry | # Population | % Population |
| American | 2,025 | 37.9% |
| Canadian | 16 | 0.3% |
| Cherokee | 52 | 1.0% |
| Creek | 17 | 0.3% |
| Cuban | 53 | 1.0% |
| English | 417 | 7.8% |
| European | 9 | 0.2% |
| French | 69 | 1.3% |
| French Canadian | 14 | 0.3% |
| German | 289 | 5.4% |
| Irish | 424 | 7.9% |
| Iroquois | 15 | 0.3% |
| Italian | 12 | 0.2% |
| Korean | 105 | 2.0% |
| Polish | 15 | 0.3% |
| Scotch-Irish | 3 | 0.1% |
| Scottish | 6 | 0.1% |
| Welsh | 57 | 1.1% | View All 18 Rows |
Immigrants in Glencoe
The most numerous immigrant groups reported in Glencoe came from Caribbean (53 | 1.0%), Cuba (53 | 1.0%), Latin America (53 | 1.0%), Asia (40 | 0.7%), and Philippines (40 | 0.7%), together accounting for 4.5% of all Glencoe residents.
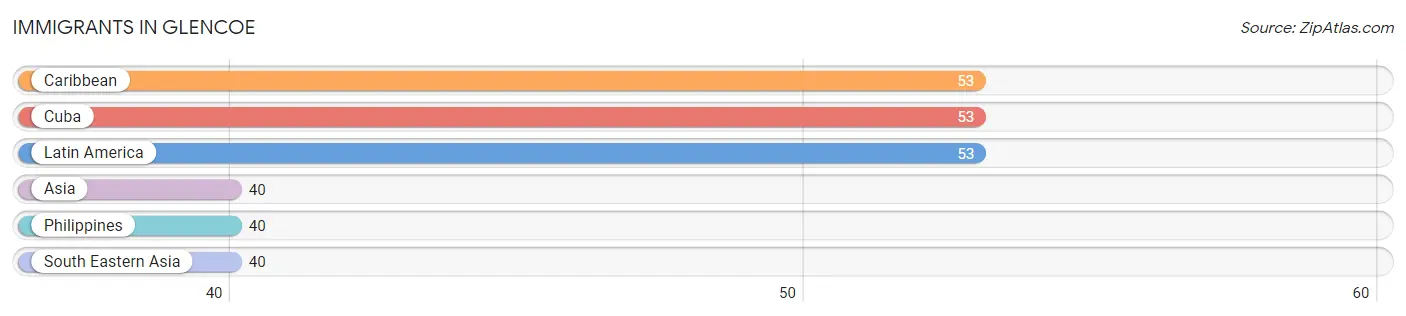
| Immigration Origin | # Population | % Population |
| Asia | 40 | 0.7% |
| Caribbean | 53 | 1.0% |
| Cuba | 53 | 1.0% |
| Latin America | 53 | 1.0% |
| Philippines | 40 | 0.7% |
| South Eastern Asia | 40 | 0.7% | View All 6 Rows |
Sex and Age in Glencoe
Sex and Age in Glencoe
The most populous age groups in Glencoe are 10 to 14 Years (346 | 14.1%) for men and 60 to 64 Years (327 | 11.3%) for women.
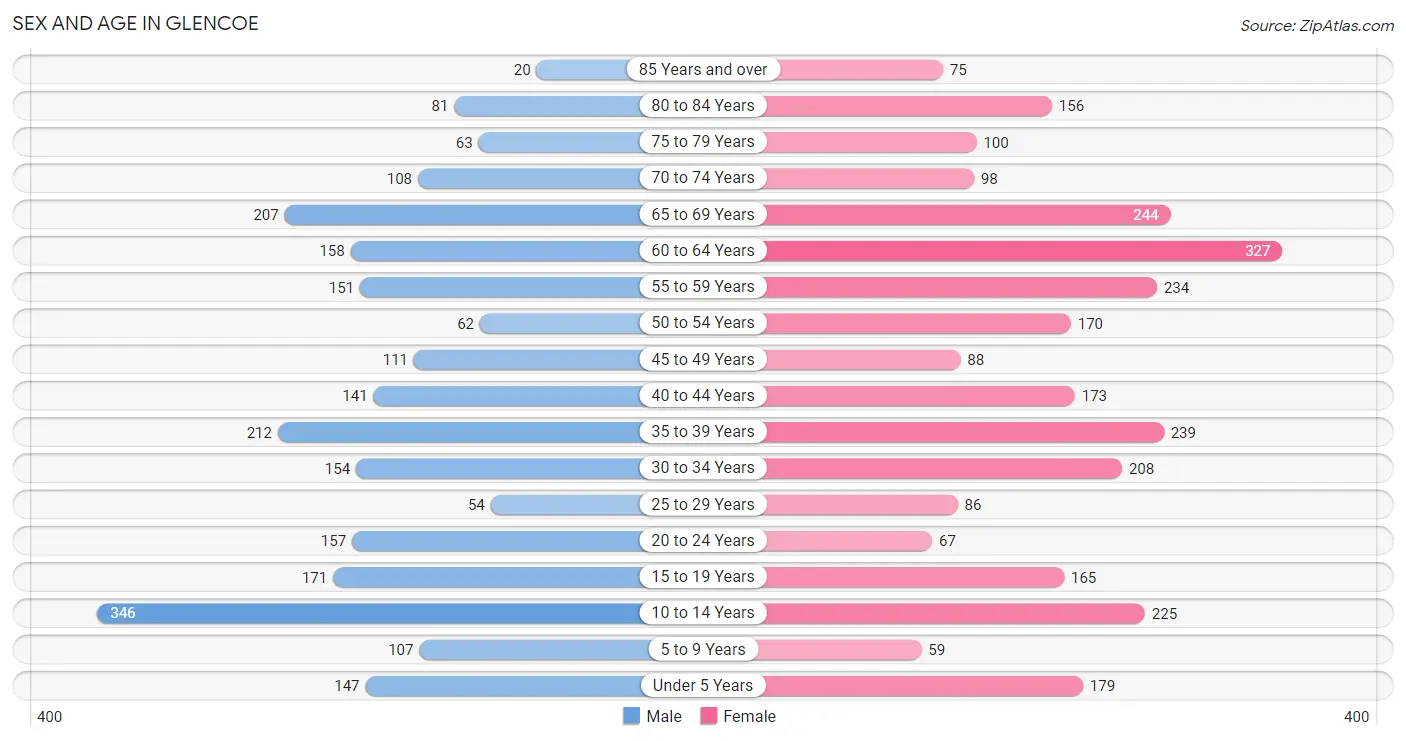
| Age Bracket | Male | Female |
| Under 5 Years | 147 (6.0%) | 179 (6.2%) |
| 5 to 9 Years | 107 (4.4%) | 59 (2.0%) |
| 10 to 14 Years | 346 (14.1%) | 225 (7.8%) |
| 15 to 19 Years | 171 (7.0%) | 165 (5.7%) |
| 20 to 24 Years | 157 (6.4%) | 67 (2.3%) |
| 25 to 29 Years | 54 (2.2%) | 86 (3.0%) |
| 30 to 34 Years | 154 (6.3%) | 208 (7.2%) |
| 35 to 39 Years | 212 (8.6%) | 239 (8.3%) |
| 40 to 44 Years | 141 (5.8%) | 173 (6.0%) |
| 45 to 49 Years | 111 (4.5%) | 88 (3.0%) |
| 50 to 54 Years | 62 (2.5%) | 170 (5.9%) |
| 55 to 59 Years | 151 (6.2%) | 234 (8.1%) |
| 60 to 64 Years | 158 (6.5%) | 327 (11.3%) |
| 65 to 69 Years | 207 (8.5%) | 244 (8.4%) |
| 70 to 74 Years | 108 (4.4%) | 98 (3.4%) |
| 75 to 79 Years | 63 (2.6%) | 100 (3.5%) |
| 80 to 84 Years | 81 (3.3%) | 156 (5.4%) |
| 85 Years and over | 20 (0.8%) | 75 (2.6%) |
| Total | 2,450 (100.0%) | 2,893 (100.0%) |
Families and Households in Glencoe
Median Family Size in Glencoe
The median family size in Glencoe is 3.21 persons per family, with single female/mother families (210 | 15.1%) accounting for the largest median family size of 3.53 persons per family. On the other hand, single male/father families (33 | 2.4%) represent the smallest median family size with 2.33 persons per family.
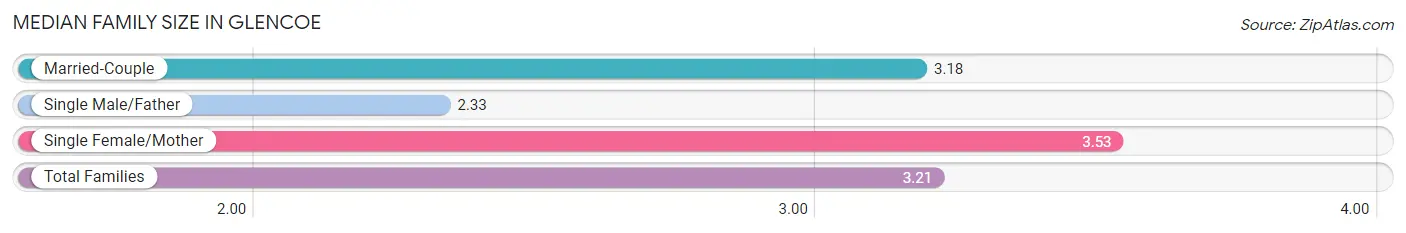
| Family Type | # Families | Family Size |
| Married-Couple | 1,151 (82.6%) | 3.18 |
| Single Male/Father | 33 (2.4%) | 2.33 |
| Single Female/Mother | 210 (15.1%) | 3.53 |
| Total Families | 1,394 (100.0%) | 3.21 |
Median Household Size in Glencoe
The median household size in Glencoe is 2.71 persons per household, with single female/mother households (210 | 10.8%) accounting for the largest median household size of 3.64 persons per household. non-family households (556 | 28.5%) represent the smallest median household size with 1.16 persons per household.
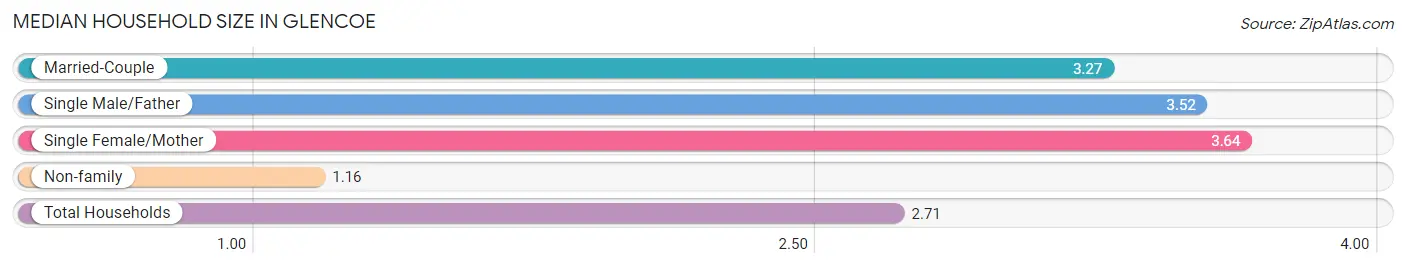
| Household Type | # Households | Household Size |
| Married-Couple | 1,151 (59.0%) | 3.27 |
| Single Male/Father | 33 (1.7%) | 3.52 |
| Single Female/Mother | 210 (10.8%) | 3.64 |
| Non-family | 556 (28.5%) | 1.16 |
| Total Households | 1,950 (100.0%) | 2.71 |
Household Size by Marriage Status in Glencoe
Out of a total of 1,950 households in Glencoe, 1,394 (71.5%) are family households, while 556 (28.5%) are nonfamily households. The most numerous type of family households are 2-person households, comprising 619, and the most common type of nonfamily households are 1-person households, comprising 516.
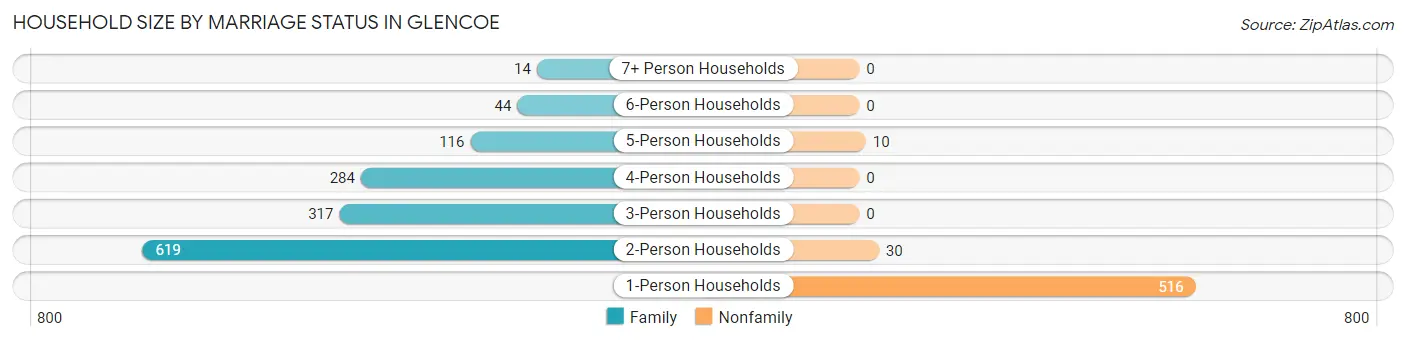
| Household Size | Family Households | Nonfamily Households |
| 1-Person Households | - | 516 (26.5%) |
| 2-Person Households | 619 (31.7%) | 30 (1.5%) |
| 3-Person Households | 317 (16.3%) | 0 (0.0%) |
| 4-Person Households | 284 (14.6%) | 0 (0.0%) |
| 5-Person Households | 116 (5.9%) | 10 (0.5%) |
| 6-Person Households | 44 (2.3%) | 0 (0.0%) |
| 7+ Person Households | 14 (0.7%) | 0 (0.0%) |
| Total | 1,394 (71.5%) | 556 (28.5%) |
Female Fertility in Glencoe
Fertility by Age in Glencoe
Average fertility rate in Glencoe is 34.0 births per 1,000 women. Women in the age bracket of 20 to 34 years have the highest fertility rate with 97.0 births per 1,000 women. Women in the age bracket of 20 to 34 years acount for 100.0% of all women with births.
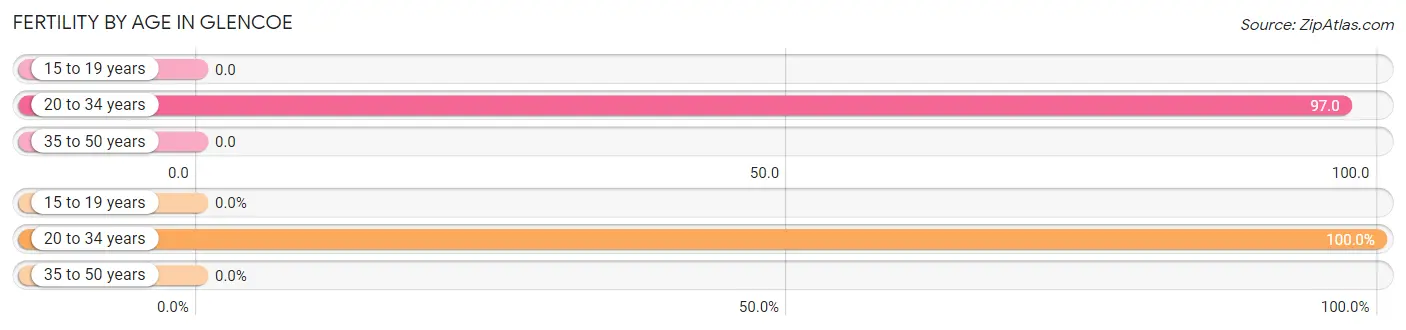
| Age Bracket | Women with Births | Births / 1,000 Women |
| 15 to 19 years | 0 (0.0%) | 0.0 |
| 20 to 34 years | 35 (100.0%) | 97.0 |
| 35 to 50 years | 0 (0.0%) | 0.0 |
| Total | 35 (100.0%) | 34.0 |
Fertility by Age by Marriage Status in Glencoe
34.3% of women with births (35) in Glencoe are married. The highest percentage of unmarried women with births falls into 20 to 34 years age bracket with 65.7% of them unmarried at the time of birth, while the lowest percentage of unmarried women with births belong to 20 to 34 years age bracket with 65.7% of them unmarried.
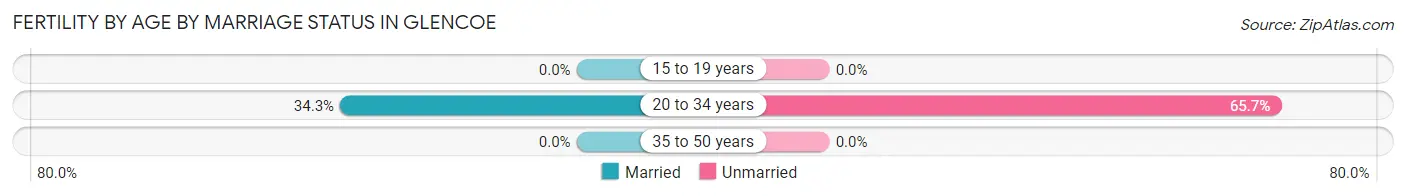
| Age Bracket | Married | Unmarried |
| 15 to 19 years | 0 (0.0%) | 0 (0.0%) |
| 20 to 34 years | 12 (34.3%) | 23 (65.7%) |
| 35 to 50 years | 0 (0.0%) | 0 (0.0%) |
| Total | 12 (34.3%) | 23 (65.7%) |
Fertility by Education in Glencoe
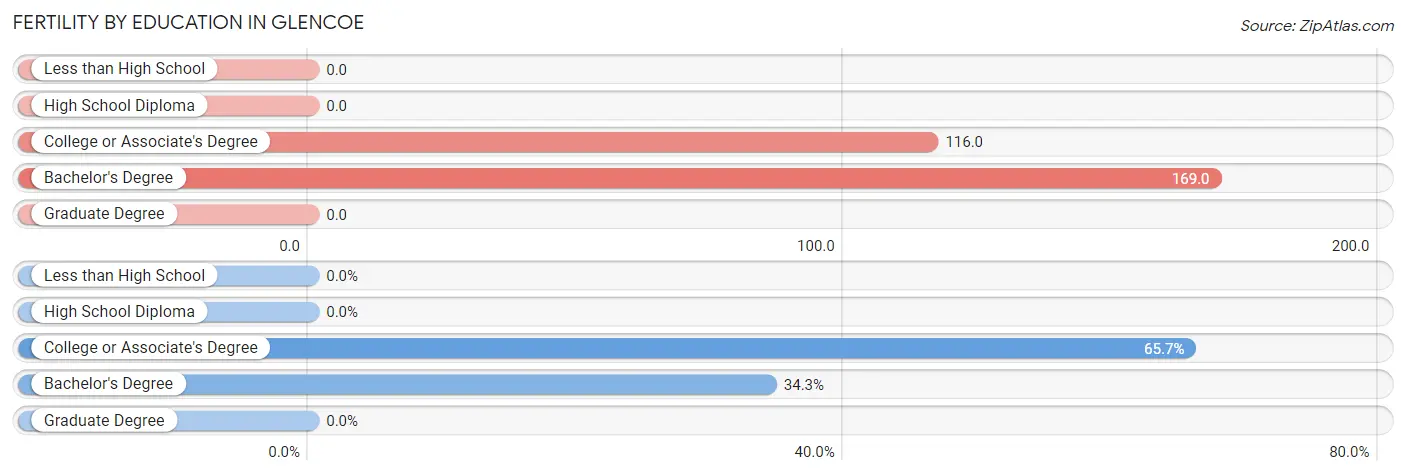
| Educational Attainment | Women with Births | Births / 1,000 Women |
| Less than High School | 0 (0.0%) | 0.0 |
| High School Diploma | 0 (0.0%) | 0.0 |
| College or Associate's Degree | 23 (65.7%) | 116.0 |
| Bachelor's Degree | 12 (34.3%) | 169.0 |
| Graduate Degree | 0 (0.0%) | 0.0 |
| Total | 35 (100.0%) | 34.0 |
Fertility by Education by Marriage Status in Glencoe
65.7% of women with births in Glencoe are unmarried. Women with the educational attainment of bachelor's degree are most likely to be married with 100.0% of them married at childbirth, while women with the educational attainment of college or associate's degree are least likely to be married with 100.0% of them unmarried at childbirth.
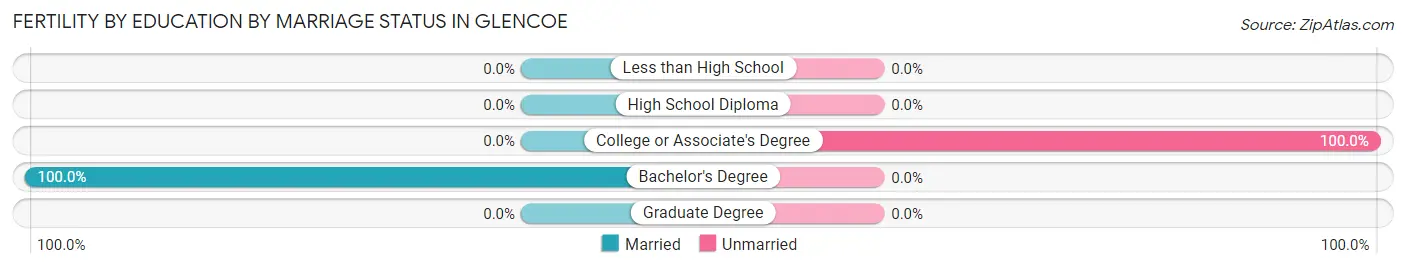
| Educational Attainment | Married | Unmarried |
| Less than High School | 0 (0.0%) | 0 (0.0%) |
| High School Diploma | 0 (0.0%) | 0 (0.0%) |
| College or Associate's Degree | 0 (0.0%) | 23 (100.0%) |
| Bachelor's Degree | 12 (100.0%) | 0 (0.0%) |
| Graduate Degree | 0 (0.0%) | 0 (0.0%) |
| Total | 12 (34.3%) | 23 (65.7%) |
Employment Characteristics in Glencoe
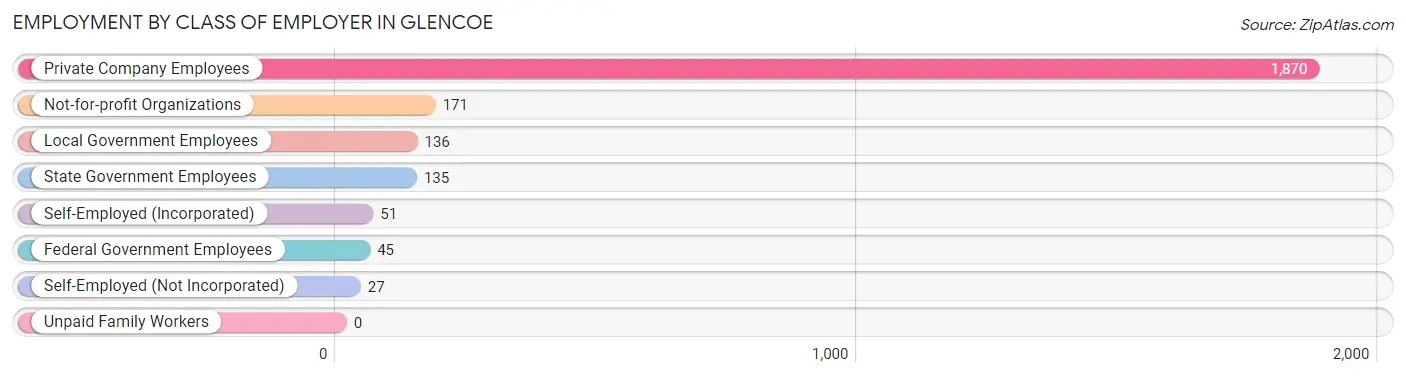
Employment by Class of Employer in Glencoe
Among the 2,435 employed individuals in Glencoe, private company employees (1,870 | 76.8%), not-for-profit organizations (171 | 7.0%), and local government employees (136 | 5.6%) make up the most common classes of employment.
| Employer Class | # Employees | % Employees |
| Private Company Employees | 1,870 | 76.8% |
| Self-Employed (Incorporated) | 51 | 2.1% |
| Self-Employed (Not Incorporated) | 27 | 1.1% |
| Not-for-profit Organizations | 171 | 7.0% |
| Local Government Employees | 136 | 5.6% |
| State Government Employees | 135 | 5.5% |
| Federal Government Employees | 45 | 1.8% |
| Unpaid Family Workers | 0 | 0.0% |
| Total | 2,435 | 100.0% |
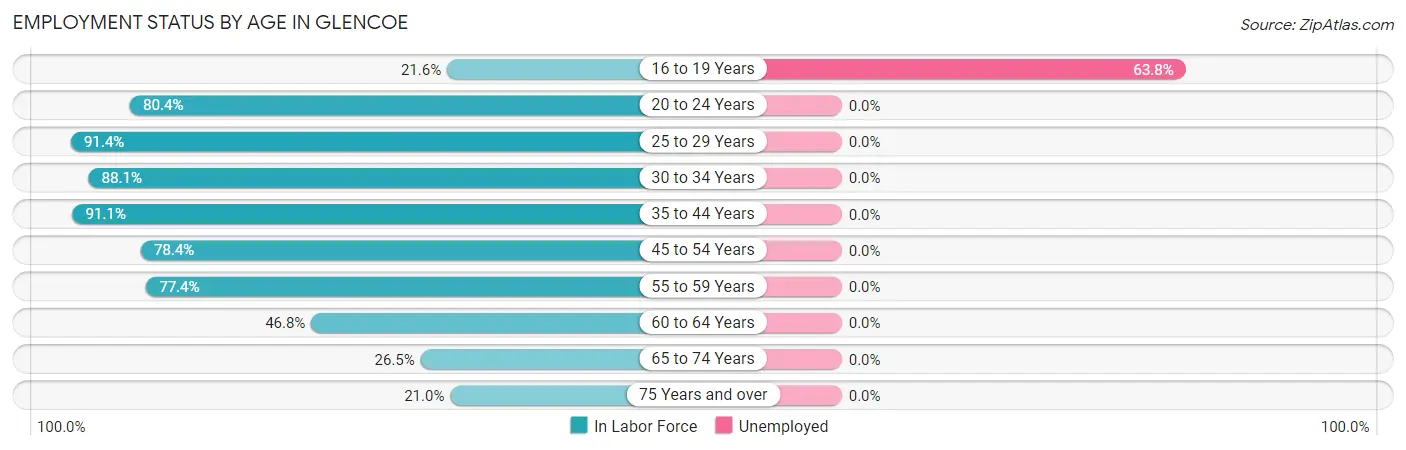
Employment Status by Age in Glencoe
According to the labor force statistics for Glencoe, out of the total population over 16 years of age (4,213), 59.9% or 2,524 individuals are in the labor force, with 1.5% or 38 of them unemployed. The age group with the highest labor force participation rate is 25 to 29 years, with 91.4% or 128 individuals in the labor force. Within the labor force, the 16 to 19 years age range has the highest percentage of unemployed individuals, with 63.8% or 37 of them being unemployed.
| Age Bracket | In Labor Force | Unemployed |
| 16 to 19 Years | 58 (21.6%) | 37 (63.8%) |
| 20 to 24 Years | 180 (80.4%) | 0 (0.0%) |
| 25 to 29 Years | 128 (91.4%) | 0 (0.0%) |
| 30 to 34 Years | 319 (88.1%) | 0 (0.0%) |
| 35 to 44 Years | 697 (91.1%) | 0 (0.0%) |
| 45 to 54 Years | 338 (78.4%) | 0 (0.0%) |
| 55 to 59 Years | 298 (77.4%) | 0 (0.0%) |
| 60 to 64 Years | 227 (46.8%) | 0 (0.0%) |
| 65 to 74 Years | 174 (26.5%) | 0 (0.0%) |
| 75 Years and over | 104 (21.0%) | 0 (0.0%) |
| Total | 2,524 (59.9%) | 38 (1.5%) |
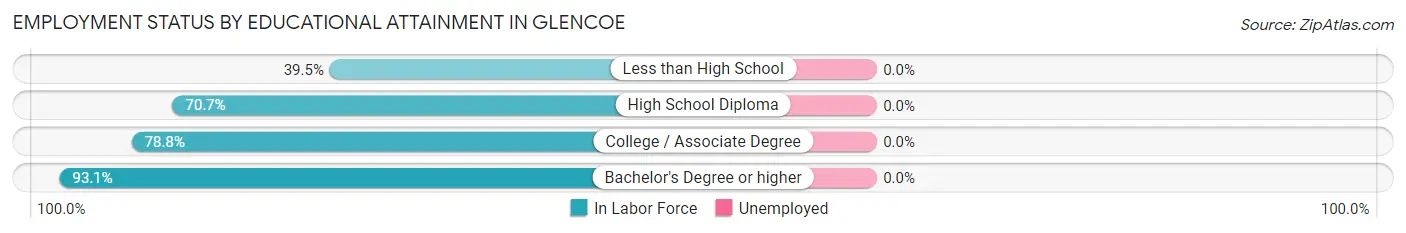
Employment Status by Educational Attainment in Glencoe
| Educational Attainment | In Labor Force | Unemployed |
| Less than High School | 34 (39.5%) | 0 (0.0%) |
| High School Diploma | 581 (70.7%) | 0 (0.0%) |
| College / Associate Degree | 843 (78.8%) | 0 (0.0%) |
| Bachelor's Degree or higher | 549 (93.1%) | 0 (0.0%) |
| Total | 2,008 (78.2%) | 0 (0.0%) |
Employment Occupations by Sex in Glencoe
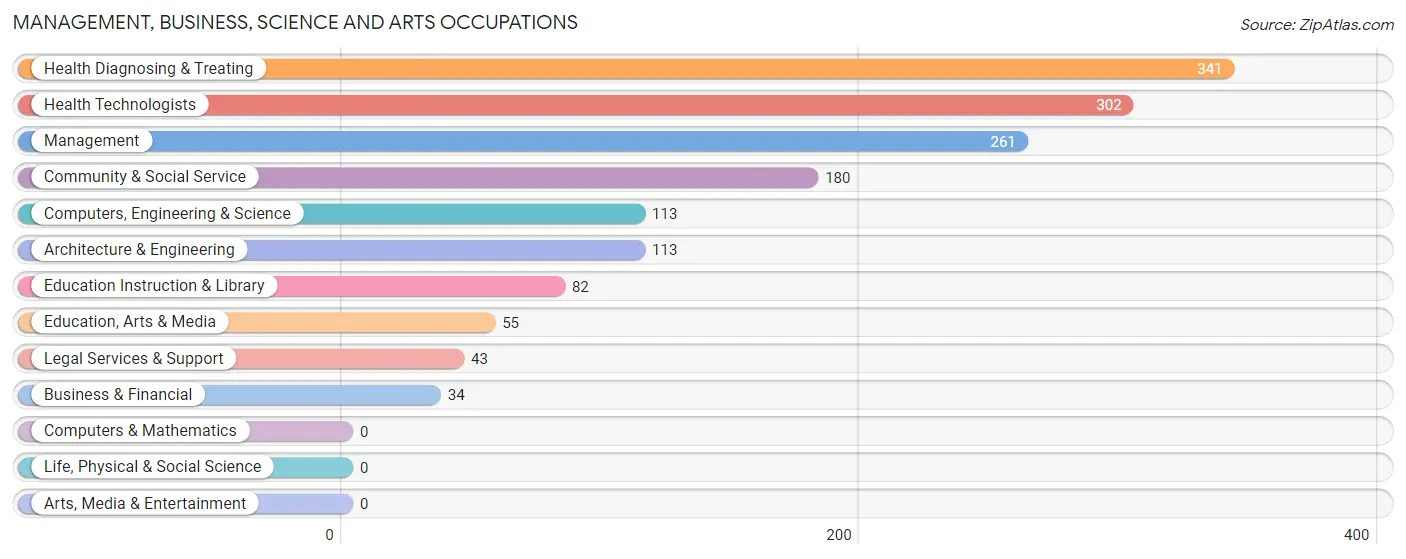
Management, Business, Science and Arts Occupations
The most common Management, Business, Science and Arts occupations in Glencoe are Health Diagnosing & Treating (341 | 13.7%), Health Technologists (302 | 12.1%), Management (261 | 10.5%), Community & Social Service (180 | 7.2%), and Computers, Engineering & Science (113 | 4.5%).
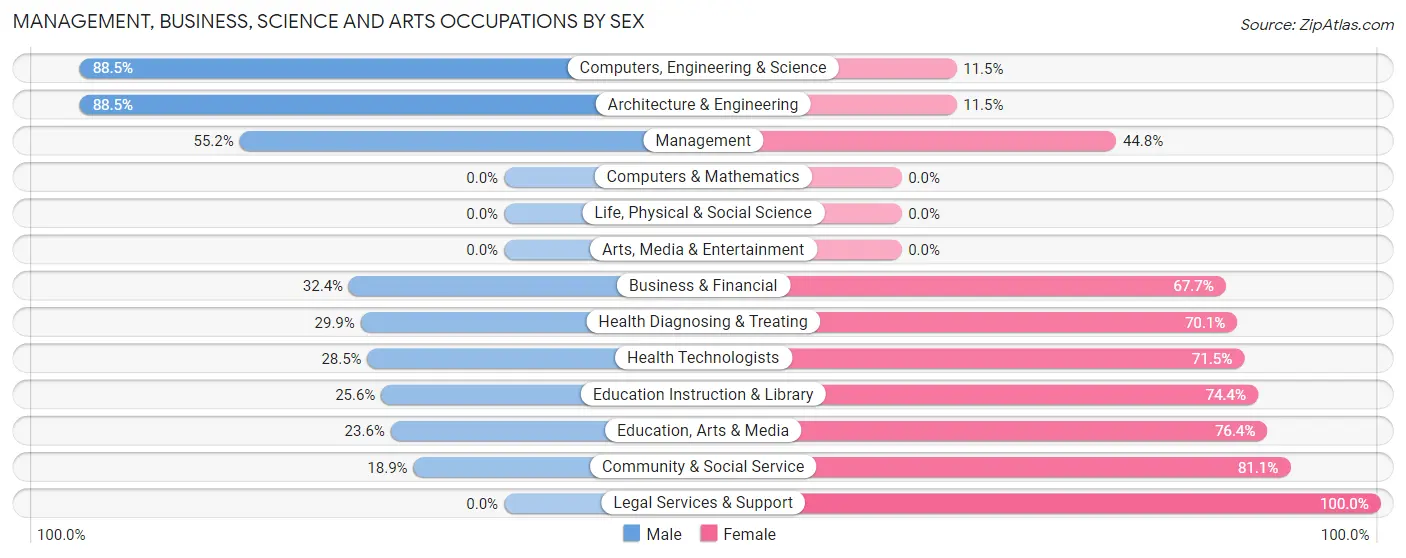
Management, Business, Science and Arts Occupations by Sex
Within the Management, Business, Science and Arts occupations in Glencoe, the most male-oriented occupations are Computers, Engineering & Science (88.5%), Architecture & Engineering (88.5%), and Management (55.2%), while the most female-oriented occupations are Legal Services & Support (100.0%), Community & Social Service (81.1%), and Education, Arts & Media (76.4%).
| Occupation | Male | Female |
| Management | 144 (55.2%) | 117 (44.8%) |
| Business & Financial | 11 (32.4%) | 23 (67.6%) |
| Computers, Engineering & Science | 100 (88.5%) | 13 (11.5%) |
| Computers & Mathematics | 0 (0.0%) | 0 (0.0%) |
| Architecture & Engineering | 100 (88.5%) | 13 (11.5%) |
| Life, Physical & Social Science | 0 (0.0%) | 0 (0.0%) |
| Community & Social Service | 34 (18.9%) | 146 (81.1%) |
| Education, Arts & Media | 13 (23.6%) | 42 (76.4%) |
| Legal Services & Support | 0 (0.0%) | 43 (100.0%) |
| Education Instruction & Library | 21 (25.6%) | 61 (74.4%) |
| Arts, Media & Entertainment | 0 (0.0%) | 0 (0.0%) |
| Health Diagnosing & Treating | 102 (29.9%) | 239 (70.1%) |
| Health Technologists | 86 (28.5%) | 216 (71.5%) |
| Total (Category) | 391 (42.1%) | 538 (57.9%) |
| Total (Overall) | 1,262 (50.8%) | 1,224 (49.2%) |
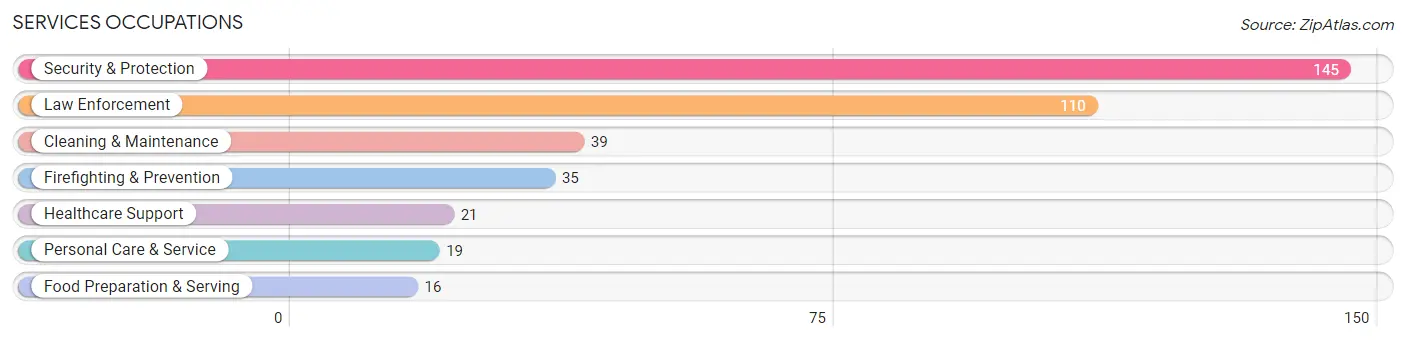
Services Occupations
The most common Services occupations in Glencoe are Security & Protection (145 | 5.8%), Law Enforcement (110 | 4.4%), Cleaning & Maintenance (39 | 1.6%), Firefighting & Prevention (35 | 1.4%), and Healthcare Support (21 | 0.8%).
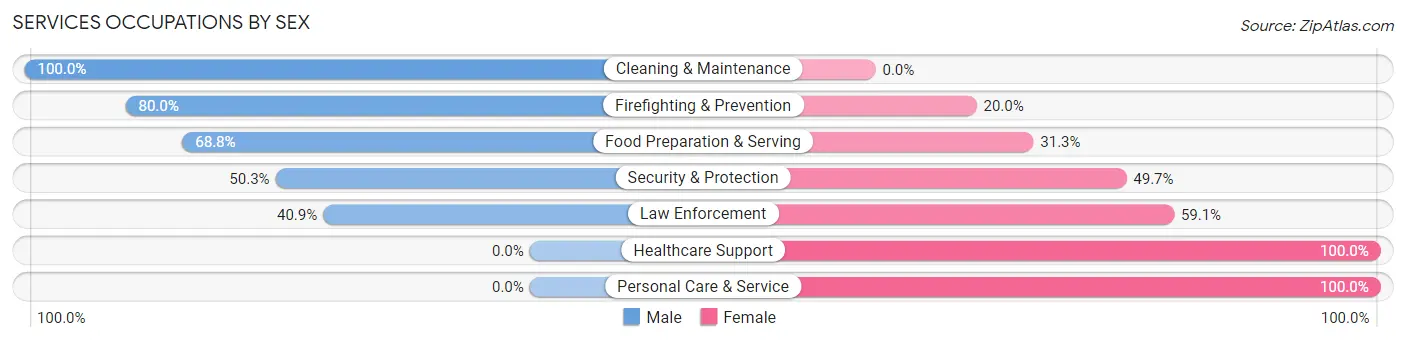
Services Occupations by Sex
Within the Services occupations in Glencoe, the most male-oriented occupations are Cleaning & Maintenance (100.0%), Firefighting & Prevention (80.0%), and Food Preparation & Serving (68.8%), while the most female-oriented occupations are Healthcare Support (100.0%), Personal Care & Service (100.0%), and Law Enforcement (59.1%).
| Occupation | Male | Female |
| Healthcare Support | 0 (0.0%) | 21 (100.0%) |
| Security & Protection | 73 (50.3%) | 72 (49.7%) |
| Firefighting & Prevention | 28 (80.0%) | 7 (20.0%) |
| Law Enforcement | 45 (40.9%) | 65 (59.1%) |
| Food Preparation & Serving | 11 (68.8%) | 5 (31.2%) |
| Cleaning & Maintenance | 39 (100.0%) | 0 (0.0%) |
| Personal Care & Service | 0 (0.0%) | 19 (100.0%) |
| Total (Category) | 123 (51.2%) | 117 (48.7%) |
| Total (Overall) | 1,262 (50.8%) | 1,224 (49.2%) |
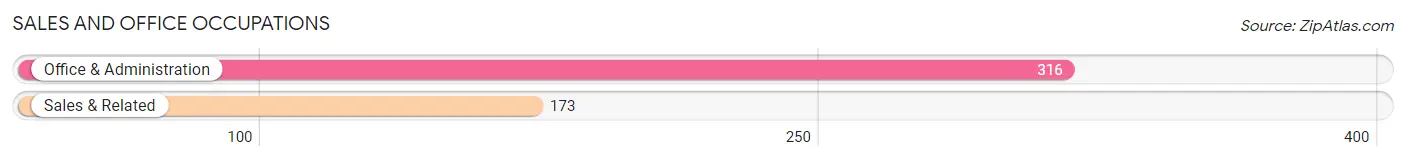
Sales and Office Occupations
The most common Sales and Office occupations in Glencoe are Office & Administration (316 | 12.7%), and Sales & Related (173 | 7.0%).
Sales and Office Occupations by Sex
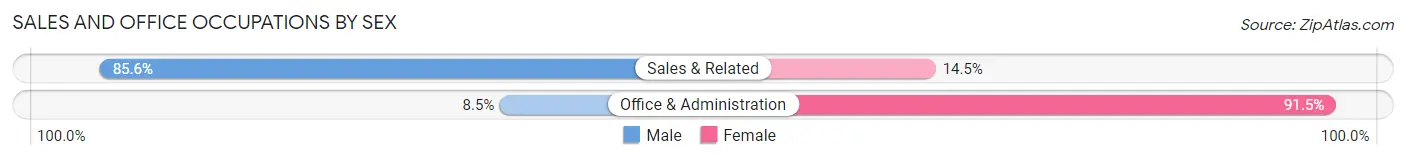
| Occupation | Male | Female |
| Sales & Related | 148 (85.6%) | 25 (14.4%) |
| Office & Administration | 27 (8.5%) | 289 (91.5%) |
| Total (Category) | 175 (35.8%) | 314 (64.2%) |
| Total (Overall) | 1,262 (50.8%) | 1,224 (49.2%) |
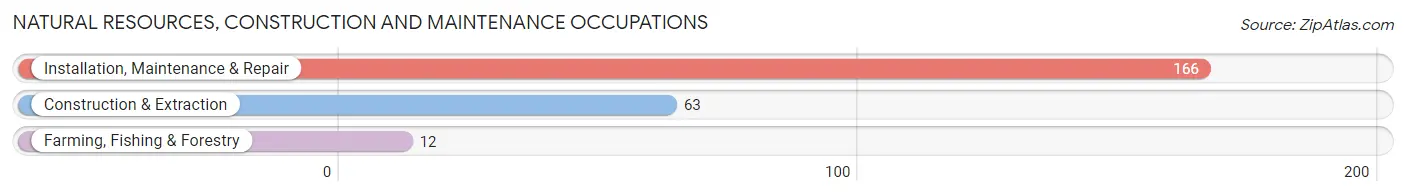
Natural Resources, Construction and Maintenance Occupations
The most common Natural Resources, Construction and Maintenance occupations in Glencoe are Installation, Maintenance & Repair (166 | 6.7%), Construction & Extraction (63 | 2.5%), and Farming, Fishing & Forestry (12 | 0.5%).
Natural Resources, Construction and Maintenance Occupations by Sex
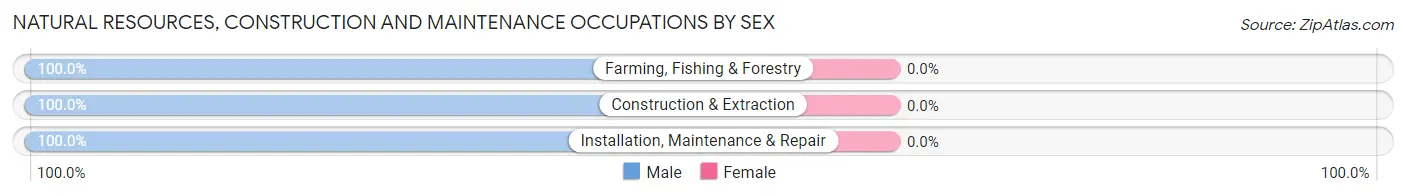
| Occupation | Male | Female |
| Farming, Fishing & Forestry | 12 (100.0%) | 0 (0.0%) |
| Construction & Extraction | 63 (100.0%) | 0 (0.0%) |
| Installation, Maintenance & Repair | 166 (100.0%) | 0 (0.0%) |
| Total (Category) | 241 (100.0%) | 0 (0.0%) |
| Total (Overall) | 1,262 (50.8%) | 1,224 (49.2%) |
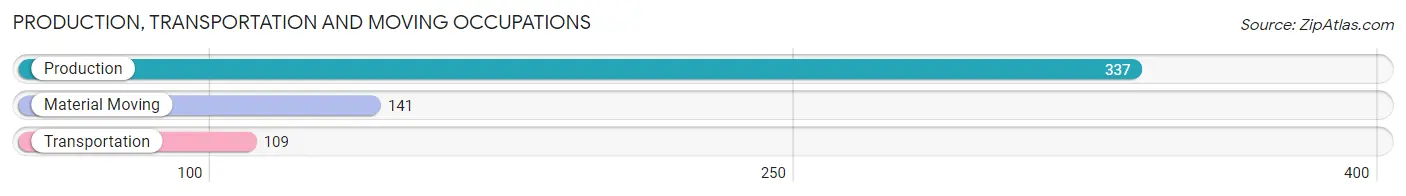
Production, Transportation and Moving Occupations
The most common Production, Transportation and Moving occupations in Glencoe are Production (337 | 13.6%), Material Moving (141 | 5.7%), and Transportation (109 | 4.4%).
Production, Transportation and Moving Occupations by Sex
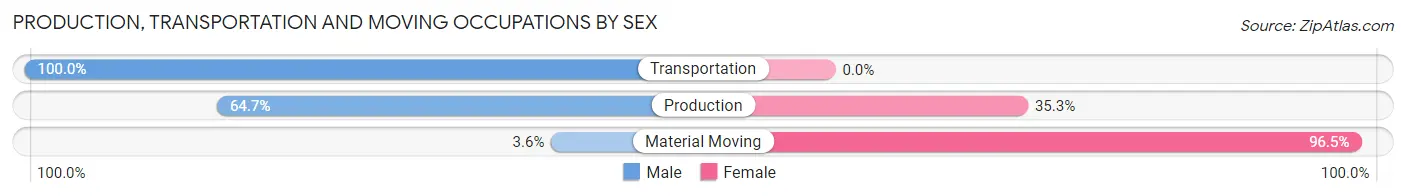
| Occupation | Male | Female |
| Production | 218 (64.7%) | 119 (35.3%) |
| Transportation | 109 (100.0%) | 0 (0.0%) |
| Material Moving | 5 (3.5%) | 136 (96.5%) |
| Total (Category) | 332 (56.6%) | 255 (43.4%) |
| Total (Overall) | 1,262 (50.8%) | 1,224 (49.2%) |
Employment Industries by Sex in Glencoe
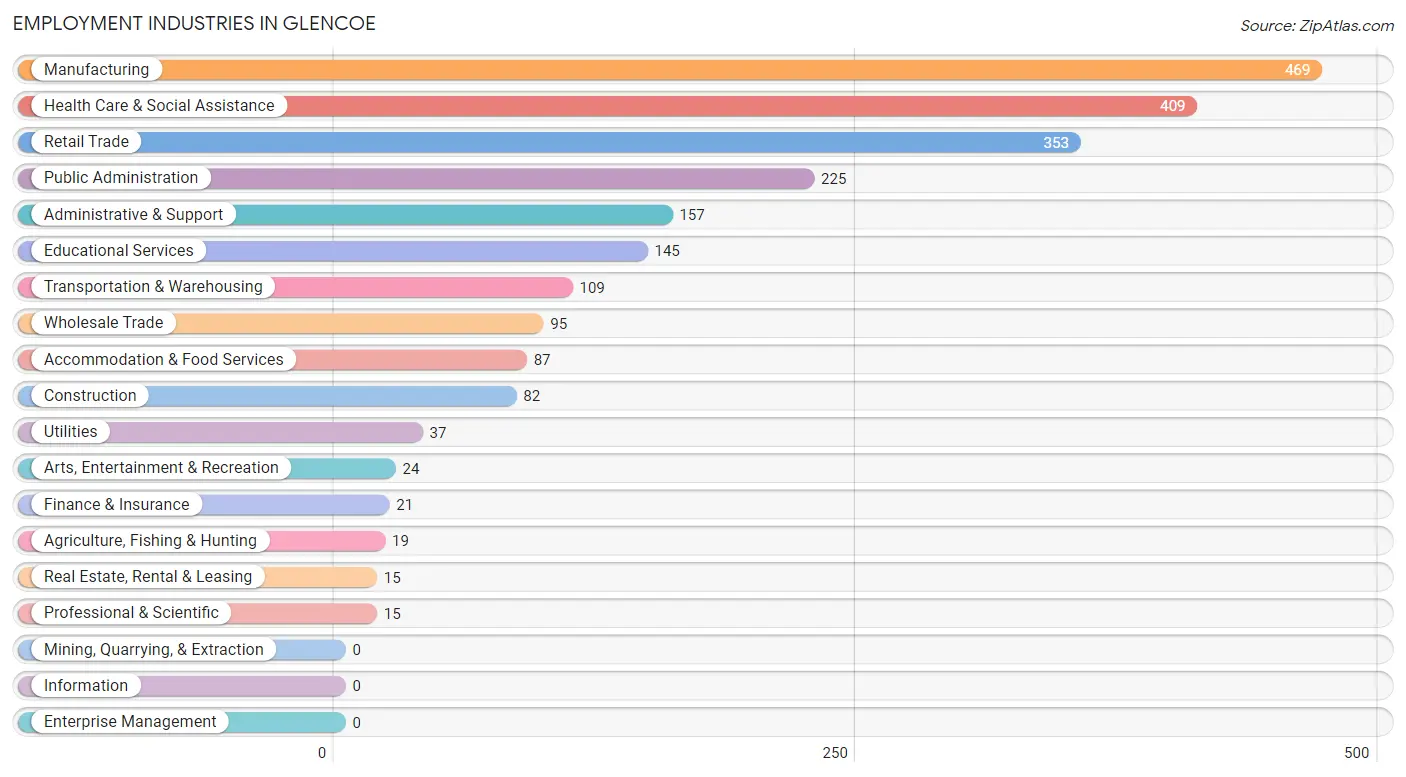
Employment Industries in Glencoe
The major employment industries in Glencoe include Manufacturing (469 | 18.9%), Health Care & Social Assistance (409 | 16.5%), Retail Trade (353 | 14.2%), Public Administration (225 | 9.0%), and Administrative & Support (157 | 6.3%).
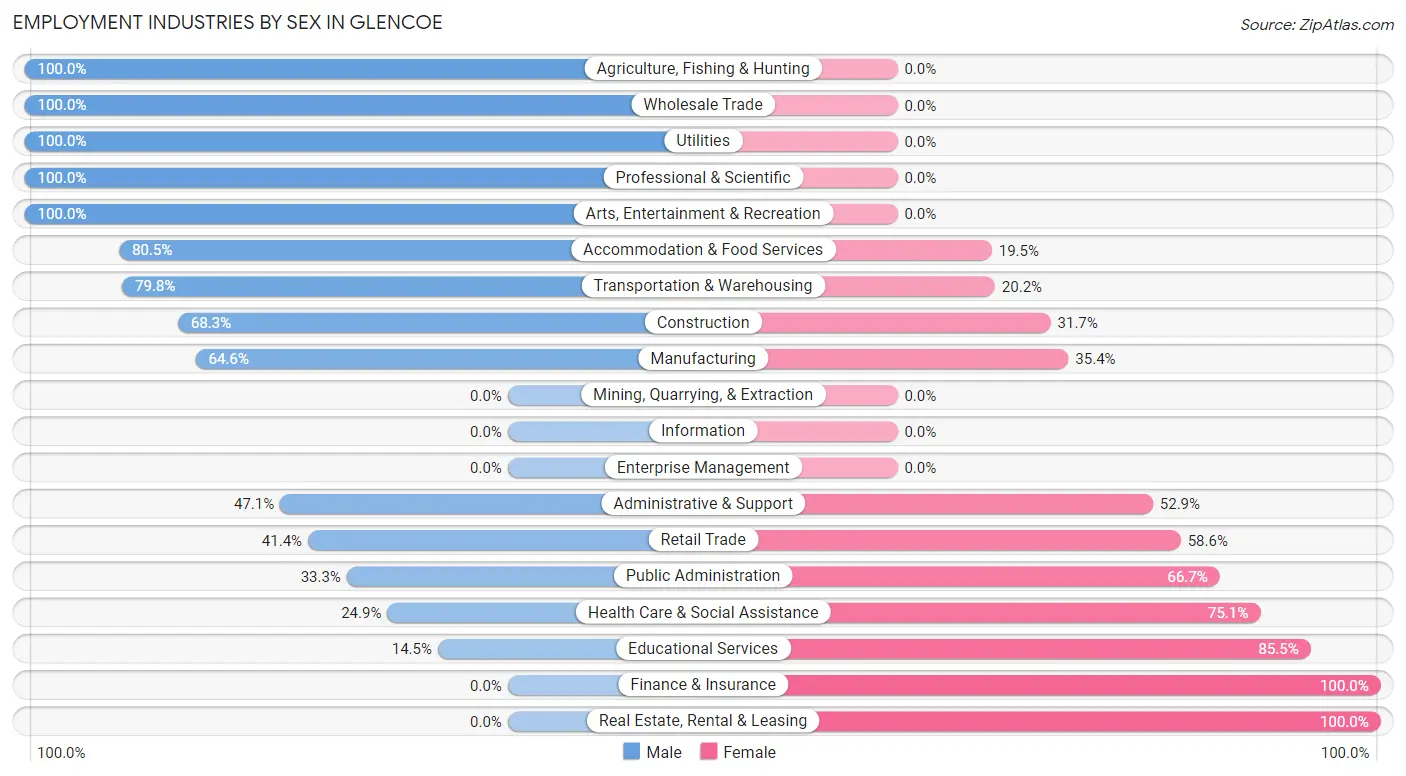
Employment Industries by Sex in Glencoe
The Glencoe industries that see more men than women are Agriculture, Fishing & Hunting (100.0%), Wholesale Trade (100.0%), and Utilities (100.0%), whereas the industries that tend to have a higher number of women are Finance & Insurance (100.0%), Real Estate, Rental & Leasing (100.0%), and Educational Services (85.5%).
| Industry | Male | Female |
| Agriculture, Fishing & Hunting | 19 (100.0%) | 0 (0.0%) |
| Mining, Quarrying, & Extraction | 0 (0.0%) | 0 (0.0%) |
| Construction | 56 (68.3%) | 26 (31.7%) |
| Manufacturing | 303 (64.6%) | 166 (35.4%) |
| Wholesale Trade | 95 (100.0%) | 0 (0.0%) |
| Retail Trade | 146 (41.4%) | 207 (58.6%) |
| Transportation & Warehousing | 87 (79.8%) | 22 (20.2%) |
| Utilities | 37 (100.0%) | 0 (0.0%) |
| Information | 0 (0.0%) | 0 (0.0%) |
| Finance & Insurance | 0 (0.0%) | 21 (100.0%) |
| Real Estate, Rental & Leasing | 0 (0.0%) | 15 (100.0%) |
| Professional & Scientific | 15 (100.0%) | 0 (0.0%) |
| Enterprise Management | 0 (0.0%) | 0 (0.0%) |
| Administrative & Support | 74 (47.1%) | 83 (52.9%) |
| Educational Services | 21 (14.5%) | 124 (85.5%) |
| Health Care & Social Assistance | 102 (24.9%) | 307 (75.1%) |
| Arts, Entertainment & Recreation | 24 (100.0%) | 0 (0.0%) |
| Accommodation & Food Services | 70 (80.5%) | 17 (19.5%) |
| Public Administration | 75 (33.3%) | 150 (66.7%) |
| Total | 1,262 (50.8%) | 1,224 (49.2%) |
Education in Glencoe
School Enrollment in Glencoe
The most common levels of schooling among the 1,257 students in Glencoe are middle school (457 | 36.4%), high school (333 | 26.5%), and elementary school (220 | 17.5%).
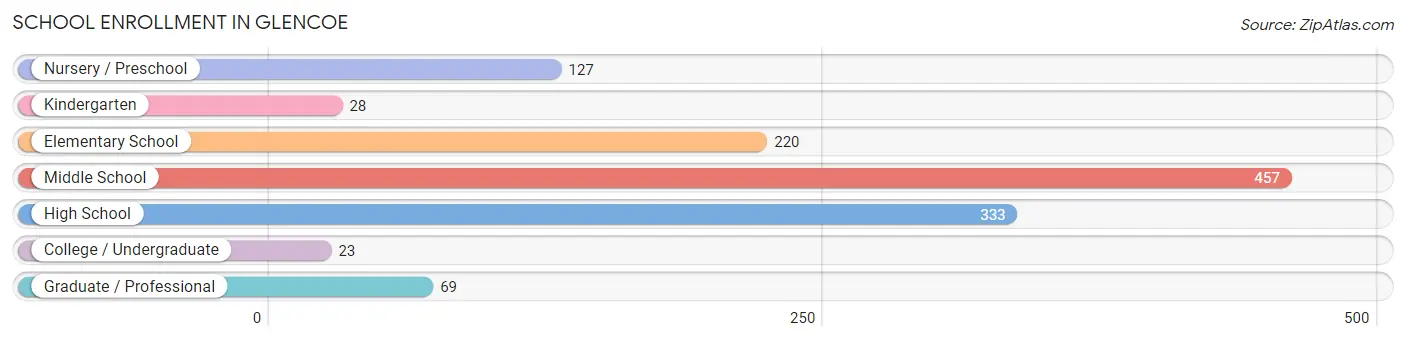
| School Level | # Students | % Students |
| Nursery / Preschool | 127 | 10.1% |
| Kindergarten | 28 | 2.2% |
| Elementary School | 220 | 17.5% |
| Middle School | 457 | 36.4% |
| High School | 333 | 26.5% |
| College / Undergraduate | 23 | 1.8% |
| Graduate / Professional | 69 | 5.5% |
| Total | 1,257 | 100.0% |
School Enrollment by Age by Funding Source in Glencoe
Out of a total of 1,257 students who are enrolled in schools in Glencoe, 212 (16.9%) attend a private institution, while the remaining 1,045 (83.1%) are enrolled in public schools. The age group of 25 to 34 year olds has the highest likelihood of being enrolled in private schools, with 30 (32.6% in the age bracket) enrolled. Conversely, the age group of 18 to 19 year olds has the lowest likelihood of being enrolled in a private school, with 21 (100.0% in the age bracket) attending a public institution.
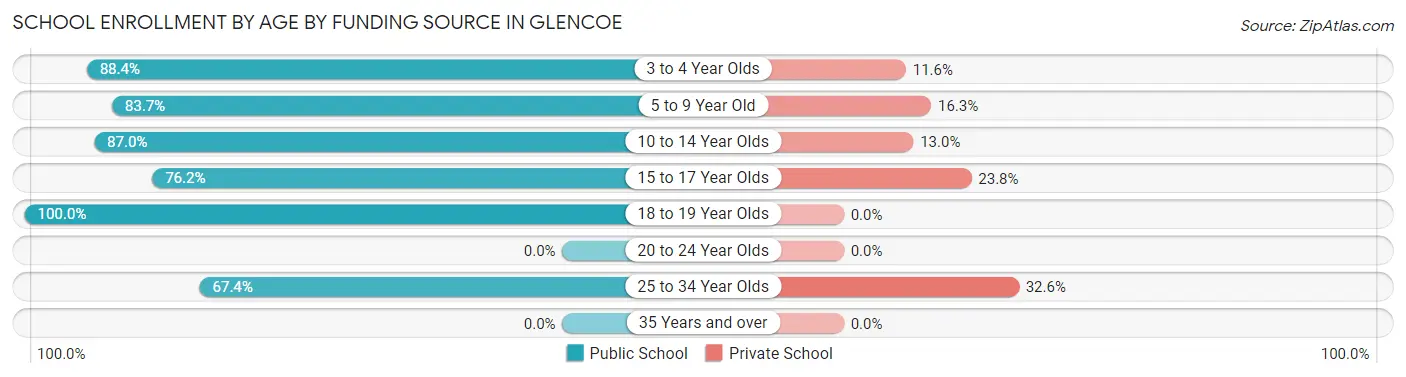
| Age Bracket | Public School | Private School |
| 3 to 4 Year Olds | 107 (88.4%) | 14 (11.6%) |
| 5 to 9 Year Old | 139 (83.7%) | 27 (16.3%) |
| 10 to 14 Year Olds | 497 (87.0%) | 74 (13.0%) |
| 15 to 17 Year Olds | 218 (76.2%) | 68 (23.8%) |
| 18 to 19 Year Olds | 21 (100.0%) | 0 (0.0%) |
| 20 to 24 Year Olds | 0 (0.0%) | 0 (0.0%) |
| 25 to 34 Year Olds | 62 (67.4%) | 30 (32.6%) |
| 35 Years and over | 0 (0.0%) | 0 (0.0%) |
| Total | 1,045 (83.1%) | 212 (16.9%) |
Educational Attainment by Field of Study in Glencoe
Science & technology (260 | 28.9%), education (185 | 20.6%), engineering (100 | 11.1%), business (94 | 10.5%), and social sciences (64 | 7.1%) are the most common fields of study among 899 individuals in Glencoe who have obtained a bachelor's degree or higher.
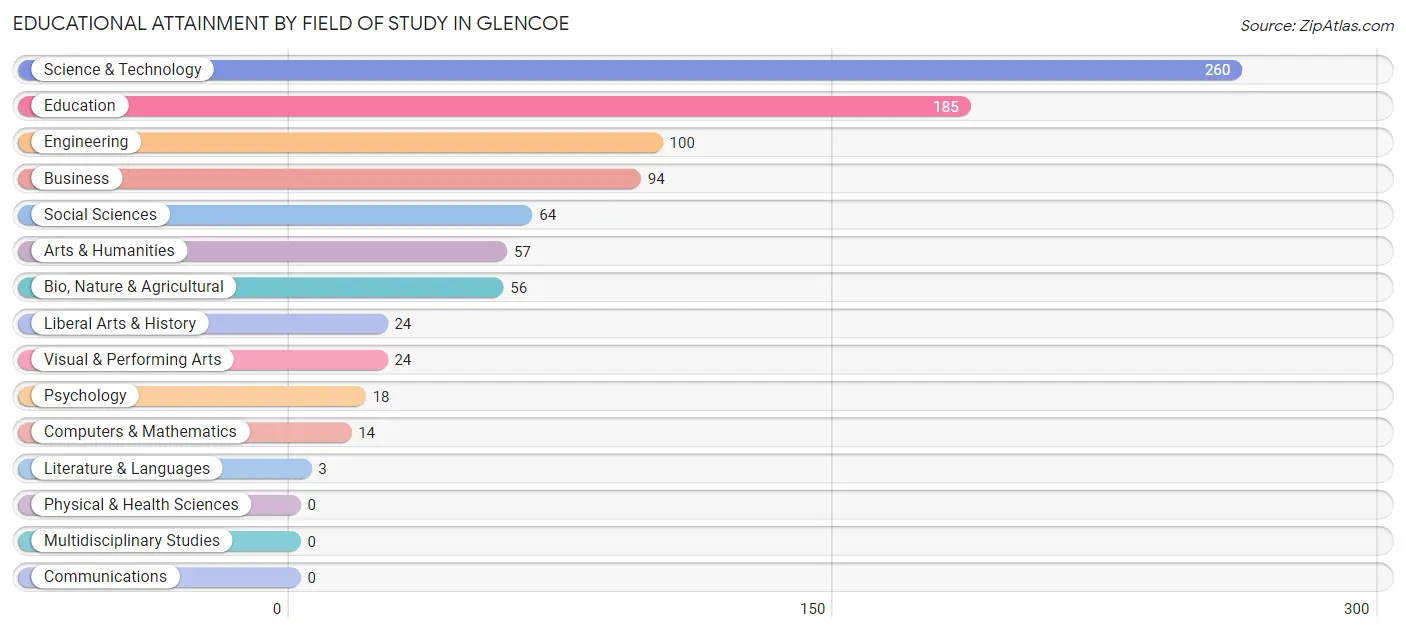
| Field of Study | # Graduates | % Graduates |
| Computers & Mathematics | 14 | 1.6% |
| Bio, Nature & Agricultural | 56 | 6.2% |
| Physical & Health Sciences | 0 | 0.0% |
| Psychology | 18 | 2.0% |
| Social Sciences | 64 | 7.1% |
| Engineering | 100 | 11.1% |
| Multidisciplinary Studies | 0 | 0.0% |
| Science & Technology | 260 | 28.9% |
| Business | 94 | 10.5% |
| Education | 185 | 20.6% |
| Literature & Languages | 3 | 0.3% |
| Liberal Arts & History | 24 | 2.7% |
| Visual & Performing Arts | 24 | 2.7% |
| Communications | 0 | 0.0% |
| Arts & Humanities | 57 | 6.3% |
| Total | 899 | 100.0% |
Transportation & Commute in Glencoe
Vehicle Availability by Sex in Glencoe
The most prevalent vehicle ownership categories in Glencoe are males with 2 vehicles (452, accounting for 36.6%) and females with 2 vehicles (685, making up 37.6%).
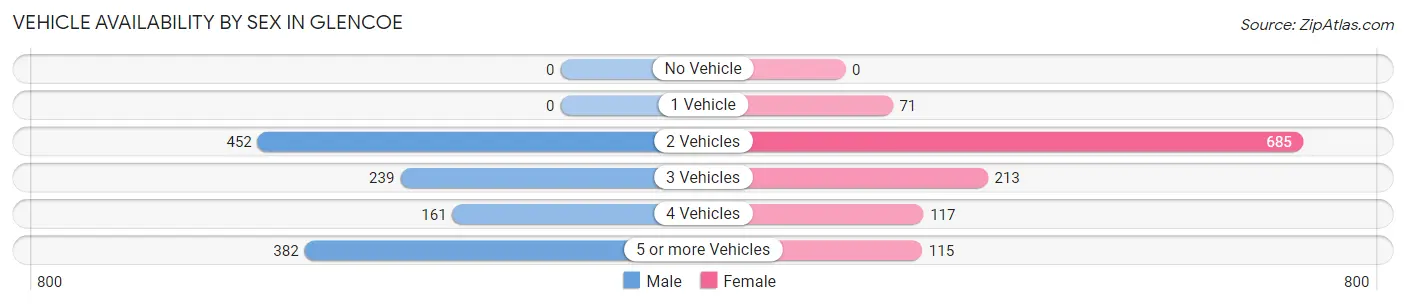
| Vehicles Available | Male | Female |
| No Vehicle | 0 (0.0%) | 0 (0.0%) |
| 1 Vehicle | 0 (0.0%) | 71 (5.9%) |
| 2 Vehicles | 452 (36.6%) | 685 (57.0%) |
| 3 Vehicles | 239 (19.4%) | 213 (17.7%) |
| 4 Vehicles | 161 (13.1%) | 117 (9.7%) |
| 5 or more Vehicles | 382 (31.0%) | 115 (9.6%) |
| Total | 1,234 (100.0%) | 1,201 (100.0%) |
Commute Time in Glencoe
The most frequently occuring commute durations in Glencoe are 15 to 19 minutes (602 commuters, 25.1%), 45 to 59 minutes (413 commuters, 17.2%), and 20 to 24 minutes (386 commuters, 16.1%).
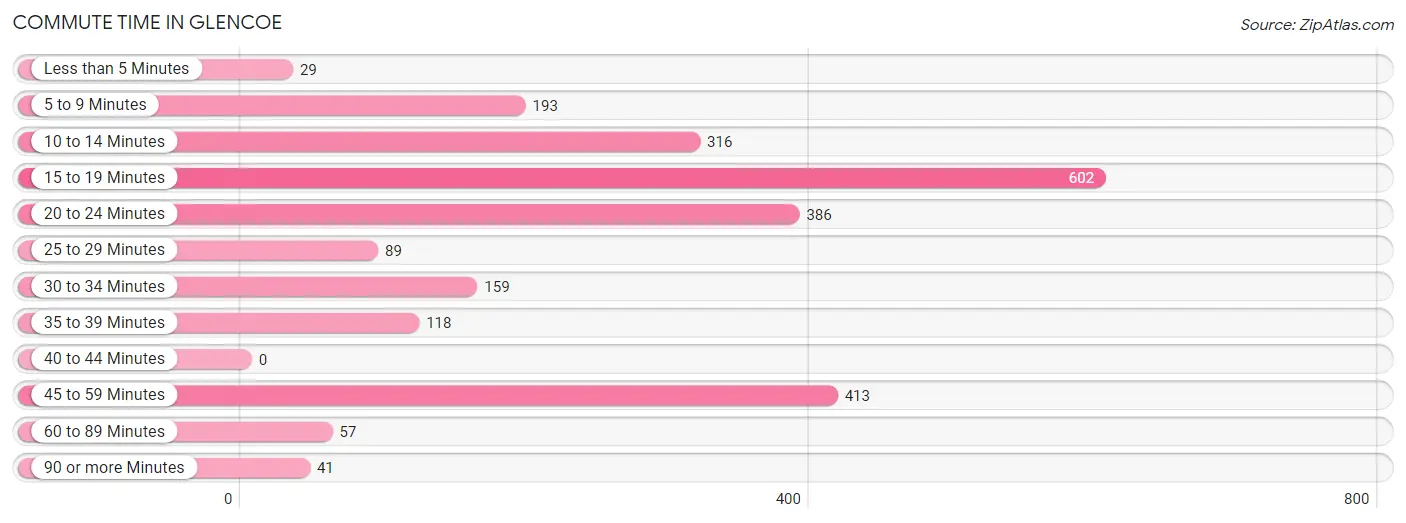
| Commute Time | # Commuters | % Commuters |
| Less than 5 Minutes | 29 | 1.2% |
| 5 to 9 Minutes | 193 | 8.0% |
| 10 to 14 Minutes | 316 | 13.2% |
| 15 to 19 Minutes | 602 | 25.1% |
| 20 to 24 Minutes | 386 | 16.1% |
| 25 to 29 Minutes | 89 | 3.7% |
| 30 to 34 Minutes | 159 | 6.6% |
| 35 to 39 Minutes | 118 | 4.9% |
| 40 to 44 Minutes | 0 | 0.0% |
| 45 to 59 Minutes | 413 | 17.2% |
| 60 to 89 Minutes | 57 | 2.4% |
| 90 or more Minutes | 41 | 1.7% |
Commute Time by Sex in Glencoe
The most common commute times in Glencoe are 45 to 59 minutes (306 commuters, 25.1%) for males and 20 to 24 minutes (322 commuters, 27.2%) for females.
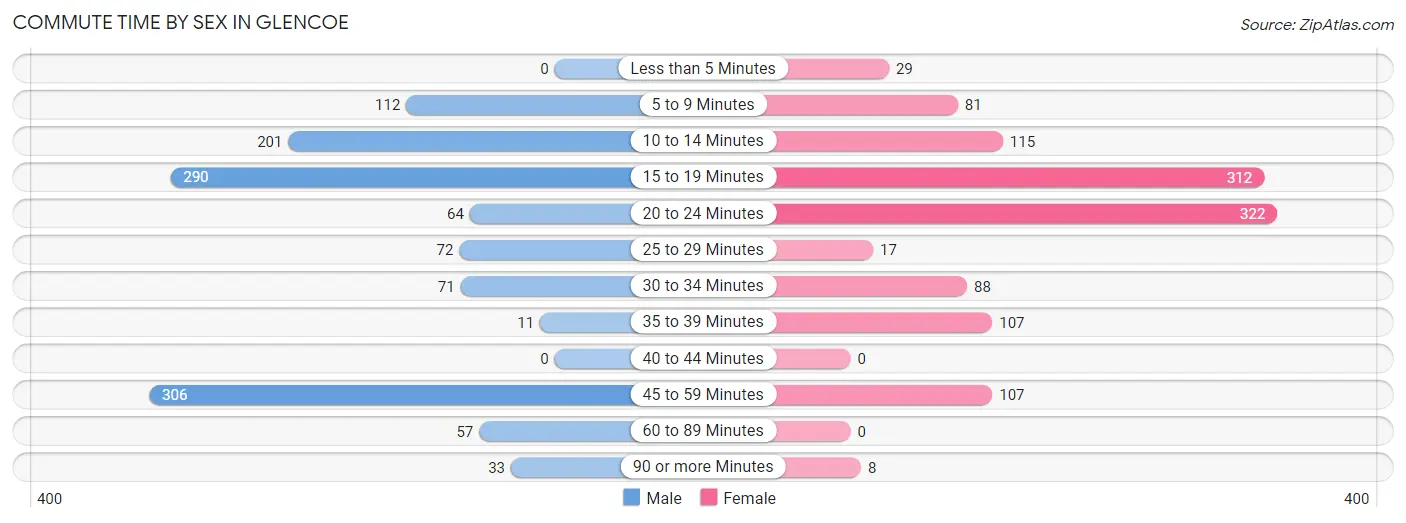
| Commute Time | Male | Female |
| Less than 5 Minutes | 0 (0.0%) | 29 (2.5%) |
| 5 to 9 Minutes | 112 (9.2%) | 81 (6.8%) |
| 10 to 14 Minutes | 201 (16.5%) | 115 (9.7%) |
| 15 to 19 Minutes | 290 (23.8%) | 312 (26.3%) |
| 20 to 24 Minutes | 64 (5.3%) | 322 (27.2%) |
| 25 to 29 Minutes | 72 (5.9%) | 17 (1.4%) |
| 30 to 34 Minutes | 71 (5.8%) | 88 (7.4%) |
| 35 to 39 Minutes | 11 (0.9%) | 107 (9.0%) |
| 40 to 44 Minutes | 0 (0.0%) | 0 (0.0%) |
| 45 to 59 Minutes | 306 (25.1%) | 107 (9.0%) |
| 60 to 89 Minutes | 57 (4.7%) | 0 (0.0%) |
| 90 or more Minutes | 33 (2.7%) | 8 (0.7%) |
Time of Departure to Work by Sex in Glencoe
The most frequent times of departure to work in Glencoe are 5:00 AM to 5:29 AM (197, 16.2%) for males and 7:00 AM to 7:29 AM (345, 29.1%) for females.
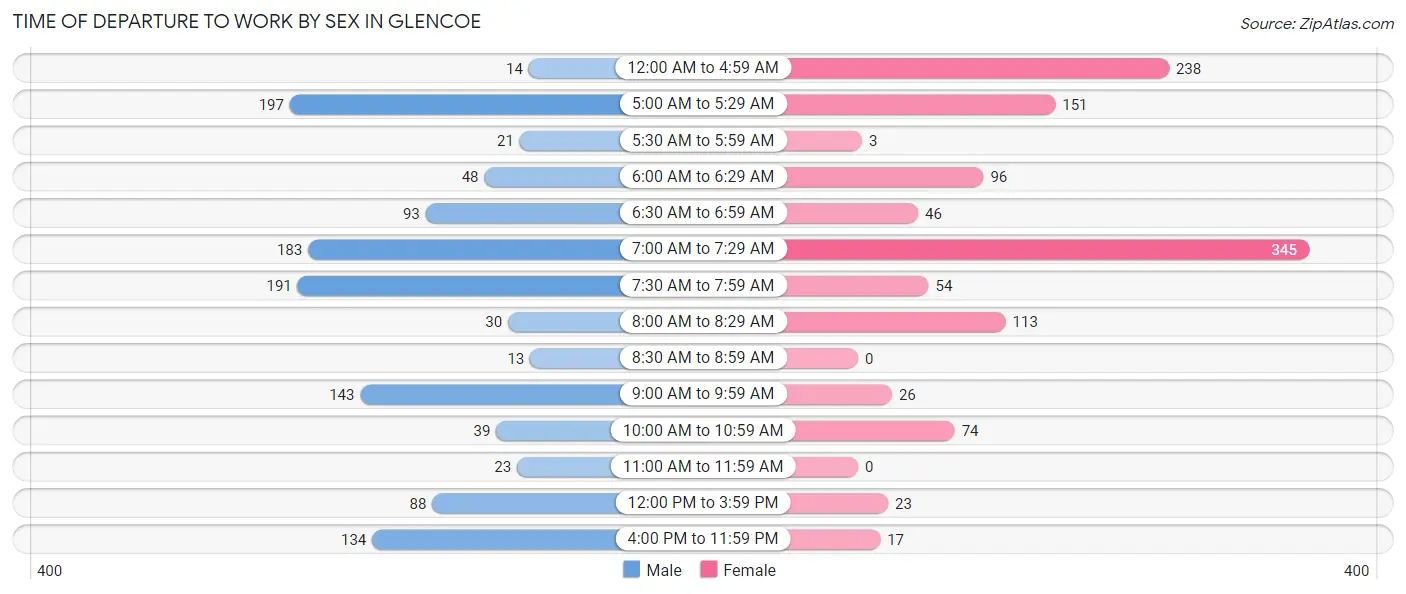
| Time of Departure | Male | Female |
| 12:00 AM to 4:59 AM | 14 (1.1%) | 238 (20.1%) |
| 5:00 AM to 5:29 AM | 197 (16.2%) | 151 (12.7%) |
| 5:30 AM to 5:59 AM | 21 (1.7%) | 3 (0.3%) |
| 6:00 AM to 6:29 AM | 48 (3.9%) | 96 (8.1%) |
| 6:30 AM to 6:59 AM | 93 (7.6%) | 46 (3.9%) |
| 7:00 AM to 7:29 AM | 183 (15.0%) | 345 (29.1%) |
| 7:30 AM to 7:59 AM | 191 (15.7%) | 54 (4.5%) |
| 8:00 AM to 8:29 AM | 30 (2.5%) | 113 (9.5%) |
| 8:30 AM to 8:59 AM | 13 (1.1%) | 0 (0.0%) |
| 9:00 AM to 9:59 AM | 143 (11.7%) | 26 (2.2%) |
| 10:00 AM to 10:59 AM | 39 (3.2%) | 74 (6.2%) |
| 11:00 AM to 11:59 AM | 23 (1.9%) | 0 (0.0%) |
| 12:00 PM to 3:59 PM | 88 (7.2%) | 23 (1.9%) |
| 4:00 PM to 11:59 PM | 134 (11.0%) | 17 (1.4%) |
| Total | 1,217 (100.0%) | 1,186 (100.0%) |
Housing Occupancy in Glencoe
Occupancy by Ownership in Glencoe
Of the total 1,950 dwellings in Glencoe, owner-occupied units account for 1,675 (85.9%), while renter-occupied units make up 275 (14.1%).
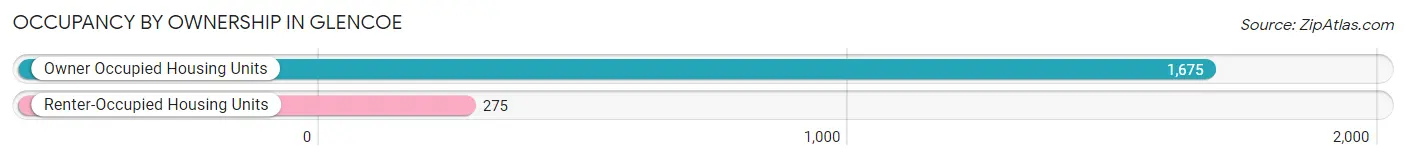
| Occupancy | # Housing Units | % Housing Units |
| Owner Occupied Housing Units | 1,675 | 85.9% |
| Renter-Occupied Housing Units | 275 | 14.1% |
| Total Occupied Housing Units | 1,950 | 100.0% |
Occupancy by Household Size in Glencoe
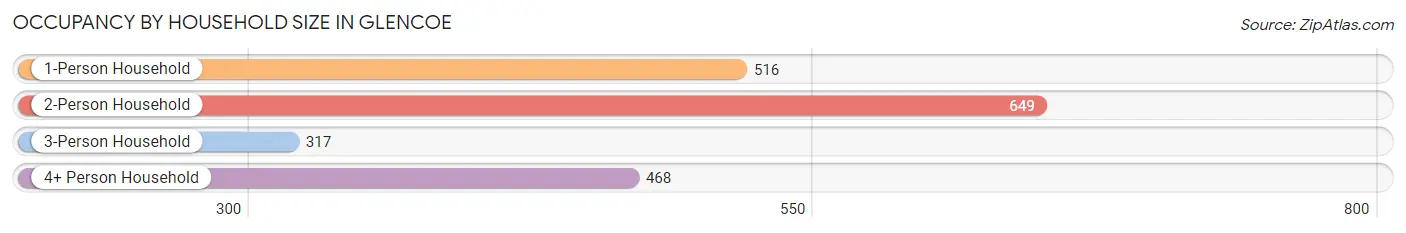
| Household Size | # Housing Units | % Housing Units |
| 1-Person Household | 516 | 26.5% |
| 2-Person Household | 649 | 33.3% |
| 3-Person Household | 317 | 16.3% |
| 4+ Person Household | 468 | 24.0% |
| Total Housing Units | 1,950 | 100.0% |
Occupancy by Ownership by Household Size in Glencoe
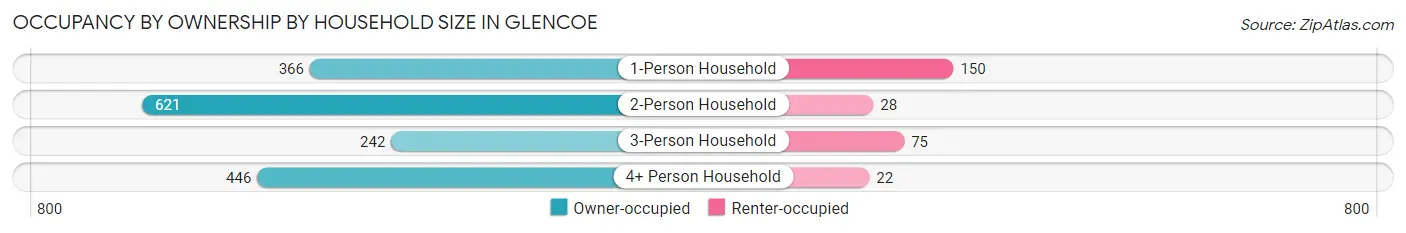
| Household Size | Owner-occupied | Renter-occupied |
| 1-Person Household | 366 (70.9%) | 150 (29.1%) |
| 2-Person Household | 621 (95.7%) | 28 (4.3%) |
| 3-Person Household | 242 (76.3%) | 75 (23.7%) |
| 4+ Person Household | 446 (95.3%) | 22 (4.7%) |
| Total Housing Units | 1,675 (85.9%) | 275 (14.1%) |
Occupancy by Educational Attainment in Glencoe
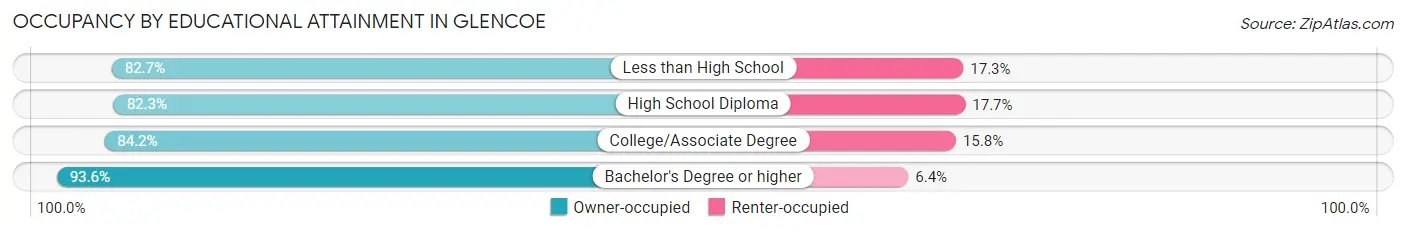
| Household Size | Owner-occupied | Renter-occupied |
| Less than High School | 110 (82.7%) | 23 (17.3%) |
| High School Diploma | 461 (82.3%) | 99 (17.7%) |
| College/Associate Degree | 649 (84.2%) | 122 (15.8%) |
| Bachelor's Degree or higher | 455 (93.6%) | 31 (6.4%) |
Occupancy by Age of Householder in Glencoe
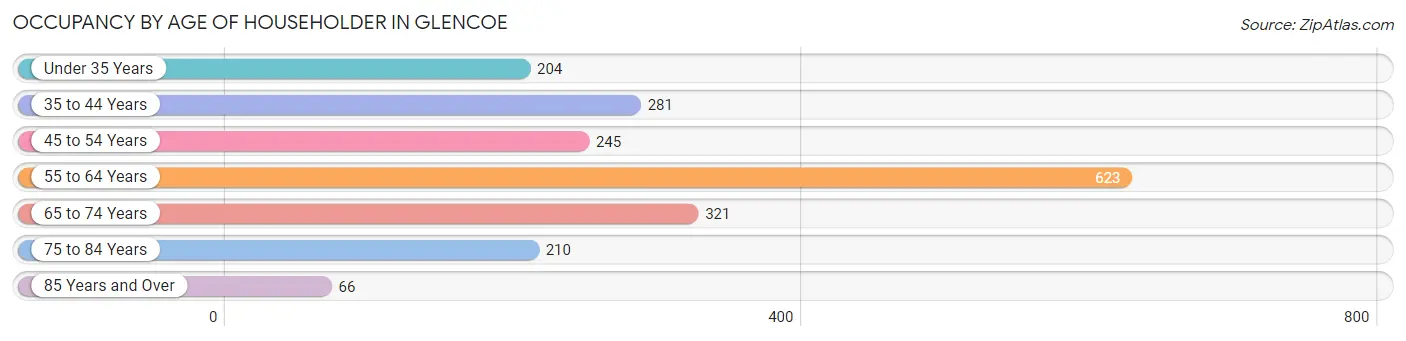
| Age Bracket | # Households | % Households |
| Under 35 Years | 204 | 10.5% |
| 35 to 44 Years | 281 | 14.4% |
| 45 to 54 Years | 245 | 12.6% |
| 55 to 64 Years | 623 | 32.0% |
| 65 to 74 Years | 321 | 16.5% |
| 75 to 84 Years | 210 | 10.8% |
| 85 Years and Over | 66 | 3.4% |
| Total | 1,950 | 100.0% |
Housing Finances in Glencoe
Median Income by Occupancy in Glencoe
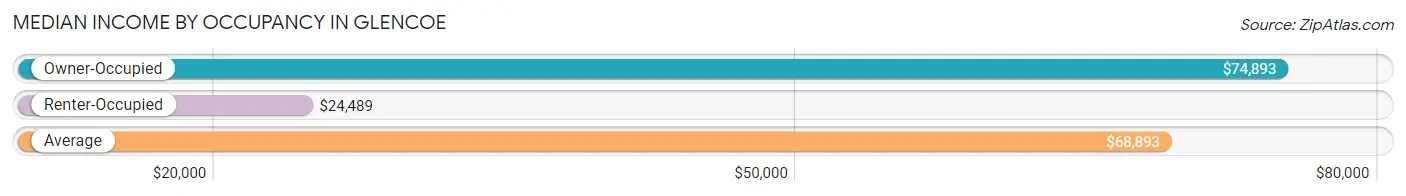
| Occupancy Type | # Households | Median Income |
| Owner-Occupied | 1,675 (85.9%) | $74,893 |
| Renter-Occupied | 275 (14.1%) | $24,489 |
| Average | 1,950 (100.0%) | $68,893 |
Occupancy by Householder Income Bracket in Glencoe
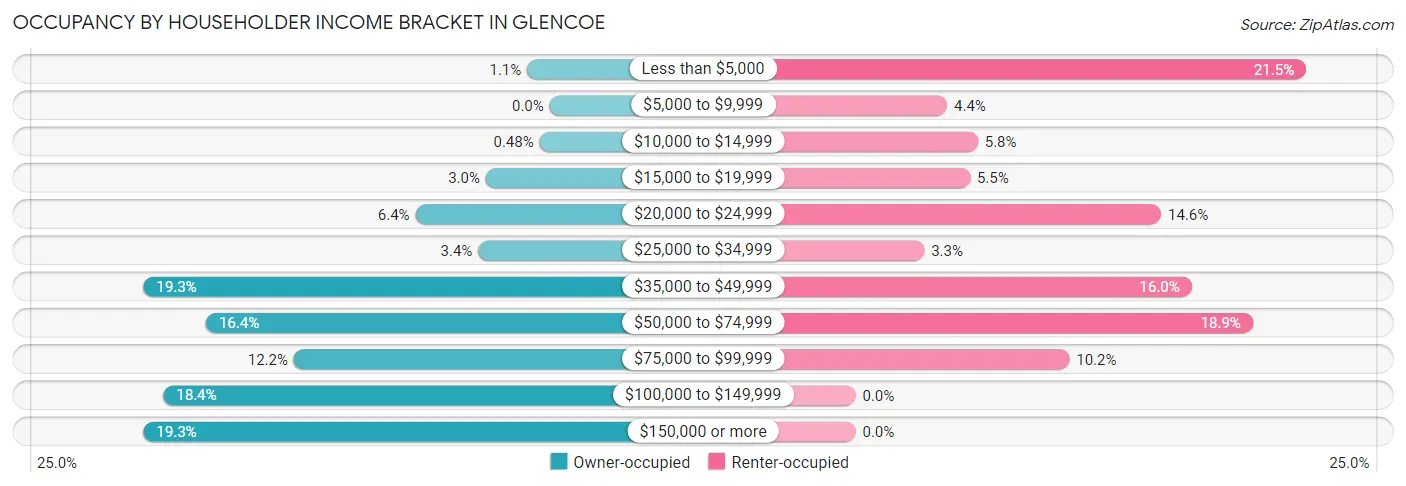
| Income Bracket | Owner-occupied | Renter-occupied |
| Less than $5,000 | 18 (1.1%) | 59 (21.4%) |
| $5,000 to $9,999 | 0 (0.0%) | 12 (4.4%) |
| $10,000 to $14,999 | 8 (0.5%) | 16 (5.8%) |
| $15,000 to $19,999 | 51 (3.0%) | 15 (5.4%) |
| $20,000 to $24,999 | 107 (6.4%) | 40 (14.5%) |
| $25,000 to $34,999 | 57 (3.4%) | 9 (3.3%) |
| $35,000 to $49,999 | 324 (19.3%) | 44 (16.0%) |
| $50,000 to $74,999 | 274 (16.4%) | 52 (18.9%) |
| $75,000 to $99,999 | 204 (12.2%) | 28 (10.2%) |
| $100,000 to $149,999 | 308 (18.4%) | 0 (0.0%) |
| $150,000 or more | 324 (19.3%) | 0 (0.0%) |
| Total | 1,675 (100.0%) | 275 (100.0%) |
Monthly Housing Cost Tiers in Glencoe
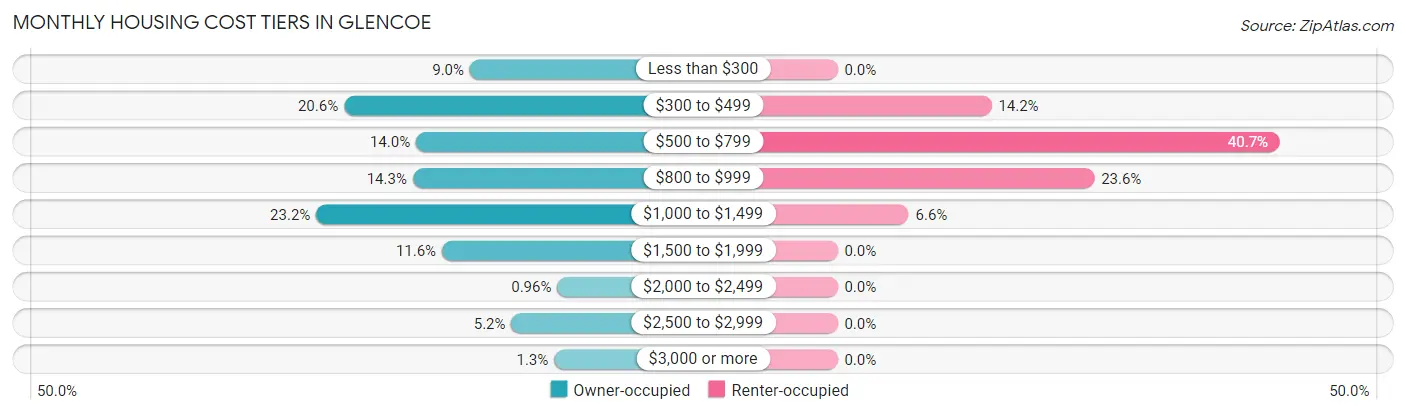
| Monthly Cost | Owner-occupied | Renter-occupied |
| Less than $300 | 151 (9.0%) | 0 (0.0%) |
| $300 to $499 | 345 (20.6%) | 39 (14.2%) |
| $500 to $799 | 234 (14.0%) | 112 (40.7%) |
| $800 to $999 | 239 (14.3%) | 65 (23.6%) |
| $1,000 to $1,499 | 388 (23.2%) | 18 (6.6%) |
| $1,500 to $1,999 | 194 (11.6%) | 0 (0.0%) |
| $2,000 to $2,499 | 16 (1.0%) | 0 (0.0%) |
| $2,500 to $2,999 | 87 (5.2%) | 0 (0.0%) |
| $3,000 or more | 21 (1.3%) | 0 (0.0%) |
| Total | 1,675 (100.0%) | 275 (100.0%) |
Physical Housing Characteristics in Glencoe
Housing Structures in Glencoe
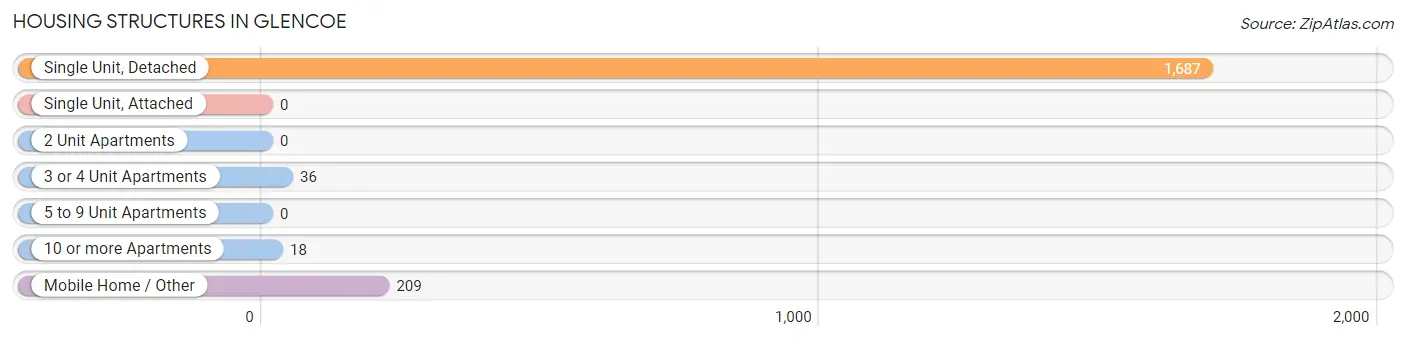
| Structure Type | # Housing Units | % Housing Units |
| Single Unit, Detached | 1,687 | 86.5% |
| Single Unit, Attached | 0 | 0.0% |
| 2 Unit Apartments | 0 | 0.0% |
| 3 or 4 Unit Apartments | 36 | 1.8% |
| 5 to 9 Unit Apartments | 0 | 0.0% |
| 10 or more Apartments | 18 | 0.9% |
| Mobile Home / Other | 209 | 10.7% |
| Total | 1,950 | 100.0% |
Housing Structures by Occupancy in Glencoe
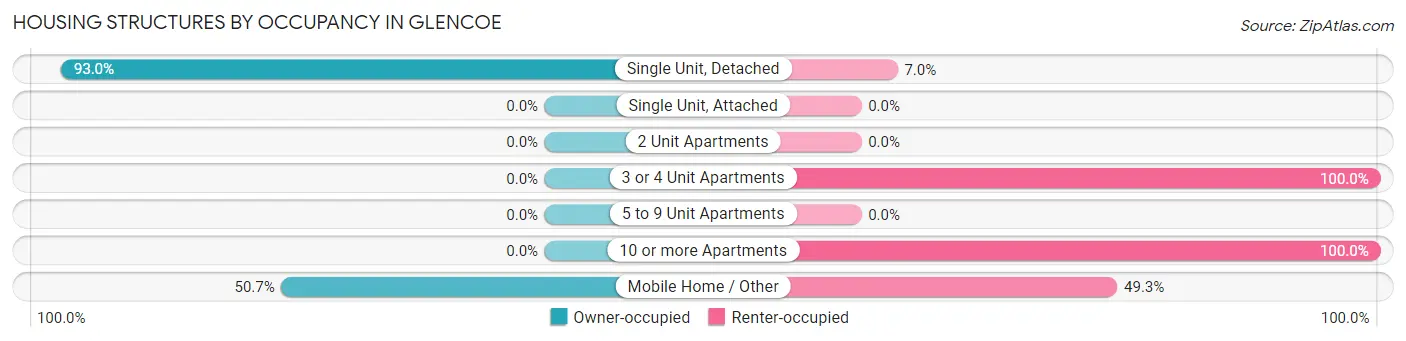
| Structure Type | Owner-occupied | Renter-occupied |
| Single Unit, Detached | 1,569 (93.0%) | 118 (7.0%) |
| Single Unit, Attached | 0 (0.0%) | 0 (0.0%) |
| 2 Unit Apartments | 0 (0.0%) | 0 (0.0%) |
| 3 or 4 Unit Apartments | 0 (0.0%) | 36 (100.0%) |
| 5 to 9 Unit Apartments | 0 (0.0%) | 0 (0.0%) |
| 10 or more Apartments | 0 (0.0%) | 18 (100.0%) |
| Mobile Home / Other | 106 (50.7%) | 103 (49.3%) |
| Total | 1,675 (85.9%) | 275 (14.1%) |
Housing Structures by Number of Rooms in Glencoe
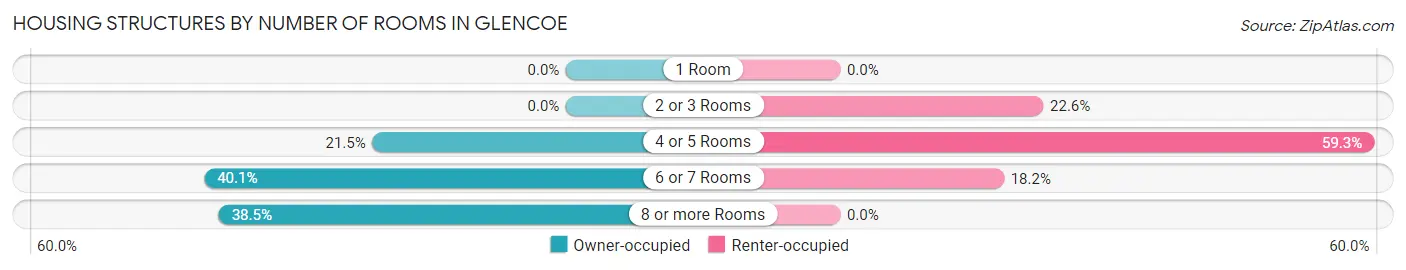
| Number of Rooms | Owner-occupied | Renter-occupied |
| 1 Room | 0 (0.0%) | 0 (0.0%) |
| 2 or 3 Rooms | 0 (0.0%) | 62 (22.6%) |
| 4 or 5 Rooms | 360 (21.5%) | 163 (59.3%) |
| 6 or 7 Rooms | 671 (40.1%) | 50 (18.2%) |
| 8 or more Rooms | 644 (38.5%) | 0 (0.0%) |
| Total | 1,675 (100.0%) | 275 (100.0%) |
Housing Structure by Heating Type in Glencoe
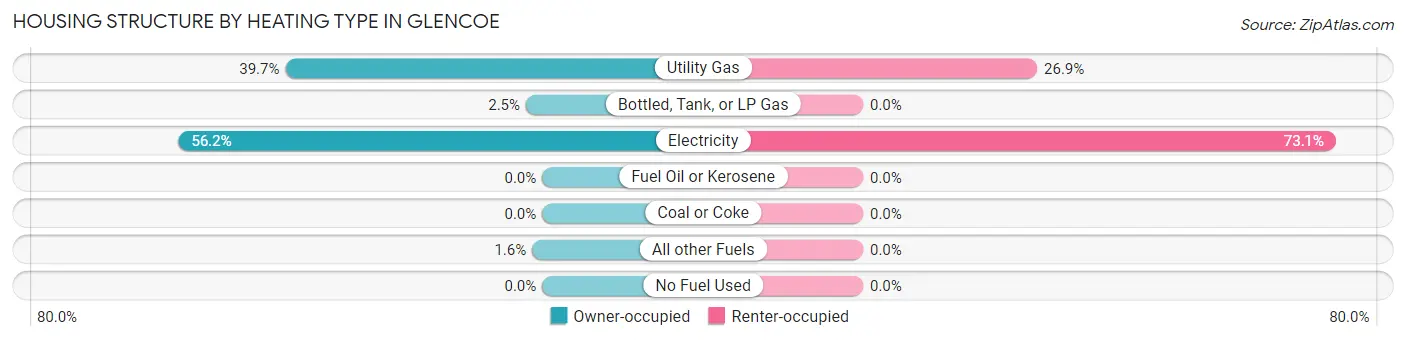
| Heating Type | Owner-occupied | Renter-occupied |
| Utility Gas | 665 (39.7%) | 74 (26.9%) |
| Bottled, Tank, or LP Gas | 42 (2.5%) | 0 (0.0%) |
| Electricity | 942 (56.2%) | 201 (73.1%) |
| Fuel Oil or Kerosene | 0 (0.0%) | 0 (0.0%) |
| Coal or Coke | 0 (0.0%) | 0 (0.0%) |
| All other Fuels | 26 (1.5%) | 0 (0.0%) |
| No Fuel Used | 0 (0.0%) | 0 (0.0%) |
| Total | 1,675 (100.0%) | 275 (100.0%) |
Household Vehicle Usage in Glencoe
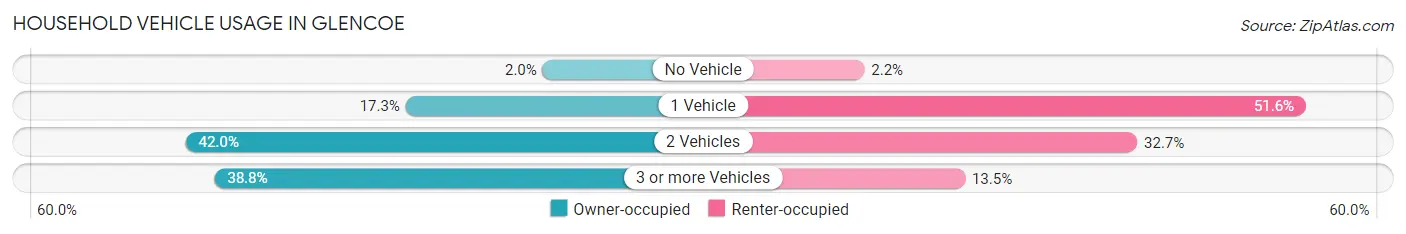
| Vehicles per Household | Owner-occupied | Renter-occupied |
| No Vehicle | 33 (2.0%) | 6 (2.2%) |
| 1 Vehicle | 290 (17.3%) | 142 (51.6%) |
| 2 Vehicles | 703 (42.0%) | 90 (32.7%) |
| 3 or more Vehicles | 649 (38.8%) | 37 (13.5%) |
| Total | 1,675 (100.0%) | 275 (100.0%) |
Real Estate & Mortgages in Glencoe
Real Estate and Mortgage Overview in Glencoe
| Characteristic | Without Mortgage | With Mortgage |
| Housing Units | 646 | 1,029 |
| Median Property Value | $149,600 | $196,300 |
| Median Household Income | $68,929 | $231 |
| Monthly Housing Costs | $424 | $21 |
| Real Estate Taxes | $727 | $116 |
Property Value by Mortgage Status in Glencoe
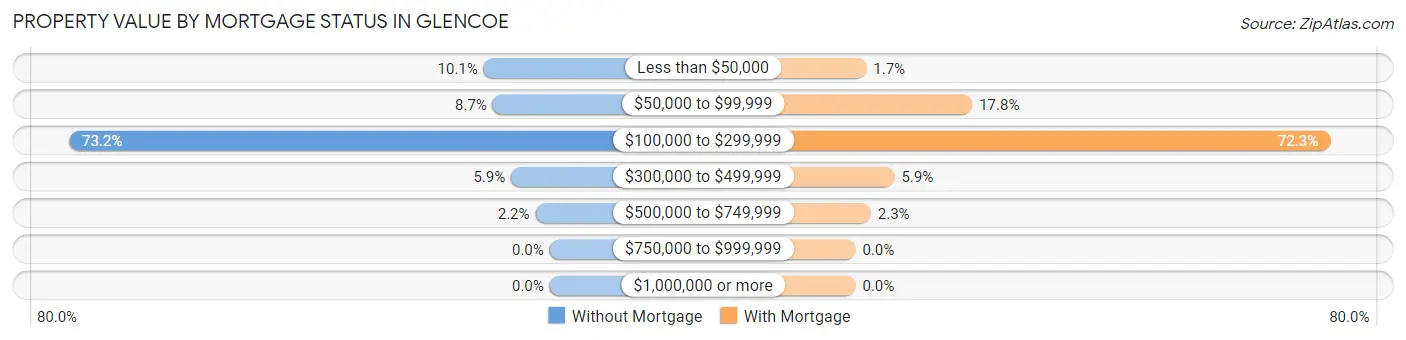
| Property Value | Without Mortgage | With Mortgage |
| Less than $50,000 | 65 (10.1%) | 17 (1.7%) |
| $50,000 to $99,999 | 56 (8.7%) | 183 (17.8%) |
| $100,000 to $299,999 | 473 (73.2%) | 744 (72.3%) |
| $300,000 to $499,999 | 38 (5.9%) | 61 (5.9%) |
| $500,000 to $749,999 | 14 (2.2%) | 24 (2.3%) |
| $750,000 to $999,999 | 0 (0.0%) | 0 (0.0%) |
| $1,000,000 or more | 0 (0.0%) | 0 (0.0%) |
| Total | 646 (100.0%) | 1,029 (100.0%) |
Household Income by Mortgage Status in Glencoe
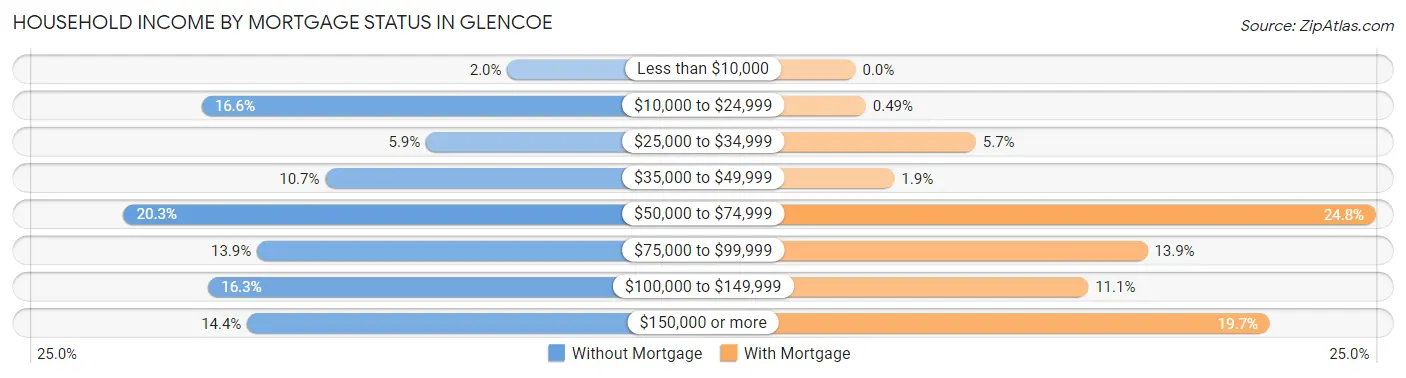
| Household Income | Without Mortgage | With Mortgage |
| Less than $10,000 | 13 (2.0%) | 0 (0.0%) |
| $10,000 to $24,999 | 107 (16.6%) | 5 (0.5%) |
| $25,000 to $34,999 | 38 (5.9%) | 59 (5.7%) |
| $35,000 to $49,999 | 69 (10.7%) | 19 (1.8%) |
| $50,000 to $74,999 | 131 (20.3%) | 255 (24.8%) |
| $75,000 to $99,999 | 90 (13.9%) | 143 (13.9%) |
| $100,000 to $149,999 | 105 (16.3%) | 114 (11.1%) |
| $150,000 or more | 93 (14.4%) | 203 (19.7%) |
| Total | 646 (100.0%) | 1,029 (100.0%) |
Property Value to Household Income Ratio in Glencoe
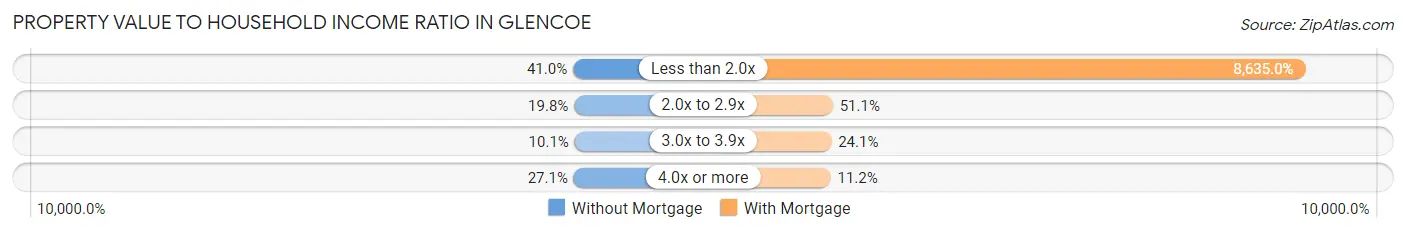
| Value-to-Income Ratio | Without Mortgage | With Mortgage |
| Less than 2.0x | 265 (41.0%) | 88,854 (8,635.0%) |
| 2.0x to 2.9x | 128 (19.8%) | 526 (51.1%) |
| 3.0x to 3.9x | 65 (10.1%) | 248 (24.1%) |
| 4.0x or more | 175 (27.1%) | 115 (11.2%) |
| Total | 646 (100.0%) | 1,029 (100.0%) |
Real Estate Taxes by Mortgage Status in Glencoe
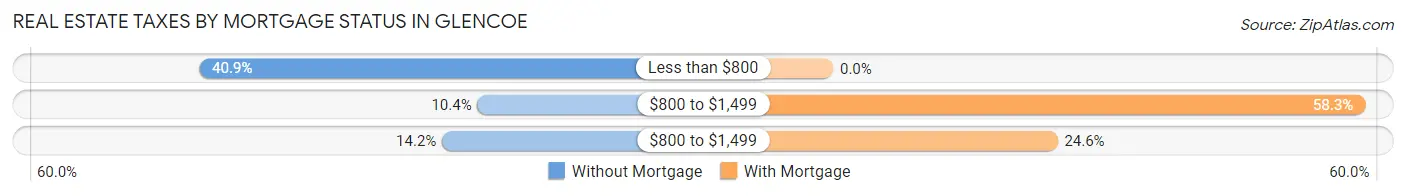
| Property Taxes | Without Mortgage | With Mortgage |
| Less than $800 | 264 (40.9%) | 0 (0.0%) |
| $800 to $1,499 | 67 (10.4%) | 600 (58.3%) |
| $800 to $1,499 | 92 (14.2%) | 253 (24.6%) |
| Total | 646 (100.0%) | 1,029 (100.0%) |
Health & Disability in Glencoe
Health Insurance Coverage by Age in Glencoe
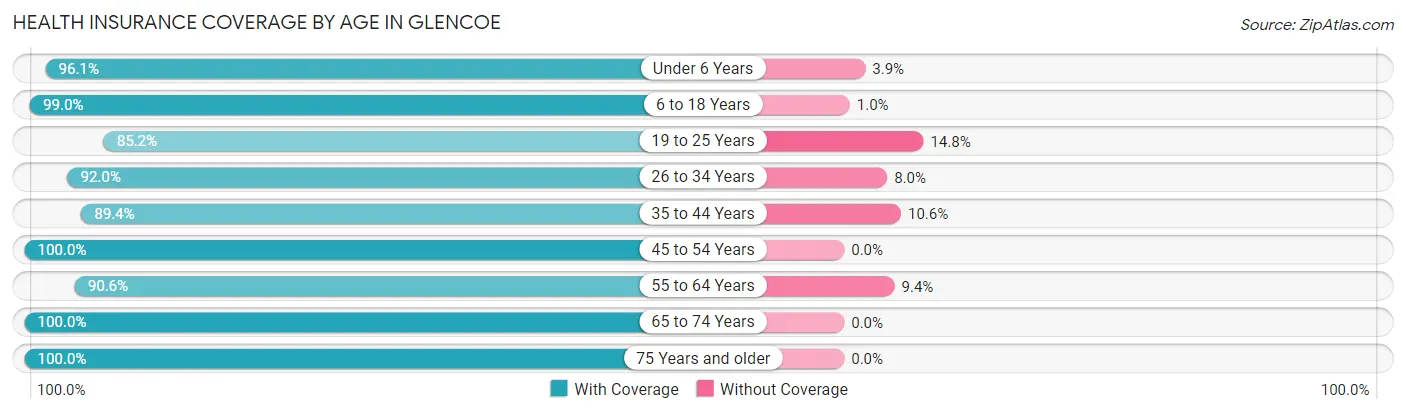
| Age Bracket | With Coverage | Without Coverage |
| Under 6 Years | 319 (96.1%) | 13 (3.9%) |
| 6 to 18 Years | 1,045 (99.0%) | 11 (1.0%) |
| 19 to 25 Years | 202 (85.2%) | 35 (14.8%) |
| 26 to 34 Years | 460 (92.0%) | 40 (8.0%) |
| 35 to 44 Years | 684 (89.4%) | 81 (10.6%) |
| 45 to 54 Years | 411 (100.0%) | 0 (0.0%) |
| 55 to 64 Years | 773 (90.6%) | 80 (9.4%) |
| 65 to 74 Years | 657 (100.0%) | 0 (0.0%) |
| 75 Years and older | 475 (100.0%) | 0 (0.0%) |
| Total | 5,026 (95.1%) | 260 (4.9%) |
Health Insurance Coverage by Citizenship Status in Glencoe
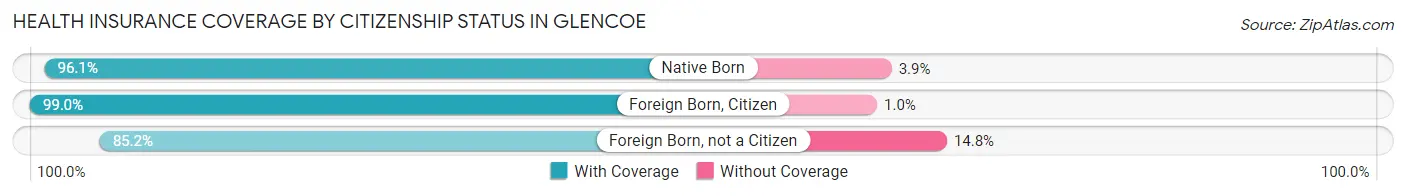
| Citizenship Status | With Coverage | Without Coverage |
| Native Born | 319 (96.1%) | 13 (3.9%) |
| Foreign Born, Citizen | 1,045 (99.0%) | 11 (1.0%) |
| Foreign Born, not a Citizen | 202 (85.2%) | 35 (14.8%) |
Health Insurance Coverage by Household Income in Glencoe
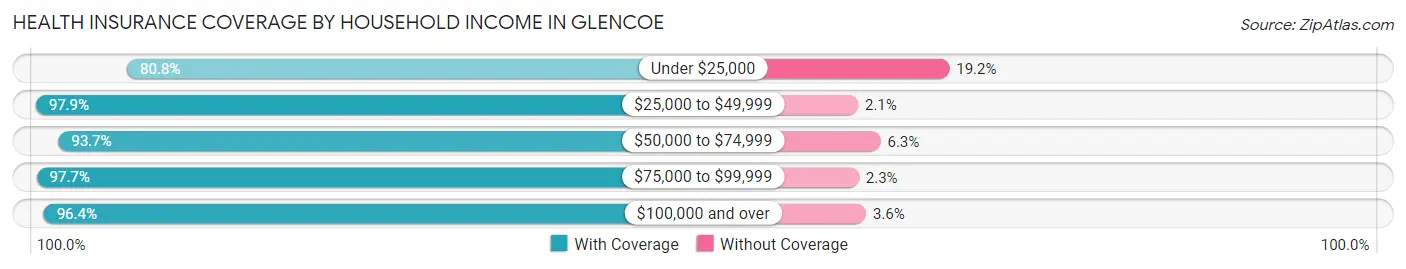
| Household Income | With Coverage | Without Coverage |
| Under $25,000 | 383 (80.8%) | 91 (19.2%) |
| $25,000 to $49,999 | 1,069 (97.9%) | 23 (2.1%) |
| $50,000 to $74,999 | 711 (93.7%) | 48 (6.3%) |
| $75,000 to $99,999 | 605 (97.7%) | 14 (2.3%) |
| $100,000 and over | 2,258 (96.4%) | 84 (3.6%) |
Public vs Private Health Insurance Coverage by Age in Glencoe

| Age Bracket | Public Insurance | Private Insurance |
| Under 6 | 123 (37.0%) | 196 (59.0%) |
| 6 to 18 Years | 302 (28.6%) | 836 (79.2%) |
| 19 to 25 Years | 0 (0.0%) | 202 (85.2%) |
| 25 to 34 Years | 71 (14.2%) | 389 (77.8%) |
| 35 to 44 Years | 73 (9.5%) | 626 (81.8%) |
| 45 to 54 Years | 167 (40.6%) | 288 (70.1%) |
| 55 to 64 Years | 132 (15.5%) | 660 (77.4%) |
| 65 to 74 Years | 605 (92.1%) | 404 (61.5%) |
| 75 Years and over | 475 (100.0%) | 317 (66.7%) |
| Total | 1,948 (36.8%) | 3,918 (74.1%) |
Disability Status by Sex by Age in Glencoe
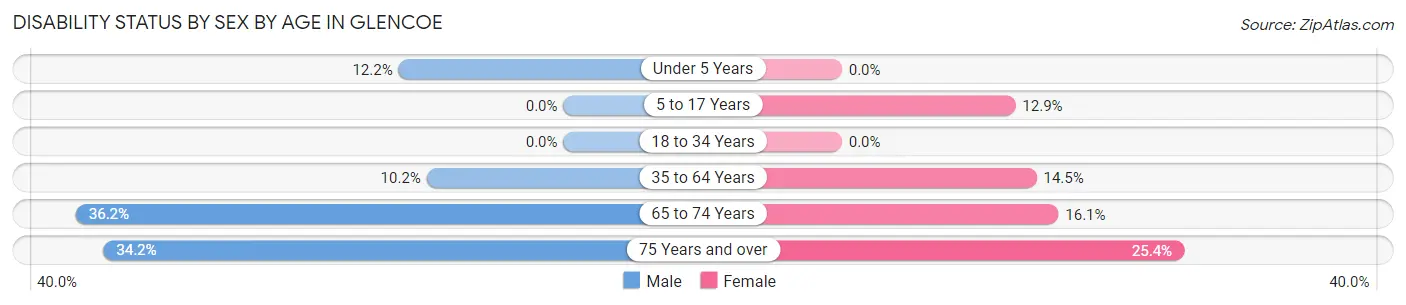
| Age Bracket | Male | Female |
| Under 5 Years | 18 (12.2%) | 0 (0.0%) |
| 5 to 17 Years | 0 (0.0%) | 54 (12.9%) |
| 18 to 34 Years | 0 (0.0%) | 0 (0.0%) |
| 35 to 64 Years | 81 (10.2%) | 178 (14.5%) |
| 65 to 74 Years | 114 (36.2%) | 55 (16.1%) |
| 75 Years and over | 56 (34.2%) | 79 (25.4%) |
Disability Class by Sex by Age in Glencoe
Disability Class: Hearing Difficulty
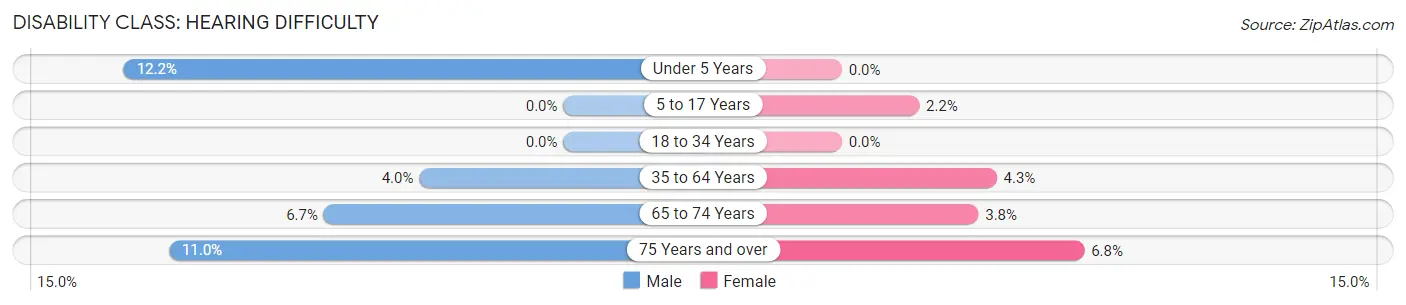
| Age Bracket | Male | Female |
| Under 5 Years | 18 (12.2%) | 0 (0.0%) |
| 5 to 17 Years | 0 (0.0%) | 9 (2.1%) |
| 18 to 34 Years | 0 (0.0%) | 0 (0.0%) |
| 35 to 64 Years | 32 (4.0%) | 53 (4.3%) |
| 65 to 74 Years | 21 (6.7%) | 13 (3.8%) |
| 75 Years and over | 18 (11.0%) | 21 (6.8%) |
Disability Class: Vision Difficulty
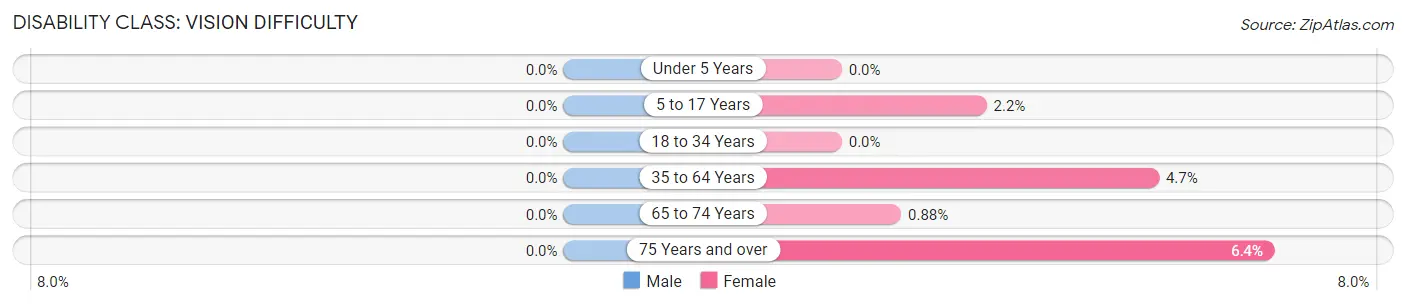
| Age Bracket | Male | Female |
| Under 5 Years | 0 (0.0%) | 0 (0.0%) |
| 5 to 17 Years | 0 (0.0%) | 9 (2.1%) |
| 18 to 34 Years | 0 (0.0%) | 0 (0.0%) |
| 35 to 64 Years | 0 (0.0%) | 58 (4.7%) |
| 65 to 74 Years | 0 (0.0%) | 3 (0.9%) |
| 75 Years and over | 0 (0.0%) | 20 (6.4%) |
Disability Class: Cognitive Difficulty
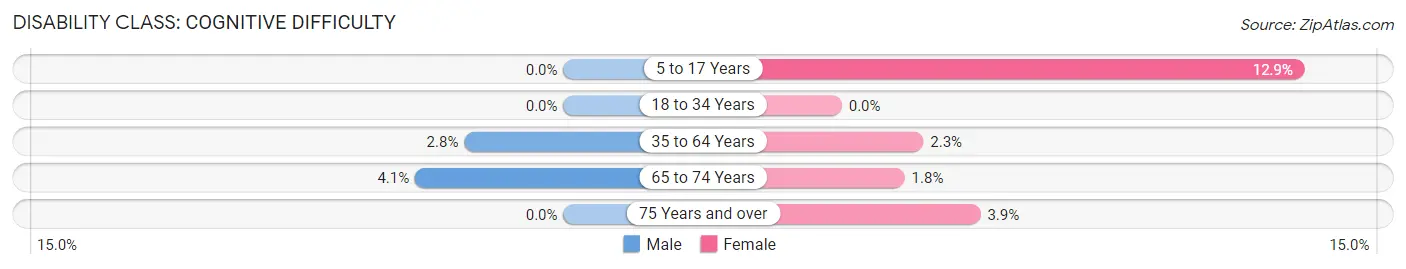
| Age Bracket | Male | Female |
| 5 to 17 Years | 0 (0.0%) | 54 (12.9%) |
| 18 to 34 Years | 0 (0.0%) | 0 (0.0%) |
| 35 to 64 Years | 22 (2.8%) | 28 (2.3%) |
| 65 to 74 Years | 13 (4.1%) | 6 (1.8%) |
| 75 Years and over | 0 (0.0%) | 12 (3.9%) |
Disability Class: Ambulatory Difficulty
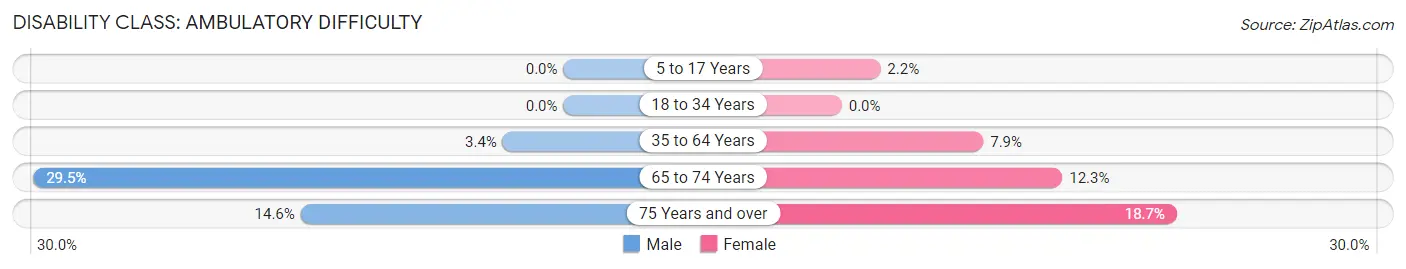
| Age Bracket | Male | Female |
| 5 to 17 Years | 0 (0.0%) | 9 (2.1%) |
| 18 to 34 Years | 0 (0.0%) | 0 (0.0%) |
| 35 to 64 Years | 27 (3.4%) | 97 (7.9%) |
| 65 to 74 Years | 93 (29.5%) | 42 (12.3%) |
| 75 Years and over | 24 (14.6%) | 58 (18.6%) |
Disability Class: Self-Care Difficulty
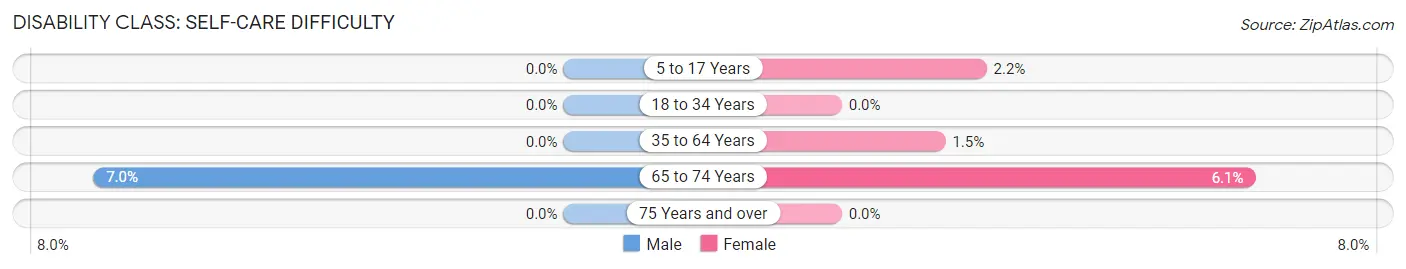
| Age Bracket | Male | Female |
| 5 to 17 Years | 0 (0.0%) | 9 (2.1%) |
| 18 to 34 Years | 0 (0.0%) | 0 (0.0%) |
| 35 to 64 Years | 0 (0.0%) | 19 (1.5%) |
| 65 to 74 Years | 22 (7.0%) | 21 (6.1%) |
| 75 Years and over | 0 (0.0%) | 0 (0.0%) |
Technology Access in Glencoe
Computing Device Access in Glencoe
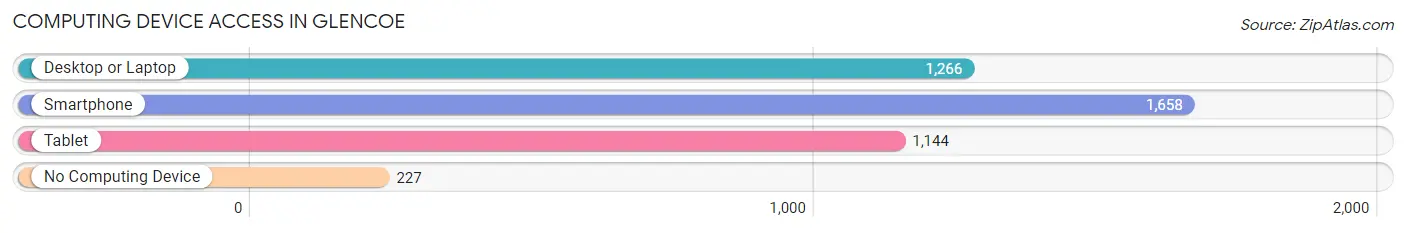
| Device Type | # Households | % Households |
| Desktop or Laptop | 1,266 | 64.9% |
| Smartphone | 1,658 | 85.0% |
| Tablet | 1,144 | 58.7% |
| No Computing Device | 227 | 11.6% |
| Total | 1,950 | 100.0% |
Internet Access in Glencoe
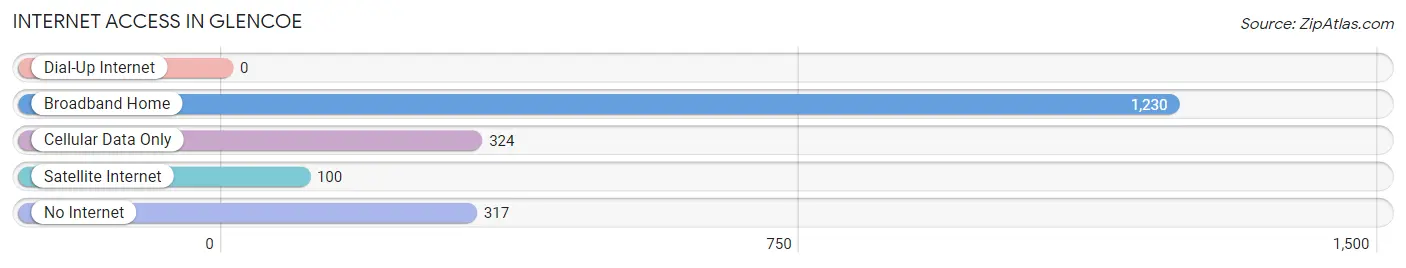
| Internet Type | # Households | % Households |
| Dial-Up Internet | 0 | 0.0% |
| Broadband Home | 1,230 | 63.1% |
| Cellular Data Only | 324 | 16.6% |
| Satellite Internet | 100 | 5.1% |
| No Internet | 317 | 16.3% |
| Total | 1,950 | 100.0% |
Glencoe Summary
Glencoe is a small city located in Etowah County, Alabama. It is situated in the foothills of the Appalachian Mountains, approximately 25 miles northeast of Birmingham. The city has a population of approximately 2,500 people and is part of the Gadsden Metropolitan Statistical Area.
History
Glencoe was founded in 1883 by a group of settlers from Georgia. The city was named after the Glencoe Valley in Scotland. The first settlers were primarily farmers and the city quickly grew to become a thriving agricultural community. The city was incorporated in 1887 and the first mayor was elected in 1888.
In the early 1900s, the city began to experience a period of growth and development. The city was connected to the railroad in 1906 and the first bank was established in 1907. The city also saw the construction of a number of new businesses, including a cotton gin, a grist mill, and a sawmill.
In the 1920s, the city experienced a period of decline due to the Great Depression. However, the city was able to recover and by the 1950s, the city had become a thriving community once again. The city was connected to the interstate highway system in the 1960s and this helped to spur further growth and development.
Geography
Glencoe is located in the foothills of the Appalachian Mountains in Etowah County, Alabama. The city is situated at the intersection of US Highway 431 and Alabama State Route 77. The city is located approximately 25 miles northeast of Birmingham and is part of the Gadsden Metropolitan Statistical Area.
The city has a total area of 4.2 square miles, all of which is land. The city is located at an elevation of 845 feet above sea level. The city is located in a humid subtropical climate zone and experiences hot, humid summers and mild winters.
Economy
The economy of Glencoe is primarily based on agriculture and manufacturing. The city is home to a number of agricultural businesses, including a cotton gin, a grist mill, and a sawmill. The city is also home to a number of manufacturing businesses, including a furniture factory, a paper mill, and a plastics factory.
The city is also home to a number of retail businesses, including a grocery store, a hardware store, and a number of restaurants. The city is also home to a number of service businesses, including a bank, a post office, and a number of medical offices.
Demographics
As of the 2010 census, the population of Glencoe was 2,500. The racial makeup of the city was 95.2% White, 2.2% African American, 0.4% Native American, 0.4% Asian, 0.2% from other races, and 1.6% from two or more races. Hispanic or Latino of any race were 1.2% of the population.
The median household income in the city was $35,000 and the median family income was $41,000. The per capita income in the city was $17,000. Approximately 16.2% of the population was below the poverty line.
Common Questions
What is Per Capita Income in Glencoe?
Per Capita income in Glencoe is $33,056.
What is the Median Family Income in Glencoe?
Median Family Income in Glencoe is $91,319.
What is the Median Household income in Glencoe?
Median Household Income in Glencoe is $68,893.
What is Income or Wage Gap in Glencoe?
Income or Wage Gap in Glencoe is 45.4%.
Women in Glencoe earn 54.6 cents for every dollar earned by a man.
What is Inequality or Gini Index in Glencoe?
Inequality or Gini Index in Glencoe is 0.42.
What is the Total Population of Glencoe?
Total Population of Glencoe is 5,343.
What is the Total Male Population of Glencoe?
Total Male Population of Glencoe is 2,450.
What is the Total Female Population of Glencoe?
Total Female Population of Glencoe is 2,893.
What is the Ratio of Males per 100 Females in Glencoe?
There are 84.69 Males per 100 Females in Glencoe.
What is the Ratio of Females per 100 Males in Glencoe?
There are 118.08 Females per 100 Males in Glencoe.
What is the Median Population Age in Glencoe?
Median Population Age in Glencoe is 43.2 Years.
What is the Average Family Size in Glencoe
Average Family Size in Glencoe is 3.2 People.
What is the Average Household Size in Glencoe
Average Household Size in Glencoe is 2.7 People.
How Large is the Labor Force in Glencoe?
There are 2,524 People in the Labor Forcein in Glencoe.
What is the Percentage of People in the Labor Force in Glencoe?
59.9% of People are in the Labor Force in Glencoe.
What is the Unemployment Rate in Glencoe?
Unemployment Rate in Glencoe is 1.5%.