Huguley, AL Map & Demographics
Huguley Map
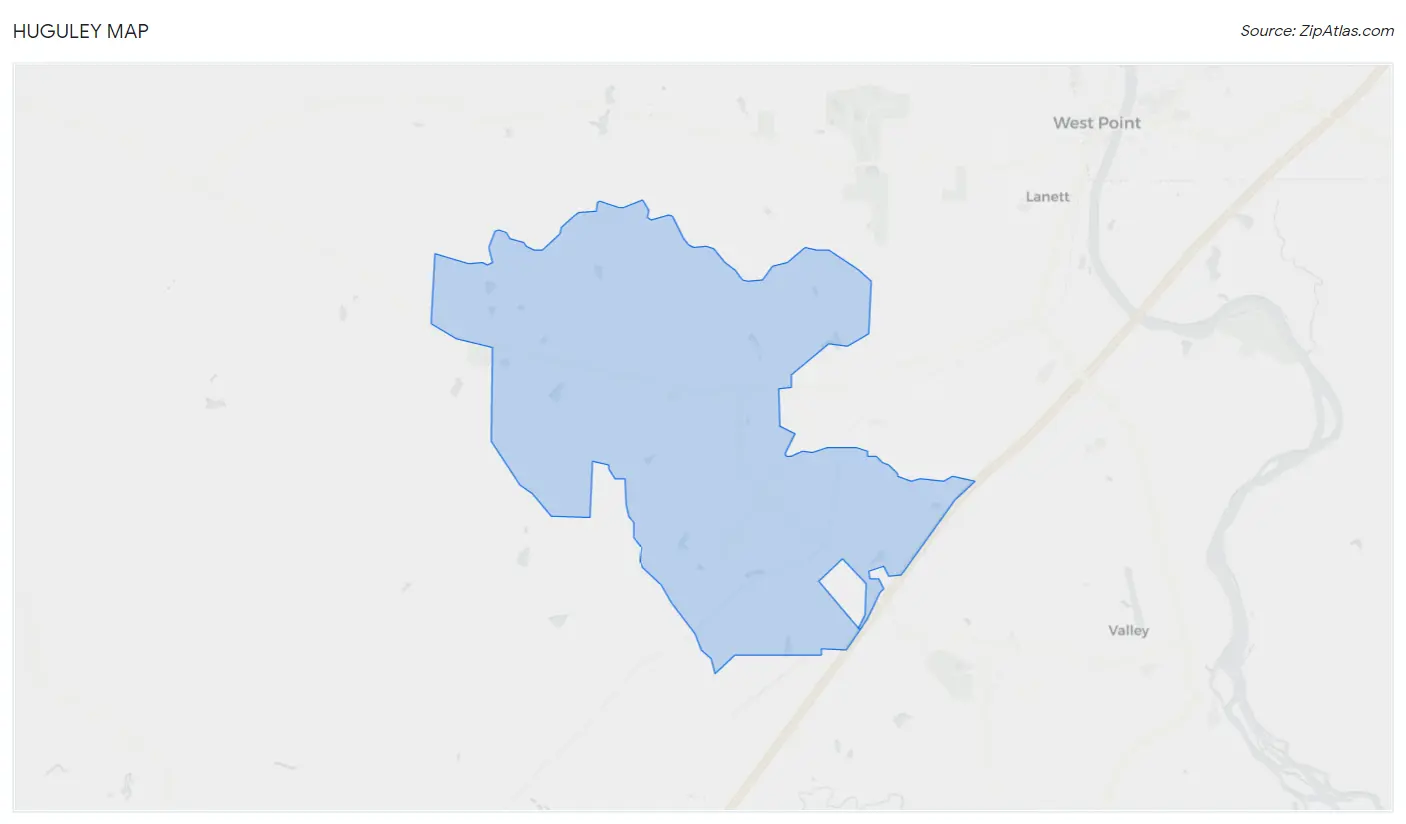
Huguley Overview
$26,882
PER CAPITA INCOME
$59,028
AVG FAMILY INCOME
$41,338
AVG HOUSEHOLD INCOME
8.1%
WAGE / INCOME GAP [ % ]
91.9¢/ $1
WAGE / INCOME GAP [ $ ]
$5,486
FAMILY INCOME DEFICIT
0.45
INEQUALITY / GINI INDEX
3,020
TOTAL POPULATION
1,467
MALE POPULATION
1,553
FEMALE POPULATION
94.46
MALES / 100 FEMALES
105.86
FEMALES / 100 MALES
43.3
MEDIAN AGE
3.6
AVG FAMILY SIZE
3.0
AVG HOUSEHOLD SIZE
1,445
LABOR FORCE [ PEOPLE ]
59.5%
PERCENT IN LABOR FORCE
2.6%
UNEMPLOYMENT RATE
Income in Huguley
Income Overview in Huguley
Per Capita Income in Huguley is $26,882, while median incomes of families and households are $59,028 and $41,338 respectively.
| Characteristic | Number | Measure |
| Per Capita Income | 3,020 | $26,882 |
| Median Family Income | 718 | $59,028 |
| Mean Family Income | 718 | $83,071 |
| Median Household Income | 999 | $41,338 |
| Mean Household Income | 999 | $70,030 |
| Income Deficit | 718 | $5,486 |
| Wage / Income Gap (%) | 3,020 | 8.15% |
| Wage / Income Gap ($) | 3,020 | 91.85¢ per $1 |
| Gini / Inequality Index | 3,020 | 0.45 |
Earnings by Sex in Huguley
Average Earnings in Huguley are $30,953, $31,301 for men and $28,750 for women, a difference of 8.2%.
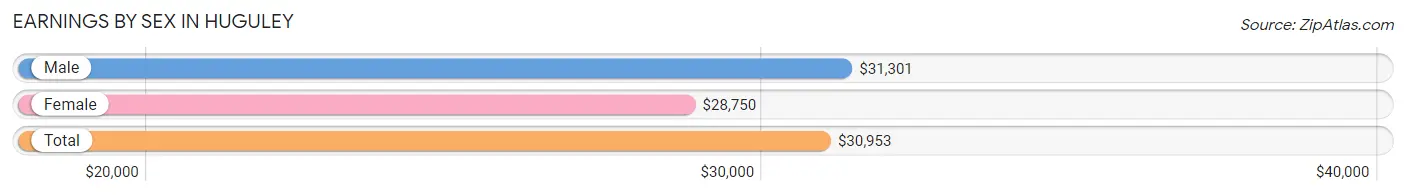
| Sex | Number | Average Earnings |
| Male | 838 (56.6%) | $31,301 |
| Female | 642 (43.4%) | $28,750 |
| Total | 1,480 (100.0%) | $30,953 |
Earnings by Sex by Income Bracket in Huguley
The most common earnings brackets in Huguley are $30,000 to $34,999 for men (129 | 15.4%) and $25,000 to $29,999 for women (84 | 13.1%).
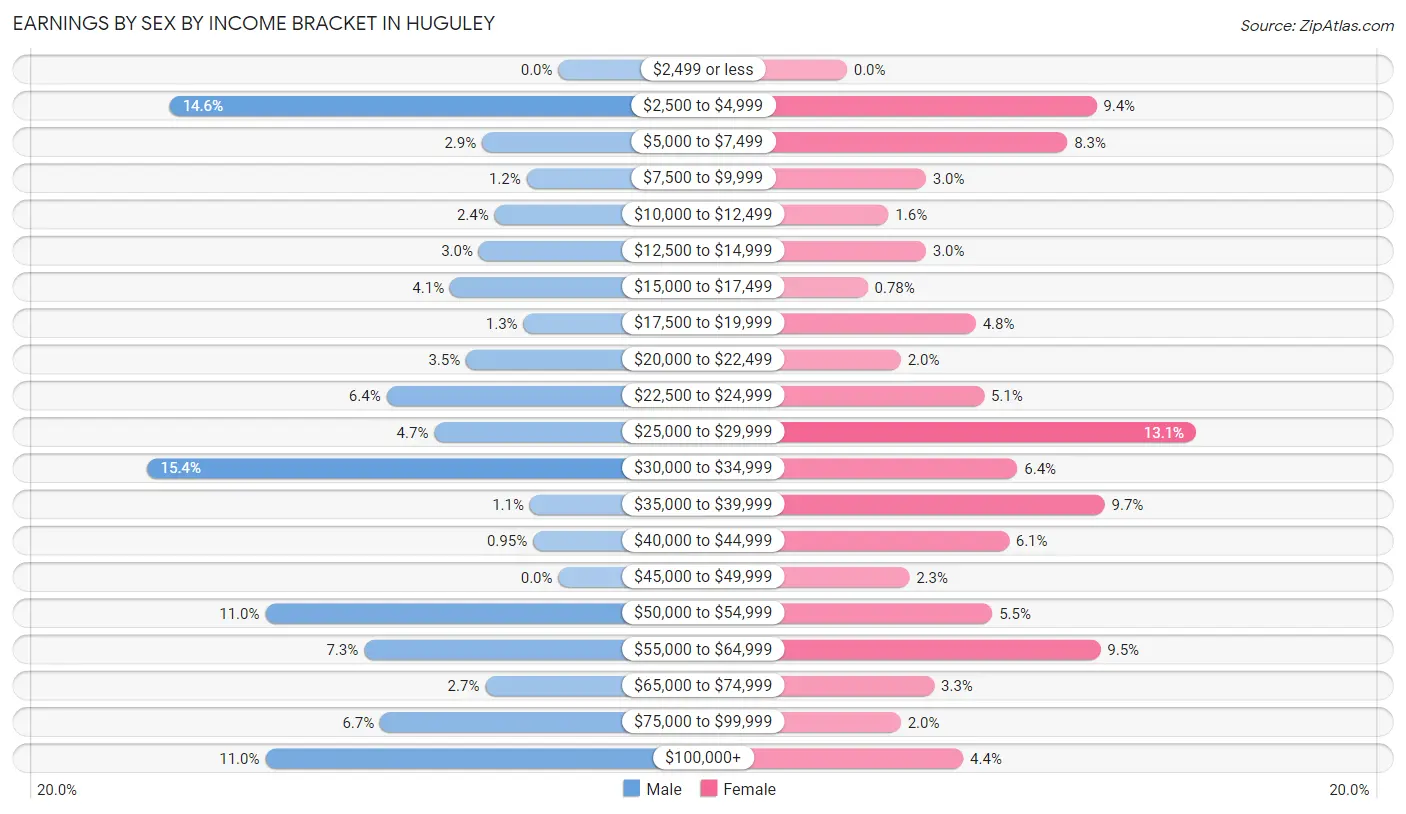
| Income | Male | Female |
| $2,499 or less | 0 (0.0%) | 0 (0.0%) |
| $2,500 to $4,999 | 122 (14.6%) | 60 (9.3%) |
| $5,000 to $7,499 | 24 (2.9%) | 53 (8.3%) |
| $7,500 to $9,999 | 10 (1.2%) | 19 (3.0%) |
| $10,000 to $12,499 | 20 (2.4%) | 10 (1.6%) |
| $12,500 to $14,999 | 25 (3.0%) | 19 (3.0%) |
| $15,000 to $17,499 | 34 (4.1%) | 5 (0.8%) |
| $17,500 to $19,999 | 11 (1.3%) | 31 (4.8%) |
| $20,000 to $22,499 | 29 (3.5%) | 13 (2.0%) |
| $22,500 to $24,999 | 54 (6.4%) | 33 (5.1%) |
| $25,000 to $29,999 | 39 (4.6%) | 84 (13.1%) |
| $30,000 to $34,999 | 129 (15.4%) | 41 (6.4%) |
| $35,000 to $39,999 | 9 (1.1%) | 62 (9.7%) |
| $40,000 to $44,999 | 8 (0.9%) | 39 (6.1%) |
| $45,000 to $49,999 | 0 (0.0%) | 15 (2.3%) |
| $50,000 to $54,999 | 92 (11.0%) | 35 (5.4%) |
| $55,000 to $64,999 | 61 (7.3%) | 61 (9.5%) |
| $65,000 to $74,999 | 23 (2.7%) | 21 (3.3%) |
| $75,000 to $99,999 | 56 (6.7%) | 13 (2.0%) |
| $100,000+ | 92 (11.0%) | 28 (4.4%) |
| Total | 838 (100.0%) | 642 (100.0%) |
Earnings by Sex by Educational Attainment in Huguley
Average earnings in Huguley are $31,866 for men and $39,012 for women, a difference of 18.3%. Men with an educational attainment of bachelor's degree enjoy the highest average annual earnings of $51,354, while those with bachelor's degree education earn the least with $51,354. Women with an educational attainment of college or associate's degree earn the most with the average annual earnings of $37,866, while those with high school diploma education have the smallest earnings of $37,798.
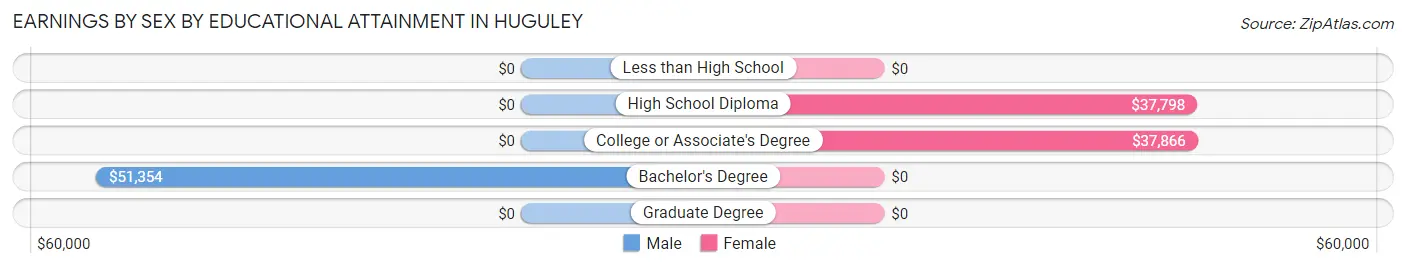
| Educational Attainment | Male Income | Female Income |
| Less than High School | - | - |
| High School Diploma | - | - |
| College or Associate's Degree | - | - |
| Bachelor's Degree | $51,354 | $0 |
| Graduate Degree | - | - |
| Total | $31,866 | $39,012 |
Family Income in Huguley
Family Income Brackets in Huguley
According to the Huguley family income data, there are 210 families falling into the $35,000 to $49,999 income range, which is the most common income bracket and makes up 29.2% of all families. Conversely, the less than $10,000 income bracket is the least frequent group with only 9 families (1.3%) belonging to this category.
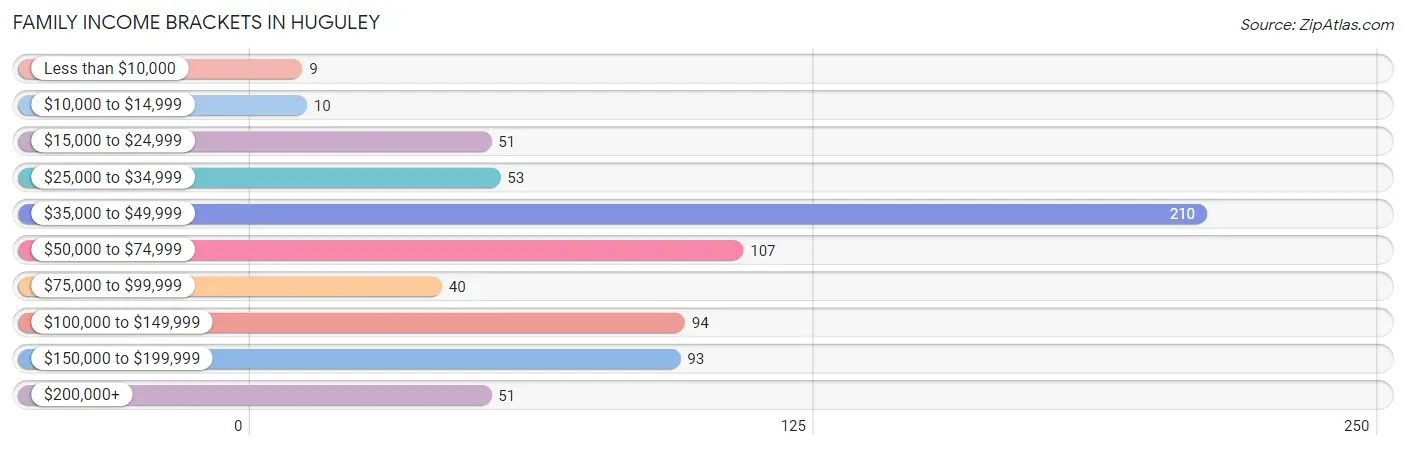
| Income Bracket | # Families | % Families |
| Less than $10,000 | 9 | 1.3% |
| $10,000 to $14,999 | 10 | 1.4% |
| $15,000 to $24,999 | 51 | 7.1% |
| $25,000 to $34,999 | 53 | 7.4% |
| $35,000 to $49,999 | 210 | 29.2% |
| $50,000 to $74,999 | 107 | 14.9% |
| $75,000 to $99,999 | 40 | 5.6% |
| $100,000 to $149,999 | 94 | 13.1% |
| $150,000 to $199,999 | 93 | 13.0% |
| $200,000+ | 51 | 7.1% |
Family Income by Famaliy Size in Huguley
3-person families (186 | 25.9%) account for the highest median family income in Huguley with $71,591 per family, while 3-person families (186 | 25.9%) have the highest median income of $23,864 per family member.
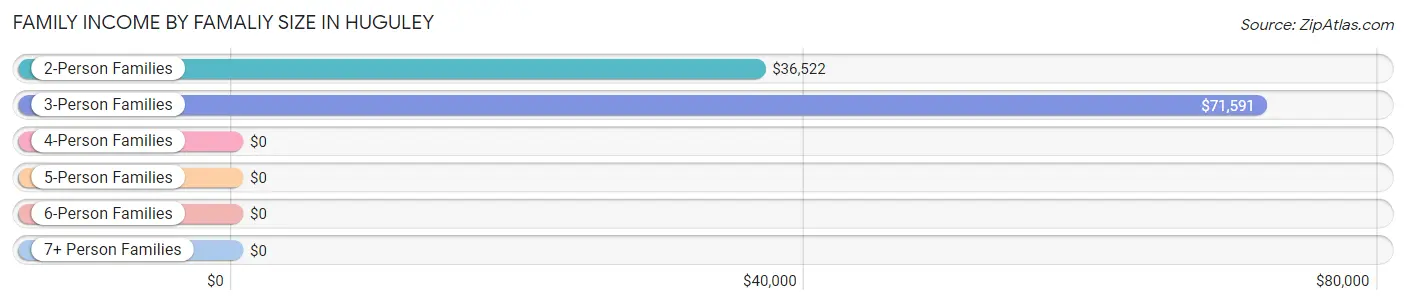
| Income Bracket | # Families | Median Income |
| 2-Person Families | 338 (47.1%) | $36,522 |
| 3-Person Families | 186 (25.9%) | $71,591 |
| 4-Person Families | 107 (14.9%) | $0 |
| 5-Person Families | 15 (2.1%) | $0 |
| 6-Person Families | 18 (2.5%) | $0 |
| 7+ Person Families | 54 (7.5%) | $0 |
| Total | 718 (100.0%) | $59,028 |
Family Income by Number of Earners in Huguley
The median family income in Huguley is $59,028, with families comprising 3+ earners (93) having the highest median family income of $143,295, while families with no earners (113) have the lowest median family income of $35,515, accounting for 13.0% and 15.7% of families, respectively.
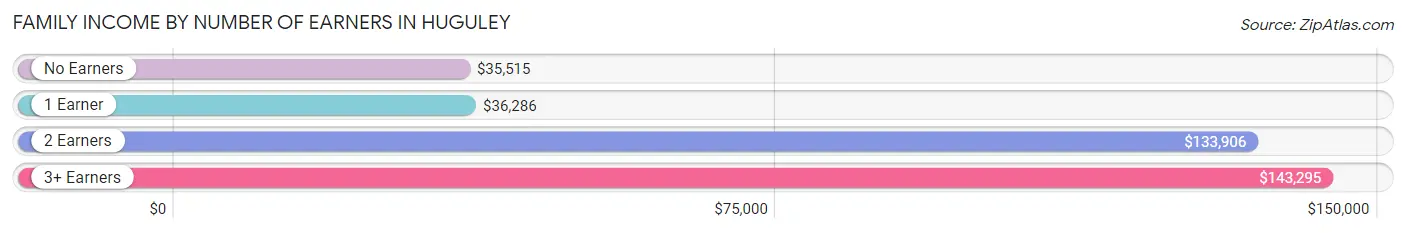
| Number of Earners | # Families | Median Income |
| No Earners | 113 (15.7%) | $35,515 |
| 1 Earner | 267 (37.2%) | $36,286 |
| 2 Earners | 245 (34.1%) | $133,906 |
| 3+ Earners | 93 (13.0%) | $143,295 |
| Total | 718 (100.0%) | $59,028 |
Household Income in Huguley
Household Income Brackets in Huguley
With 279 households falling in the category, the $35,000 to $49,999 income range is the most frequent in Huguley, accounting for 27.9% of all households. In contrast, only 27 households (2.7%) fall into the $10,000 to $14,999 income bracket, making it the least populous group.
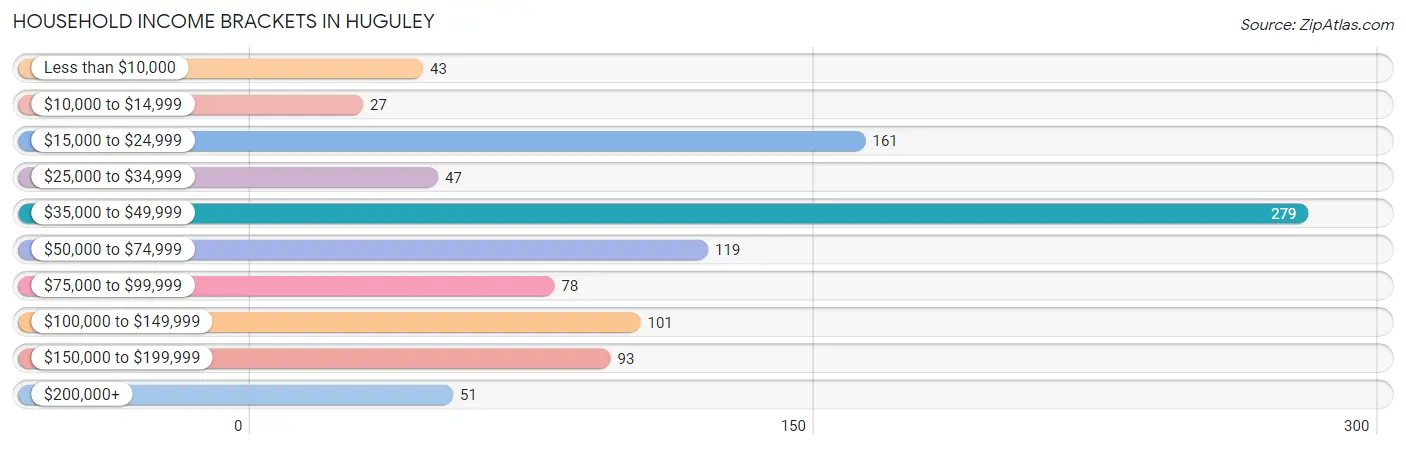
| Income Bracket | # Households | % Households |
| Less than $10,000 | 43 | 4.3% |
| $10,000 to $14,999 | 27 | 2.7% |
| $15,000 to $24,999 | 161 | 16.1% |
| $25,000 to $34,999 | 47 | 4.7% |
| $35,000 to $49,999 | 279 | 27.9% |
| $50,000 to $74,999 | 119 | 11.9% |
| $75,000 to $99,999 | 78 | 7.8% |
| $100,000 to $149,999 | 101 | 10.1% |
| $150,000 to $199,999 | 93 | 9.3% |
| $200,000+ | 51 | 5.1% |
Household Income by Householder Age in Huguley
The median household income in Huguley is $41,338, with the highest median household income of $65,809 found in the 25 to 44 years age bracket for the primary householder. A total of 207 households (20.7%) fall into this category. Meanwhile, the 15 to 24 years age bracket for the primary householder has the lowest median household income of $0, with 39 households (3.9%) in this group.
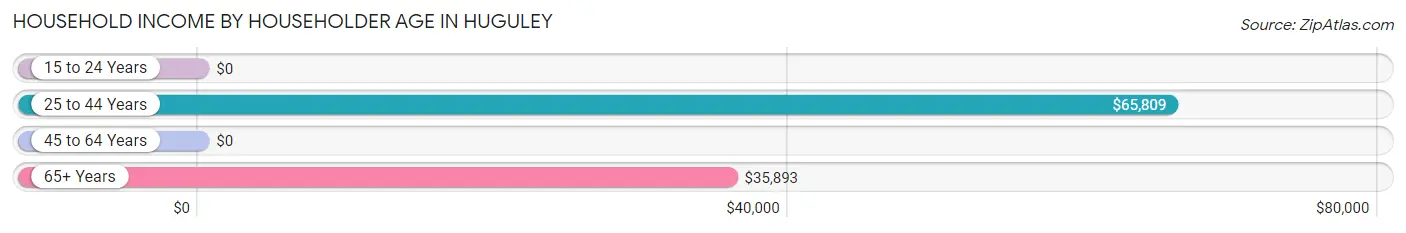
| Income Bracket | # Households | Median Income |
| 15 to 24 Years | 39 (3.9%) | $0 |
| 25 to 44 Years | 207 (20.7%) | $65,809 |
| 45 to 64 Years | 478 (47.8%) | $0 |
| 65+ Years | 275 (27.5%) | $35,893 |
| Total | 999 (100.0%) | $41,338 |
Poverty in Huguley
Income Below Poverty by Sex and Age in Huguley
With 8.3% poverty level for males and 11.0% for females among the residents of Huguley, 65 to 74 year old males and 25 to 34 year old females are the most vulnerable to poverty, with 33 males (27.1%) and 36 females (28.8%) in their respective age groups living below the poverty level.
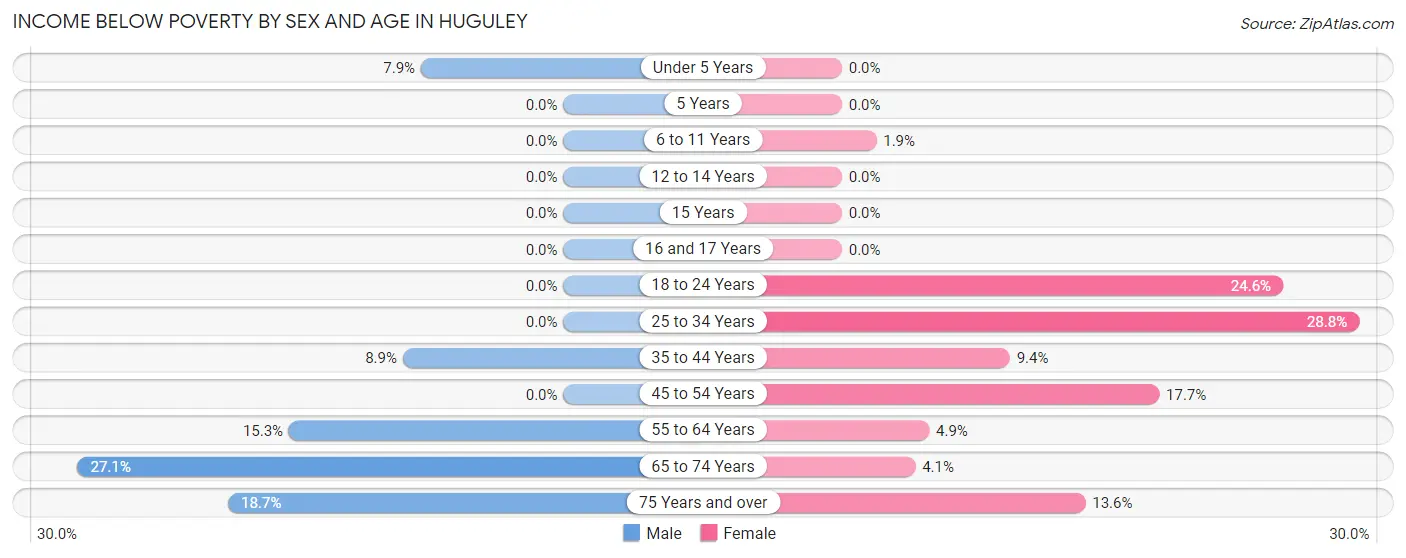
| Age Bracket | Male | Female |
| Under 5 Years | 13 (7.9%) | 0 (0.0%) |
| 5 Years | 0 (0.0%) | 0 (0.0%) |
| 6 to 11 Years | 0 (0.0%) | 3 (1.9%) |
| 12 to 14 Years | 0 (0.0%) | 0 (0.0%) |
| 15 Years | 0 (0.0%) | 0 (0.0%) |
| 16 and 17 Years | 0 (0.0%) | 0 (0.0%) |
| 18 to 24 Years | 0 (0.0%) | 42 (24.6%) |
| 25 to 34 Years | 0 (0.0%) | 36 (28.8%) |
| 35 to 44 Years | 16 (8.9%) | 13 (9.3%) |
| 45 to 54 Years | 0 (0.0%) | 41 (17.7%) |
| 55 to 64 Years | 46 (15.3%) | 12 (4.9%) |
| 65 to 74 Years | 33 (27.1%) | 7 (4.1%) |
| 75 Years and over | 14 (18.7%) | 16 (13.6%) |
| Total | 122 (8.3%) | 170 (11.0%) |
Income Above Poverty by Sex and Age in Huguley
According to the poverty statistics in Huguley, males aged 5 years and females aged under 5 years are the age groups that are most secure financially, with 100.0% of males and 100.0% of females in these age groups living above the poverty line.
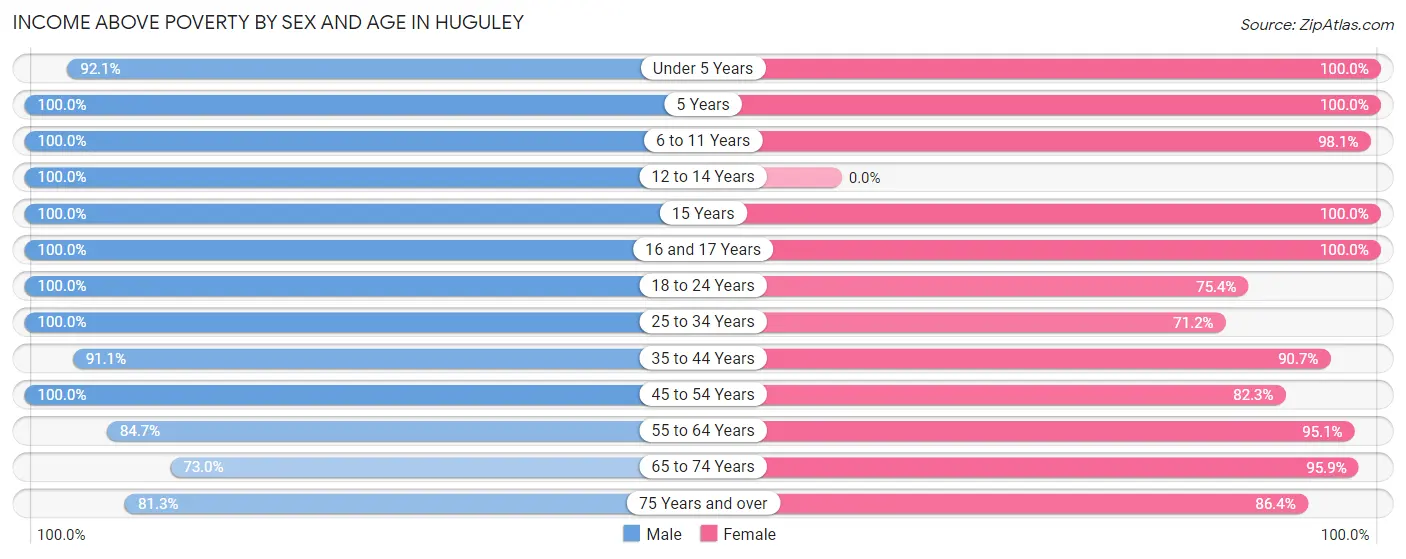
| Age Bracket | Male | Female |
| Under 5 Years | 151 (92.1%) | 56 (100.0%) |
| 5 Years | 7 (100.0%) | 12 (100.0%) |
| 6 to 11 Years | 50 (100.0%) | 153 (98.1%) |
| 12 to 14 Years | 63 (100.0%) | 0 (0.0%) |
| 15 Years | 49 (100.0%) | 35 (100.0%) |
| 16 and 17 Years | 35 (100.0%) | 91 (100.0%) |
| 18 to 24 Years | 116 (100.0%) | 129 (75.4%) |
| 25 to 34 Years | 129 (100.0%) | 89 (71.2%) |
| 35 to 44 Years | 163 (91.1%) | 126 (90.6%) |
| 45 to 54 Years | 177 (100.0%) | 191 (82.3%) |
| 55 to 64 Years | 255 (84.7%) | 235 (95.1%) |
| 65 to 74 Years | 89 (73.0%) | 164 (95.9%) |
| 75 Years and over | 61 (81.3%) | 102 (86.4%) |
| Total | 1,345 (91.7%) | 1,383 (89.0%) |
Income Below Poverty Among Married-Couple Families in Huguley
The poverty statistics for married-couple families in Huguley show that 5.1% or 29 of the total 571 families live below the poverty line. Families with 1 or 2 children have the highest poverty rate of 7.5%, comprising of 13 families. On the other hand, families with 3 or 4 children have the lowest poverty rate of 0.0%, which includes 0 families.
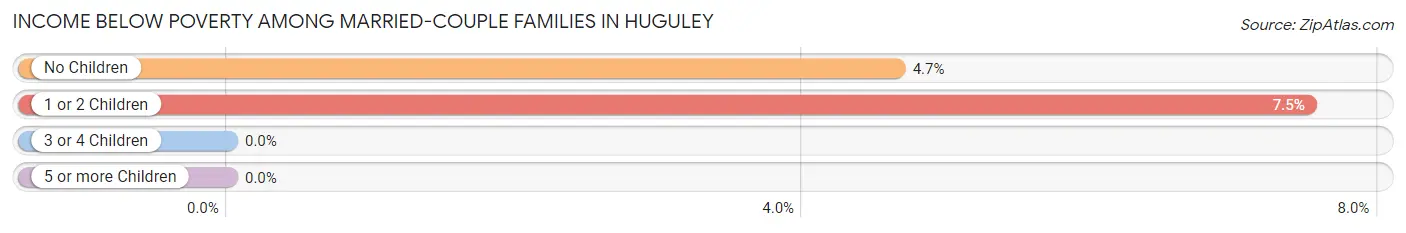
| Children | Above Poverty | Below Poverty |
| No Children | 328 (95.4%) | 16 (4.6%) |
| 1 or 2 Children | 160 (92.5%) | 13 (7.5%) |
| 3 or 4 Children | 26 (100.0%) | 0 (0.0%) |
| 5 or more Children | 28 (100.0%) | 0 (0.0%) |
| Total | 542 (94.9%) | 29 (5.1%) |
Income Below Poverty Among Single-Parent Households in Huguley
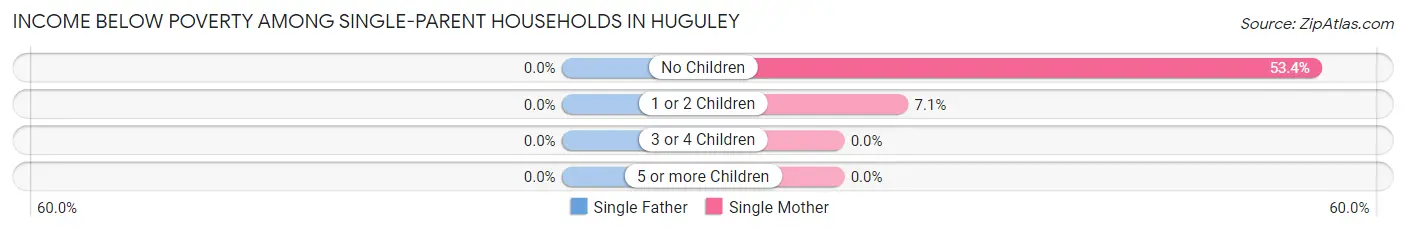
| Children | Single Father | Single Mother |
| No Children | 0 (0.0%) | 39 (53.4%) |
| 1 or 2 Children | 0 (0.0%) | 2 (7.1%) |
| 3 or 4 Children | 0 (0.0%) | 0 (0.0%) |
| 5 or more Children | 0 (0.0%) | 0 (0.0%) |
| Total | 0 (0.0%) | 41 (40.6%) |
Income Below Poverty Among Married-Couple vs Single-Parent Households in Huguley
The poverty data for Huguley shows that 29 of the married-couple family households (5.1%) and 41 of the single-parent households (27.9%) are living below the poverty level. Within the married-couple family households, those with 1 or 2 children have the highest poverty rate, with 13 households (7.5%) falling below the poverty line. Among the single-parent households, those with no children have the highest poverty rate, with 39 household (45.9%) living below poverty.
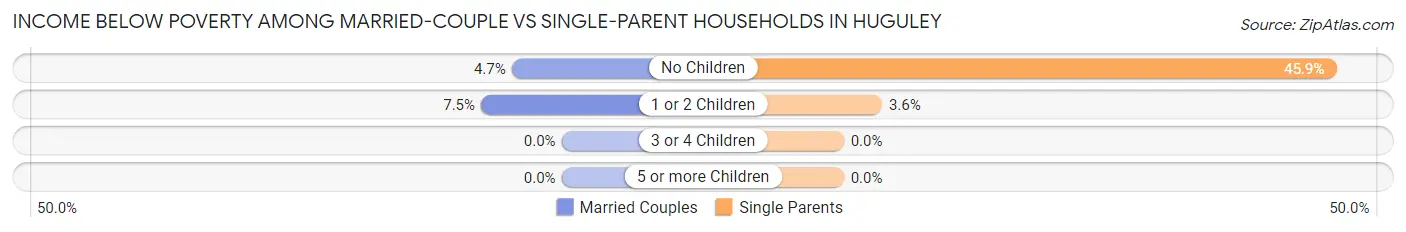
| Children | Married-Couple Families | Single-Parent Households |
| No Children | 16 (4.6%) | 39 (45.9%) |
| 1 or 2 Children | 13 (7.5%) | 2 (3.6%) |
| 3 or 4 Children | 0 (0.0%) | 0 (0.0%) |
| 5 or more Children | 0 (0.0%) | 0 (0.0%) |
| Total | 29 (5.1%) | 41 (27.9%) |
Race in Huguley
The most populous races in Huguley are White / Caucasian (2,489 | 82.4%), Black / African American (457 | 15.1%), and Two or more Races (74 | 2.5%).
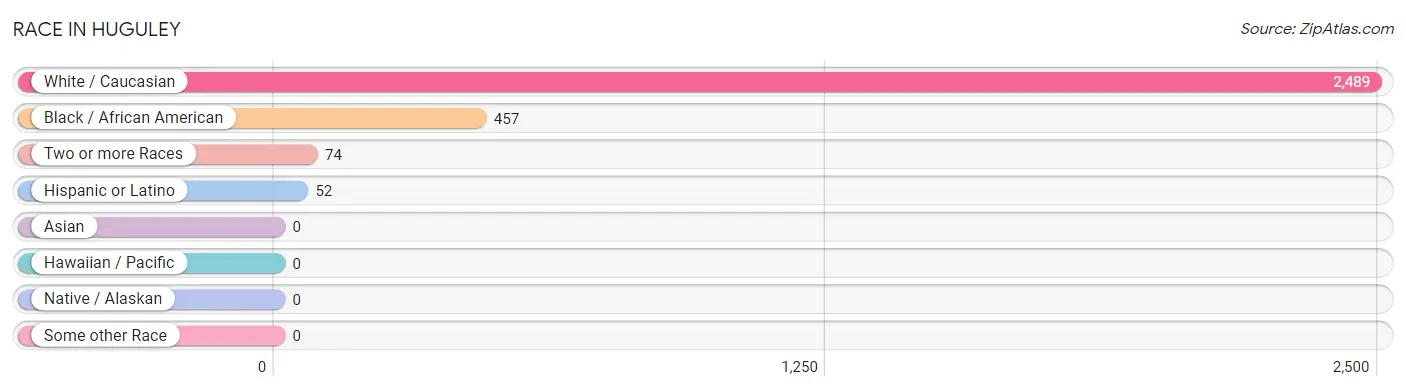
| Race | # Population | % Population |
| Asian | 0 | 0.0% |
| Black / African American | 457 | 15.1% |
| Hawaiian / Pacific | 0 | 0.0% |
| Hispanic or Latino | 52 | 1.7% |
| Native / Alaskan | 0 | 0.0% |
| White / Caucasian | 2,489 | 82.4% |
| Two or more Races | 74 | 2.5% |
| Some other Race | 0 | 0.0% |
| Total | 3,020 | 100.0% |
Ancestry in Huguley
The most populous ancestries reported in Huguley are American (852 | 28.2%), English (506 | 16.8%), Irish (256 | 8.5%), German (84 | 2.8%), and European (55 | 1.8%), together accounting for 58.0% of all Huguley residents.
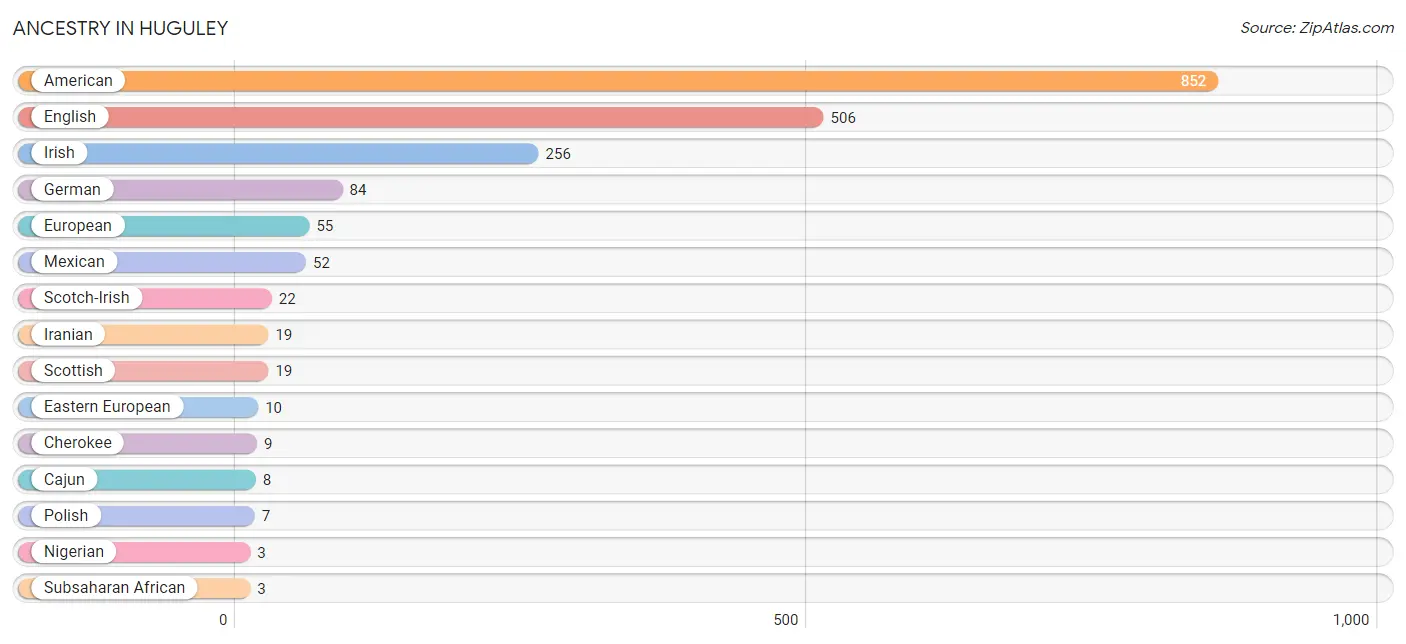
| Ancestry | # Population | % Population |
| American | 852 | 28.2% |
| Cajun | 8 | 0.3% |
| Cherokee | 9 | 0.3% |
| Eastern European | 10 | 0.3% |
| English | 506 | 16.8% |
| European | 55 | 1.8% |
| German | 84 | 2.8% |
| Iranian | 19 | 0.6% |
| Irish | 256 | 8.5% |
| Mexican | 52 | 1.7% |
| Nigerian | 3 | 0.1% |
| Polish | 7 | 0.2% |
| Scotch-Irish | 22 | 0.7% |
| Scottish | 19 | 0.6% |
| Subsaharan African | 3 | 0.1% | View All 15 Rows |
Immigrants in Huguley
The most numerous immigrant groups reported in Huguley came from Asia (19 | 0.6%), Iran (19 | 0.6%), and South Central Asia (19 | 0.6%), together accounting for 1.9% of all Huguley residents.
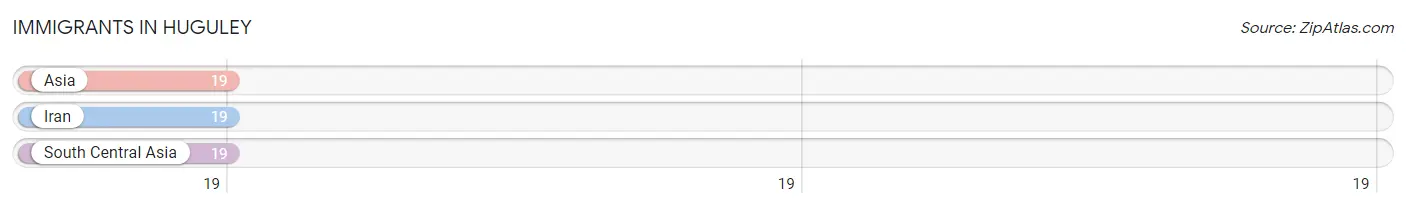
| Immigration Origin | # Population | % Population |
| Asia | 19 | 0.6% |
| Iran | 19 | 0.6% |
| South Central Asia | 19 | 0.6% | View All 3 Rows |
Sex and Age in Huguley
Sex and Age in Huguley
The most populous age groups in Huguley are 60 to 64 Years (224 | 15.3%) for men and 60 to 64 Years (178 | 11.5%) for women.
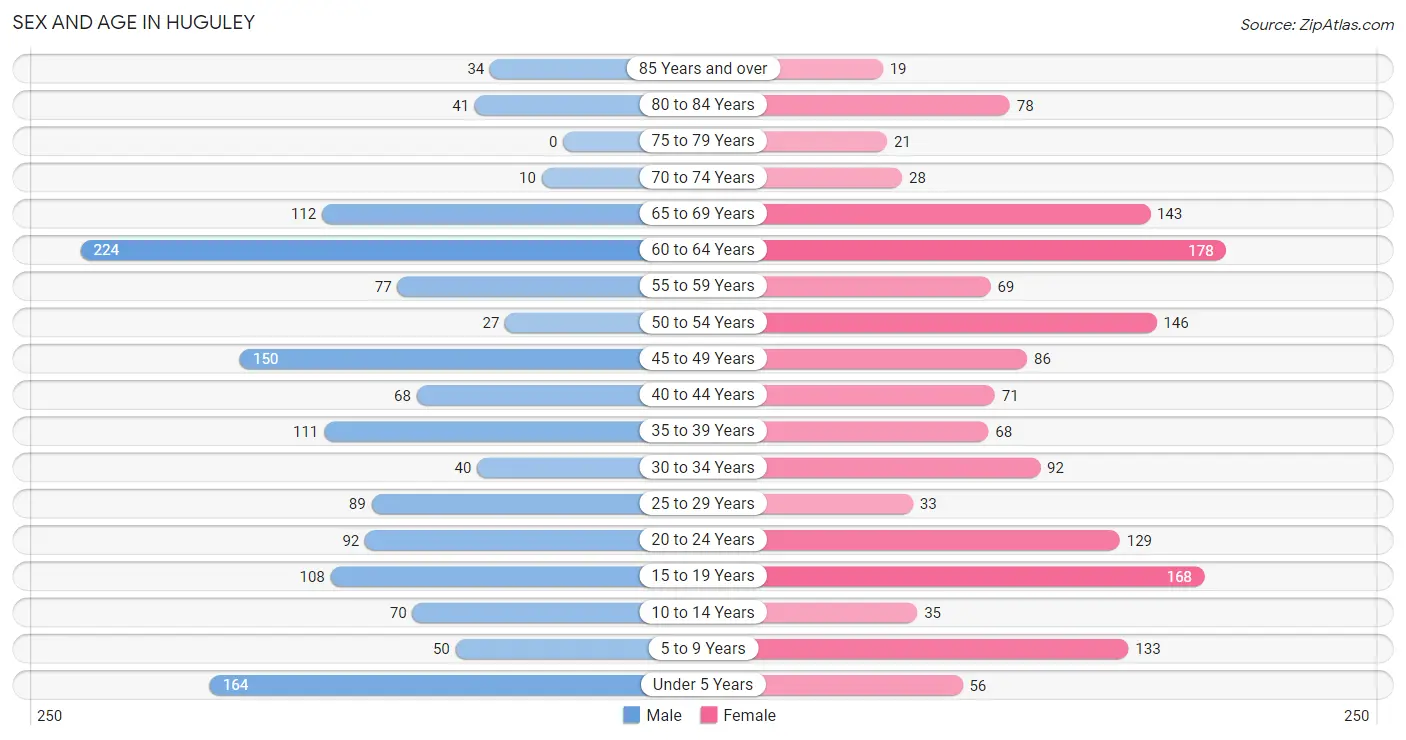
| Age Bracket | Male | Female |
| Under 5 Years | 164 (11.2%) | 56 (3.6%) |
| 5 to 9 Years | 50 (3.4%) | 133 (8.6%) |
| 10 to 14 Years | 70 (4.8%) | 35 (2.2%) |
| 15 to 19 Years | 108 (7.4%) | 168 (10.8%) |
| 20 to 24 Years | 92 (6.3%) | 129 (8.3%) |
| 25 to 29 Years | 89 (6.1%) | 33 (2.1%) |
| 30 to 34 Years | 40 (2.7%) | 92 (5.9%) |
| 35 to 39 Years | 111 (7.6%) | 68 (4.4%) |
| 40 to 44 Years | 68 (4.6%) | 71 (4.6%) |
| 45 to 49 Years | 150 (10.2%) | 86 (5.5%) |
| 50 to 54 Years | 27 (1.8%) | 146 (9.4%) |
| 55 to 59 Years | 77 (5.2%) | 69 (4.4%) |
| 60 to 64 Years | 224 (15.3%) | 178 (11.5%) |
| 65 to 69 Years | 112 (7.6%) | 143 (9.2%) |
| 70 to 74 Years | 10 (0.7%) | 28 (1.8%) |
| 75 to 79 Years | 0 (0.0%) | 21 (1.3%) |
| 80 to 84 Years | 41 (2.8%) | 78 (5.0%) |
| 85 Years and over | 34 (2.3%) | 19 (1.2%) |
| Total | 1,467 (100.0%) | 1,553 (100.0%) |
Families and Households in Huguley
Median Family Size in Huguley
The median family size in Huguley is 3.58 persons per family, with single male/father families (46 | 6.4%) accounting for the largest median family size of 4.48 persons per family. On the other hand, single female/mother families (101 | 14.1%) represent the smallest median family size with 3.10 persons per family.
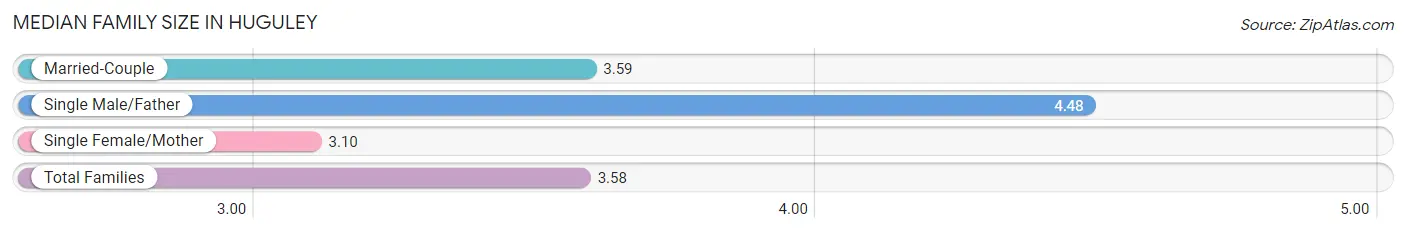
| Family Type | # Families | Family Size |
| Married-Couple | 571 (79.5%) | 3.59 |
| Single Male/Father | 46 (6.4%) | 4.48 |
| Single Female/Mother | 101 (14.1%) | 3.10 |
| Total Families | 718 (100.0%) | 3.58 |
Median Household Size in Huguley
The median household size in Huguley is 3.02 persons per household, with single male/father households (46 | 4.6%) accounting for the largest median household size of 4.98 persons per household. non-family households (281 | 28.1%) represent the smallest median household size with 1.21 persons per household.
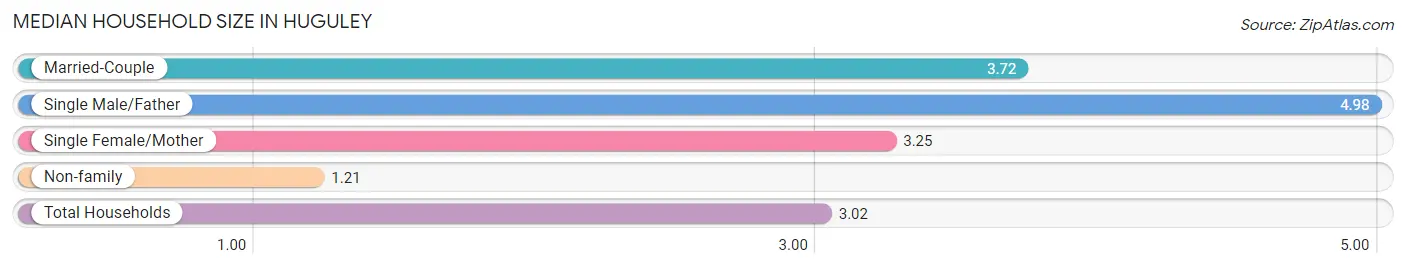
| Household Type | # Households | Household Size |
| Married-Couple | 571 (57.2%) | 3.72 |
| Single Male/Father | 46 (4.6%) | 4.98 |
| Single Female/Mother | 101 (10.1%) | 3.25 |
| Non-family | 281 (28.1%) | 1.21 |
| Total Households | 999 (100.0%) | 3.02 |
Household Size by Marriage Status in Huguley
Out of a total of 999 households in Huguley, 718 (71.9%) are family households, while 281 (28.1%) are nonfamily households. The most numerous type of family households are 2-person households, comprising 338, and the most common type of nonfamily households are 1-person households, comprising 222.
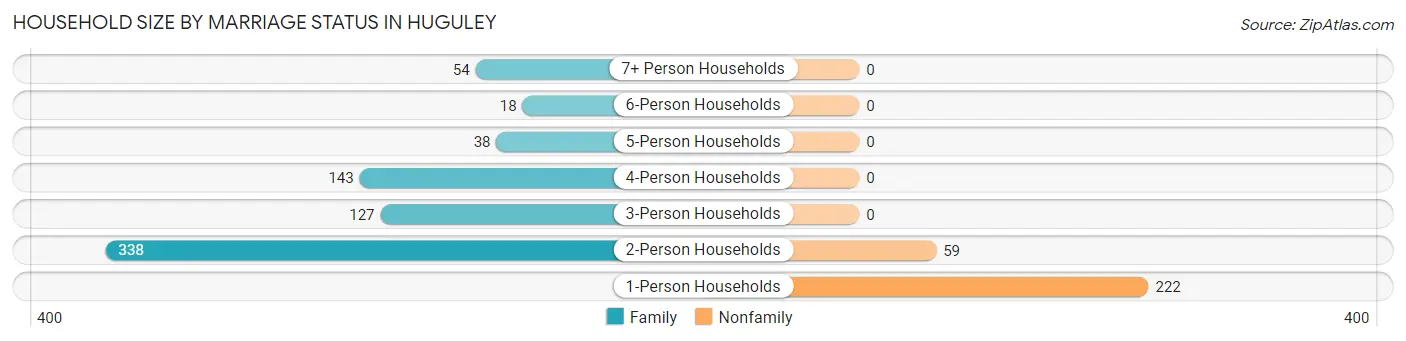
| Household Size | Family Households | Nonfamily Households |
| 1-Person Households | - | 222 (22.2%) |
| 2-Person Households | 338 (33.8%) | 59 (5.9%) |
| 3-Person Households | 127 (12.7%) | 0 (0.0%) |
| 4-Person Households | 143 (14.3%) | 0 (0.0%) |
| 5-Person Households | 38 (3.8%) | 0 (0.0%) |
| 6-Person Households | 18 (1.8%) | 0 (0.0%) |
| 7+ Person Households | 54 (5.4%) | 0 (0.0%) |
| Total | 718 (71.9%) | 281 (28.1%) |
Female Fertility in Huguley
Fertility by Age in Huguley
Average fertility rate in Huguley is 128.0 births per 1,000 women. Women in the age bracket of 20 to 34 years have the highest fertility rate with 236.0 births per 1,000 women. Women in the age bracket of 20 to 34 years acount for 65.9% of all women with births.
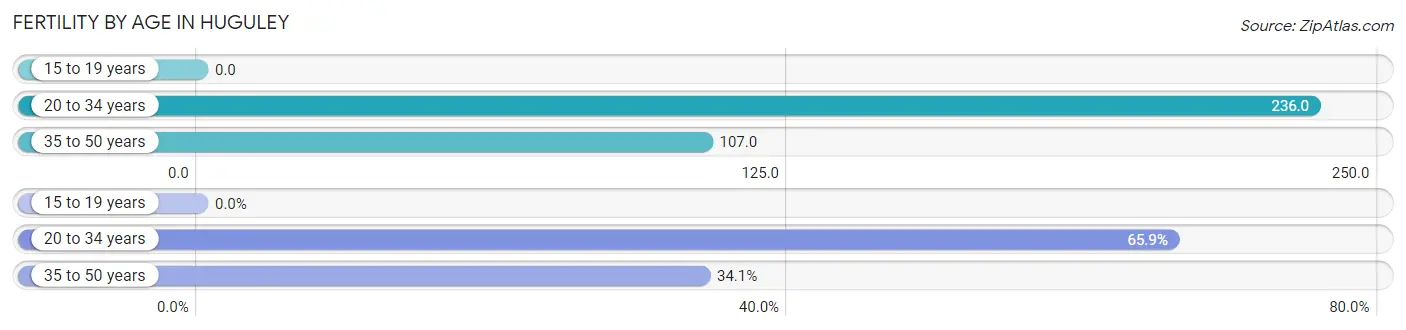
| Age Bracket | Women with Births | Births / 1,000 Women |
| 15 to 19 years | 0 (0.0%) | 0.0 |
| 20 to 34 years | 60 (65.9%) | 236.0 |
| 35 to 50 years | 31 (34.1%) | 107.0 |
| Total | 91 (100.0%) | 128.0 |
Fertility by Age by Marriage Status in Huguley
34.1% of women with births (91) in Huguley are married. The highest percentage of unmarried women with births falls into 20 to 34 years age bracket with 100.0% of them unmarried at the time of birth, while the lowest percentage of unmarried women with births belong to 35 to 50 years age bracket with 0.0% of them unmarried.
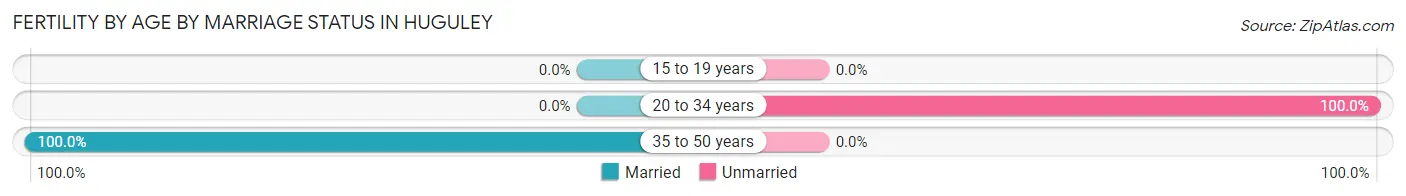
| Age Bracket | Married | Unmarried |
| 15 to 19 years | 0 (0.0%) | 0 (0.0%) |
| 20 to 34 years | 0 (0.0%) | 60 (100.0%) |
| 35 to 50 years | 31 (100.0%) | 0 (0.0%) |
| Total | 31 (34.1%) | 60 (65.9%) |
Fertility by Education in Huguley
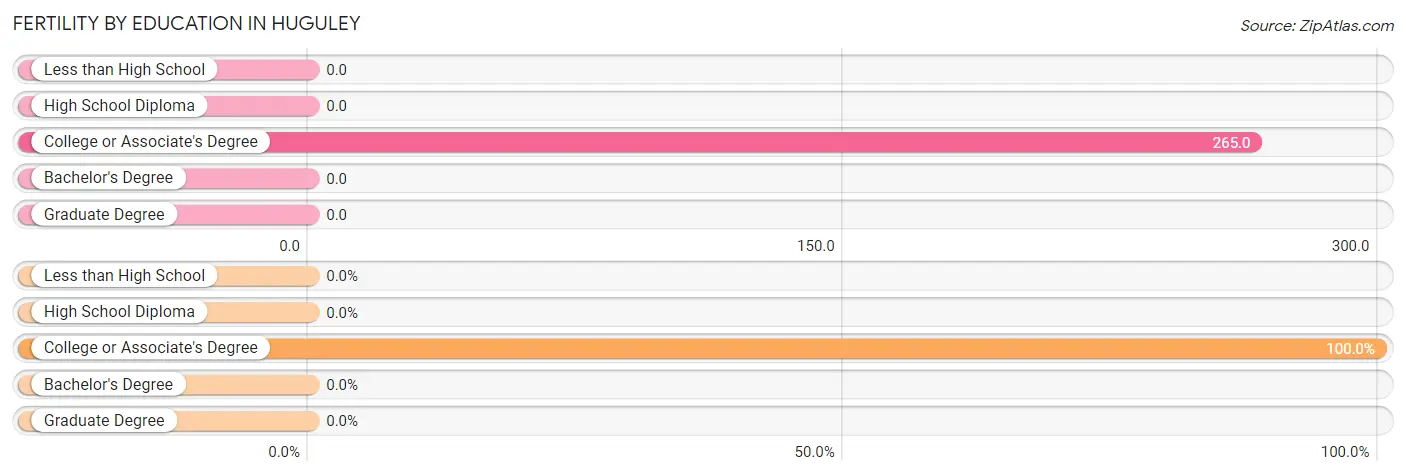
| Educational Attainment | Women with Births | Births / 1,000 Women |
| Less than High School | 0 (0.0%) | 0.0 |
| High School Diploma | 0 (0.0%) | 0.0 |
| College or Associate's Degree | 91 (100.0%) | 265.0 |
| Bachelor's Degree | 0 (0.0%) | 0.0 |
| Graduate Degree | 0 (0.0%) | 0.0 |
| Total | 91 (100.0%) | 128.0 |
Fertility by Education by Marriage Status in Huguley
65.9% of women with births in Huguley are unmarried. Women with the educational attainment of college or associate's degree are most likely to be married with 34.1% of them married at childbirth, while women with the educational attainment of college or associate's degree are least likely to be married with 65.9% of them unmarried at childbirth.
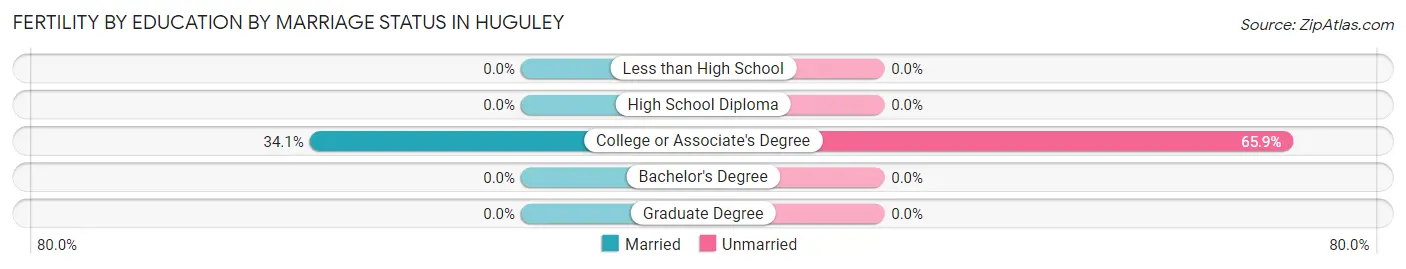
| Educational Attainment | Married | Unmarried |
| Less than High School | 0 (0.0%) | 0 (0.0%) |
| High School Diploma | 0 (0.0%) | 0 (0.0%) |
| College or Associate's Degree | 31 (34.1%) | 60 (65.9%) |
| Bachelor's Degree | 0 (0.0%) | 0 (0.0%) |
| Graduate Degree | 0 (0.0%) | 0 (0.0%) |
| Total | 31 (34.1%) | 60 (65.9%) |
Employment Characteristics in Huguley
Employment by Class of Employer in Huguley
Among the 1,365 employed individuals in Huguley, private company employees (927 | 67.9%), self-employed (not incorporated) (216 | 15.8%), and not-for-profit organizations (83 | 6.1%) make up the most common classes of employment.
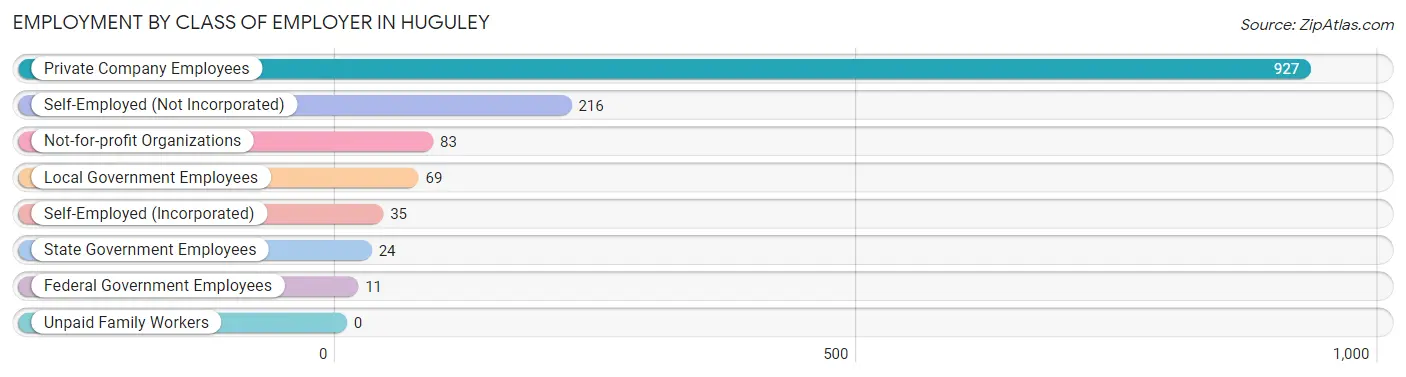
| Employer Class | # Employees | % Employees |
| Private Company Employees | 927 | 67.9% |
| Self-Employed (Incorporated) | 35 | 2.6% |
| Self-Employed (Not Incorporated) | 216 | 15.8% |
| Not-for-profit Organizations | 83 | 6.1% |
| Local Government Employees | 69 | 5.1% |
| State Government Employees | 24 | 1.8% |
| Federal Government Employees | 11 | 0.8% |
| Unpaid Family Workers | 0 | 0.0% |
| Total | 1,365 | 100.0% |
Employment Status by Age in Huguley
According to the labor force statistics for Huguley, out of the total population over 16 years of age (2,428), 59.5% or 1,445 individuals are in the labor force, with 2.6% or 38 of them unemployed. The age group with the highest labor force participation rate is 20 to 24 years, with 100.0% or 221 individuals in the labor force. Within the labor force, the 20 to 24 years age range has the highest percentage of unemployed individuals, with 10.9% or 24 of them being unemployed.
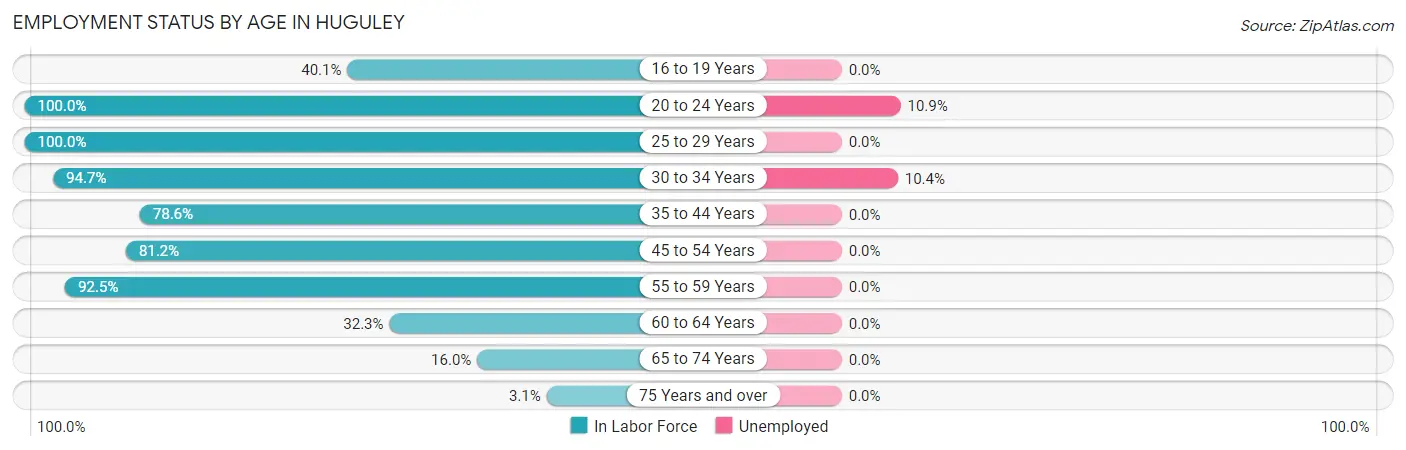
| Age Bracket | In Labor Force | Unemployed |
| 16 to 19 Years | 77 (40.1%) | 0 (0.0%) |
| 20 to 24 Years | 221 (100.0%) | 24 (10.9%) |
| 25 to 29 Years | 122 (100.0%) | 0 (0.0%) |
| 30 to 34 Years | 125 (94.7%) | 13 (10.4%) |
| 35 to 44 Years | 250 (78.6%) | 0 (0.0%) |
| 45 to 54 Years | 332 (81.2%) | 0 (0.0%) |
| 55 to 59 Years | 135 (92.5%) | 0 (0.0%) |
| 60 to 64 Years | 130 (32.3%) | 0 (0.0%) |
| 65 to 74 Years | 47 (16.0%) | 0 (0.0%) |
| 75 Years and over | 6 (3.1%) | 0 (0.0%) |
| Total | 1,445 (59.5%) | 38 (2.6%) |
Employment Status by Educational Attainment in Huguley
According to labor force statistics for Huguley, 71.6% of individuals (1,095) out of the total population between 25 and 64 years of age (1,529) are in the labor force, with 1.2% or 13 of them being unemployed. The group with the highest labor force participation rate are those with the educational attainment of bachelor's degree or higher, with 85.5% or 112 individuals in the labor force. Within the labor force, individuals with college / associate degree education have the highest percentage of unemployment, with 2.9% or 13 of them being unemployed.
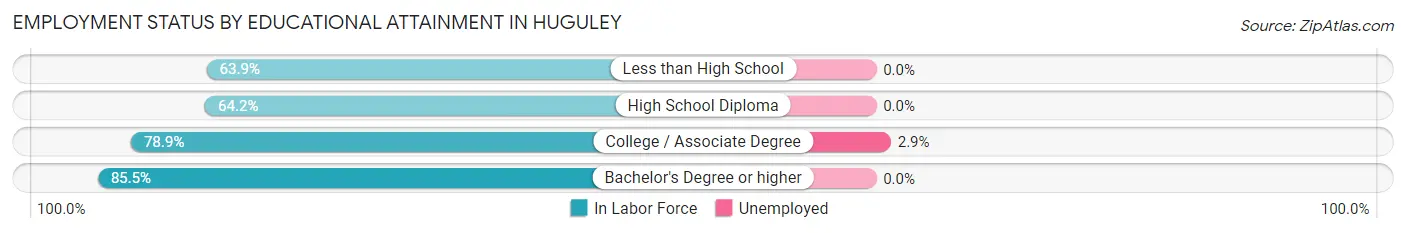
| Educational Attainment | In Labor Force | Unemployed |
| Less than High School | 101 (63.9%) | 0 (0.0%) |
| High School Diploma | 425 (64.2%) | 0 (0.0%) |
| College / Associate Degree | 456 (78.9%) | 17 (2.9%) |
| Bachelor's Degree or higher | 112 (85.5%) | 0 (0.0%) |
| Total | 1,095 (71.6%) | 18 (1.2%) |
Employment Occupations by Sex in Huguley
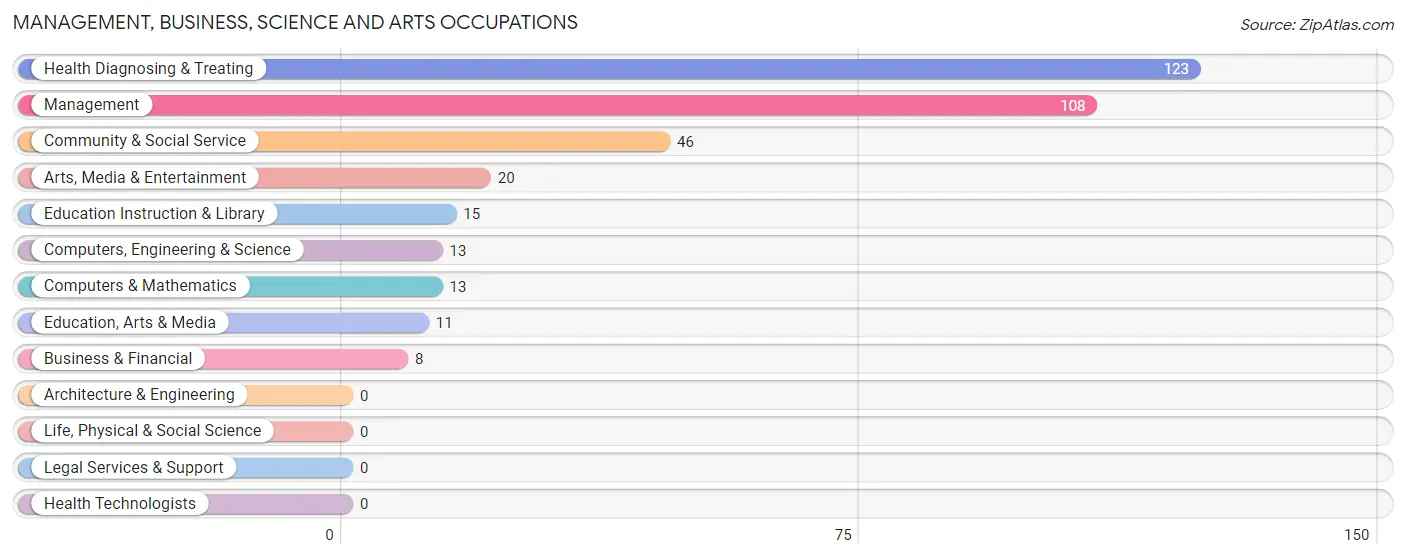
Management, Business, Science and Arts Occupations
The most common Management, Business, Science and Arts occupations in Huguley are Health Diagnosing & Treating (123 | 8.7%), Management (108 | 7.7%), Community & Social Service (46 | 3.3%), Arts, Media & Entertainment (20 | 1.4%), and Education Instruction & Library (15 | 1.1%).
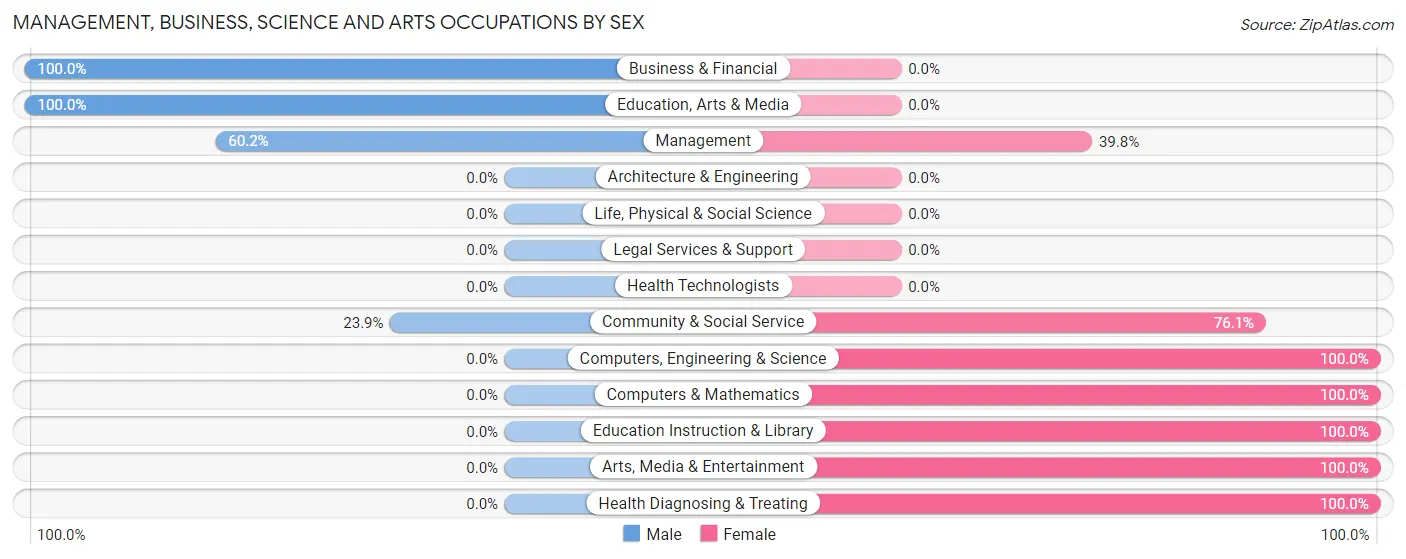
Management, Business, Science and Arts Occupations by Sex
Within the Management, Business, Science and Arts occupations in Huguley, the most male-oriented occupations are Business & Financial (100.0%), Education, Arts & Media (100.0%), and Management (60.2%), while the most female-oriented occupations are Computers, Engineering & Science (100.0%), Computers & Mathematics (100.0%), and Education Instruction & Library (100.0%).
| Occupation | Male | Female |
| Management | 65 (60.2%) | 43 (39.8%) |
| Business & Financial | 8 (100.0%) | 0 (0.0%) |
| Computers, Engineering & Science | 0 (0.0%) | 13 (100.0%) |
| Computers & Mathematics | 0 (0.0%) | 13 (100.0%) |
| Architecture & Engineering | 0 (0.0%) | 0 (0.0%) |
| Life, Physical & Social Science | 0 (0.0%) | 0 (0.0%) |
| Community & Social Service | 11 (23.9%) | 35 (76.1%) |
| Education, Arts & Media | 11 (100.0%) | 0 (0.0%) |
| Legal Services & Support | 0 (0.0%) | 0 (0.0%) |
| Education Instruction & Library | 0 (0.0%) | 15 (100.0%) |
| Arts, Media & Entertainment | 0 (0.0%) | 20 (100.0%) |
| Health Diagnosing & Treating | 0 (0.0%) | 123 (100.0%) |
| Health Technologists | 0 (0.0%) | 0 (0.0%) |
| Total (Category) | 84 (28.2%) | 214 (71.8%) |
| Total (Overall) | 770 (54.7%) | 638 (45.3%) |
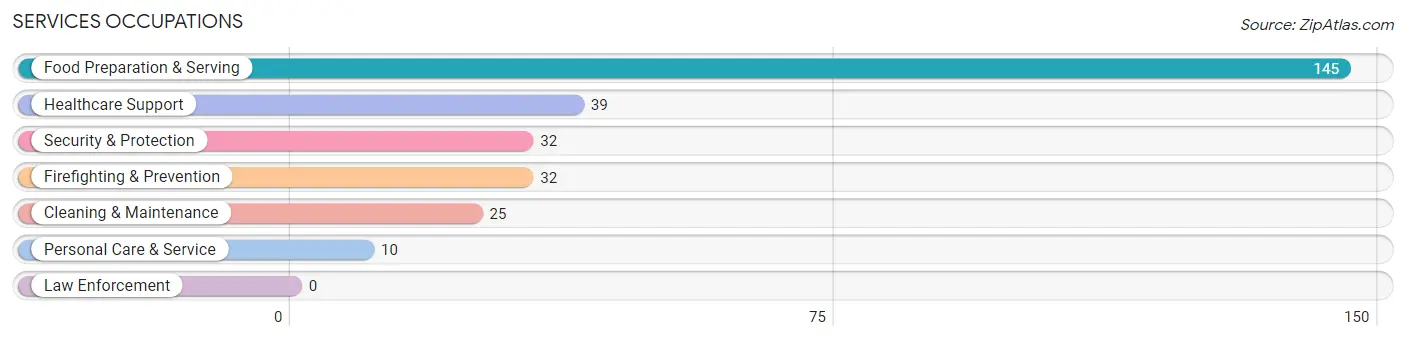
Services Occupations
The most common Services occupations in Huguley are Food Preparation & Serving (145 | 10.3%), Healthcare Support (39 | 2.8%), Security & Protection (32 | 2.3%), Firefighting & Prevention (32 | 2.3%), and Cleaning & Maintenance (25 | 1.8%).
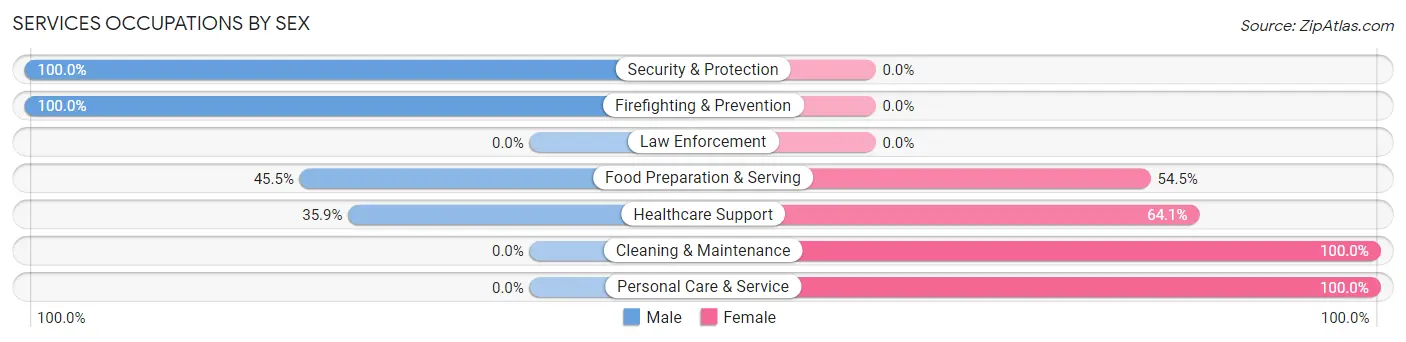
Services Occupations by Sex
Within the Services occupations in Huguley, the most male-oriented occupations are Security & Protection (100.0%), Firefighting & Prevention (100.0%), and Food Preparation & Serving (45.5%), while the most female-oriented occupations are Cleaning & Maintenance (100.0%), Personal Care & Service (100.0%), and Healthcare Support (64.1%).
| Occupation | Male | Female |
| Healthcare Support | 14 (35.9%) | 25 (64.1%) |
| Security & Protection | 32 (100.0%) | 0 (0.0%) |
| Firefighting & Prevention | 32 (100.0%) | 0 (0.0%) |
| Law Enforcement | 0 (0.0%) | 0 (0.0%) |
| Food Preparation & Serving | 66 (45.5%) | 79 (54.5%) |
| Cleaning & Maintenance | 0 (0.0%) | 25 (100.0%) |
| Personal Care & Service | 0 (0.0%) | 10 (100.0%) |
| Total (Category) | 112 (44.6%) | 139 (55.4%) |
| Total (Overall) | 770 (54.7%) | 638 (45.3%) |
Sales and Office Occupations
The most common Sales and Office occupations in Huguley are Office & Administration (189 | 13.4%), and Sales & Related (69 | 4.9%).
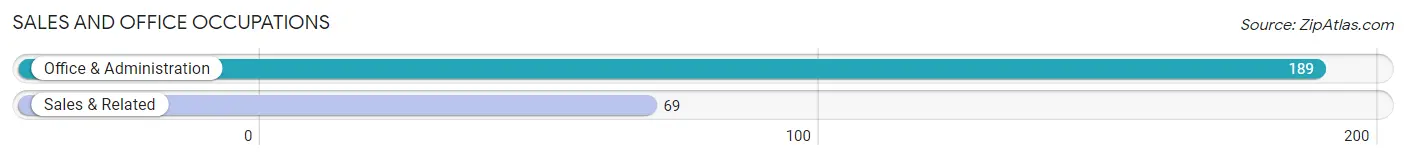
Sales and Office Occupations by Sex
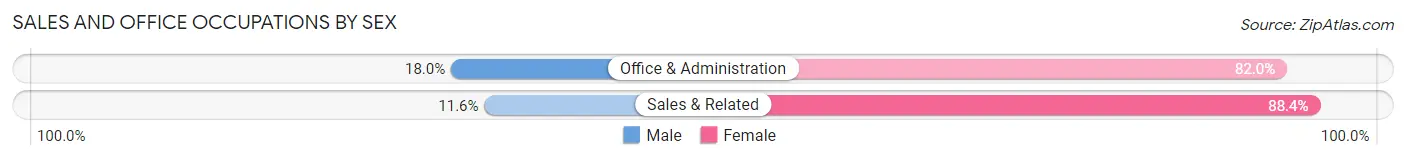
| Occupation | Male | Female |
| Sales & Related | 8 (11.6%) | 61 (88.4%) |
| Office & Administration | 34 (18.0%) | 155 (82.0%) |
| Total (Category) | 42 (16.3%) | 216 (83.7%) |
| Total (Overall) | 770 (54.7%) | 638 (45.3%) |
Natural Resources, Construction and Maintenance Occupations
The most common Natural Resources, Construction and Maintenance occupations in Huguley are Installation, Maintenance & Repair (131 | 9.3%), and Construction & Extraction (88 | 6.2%).
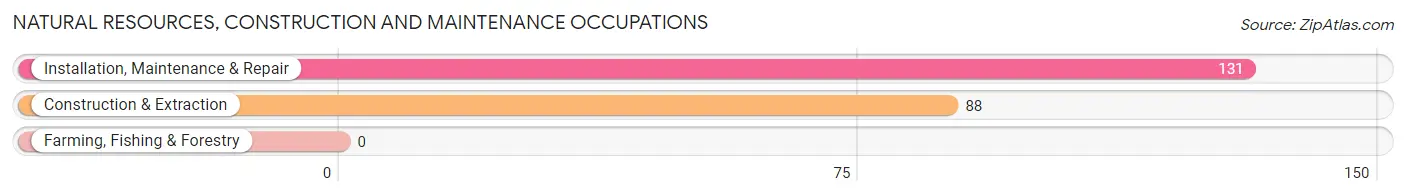
Natural Resources, Construction and Maintenance Occupations by Sex
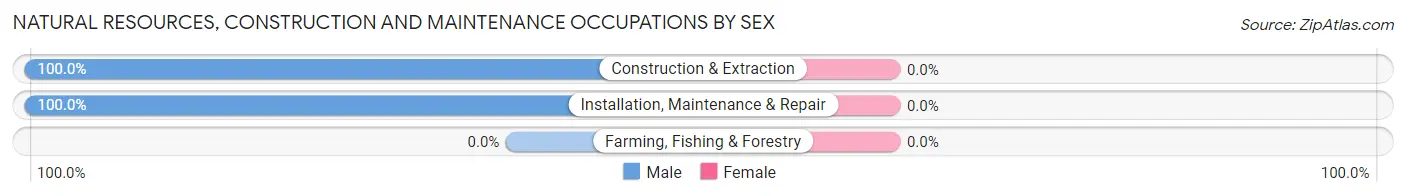
| Occupation | Male | Female |
| Farming, Fishing & Forestry | 0 (0.0%) | 0 (0.0%) |
| Construction & Extraction | 88 (100.0%) | 0 (0.0%) |
| Installation, Maintenance & Repair | 131 (100.0%) | 0 (0.0%) |
| Total (Category) | 219 (100.0%) | 0 (0.0%) |
| Total (Overall) | 770 (54.7%) | 638 (45.3%) |
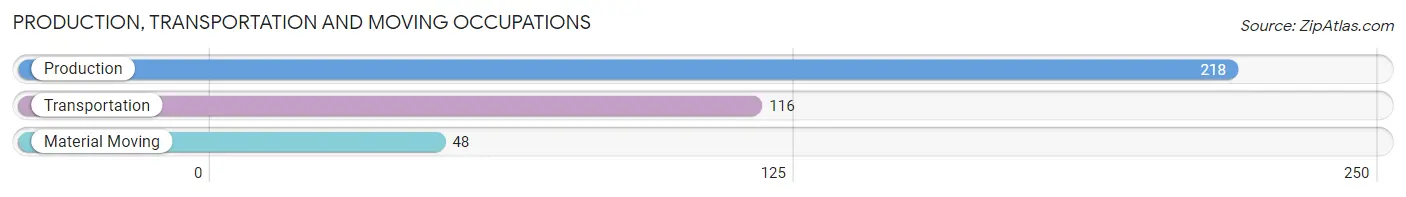
Production, Transportation and Moving Occupations
The most common Production, Transportation and Moving occupations in Huguley are Production (218 | 15.5%), Transportation (116 | 8.2%), and Material Moving (48 | 3.4%).
Production, Transportation and Moving Occupations by Sex
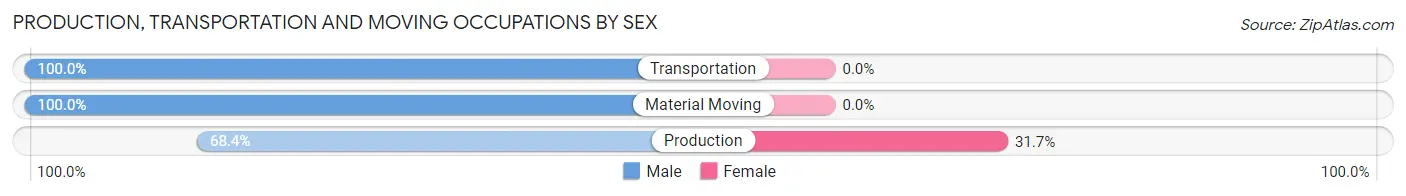
| Occupation | Male | Female |
| Production | 149 (68.3%) | 69 (31.7%) |
| Transportation | 116 (100.0%) | 0 (0.0%) |
| Material Moving | 48 (100.0%) | 0 (0.0%) |
| Total (Category) | 313 (81.9%) | 69 (18.1%) |
| Total (Overall) | 770 (54.7%) | 638 (45.3%) |
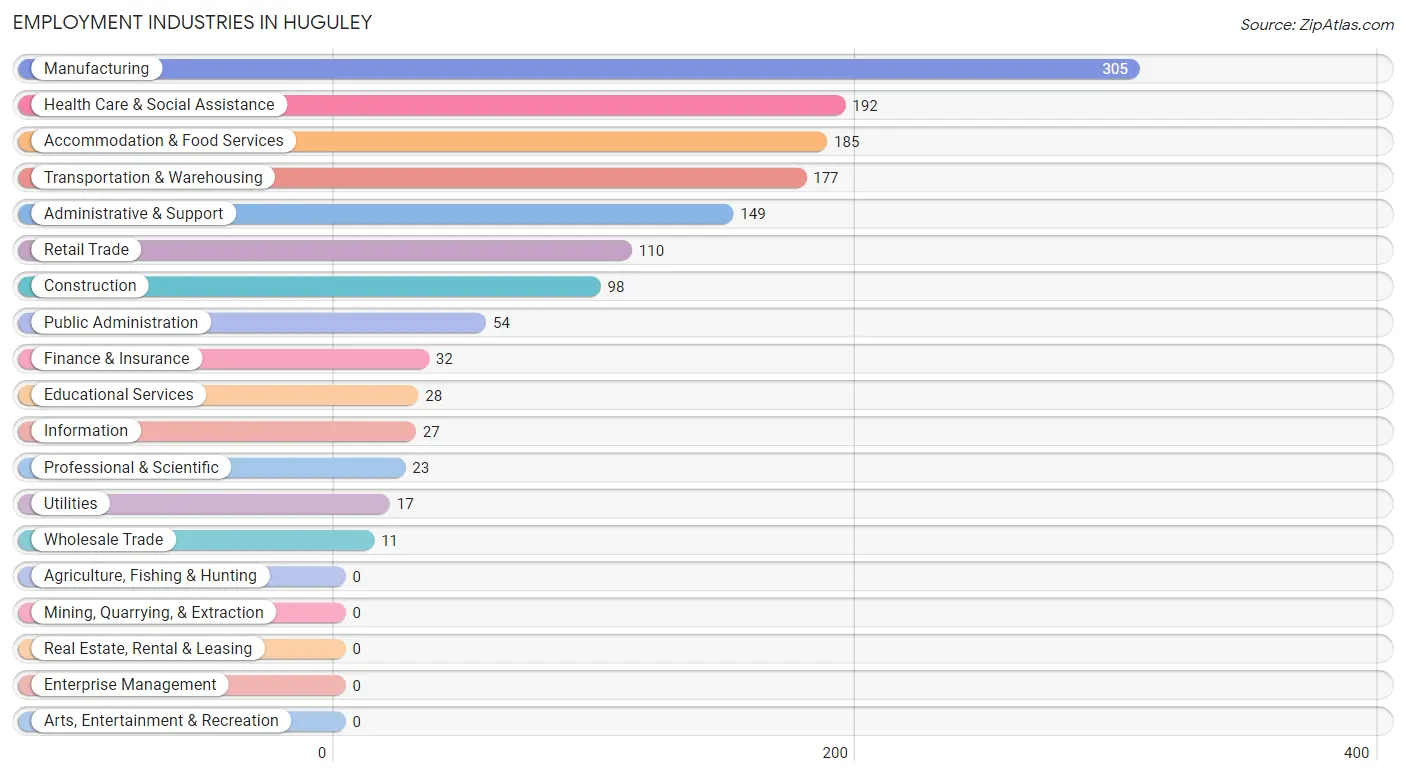
Employment Industries by Sex in Huguley
Employment Industries in Huguley
The major employment industries in Huguley include Manufacturing (305 | 21.7%), Health Care & Social Assistance (192 | 13.6%), Accommodation & Food Services (185 | 13.1%), Transportation & Warehousing (177 | 12.6%), and Administrative & Support (149 | 10.6%).
Employment Industries by Sex in Huguley
The Huguley industries that see more men than women are Construction (100.0%), Wholesale Trade (100.0%), and Transportation & Warehousing (100.0%), whereas the industries that tend to have a higher number of women are Educational Services (100.0%), Health Care & Social Assistance (87.5%), and Administrative & Support (85.9%).
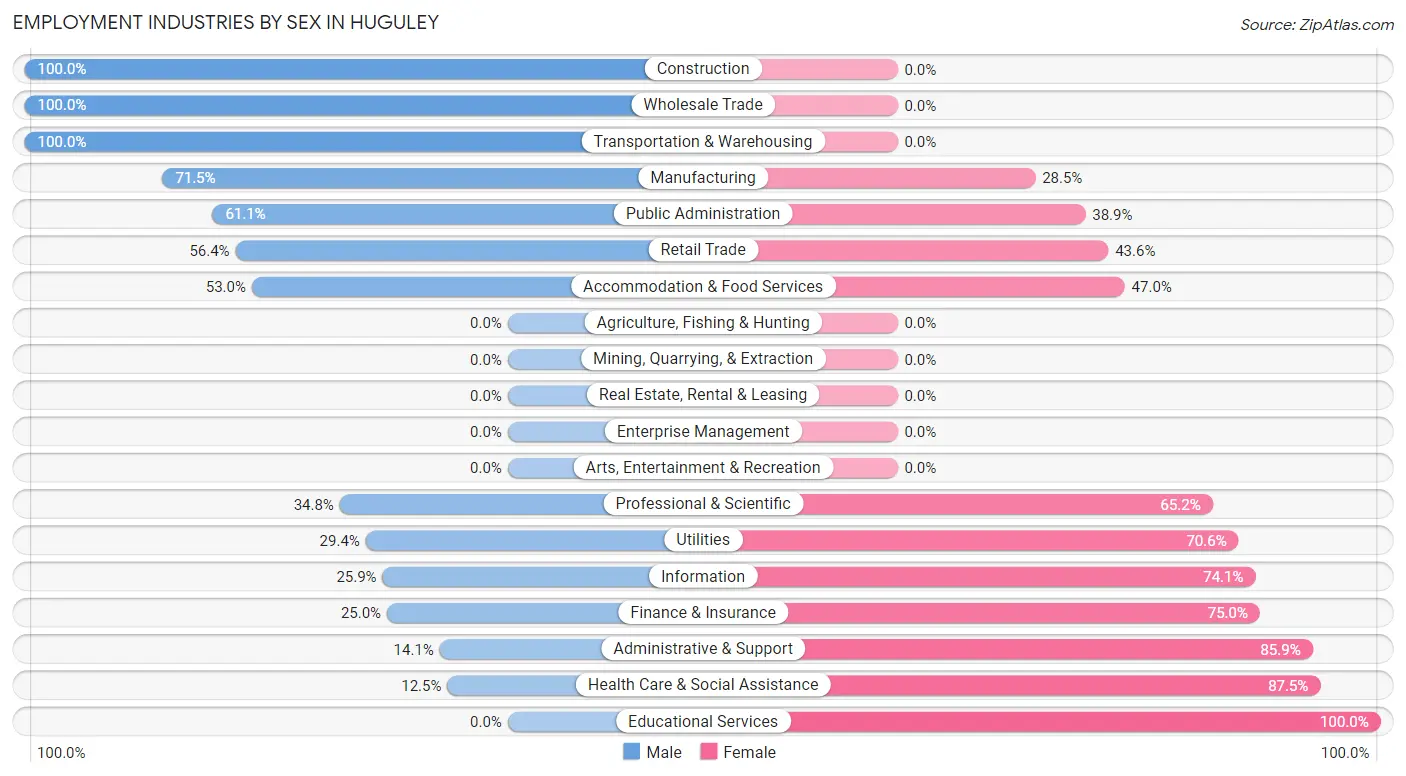
| Industry | Male | Female |
| Agriculture, Fishing & Hunting | 0 (0.0%) | 0 (0.0%) |
| Mining, Quarrying, & Extraction | 0 (0.0%) | 0 (0.0%) |
| Construction | 98 (100.0%) | 0 (0.0%) |
| Manufacturing | 218 (71.5%) | 87 (28.5%) |
| Wholesale Trade | 11 (100.0%) | 0 (0.0%) |
| Retail Trade | 62 (56.4%) | 48 (43.6%) |
| Transportation & Warehousing | 177 (100.0%) | 0 (0.0%) |
| Utilities | 5 (29.4%) | 12 (70.6%) |
| Information | 7 (25.9%) | 20 (74.1%) |
| Finance & Insurance | 8 (25.0%) | 24 (75.0%) |
| Real Estate, Rental & Leasing | 0 (0.0%) | 0 (0.0%) |
| Professional & Scientific | 8 (34.8%) | 15 (65.2%) |
| Enterprise Management | 0 (0.0%) | 0 (0.0%) |
| Administrative & Support | 21 (14.1%) | 128 (85.9%) |
| Educational Services | 0 (0.0%) | 28 (100.0%) |
| Health Care & Social Assistance | 24 (12.5%) | 168 (87.5%) |
| Arts, Entertainment & Recreation | 0 (0.0%) | 0 (0.0%) |
| Accommodation & Food Services | 98 (53.0%) | 87 (47.0%) |
| Public Administration | 33 (61.1%) | 21 (38.9%) |
| Total | 770 (54.7%) | 638 (45.3%) |
Education in Huguley
School Enrollment in Huguley
The most common levels of schooling among the 545 students in Huguley are high school (236 | 43.3%), elementary school (131 | 24.0%), and middle school (81 | 14.9%).

| School Level | # Students | % Students |
| Nursery / Preschool | 17 | 3.1% |
| Kindergarten | 12 | 2.2% |
| Elementary School | 131 | 24.0% |
| Middle School | 81 | 14.9% |
| High School | 236 | 43.3% |
| College / Undergraduate | 68 | 12.5% |
| Graduate / Professional | 0 | 0.0% |
| Total | 545 | 100.0% |
School Enrollment by Age by Funding Source in Huguley
Out of a total of 545 students who are enrolled in schools in Huguley, 41 (7.5%) attend a private institution, while the remaining 504 (92.5%) are enrolled in public schools. The age group of 25 to 34 year olds has the highest likelihood of being enrolled in private schools, with 22 (100.0% in the age bracket) enrolled. Conversely, the age group of 5 to 9 year old has the lowest likelihood of being enrolled in a private school, with 146 (100.0% in the age bracket) attending a public institution.
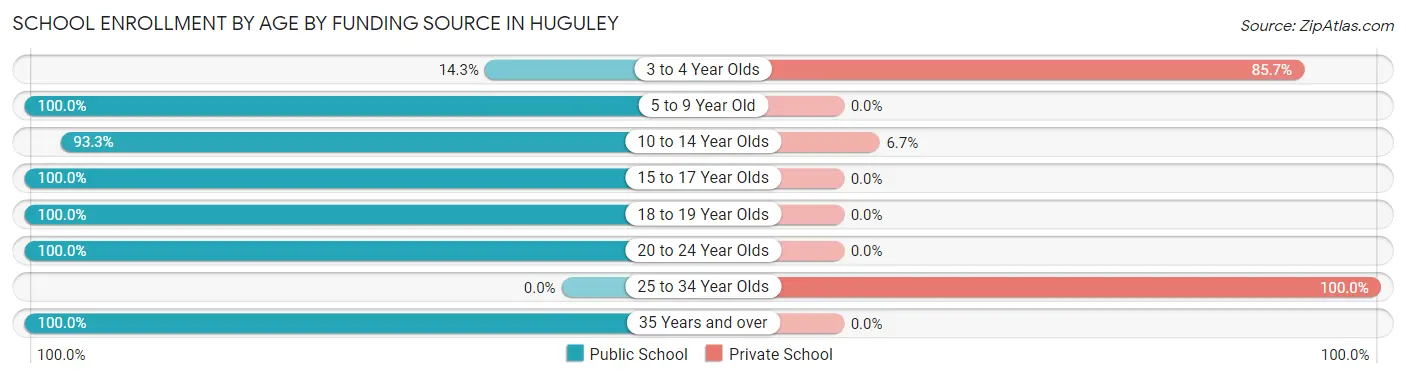
| Age Bracket | Public School | Private School |
| 3 to 4 Year Olds | 2 (14.3%) | 12 (85.7%) |
| 5 to 9 Year Old | 146 (100.0%) | 0 (0.0%) |
| 10 to 14 Year Olds | 98 (93.3%) | 7 (6.7%) |
| 15 to 17 Year Olds | 210 (100.0%) | 0 (0.0%) |
| 18 to 19 Year Olds | 24 (100.0%) | 0 (0.0%) |
| 20 to 24 Year Olds | 9 (100.0%) | 0 (0.0%) |
| 25 to 34 Year Olds | 0 (0.0%) | 22 (100.0%) |
| 35 Years and over | 15 (100.0%) | 0 (0.0%) |
| Total | 504 (92.5%) | 41 (7.5%) |
Educational Attainment by Field of Study in Huguley
Arts & humanities (56 | 29.5%), science & technology (40 | 21.0%), business (40 | 21.0%), education (25 | 13.2%), and computers & mathematics (13 | 6.8%) are the most common fields of study among 190 individuals in Huguley who have obtained a bachelor's degree or higher.
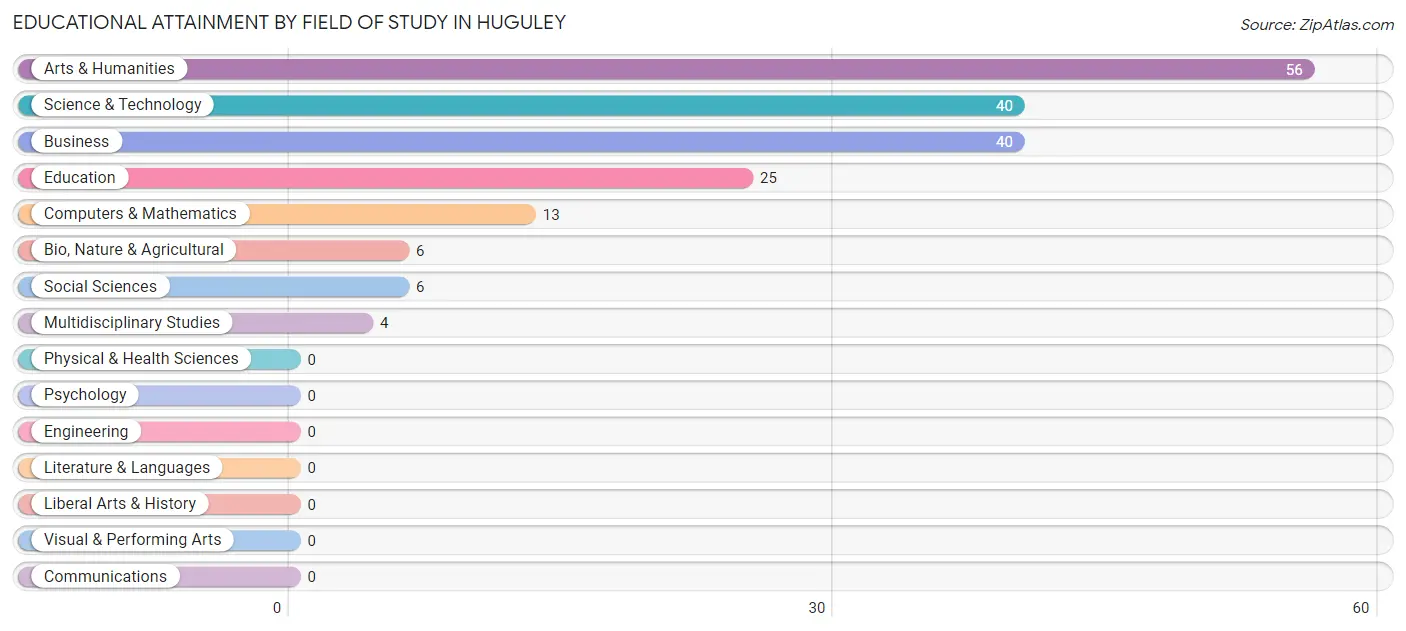
| Field of Study | # Graduates | % Graduates |
| Computers & Mathematics | 13 | 6.8% |
| Bio, Nature & Agricultural | 6 | 3.2% |
| Physical & Health Sciences | 0 | 0.0% |
| Psychology | 0 | 0.0% |
| Social Sciences | 6 | 3.2% |
| Engineering | 0 | 0.0% |
| Multidisciplinary Studies | 4 | 2.1% |
| Science & Technology | 40 | 21.0% |
| Business | 40 | 21.0% |
| Education | 25 | 13.2% |
| Literature & Languages | 0 | 0.0% |
| Liberal Arts & History | 0 | 0.0% |
| Visual & Performing Arts | 0 | 0.0% |
| Communications | 0 | 0.0% |
| Arts & Humanities | 56 | 29.5% |
| Total | 190 | 100.0% |
Transportation & Commute in Huguley
Vehicle Availability by Sex in Huguley
The most prevalent vehicle ownership categories in Huguley are males with 2 vehicles (290, accounting for 39.1%) and females with 2 vehicles (197, making up 46.6%).
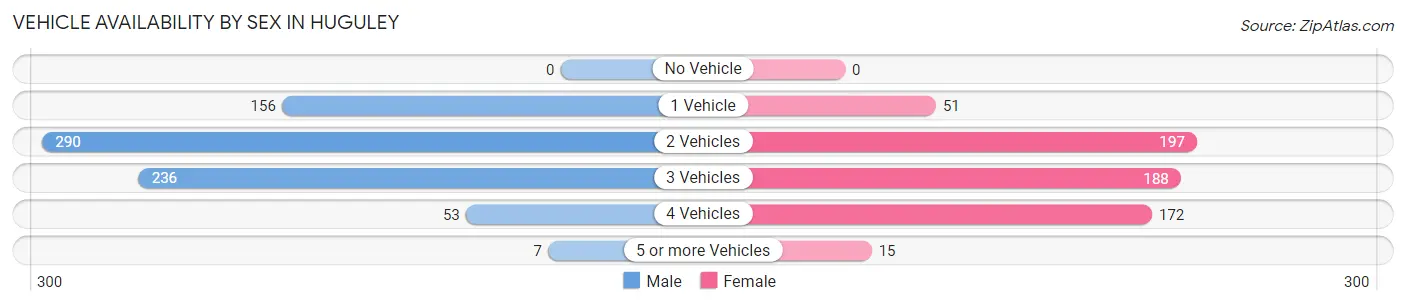
| Vehicles Available | Male | Female |
| No Vehicle | 0 (0.0%) | 0 (0.0%) |
| 1 Vehicle | 156 (21.0%) | 51 (8.2%) |
| 2 Vehicles | 290 (39.1%) | 197 (31.6%) |
| 3 Vehicles | 236 (31.8%) | 188 (30.2%) |
| 4 Vehicles | 53 (7.1%) | 172 (27.6%) |
| 5 or more Vehicles | 7 (0.9%) | 15 (2.4%) |
| Total | 742 (100.0%) | 623 (100.0%) |
Commute Time in Huguley
The most frequently occuring commute durations in Huguley are 10 to 14 minutes (280 commuters, 21.6%), 5 to 9 minutes (266 commuters, 20.5%), and 20 to 24 minutes (182 commuters, 14.0%).
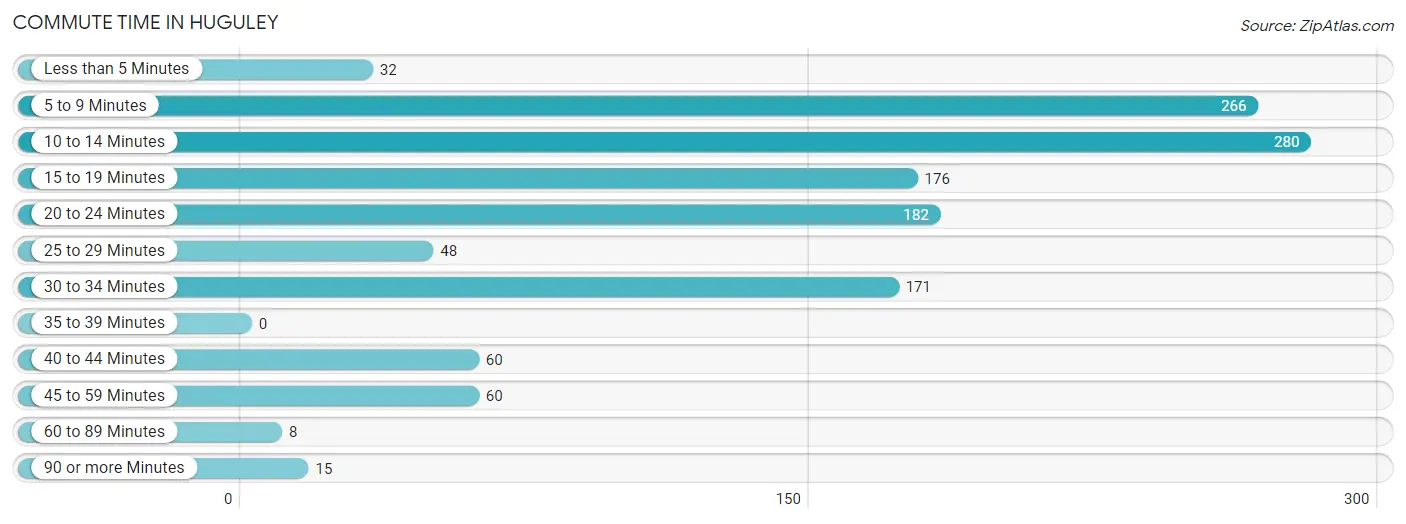
| Commute Time | # Commuters | % Commuters |
| Less than 5 Minutes | 32 | 2.5% |
| 5 to 9 Minutes | 266 | 20.5% |
| 10 to 14 Minutes | 280 | 21.6% |
| 15 to 19 Minutes | 176 | 13.6% |
| 20 to 24 Minutes | 182 | 14.0% |
| 25 to 29 Minutes | 48 | 3.7% |
| 30 to 34 Minutes | 171 | 13.2% |
| 35 to 39 Minutes | 0 | 0.0% |
| 40 to 44 Minutes | 60 | 4.6% |
| 45 to 59 Minutes | 60 | 4.6% |
| 60 to 89 Minutes | 8 | 0.6% |
| 90 or more Minutes | 15 | 1.2% |
Commute Time by Sex in Huguley
The most common commute times in Huguley are 10 to 14 minutes (198 commuters, 27.0%) for males and 5 to 9 minutes (127 commuters, 22.5%) for females.
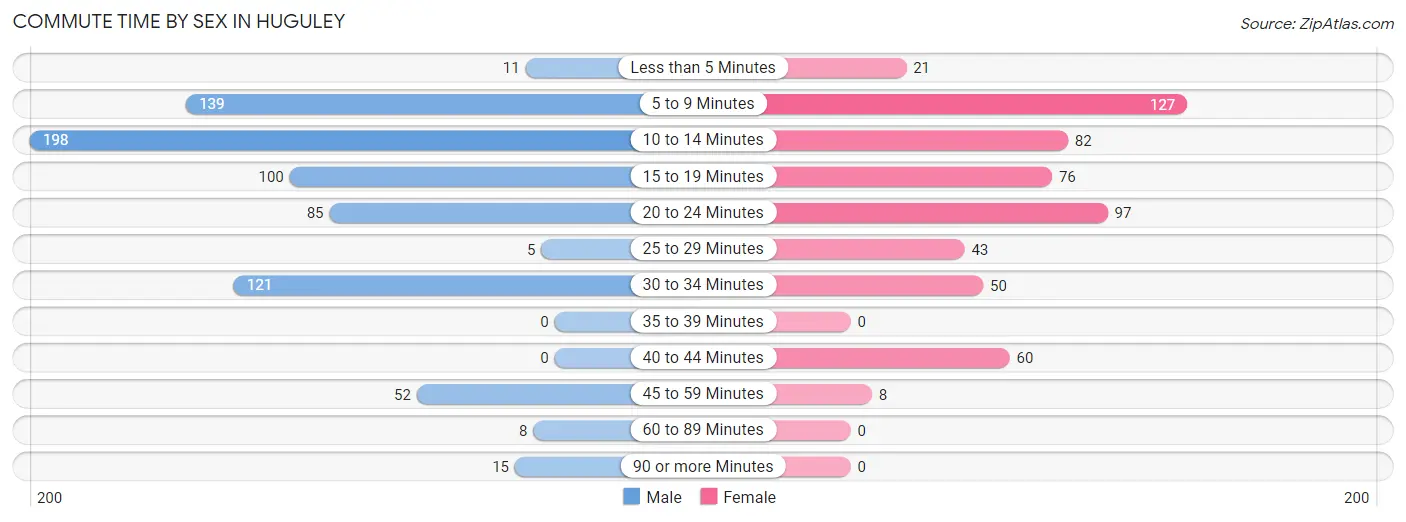
| Commute Time | Male | Female |
| Less than 5 Minutes | 11 (1.5%) | 21 (3.7%) |
| 5 to 9 Minutes | 139 (18.9%) | 127 (22.5%) |
| 10 to 14 Minutes | 198 (27.0%) | 82 (14.5%) |
| 15 to 19 Minutes | 100 (13.6%) | 76 (13.5%) |
| 20 to 24 Minutes | 85 (11.6%) | 97 (17.2%) |
| 25 to 29 Minutes | 5 (0.7%) | 43 (7.6%) |
| 30 to 34 Minutes | 121 (16.5%) | 50 (8.9%) |
| 35 to 39 Minutes | 0 (0.0%) | 0 (0.0%) |
| 40 to 44 Minutes | 0 (0.0%) | 60 (10.6%) |
| 45 to 59 Minutes | 52 (7.1%) | 8 (1.4%) |
| 60 to 89 Minutes | 8 (1.1%) | 0 (0.0%) |
| 90 or more Minutes | 15 (2.0%) | 0 (0.0%) |
Time of Departure to Work by Sex in Huguley
The most frequent times of departure to work in Huguley are 5:30 AM to 5:59 AM (165, 22.5%) for males and 4:00 PM to 11:59 PM (164, 29.1%) for females.
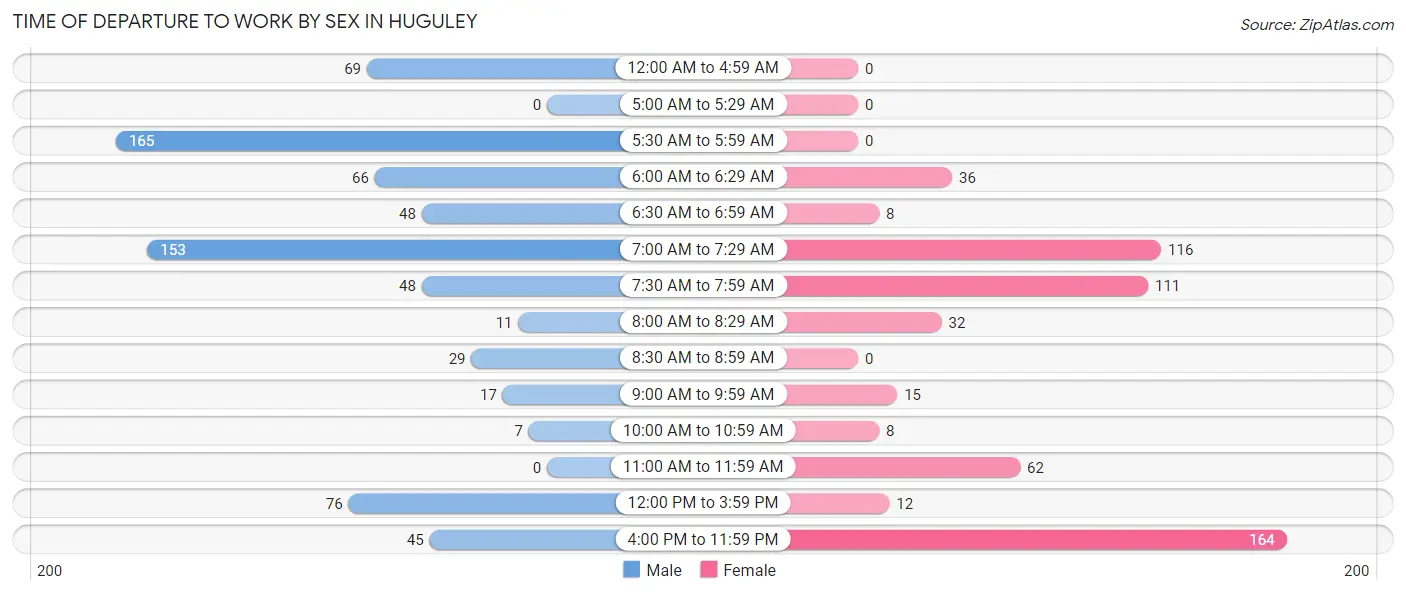
| Time of Departure | Male | Female |
| 12:00 AM to 4:59 AM | 69 (9.4%) | 0 (0.0%) |
| 5:00 AM to 5:29 AM | 0 (0.0%) | 0 (0.0%) |
| 5:30 AM to 5:59 AM | 165 (22.5%) | 0 (0.0%) |
| 6:00 AM to 6:29 AM | 66 (9.0%) | 36 (6.4%) |
| 6:30 AM to 6:59 AM | 48 (6.5%) | 8 (1.4%) |
| 7:00 AM to 7:29 AM | 153 (20.8%) | 116 (20.6%) |
| 7:30 AM to 7:59 AM | 48 (6.5%) | 111 (19.7%) |
| 8:00 AM to 8:29 AM | 11 (1.5%) | 32 (5.7%) |
| 8:30 AM to 8:59 AM | 29 (4.0%) | 0 (0.0%) |
| 9:00 AM to 9:59 AM | 17 (2.3%) | 15 (2.7%) |
| 10:00 AM to 10:59 AM | 7 (0.9%) | 8 (1.4%) |
| 11:00 AM to 11:59 AM | 0 (0.0%) | 62 (11.0%) |
| 12:00 PM to 3:59 PM | 76 (10.3%) | 12 (2.1%) |
| 4:00 PM to 11:59 PM | 45 (6.1%) | 164 (29.1%) |
| Total | 734 (100.0%) | 564 (100.0%) |
Housing Occupancy in Huguley
Occupancy by Ownership in Huguley
Of the total 999 dwellings in Huguley, owner-occupied units account for 853 (85.4%), while renter-occupied units make up 146 (14.6%).
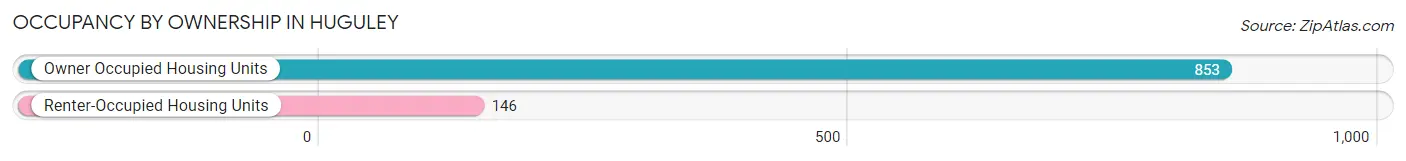
| Occupancy | # Housing Units | % Housing Units |
| Owner Occupied Housing Units | 853 | 85.4% |
| Renter-Occupied Housing Units | 146 | 14.6% |
| Total Occupied Housing Units | 999 | 100.0% |
Occupancy by Household Size in Huguley
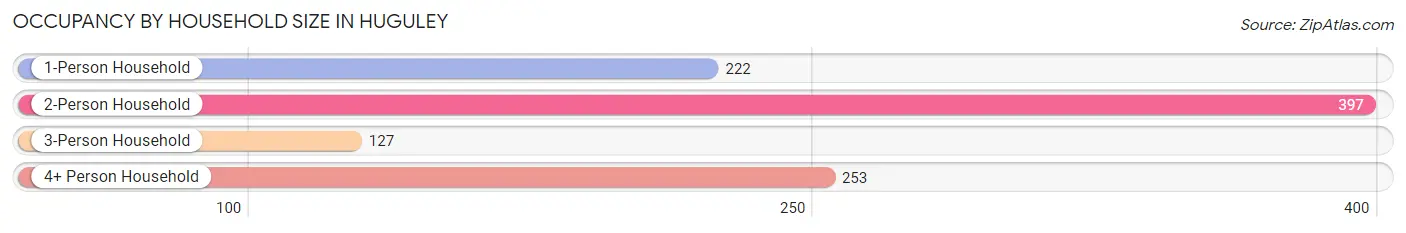
| Household Size | # Housing Units | % Housing Units |
| 1-Person Household | 222 | 22.2% |
| 2-Person Household | 397 | 39.7% |
| 3-Person Household | 127 | 12.7% |
| 4+ Person Household | 253 | 25.3% |
| Total Housing Units | 999 | 100.0% |
Occupancy by Ownership by Household Size in Huguley
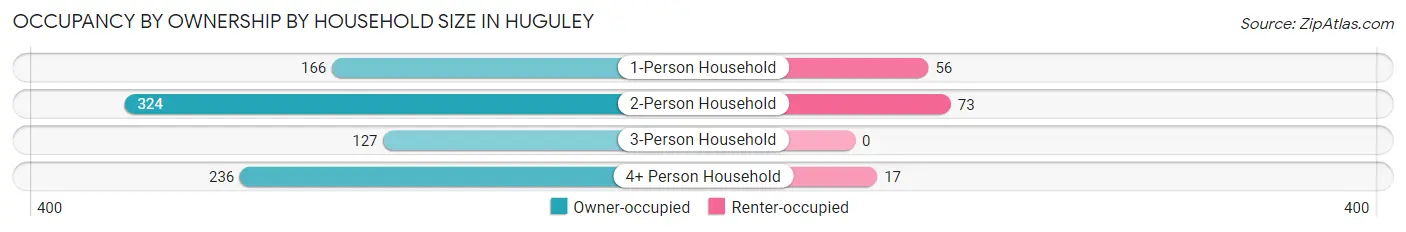
| Household Size | Owner-occupied | Renter-occupied |
| 1-Person Household | 166 (74.8%) | 56 (25.2%) |
| 2-Person Household | 324 (81.6%) | 73 (18.4%) |
| 3-Person Household | 127 (100.0%) | 0 (0.0%) |
| 4+ Person Household | 236 (93.3%) | 17 (6.7%) |
| Total Housing Units | 853 (85.4%) | 146 (14.6%) |
Occupancy by Educational Attainment in Huguley
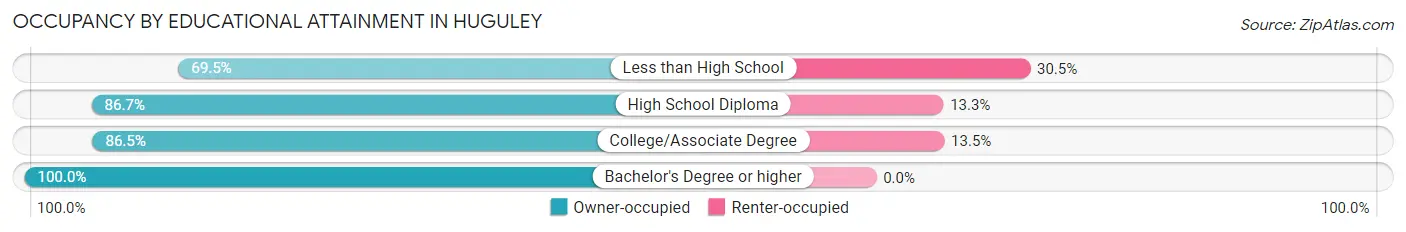
| Household Size | Owner-occupied | Renter-occupied |
| Less than High School | 98 (69.5%) | 43 (30.5%) |
| High School Diploma | 359 (86.7%) | 55 (13.3%) |
| College/Associate Degree | 308 (86.5%) | 48 (13.5%) |
| Bachelor's Degree or higher | 88 (100.0%) | 0 (0.0%) |
Occupancy by Age of Householder in Huguley
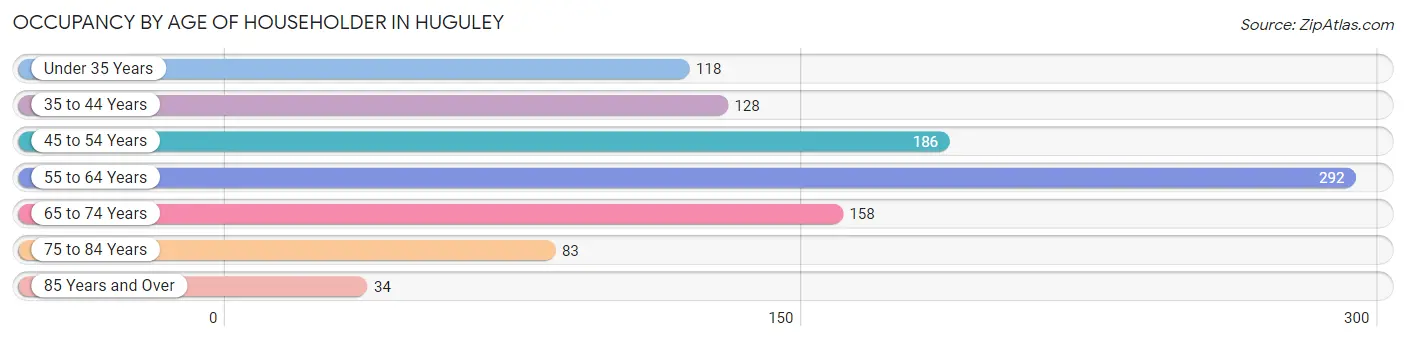
| Age Bracket | # Households | % Households |
| Under 35 Years | 118 | 11.8% |
| 35 to 44 Years | 128 | 12.8% |
| 45 to 54 Years | 186 | 18.6% |
| 55 to 64 Years | 292 | 29.2% |
| 65 to 74 Years | 158 | 15.8% |
| 75 to 84 Years | 83 | 8.3% |
| 85 Years and Over | 34 | 3.4% |
| Total | 999 | 100.0% |
Housing Finances in Huguley
Median Income by Occupancy in Huguley
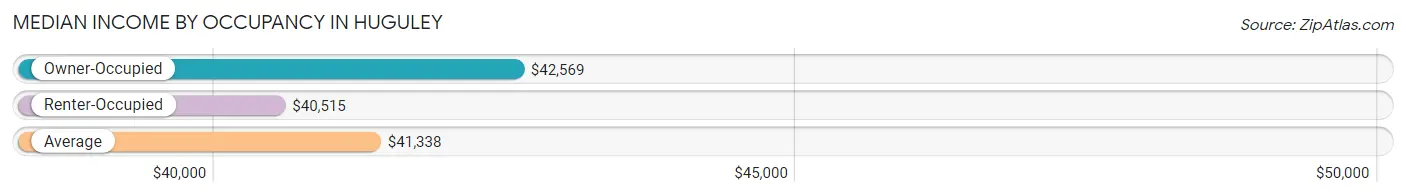
| Occupancy Type | # Households | Median Income |
| Owner-Occupied | 853 (85.4%) | $42,569 |
| Renter-Occupied | 146 (14.6%) | $40,515 |
| Average | 999 (100.0%) | $41,338 |
Occupancy by Householder Income Bracket in Huguley
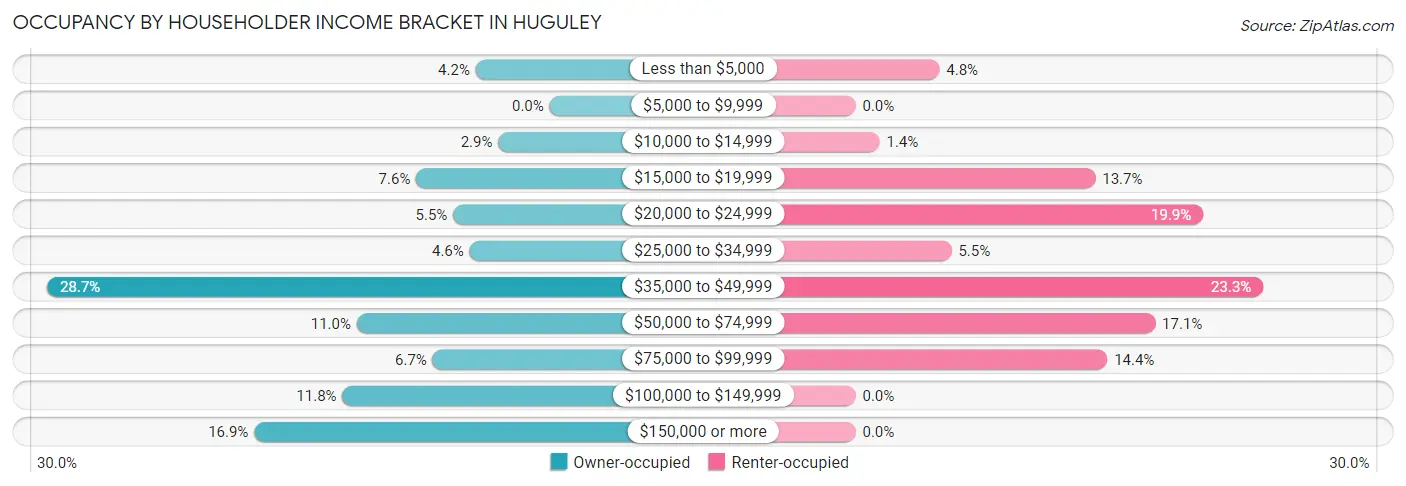
| Income Bracket | Owner-occupied | Renter-occupied |
| Less than $5,000 | 36 (4.2%) | 7 (4.8%) |
| $5,000 to $9,999 | 0 (0.0%) | 0 (0.0%) |
| $10,000 to $14,999 | 25 (2.9%) | 2 (1.4%) |
| $15,000 to $19,999 | 65 (7.6%) | 20 (13.7%) |
| $20,000 to $24,999 | 47 (5.5%) | 29 (19.9%) |
| $25,000 to $34,999 | 39 (4.6%) | 8 (5.5%) |
| $35,000 to $49,999 | 245 (28.7%) | 34 (23.3%) |
| $50,000 to $74,999 | 94 (11.0%) | 25 (17.1%) |
| $75,000 to $99,999 | 57 (6.7%) | 21 (14.4%) |
| $100,000 to $149,999 | 101 (11.8%) | 0 (0.0%) |
| $150,000 or more | 144 (16.9%) | 0 (0.0%) |
| Total | 853 (100.0%) | 146 (100.0%) |
Monthly Housing Cost Tiers in Huguley
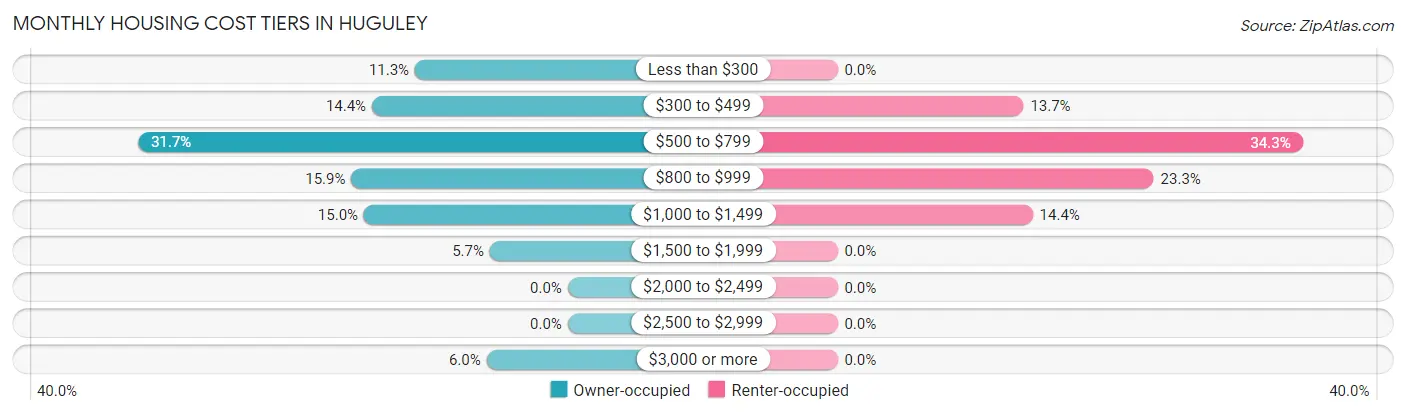
| Monthly Cost | Owner-occupied | Renter-occupied |
| Less than $300 | 96 (11.3%) | 0 (0.0%) |
| $300 to $499 | 123 (14.4%) | 20 (13.7%) |
| $500 to $799 | 270 (31.7%) | 50 (34.3%) |
| $800 to $999 | 136 (15.9%) | 34 (23.3%) |
| $1,000 to $1,499 | 128 (15.0%) | 21 (14.4%) |
| $1,500 to $1,999 | 49 (5.7%) | 0 (0.0%) |
| $2,000 to $2,499 | 0 (0.0%) | 0 (0.0%) |
| $2,500 to $2,999 | 0 (0.0%) | 0 (0.0%) |
| $3,000 or more | 51 (6.0%) | 0 (0.0%) |
| Total | 853 (100.0%) | 146 (100.0%) |
Physical Housing Characteristics in Huguley
Housing Structures in Huguley
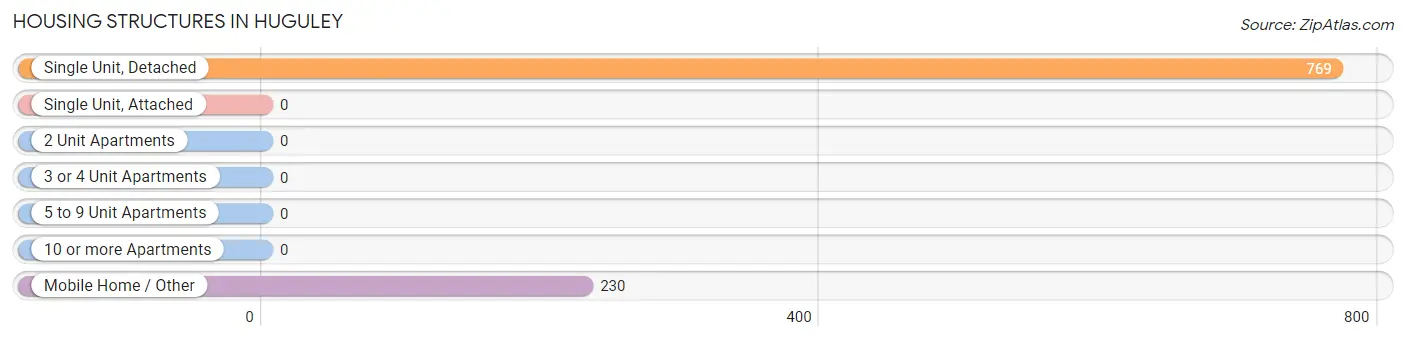
| Structure Type | # Housing Units | % Housing Units |
| Single Unit, Detached | 769 | 77.0% |
| Single Unit, Attached | 0 | 0.0% |
| 2 Unit Apartments | 0 | 0.0% |
| 3 or 4 Unit Apartments | 0 | 0.0% |
| 5 to 9 Unit Apartments | 0 | 0.0% |
| 10 or more Apartments | 0 | 0.0% |
| Mobile Home / Other | 230 | 23.0% |
| Total | 999 | 100.0% |
Housing Structures by Occupancy in Huguley
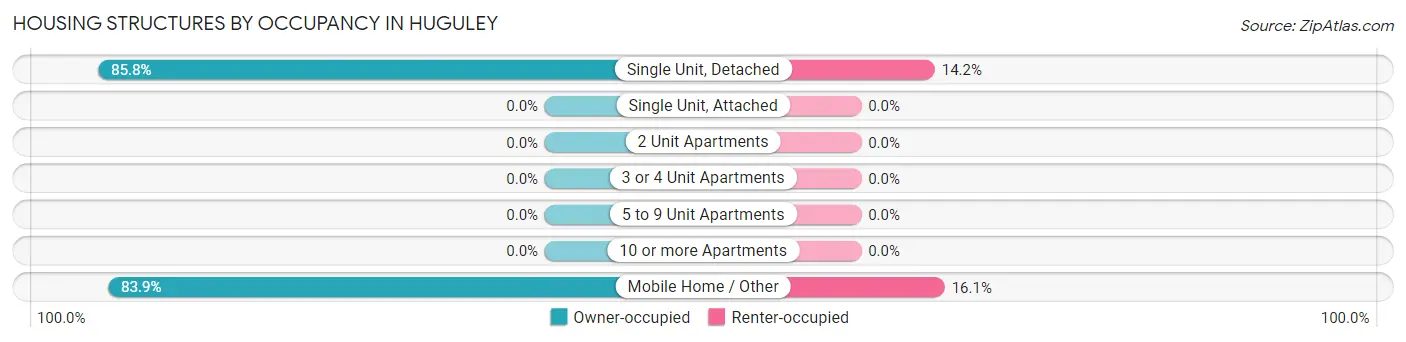
| Structure Type | Owner-occupied | Renter-occupied |
| Single Unit, Detached | 660 (85.8%) | 109 (14.2%) |
| Single Unit, Attached | 0 (0.0%) | 0 (0.0%) |
| 2 Unit Apartments | 0 (0.0%) | 0 (0.0%) |
| 3 or 4 Unit Apartments | 0 (0.0%) | 0 (0.0%) |
| 5 to 9 Unit Apartments | 0 (0.0%) | 0 (0.0%) |
| 10 or more Apartments | 0 (0.0%) | 0 (0.0%) |
| Mobile Home / Other | 193 (83.9%) | 37 (16.1%) |
| Total | 853 (85.4%) | 146 (14.6%) |
Housing Structures by Number of Rooms in Huguley
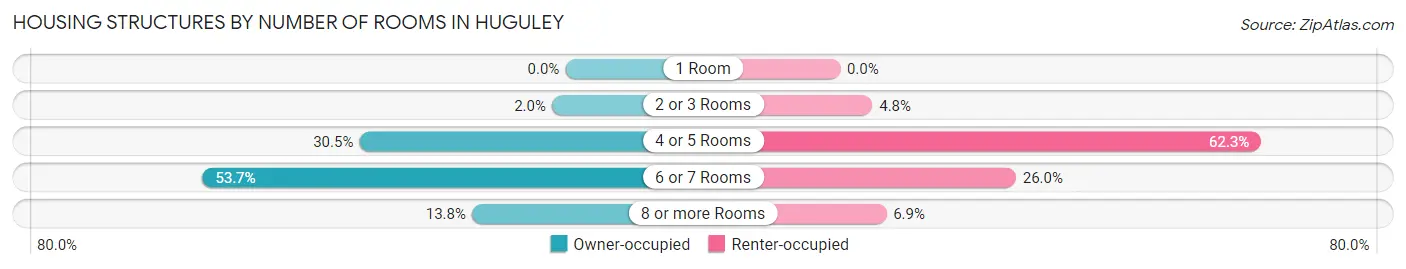
| Number of Rooms | Owner-occupied | Renter-occupied |
| 1 Room | 0 (0.0%) | 0 (0.0%) |
| 2 or 3 Rooms | 17 (2.0%) | 7 (4.8%) |
| 4 or 5 Rooms | 260 (30.5%) | 91 (62.3%) |
| 6 or 7 Rooms | 458 (53.7%) | 38 (26.0%) |
| 8 or more Rooms | 118 (13.8%) | 10 (6.9%) |
| Total | 853 (100.0%) | 146 (100.0%) |
Housing Structure by Heating Type in Huguley
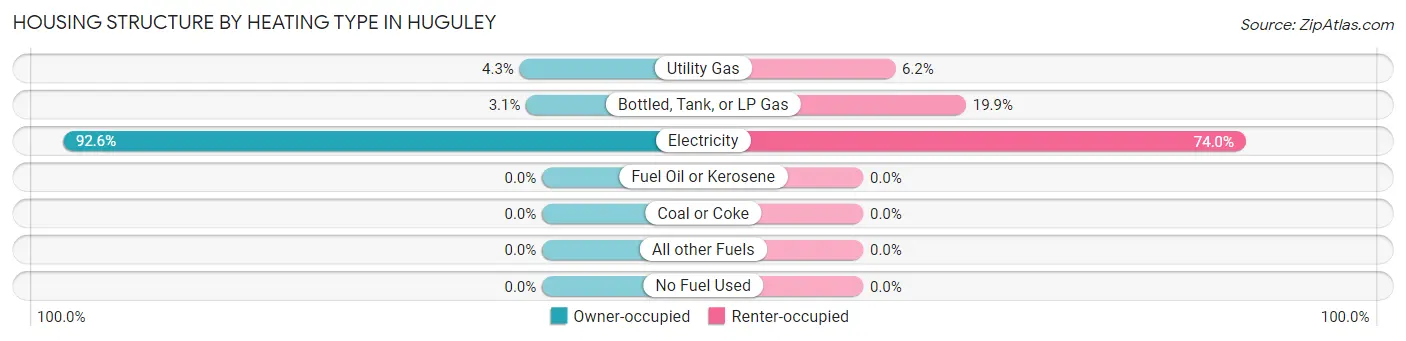
| Heating Type | Owner-occupied | Renter-occupied |
| Utility Gas | 37 (4.3%) | 9 (6.2%) |
| Bottled, Tank, or LP Gas | 26 (3.0%) | 29 (19.9%) |
| Electricity | 790 (92.6%) | 108 (74.0%) |
| Fuel Oil or Kerosene | 0 (0.0%) | 0 (0.0%) |
| Coal or Coke | 0 (0.0%) | 0 (0.0%) |
| All other Fuels | 0 (0.0%) | 0 (0.0%) |
| No Fuel Used | 0 (0.0%) | 0 (0.0%) |
| Total | 853 (100.0%) | 146 (100.0%) |
Household Vehicle Usage in Huguley
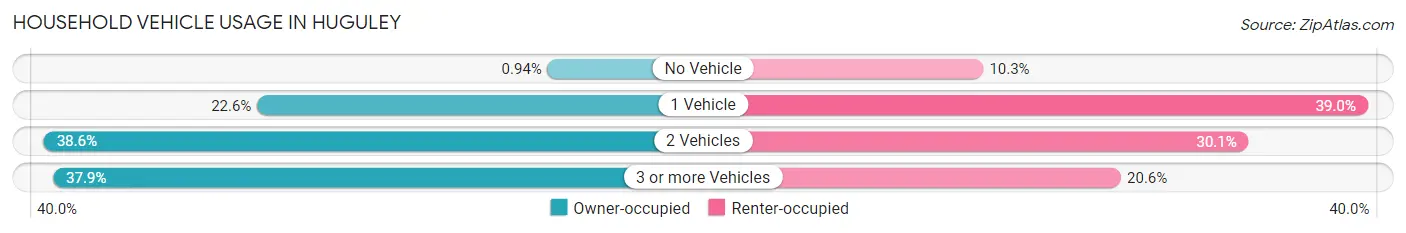
| Vehicles per Household | Owner-occupied | Renter-occupied |
| No Vehicle | 8 (0.9%) | 15 (10.3%) |
| 1 Vehicle | 193 (22.6%) | 57 (39.0%) |
| 2 Vehicles | 329 (38.6%) | 44 (30.1%) |
| 3 or more Vehicles | 323 (37.9%) | 30 (20.5%) |
| Total | 853 (100.0%) | 146 (100.0%) |
Real Estate & Mortgages in Huguley
Real Estate and Mortgage Overview in Huguley
| Characteristic | Without Mortgage | With Mortgage |
| Housing Units | 425 | 428 |
| Median Property Value | $116,500 | $129,400 |
| Median Household Income | $37,067 | $108 |
| Monthly Housing Costs | $503 | $51 |
| Real Estate Taxes | - | - |
Property Value by Mortgage Status in Huguley
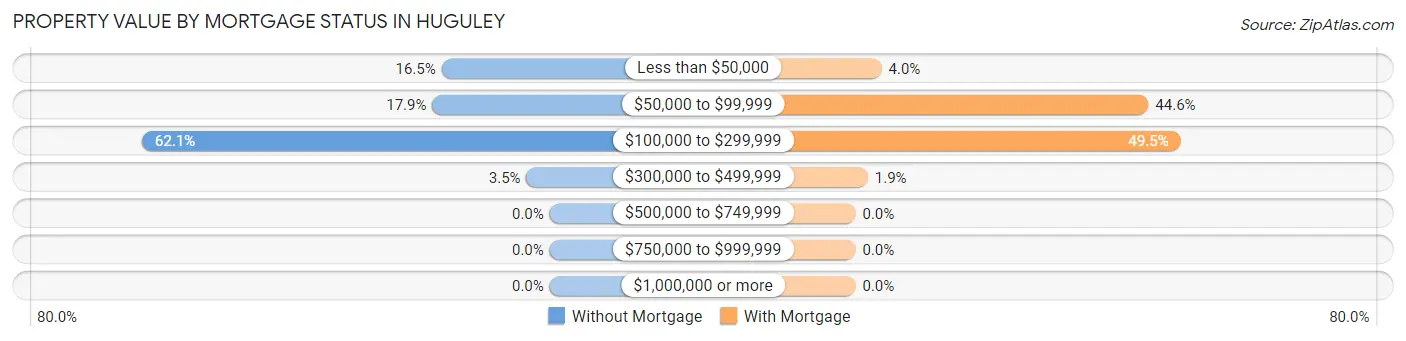
| Property Value | Without Mortgage | With Mortgage |
| Less than $50,000 | 70 (16.5%) | 17 (4.0%) |
| $50,000 to $99,999 | 76 (17.9%) | 191 (44.6%) |
| $100,000 to $299,999 | 264 (62.1%) | 212 (49.5%) |
| $300,000 to $499,999 | 15 (3.5%) | 8 (1.9%) |
| $500,000 to $749,999 | 0 (0.0%) | 0 (0.0%) |
| $750,000 to $999,999 | 0 (0.0%) | 0 (0.0%) |
| $1,000,000 or more | 0 (0.0%) | 0 (0.0%) |
| Total | 425 (100.0%) | 428 (100.0%) |
Household Income by Mortgage Status in Huguley
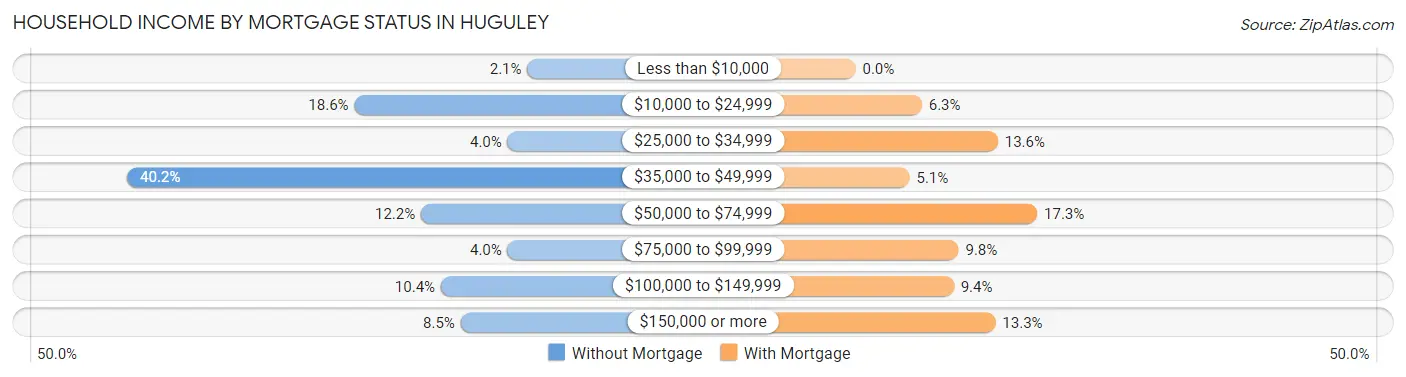
| Household Income | Without Mortgage | With Mortgage |
| Less than $10,000 | 9 (2.1%) | 0 (0.0%) |
| $10,000 to $24,999 | 79 (18.6%) | 27 (6.3%) |
| $25,000 to $34,999 | 17 (4.0%) | 58 (13.6%) |
| $35,000 to $49,999 | 171 (40.2%) | 22 (5.1%) |
| $50,000 to $74,999 | 52 (12.2%) | 74 (17.3%) |
| $75,000 to $99,999 | 17 (4.0%) | 42 (9.8%) |
| $100,000 to $149,999 | 44 (10.3%) | 40 (9.3%) |
| $150,000 or more | 36 (8.5%) | 57 (13.3%) |
| Total | 425 (100.0%) | 428 (100.0%) |
Property Value to Household Income Ratio in Huguley
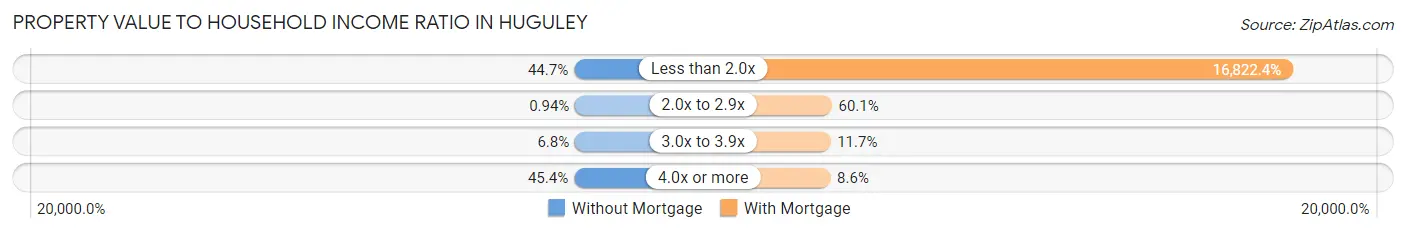
| Value-to-Income Ratio | Without Mortgage | With Mortgage |
| Less than 2.0x | 190 (44.7%) | 72,000 (16,822.4%) |
| 2.0x to 2.9x | 4 (0.9%) | 257 (60.1%) |
| 3.0x to 3.9x | 29 (6.8%) | 50 (11.7%) |
| 4.0x or more | 193 (45.4%) | 37 (8.6%) |
| Total | 425 (100.0%) | 428 (100.0%) |
Real Estate Taxes by Mortgage Status in Huguley
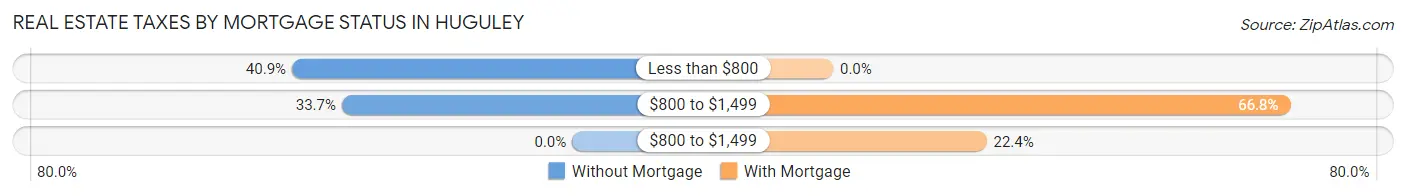
| Property Taxes | Without Mortgage | With Mortgage |
| Less than $800 | 174 (40.9%) | 0 (0.0%) |
| $800 to $1,499 | 143 (33.7%) | 286 (66.8%) |
| $800 to $1,499 | 0 (0.0%) | 96 (22.4%) |
| Total | 425 (100.0%) | 428 (100.0%) |
Health & Disability in Huguley
Health Insurance Coverage by Age in Huguley
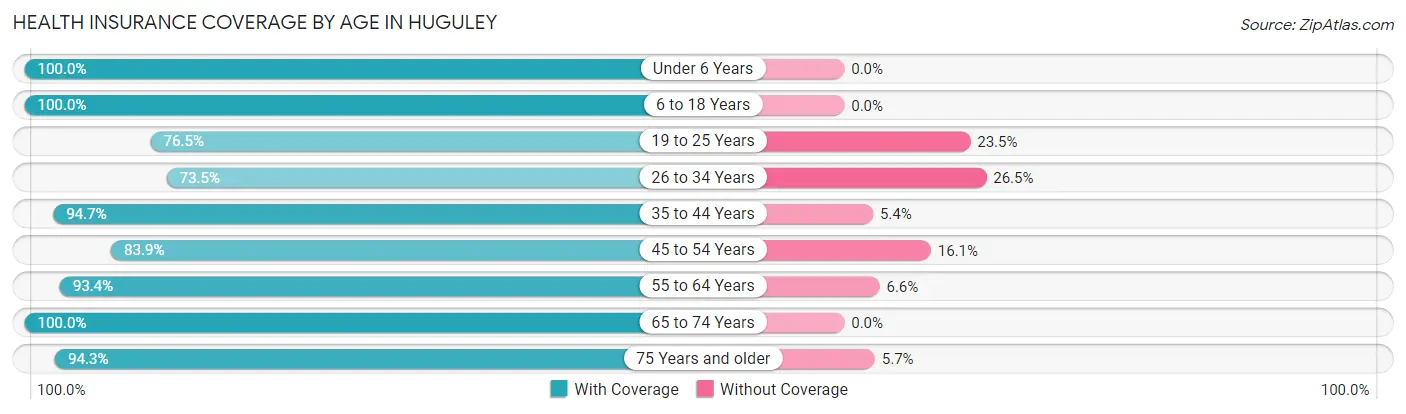
| Age Bracket | With Coverage | Without Coverage |
| Under 6 Years | 239 (100.0%) | 0 (0.0%) |
| 6 to 18 Years | 503 (100.0%) | 0 (0.0%) |
| 19 to 25 Years | 228 (76.5%) | 70 (23.5%) |
| 26 to 34 Years | 161 (73.5%) | 58 (26.5%) |
| 35 to 44 Years | 301 (94.7%) | 17 (5.3%) |
| 45 to 54 Years | 343 (83.9%) | 66 (16.1%) |
| 55 to 64 Years | 512 (93.4%) | 36 (6.6%) |
| 65 to 74 Years | 293 (100.0%) | 0 (0.0%) |
| 75 Years and older | 182 (94.3%) | 11 (5.7%) |
| Total | 2,762 (91.5%) | 258 (8.5%) |
Health Insurance Coverage by Citizenship Status in Huguley
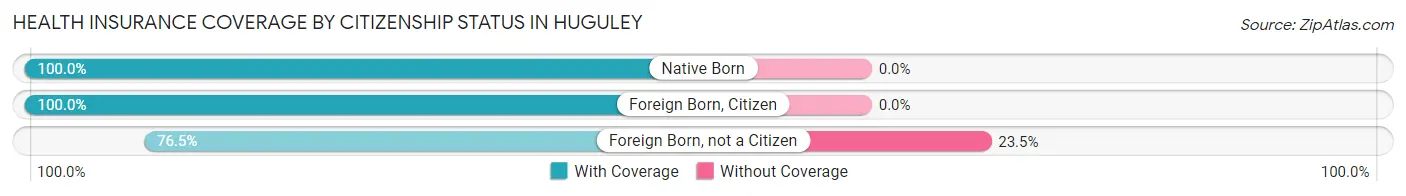
| Citizenship Status | With Coverage | Without Coverage |
| Native Born | 239 (100.0%) | 0 (0.0%) |
| Foreign Born, Citizen | 503 (100.0%) | 0 (0.0%) |
| Foreign Born, not a Citizen | 228 (76.5%) | 70 (23.5%) |
Health Insurance Coverage by Household Income in Huguley
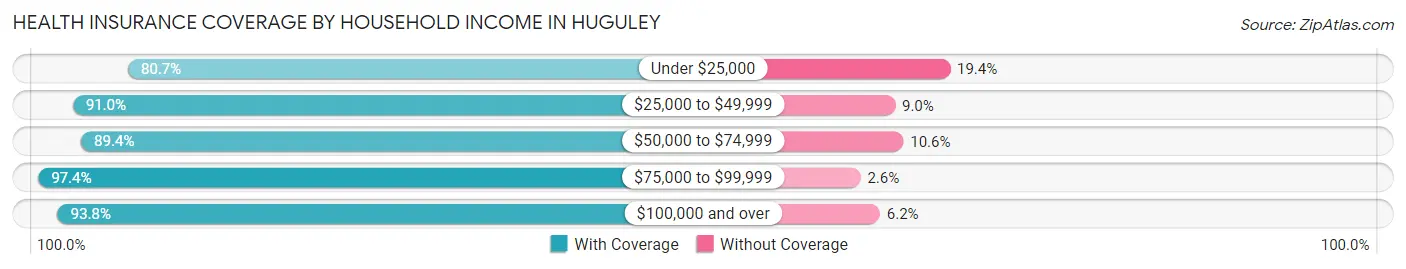
| Household Income | With Coverage | Without Coverage |
| Under $25,000 | 271 (80.6%) | 65 (19.4%) |
| $25,000 to $49,999 | 624 (91.0%) | 62 (9.0%) |
| $50,000 to $74,999 | 380 (89.4%) | 45 (10.6%) |
| $75,000 to $99,999 | 304 (97.4%) | 8 (2.6%) |
| $100,000 and over | 1,183 (93.8%) | 78 (6.2%) |
Public vs Private Health Insurance Coverage by Age in Huguley
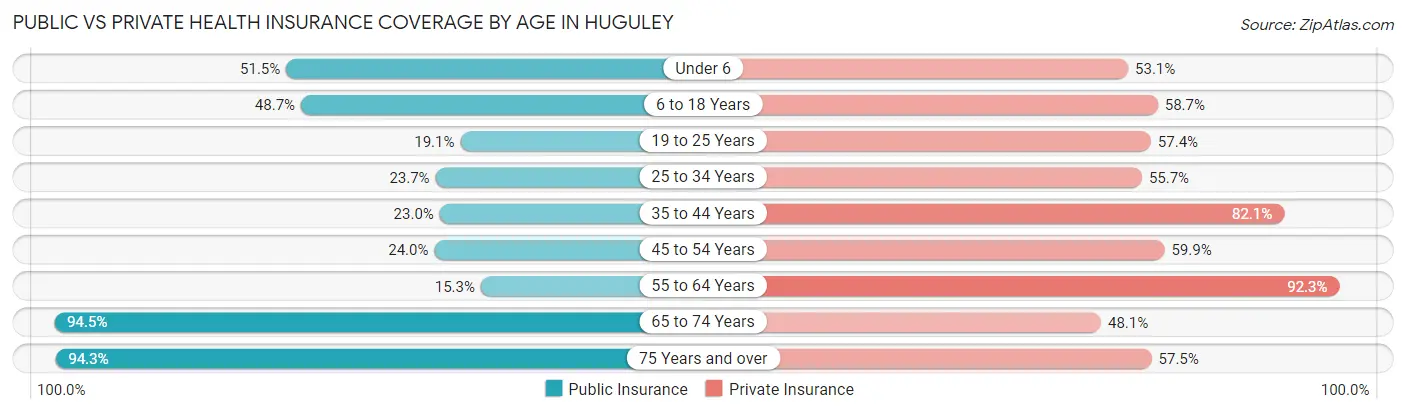
| Age Bracket | Public Insurance | Private Insurance |
| Under 6 | 123 (51.5%) | 127 (53.1%) |
| 6 to 18 Years | 245 (48.7%) | 295 (58.7%) |
| 19 to 25 Years | 57 (19.1%) | 171 (57.4%) |
| 25 to 34 Years | 52 (23.7%) | 122 (55.7%) |
| 35 to 44 Years | 73 (23.0%) | 261 (82.1%) |
| 45 to 54 Years | 98 (24.0%) | 245 (59.9%) |
| 55 to 64 Years | 84 (15.3%) | 506 (92.3%) |
| 65 to 74 Years | 277 (94.5%) | 141 (48.1%) |
| 75 Years and over | 182 (94.3%) | 111 (57.5%) |
| Total | 1,191 (39.4%) | 1,979 (65.5%) |
Disability Status by Sex by Age in Huguley
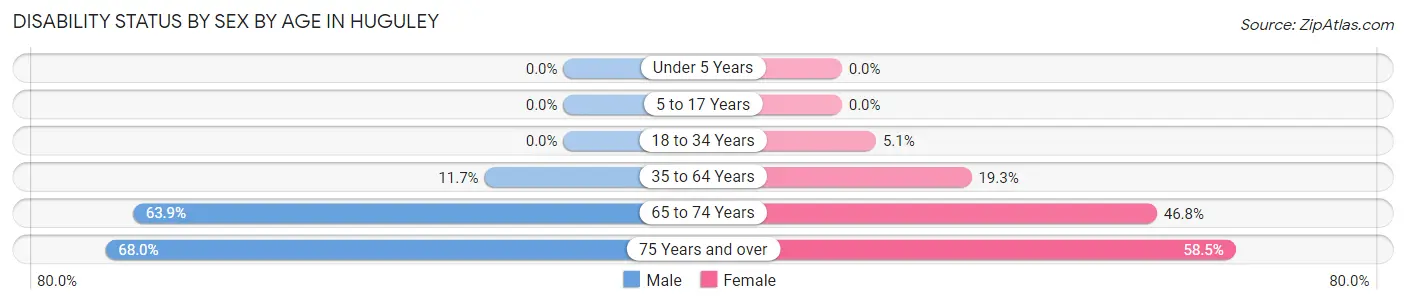
| Age Bracket | Male | Female |
| Under 5 Years | 0 (0.0%) | 0 (0.0%) |
| 5 to 17 Years | 0 (0.0%) | 0 (0.0%) |
| 18 to 34 Years | 0 (0.0%) | 15 (5.1%) |
| 35 to 64 Years | 77 (11.7%) | 119 (19.3%) |
| 65 to 74 Years | 78 (63.9%) | 80 (46.8%) |
| 75 Years and over | 51 (68.0%) | 69 (58.5%) |
Disability Class by Sex by Age in Huguley
Disability Class: Hearing Difficulty
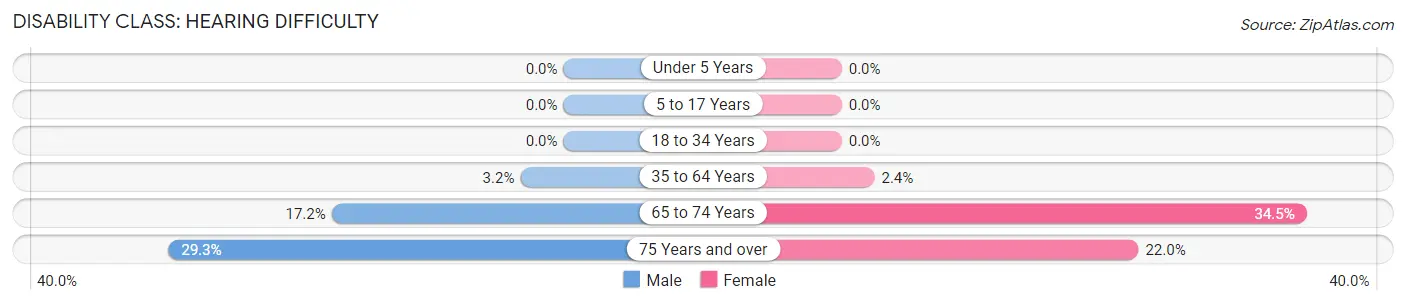
| Age Bracket | Male | Female |
| Under 5 Years | 0 (0.0%) | 0 (0.0%) |
| 5 to 17 Years | 0 (0.0%) | 0 (0.0%) |
| 18 to 34 Years | 0 (0.0%) | 0 (0.0%) |
| 35 to 64 Years | 21 (3.2%) | 15 (2.4%) |
| 65 to 74 Years | 21 (17.2%) | 59 (34.5%) |
| 75 Years and over | 22 (29.3%) | 26 (22.0%) |
Disability Class: Vision Difficulty
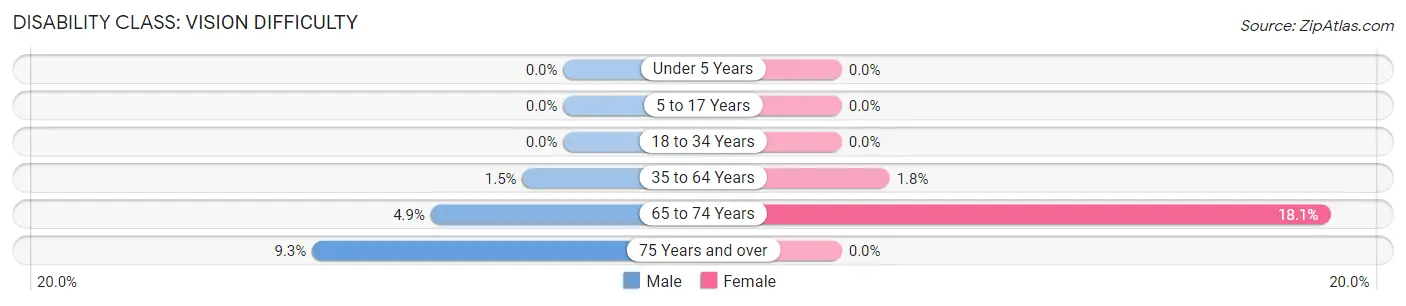
| Age Bracket | Male | Female |
| Under 5 Years | 0 (0.0%) | 0 (0.0%) |
| 5 to 17 Years | 0 (0.0%) | 0 (0.0%) |
| 18 to 34 Years | 0 (0.0%) | 0 (0.0%) |
| 35 to 64 Years | 10 (1.5%) | 11 (1.8%) |
| 65 to 74 Years | 6 (4.9%) | 31 (18.1%) |
| 75 Years and over | 7 (9.3%) | 0 (0.0%) |
Disability Class: Cognitive Difficulty
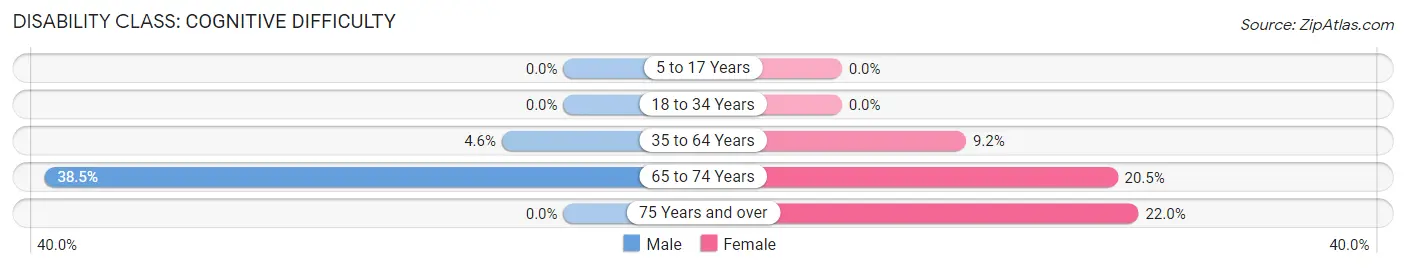
| Age Bracket | Male | Female |
| 5 to 17 Years | 0 (0.0%) | 0 (0.0%) |
| 18 to 34 Years | 0 (0.0%) | 0 (0.0%) |
| 35 to 64 Years | 30 (4.6%) | 57 (9.2%) |
| 65 to 74 Years | 47 (38.5%) | 35 (20.5%) |
| 75 Years and over | 0 (0.0%) | 26 (22.0%) |
Disability Class: Ambulatory Difficulty
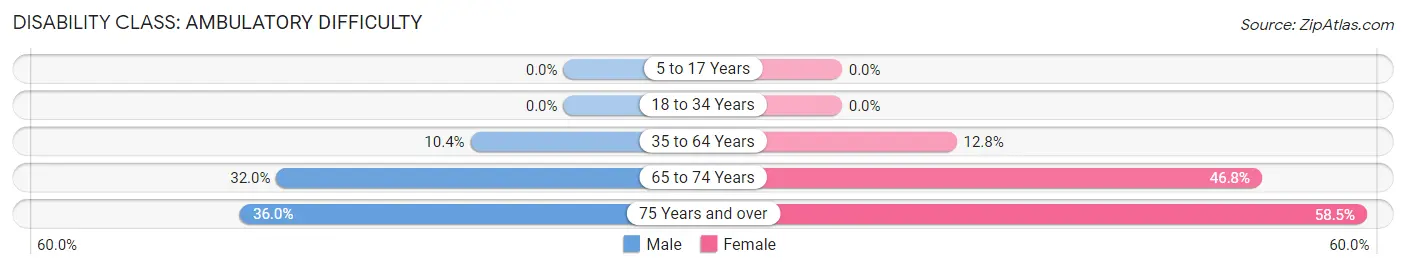
| Age Bracket | Male | Female |
| 5 to 17 Years | 0 (0.0%) | 0 (0.0%) |
| 18 to 34 Years | 0 (0.0%) | 0 (0.0%) |
| 35 to 64 Years | 68 (10.3%) | 79 (12.8%) |
| 65 to 74 Years | 39 (32.0%) | 80 (46.8%) |
| 75 Years and over | 27 (36.0%) | 69 (58.5%) |
Disability Class: Self-Care Difficulty
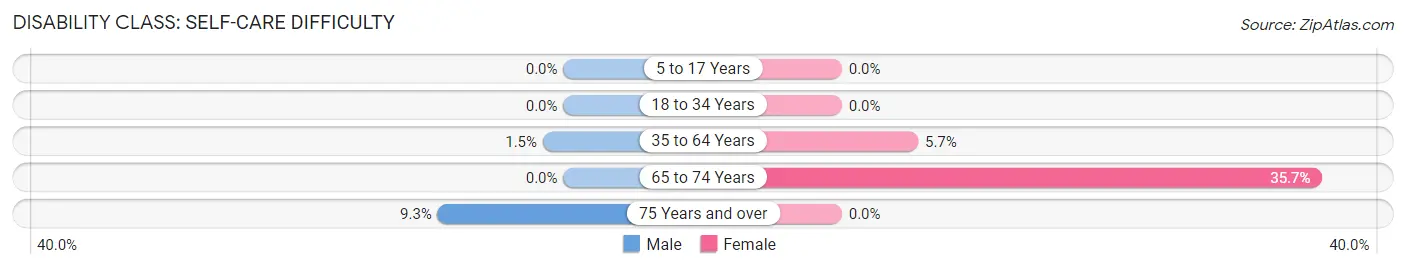
| Age Bracket | Male | Female |
| 5 to 17 Years | 0 (0.0%) | 0 (0.0%) |
| 18 to 34 Years | 0 (0.0%) | 0 (0.0%) |
| 35 to 64 Years | 10 (1.5%) | 35 (5.7%) |
| 65 to 74 Years | 0 (0.0%) | 61 (35.7%) |
| 75 Years and over | 7 (9.3%) | 0 (0.0%) |
Technology Access in Huguley
Computing Device Access in Huguley
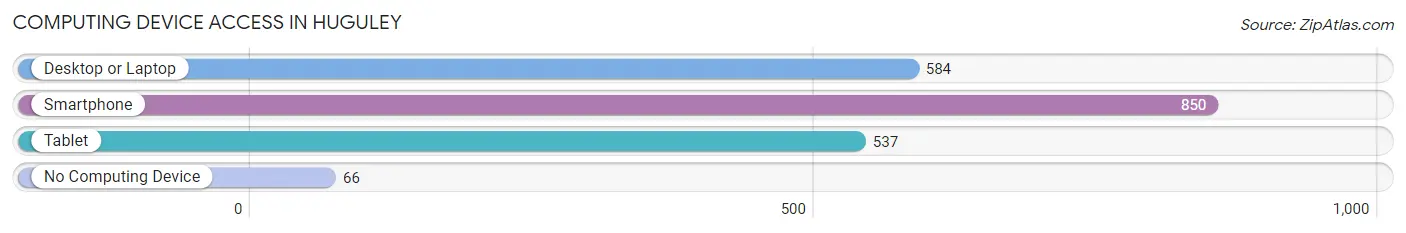
| Device Type | # Households | % Households |
| Desktop or Laptop | 584 | 58.5% |
| Smartphone | 850 | 85.1% |
| Tablet | 537 | 53.7% |
| No Computing Device | 66 | 6.6% |
| Total | 999 | 100.0% |
Internet Access in Huguley
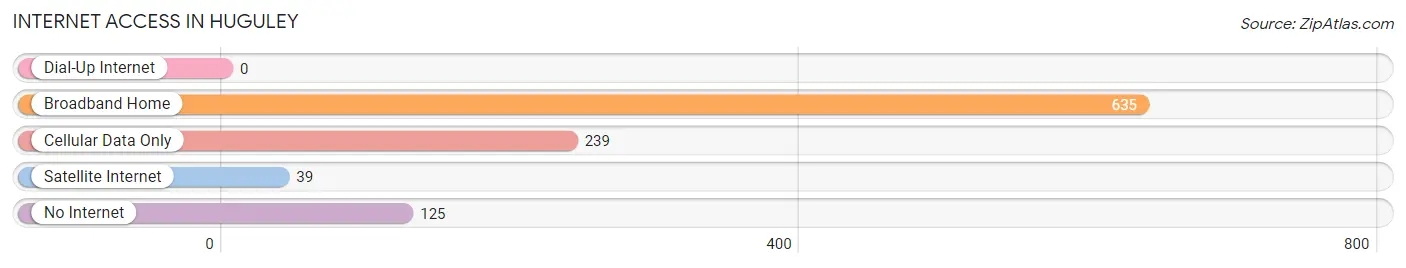
| Internet Type | # Households | % Households |
| Dial-Up Internet | 0 | 0.0% |
| Broadband Home | 635 | 63.6% |
| Cellular Data Only | 239 | 23.9% |
| Satellite Internet | 39 | 3.9% |
| No Internet | 125 | 12.5% |
| Total | 999 | 100.0% |
Huguley Summary
Huguley is a small unincorporated community located in the northwest corner of Alabama in the United States. It is situated in the foothills of the Appalachian Mountains and is part of the greater Birmingham metropolitan area. The community is named after the Huguley family, who were among the first settlers in the area.
History
The area that is now Huguley was first settled in the early 1800s by the Huguley family. The family was originally from North Carolina and had moved to Alabama in search of better opportunities. The family established a small farm and began to grow cotton, corn, and other crops. The area was sparsely populated until the late 1800s when the railroad was built through the area. This allowed for the development of the community and the growth of the local economy.
The town of Huguley was officially incorporated in 1891. The town was named after the Huguley family and was home to a variety of businesses, including a general store, a blacksmith shop, and a cotton gin. The town also had a post office, a school, and a church.
In the early 1900s, the town began to grow and prosper. The population increased and the economy flourished. The town was home to several businesses, including a sawmill, a gristmill, and a cotton gin. The town also had a bank, a hotel, and a movie theater.
In the mid-1900s, the town began to decline. The railroad was abandoned and the local economy suffered. The population began to decline and many of the businesses closed. The town was eventually annexed by the city of Birmingham in the late 1960s.
Geography
Huguley is located in the northwest corner of Alabama in the foothills of the Appalachian Mountains. The town is situated in the Jones Valley, which is part of the greater Birmingham metropolitan area. The town is located near the intersection of Interstate 65 and US Highway 31.
The town is located at an elevation of 845 feet above sea level. The climate is humid subtropical, with hot summers and mild winters. The average annual temperature is around 70 degrees Fahrenheit. The average annual precipitation is around 50 inches.
Economy
The economy of Huguley is largely based on agriculture. The town is home to several farms that grow cotton, corn, soybeans, and other crops. The town is also home to several small businesses, including a general store, a hardware store, and a gas station.
The town is also home to several manufacturing companies, including a furniture factory and a plastics factory. The town is also home to several restaurants and bars.
Demographics
As of the 2010 census, the population of Huguley was 1,845. The racial makeup of the town was 97.3% White, 0.9% African American, 0.2% Native American, 0.2% Asian, 0.1% Pacific Islander, and 0.3% from other races. The median household income was $37,917. The per capita income was $17,917.
Conclusion
Huguley is a small unincorporated community located in the northwest corner of Alabama in the United States. The town was first settled in the early 1800s by the Huguley family and was officially incorporated in 1891. The town has a population of 1,845 and is largely based on agriculture. The town is home to several small businesses and manufacturing companies. The town is also home to several restaurants and bars.
Common Questions
What is Per Capita Income in Huguley?
Per Capita income in Huguley is $26,882.
What is the Median Family Income in Huguley?
Median Family Income in Huguley is $59,028.
What is the Median Household income in Huguley?
Median Household Income in Huguley is $41,338.
What is Income or Wage Gap in Huguley?
Income or Wage Gap in Huguley is 8.1%.
Women in Huguley earn 91.9 cents for every dollar earned by a man.
What is Family Income Deficit in Huguley?
Family Income Deficit in Huguley is $5,486.
Families that are below poverty line in Huguley earn $5,486 less on average than the poverty threshold level.
What is Inequality or Gini Index in Huguley?
Inequality or Gini Index in Huguley is 0.45.
What is the Total Population of Huguley?
Total Population of Huguley is 3,020.
What is the Total Male Population of Huguley?
Total Male Population of Huguley is 1,467.
What is the Total Female Population of Huguley?
Total Female Population of Huguley is 1,553.
What is the Ratio of Males per 100 Females in Huguley?
There are 94.46 Males per 100 Females in Huguley.
What is the Ratio of Females per 100 Males in Huguley?
There are 105.86 Females per 100 Males in Huguley.
What is the Median Population Age in Huguley?
Median Population Age in Huguley is 43.3 Years.
What is the Average Family Size in Huguley
Average Family Size in Huguley is 3.6 People.
What is the Average Household Size in Huguley
Average Household Size in Huguley is 3.0 People.
How Large is the Labor Force in Huguley?
There are 1,445 People in the Labor Forcein in Huguley.
What is the Percentage of People in the Labor Force in Huguley?
59.5% of People are in the Labor Force in Huguley.
What is the Unemployment Rate in Huguley?
Unemployment Rate in Huguley is 2.6%.