Coaling, AL Map & Demographics
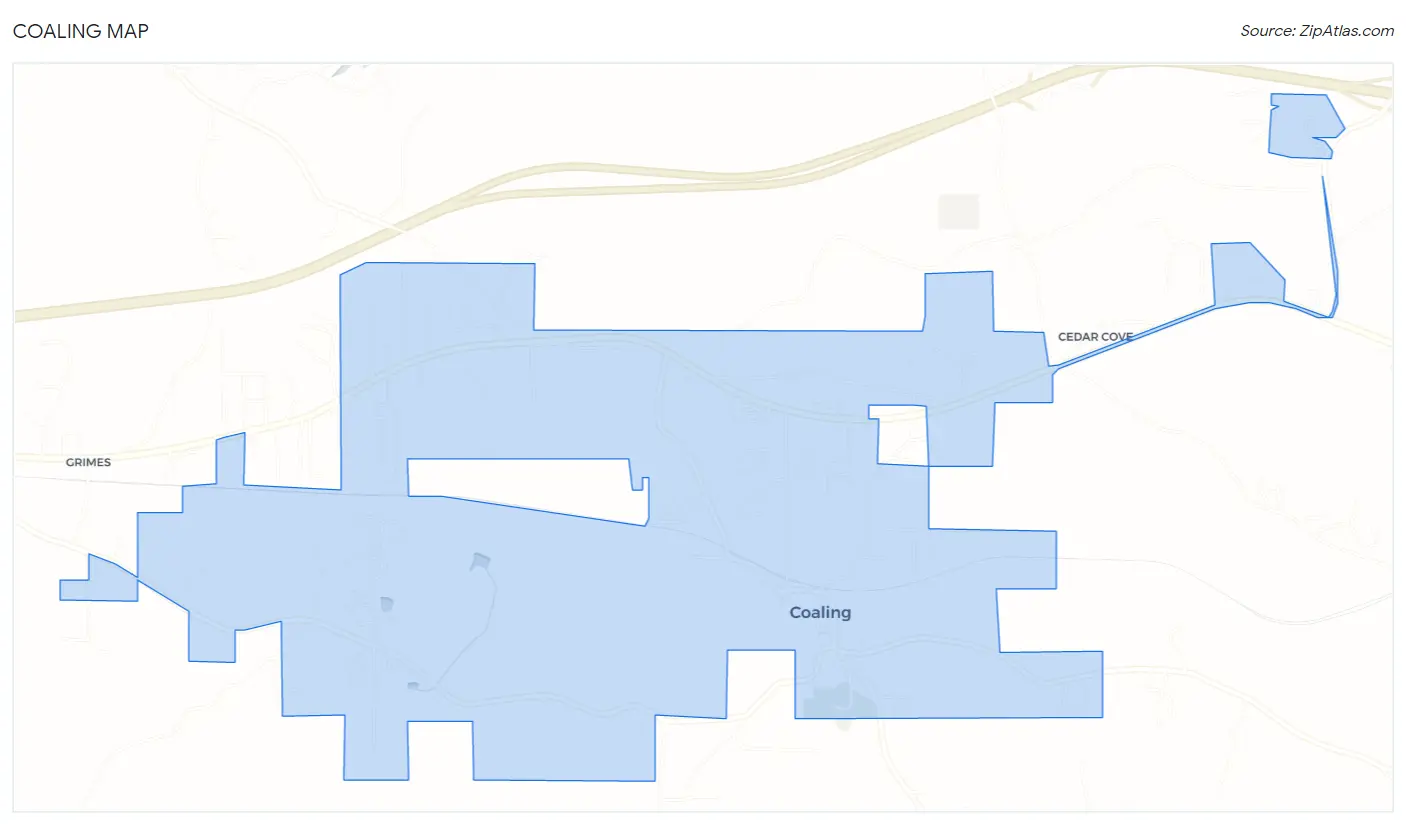
Coaling Map
Coaling Overview
$28,521
PER CAPITA INCOME
$79,559
AVG FAMILY INCOME
$74,032
AVG HOUSEHOLD INCOME
43.0%
WAGE / INCOME GAP [ % ]
57.0¢/ $1
WAGE / INCOME GAP [ $ ]
0.36
INEQUALITY / GINI INDEX
2,203
TOTAL POPULATION
1,149
MALE POPULATION
1,054
FEMALE POPULATION
109.01
MALES / 100 FEMALES
91.73
FEMALES / 100 MALES
35.4
MEDIAN AGE
3.4
AVG FAMILY SIZE
3.2
AVG HOUSEHOLD SIZE
1,219
LABOR FORCE [ PEOPLE ]
71.9%
PERCENT IN LABOR FORCE
12.0%
UNEMPLOYMENT RATE
Coaling Area Codes
Income in Coaling
Income Overview in Coaling
Per Capita Income in Coaling is $28,521, while median incomes of families and households are $79,559 and $74,032 respectively.
| Characteristic | Number | Measure |
| Per Capita Income | 2,203 | $28,521 |
| Median Family Income | 598 | $79,559 |
| Mean Family Income | 598 | $90,068 |
| Median Household Income | 696 | $74,032 |
| Mean Household Income | 696 | $85,337 |
| Income Deficit | 598 | $0 |
| Wage / Income Gap (%) | 2,203 | 43.02% |
| Wage / Income Gap ($) | 2,203 | 56.98¢ per $1 |
| Gini / Inequality Index | 2,203 | 0.36 |
Earnings by Sex in Coaling
Average Earnings in Coaling are $36,696, $52,539 for men and $29,938 for women, a difference of 43.0%.
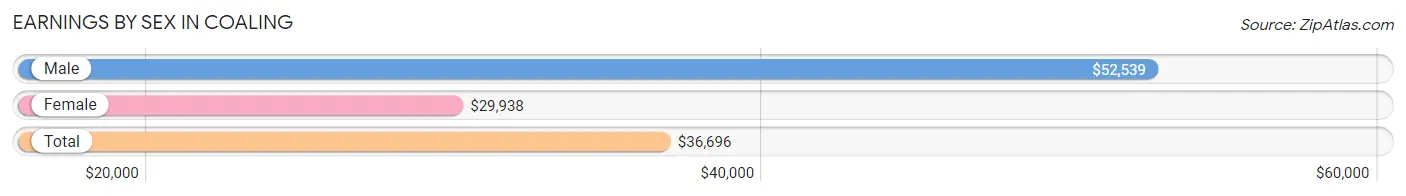
| Sex | Number | Average Earnings |
| Male | 649 (55.3%) | $52,539 |
| Female | 525 (44.7%) | $29,938 |
| Total | 1,174 (100.0%) | $36,696 |
Earnings by Sex by Income Bracket in Coaling
The most common earnings brackets in Coaling are $75,000 to $99,999 for men (92 | 14.2%) and $35,000 to $39,999 for women (70 | 13.3%).
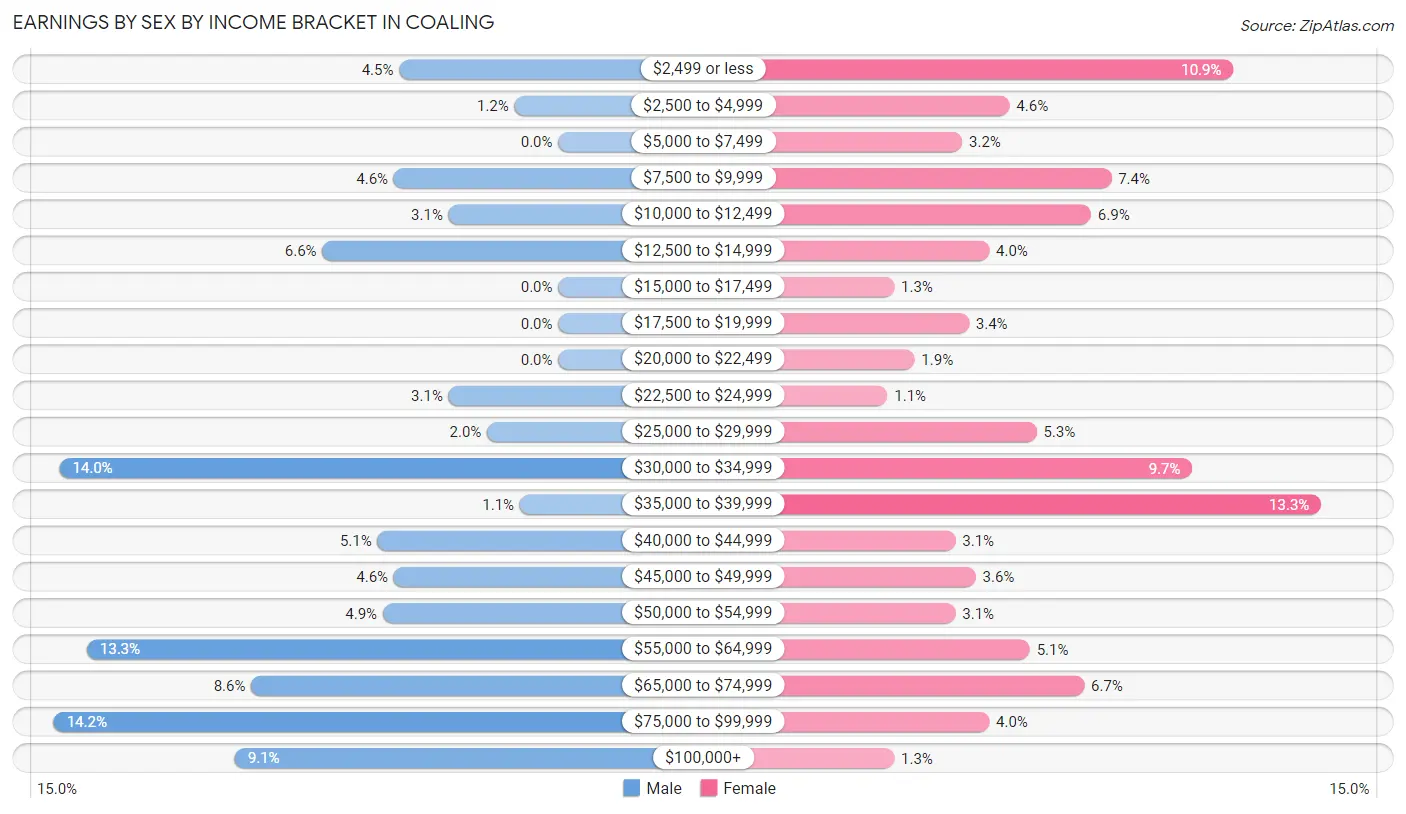
| Income | Male | Female |
| $2,499 or less | 29 (4.5%) | 57 (10.9%) |
| $2,500 to $4,999 | 8 (1.2%) | 24 (4.6%) |
| $5,000 to $7,499 | 0 (0.0%) | 17 (3.2%) |
| $7,500 to $9,999 | 30 (4.6%) | 39 (7.4%) |
| $10,000 to $12,499 | 20 (3.1%) | 36 (6.9%) |
| $12,500 to $14,999 | 43 (6.6%) | 21 (4.0%) |
| $15,000 to $17,499 | 0 (0.0%) | 7 (1.3%) |
| $17,500 to $19,999 | 0 (0.0%) | 18 (3.4%) |
| $20,000 to $22,499 | 0 (0.0%) | 10 (1.9%) |
| $22,500 to $24,999 | 20 (3.1%) | 6 (1.1%) |
| $25,000 to $29,999 | 13 (2.0%) | 28 (5.3%) |
| $30,000 to $34,999 | 91 (14.0%) | 51 (9.7%) |
| $35,000 to $39,999 | 7 (1.1%) | 70 (13.3%) |
| $40,000 to $44,999 | 33 (5.1%) | 16 (3.0%) |
| $45,000 to $49,999 | 30 (4.6%) | 19 (3.6%) |
| $50,000 to $54,999 | 32 (4.9%) | 16 (3.0%) |
| $55,000 to $64,999 | 86 (13.3%) | 27 (5.1%) |
| $65,000 to $74,999 | 56 (8.6%) | 35 (6.7%) |
| $75,000 to $99,999 | 92 (14.2%) | 21 (4.0%) |
| $100,000+ | 59 (9.1%) | 7 (1.3%) |
| Total | 649 (100.0%) | 525 (100.0%) |
Earnings by Sex by Educational Attainment in Coaling
Average earnings in Coaling are $57,703 for men and $32,813 for women, a difference of 43.1%. Men with an educational attainment of college or associate's degree enjoy the highest average annual earnings of $61,719, while those with bachelor's degree education earn the least with $48,000. Women with an educational attainment of graduate degree earn the most with the average annual earnings of $47,333, while those with college or associate's degree education have the smallest earnings of $28,563.
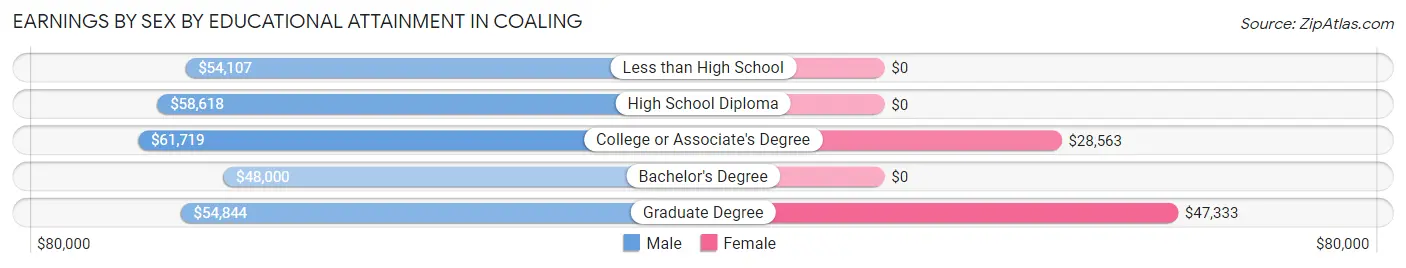
| Educational Attainment | Male Income | Female Income |
| Less than High School | $54,107 | $0 |
| High School Diploma | $58,618 | $0 |
| College or Associate's Degree | $61,719 | $28,563 |
| Bachelor's Degree | $48,000 | $0 |
| Graduate Degree | $54,844 | $47,333 |
| Total | $57,703 | $32,813 |
Family Income in Coaling
Family Income Brackets in Coaling
According to the Coaling family income data, there are 116 families falling into the $75,000 to $99,999 income range, which is the most common income bracket and makes up 19.4% of all families. Conversely, the $15,000 to $24,999 income bracket is the least frequent group with only 5 families (0.8%) belonging to this category.
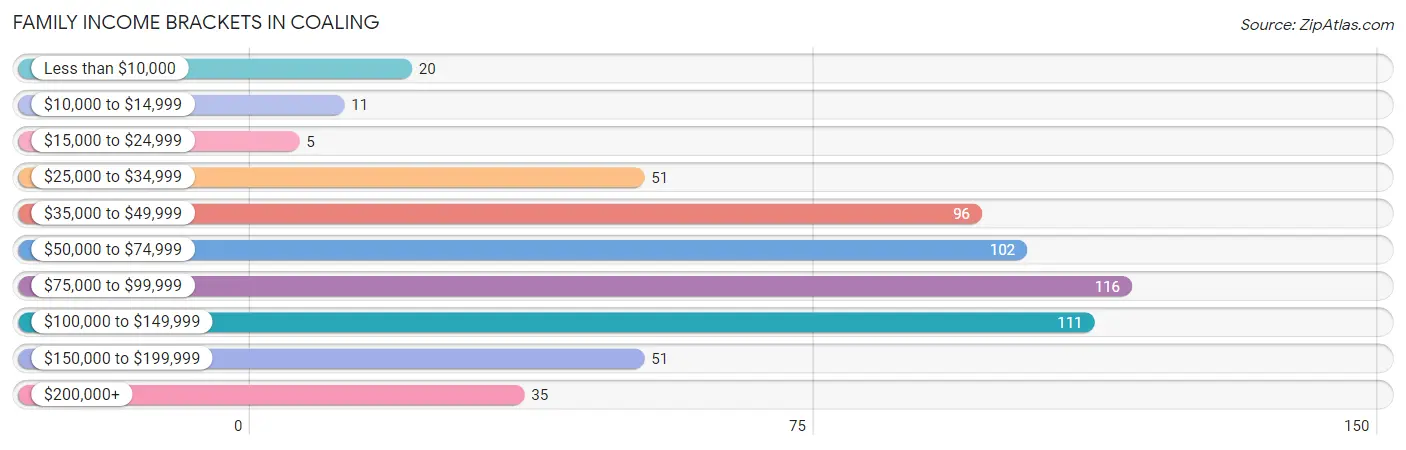
| Income Bracket | # Families | % Families |
| Less than $10,000 | 20 | 3.3% |
| $10,000 to $14,999 | 11 | 1.8% |
| $15,000 to $24,999 | 5 | 0.8% |
| $25,000 to $34,999 | 51 | 8.5% |
| $35,000 to $49,999 | 96 | 16.1% |
| $50,000 to $74,999 | 102 | 17.1% |
| $75,000 to $99,999 | 116 | 19.4% |
| $100,000 to $149,999 | 111 | 18.6% |
| $150,000 to $199,999 | 51 | 8.5% |
| $200,000+ | 35 | 5.9% |
Family Income by Famaliy Size in Coaling
3-person families (113 | 18.9%) account for the highest median family income in Coaling with $102,750 per family, while 2-person families (292 | 48.8%) have the highest median income of $35,568 per family member.
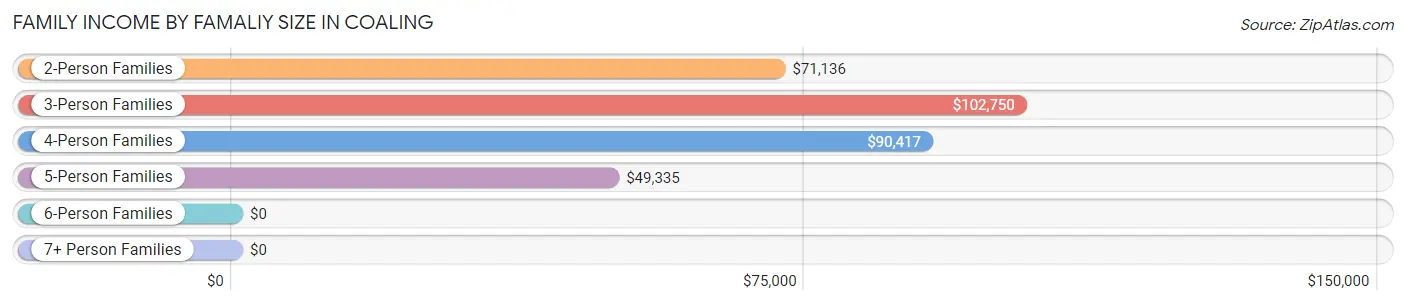
| Income Bracket | # Families | Median Income |
| 2-Person Families | 292 (48.8%) | $71,136 |
| 3-Person Families | 113 (18.9%) | $102,750 |
| 4-Person Families | 111 (18.6%) | $90,417 |
| 5-Person Families | 69 (11.5%) | $49,335 |
| 6-Person Families | 13 (2.2%) | $0 |
| 7+ Person Families | 0 (0.0%) | $0 |
| Total | 598 (100.0%) | $79,559 |
Family Income by Number of Earners in Coaling
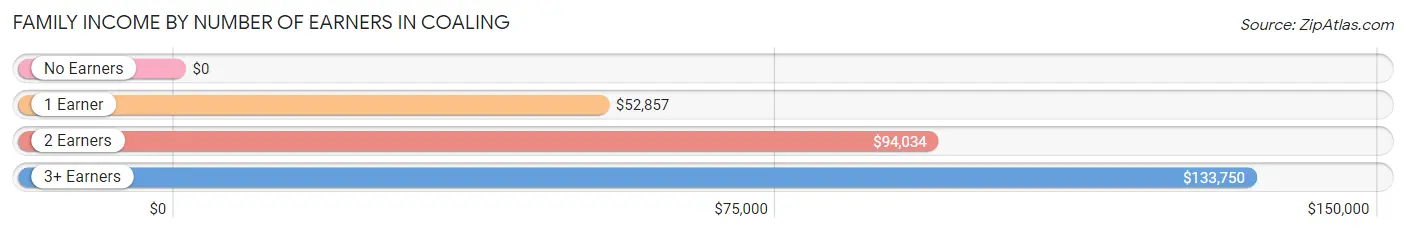
| Number of Earners | # Families | Median Income |
| No Earners | 63 (10.5%) | $0 |
| 1 Earner | 236 (39.5%) | $52,857 |
| 2 Earners | 229 (38.3%) | $94,034 |
| 3+ Earners | 70 (11.7%) | $133,750 |
| Total | 598 (100.0%) | $79,559 |
Household Income in Coaling
Household Income Brackets in Coaling
With 129 households falling in the category, the $100,000 to $149,999 income range is the most frequent in Coaling, accounting for 18.5% of all households. In contrast, only 7 households (1.0%) fall into the less than $10,000 income bracket, making it the least populous group.
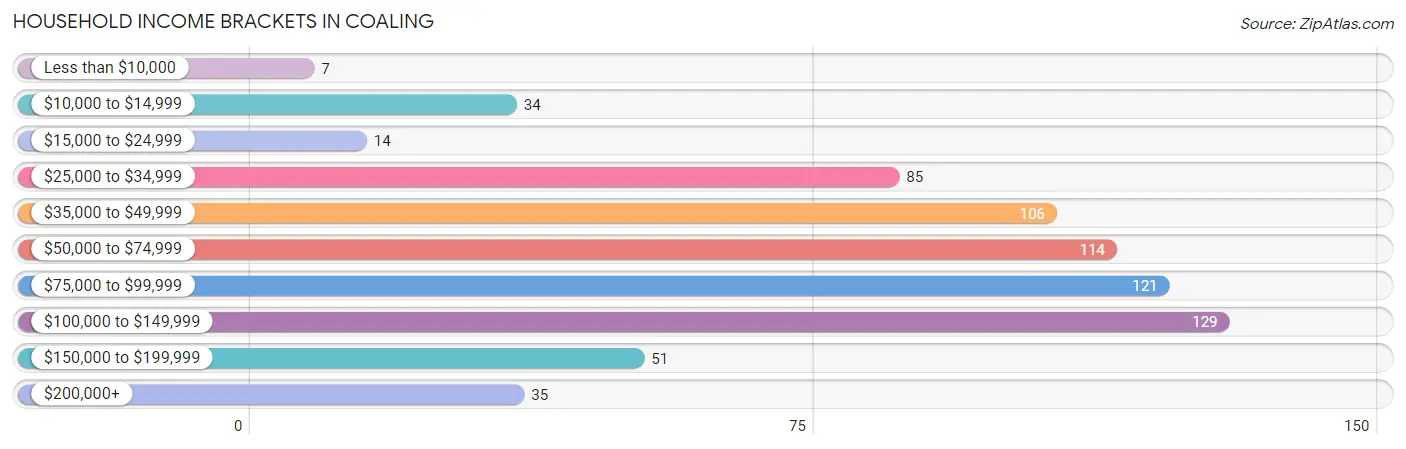
| Income Bracket | # Households | % Households |
| Less than $10,000 | 7 | 1.0% |
| $10,000 to $14,999 | 34 | 4.9% |
| $15,000 to $24,999 | 14 | 2.0% |
| $25,000 to $34,999 | 85 | 12.2% |
| $35,000 to $49,999 | 106 | 15.2% |
| $50,000 to $74,999 | 114 | 16.4% |
| $75,000 to $99,999 | 121 | 17.4% |
| $100,000 to $149,999 | 129 | 18.5% |
| $150,000 to $199,999 | 51 | 7.3% |
| $200,000+ | 35 | 5.0% |
Household Income by Householder Age in Coaling
The median household income in Coaling is $74,032, with the highest median household income of $82,500 found in the 45 to 64 years age bracket for the primary householder. A total of 276 households (39.7%) fall into this category. Meanwhile, the 15 to 24 years age bracket for the primary householder has the lowest median household income of $34,290, with 63 households (9.0%) in this group.
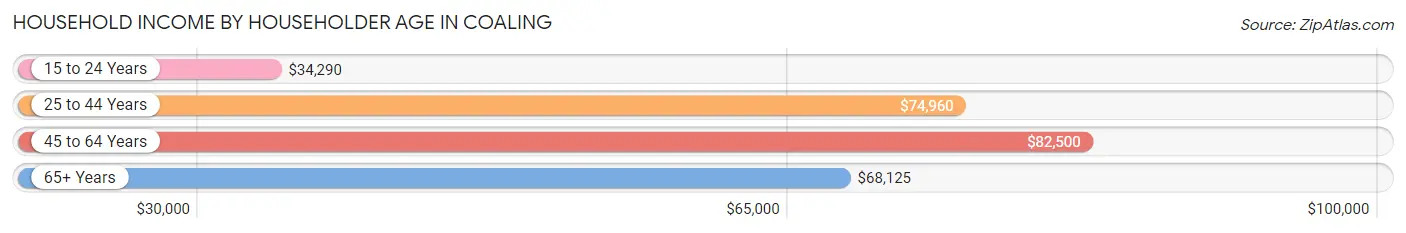
| Income Bracket | # Households | Median Income |
| 15 to 24 Years | 63 (9.0%) | $34,290 |
| 25 to 44 Years | 243 (34.9%) | $74,960 |
| 45 to 64 Years | 276 (39.7%) | $82,500 |
| 65+ Years | 114 (16.4%) | $68,125 |
| Total | 696 (100.0%) | $74,032 |
Poverty in Coaling
Income Below Poverty by Sex and Age in Coaling
With 4.6% poverty level for males and 9.8% for females among the residents of Coaling, 75 year old and over males and 5 year old females are the most vulnerable to poverty, with 4 males (33.3%) and 12 females (100.0%) in their respective age groups living below the poverty level.
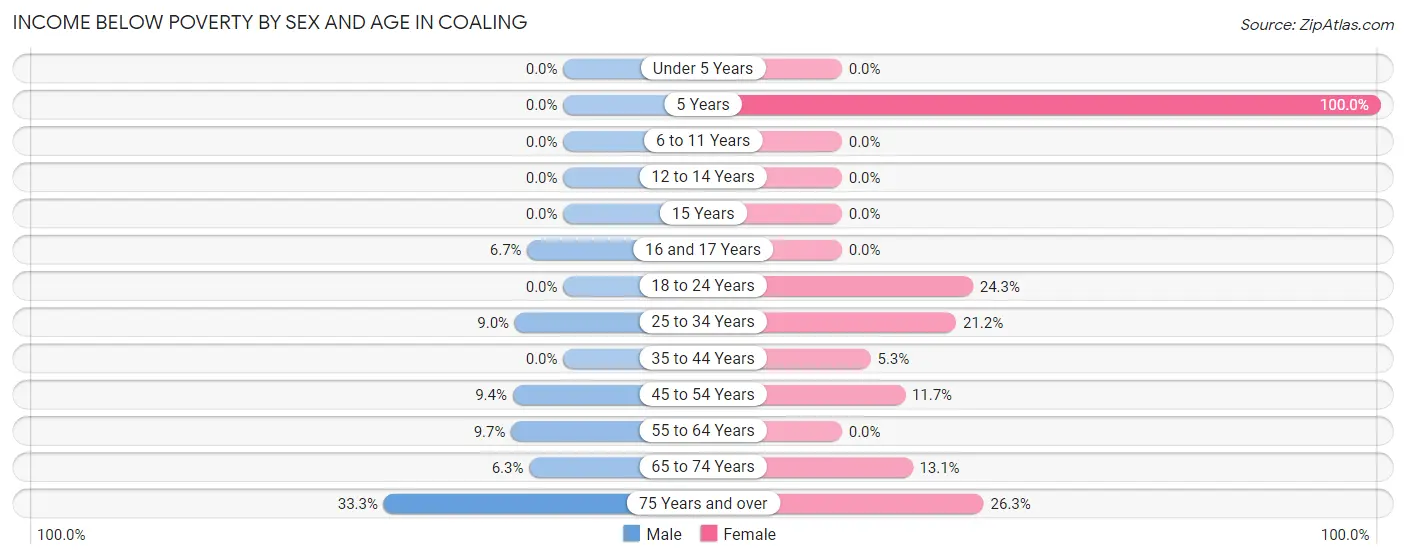
| Age Bracket | Male | Female |
| Under 5 Years | 0 (0.0%) | 0 (0.0%) |
| 5 Years | 0 (0.0%) | 12 (100.0%) |
| 6 to 11 Years | 0 (0.0%) | 0 (0.0%) |
| 12 to 14 Years | 0 (0.0%) | 0 (0.0%) |
| 15 Years | 0 (0.0%) | 0 (0.0%) |
| 16 and 17 Years | 2 (6.7%) | 0 (0.0%) |
| 18 to 24 Years | 0 (0.0%) | 27 (24.3%) |
| 25 to 34 Years | 15 (9.0%) | 21 (21.2%) |
| 35 to 44 Years | 0 (0.0%) | 13 (5.3%) |
| 45 to 54 Years | 12 (9.4%) | 17 (11.7%) |
| 55 to 64 Years | 14 (9.7%) | 0 (0.0%) |
| 65 to 74 Years | 6 (6.3%) | 8 (13.1%) |
| 75 Years and over | 4 (33.3%) | 5 (26.3%) |
| Total | 53 (4.6%) | 103 (9.8%) |
Income Above Poverty by Sex and Age in Coaling
According to the poverty statistics in Coaling, males aged under 5 years and females aged under 5 years are the age groups that are most secure financially, with 100.0% of males and 100.0% of females in these age groups living above the poverty line.
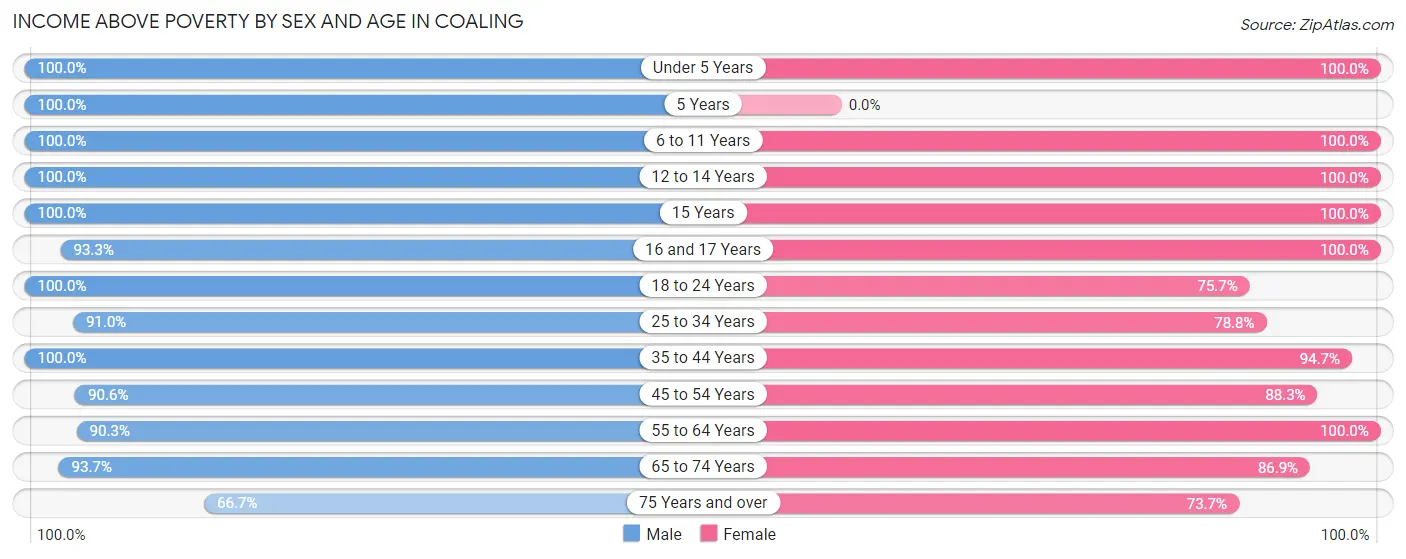
| Age Bracket | Male | Female |
| Under 5 Years | 56 (100.0%) | 66 (100.0%) |
| 5 Years | 9 (100.0%) | 0 (0.0%) |
| 6 to 11 Years | 128 (100.0%) | 119 (100.0%) |
| 12 to 14 Years | 31 (100.0%) | 34 (100.0%) |
| 15 Years | 47 (100.0%) | 5 (100.0%) |
| 16 and 17 Years | 28 (93.3%) | 14 (100.0%) |
| 18 to 24 Years | 169 (100.0%) | 84 (75.7%) |
| 25 to 34 Years | 152 (91.0%) | 78 (78.8%) |
| 35 to 44 Years | 132 (100.0%) | 231 (94.7%) |
| 45 to 54 Years | 116 (90.6%) | 128 (88.3%) |
| 55 to 64 Years | 131 (90.3%) | 125 (100.0%) |
| 65 to 74 Years | 89 (93.7%) | 53 (86.9%) |
| 75 Years and over | 8 (66.7%) | 14 (73.7%) |
| Total | 1,096 (95.4%) | 951 (90.2%) |
Income Below Poverty Among Married-Couple Families in Coaling
The poverty statistics for married-couple families in Coaling show that 0.9% or 4 of the total 454 families live below the poverty line. Families with no children have the highest poverty rate of 1.8%, comprising of 4 families. On the other hand, families with 1 or 2 children have the lowest poverty rate of 0.0%, which includes 0 families.
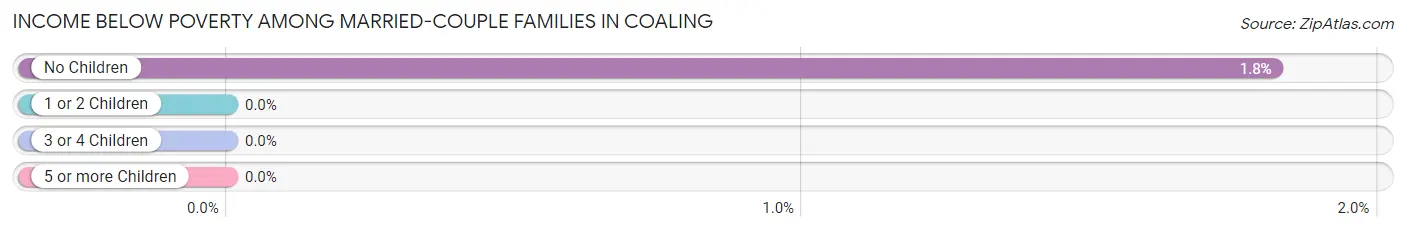
| Children | Above Poverty | Below Poverty |
| No Children | 216 (98.2%) | 4 (1.8%) |
| 1 or 2 Children | 203 (100.0%) | 0 (0.0%) |
| 3 or 4 Children | 31 (100.0%) | 0 (0.0%) |
| 5 or more Children | 0 (0.0%) | 0 (0.0%) |
| Total | 450 (99.1%) | 4 (0.9%) |
Income Below Poverty Among Single-Parent Households in Coaling
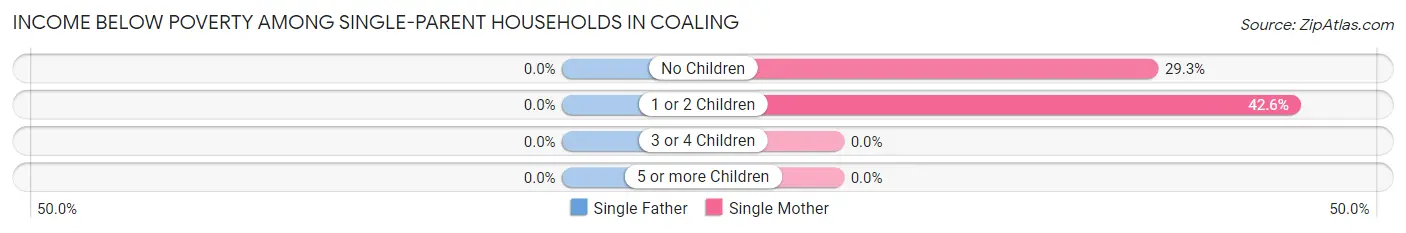
| Children | Single Father | Single Mother |
| No Children | 0 (0.0%) | 12 (29.3%) |
| 1 or 2 Children | 0 (0.0%) | 20 (42.5%) |
| 3 or 4 Children | 0 (0.0%) | 0 (0.0%) |
| 5 or more Children | 0 (0.0%) | 0 (0.0%) |
| Total | 0 (0.0%) | 32 (36.4%) |
Income Below Poverty Among Married-Couple vs Single-Parent Households in Coaling
The poverty data for Coaling shows that 4 of the married-couple family households (0.9%) and 32 of the single-parent households (22.2%) are living below the poverty level. Within the married-couple family households, those with no children have the highest poverty rate, with 4 households (1.8%) falling below the poverty line. Among the single-parent households, those with 1 or 2 children have the highest poverty rate, with 20 household (24.4%) living below poverty.
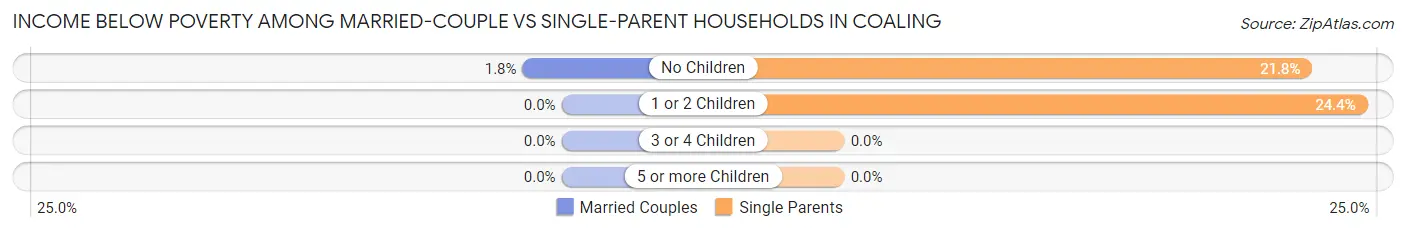
| Children | Married-Couple Families | Single-Parent Households |
| No Children | 4 (1.8%) | 12 (21.8%) |
| 1 or 2 Children | 0 (0.0%) | 20 (24.4%) |
| 3 or 4 Children | 0 (0.0%) | 0 (0.0%) |
| 5 or more Children | 0 (0.0%) | 0 (0.0%) |
| Total | 4 (0.9%) | 32 (22.2%) |
Race in Coaling
The most populous races in Coaling are White / Caucasian (1,715 | 77.8%), Black / African American (298 | 13.5%), and Two or more Races (190 | 8.6%).
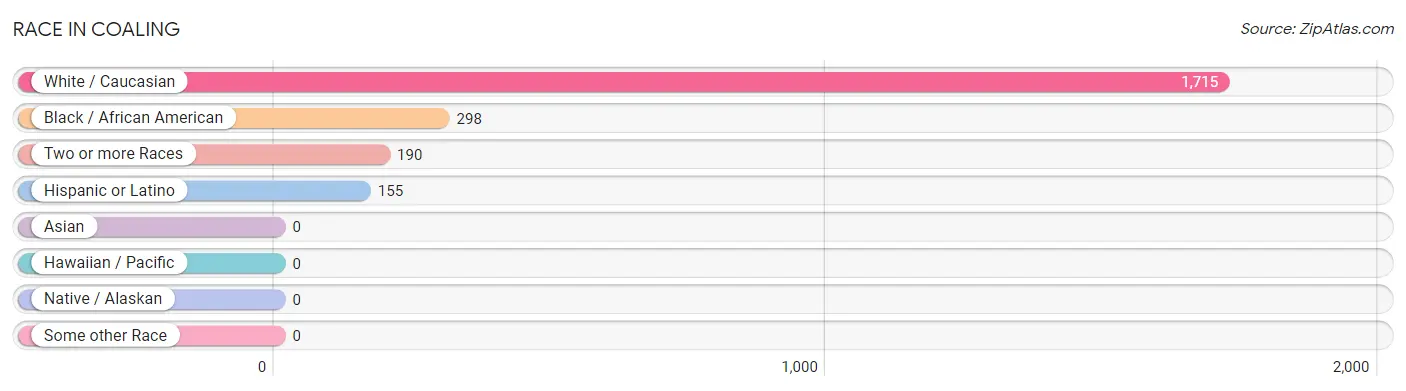
| Race | # Population | % Population |
| Asian | 0 | 0.0% |
| Black / African American | 298 | 13.5% |
| Hawaiian / Pacific | 0 | 0.0% |
| Hispanic or Latino | 155 | 7.0% |
| Native / Alaskan | 0 | 0.0% |
| White / Caucasian | 1,715 | 77.8% |
| Two or more Races | 190 | 8.6% |
| Some other Race | 0 | 0.0% |
| Total | 2,203 | 100.0% |
Ancestry in Coaling
The most populous ancestries reported in Coaling are Irish (357 | 16.2%), Italian (218 | 9.9%), English (182 | 8.3%), German (145 | 6.6%), and Central American (140 | 6.4%), together accounting for 47.3% of all Coaling residents.
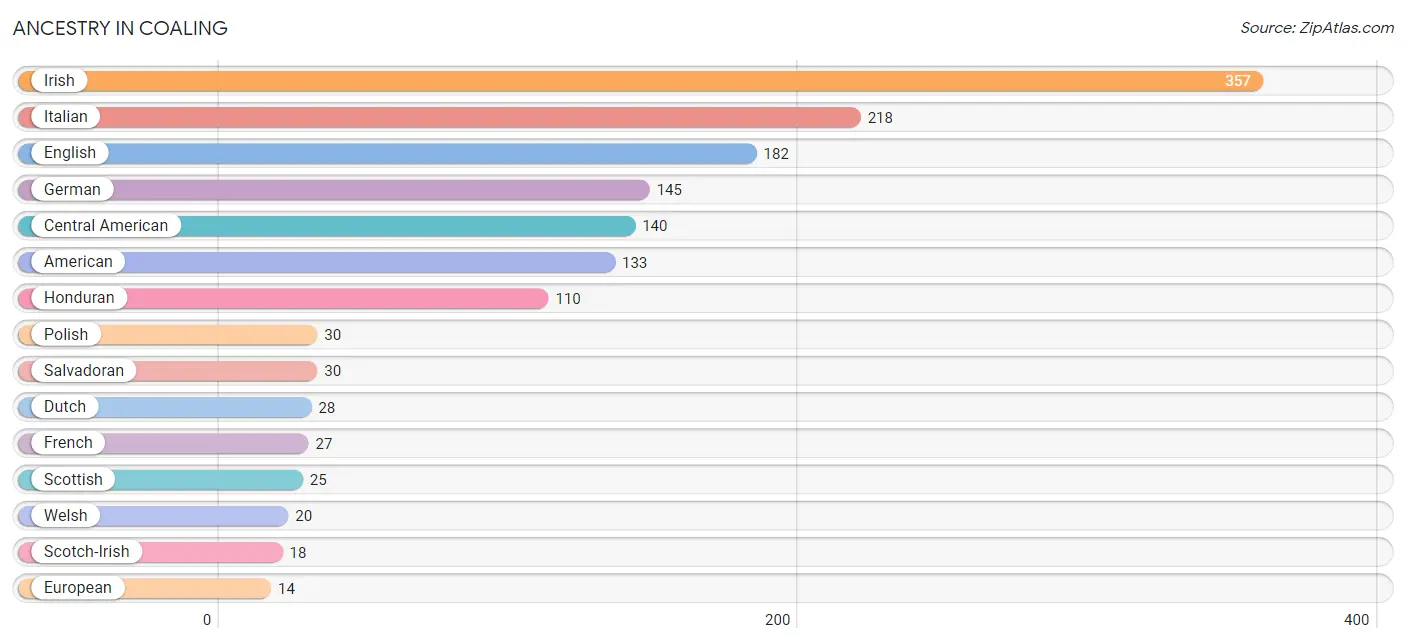
| Ancestry | # Population | % Population |
| American | 133 | 6.0% |
| Austrian | 4 | 0.2% |
| Central American | 140 | 6.4% |
| Croatian | 4 | 0.2% |
| Czech | 6 | 0.3% |
| Dutch | 28 | 1.3% |
| Eastern European | 11 | 0.5% |
| English | 182 | 8.3% |
| European | 14 | 0.6% |
| French | 27 | 1.2% |
| German | 145 | 6.6% |
| Honduran | 110 | 5.0% |
| Hungarian | 4 | 0.2% |
| Irish | 357 | 16.2% |
| Italian | 218 | 9.9% |
| Korean | 7 | 0.3% |
| Mexican | 5 | 0.2% |
| Peruvian | 4 | 0.2% |
| Polish | 30 | 1.4% |
| Russian | 4 | 0.2% |
| Salvadoran | 30 | 1.4% |
| Scotch-Irish | 18 | 0.8% |
| Scottish | 25 | 1.1% |
| South American | 4 | 0.2% |
| Swedish | 5 | 0.2% |
| Welsh | 20 | 0.9% | View All 26 Rows |
Immigrants in Coaling
The most numerous immigrant groups reported in Coaling came from Latin America (34 | 1.5%), Central America (30 | 1.4%), Honduras (24 | 1.1%), El Salvador (6 | 0.3%), and Peru (4 | 0.2%), together accounting for 4.4% of all Coaling residents.
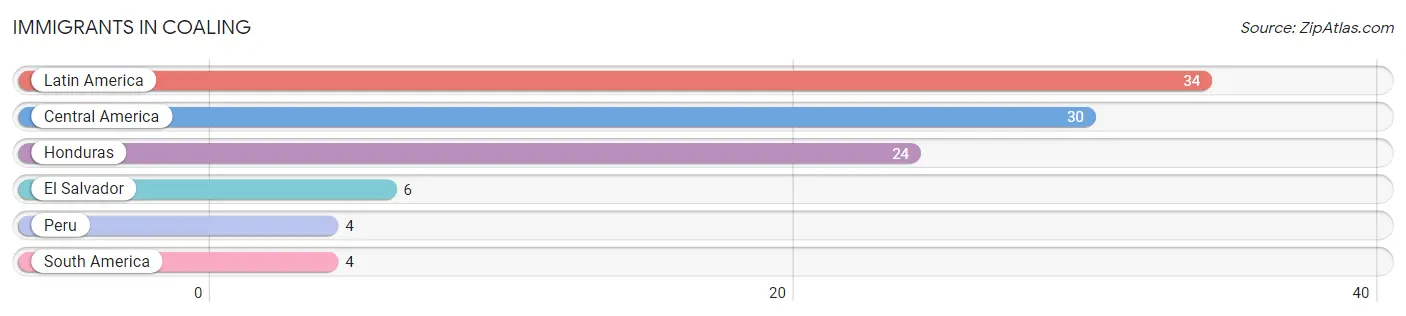
| Immigration Origin | # Population | % Population |
| Central America | 30 | 1.4% |
| El Salvador | 6 | 0.3% |
| Honduras | 24 | 1.1% |
| Latin America | 34 | 1.5% |
| Peru | 4 | 0.2% |
| South America | 4 | 0.2% | View All 6 Rows |
Sex and Age in Coaling
Sex and Age in Coaling
The most populous age groups in Coaling are 20 to 24 Years (165 | 14.4%) for men and 40 to 44 Years (169 | 16.0%) for women.
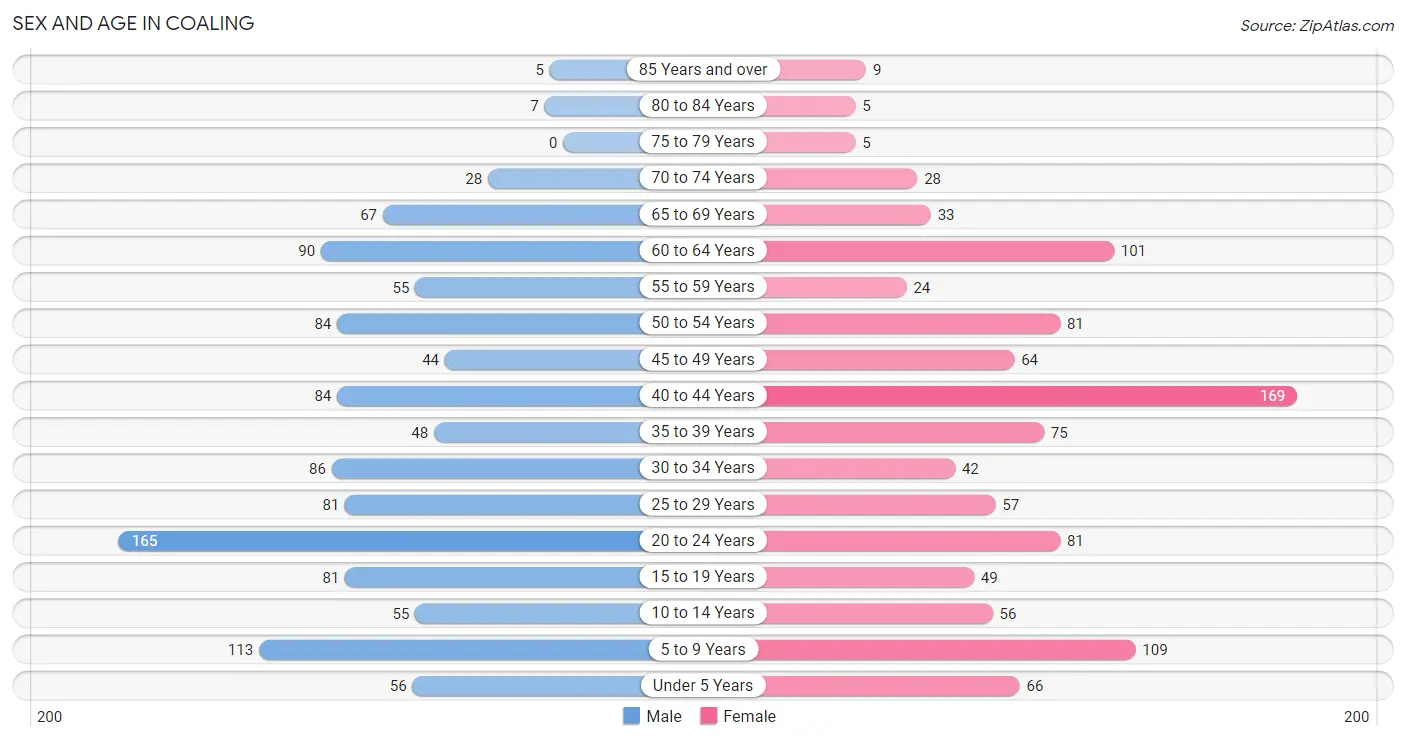
| Age Bracket | Male | Female |
| Under 5 Years | 56 (4.9%) | 66 (6.3%) |
| 5 to 9 Years | 113 (9.8%) | 109 (10.3%) |
| 10 to 14 Years | 55 (4.8%) | 56 (5.3%) |
| 15 to 19 Years | 81 (7.0%) | 49 (4.6%) |
| 20 to 24 Years | 165 (14.4%) | 81 (7.7%) |
| 25 to 29 Years | 81 (7.0%) | 57 (5.4%) |
| 30 to 34 Years | 86 (7.5%) | 42 (4.0%) |
| 35 to 39 Years | 48 (4.2%) | 75 (7.1%) |
| 40 to 44 Years | 84 (7.3%) | 169 (16.0%) |
| 45 to 49 Years | 44 (3.8%) | 64 (6.1%) |
| 50 to 54 Years | 84 (7.3%) | 81 (7.7%) |
| 55 to 59 Years | 55 (4.8%) | 24 (2.3%) |
| 60 to 64 Years | 90 (7.8%) | 101 (9.6%) |
| 65 to 69 Years | 67 (5.8%) | 33 (3.1%) |
| 70 to 74 Years | 28 (2.4%) | 28 (2.7%) |
| 75 to 79 Years | 0 (0.0%) | 5 (0.5%) |
| 80 to 84 Years | 7 (0.6%) | 5 (0.5%) |
| 85 Years and over | 5 (0.4%) | 9 (0.9%) |
| Total | 1,149 (100.0%) | 1,054 (100.0%) |
Families and Households in Coaling
Median Family Size in Coaling
The median family size in Coaling is 3.37 persons per family, with married-couple families (454 | 75.9%) accounting for the largest median family size of 3.54 persons per family. On the other hand, single male/father families (56 | 9.4%) represent the smallest median family size with 2.84 persons per family.
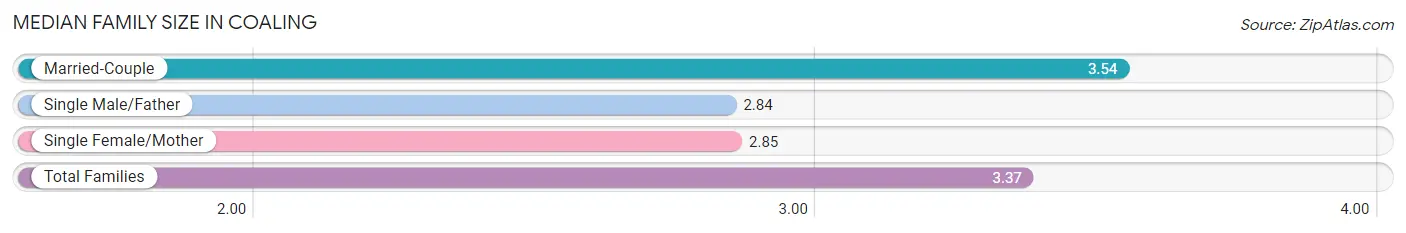
| Family Type | # Families | Family Size |
| Married-Couple | 454 (75.9%) | 3.54 |
| Single Male/Father | 56 (9.4%) | 2.84 |
| Single Female/Mother | 88 (14.7%) | 2.85 |
| Total Families | 598 (100.0%) | 3.37 |
Median Household Size in Coaling
The median household size in Coaling is 3.16 persons per household, with married-couple households (454 | 65.2%) accounting for the largest median household size of 3.54 persons per household. non-family households (98 | 14.1%) represent the smallest median household size with 1.33 persons per household.
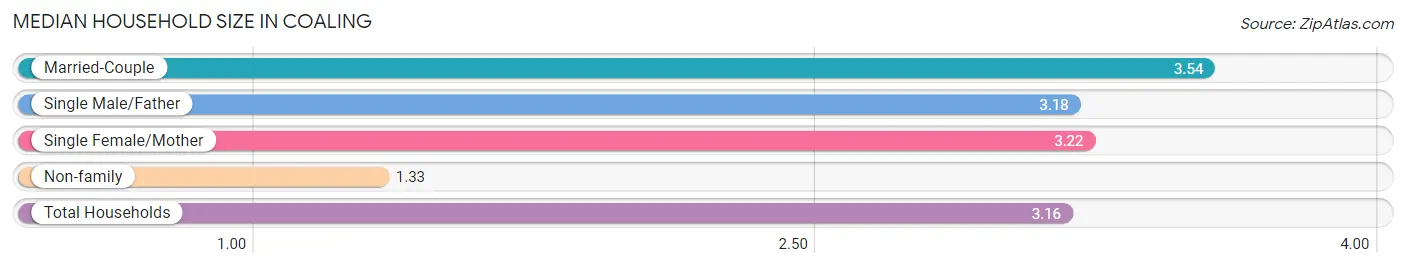
| Household Type | # Households | Household Size |
| Married-Couple | 454 (65.2%) | 3.54 |
| Single Male/Father | 56 (8.1%) | 3.18 |
| Single Female/Mother | 88 (12.6%) | 3.22 |
| Non-family | 98 (14.1%) | 1.33 |
| Total Households | 696 (100.0%) | 3.16 |
Household Size by Marriage Status in Coaling
Out of a total of 696 households in Coaling, 598 (85.9%) are family households, while 98 (14.1%) are nonfamily households. The most numerous type of family households are 2-person households, comprising 276, and the most common type of nonfamily households are 1-person households, comprising 66.
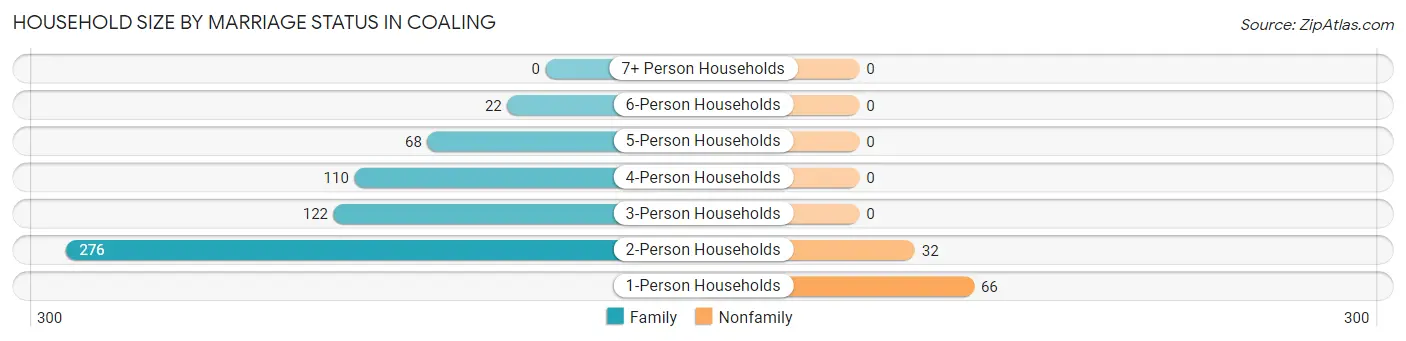
| Household Size | Family Households | Nonfamily Households |
| 1-Person Households | - | 66 (9.5%) |
| 2-Person Households | 276 (39.7%) | 32 (4.6%) |
| 3-Person Households | 122 (17.5%) | 0 (0.0%) |
| 4-Person Households | 110 (15.8%) | 0 (0.0%) |
| 5-Person Households | 68 (9.8%) | 0 (0.0%) |
| 6-Person Households | 22 (3.2%) | 0 (0.0%) |
| 7+ Person Households | 0 (0.0%) | 0 (0.0%) |
| Total | 598 (85.9%) | 98 (14.1%) |
Female Fertility in Coaling
Fertility by Age in Coaling
Average fertility rate in Coaling is 61.0 births per 1,000 women. Women in the age bracket of 20 to 34 years have the highest fertility rate with 183.0 births per 1,000 women. Women in the age bracket of 20 to 34 years acount for 100.0% of all women with births.
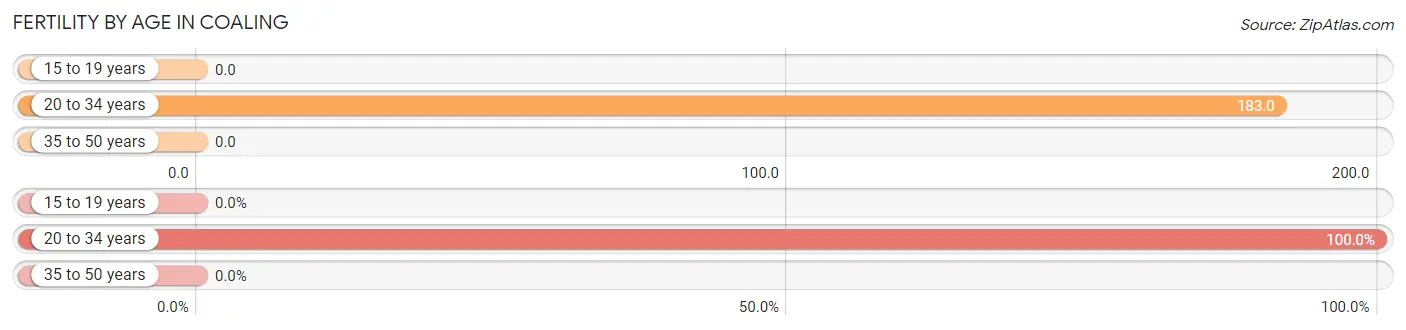
| Age Bracket | Women with Births | Births / 1,000 Women |
| 15 to 19 years | 0 (0.0%) | 0.0 |
| 20 to 34 years | 33 (100.0%) | 183.0 |
| 35 to 50 years | 0 (0.0%) | 0.0 |
| Total | 33 (100.0%) | 61.0 |
Fertility by Age by Marriage Status in Coaling
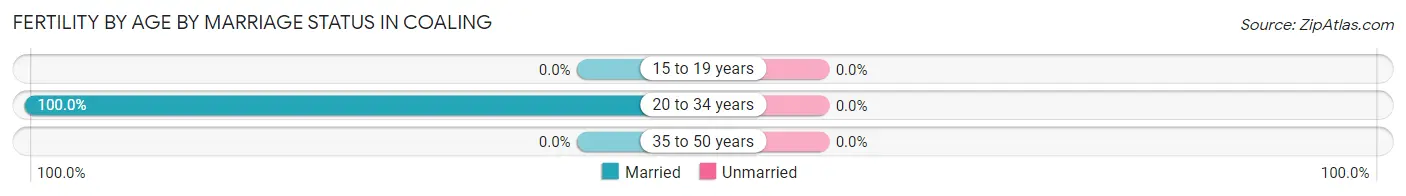
| Age Bracket | Married | Unmarried |
| 15 to 19 years | 0 (0.0%) | 0 (0.0%) |
| 20 to 34 years | 33 (100.0%) | 0 (0.0%) |
| 35 to 50 years | 0 (0.0%) | 0 (0.0%) |
| Total | 33 (100.0%) | 0 (0.0%) |
Fertility by Education in Coaling
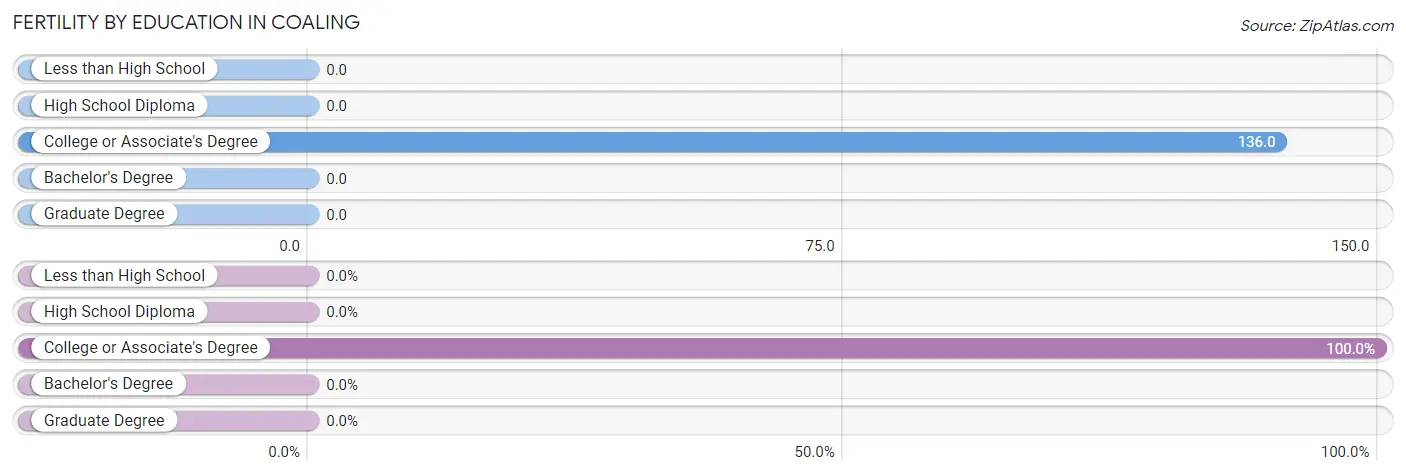
| Educational Attainment | Women with Births | Births / 1,000 Women |
| Less than High School | 0 (0.0%) | 0.0 |
| High School Diploma | 0 (0.0%) | 0.0 |
| College or Associate's Degree | 33 (100.0%) | 136.0 |
| Bachelor's Degree | 0 (0.0%) | 0.0 |
| Graduate Degree | 0 (0.0%) | 0.0 |
| Total | 33 (100.0%) | 61.0 |
Fertility by Education by Marriage Status in Coaling
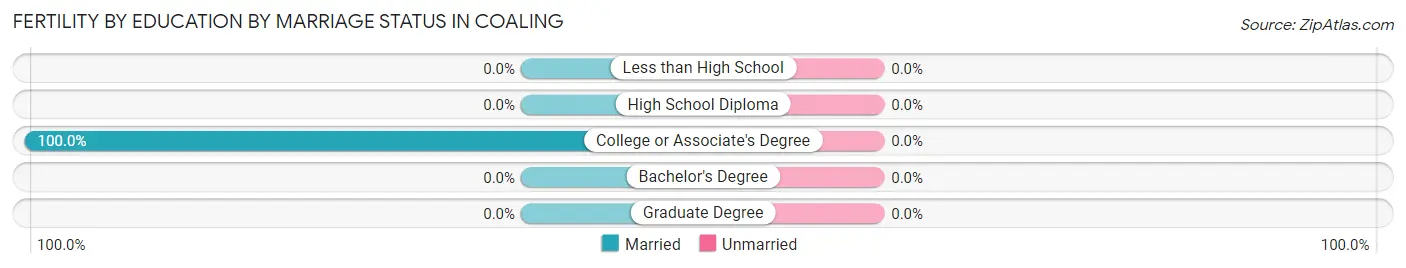
| Educational Attainment | Married | Unmarried |
| Less than High School | 0 (0.0%) | 0 (0.0%) |
| High School Diploma | 0 (0.0%) | 0 (0.0%) |
| College or Associate's Degree | 33 (100.0%) | 0 (0.0%) |
| Bachelor's Degree | 0 (0.0%) | 0 (0.0%) |
| Graduate Degree | 0 (0.0%) | 0 (0.0%) |
| Total | 33 (100.0%) | 0 (0.0%) |
Employment Characteristics in Coaling
Employment by Class of Employer in Coaling
Among the 1,074 employed individuals in Coaling, private company employees (808 | 75.2%), state government employees (107 | 10.0%), and local government employees (86 | 8.0%) make up the most common classes of employment.
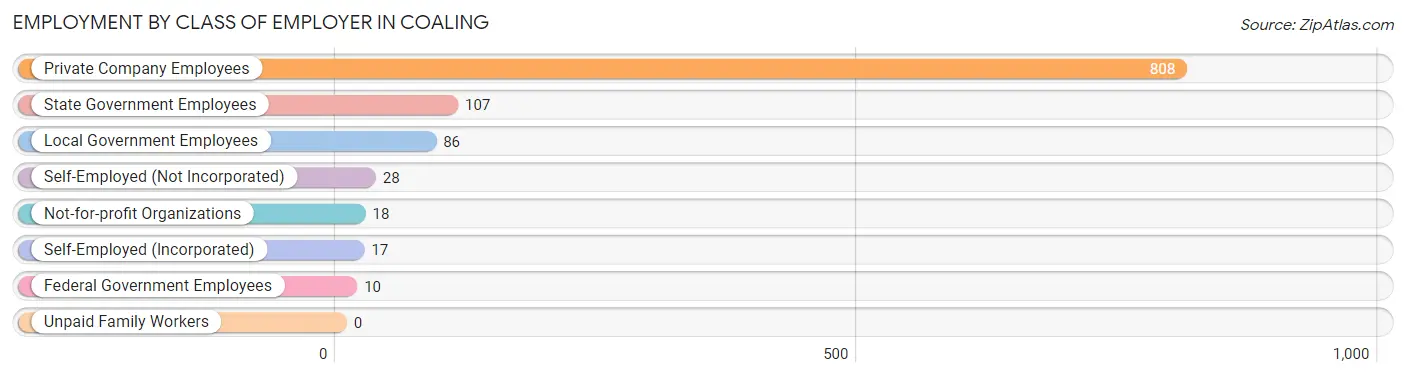
| Employer Class | # Employees | % Employees |
| Private Company Employees | 808 | 75.2% |
| Self-Employed (Incorporated) | 17 | 1.6% |
| Self-Employed (Not Incorporated) | 28 | 2.6% |
| Not-for-profit Organizations | 18 | 1.7% |
| Local Government Employees | 86 | 8.0% |
| State Government Employees | 107 | 10.0% |
| Federal Government Employees | 10 | 0.9% |
| Unpaid Family Workers | 0 | 0.0% |
| Total | 1,074 | 100.0% |
Employment Status by Age in Coaling
According to the labor force statistics for Coaling, out of the total population over 16 years of age (1,696), 71.9% or 1,219 individuals are in the labor force, with 12.0% or 146 of them unemployed. The age group with the highest labor force participation rate is 35 to 44 years, with 95.2% or 358 individuals in the labor force. Within the labor force, the 35 to 44 years age range has the highest percentage of unemployed individuals, with 24.9% or 89 of them being unemployed.
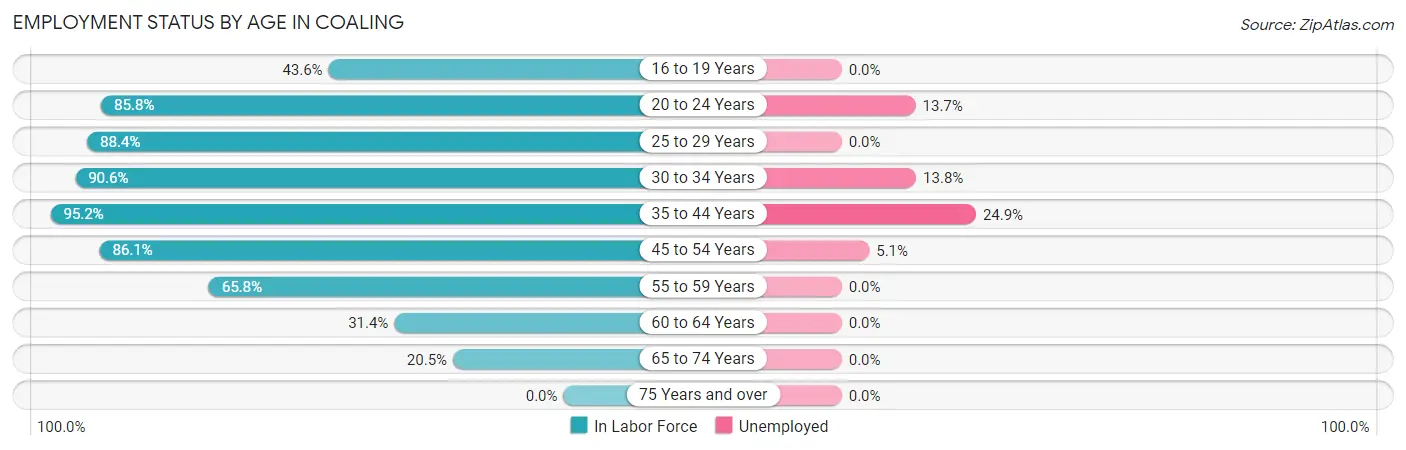
| Age Bracket | In Labor Force | Unemployed |
| 16 to 19 Years | 34 (43.6%) | 0 (0.0%) |
| 20 to 24 Years | 211 (85.8%) | 29 (13.7%) |
| 25 to 29 Years | 122 (88.4%) | 0 (0.0%) |
| 30 to 34 Years | 116 (90.6%) | 16 (13.8%) |
| 35 to 44 Years | 358 (95.2%) | 89 (24.9%) |
| 45 to 54 Years | 235 (86.1%) | 12 (5.1%) |
| 55 to 59 Years | 52 (65.8%) | 0 (0.0%) |
| 60 to 64 Years | 60 (31.4%) | 0 (0.0%) |
| 65 to 74 Years | 32 (20.5%) | 0 (0.0%) |
| 75 Years and over | 0 (0.0%) | 0 (0.0%) |
| Total | 1,219 (71.9%) | 146 (12.0%) |
Employment Status by Educational Attainment in Coaling
According to labor force statistics for Coaling, 79.6% of individuals (943) out of the total population between 25 and 64 years of age (1,185) are in the labor force, with 12.4% or 117 of them being unemployed. The group with the highest labor force participation rate are those with the educational attainment of bachelor's degree or higher, with 96.2% or 150 individuals in the labor force. Within the labor force, individuals with college / associate degree education have the highest percentage of unemployment, with 24.0% or 89 of them being unemployed.
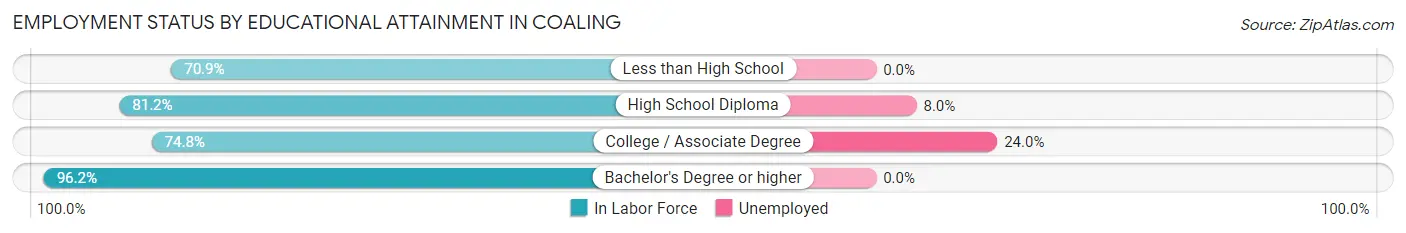
| Educational Attainment | In Labor Force | Unemployed |
| Less than High School | 73 (70.9%) | 0 (0.0%) |
| High School Diploma | 349 (81.2%) | 34 (8.0%) |
| College / Associate Degree | 371 (74.8%) | 119 (24.0%) |
| Bachelor's Degree or higher | 150 (96.2%) | 0 (0.0%) |
| Total | 943 (79.6%) | 147 (12.4%) |
Employment Occupations by Sex in Coaling
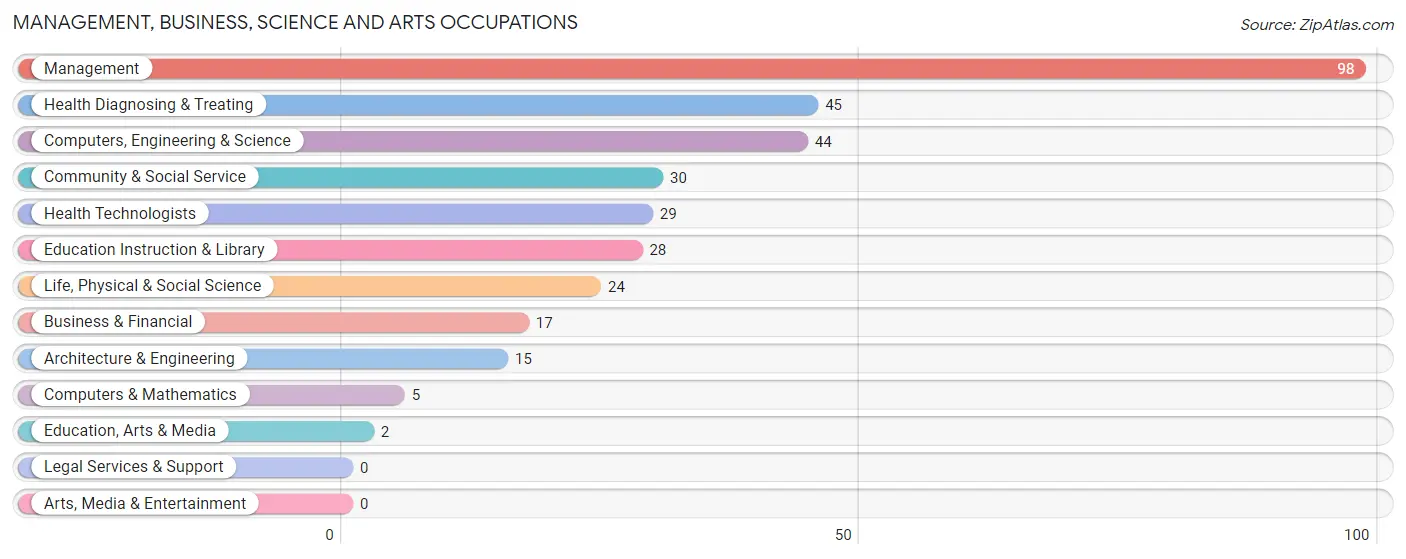
Management, Business, Science and Arts Occupations
The most common Management, Business, Science and Arts occupations in Coaling are Management (98 | 9.1%), Health Diagnosing & Treating (45 | 4.2%), Computers, Engineering & Science (44 | 4.1%), Community & Social Service (30 | 2.8%), and Health Technologists (29 | 2.7%).
Management, Business, Science and Arts Occupations by Sex
Within the Management, Business, Science and Arts occupations in Coaling, the most male-oriented occupations are Business & Financial (100.0%), Computers, Engineering & Science (100.0%), and Computers & Mathematics (100.0%), while the most female-oriented occupations are Education, Arts & Media (100.0%), Health Diagnosing & Treating (100.0%), and Health Technologists (100.0%).
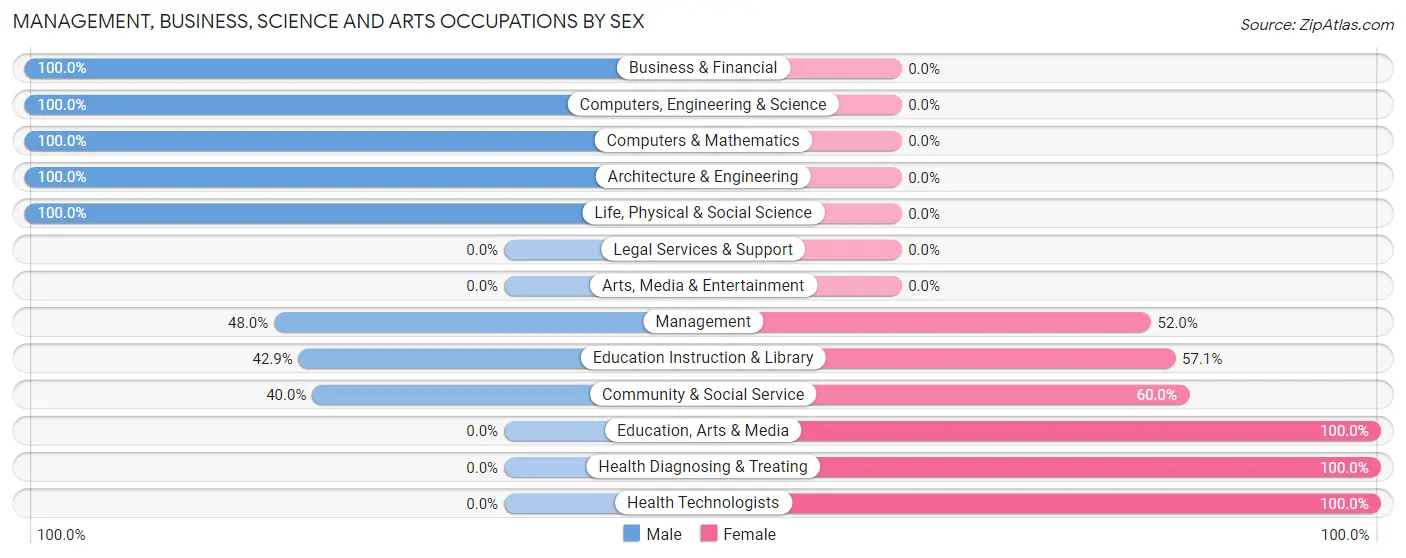
| Occupation | Male | Female |
| Management | 47 (48.0%) | 51 (52.0%) |
| Business & Financial | 17 (100.0%) | 0 (0.0%) |
| Computers, Engineering & Science | 44 (100.0%) | 0 (0.0%) |
| Computers & Mathematics | 5 (100.0%) | 0 (0.0%) |
| Architecture & Engineering | 15 (100.0%) | 0 (0.0%) |
| Life, Physical & Social Science | 24 (100.0%) | 0 (0.0%) |
| Community & Social Service | 12 (40.0%) | 18 (60.0%) |
| Education, Arts & Media | 0 (0.0%) | 2 (100.0%) |
| Legal Services & Support | 0 (0.0%) | 0 (0.0%) |
| Education Instruction & Library | 12 (42.9%) | 16 (57.1%) |
| Arts, Media & Entertainment | 0 (0.0%) | 0 (0.0%) |
| Health Diagnosing & Treating | 0 (0.0%) | 45 (100.0%) |
| Health Technologists | 0 (0.0%) | 29 (100.0%) |
| Total (Category) | 120 (51.3%) | 114 (48.7%) |
| Total (Overall) | 640 (59.6%) | 434 (40.4%) |
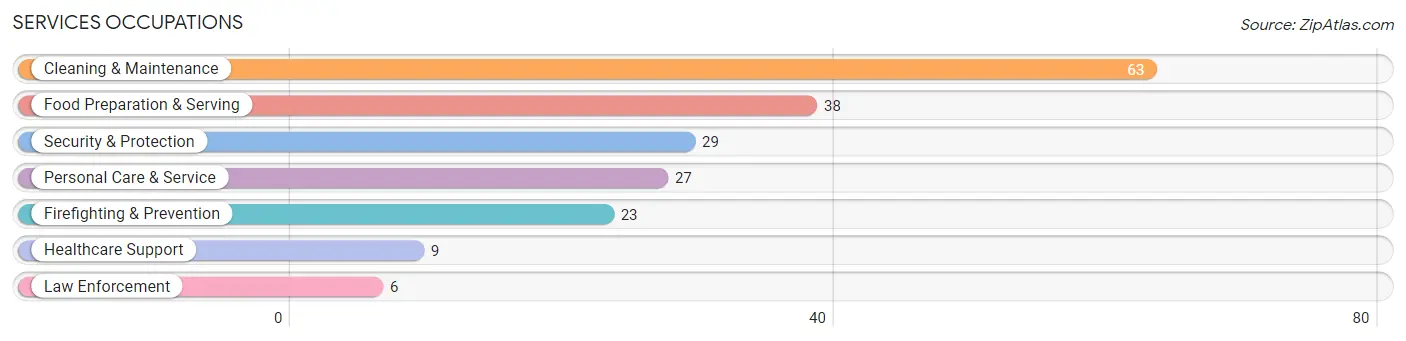
Services Occupations
The most common Services occupations in Coaling are Cleaning & Maintenance (63 | 5.9%), Food Preparation & Serving (38 | 3.5%), Security & Protection (29 | 2.7%), Personal Care & Service (27 | 2.5%), and Firefighting & Prevention (23 | 2.1%).
Services Occupations by Sex
Within the Services occupations in Coaling, the most male-oriented occupations are Security & Protection (100.0%), Firefighting & Prevention (100.0%), and Law Enforcement (100.0%), while the most female-oriented occupations are Healthcare Support (100.0%), Food Preparation & Serving (100.0%), and Personal Care & Service (100.0%).
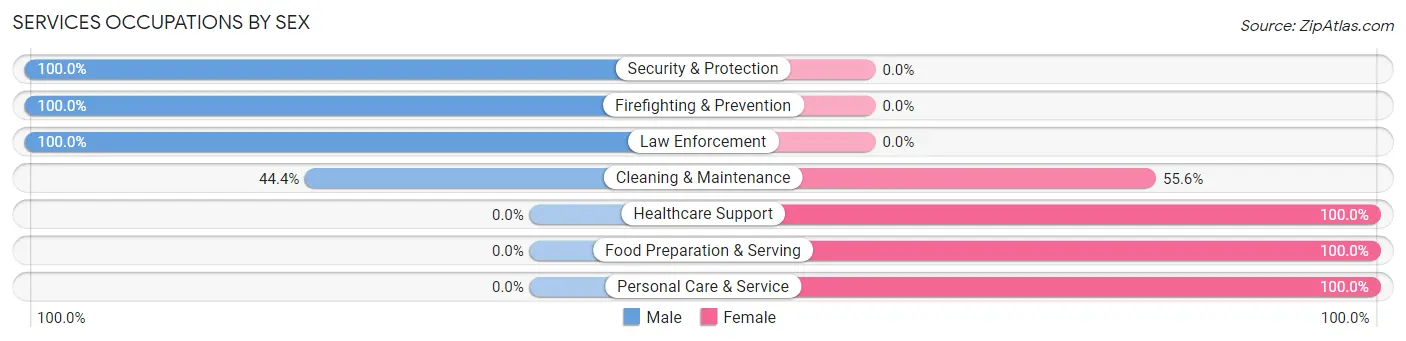
| Occupation | Male | Female |
| Healthcare Support | 0 (0.0%) | 9 (100.0%) |
| Security & Protection | 29 (100.0%) | 0 (0.0%) |
| Firefighting & Prevention | 23 (100.0%) | 0 (0.0%) |
| Law Enforcement | 6 (100.0%) | 0 (0.0%) |
| Food Preparation & Serving | 0 (0.0%) | 38 (100.0%) |
| Cleaning & Maintenance | 28 (44.4%) | 35 (55.6%) |
| Personal Care & Service | 0 (0.0%) | 27 (100.0%) |
| Total (Category) | 57 (34.3%) | 109 (65.7%) |
| Total (Overall) | 640 (59.6%) | 434 (40.4%) |
Sales and Office Occupations
The most common Sales and Office occupations in Coaling are Office & Administration (194 | 18.1%), and Sales & Related (31 | 2.9%).
Sales and Office Occupations by Sex
| Occupation | Male | Female |
| Sales & Related | 17 (54.8%) | 14 (45.2%) |
| Office & Administration | 64 (33.0%) | 130 (67.0%) |
| Total (Category) | 81 (36.0%) | 144 (64.0%) |
| Total (Overall) | 640 (59.6%) | 434 (40.4%) |
Natural Resources, Construction and Maintenance Occupations
The most common Natural Resources, Construction and Maintenance occupations in Coaling are Construction & Extraction (106 | 9.9%), and Installation, Maintenance & Repair (35 | 3.3%).
Natural Resources, Construction and Maintenance Occupations by Sex
| Occupation | Male | Female |
| Farming, Fishing & Forestry | 0 (0.0%) | 0 (0.0%) |
| Construction & Extraction | 106 (100.0%) | 0 (0.0%) |
| Installation, Maintenance & Repair | 34 (97.1%) | 1 (2.9%) |
| Total (Category) | 140 (99.3%) | 1 (0.7%) |
| Total (Overall) | 640 (59.6%) | 434 (40.4%) |
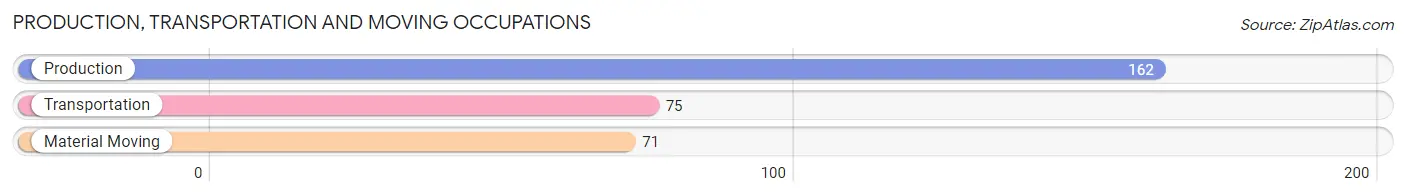
Production, Transportation and Moving Occupations
The most common Production, Transportation and Moving occupations in Coaling are Production (162 | 15.1%), Transportation (75 | 7.0%), and Material Moving (71 | 6.6%).
Production, Transportation and Moving Occupations by Sex
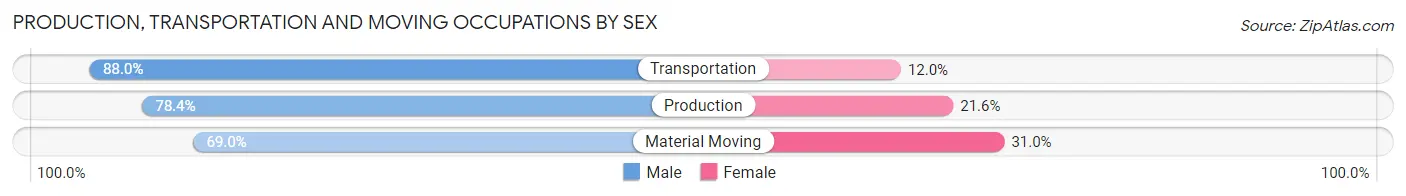
| Occupation | Male | Female |
| Production | 127 (78.4%) | 35 (21.6%) |
| Transportation | 66 (88.0%) | 9 (12.0%) |
| Material Moving | 49 (69.0%) | 22 (31.0%) |
| Total (Category) | 242 (78.6%) | 66 (21.4%) |
| Total (Overall) | 640 (59.6%) | 434 (40.4%) |
Employment Industries by Sex in Coaling
Employment Industries in Coaling
The major employment industries in Coaling include Manufacturing (236 | 22.0%), Educational Services (135 | 12.6%), Health Care & Social Assistance (110 | 10.2%), Construction (96 | 8.9%), and Transportation & Warehousing (92 | 8.6%).
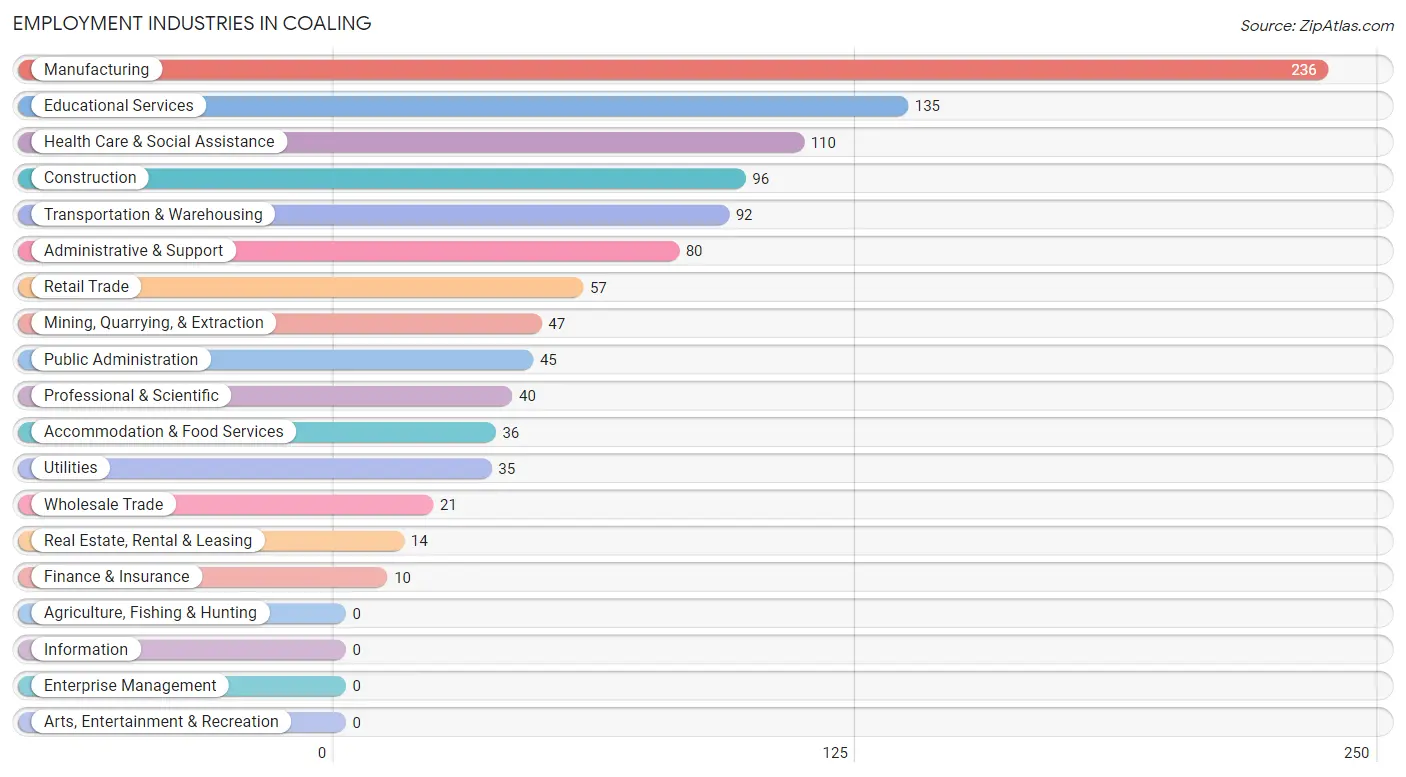
Employment Industries by Sex in Coaling
The Coaling industries that see more men than women are Mining, Quarrying, & Extraction (100.0%), Wholesale Trade (100.0%), and Utilities (100.0%), whereas the industries that tend to have a higher number of women are Finance & Insurance (100.0%), Health Care & Social Assistance (90.9%), and Accommodation & Food Services (83.3%).
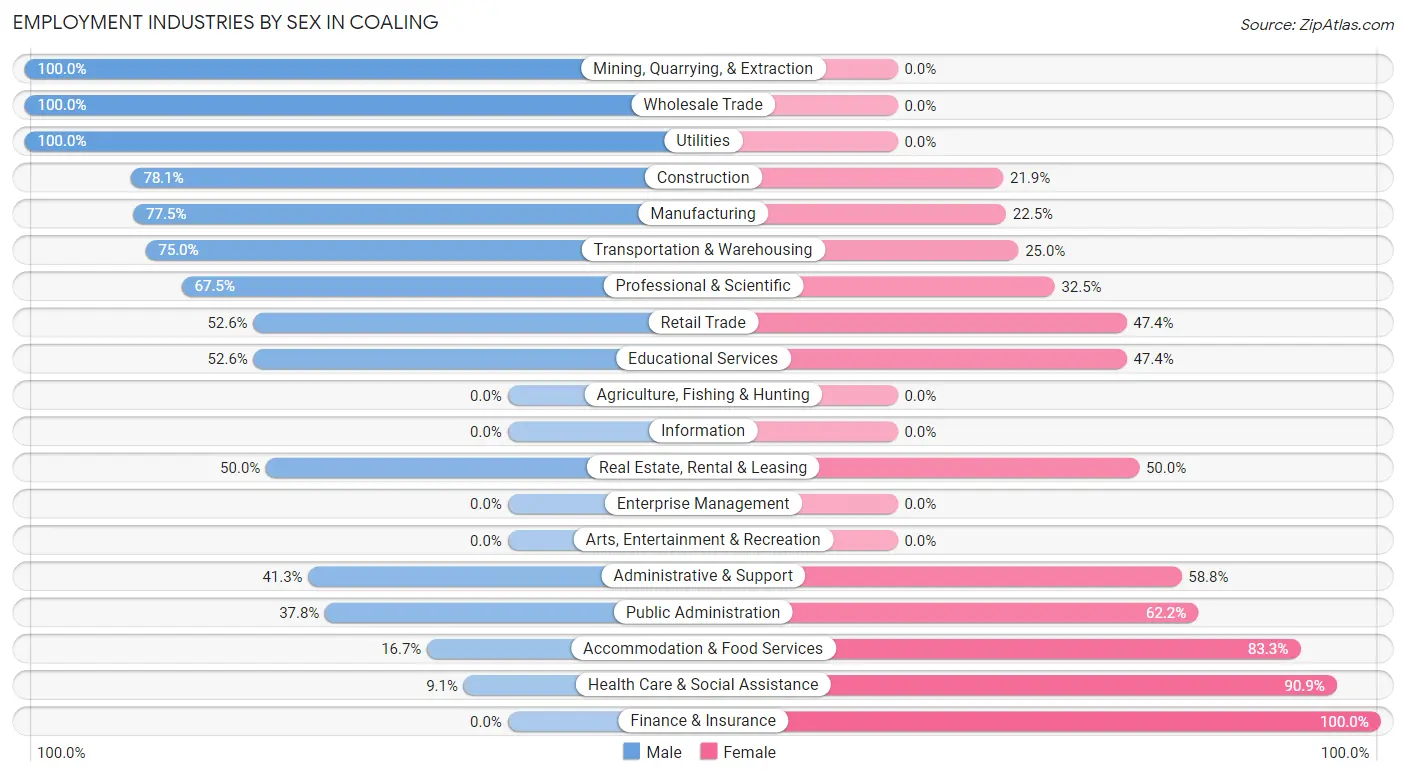
| Industry | Male | Female |
| Agriculture, Fishing & Hunting | 0 (0.0%) | 0 (0.0%) |
| Mining, Quarrying, & Extraction | 47 (100.0%) | 0 (0.0%) |
| Construction | 75 (78.1%) | 21 (21.9%) |
| Manufacturing | 183 (77.5%) | 53 (22.5%) |
| Wholesale Trade | 21 (100.0%) | 0 (0.0%) |
| Retail Trade | 30 (52.6%) | 27 (47.4%) |
| Transportation & Warehousing | 69 (75.0%) | 23 (25.0%) |
| Utilities | 35 (100.0%) | 0 (0.0%) |
| Information | 0 (0.0%) | 0 (0.0%) |
| Finance & Insurance | 0 (0.0%) | 10 (100.0%) |
| Real Estate, Rental & Leasing | 7 (50.0%) | 7 (50.0%) |
| Professional & Scientific | 27 (67.5%) | 13 (32.5%) |
| Enterprise Management | 0 (0.0%) | 0 (0.0%) |
| Administrative & Support | 33 (41.2%) | 47 (58.8%) |
| Educational Services | 71 (52.6%) | 64 (47.4%) |
| Health Care & Social Assistance | 10 (9.1%) | 100 (90.9%) |
| Arts, Entertainment & Recreation | 0 (0.0%) | 0 (0.0%) |
| Accommodation & Food Services | 6 (16.7%) | 30 (83.3%) |
| Public Administration | 17 (37.8%) | 28 (62.2%) |
| Total | 640 (59.6%) | 434 (40.4%) |
Education in Coaling
School Enrollment in Coaling
The most common levels of schooling among the 545 students in Coaling are elementary school (197 | 36.1%), high school (113 | 20.7%), and college / undergraduate (108 | 19.8%).
| School Level | # Students | % Students |
| Nursery / Preschool | 16 | 2.9% |
| Kindergarten | 23 | 4.2% |
| Elementary School | 197 | 36.1% |
| Middle School | 80 | 14.7% |
| High School | 113 | 20.7% |
| College / Undergraduate | 108 | 19.8% |
| Graduate / Professional | 8 | 1.5% |
| Total | 545 | 100.0% |
School Enrollment by Age by Funding Source in Coaling
Out of a total of 545 students who are enrolled in schools in Coaling, 85 (15.6%) attend a private institution, while the remaining 460 (84.4%) are enrolled in public schools. The age group of 3 to 4 year olds has the highest likelihood of being enrolled in private schools, with 15 (93.8% in the age bracket) enrolled. Conversely, the age group of 18 to 19 year olds has the lowest likelihood of being enrolled in a private school, with 12 (100.0% in the age bracket) attending a public institution.
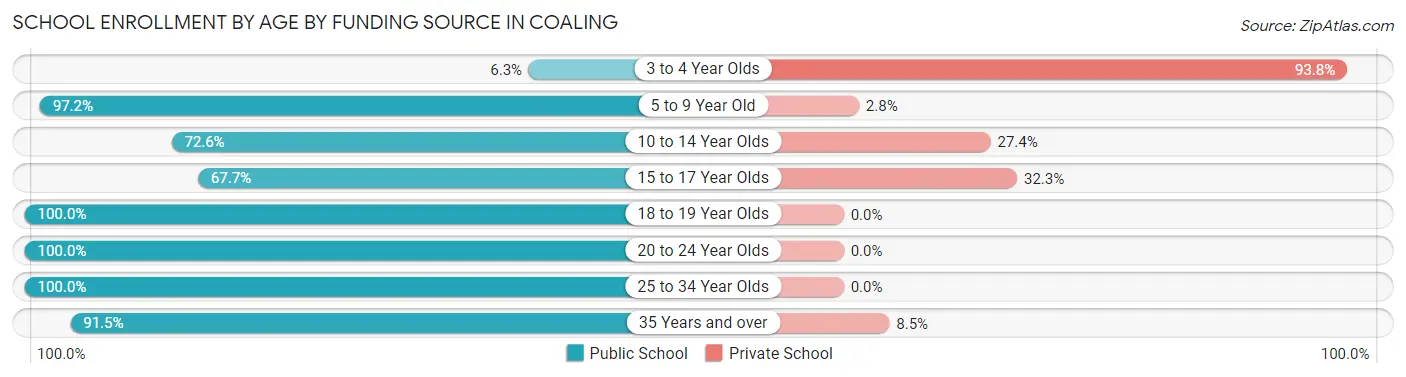
| Age Bracket | Public School | Private School |
| 3 to 4 Year Olds | 1 (6.2%) | 15 (93.8%) |
| 5 to 9 Year Old | 205 (97.2%) | 6 (2.8%) |
| 10 to 14 Year Olds | 77 (72.6%) | 29 (27.4%) |
| 15 to 17 Year Olds | 65 (67.7%) | 31 (32.3%) |
| 18 to 19 Year Olds | 12 (100.0%) | 0 (0.0%) |
| 20 to 24 Year Olds | 37 (100.0%) | 0 (0.0%) |
| 25 to 34 Year Olds | 20 (100.0%) | 0 (0.0%) |
| 35 Years and over | 43 (91.5%) | 4 (8.5%) |
| Total | 460 (84.4%) | 85 (15.6%) |
Educational Attainment by Field of Study in Coaling
Business (66 | 29.1%), science & technology (41 | 18.1%), physical & health sciences (23 | 10.1%), psychology (23 | 10.1%), and social sciences (18 | 7.9%) are the most common fields of study among 227 individuals in Coaling who have obtained a bachelor's degree or higher.
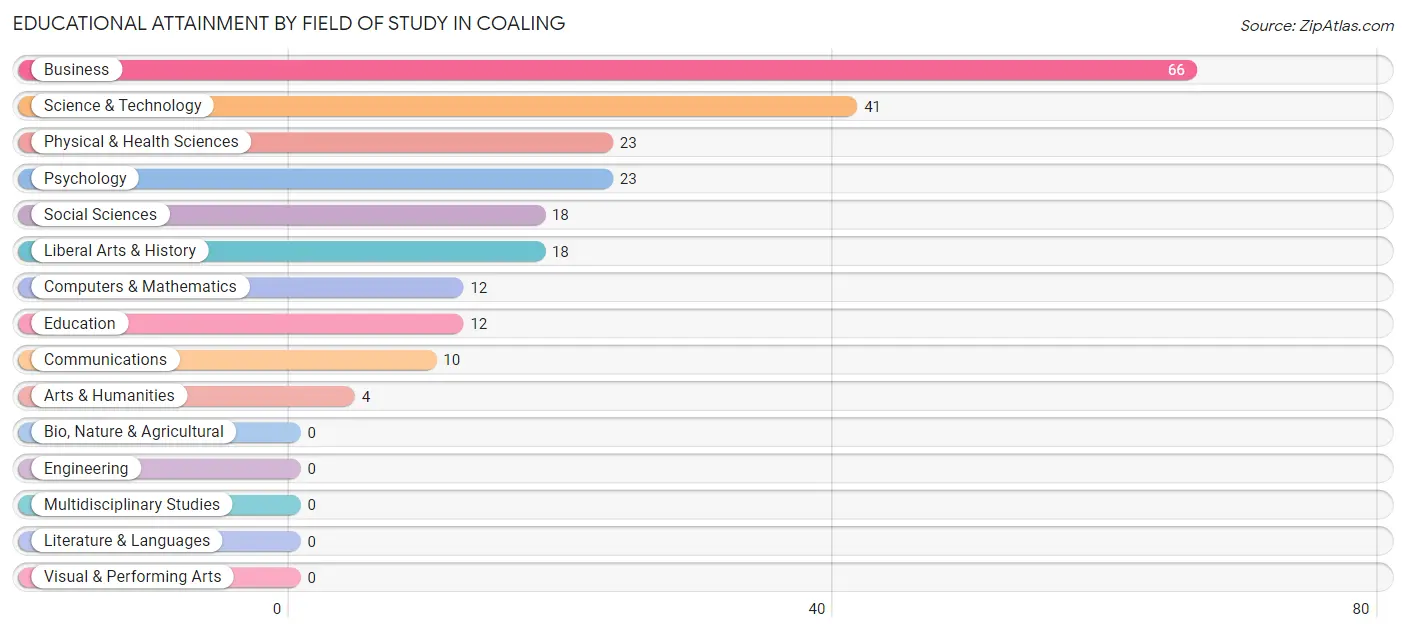
| Field of Study | # Graduates | % Graduates |
| Computers & Mathematics | 12 | 5.3% |
| Bio, Nature & Agricultural | 0 | 0.0% |
| Physical & Health Sciences | 23 | 10.1% |
| Psychology | 23 | 10.1% |
| Social Sciences | 18 | 7.9% |
| Engineering | 0 | 0.0% |
| Multidisciplinary Studies | 0 | 0.0% |
| Science & Technology | 41 | 18.1% |
| Business | 66 | 29.1% |
| Education | 12 | 5.3% |
| Literature & Languages | 0 | 0.0% |
| Liberal Arts & History | 18 | 7.9% |
| Visual & Performing Arts | 0 | 0.0% |
| Communications | 10 | 4.4% |
| Arts & Humanities | 4 | 1.8% |
| Total | 227 | 100.0% |
Transportation & Commute in Coaling
Vehicle Availability by Sex in Coaling
The most prevalent vehicle ownership categories in Coaling are males with 2 vehicles (248, accounting for 38.8%) and females with 2 vehicles (155, making up 57.1%).
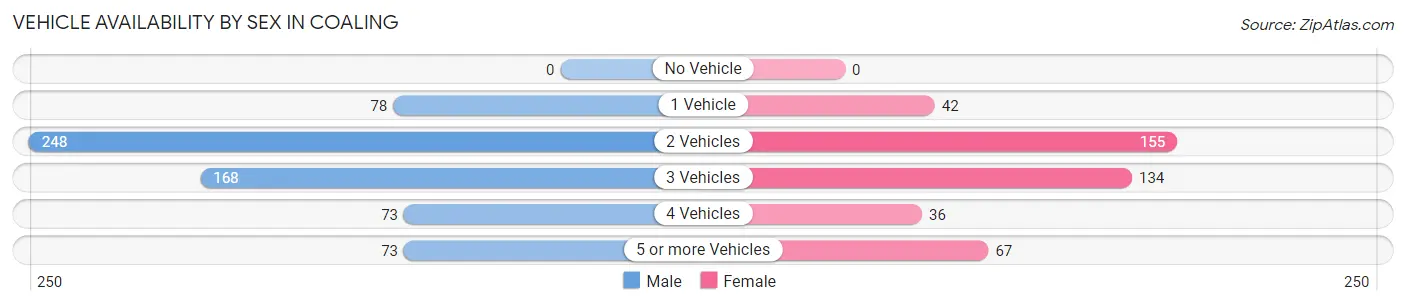
| Vehicles Available | Male | Female |
| No Vehicle | 0 (0.0%) | 0 (0.0%) |
| 1 Vehicle | 78 (12.2%) | 42 (9.7%) |
| 2 Vehicles | 248 (38.8%) | 155 (35.7%) |
| 3 Vehicles | 168 (26.3%) | 134 (30.9%) |
| 4 Vehicles | 73 (11.4%) | 36 (8.3%) |
| 5 or more Vehicles | 73 (11.4%) | 67 (15.4%) |
| Total | 640 (100.0%) | 434 (100.0%) |
Commute Time in Coaling
The most frequently occuring commute durations in Coaling are 20 to 24 minutes (223 commuters, 21.5%), 15 to 19 minutes (162 commuters, 15.7%), and 30 to 34 minutes (125 commuters, 12.1%).
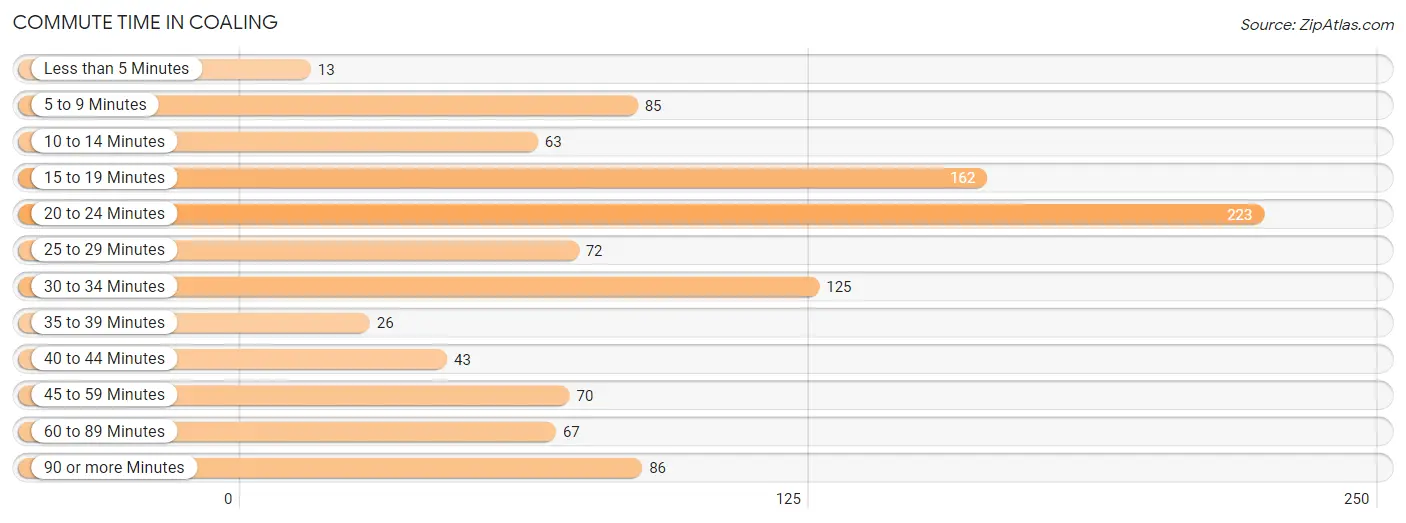
| Commute Time | # Commuters | % Commuters |
| Less than 5 Minutes | 13 | 1.3% |
| 5 to 9 Minutes | 85 | 8.2% |
| 10 to 14 Minutes | 63 | 6.1% |
| 15 to 19 Minutes | 162 | 15.7% |
| 20 to 24 Minutes | 223 | 21.5% |
| 25 to 29 Minutes | 72 | 7.0% |
| 30 to 34 Minutes | 125 | 12.1% |
| 35 to 39 Minutes | 26 | 2.5% |
| 40 to 44 Minutes | 43 | 4.2% |
| 45 to 59 Minutes | 70 | 6.8% |
| 60 to 89 Minutes | 67 | 6.5% |
| 90 or more Minutes | 86 | 8.3% |
Commute Time by Sex in Coaling
The most common commute times in Coaling are 20 to 24 minutes (115 commuters, 18.4%) for males and 20 to 24 minutes (108 commuters, 26.4%) for females.
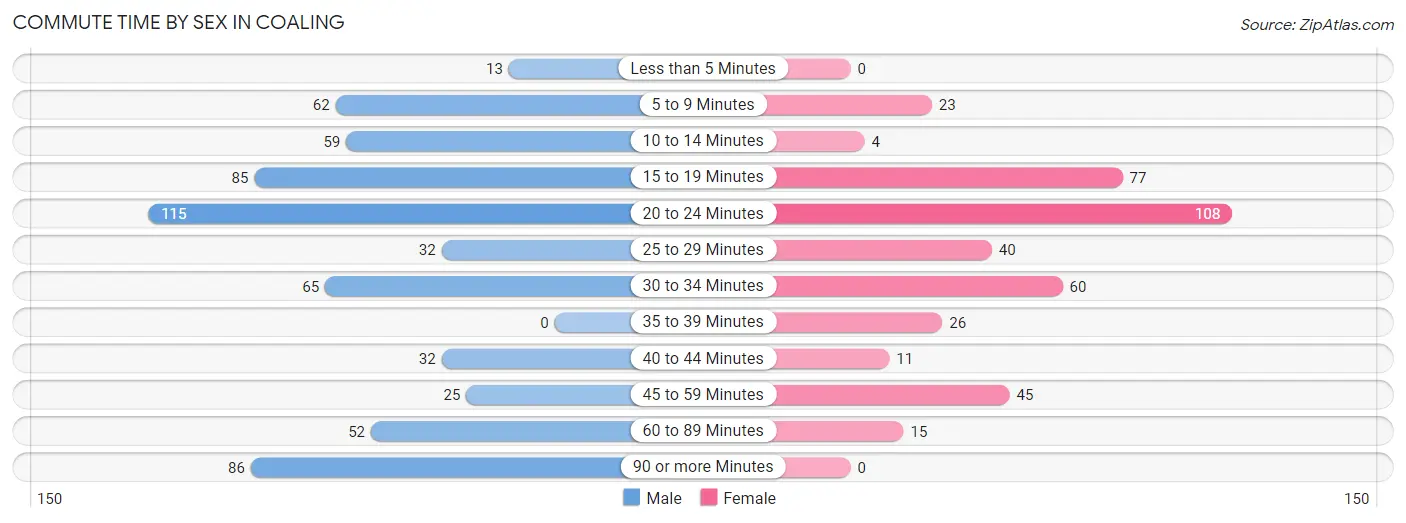
| Commute Time | Male | Female |
| Less than 5 Minutes | 13 (2.1%) | 0 (0.0%) |
| 5 to 9 Minutes | 62 (9.9%) | 23 (5.6%) |
| 10 to 14 Minutes | 59 (9.4%) | 4 (1.0%) |
| 15 to 19 Minutes | 85 (13.6%) | 77 (18.8%) |
| 20 to 24 Minutes | 115 (18.4%) | 108 (26.4%) |
| 25 to 29 Minutes | 32 (5.1%) | 40 (9.8%) |
| 30 to 34 Minutes | 65 (10.4%) | 60 (14.7%) |
| 35 to 39 Minutes | 0 (0.0%) | 26 (6.4%) |
| 40 to 44 Minutes | 32 (5.1%) | 11 (2.7%) |
| 45 to 59 Minutes | 25 (4.0%) | 45 (11.0%) |
| 60 to 89 Minutes | 52 (8.3%) | 15 (3.7%) |
| 90 or more Minutes | 86 (13.7%) | 0 (0.0%) |
Time of Departure to Work by Sex in Coaling
The most frequent times of departure to work in Coaling are 4:00 PM to 11:59 PM (113, 18.0%) for males and 7:30 AM to 7:59 AM (113, 27.6%) for females.
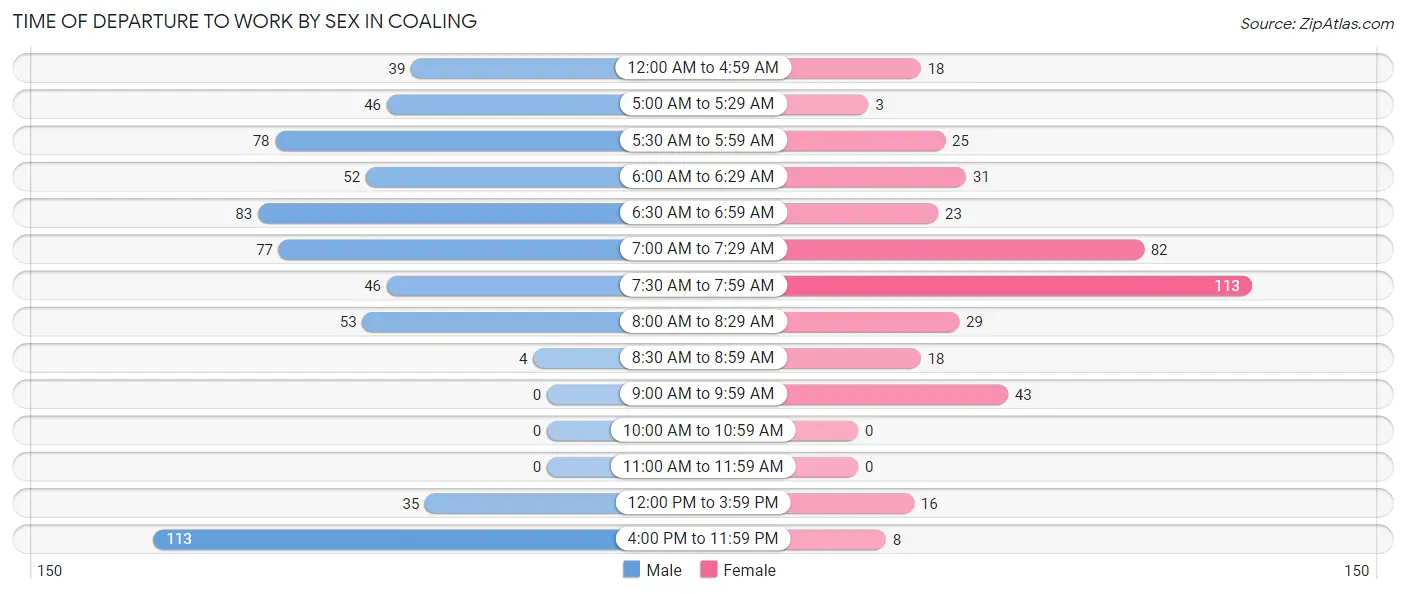
| Time of Departure | Male | Female |
| 12:00 AM to 4:59 AM | 39 (6.2%) | 18 (4.4%) |
| 5:00 AM to 5:29 AM | 46 (7.3%) | 3 (0.7%) |
| 5:30 AM to 5:59 AM | 78 (12.5%) | 25 (6.1%) |
| 6:00 AM to 6:29 AM | 52 (8.3%) | 31 (7.6%) |
| 6:30 AM to 6:59 AM | 83 (13.3%) | 23 (5.6%) |
| 7:00 AM to 7:29 AM | 77 (12.3%) | 82 (20.1%) |
| 7:30 AM to 7:59 AM | 46 (7.3%) | 113 (27.6%) |
| 8:00 AM to 8:29 AM | 53 (8.5%) | 29 (7.1%) |
| 8:30 AM to 8:59 AM | 4 (0.6%) | 18 (4.4%) |
| 9:00 AM to 9:59 AM | 0 (0.0%) | 43 (10.5%) |
| 10:00 AM to 10:59 AM | 0 (0.0%) | 0 (0.0%) |
| 11:00 AM to 11:59 AM | 0 (0.0%) | 0 (0.0%) |
| 12:00 PM to 3:59 PM | 35 (5.6%) | 16 (3.9%) |
| 4:00 PM to 11:59 PM | 113 (18.0%) | 8 (2.0%) |
| Total | 626 (100.0%) | 409 (100.0%) |
Housing Occupancy in Coaling
Occupancy by Ownership in Coaling
Of the total 696 dwellings in Coaling, owner-occupied units account for 632 (90.8%), while renter-occupied units make up 64 (9.2%).
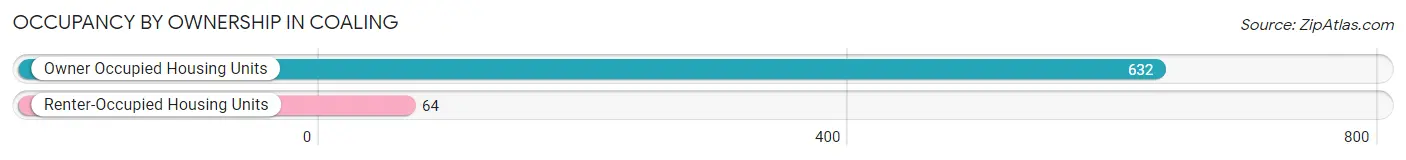
| Occupancy | # Housing Units | % Housing Units |
| Owner Occupied Housing Units | 632 | 90.8% |
| Renter-Occupied Housing Units | 64 | 9.2% |
| Total Occupied Housing Units | 696 | 100.0% |
Occupancy by Household Size in Coaling
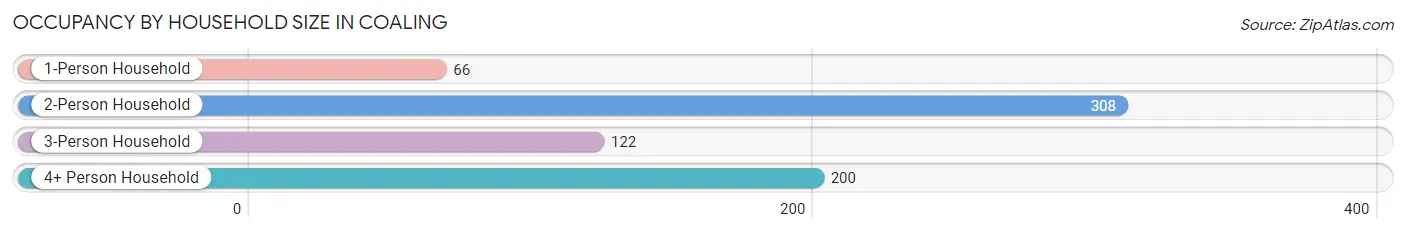
| Household Size | # Housing Units | % Housing Units |
| 1-Person Household | 66 | 9.5% |
| 2-Person Household | 308 | 44.3% |
| 3-Person Household | 122 | 17.5% |
| 4+ Person Household | 200 | 28.7% |
| Total Housing Units | 696 | 100.0% |
Occupancy by Ownership by Household Size in Coaling
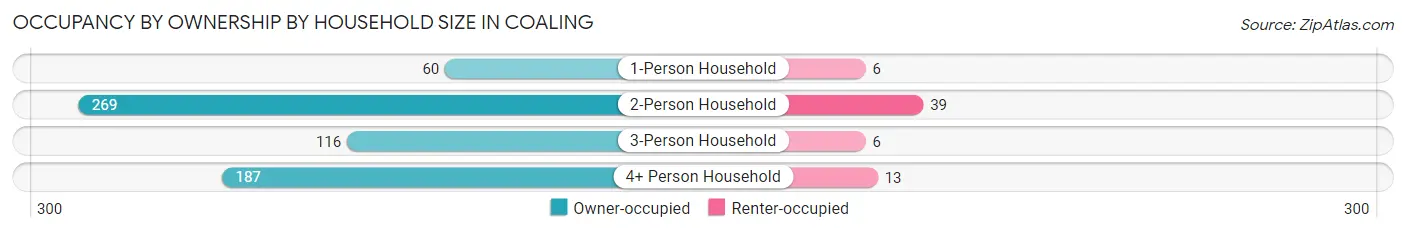
| Household Size | Owner-occupied | Renter-occupied |
| 1-Person Household | 60 (90.9%) | 6 (9.1%) |
| 2-Person Household | 269 (87.3%) | 39 (12.7%) |
| 3-Person Household | 116 (95.1%) | 6 (4.9%) |
| 4+ Person Household | 187 (93.5%) | 13 (6.5%) |
| Total Housing Units | 632 (90.8%) | 64 (9.2%) |
Occupancy by Educational Attainment in Coaling
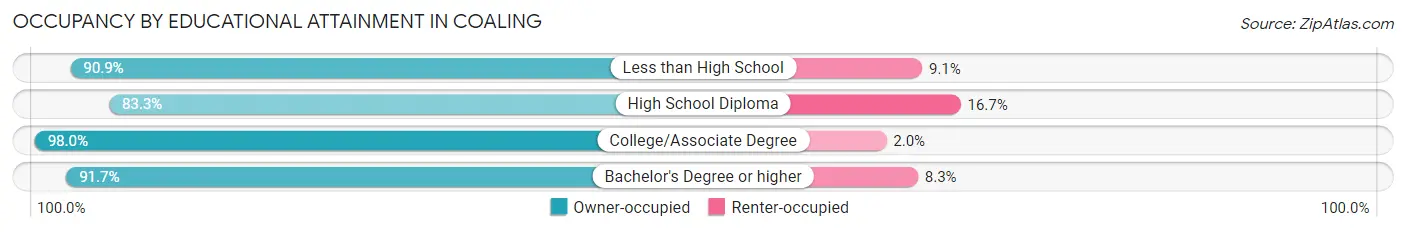
| Household Size | Owner-occupied | Renter-occupied |
| Less than High School | 80 (90.9%) | 8 (9.1%) |
| High School Diploma | 209 (83.3%) | 42 (16.7%) |
| College/Associate Degree | 243 (98.0%) | 5 (2.0%) |
| Bachelor's Degree or higher | 100 (91.7%) | 9 (8.3%) |
Occupancy by Age of Householder in Coaling
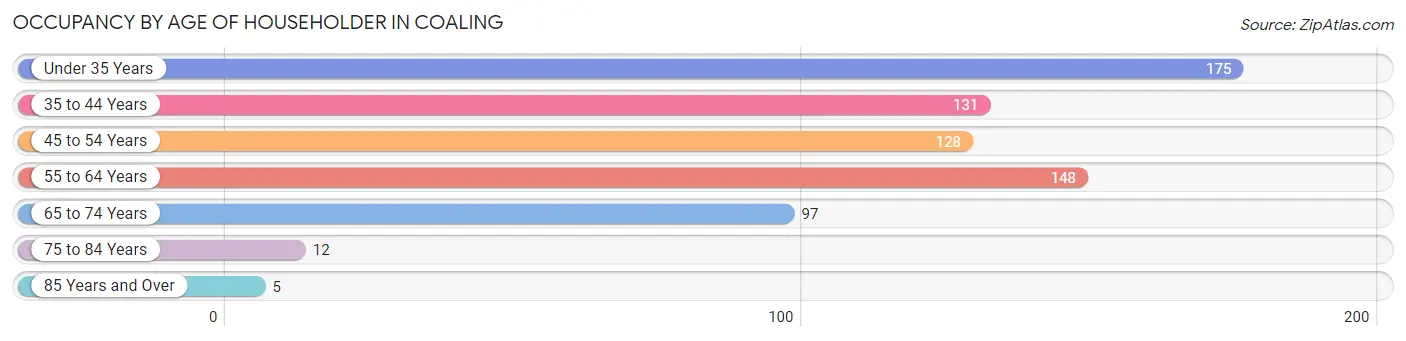
| Age Bracket | # Households | % Households |
| Under 35 Years | 175 | 25.1% |
| 35 to 44 Years | 131 | 18.8% |
| 45 to 54 Years | 128 | 18.4% |
| 55 to 64 Years | 148 | 21.3% |
| 65 to 74 Years | 97 | 13.9% |
| 75 to 84 Years | 12 | 1.7% |
| 85 Years and Over | 5 | 0.7% |
| Total | 696 | 100.0% |
Housing Finances in Coaling
Median Income by Occupancy in Coaling
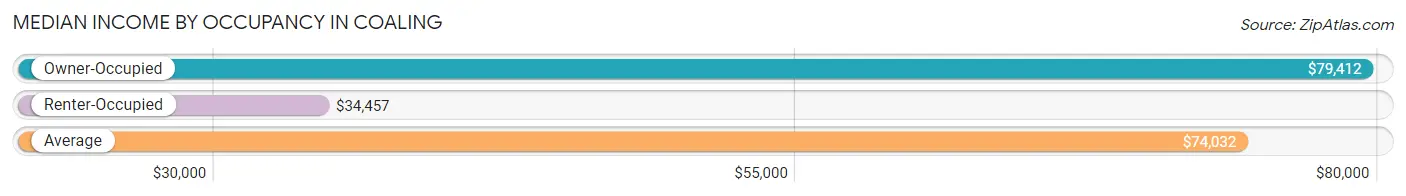
| Occupancy Type | # Households | Median Income |
| Owner-Occupied | 632 (90.8%) | $79,412 |
| Renter-Occupied | 64 (9.2%) | $34,457 |
| Average | 696 (100.0%) | $74,032 |
Occupancy by Householder Income Bracket in Coaling
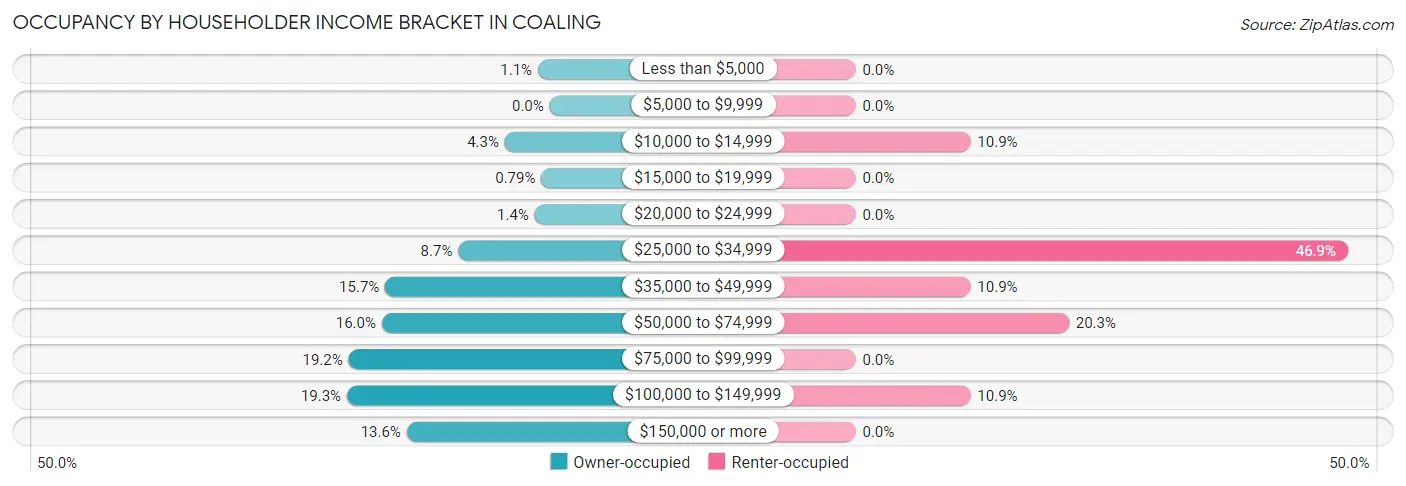
| Income Bracket | Owner-occupied | Renter-occupied |
| Less than $5,000 | 7 (1.1%) | 0 (0.0%) |
| $5,000 to $9,999 | 0 (0.0%) | 0 (0.0%) |
| $10,000 to $14,999 | 27 (4.3%) | 7 (10.9%) |
| $15,000 to $19,999 | 5 (0.8%) | 0 (0.0%) |
| $20,000 to $24,999 | 9 (1.4%) | 0 (0.0%) |
| $25,000 to $34,999 | 55 (8.7%) | 30 (46.9%) |
| $35,000 to $49,999 | 99 (15.7%) | 7 (10.9%) |
| $50,000 to $74,999 | 101 (16.0%) | 13 (20.3%) |
| $75,000 to $99,999 | 121 (19.2%) | 0 (0.0%) |
| $100,000 to $149,999 | 122 (19.3%) | 7 (10.9%) |
| $150,000 or more | 86 (13.6%) | 0 (0.0%) |
| Total | 632 (100.0%) | 64 (100.0%) |
Monthly Housing Cost Tiers in Coaling
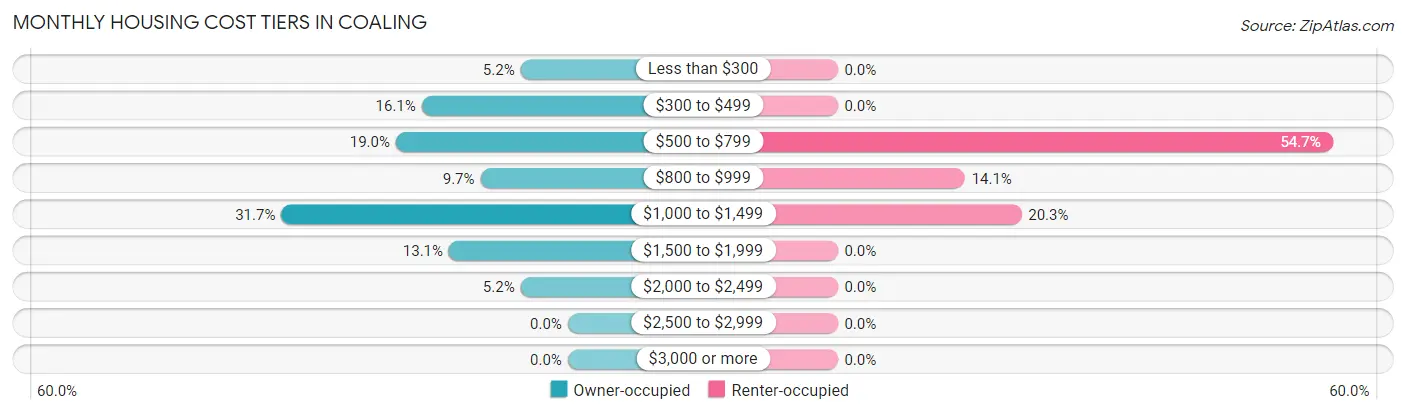
| Monthly Cost | Owner-occupied | Renter-occupied |
| Less than $300 | 33 (5.2%) | 0 (0.0%) |
| $300 to $499 | 102 (16.1%) | 0 (0.0%) |
| $500 to $799 | 120 (19.0%) | 35 (54.7%) |
| $800 to $999 | 61 (9.7%) | 9 (14.1%) |
| $1,000 to $1,499 | 200 (31.7%) | 13 (20.3%) |
| $1,500 to $1,999 | 83 (13.1%) | 0 (0.0%) |
| $2,000 to $2,499 | 33 (5.2%) | 0 (0.0%) |
| $2,500 to $2,999 | 0 (0.0%) | 0 (0.0%) |
| $3,000 or more | 0 (0.0%) | 0 (0.0%) |
| Total | 632 (100.0%) | 64 (100.0%) |
Physical Housing Characteristics in Coaling
Housing Structures in Coaling
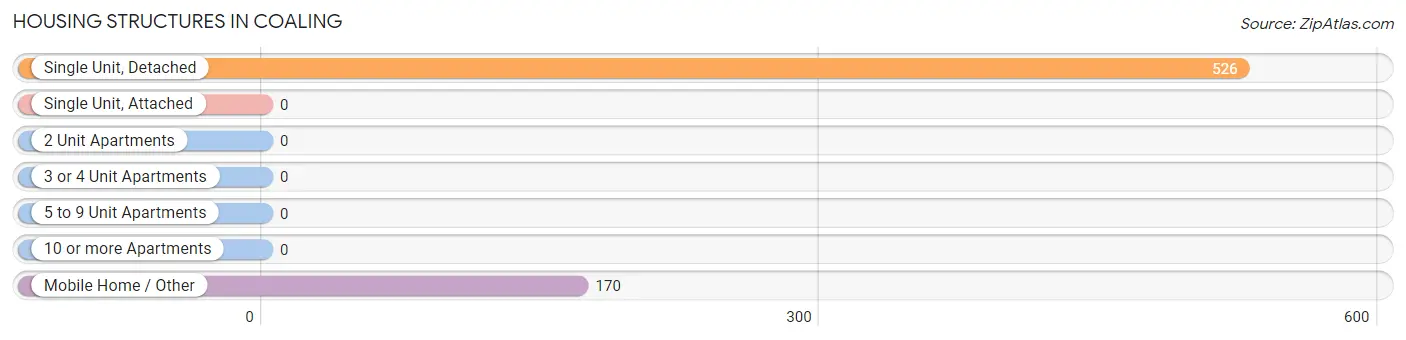
| Structure Type | # Housing Units | % Housing Units |
| Single Unit, Detached | 526 | 75.6% |
| Single Unit, Attached | 0 | 0.0% |
| 2 Unit Apartments | 0 | 0.0% |
| 3 or 4 Unit Apartments | 0 | 0.0% |
| 5 to 9 Unit Apartments | 0 | 0.0% |
| 10 or more Apartments | 0 | 0.0% |
| Mobile Home / Other | 170 | 24.4% |
| Total | 696 | 100.0% |
Housing Structures by Occupancy in Coaling
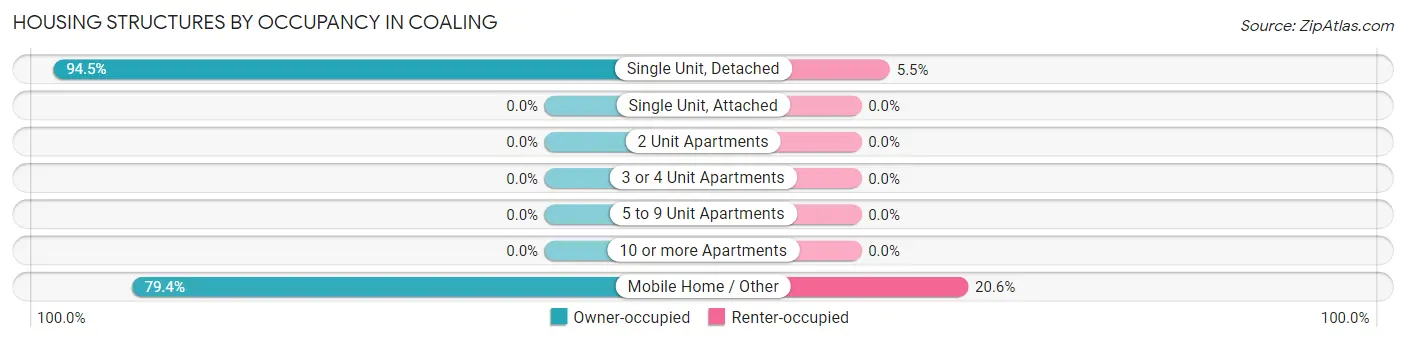
| Structure Type | Owner-occupied | Renter-occupied |
| Single Unit, Detached | 497 (94.5%) | 29 (5.5%) |
| Single Unit, Attached | 0 (0.0%) | 0 (0.0%) |
| 2 Unit Apartments | 0 (0.0%) | 0 (0.0%) |
| 3 or 4 Unit Apartments | 0 (0.0%) | 0 (0.0%) |
| 5 to 9 Unit Apartments | 0 (0.0%) | 0 (0.0%) |
| 10 or more Apartments | 0 (0.0%) | 0 (0.0%) |
| Mobile Home / Other | 135 (79.4%) | 35 (20.6%) |
| Total | 632 (90.8%) | 64 (9.2%) |
Housing Structures by Number of Rooms in Coaling
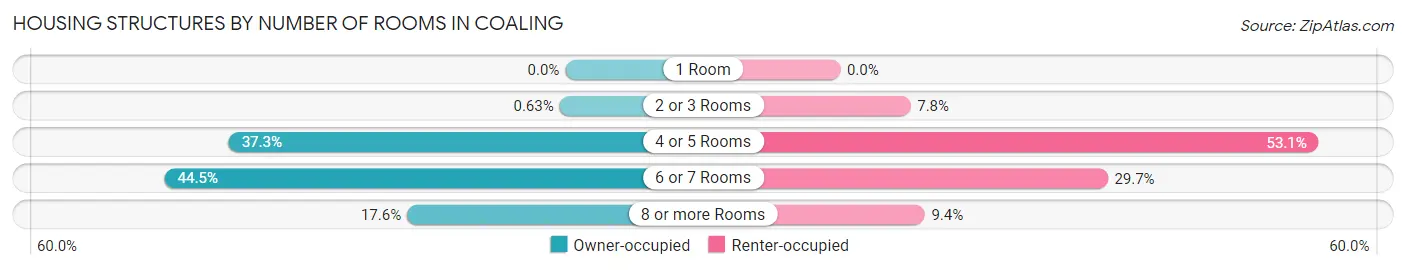
| Number of Rooms | Owner-occupied | Renter-occupied |
| 1 Room | 0 (0.0%) | 0 (0.0%) |
| 2 or 3 Rooms | 4 (0.6%) | 5 (7.8%) |
| 4 or 5 Rooms | 236 (37.3%) | 34 (53.1%) |
| 6 or 7 Rooms | 281 (44.5%) | 19 (29.7%) |
| 8 or more Rooms | 111 (17.6%) | 6 (9.4%) |
| Total | 632 (100.0%) | 64 (100.0%) |
Housing Structure by Heating Type in Coaling
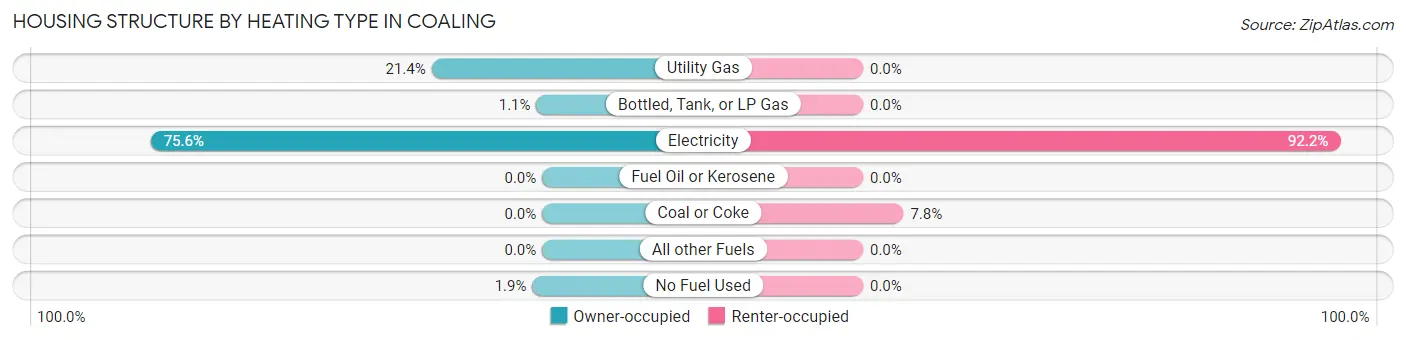
| Heating Type | Owner-occupied | Renter-occupied |
| Utility Gas | 135 (21.4%) | 0 (0.0%) |
| Bottled, Tank, or LP Gas | 7 (1.1%) | 0 (0.0%) |
| Electricity | 478 (75.6%) | 59 (92.2%) |
| Fuel Oil or Kerosene | 0 (0.0%) | 0 (0.0%) |
| Coal or Coke | 0 (0.0%) | 5 (7.8%) |
| All other Fuels | 0 (0.0%) | 0 (0.0%) |
| No Fuel Used | 12 (1.9%) | 0 (0.0%) |
| Total | 632 (100.0%) | 64 (100.0%) |
Household Vehicle Usage in Coaling
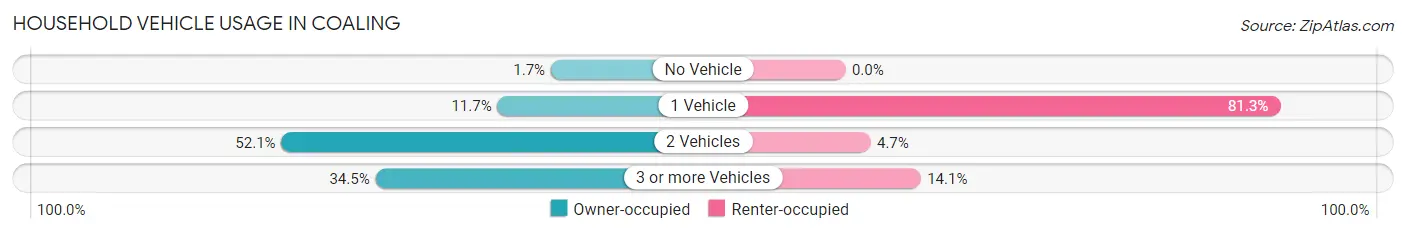
| Vehicles per Household | Owner-occupied | Renter-occupied |
| No Vehicle | 11 (1.7%) | 0 (0.0%) |
| 1 Vehicle | 74 (11.7%) | 52 (81.2%) |
| 2 Vehicles | 329 (52.1%) | 3 (4.7%) |
| 3 or more Vehicles | 218 (34.5%) | 9 (14.1%) |
| Total | 632 (100.0%) | 64 (100.0%) |
Real Estate & Mortgages in Coaling
Real Estate and Mortgage Overview in Coaling
| Characteristic | Without Mortgage | With Mortgage |
| Housing Units | 231 | 401 |
| Median Property Value | $206,100 | $199,700 |
| Median Household Income | $71,094 | $64 |
| Monthly Housing Costs | $474 | $0 |
| Real Estate Taxes | $659 | $97 |
Property Value by Mortgage Status in Coaling
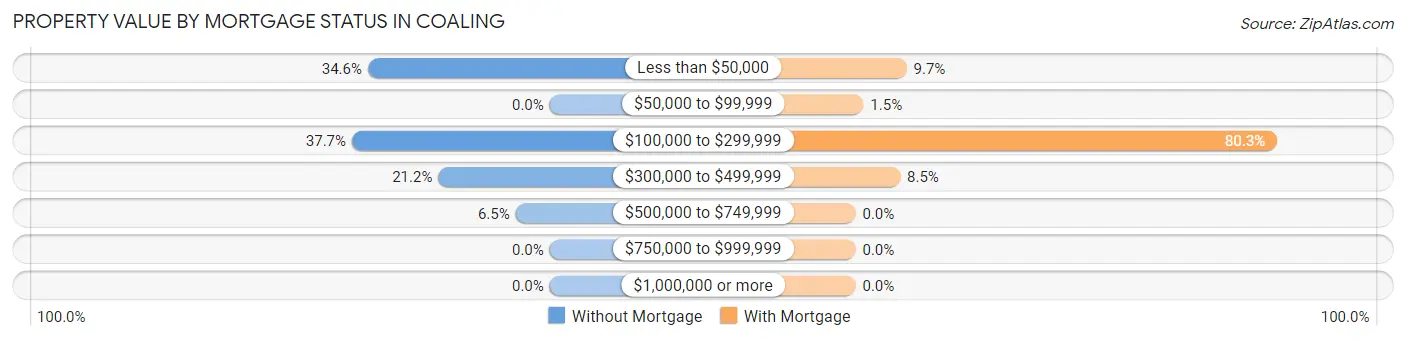
| Property Value | Without Mortgage | With Mortgage |
| Less than $50,000 | 80 (34.6%) | 39 (9.7%) |
| $50,000 to $99,999 | 0 (0.0%) | 6 (1.5%) |
| $100,000 to $299,999 | 87 (37.7%) | 322 (80.3%) |
| $300,000 to $499,999 | 49 (21.2%) | 34 (8.5%) |
| $500,000 to $749,999 | 15 (6.5%) | 0 (0.0%) |
| $750,000 to $999,999 | 0 (0.0%) | 0 (0.0%) |
| $1,000,000 or more | 0 (0.0%) | 0 (0.0%) |
| Total | 231 (100.0%) | 401 (100.0%) |
Household Income by Mortgage Status in Coaling
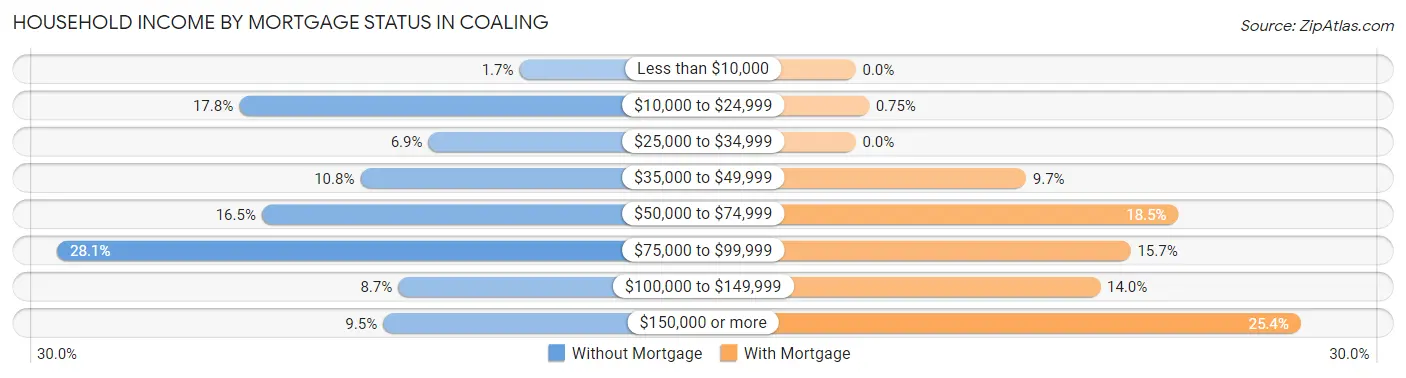
| Household Income | Without Mortgage | With Mortgage |
| Less than $10,000 | 4 (1.7%) | 0 (0.0%) |
| $10,000 to $24,999 | 41 (17.7%) | 3 (0.7%) |
| $25,000 to $34,999 | 16 (6.9%) | 0 (0.0%) |
| $35,000 to $49,999 | 25 (10.8%) | 39 (9.7%) |
| $50,000 to $74,999 | 38 (16.5%) | 74 (18.4%) |
| $75,000 to $99,999 | 65 (28.1%) | 63 (15.7%) |
| $100,000 to $149,999 | 20 (8.7%) | 56 (14.0%) |
| $150,000 or more | 22 (9.5%) | 102 (25.4%) |
| Total | 231 (100.0%) | 401 (100.0%) |
Property Value to Household Income Ratio in Coaling
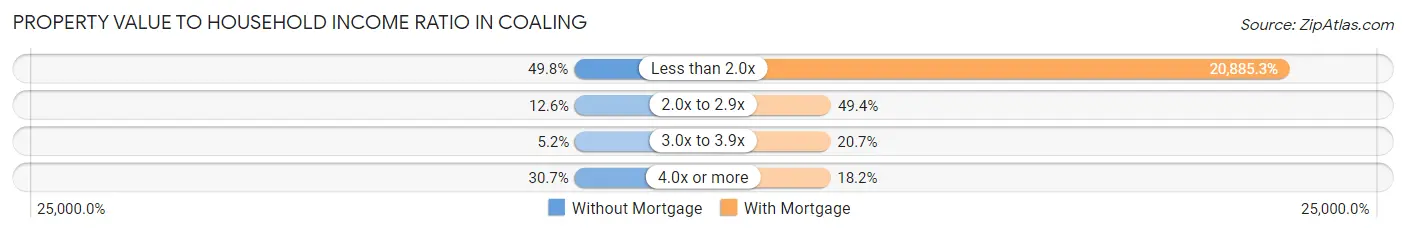
| Value-to-Income Ratio | Without Mortgage | With Mortgage |
| Less than 2.0x | 115 (49.8%) | 83,750 (20,885.3%) |
| 2.0x to 2.9x | 29 (12.6%) | 198 (49.4%) |
| 3.0x to 3.9x | 12 (5.2%) | 83 (20.7%) |
| 4.0x or more | 71 (30.7%) | 73 (18.2%) |
| Total | 231 (100.0%) | 401 (100.0%) |
Real Estate Taxes by Mortgage Status in Coaling
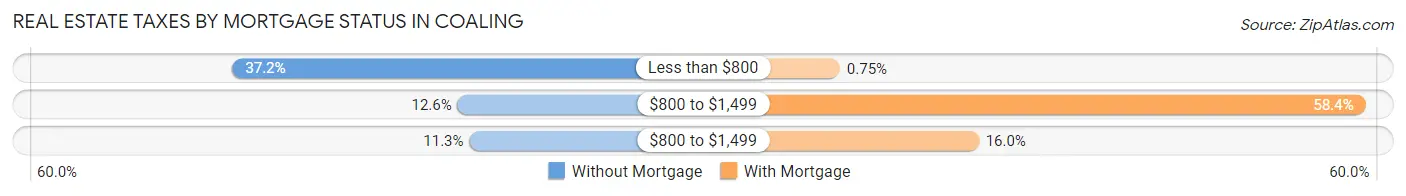
| Property Taxes | Without Mortgage | With Mortgage |
| Less than $800 | 86 (37.2%) | 3 (0.7%) |
| $800 to $1,499 | 29 (12.6%) | 234 (58.4%) |
| $800 to $1,499 | 26 (11.3%) | 64 (16.0%) |
| Total | 231 (100.0%) | 401 (100.0%) |
Health & Disability in Coaling
Health Insurance Coverage by Age in Coaling
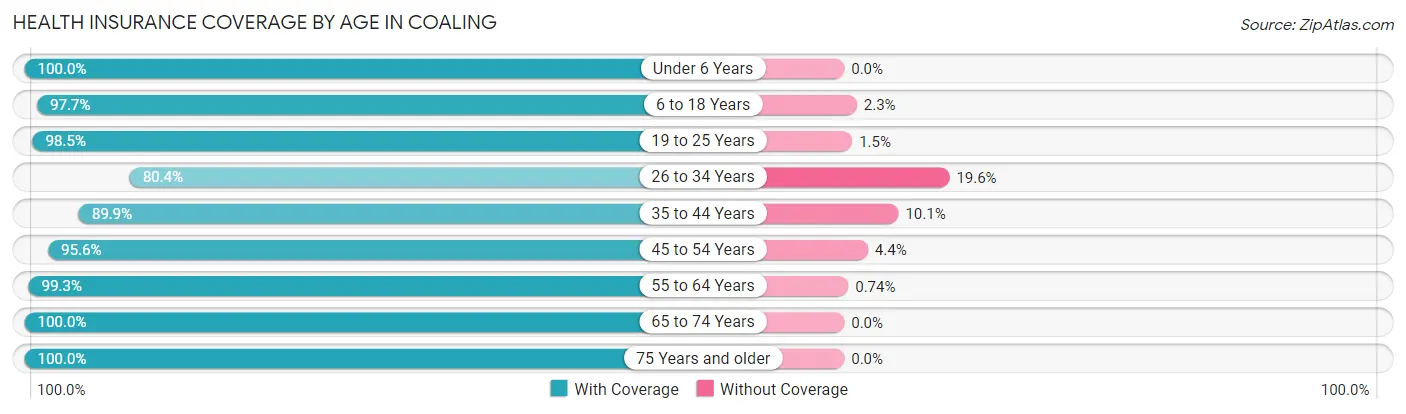
| Age Bracket | With Coverage | Without Coverage |
| Under 6 Years | 143 (100.0%) | 0 (0.0%) |
| 6 to 18 Years | 418 (97.7%) | 10 (2.3%) |
| 19 to 25 Years | 267 (98.5%) | 4 (1.5%) |
| 26 to 34 Years | 205 (80.4%) | 50 (19.6%) |
| 35 to 44 Years | 338 (89.9%) | 38 (10.1%) |
| 45 to 54 Years | 261 (95.6%) | 12 (4.4%) |
| 55 to 64 Years | 268 (99.3%) | 2 (0.7%) |
| 65 to 74 Years | 156 (100.0%) | 0 (0.0%) |
| 75 Years and older | 31 (100.0%) | 0 (0.0%) |
| Total | 2,087 (94.7%) | 116 (5.3%) |
Health Insurance Coverage by Citizenship Status in Coaling
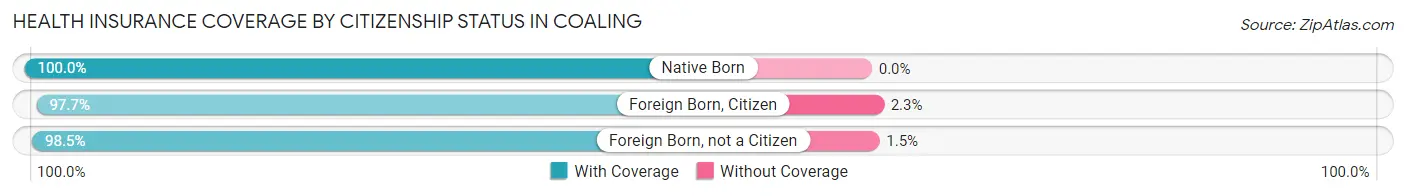
| Citizenship Status | With Coverage | Without Coverage |
| Native Born | 143 (100.0%) | 0 (0.0%) |
| Foreign Born, Citizen | 418 (97.7%) | 10 (2.3%) |
| Foreign Born, not a Citizen | 267 (98.5%) | 4 (1.5%) |
Health Insurance Coverage by Household Income in Coaling
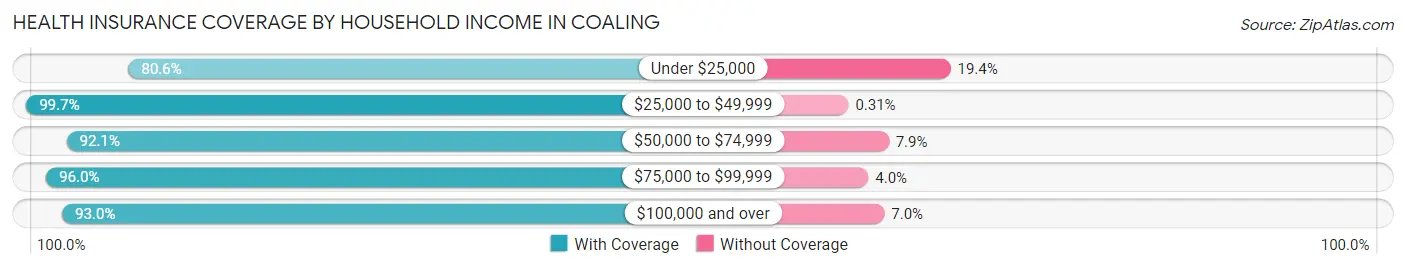
| Household Income | With Coverage | Without Coverage |
| Under $25,000 | 87 (80.6%) | 21 (19.4%) |
| $25,000 to $49,999 | 644 (99.7%) | 2 (0.3%) |
| $50,000 to $74,999 | 293 (92.1%) | 25 (7.9%) |
| $75,000 to $99,999 | 356 (96.0%) | 15 (4.0%) |
| $100,000 and over | 701 (93.0%) | 53 (7.0%) |
Public vs Private Health Insurance Coverage by Age in Coaling
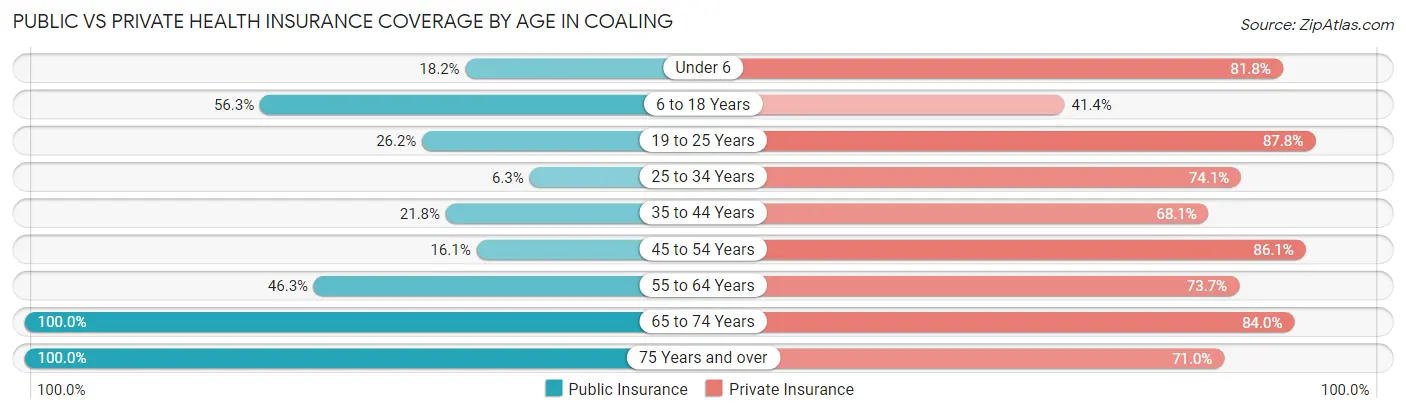
| Age Bracket | Public Insurance | Private Insurance |
| Under 6 | 26 (18.2%) | 117 (81.8%) |
| 6 to 18 Years | 241 (56.3%) | 177 (41.4%) |
| 19 to 25 Years | 71 (26.2%) | 238 (87.8%) |
| 25 to 34 Years | 16 (6.3%) | 189 (74.1%) |
| 35 to 44 Years | 82 (21.8%) | 256 (68.1%) |
| 45 to 54 Years | 44 (16.1%) | 235 (86.1%) |
| 55 to 64 Years | 125 (46.3%) | 199 (73.7%) |
| 65 to 74 Years | 156 (100.0%) | 131 (84.0%) |
| 75 Years and over | 31 (100.0%) | 22 (71.0%) |
| Total | 792 (35.9%) | 1,564 (71.0%) |
Disability Status by Sex by Age in Coaling
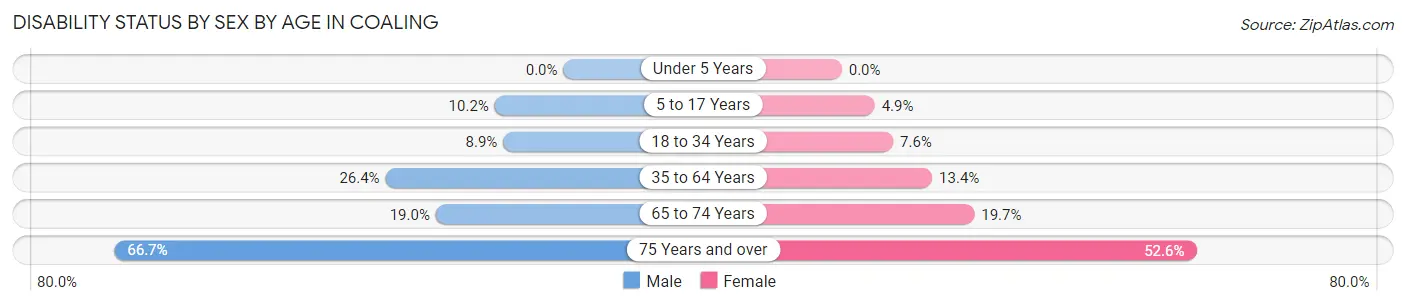
| Age Bracket | Male | Female |
| Under 5 Years | 0 (0.0%) | 0 (0.0%) |
| 5 to 17 Years | 25 (10.2%) | 9 (4.9%) |
| 18 to 34 Years | 30 (8.9%) | 16 (7.6%) |
| 35 to 64 Years | 107 (26.4%) | 69 (13.4%) |
| 65 to 74 Years | 18 (19.0%) | 12 (19.7%) |
| 75 Years and over | 8 (66.7%) | 10 (52.6%) |
Disability Class by Sex by Age in Coaling
Disability Class: Hearing Difficulty
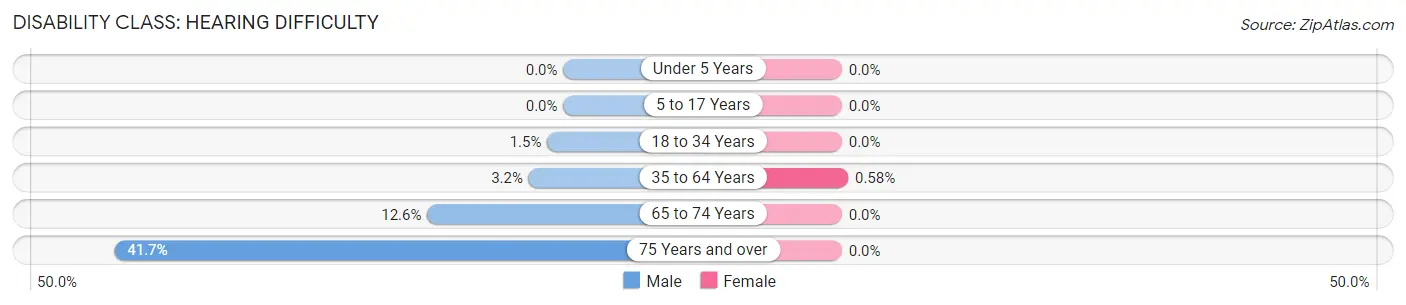
| Age Bracket | Male | Female |
| Under 5 Years | 0 (0.0%) | 0 (0.0%) |
| 5 to 17 Years | 0 (0.0%) | 0 (0.0%) |
| 18 to 34 Years | 5 (1.5%) | 0 (0.0%) |
| 35 to 64 Years | 13 (3.2%) | 3 (0.6%) |
| 65 to 74 Years | 12 (12.6%) | 0 (0.0%) |
| 75 Years and over | 5 (41.7%) | 0 (0.0%) |
Disability Class: Vision Difficulty
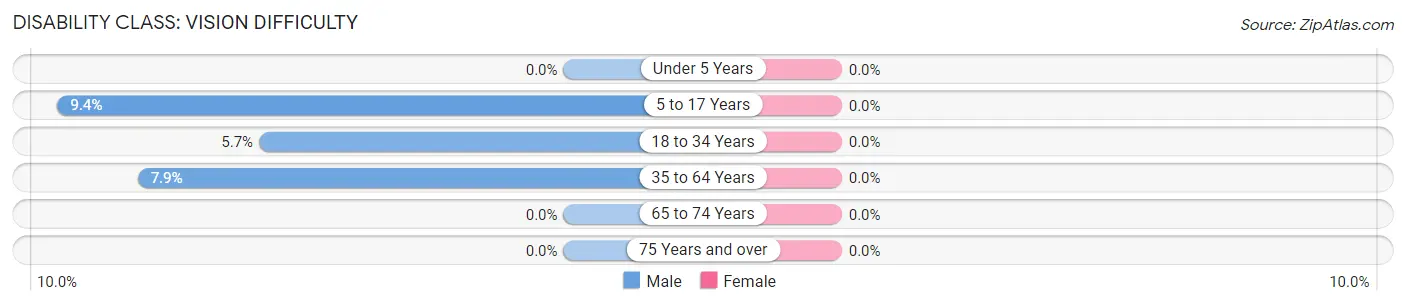
| Age Bracket | Male | Female |
| Under 5 Years | 0 (0.0%) | 0 (0.0%) |
| 5 to 17 Years | 23 (9.4%) | 0 (0.0%) |
| 18 to 34 Years | 19 (5.7%) | 0 (0.0%) |
| 35 to 64 Years | 32 (7.9%) | 0 (0.0%) |
| 65 to 74 Years | 0 (0.0%) | 0 (0.0%) |
| 75 Years and over | 0 (0.0%) | 0 (0.0%) |
Disability Class: Cognitive Difficulty
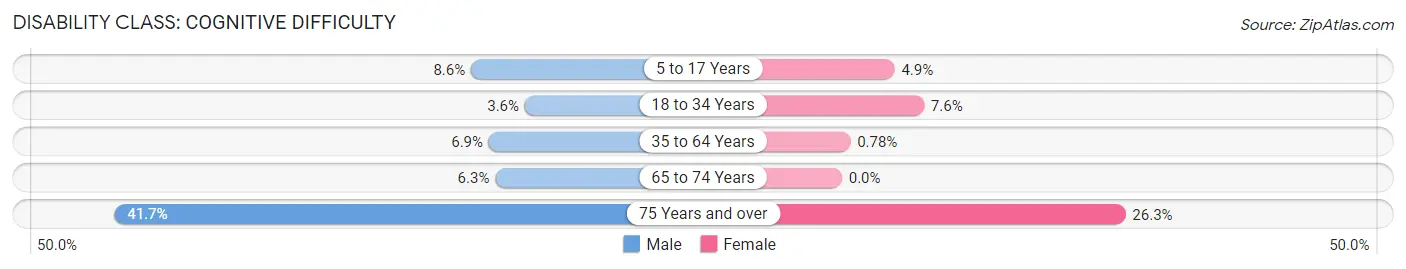
| Age Bracket | Male | Female |
| 5 to 17 Years | 21 (8.6%) | 9 (4.9%) |
| 18 to 34 Years | 12 (3.6%) | 16 (7.6%) |
| 35 to 64 Years | 28 (6.9%) | 4 (0.8%) |
| 65 to 74 Years | 6 (6.3%) | 0 (0.0%) |
| 75 Years and over | 5 (41.7%) | 5 (26.3%) |
Disability Class: Ambulatory Difficulty
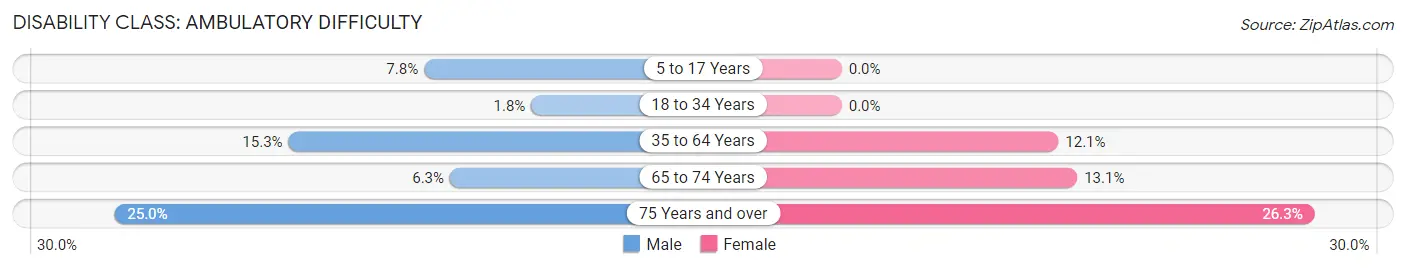
| Age Bracket | Male | Female |
| 5 to 17 Years | 19 (7.8%) | 0 (0.0%) |
| 18 to 34 Years | 6 (1.8%) | 0 (0.0%) |
| 35 to 64 Years | 62 (15.3%) | 62 (12.1%) |
| 65 to 74 Years | 6 (6.3%) | 8 (13.1%) |
| 75 Years and over | 3 (25.0%) | 5 (26.3%) |
Disability Class: Self-Care Difficulty
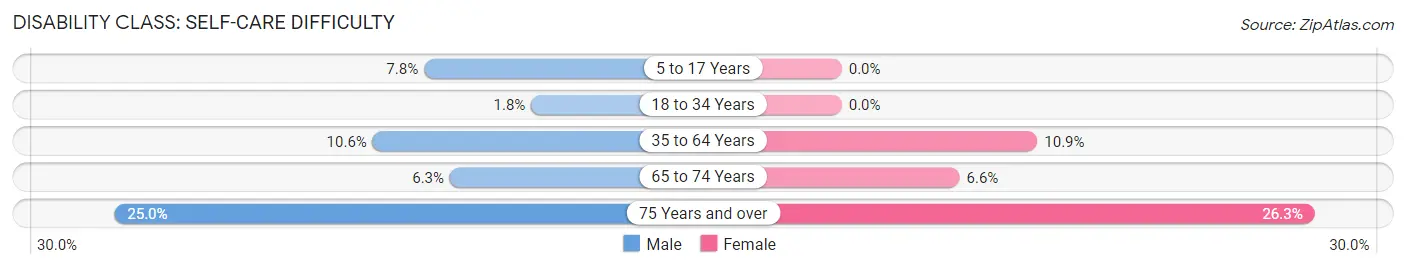
| Age Bracket | Male | Female |
| 5 to 17 Years | 19 (7.8%) | 0 (0.0%) |
| 18 to 34 Years | 6 (1.8%) | 0 (0.0%) |
| 35 to 64 Years | 43 (10.6%) | 56 (10.9%) |
| 65 to 74 Years | 6 (6.3%) | 4 (6.6%) |
| 75 Years and over | 3 (25.0%) | 5 (26.3%) |
Technology Access in Coaling
Computing Device Access in Coaling
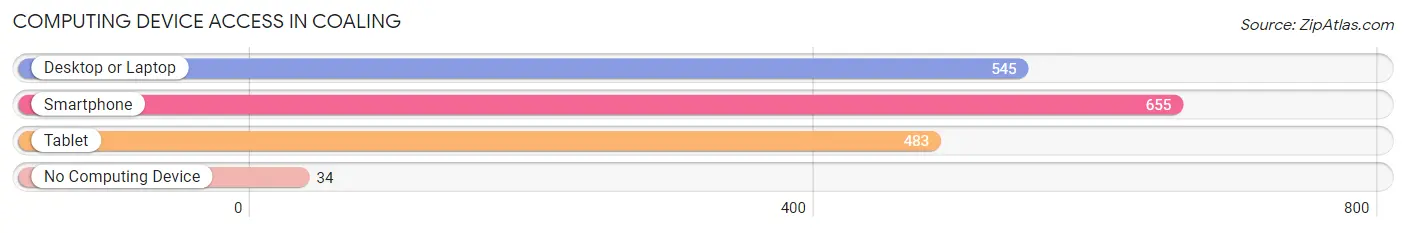
| Device Type | # Households | % Households |
| Desktop or Laptop | 545 | 78.3% |
| Smartphone | 655 | 94.1% |
| Tablet | 483 | 69.4% |
| No Computing Device | 34 | 4.9% |
| Total | 696 | 100.0% |
Internet Access in Coaling
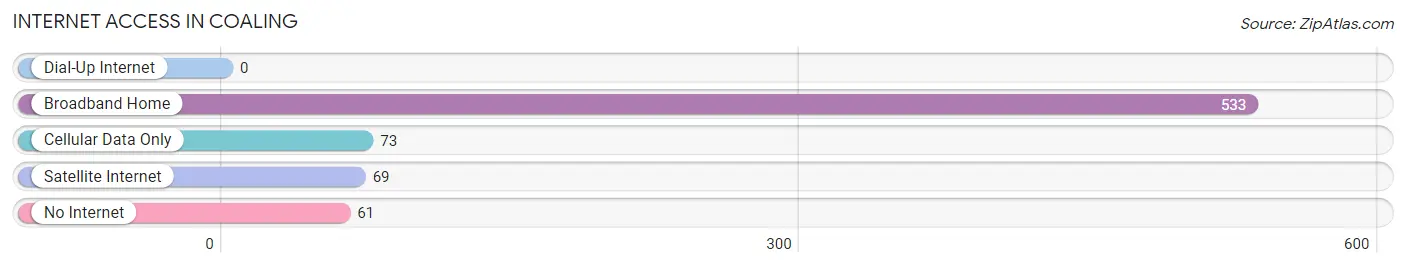
| Internet Type | # Households | % Households |
| Dial-Up Internet | 0 | 0.0% |
| Broadband Home | 533 | 76.6% |
| Cellular Data Only | 73 | 10.5% |
| Satellite Internet | 69 | 9.9% |
| No Internet | 61 | 8.8% |
| Total | 696 | 100.0% |
Coaling Summary
Coaling, Alabama is a small town located in Tuscaloosa County, Alabama. It is situated about 10 miles south of Tuscaloosa and is part of the Tuscaloosa Metropolitan Statistical Area. The town has a population of approximately 1,000 people and is known for its rural charm and friendly atmosphere.
History
Coaling, Alabama was founded in 1887 by the Coaling Land Company. The company was formed by a group of investors from Birmingham, Alabama who wanted to develop the area for coal mining. The town was named after the coal mining industry that was the main source of income for the area. The town was incorporated in 1891 and the first mayor was elected in 1892.
The town grew rapidly in the early 1900s due to the coal mining industry. The town had a population of over 1,000 people by 1910 and was home to several businesses, including a bank, a hotel, a general store, and a post office. The town also had a school and a church.
The coal mining industry declined in the 1920s and the town’s population began to decline as well. The town’s population was only about 500 people by the 1950s. The town’s economy was further hurt by the closure of the railroad in the 1960s.
The town’s population began to increase again in the 1970s and 1980s as people moved to the area for its rural charm and friendly atmosphere. The town’s population was approximately 1,000 people by the year 2000.
Geography
Coaling, Alabama is located in Tuscaloosa County, Alabama. The town is situated about 10 miles south of Tuscaloosa and is part of the Tuscaloosa Metropolitan Statistical Area. The town is located in the foothills of the Appalachian Mountains and is surrounded by rolling hills and forests. The town is located near the Black Warrior River and is about 30 miles from the Gulf of Mexico.
The town has a total area of 1.2 square miles, all of which is land. The town has a humid subtropical climate with hot, humid summers and mild winters. The average temperature in the summer is around 80 degrees Fahrenheit and the average temperature in the winter is around 50 degrees Fahrenheit.
Economy
The economy of Coaling, Alabama is largely based on agriculture and tourism. The town is home to several farms that produce a variety of crops, including corn, soybeans, cotton, and hay. The town is also home to several small businesses, including restaurants, shops, and a gas station.
The town is also a popular tourist destination due to its rural charm and friendly atmosphere. The town is home to several parks and recreational areas, including the Coaling State Park. The park offers camping, fishing, and hiking opportunities. The town also hosts several festivals and events throughout the year, including the Coaling Fall Festival and the Coaling Christmas Parade.
Demographics
As of the 2010 census, the population of Coaling, Alabama was 1,000 people. The town has a population density of 833 people per square mile. The median age of the population is 39.7 years and the median household income is $37,500.
The racial makeup of the town is 97.2% White, 0.7% African American, 0.3% Native American, 0.3% Asian, and 1.5% from other races. The town is also home to a small Hispanic population, which makes up 1.2% of the population.
The town has a high rate of homeownership, with over 80% of the population owning their own homes. The town also has a low unemployment rate, with only 4.2% of the population unemployed. The town has a low crime rate and is considered a safe place to live.
Common Questions
What is Per Capita Income in Coaling?
Per Capita income in Coaling is $28,521.
What is the Median Family Income in Coaling?
Median Family Income in Coaling is $79,559.
What is the Median Household income in Coaling?
Median Household Income in Coaling is $74,032.
What is Income or Wage Gap in Coaling?
Income or Wage Gap in Coaling is 43.0%.
Women in Coaling earn 57.0 cents for every dollar earned by a man.
What is Inequality or Gini Index in Coaling?
Inequality or Gini Index in Coaling is 0.36.
What is the Total Population of Coaling?
Total Population of Coaling is 2,203.
What is the Total Male Population of Coaling?
Total Male Population of Coaling is 1,149.
What is the Total Female Population of Coaling?
Total Female Population of Coaling is 1,054.
What is the Ratio of Males per 100 Females in Coaling?
There are 109.01 Males per 100 Females in Coaling.
What is the Ratio of Females per 100 Males in Coaling?
There are 91.73 Females per 100 Males in Coaling.
What is the Median Population Age in Coaling?
Median Population Age in Coaling is 35.4 Years.
What is the Average Family Size in Coaling
Average Family Size in Coaling is 3.4 People.
What is the Average Household Size in Coaling
Average Household Size in Coaling is 3.2 People.
How Large is the Labor Force in Coaling?
There are 1,219 People in the Labor Forcein in Coaling.
What is the Percentage of People in the Labor Force in Coaling?
71.9% of People are in the Labor Force in Coaling.
What is the Unemployment Rate in Coaling?
Unemployment Rate in Coaling is 12.0%.