Japanese Disability
COMPARE
Japanese
Select to Compare
Disability
Japanese Disability
12.2%
DISABILITY
2.3/ 100
METRIC RATING
234th/ 347
METRIC RANK
Japanese Disability Correlation Chart
The statistical analysis conducted on geographies consisting of 249,165,535 people shows a weak positive correlation between the proportion of Japanese and percentage of population with a disability in the United States with a correlation coefficient (R) of 0.217 and weighted average of 12.2%. On average, for every 1% (one percent) increase in Japanese within a typical geography, there is an increase of 0.16% in percentage of population with a disability.
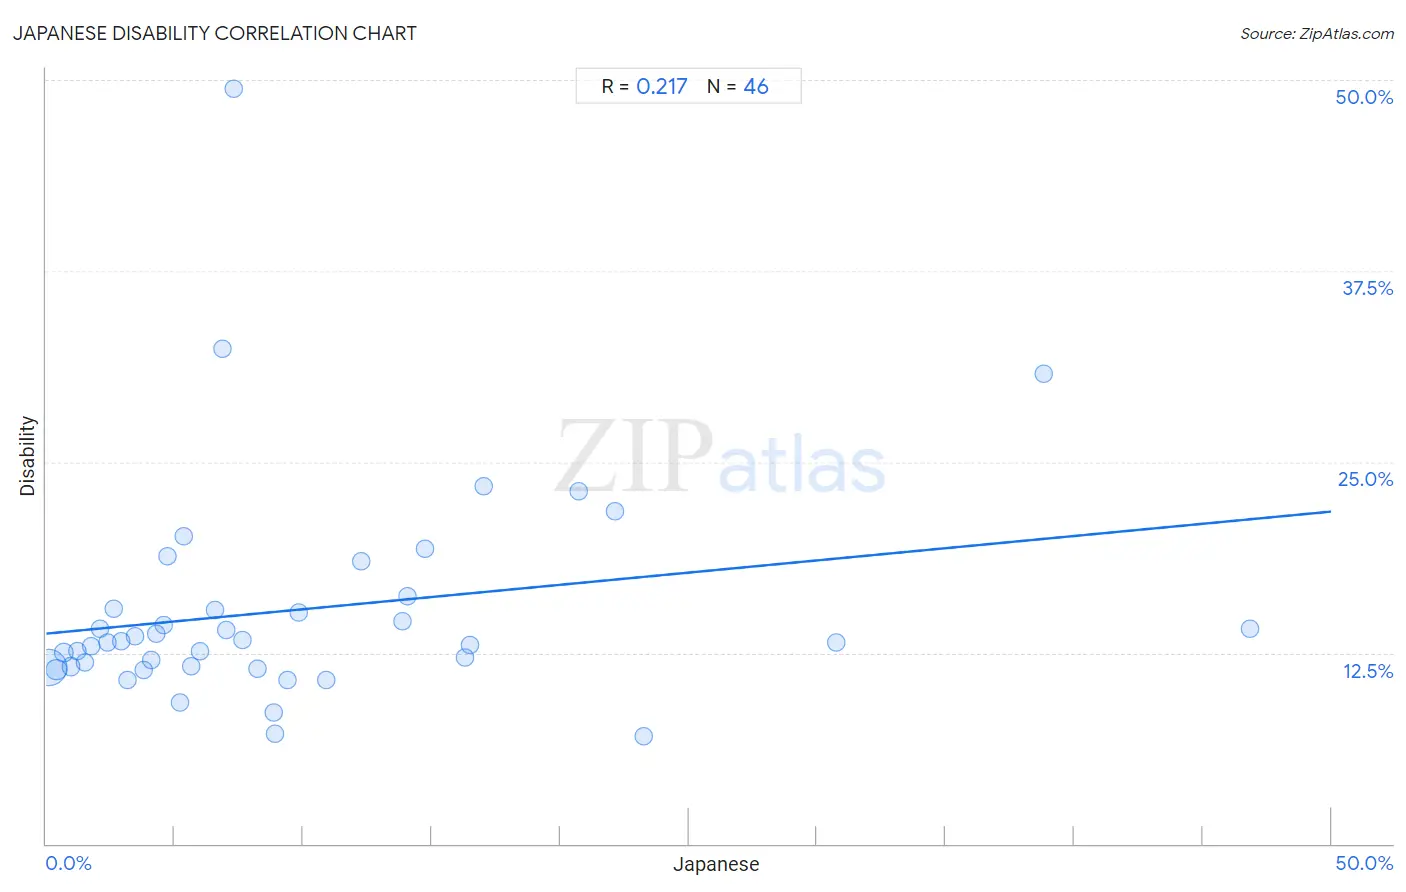
It is essential to understand that the correlation between the percentage of Japanese and percentage of population with a disability does not imply a direct cause-and-effect relationship. It remains uncertain whether the presence of Japanese influences an upward or downward trend in the level of percentage of population with a disability within an area, or if Japanese simply ended up residing in those areas with higher or lower levels of percentage of population with a disability due to other factors.
Demographics Similar to Japanese by Disability
In terms of disability, the demographic groups most similar to Japanese are Bahamian (12.2%, a difference of 0.030%), Yup'ik (12.2%, a difference of 0.040%), Italian (12.2%, a difference of 0.12%), Malaysian (12.2%, a difference of 0.13%), and Chinese (12.2%, a difference of 0.13%).
| Demographics | Rating | Rank | Disability |
| Alsatians | 3.3 /100 | #227 | Tragic 12.1% |
| West Indians | 2.9 /100 | #228 | Tragic 12.2% |
| Inupiat | 2.8 /100 | #229 | Tragic 12.2% |
| Samoans | 2.6 /100 | #230 | Tragic 12.2% |
| Malaysians | 2.5 /100 | #231 | Tragic 12.2% |
| Italians | 2.5 /100 | #232 | Tragic 12.2% |
| Bahamians | 2.3 /100 | #233 | Tragic 12.2% |
| Japanese | 2.3 /100 | #234 | Tragic 12.2% |
| Yup'ik | 2.2 /100 | #235 | Tragic 12.2% |
| Chinese | 2.0 /100 | #236 | Tragic 12.2% |
| Immigrants from Congo | 1.9 /100 | #237 | Tragic 12.2% |
| Norwegians | 1.9 /100 | #238 | Tragic 12.2% |
| Swedes | 1.8 /100 | #239 | Tragic 12.2% |
| Hungarians | 1.7 /100 | #240 | Tragic 12.2% |
| Yugoslavians | 1.7 /100 | #241 | Tragic 12.2% |
Japanese Disability Correlation Summary
| Measurement | Japanese Data | Disability Data |
| Minimum | 0.089% | 7.1% |
| Maximum | 46.8% | 49.5% |
| Range | 46.7% | 42.4% |
| Mean | 9.7% | 15.3% |
| Median | 6.7% | 13.2% |
| Interquartile 25% (IQ1) | 3.1% | 11.6% |
| Interquartile 75% (IQ3) | 13.9% | 15.3% |
| Interquartile Range (IQR) | 10.7% | 3.8% |
| Standard Deviation (Sample) | 9.9% | 7.3% |
| Standard Deviation (Population) | 9.8% | 7.2% |
Correlation Details
| Japanese Percentile | Sample Size | Disability |
[ 0.0% - 0.5% ] 0.089% | 191,214,424 | 11.6% |
[ 0.0% - 0.5% ] 0.39% | 32,062,027 | 11.4% |
[ 0.5% - 1.0% ] 0.68% | 11,053,025 | 12.5% |
[ 0.5% - 1.0% ] 0.95% | 5,586,569 | 11.6% |
[ 1.0% - 1.5% ] 1.23% | 2,875,177 | 12.6% |
[ 1.5% - 2.0% ] 1.51% | 1,550,067 | 11.9% |
[ 1.5% - 2.0% ] 1.77% | 1,269,770 | 12.9% |
[ 2.0% - 2.5% ] 2.09% | 537,392 | 14.0% |
[ 2.0% - 2.5% ] 2.37% | 401,596 | 13.2% |
[ 2.5% - 3.0% ] 2.64% | 83,848 | 15.3% |
[ 2.5% - 3.0% ] 2.93% | 184,192 | 13.2% |
[ 3.0% - 3.5% ] 3.15% | 208,256 | 10.7% |
[ 3.0% - 3.5% ] 3.43% | 147,545 | 13.6% |
[ 3.5% - 4.0% ] 3.81% | 638,209 | 11.4% |
[ 4.0% - 4.5% ] 4.08% | 60,107 | 12.0% |
[ 4.0% - 4.5% ] 4.30% | 473,882 | 13.7% |
[ 4.5% - 5.0% ] 4.57% | 68,008 | 14.3% |
[ 4.5% - 5.0% ] 4.73% | 74,695 | 18.8% |
[ 5.0% - 5.5% ] 5.21% | 41,240 | 9.3% |
[ 5.0% - 5.5% ] 5.34% | 5,600 | 20.1% |
[ 5.5% - 6.0% ] 5.64% | 104,251 | 11.6% |
[ 5.5% - 6.0% ] 5.96% | 70,567 | 12.6% |
[ 6.5% - 7.0% ] 6.54% | 65,608 | 15.3% |
[ 6.5% - 7.0% ] 6.83% | 278 | 32.4% |
[ 6.5% - 7.0% ] 6.99% | 41,001 | 14.0% |
[ 7.0% - 7.5% ] 7.29% | 645 | 49.5% |
[ 7.5% - 8.0% ] 7.63% | 59,153 | 13.4% |
[ 8.0% - 8.5% ] 8.23% | 4,145 | 11.4% |
[ 8.5% - 9.0% ] 8.84% | 12,324 | 8.6% |
[ 8.5% - 9.0% ] 8.91% | 11,678 | 7.2% |
[ 9.0% - 9.5% ] 9.38% | 2,911 | 10.8% |
[ 9.5% - 10.0% ] 9.81% | 59,460 | 15.1% |
[ 10.5% - 11.0% ] 10.92% | 27,848 | 10.7% |
[ 12.0% - 12.5% ] 12.25% | 2,588 | 18.5% |
[ 13.5% - 14.0% ] 13.86% | 114,737 | 14.6% |
[ 14.0% - 14.5% ] 14.08% | 1,364 | 16.2% |
[ 14.5% - 15.0% ] 14.72% | 2,215 | 19.3% |
[ 16.0% - 16.5% ] 16.30% | 411 | 12.2% |
[ 16.0% - 16.5% ] 16.47% | 868 | 13.0% |
[ 17.0% - 17.5% ] 17.03% | 7,118 | 23.4% |
[ 20.5% - 21.0% ] 20.70% | 1,575 | 23.1% |
[ 22.0% - 22.5% ] 22.12% | 5,478 | 21.8% |
[ 23.0% - 23.5% ] 23.24% | 921 | 7.1% |
[ 30.5% - 31.0% ] 30.73% | 32,323 | 13.1% |
[ 38.5% - 39.0% ] 38.81% | 219 | 30.8% |
[ 46.5% - 47.0% ] 46.82% | 220 | 14.1% |