Japanese Self-Care Disability
COMPARE
Japanese
Select to Compare
Self-Care Disability
Japanese Self-Care Disability
2.7%
SELF-CARE DISABILITY
0.1/ 100
METRIC RATING
276th/ 347
METRIC RANK
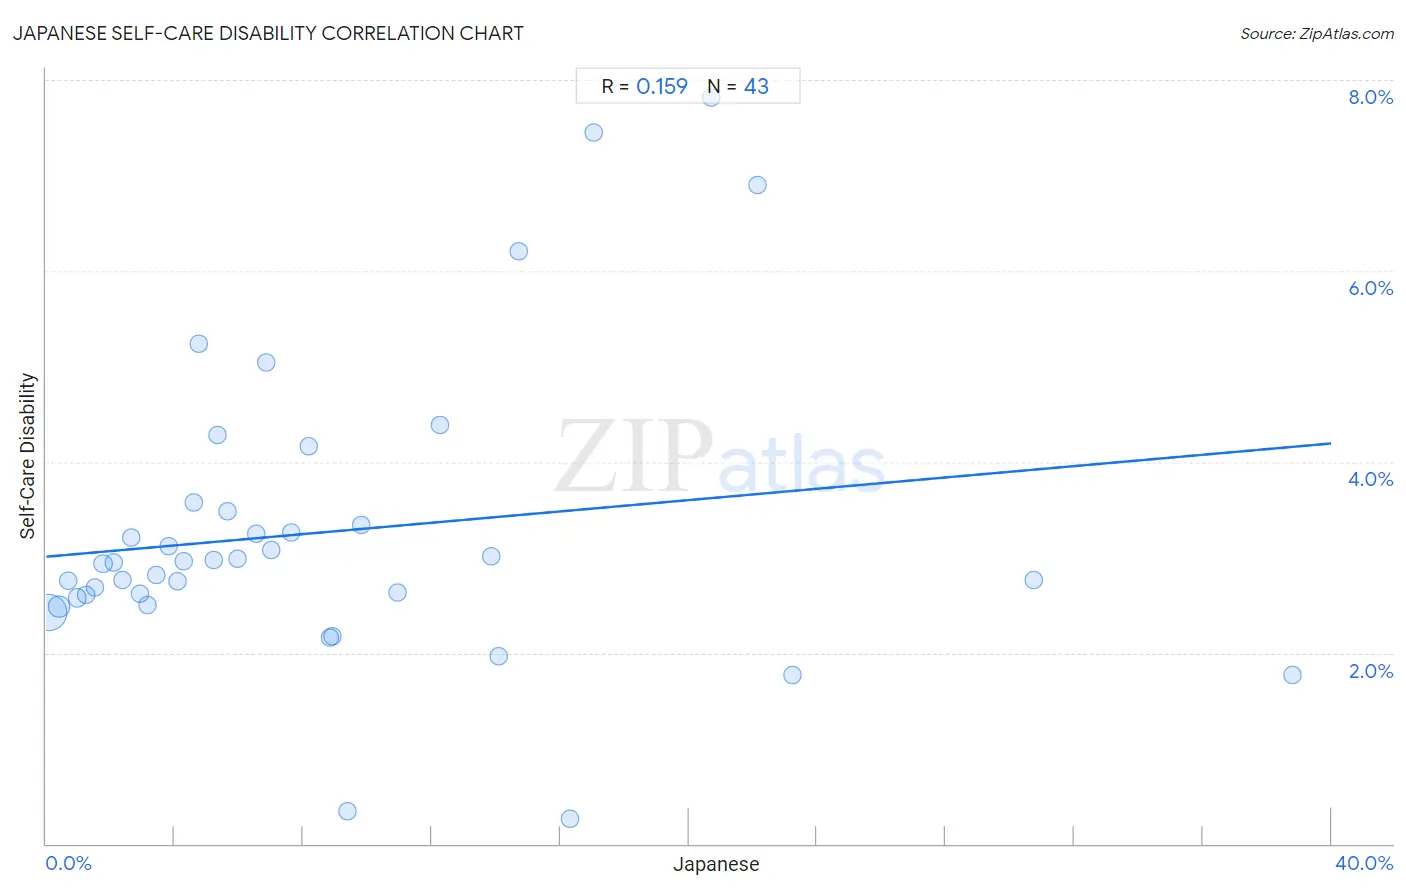
Japanese Self-Care Disability Correlation Chart
The statistical analysis conducted on geographies consisting of 249,013,660 people shows a poor positive correlation between the proportion of Japanese and percentage of population with self-care disability in the United States with a correlation coefficient (R) of 0.159 and weighted average of 2.7%. On average, for every 1% (one percent) increase in Japanese within a typical geography, there is an increase of 0.030% in percentage of population with self-care disability.
It is essential to understand that the correlation between the percentage of Japanese and percentage of population with self-care disability does not imply a direct cause-and-effect relationship. It remains uncertain whether the presence of Japanese influences an upward or downward trend in the level of percentage of population with self-care disability within an area, or if Japanese simply ended up residing in those areas with higher or lower levels of percentage of population with self-care disability due to other factors.
Demographics Similar to Japanese by Self-Care Disability
In terms of self-care disability, the demographic groups most similar to Japanese are Immigrants from Ukraine (2.7%, a difference of 0.060%), Yakama (2.7%, a difference of 0.13%), Immigrants from Trinidad and Tobago (2.7%, a difference of 0.13%), Ottawa (2.7%, a difference of 0.14%), and Mexican (2.7%, a difference of 0.19%).
| Demographics | Rating | Rank | Self-Care Disability |
| U.S. Virgin Islanders | 0.1 /100 | #269 | Tragic 2.7% |
| Immigrants from Micronesia | 0.1 /100 | #270 | Tragic 2.7% |
| Trinidadians and Tobagonians | 0.1 /100 | #271 | Tragic 2.7% |
| Immigrants from Laos | 0.1 /100 | #272 | Tragic 2.7% |
| Mexicans | 0.1 /100 | #273 | Tragic 2.7% |
| Yakama | 0.1 /100 | #274 | Tragic 2.7% |
| Immigrants from Trinidad and Tobago | 0.1 /100 | #275 | Tragic 2.7% |
| Japanese | 0.1 /100 | #276 | Tragic 2.7% |
| Immigrants from Ukraine | 0.1 /100 | #277 | Tragic 2.7% |
| Ottawa | 0.1 /100 | #278 | Tragic 2.7% |
| Iroquois | 0.1 /100 | #279 | Tragic 2.7% |
| Hispanics or Latinos | 0.1 /100 | #280 | Tragic 2.7% |
| Immigrants from Iraq | 0.0 /100 | #281 | Tragic 2.7% |
| Apache | 0.0 /100 | #282 | Tragic 2.7% |
| Delaware | 0.0 /100 | #283 | Tragic 2.7% |
Japanese Self-Care Disability Correlation Summary
| Measurement | Japanese Data | Self-Care Disability Data |
| Minimum | 0.089% | 0.26% |
| Maximum | 38.8% | 7.8% |
| Range | 38.7% | 7.6% |
| Mean | 8.7% | 3.3% |
| Median | 6.0% | 2.9% |
| Interquartile 25% (IQ1) | 2.9% | 2.6% |
| Interquartile 75% (IQ3) | 12.2% | 3.5% |
| Interquartile Range (IQR) | 9.3% | 0.91% |
| Standard Deviation (Sample) | 8.4% | 1.6% |
| Standard Deviation (Population) | 8.3% | 1.5% |
Correlation Details
| Japanese Percentile | Sample Size | Self-Care Disability |
[ 0.0% - 0.5% ] 0.089% | 191,155,761 | 2.4% |
[ 0.0% - 0.5% ] 0.39% | 32,025,773 | 2.5% |
[ 0.5% - 1.0% ] 0.68% | 11,029,258 | 2.8% |
[ 0.5% - 1.0% ] 0.95% | 5,577,130 | 2.6% |
[ 1.0% - 1.5% ] 1.23% | 2,870,989 | 2.6% |
[ 1.5% - 2.0% ] 1.51% | 1,544,927 | 2.7% |
[ 1.5% - 2.0% ] 1.77% | 1,266,487 | 2.9% |
[ 2.0% - 2.5% ] 2.08% | 535,060 | 2.9% |
[ 2.0% - 2.5% ] 2.37% | 401,596 | 2.8% |
[ 2.5% - 3.0% ] 2.64% | 83,848 | 3.2% |
[ 2.5% - 3.0% ] 2.93% | 184,192 | 2.6% |
[ 3.0% - 3.5% ] 3.15% | 208,256 | 2.5% |
[ 3.0% - 3.5% ] 3.43% | 147,545 | 2.8% |
[ 3.5% - 4.0% ] 3.81% | 638,209 | 3.1% |
[ 4.0% - 4.5% ] 4.08% | 59,104 | 2.7% |
[ 4.0% - 4.5% ] 4.30% | 473,882 | 3.0% |
[ 4.5% - 5.0% ] 4.57% | 68,008 | 3.6% |
[ 4.5% - 5.0% ] 4.73% | 74,695 | 5.2% |
[ 5.0% - 5.5% ] 5.21% | 41,240 | 3.0% |
[ 5.0% - 5.5% ] 5.34% | 5,600 | 4.3% |
[ 5.5% - 6.0% ] 5.64% | 103,421 | 3.5% |
[ 5.5% - 6.0% ] 5.97% | 68,039 | 3.0% |
[ 6.5% - 7.0% ] 6.54% | 65,608 | 3.2% |
[ 6.5% - 7.0% ] 6.83% | 278 | 5.0% |
[ 6.5% - 7.0% ] 6.99% | 41,001 | 3.1% |
[ 7.5% - 8.0% ] 7.63% | 59,153 | 3.3% |
[ 8.0% - 8.5% ] 8.15% | 2,367 | 4.2% |
[ 8.5% - 9.0% ] 8.85% | 11,764 | 2.2% |
[ 8.5% - 9.0% ] 8.91% | 11,678 | 2.2% |
[ 9.0% - 9.5% ] 9.38% | 2,911 | 0.34% |
[ 9.5% - 10.0% ] 9.81% | 59,460 | 3.3% |
[ 10.5% - 11.0% ] 10.92% | 27,848 | 2.6% |
[ 12.0% - 12.5% ] 12.25% | 2,588 | 4.4% |
[ 13.5% - 14.0% ] 13.86% | 114,737 | 3.0% |
[ 14.0% - 14.5% ] 14.08% | 987 | 2.0% |
[ 14.5% - 15.0% ] 14.72% | 2,215 | 6.2% |
[ 16.0% - 16.5% ] 16.30% | 411 | 0.26% |
[ 17.0% - 17.5% ] 17.03% | 7,118 | 7.5% |
[ 20.5% - 21.0% ] 20.70% | 1,575 | 7.8% |
[ 22.0% - 22.5% ] 22.12% | 5,478 | 6.9% |
[ 23.0% - 23.5% ] 23.24% | 921 | 1.8% |
[ 30.5% - 31.0% ] 30.73% | 32,323 | 2.8% |
[ 38.5% - 39.0% ] 38.81% | 219 | 1.8% |