Japanese Married-couple Households

COMPARE

Japanese
Race
Ancestry
AfghanAfricanAlaska NativeAlaskan AthabascanAlbanianAleutAlsatianAmericanApacheArabArapahoArgentineanArmenianAssyrian/Chaldean/SyriacAustralianAustrianBahamianBangladeshiBarbadianBasqueBelgianBelizeanBermudanBhutaneseBlackfeetBolivianBrazilianBritishBritish West IndianBulgarianBurmeseCajunCambodianCanadianCape VerdeanCarpatho RusynCelticCentral AmericanCentral American IndianCherokeeCheyenneChickasawChileanChineseChippewaChoctawColombianColvilleComancheCosta RicanCreeCreekCroatianCrowCubanCypriotCzechCzechoslovakianDanishDelawareDominicanDutchDutch West IndianEastern EuropeanEcuadorianEgyptianEnglishEstonianEthiopianEuropeanFijianFilipinoFinnishFrenchFrench American IndianFrench CanadianGermanGerman RussianGhanaianGreekGuamanian/ChamorroGuatemalanGuyaneseHaitianHmongHonduranHopiHoumaHungarianIcelanderIndian (Asian)IndonesianInupiatIranianIraqiIrishIroquoisIsraeliItalianJamaicanJapaneseJordanianKenyanKiowaKoreanLaotianLatvianLebaneseLiberianLithuanianLumbeeLuxembourgerMacedonianMalaysianMalteseMarshalleseMenomineeMexicanMexican American IndianMongolianMoroccanNative HawaiianNavajoNepaleseNew ZealanderNicaraguanNigerianNorthern EuropeanNorwegianOkinawanOsageOttawaPaiutePakistaniPalestinianPanamanianParaguayanPennsylvania GermanPeruvianPimaPolishPortuguesePotawatomiPuebloPuerto RicanPuget Sound SalishRomanianRussianSalvadoranSamoanScandinavianScotch-IrishScottishSeminoleSenegaleseSerbianShoshoneSierra LeoneanSiouxSlavicSlovakSloveneSomaliSouth AfricanSouth AmericanSouth American IndianSoviet UnionSpaniardSpanishSpanish AmericanSpanish American IndianSri LankanSubsaharan AfricanSudaneseSwedishSwissSyrianTaiwaneseThaiTlingit-HaidaTohono O'OdhamTonganTrinidadian and TobagonianTsimshianTurkishU.S. Virgin IslanderUgandanUkrainianUruguayanUteVenezuelanVietnameseWelshWest IndianYakamaYaquiYugoslavianYumanYup'ikZimbabwean
Immigration
NonimmigrantsImmigrantsAfghanistanAfricaAlbaniaArgentinaArmeniaAsiaAustraliaAustriaBahamasBangladeshBarbadosBelarusBelgiumBelizeBoliviaBosnia and HerzegovinaBrazilBulgariaBurma/MyanmarCabo VerdeCambodiaCameroonCanadaCaribbeanCentral AmericaChileChinaColombiaCongoCosta RicaCroatiaCubaCzechoslovakiaDenmarkDominicaDominican RepublicEastern AfricaEastern AsiaEastern EuropeEcuadorEgyptEl SalvadorEnglandEritreaEthiopiaEuropeFijiFranceGermanyGhanaGreeceGrenadaGuatemalaGuyanaHaitiHondurasHong KongHungaryIndiaIndonesiaIranIraqIrelandIsraelItalyJamaicaJapanJordanKazakhstanKenyaKoreaKuwaitLaosLatin AmericaLatviaLebanonLiberiaLithuaniaMalaysiaMexicoMicronesiaMiddle AfricaMoldovaMoroccoNepalNetherlandsNicaraguaNigeriaNorth AmericaNorth MacedoniaNorthern AfricaNorthern EuropeNorwayOceaniaPakistanPanamaPeruPhilippinesPolandPortugalRomaniaRussiaSaudi ArabiaScotlandSenegalSerbiaSierra LeoneSingaporeSomaliaSouth AfricaSouth AmericaSouth Central AsiaSouth Eastern AsiaSouthern EuropeSpainSri LankaSt. Vincent and the GrenadinesSudanSwedenSwitzerlandSyriaTaiwanThailandTrinidad and TobagoTurkeyUgandaUkraineUruguayUzbekistanVenezuelaVietnamWest IndiesWestern AfricaWestern AsiaWestern EuropeYemenZaireZimbabweAzores
Select to Compare
Race
Ancestry
AfghanAfricanAlaska NativeAlaskan AthabascanAlbanianAleutAlsatianAmericanApacheArabArapahoArgentineanArmenianAssyrian/Chaldean/SyriacAustralianAustrianBahamianBangladeshiBarbadianBasqueBelgianBelizeanBermudanBhutaneseBlackfeetBolivianBrazilianBritishBritish West IndianBulgarianBurmeseCajunCambodianCanadianCape VerdeanCarpatho RusynCelticCentral AmericanCentral American IndianCherokeeCheyenneChickasawChileanChineseChippewaChoctawColombianColvilleComancheCosta RicanCreeCreekCroatianCrowCubanCypriotCzechCzechoslovakianDanishDelawareDominicanDutchDutch West IndianEastern EuropeanEcuadorianEgyptianEnglishEstonianEthiopianEuropeanFijianFilipinoFinnishFrenchFrench American IndianFrench CanadianGermanGerman RussianGhanaianGreekGuamanian/ChamorroGuatemalanGuyaneseHaitianHmongHonduranHopiHoumaHungarianIcelanderIndian (Asian)IndonesianInupiatIranianIraqiIrishIroquoisIsraeliItalianJamaicanJordanianKenyanKiowaKoreanLaotianLatvianLebaneseLiberianLithuanianLumbeeLuxembourgerMacedonianMalaysianMalteseMarshalleseMenomineeMexicanMexican American IndianMongolianMoroccanNative HawaiianNavajoNepaleseNew ZealanderNicaraguanNigerianNorthern EuropeanNorwegianOkinawanOsageOttawaPaiutePakistaniPalestinianPanamanianParaguayanPennsylvania GermanPeruvianPimaPolishPortuguesePotawatomiPuebloPuerto RicanPuget Sound SalishRomanianRussianSalvadoranSamoanScandinavianScotch-IrishScottishSeminoleSenegaleseSerbianShoshoneSierra LeoneanSiouxSlavicSlovakSloveneSomaliSouth AfricanSouth AmericanSouth American IndianSoviet UnionSpaniardSpanishSpanish AmericanSpanish American IndianSri LankanSubsaharan AfricanSudaneseSwedishSwissSyrianTaiwaneseThaiTlingit-HaidaTohono O'OdhamTonganTrinidadian and TobagonianTsimshianTurkishU.S. Virgin IslanderUgandanUkrainianUruguayanUteVenezuelanVietnameseWelshWest IndianYakamaYaquiYugoslavianYumanYup'ikZimbabwean
Immigration
NonimmigrantsImmigrantsAfghanistanAfricaAlbaniaArgentinaArmeniaAsiaAustraliaAustriaBahamasBangladeshBarbadosBelarusBelgiumBelizeBoliviaBosnia and HerzegovinaBrazilBulgariaBurma/MyanmarCabo VerdeCambodiaCameroonCanadaCaribbeanCentral AmericaChileChinaColombiaCongoCosta RicaCroatiaCubaCzechoslovakiaDenmarkDominicaDominican RepublicEastern AfricaEastern AsiaEastern EuropeEcuadorEgyptEl SalvadorEnglandEritreaEthiopiaEuropeFijiFranceGermanyGhanaGreeceGrenadaGuatemalaGuyanaHaitiHondurasHong KongHungaryIndiaIndonesiaIranIraqIrelandIsraelItalyJamaicaJapanJordanKazakhstanKenyaKoreaKuwaitLaosLatin AmericaLatviaLebanonLiberiaLithuaniaMalaysiaMexicoMicronesiaMiddle AfricaMoldovaMoroccoNepalNetherlandsNicaraguaNigeriaNorth AmericaNorth MacedoniaNorthern AfricaNorthern EuropeNorwayOceaniaPakistanPanamaPeruPhilippinesPolandPortugalRomaniaRussiaSaudi ArabiaScotlandSenegalSerbiaSierra LeoneSingaporeSomaliaSouth AfricaSouth AmericaSouth Central AsiaSouth Eastern AsiaSouthern EuropeSpainSri LankaSt. Vincent and the GrenadinesSudanSwedenSwitzerlandSyriaTaiwanThailandTrinidad and TobagoTurkeyUgandaUkraineUruguayUzbekistanVenezuelaVietnamWest IndiesWestern AfricaWestern AsiaWestern EuropeYemenZaireZimbabweAzores
Married-couple Households
Income
Poverty
Unemployment
Labor Participation
Family Structure
Vehicle Availability
Education Level
Disability

Japanese Married-couple Households
Tragic

45.2%
MARRIED-COUPLE HOUSEHOLDS
5.7/ 100
METRIC RATING
214th/ 347
METRIC RANK

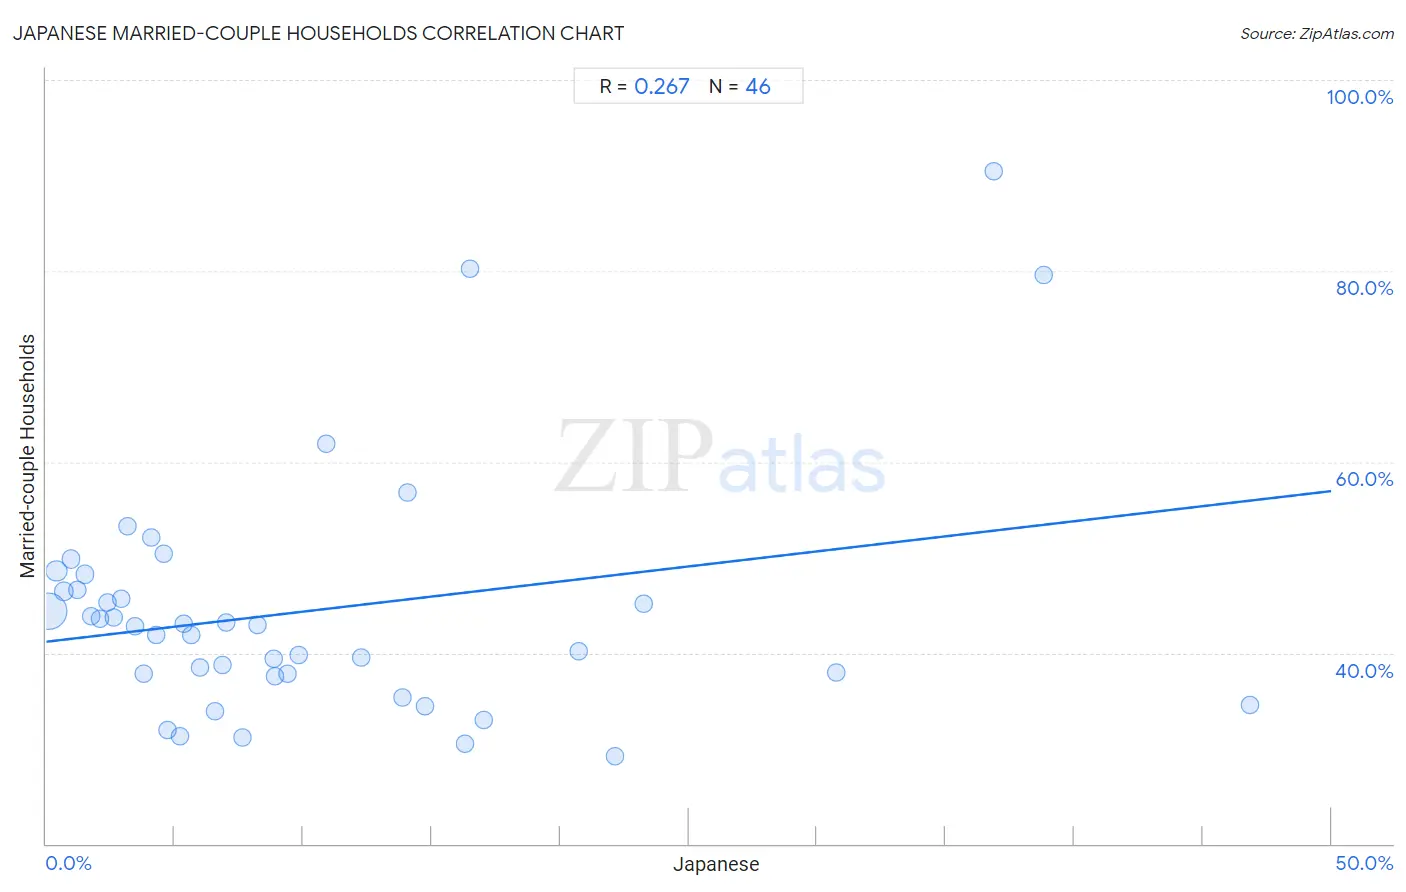
Japanese Married-couple Households Correlation Chart

The statistical analysis conducted on geographies consisting of 249,071,577 people shows a weak positive correlation between the proportion of Japanese and percentage of married-couple family households in the United States with a correlation coefficient (R) of 0.267 and weighted average of 45.2%. On average, for every 1% (one percent) increase in Japanese within a typical geography, there is an increase of 0.32% in percentage of married-couple family households.
Japanese Married-couple Households
It is essential to understand that the correlation between the percentage of Japanese and percentage of married-couple family households does not imply a direct cause-and-effect relationship. It remains uncertain whether the presence of Japanese influences an upward or downward trend in the level of percentage of married-couple family households within an area, or if Japanese simply ended up residing in those areas with higher or lower levels of percentage of married-couple family households due to other factors.

Demographics Similar to Japanese by Married-couple Households

In terms of married-couple households, the demographic groups most similar to Japanese are Yakama (45.2%, a difference of 0.020%), Immigrants from Nepal (45.2%, a difference of 0.020%), Immigrants from Portugal (45.2%, a difference of 0.020%), Panamanian (45.2%, a difference of 0.040%), and Immigrants from the Azores (45.2%, a difference of 0.070%).
DemographicsRating | RankMarried-couple Households
Immigrants from France
8.8
/100
|
#207
Tragic
45.4%
Hispanics or Latinos
8.7
/100
|
#208
Tragic
45.4%
Immigrants from Uzbekistan
8.4
/100
|
#209
Tragic
45.4%
Cubans
7.7
/100
|
#210
Tragic
45.4%
Immigrants from Spain
7.3
/100
|
#211
Tragic
45.3%
Creek
6.4
/100
|
#212
Tragic
45.3%
Yakama
5.8
/100
|
#213
Tragic
45.2%
Japanese
5.7
/100
|
#214
Tragic
45.2%
Immigrants from Nepal
5.6
/100
|
#215
Tragic
45.2%
Immigrants from Portugal
5.6
/100
|
#216
Tragic
45.2%
Panamanians
5.5
/100
|
#217
Tragic
45.2%
Immigrants from the Azores
5.3
/100
|
#218
Tragic
45.2%
Nicaraguans
5.3
/100
|
#219
Tragic
45.2%
Immigrants from Thailand
5.1
/100
|
#220
Tragic
45.2%
Tlingit-Haida
4.9
/100
|
#221
Tragic
45.1%

Japanese Married-couple Households Correlation Summary

MeasurementJapanese DataMarried-couple Households Data
Minimum0.089%29.2%
Maximum46.8%90.5%
Range46.7%61.3%
Mean10.3%44.4%
Median6.7%42.9%
Interquartile 25% (IQ1)3.1%37.8%
Interquartile 75% (IQ3)14.1%46.6%
Interquartile Range (IQR)10.9%8.8%
Standard Deviation (Sample)10.7%12.6%
Standard Deviation (Population)10.6%12.5%

Correlation Details

Japanese PercentileSample SizeMarried-couple Households
[
0.0%
-
0.5%
]
0.089%
191,171,52344.3%
[
0.0%
-
0.5%
]
0.39%
32,034,07748.6%
[
0.5%
-
1.0%
]
0.68%
11,040,41546.5%
[
0.5%
-
1.0%
]
0.95%
5,586,56949.8%
[
1.0%
-
1.5%
]
1.23%
2,870,55246.6%
[
1.5%
-
2.0%
]
1.51%
1,545,87348.2%
[
1.5%
-
2.0%
]
1.77%
1,268,09843.9%
[
2.0%
-
2.5%
]
2.09%
537,39243.6%
[
2.0%
-
2.5%
]
2.37%
401,59645.2%
[
2.5%
-
3.0%
]
2.64%
83,84843.7%
[
2.5%
-
3.0%
]
2.93%
184,19245.7%
[
3.0%
-
3.5%
]
3.15%
208,25653.2%
[
3.0%
-
3.5%
]
3.43%
147,54542.8%
[
3.5%
-
4.0%
]
3.81%
638,20937.8%
[
4.0%
-
4.5%
]
4.08%
60,10752.0%
[
4.0%
-
4.5%
]
4.30%
473,88241.9%
[
4.5%
-
5.0%
]
4.57%
68,00850.4%
[
4.5%
-
5.0%
]
4.73%
74,69531.9%
[
5.0%
-
5.5%
]
5.21%
41,24031.3%
[
5.0%
-
5.5%
]
5.34%
5,60043.0%
[
5.5%
-
6.0%
]
5.64%
104,25141.9%
[
5.5%
-
6.0%
]
5.96%
70,81838.5%
[
6.5%
-
7.0%
]
6.54%
65,60833.8%
[
6.5%
-
7.0%
]
6.83%
27838.7%
[
6.5%
-
7.0%
]
6.99%
41,00143.1%
[
7.5%
-
8.0%
]
7.63%
59,15331.2%
[
8.0%
-
8.5%
]
8.23%
4,14543.0%
[
8.5%
-
9.0%
]
8.84%
12,32439.4%
[
8.5%
-
9.0%
]
8.91%
11,67837.6%
[
9.0%
-
9.5%
]
9.38%
2,91137.9%
[
9.5%
-
10.0%
]
9.81%
59,46039.8%
[
10.5%
-
11.0%
]
10.92%
27,84861.8%
[
12.0%
-
12.5%
]
12.25%
2,58839.5%
[
13.5%
-
14.0%
]
13.86%
114,73735.3%
[
14.0%
-
14.5%
]
14.08%
1,36456.7%
[
14.5%
-
15.0%
]
14.72%
2,21534.4%
[
16.0%
-
16.5%
]
16.30%
41130.5%
[
16.0%
-
16.5%
]
16.47%
86880.2%
[
17.0%
-
17.5%
]
17.03%
7,11832.9%
[
20.5%
-
21.0%
]
20.70%
1,57540.2%
[
22.0%
-
22.5%
]
22.12%
5,47829.2%
[
23.0%
-
23.5%
]
23.24%
92145.1%
[
30.5%
-
31.0%
]
30.73%
32,32338.0%
[
36.5%
-
37.0%
]
36.86%
38890.5%
[
38.5%
-
39.0%
]
38.81%
21979.6%
[
46.5%
-
47.0%
]
46.82%
22034.5%