Japanese 4 or more Vehicles in Household
COMPARE
Japanese
Select to Compare
4 or more Vehicles in Household
Japanese 4 or more Vehicles in Household
7.7%
4+ VEHICLES AVAILABLE
100.0/ 100
METRIC RATING
52nd/ 347
METRIC RANK
Japanese 4 or more Vehicles in Household Correlation Chart
The statistical analysis conducted on geographies consisting of 248,680,016 people shows no correlation between the proportion of Japanese and percentage of households with 4 or more vehicles available in the United States with a correlation coefficient (R) of 0.033 and weighted average of 7.7%. On average, for every 1% (one percent) increase in Japanese within a typical geography, there is an increase of 0.016% in percentage of households with 4 or more vehicles available.
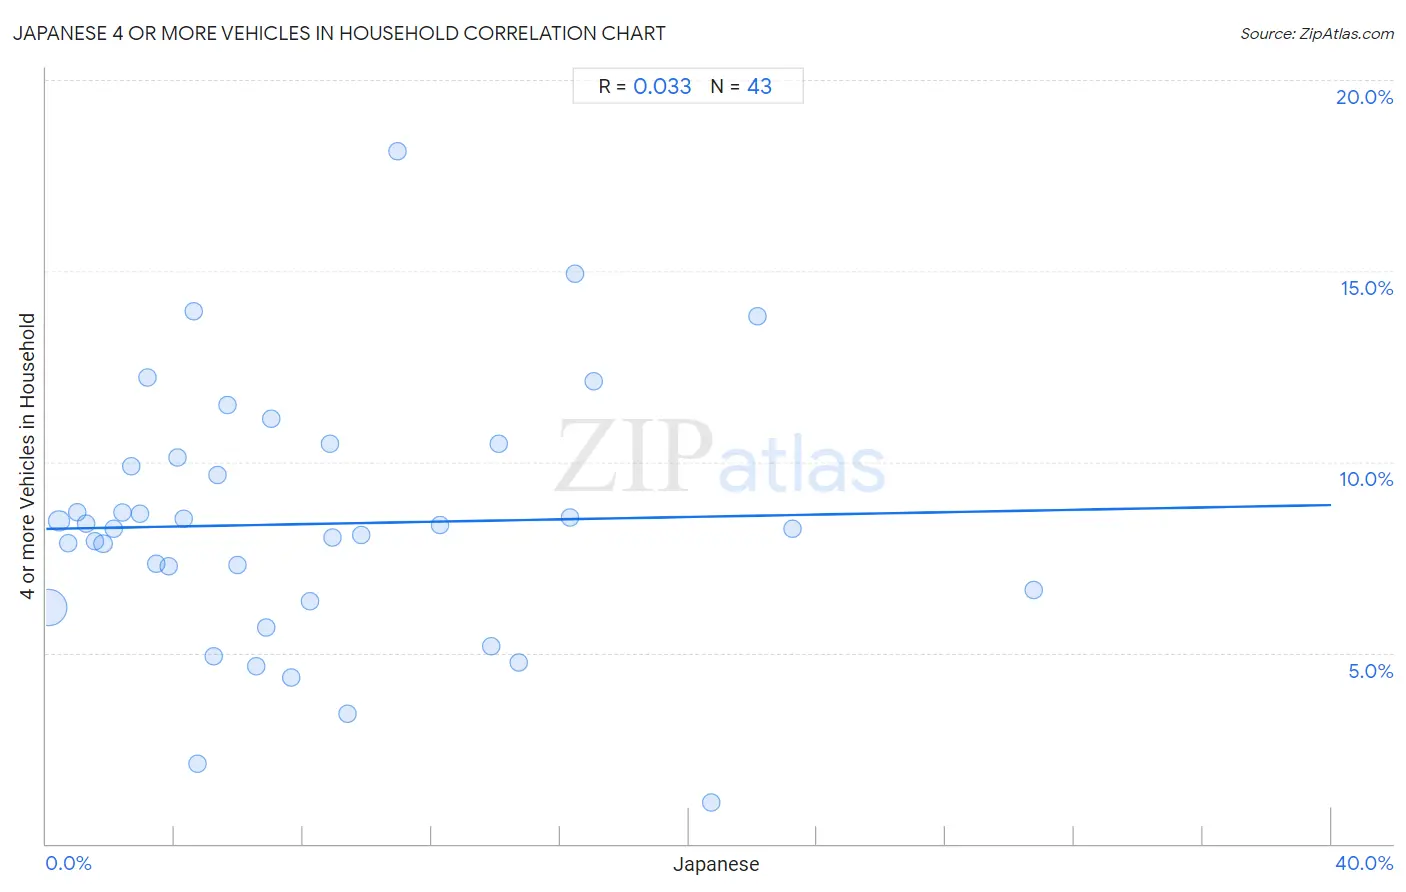
It is essential to understand that the correlation between the percentage of Japanese and percentage of households with 4 or more vehicles available does not imply a direct cause-and-effect relationship. It remains uncertain whether the presence of Japanese influences an upward or downward trend in the level of percentage of households with 4 or more vehicles available within an area, or if Japanese simply ended up residing in those areas with higher or lower levels of percentage of households with 4 or more vehicles available due to other factors.
Demographics Similar to Japanese by 4 or more Vehicles in Household
In terms of 4 or more vehicles in household, the demographic groups most similar to Japanese are Immigrants from Laos (7.7%, a difference of 0.12%), Malaysian (7.7%, a difference of 0.38%), Dutch (7.7%, a difference of 0.46%), Immigrants from El Salvador (7.7%, a difference of 0.47%), and Cherokee (7.7%, a difference of 0.63%).
| Demographics | Rating | Rank | 4 or more Vehicles in Household |
| Choctaw | 100.0 /100 | #45 | Exceptional 7.8% |
| Crow | 100.0 /100 | #46 | Exceptional 7.8% |
| Osage | 100.0 /100 | #47 | Exceptional 7.8% |
| Swiss | 100.0 /100 | #48 | Exceptional 7.8% |
| Cherokee | 100.0 /100 | #49 | Exceptional 7.7% |
| Immigrants from El Salvador | 100.0 /100 | #50 | Exceptional 7.7% |
| Immigrants from Laos | 100.0 /100 | #51 | Exceptional 7.7% |
| Japanese | 100.0 /100 | #52 | Exceptional 7.7% |
| Malaysians | 100.0 /100 | #53 | Exceptional 7.7% |
| Dutch | 100.0 /100 | #54 | Exceptional 7.7% |
| Immigrants from Oceania | 100.0 /100 | #55 | Exceptional 7.6% |
| English | 100.0 /100 | #56 | Exceptional 7.6% |
| Pennsylvania Germans | 100.0 /100 | #57 | Exceptional 7.6% |
| Swedes | 100.0 /100 | #58 | Exceptional 7.6% |
| Hispanics or Latinos | 100.0 /100 | #59 | Exceptional 7.6% |
Japanese 4 or more Vehicles in Household Correlation Summary
| Measurement | Japanese Data | 4 or more Vehicles in Household Data |
| Minimum | 0.089% | 1.1% |
| Maximum | 30.7% | 18.1% |
| Range | 30.6% | 17.0% |
| Mean | 8.2% | 8.4% |
| Median | 6.0% | 8.3% |
| Interquartile 25% (IQ1) | 2.9% | 6.3% |
| Interquartile 75% (IQ3) | 12.2% | 10.1% |
| Interquartile Range (IQR) | 9.3% | 3.8% |
| Standard Deviation (Sample) | 7.1% | 3.3% |
| Standard Deviation (Population) | 7.0% | 3.3% |
Correlation Details
| Japanese Percentile | Sample Size | 4 or more Vehicles in Household |
[ 0.0% - 0.5% ] 0.089% | 190,845,253 | 6.2% |
[ 0.0% - 0.5% ] 0.39% | 31,998,235 | 8.4% |
[ 0.5% - 1.0% ] 0.68% | 11,025,635 | 7.9% |
[ 0.5% - 1.0% ] 0.95% | 5,586,569 | 8.7% |
[ 1.0% - 1.5% ] 1.23% | 2,870,552 | 8.4% |
[ 1.5% - 2.0% ] 1.51% | 1,545,873 | 7.9% |
[ 1.5% - 2.0% ] 1.77% | 1,266,841 | 7.9% |
[ 2.0% - 2.5% ] 2.08% | 534,630 | 8.2% |
[ 2.0% - 2.5% ] 2.37% | 401,596 | 8.7% |
[ 2.5% - 3.0% ] 2.64% | 83,848 | 9.9% |
[ 2.5% - 3.0% ] 2.93% | 183,152 | 8.6% |
[ 3.0% - 3.5% ] 3.15% | 208,256 | 12.2% |
[ 3.0% - 3.5% ] 3.43% | 147,545 | 7.3% |
[ 3.5% - 4.0% ] 3.81% | 634,587 | 7.3% |
[ 4.0% - 4.5% ] 4.08% | 60,107 | 10.1% |
[ 4.0% - 4.5% ] 4.30% | 473,882 | 8.5% |
[ 4.5% - 5.0% ] 4.57% | 68,008 | 13.9% |
[ 4.5% - 5.0% ] 4.72% | 72,046 | 2.1% |
[ 5.0% - 5.5% ] 5.21% | 41,240 | 4.9% |
[ 5.0% - 5.5% ] 5.33% | 3,339 | 9.7% |
[ 5.5% - 6.0% ] 5.64% | 104,251 | 11.5% |
[ 5.5% - 6.0% ] 5.96% | 70,567 | 7.3% |
[ 6.5% - 7.0% ] 6.54% | 65,608 | 4.7% |
[ 6.5% - 7.0% ] 6.83% | 278 | 5.7% |
[ 6.5% - 7.0% ] 6.99% | 41,001 | 11.1% |
[ 7.5% - 8.0% ] 7.63% | 59,153 | 4.3% |
[ 8.0% - 8.5% ] 8.23% | 4,145 | 6.3% |
[ 8.5% - 9.0% ] 8.84% | 12,324 | 10.5% |
[ 8.5% - 9.0% ] 8.91% | 11,678 | 8.0% |
[ 9.0% - 9.5% ] 9.38% | 2,911 | 3.4% |
[ 9.5% - 10.0% ] 9.81% | 59,460 | 8.1% |
[ 10.5% - 11.0% ] 10.92% | 27,848 | 18.1% |
[ 12.0% - 12.5% ] 12.25% | 2,588 | 8.3% |
[ 13.5% - 14.0% ] 13.86% | 114,737 | 5.2% |
[ 14.0% - 14.5% ] 14.08% | 1,364 | 10.5% |
[ 14.5% - 15.0% ] 14.72% | 2,215 | 4.8% |
[ 16.0% - 16.5% ] 16.30% | 411 | 8.5% |
[ 16.0% - 16.5% ] 16.47% | 868 | 14.9% |
[ 17.0% - 17.5% ] 17.03% | 7,118 | 12.1% |
[ 20.5% - 21.0% ] 20.70% | 1,575 | 1.1% |
[ 22.0% - 22.5% ] 22.12% | 5,478 | 13.8% |
[ 23.0% - 23.5% ] 23.24% | 921 | 8.3% |
[ 30.5% - 31.0% ] 30.73% | 32,323 | 6.7% |