Bhutanese Married-Couple Family Poverty
COMPARE
Bhutanese
Select to Compare
Married-Couple Family Poverty
Bhutanese Married-Couple Family Poverty
4.1%
POVERTY | MARRIED-COUPLE FAMILIES
99.9/ 100
METRIC RATING
23rd/ 347
METRIC RANK
Bhutanese Married-Couple Family Poverty Correlation Chart
The statistical analysis conducted on geographies consisting of 450,291,687 people shows a weak positive correlation between the proportion of Bhutanese and poverty level among married-couple families in the United States with a correlation coefficient (R) of 0.217 and weighted average of 4.1%. On average, for every 1% (one percent) increase in Bhutanese within a typical geography, there is an increase of 0.11% in poverty level among married-couple families.
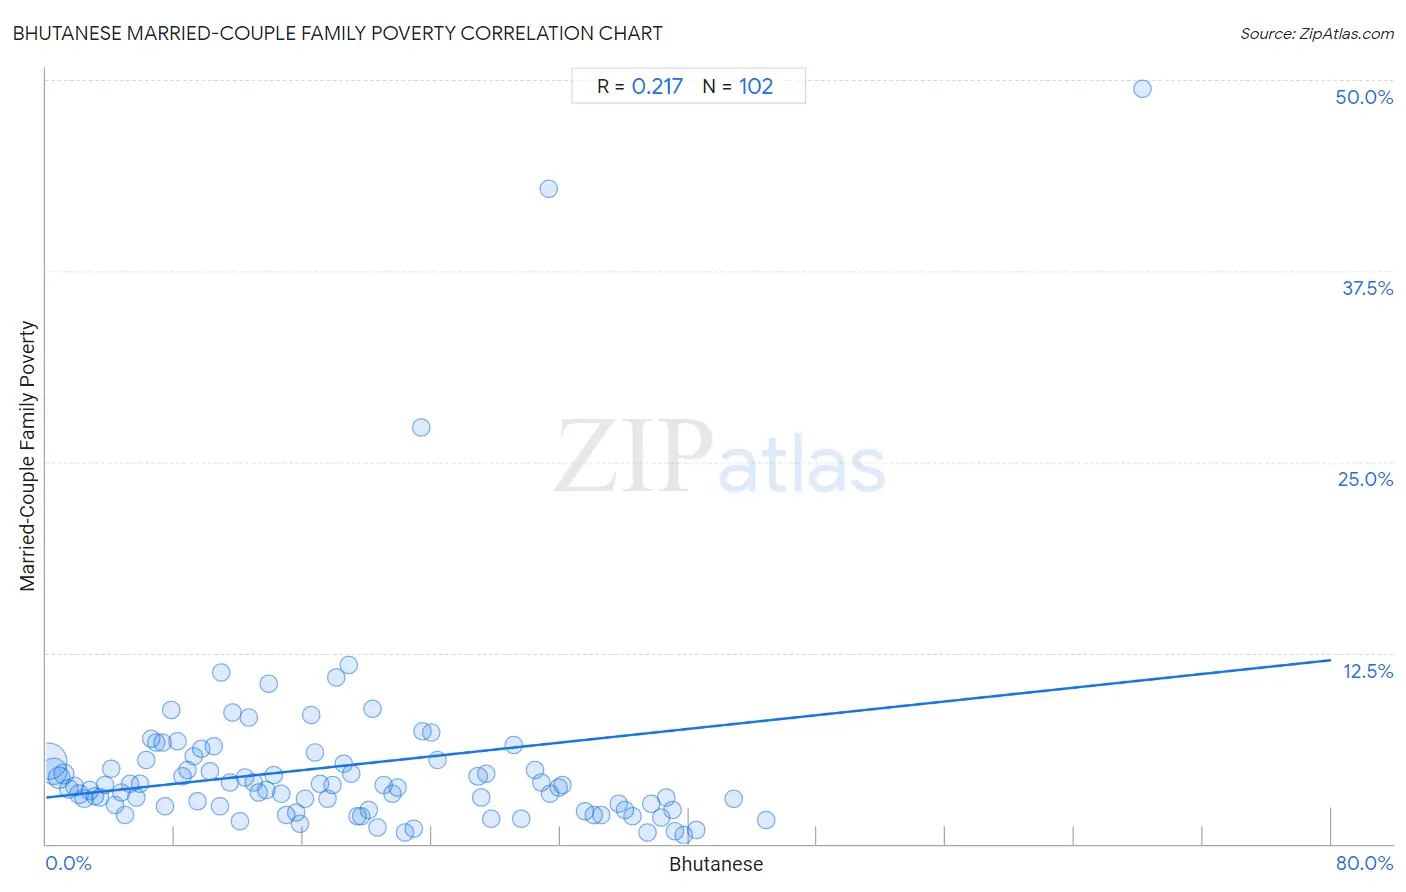
It is essential to understand that the correlation between the percentage of Bhutanese and poverty level among married-couple families does not imply a direct cause-and-effect relationship. It remains uncertain whether the presence of Bhutanese influences an upward or downward trend in the level of poverty level among married-couple families within an area, or if Bhutanese simply ended up residing in those areas with higher or lower levels of poverty level among married-couple families due to other factors.
Demographics Similar to Bhutanese by Married-Couple Family Poverty
In terms of married-couple family poverty, the demographic groups most similar to Bhutanese are Immigrants from Singapore (4.1%, a difference of 0.020%), Eastern European (4.1%, a difference of 0.23%), Zimbabwean (4.1%, a difference of 0.39%), Maltese (4.1%, a difference of 0.42%), and Immigrants from Ireland (4.1%, a difference of 0.66%).
| Demographics | Rating | Rank | Married-Couple Family Poverty |
| Germans | 100.0 /100 | #16 | Exceptional 4.0% |
| Filipinos | 100.0 /100 | #17 | Exceptional 4.0% |
| Italians | 100.0 /100 | #18 | Exceptional 4.0% |
| Immigrants from Ireland | 99.9 /100 | #19 | Exceptional 4.1% |
| Maltese | 99.9 /100 | #20 | Exceptional 4.1% |
| Zimbabweans | 99.9 /100 | #21 | Exceptional 4.1% |
| Immigrants from Singapore | 99.9 /100 | #22 | Exceptional 4.1% |
| Bhutanese | 99.9 /100 | #23 | Exceptional 4.1% |
| Eastern Europeans | 99.9 /100 | #24 | Exceptional 4.1% |
| Immigrants from Taiwan | 99.9 /100 | #25 | Exceptional 4.1% |
| Cypriots | 99.9 /100 | #26 | Exceptional 4.1% |
| Danes | 99.9 /100 | #27 | Exceptional 4.1% |
| Scandinavians | 99.9 /100 | #28 | Exceptional 4.1% |
| Immigrants from Scotland | 99.9 /100 | #29 | Exceptional 4.2% |
| Finns | 99.9 /100 | #30 | Exceptional 4.2% |
Bhutanese Married-Couple Family Poverty Correlation Summary
| Measurement | Bhutanese Data | Married-Couple Family Poverty Data |
| Minimum | 0.15% | 0.54% |
| Maximum | 68.2% | 49.5% |
| Range | 68.1% | 48.9% |
| Mean | 18.6% | 5.1% |
| Median | 16.6% | 3.7% |
| Interquartile 25% (IQ1) | 8.2% | 2.4% |
| Interquartile 75% (IQ3) | 27.7% | 5.4% |
| Interquartile Range (IQR) | 19.5% | 3.0% |
| Standard Deviation (Sample) | 13.0% | 6.7% |
| Standard Deviation (Population) | 12.9% | 6.7% |
Correlation Details
| Bhutanese Percentile | Sample Size | Married-Couple Family Poverty |
[ 0.0% - 0.5% ] 0.15% | 232,629,318 | 5.4% |
[ 0.0% - 0.5% ] 0.45% | 106,482,476 | 4.8% |
[ 0.5% - 1.0% ] 0.79% | 39,279,449 | 4.3% |
[ 1.0% - 1.5% ] 1.11% | 26,053,128 | 4.5% |
[ 1.0% - 1.5% ] 1.42% | 13,179,315 | 3.6% |
[ 1.5% - 2.0% ] 1.75% | 10,685,252 | 3.8% |
[ 2.0% - 2.5% ] 2.06% | 6,128,204 | 3.2% |
[ 2.0% - 2.5% ] 2.36% | 4,623,903 | 3.0% |
[ 2.5% - 3.0% ] 2.73% | 2,591,878 | 3.5% |
[ 3.0% - 3.5% ] 3.03% | 1,486,159 | 3.1% |
[ 3.0% - 3.5% ] 3.34% | 1,211,029 | 3.0% |
[ 3.5% - 4.0% ] 3.63% | 876,353 | 3.8% |
[ 4.0% - 4.5% ] 4.03% | 96,995 | 4.9% |
[ 4.0% - 4.5% ] 4.31% | 598,744 | 2.5% |
[ 4.5% - 5.0% ] 4.67% | 163,001 | 3.4% |
[ 4.5% - 5.0% ] 4.93% | 273,848 | 1.8% |
[ 5.0% - 5.5% ] 5.24% | 139,418 | 3.9% |
[ 5.5% - 6.0% ] 5.59% | 154,902 | 3.1% |
[ 5.5% - 6.0% ] 5.87% | 33,209 | 3.9% |
[ 6.0% - 6.5% ] 6.26% | 92,219 | 5.4% |
[ 6.5% - 7.0% ] 6.54% | 102,134 | 6.9% |
[ 6.5% - 7.0% ] 6.86% | 34,167 | 6.7% |
[ 7.0% - 7.5% ] 7.27% | 47,551 | 6.6% |
[ 7.0% - 7.5% ] 7.43% | 65,396 | 2.4% |
[ 7.5% - 8.0% ] 7.78% | 35,164 | 8.8% |
[ 8.0% - 8.5% ] 8.18% | 36,375 | 6.7% |
[ 8.5% - 9.0% ] 8.51% | 78,822 | 4.4% |
[ 8.5% - 9.0% ] 8.77% | 21,961 | 4.8% |
[ 9.0% - 9.5% ] 9.21% | 148,039 | 5.7% |
[ 9.0% - 9.5% ] 9.40% | 56,555 | 2.8% |
[ 9.5% - 10.0% ] 9.69% | 47,682 | 6.2% |
[ 10.0% - 10.5% ] 10.16% | 33,631 | 4.7% |
[ 10.0% - 10.5% ] 10.41% | 101,047 | 6.4% |
[ 10.5% - 11.0% ] 10.80% | 109,080 | 2.5% |
[ 10.5% - 11.0% ] 10.91% | 3,345 | 11.2% |
[ 11.0% - 11.5% ] 11.40% | 51,425 | 4.0% |
[ 11.5% - 12.0% ] 11.62% | 26,270 | 8.6% |
[ 12.0% - 12.5% ] 12.08% | 44,280 | 1.5% |
[ 12.0% - 12.5% ] 12.35% | 68,735 | 4.4% |
[ 12.5% - 13.0% ] 12.62% | 62,709 | 8.3% |
[ 12.5% - 13.0% ] 12.90% | 22,560 | 4.0% |
[ 13.0% - 13.5% ] 13.19% | 9,534 | 3.4% |
[ 13.5% - 14.0% ] 13.72% | 171,293 | 3.5% |
[ 13.5% - 14.0% ] 13.85% | 917 | 10.5% |
[ 14.0% - 14.5% ] 14.13% | 73,188 | 4.5% |
[ 14.5% - 15.0% ] 14.62% | 20,803 | 3.3% |
[ 14.5% - 15.0% ] 14.98% | 14,299 | 1.9% |
[ 15.5% - 16.0% ] 15.55% | 24,028 | 2.0% |
[ 15.5% - 16.0% ] 15.78% | 12,785 | 1.3% |
[ 16.0% - 16.5% ] 16.12% | 76,992 | 2.9% |
[ 16.0% - 16.5% ] 16.47% | 16,263 | 8.4% |
[ 16.5% - 17.0% ] 16.75% | 3,386 | 6.0% |
[ 17.0% - 17.5% ] 17.05% | 48,563 | 4.0% |
[ 17.0% - 17.5% ] 17.49% | 142,903 | 2.9% |
[ 17.5% - 18.0% ] 17.86% | 52,772 | 3.8% |
[ 18.0% - 18.5% ] 18.03% | 5,080 | 10.8% |
[ 18.0% - 18.5% ] 18.50% | 12,742 | 5.3% |
[ 18.5% - 19.0% ] 18.82% | 7,498 | 11.7% |
[ 19.0% - 19.5% ] 19.02% | 105,792 | 4.6% |
[ 19.0% - 19.5% ] 19.37% | 27,233 | 1.8% |
[ 19.5% - 20.0% ] 19.62% | 29,453 | 1.8% |
[ 20.0% - 20.5% ] 20.07% | 58,985 | 2.2% |
[ 20.0% - 20.5% ] 20.29% | 10,139 | 8.8% |
[ 20.5% - 21.0% ] 20.64% | 29,516 | 1.1% |
[ 20.5% - 21.0% ] 21.00% | 25,000 | 3.8% |
[ 21.5% - 22.0% ] 21.53% | 17,604 | 3.3% |
[ 21.5% - 22.0% ] 21.84% | 38,065 | 3.7% |
[ 22.0% - 22.5% ] 22.30% | 20,473 | 0.73% |
[ 22.5% - 23.0% ] 22.85% | 15,911 | 1.00% |
[ 23.0% - 23.5% ] 23.33% | 210 | 27.3% |
[ 23.0% - 23.5% ] 23.44% | 61,785 | 7.4% |
[ 23.5% - 24.0% ] 23.94% | 32,036 | 7.3% |
[ 24.0% - 24.5% ] 24.39% | 20,302 | 5.5% |
[ 26.5% - 27.0% ] 26.89% | 348,547 | 4.4% |
[ 27.0% - 27.5% ] 27.08% | 853 | 3.0% |
[ 27.0% - 27.5% ] 27.40% | 24,520 | 4.6% |
[ 27.5% - 28.0% ] 27.69% | 2,438 | 1.7% |
[ 29.0% - 29.5% ] 29.12% | 30,068 | 6.4% |
[ 29.5% - 30.0% ] 29.60% | 8,649 | 1.6% |
[ 30.0% - 30.5% ] 30.46% | 2,896 | 4.8% |
[ 30.5% - 31.0% ] 30.85% | 50,453 | 4.0% |
[ 31.0% - 31.5% ] 31.28% | 227 | 42.9% |
[ 31.0% - 31.5% ] 31.40% | 981 | 3.3% |
[ 31.5% - 32.0% ] 31.87% | 47,627 | 3.7% |
[ 32.0% - 32.5% ] 32.13% | 22,723 | 3.9% |
[ 33.5% - 34.0% ] 33.55% | 25,957 | 2.1% |
[ 34.0% - 34.5% ] 34.12% | 25,771 | 1.8% |
[ 34.5% - 35.0% ] 34.54% | 46,225 | 1.8% |
[ 35.5% - 36.0% ] 35.67% | 45,038 | 2.6% |
[ 36.0% - 36.5% ] 36.04% | 55,888 | 2.2% |
[ 36.0% - 36.5% ] 36.47% | 30,444 | 1.8% |
[ 37.0% - 37.5% ] 37.43% | 9,571 | 0.70% |
[ 37.5% - 38.0% ] 37.65% | 50,793 | 2.6% |
[ 38.0% - 38.5% ] 38.32% | 51,598 | 1.7% |
[ 38.5% - 39.0% ] 38.62% | 35,493 | 3.0% |
[ 38.5% - 39.0% ] 38.98% | 49,491 | 2.2% |
[ 39.0% - 39.5% ] 39.14% | 41,748 | 0.80% |
[ 39.5% - 40.0% ] 39.66% | 27,423 | 0.54% |
[ 40.0% - 40.5% ] 40.46% | 54,362 | 0.94% |
[ 42.5% - 43.0% ] 42.78% | 18,802 | 3.0% |
[ 44.5% - 45.0% ] 44.83% | 21,546 | 1.6% |
[ 68.0% - 68.5% ] 68.23% | 277 | 49.5% |