Bhutanese Disability
COMPARE
Bhutanese
Select to Compare
Disability
Bhutanese Disability
11.2%
DISABILITY
97.4/ 100
METRIC RATING
97th/ 347
METRIC RANK
Bhutanese Disability Correlation Chart
The statistical analysis conducted on geographies consisting of 455,521,093 people shows a poor positive correlation between the proportion of Bhutanese and percentage of population with a disability in the United States with a correlation coefficient (R) of 0.122 and weighted average of 11.2%. On average, for every 1% (one percent) increase in Bhutanese within a typical geography, there is an increase of 0.026% in percentage of population with a disability.
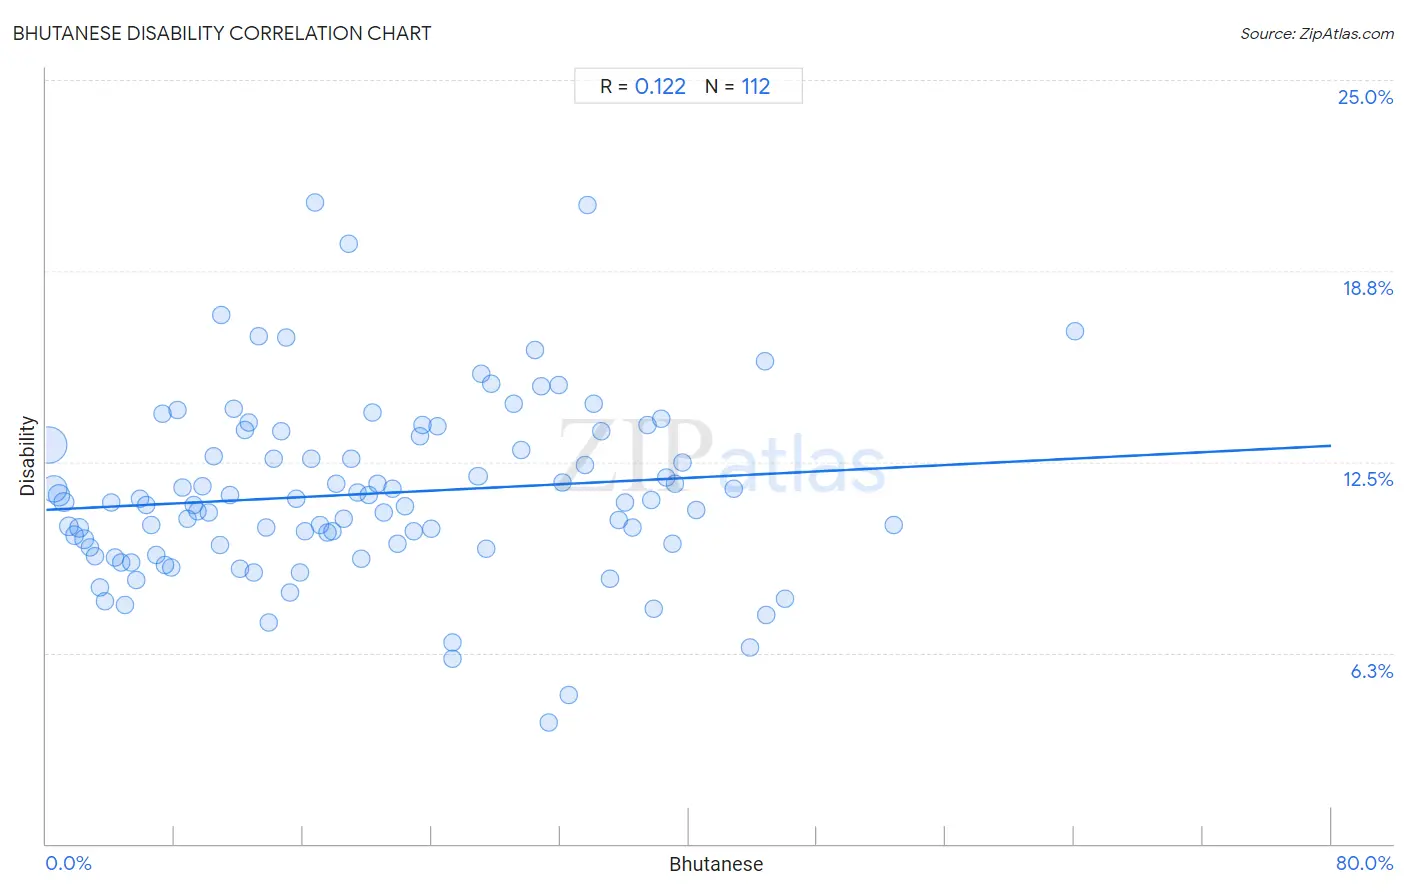
It is essential to understand that the correlation between the percentage of Bhutanese and percentage of population with a disability does not imply a direct cause-and-effect relationship. It remains uncertain whether the presence of Bhutanese influences an upward or downward trend in the level of percentage of population with a disability within an area, or if Bhutanese simply ended up residing in those areas with higher or lower levels of percentage of population with a disability due to other factors.
Demographics Similar to Bhutanese by Disability
In terms of disability, the demographic groups most similar to Bhutanese are Uruguayan (11.2%, a difference of 0.0%), Immigrants from Czechoslovakia (11.2%, a difference of 0.010%), Immigrants from Zimbabwe (11.2%, a difference of 0.14%), Immigrants from Greece (11.3%, a difference of 0.18%), and Immigrants from Morocco (11.2%, a difference of 0.21%).
| Demographics | Rating | Rank | Disability |
| Immigrants from Brazil | 98.1 /100 | #90 | Exceptional 11.2% |
| Immigrants from Western Asia | 98.1 /100 | #91 | Exceptional 11.2% |
| Ecuadorians | 98.0 /100 | #92 | Exceptional 11.2% |
| Immigrants from Ecuador | 98.0 /100 | #93 | Exceptional 11.2% |
| Immigrants from Morocco | 97.8 /100 | #94 | Exceptional 11.2% |
| Eastern Europeans | 97.8 /100 | #95 | Exceptional 11.2% |
| Immigrants from Zimbabwe | 97.7 /100 | #96 | Exceptional 11.2% |
| Bhutanese | 97.4 /100 | #97 | Exceptional 11.2% |
| Uruguayans | 97.4 /100 | #98 | Exceptional 11.2% |
| Immigrants from Czechoslovakia | 97.4 /100 | #99 | Exceptional 11.2% |
| Immigrants from Greece | 96.9 /100 | #100 | Exceptional 11.3% |
| Immigrants from Nicaragua | 96.8 /100 | #101 | Exceptional 11.3% |
| Immigrants from Eastern Africa | 96.7 /100 | #102 | Exceptional 11.3% |
| Immigrants from Uruguay | 96.4 /100 | #103 | Exceptional 11.3% |
| Immigrants | 96.4 /100 | #104 | Exceptional 11.3% |
Bhutanese Disability Correlation Summary
| Measurement | Bhutanese Data | Disability Data |
| Minimum | 0.15% | 4.0% |
| Maximum | 64.0% | 21.0% |
| Range | 63.9% | 17.0% |
| Mean | 20.1% | 11.5% |
| Median | 18.0% | 11.2% |
| Interquartile 25% (IQ1) | 9.0% | 9.7% |
| Interquartile 75% (IQ3) | 31.1% | 13.2% |
| Interquartile Range (IQR) | 22.1% | 3.5% |
| Standard Deviation (Sample) | 13.6% | 2.9% |
| Standard Deviation (Population) | 13.6% | 2.9% |
Correlation Details
| Bhutanese Percentile | Sample Size | Disability |
[ 0.0% - 0.5% ] 0.15% | 234,409,718 | 13.1% |
[ 0.0% - 0.5% ] 0.45% | 107,695,082 | 11.6% |
[ 0.5% - 1.0% ] 0.79% | 39,925,391 | 11.4% |
[ 1.0% - 1.5% ] 1.11% | 26,497,828 | 11.2% |
[ 1.0% - 1.5% ] 1.42% | 13,546,289 | 10.4% |
[ 1.5% - 2.0% ] 1.75% | 10,883,513 | 10.1% |
[ 2.0% - 2.5% ] 2.06% | 6,218,067 | 10.3% |
[ 2.0% - 2.5% ] 2.36% | 4,695,192 | 10.0% |
[ 2.5% - 3.0% ] 2.73% | 2,637,664 | 9.7% |
[ 3.0% - 3.5% ] 3.03% | 1,548,294 | 9.4% |
[ 3.0% - 3.5% ] 3.35% | 1,256,866 | 8.4% |
[ 3.5% - 4.0% ] 3.64% | 906,608 | 8.0% |
[ 4.0% - 4.5% ] 4.02% | 118,979 | 11.2% |
[ 4.0% - 4.5% ] 4.31% | 625,863 | 9.4% |
[ 4.5% - 5.0% ] 4.68% | 169,752 | 9.2% |
[ 4.5% - 5.0% ] 4.93% | 286,362 | 7.8% |
[ 5.0% - 5.5% ] 5.26% | 160,283 | 9.2% |
[ 5.5% - 6.0% ] 5.59% | 168,199 | 8.6% |
[ 5.5% - 6.0% ] 5.87% | 36,963 | 11.3% |
[ 6.0% - 6.5% ] 6.26% | 98,962 | 11.1% |
[ 6.5% - 7.0% ] 6.55% | 107,605 | 10.4% |
[ 6.5% - 7.0% ] 6.86% | 36,144 | 9.4% |
[ 7.0% - 7.5% ] 7.27% | 57,288 | 14.1% |
[ 7.0% - 7.5% ] 7.43% | 66,817 | 9.1% |
[ 7.5% - 8.0% ] 7.78% | 45,426 | 9.1% |
[ 8.0% - 8.5% ] 8.19% | 39,291 | 14.2% |
[ 8.5% - 9.0% ] 8.51% | 79,049 | 11.7% |
[ 8.5% - 9.0% ] 8.78% | 22,527 | 10.6% |
[ 9.0% - 9.5% ] 9.21% | 150,469 | 11.1% |
[ 9.0% - 9.5% ] 9.40% | 58,328 | 10.9% |
[ 9.5% - 10.0% ] 9.69% | 50,021 | 11.7% |
[ 10.0% - 10.5% ] 10.15% | 36,641 | 10.8% |
[ 10.0% - 10.5% ] 10.41% | 101,164 | 12.7% |
[ 10.5% - 11.0% ] 10.80% | 109,561 | 9.8% |
[ 10.5% - 11.0% ] 10.91% | 3,418 | 17.3% |
[ 11.0% - 11.5% ] 11.40% | 51,425 | 11.4% |
[ 11.5% - 12.0% ] 11.64% | 28,990 | 14.2% |
[ 12.0% - 12.5% ] 12.08% | 44,828 | 9.0% |
[ 12.0% - 12.5% ] 12.35% | 69,533 | 13.6% |
[ 12.5% - 13.0% ] 12.62% | 63,452 | 13.8% |
[ 12.5% - 13.0% ] 12.90% | 22,560 | 8.9% |
[ 13.0% - 13.5% ] 13.19% | 9,534 | 16.6% |
[ 13.5% - 14.0% ] 13.72% | 172,306 | 10.4% |
[ 13.5% - 14.0% ] 13.83% | 1,555 | 7.2% |
[ 14.0% - 14.5% ] 14.13% | 73,593 | 12.6% |
[ 14.5% - 15.0% ] 14.62% | 21,492 | 13.5% |
[ 14.5% - 15.0% ] 14.98% | 14,299 | 16.6% |
[ 15.0% - 15.5% ] 15.18% | 560 | 8.2% |
[ 15.5% - 16.0% ] 15.55% | 30,266 | 11.3% |
[ 15.5% - 16.0% ] 15.78% | 12,885 | 8.9% |
[ 16.0% - 16.5% ] 16.12% | 78,014 | 10.2% |
[ 16.0% - 16.5% ] 16.47% | 16,263 | 12.6% |
[ 16.5% - 17.0% ] 16.75% | 3,386 | 21.0% |
[ 17.0% - 17.5% ] 17.05% | 49,187 | 10.4% |
[ 17.0% - 17.5% ] 17.49% | 142,903 | 10.2% |
[ 17.5% - 18.0% ] 17.86% | 52,772 | 10.2% |
[ 18.0% - 18.5% ] 18.05% | 5,817 | 11.8% |
[ 18.5% - 19.0% ] 18.51% | 16,703 | 10.6% |
[ 18.5% - 19.0% ] 18.82% | 7,498 | 19.6% |
[ 19.0% - 19.5% ] 19.02% | 105,792 | 12.6% |
[ 19.0% - 19.5% ] 19.37% | 28,551 | 11.5% |
[ 19.5% - 20.0% ] 19.63% | 36,642 | 9.3% |
[ 20.0% - 20.5% ] 20.07% | 58,985 | 11.4% |
[ 20.0% - 20.5% ] 20.31% | 11,522 | 14.1% |
[ 20.5% - 21.0% ] 20.64% | 30,022 | 11.8% |
[ 20.5% - 21.0% ] 21.00% | 25,091 | 10.8% |
[ 21.5% - 22.0% ] 21.53% | 17,604 | 11.6% |
[ 21.5% - 22.0% ] 21.84% | 38,891 | 9.8% |
[ 22.0% - 22.5% ] 22.30% | 20,473 | 11.0% |
[ 22.5% - 23.0% ] 22.85% | 15,911 | 10.2% |
[ 23.0% - 23.5% ] 23.23% | 495 | 13.4% |
[ 23.0% - 23.5% ] 23.44% | 62,481 | 13.7% |
[ 23.5% - 24.0% ] 23.94% | 32,036 | 10.3% |
[ 24.0% - 24.5% ] 24.39% | 21,592 | 13.7% |
[ 25.0% - 25.5% ] 25.26% | 289 | 6.6% |
[ 25.0% - 25.5% ] 25.30% | 577 | 6.1% |
[ 26.5% - 27.0% ] 26.89% | 348,547 | 12.0% |
[ 27.0% - 27.5% ] 27.06% | 6,246 | 15.4% |
[ 27.0% - 27.5% ] 27.40% | 24,520 | 9.7% |
[ 27.5% - 28.0% ] 27.69% | 2,438 | 15.0% |
[ 29.0% - 29.5% ] 29.12% | 30,068 | 14.4% |
[ 29.5% - 30.0% ] 29.60% | 8,649 | 12.9% |
[ 30.0% - 30.5% ] 30.46% | 2,896 | 16.2% |
[ 30.5% - 31.0% ] 30.85% | 50,453 | 15.0% |
[ 31.0% - 31.5% ] 31.28% | 227 | 4.0% |
[ 31.5% - 32.0% ] 31.87% | 47,627 | 15.0% |
[ 32.0% - 32.5% ] 32.13% | 22,723 | 11.8% |
[ 32.5% - 33.0% ] 32.52% | 3,887 | 4.9% |
[ 33.5% - 34.0% ] 33.55% | 25,957 | 12.4% |
[ 33.5% - 34.0% ] 33.73% | 2,188 | 20.9% |
[ 34.0% - 34.5% ] 34.12% | 25,771 | 14.4% |
[ 34.5% - 35.0% ] 34.53% | 55,402 | 13.5% |
[ 35.0% - 35.5% ] 35.08% | 13,932 | 8.7% |
[ 35.5% - 36.0% ] 35.67% | 45,038 | 10.6% |
[ 36.0% - 36.5% ] 36.04% | 55,888 | 11.2% |
[ 36.0% - 36.5% ] 36.47% | 34,001 | 10.4% |
[ 37.0% - 37.5% ] 37.43% | 9,571 | 13.7% |
[ 37.5% - 38.0% ] 37.65% | 50,976 | 11.3% |
[ 37.5% - 38.0% ] 37.83% | 3,902 | 7.7% |
[ 38.0% - 38.5% ] 38.32% | 51,598 | 13.9% |
[ 38.5% - 39.0% ] 38.62% | 35,493 | 12.0% |
[ 38.5% - 39.0% ] 38.98% | 49,491 | 9.8% |
[ 39.0% - 39.5% ] 39.14% | 41,748 | 11.8% |
[ 39.5% - 40.0% ] 39.65% | 29,490 | 12.5% |
[ 40.0% - 40.5% ] 40.46% | 54,362 | 10.9% |
[ 42.5% - 43.0% ] 42.78% | 18,802 | 11.6% |
[ 43.5% - 44.0% ] 43.79% | 733 | 6.4% |
[ 44.5% - 45.0% ] 44.74% | 38 | 15.8% |
[ 44.5% - 45.0% ] 44.83% | 21,546 | 7.5% |
[ 46.0% - 46.5% ] 46.00% | 50 | 8.0% |
[ 52.5% - 53.0% ] 52.78% | 144 | 10.4% |
[ 64.0% - 64.5% ] 64.04% | 292 | 16.8% |