Bhutanese Self-Care Disability
COMPARE
Bhutanese
Select to Compare
Self-Care Disability
Bhutanese Self-Care Disability
2.4%
SELF-CARE DISABILITY
94.5/ 100
METRIC RATING
104th/ 347
METRIC RANK
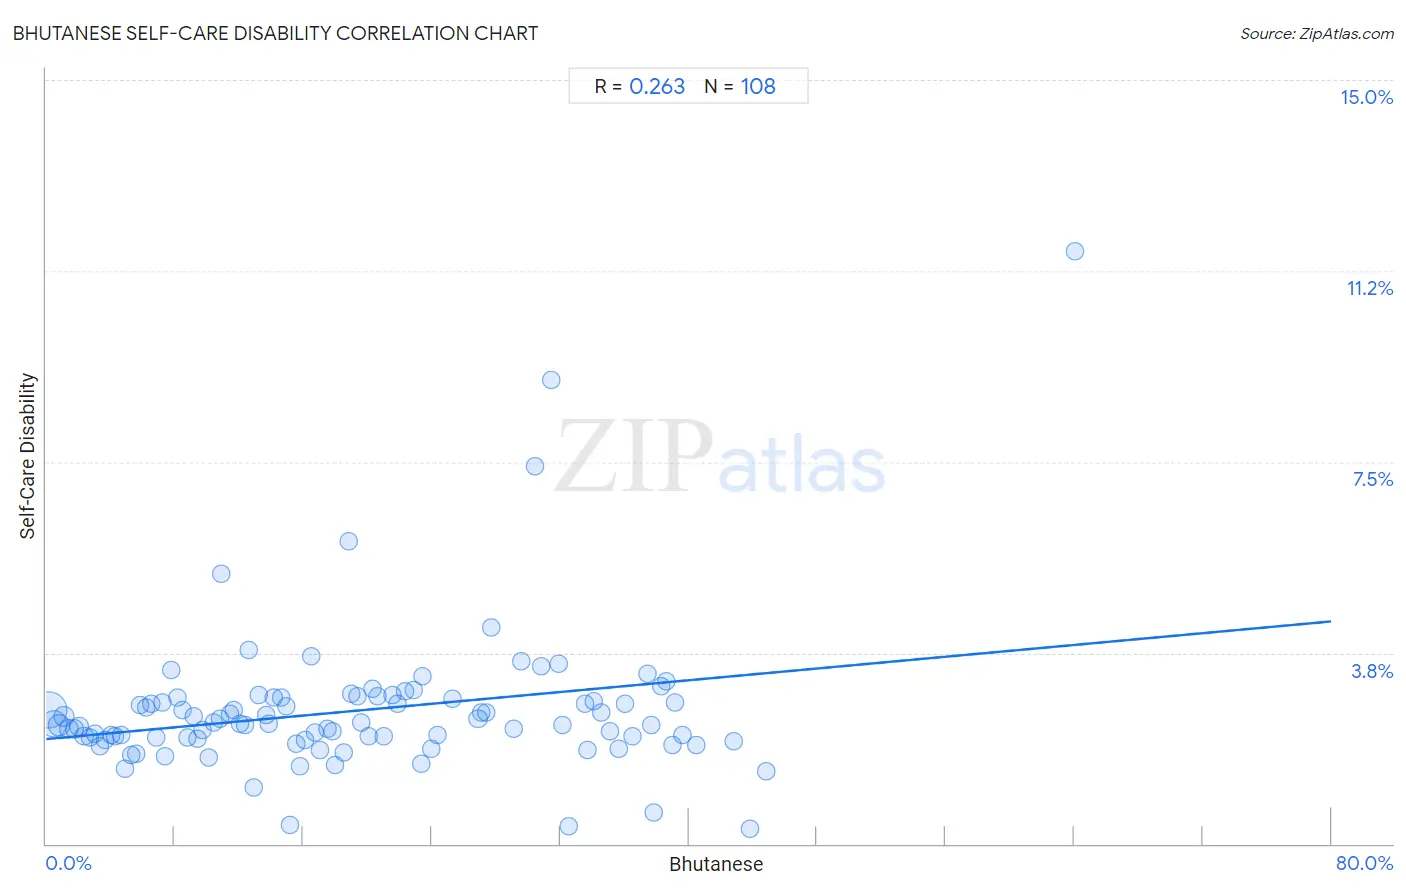
Bhutanese Self-Care Disability Correlation Chart
The statistical analysis conducted on geographies consisting of 454,630,496 people shows a weak positive correlation between the proportion of Bhutanese and percentage of population with self-care disability in the United States with a correlation coefficient (R) of 0.263 and weighted average of 2.4%. On average, for every 1% (one percent) increase in Bhutanese within a typical geography, there is an increase of 0.029% in percentage of population with self-care disability.
It is essential to understand that the correlation between the percentage of Bhutanese and percentage of population with self-care disability does not imply a direct cause-and-effect relationship. It remains uncertain whether the presence of Bhutanese influences an upward or downward trend in the level of percentage of population with self-care disability within an area, or if Bhutanese simply ended up residing in those areas with higher or lower levels of percentage of population with self-care disability due to other factors.
Demographics Similar to Bhutanese by Self-Care Disability
In terms of self-care disability, the demographic groups most similar to Bhutanese are Carpatho Rusyn (2.4%, a difference of 0.030%), Immigrants from Indonesia (2.4%, a difference of 0.040%), British (2.4%, a difference of 0.050%), Greek (2.4%, a difference of 0.080%), and Slovene (2.4%, a difference of 0.090%).
| Demographics | Rating | Rank | Self-Care Disability |
| Swiss | 96.6 /100 | #97 | Exceptional 2.4% |
| Immigrants from Poland | 96.4 /100 | #98 | Exceptional 2.4% |
| Immigrants from Israel | 96.1 /100 | #99 | Exceptional 2.4% |
| Europeans | 95.8 /100 | #100 | Exceptional 2.4% |
| Immigrants from Scotland | 95.7 /100 | #101 | Exceptional 2.4% |
| Croatians | 95.0 /100 | #102 | Exceptional 2.4% |
| Alsatians | 94.9 /100 | #103 | Exceptional 2.4% |
| Bhutanese | 94.5 /100 | #104 | Exceptional 2.4% |
| Carpatho Rusyns | 94.4 /100 | #105 | Exceptional 2.4% |
| Immigrants from Indonesia | 94.3 /100 | #106 | Exceptional 2.4% |
| British | 94.3 /100 | #107 | Exceptional 2.4% |
| Greeks | 94.1 /100 | #108 | Exceptional 2.4% |
| Slovenes | 94.1 /100 | #109 | Exceptional 2.4% |
| Immigrants from Africa | 93.7 /100 | #110 | Exceptional 2.4% |
| Serbians | 93.6 /100 | #111 | Exceptional 2.4% |
Bhutanese Self-Care Disability Correlation Summary
| Measurement | Bhutanese Data | Self-Care Disability Data |
| Minimum | 0.15% | 0.28% |
| Maximum | 64.0% | 11.6% |
| Range | 63.9% | 11.4% |
| Mean | 19.3% | 2.6% |
| Median | 17.3% | 2.4% |
| Interquartile 25% (IQ1) | 8.6% | 2.1% |
| Interquartile 75% (IQ3) | 30.0% | 2.9% |
| Interquartile Range (IQR) | 21.4% | 0.78% |
| Standard Deviation (Sample) | 13.0% | 1.4% |
| Standard Deviation (Population) | 13.0% | 1.4% |
Correlation Details
| Bhutanese Percentile | Sample Size | Self-Care Disability |
[ 0.0% - 0.5% ] 0.15% | 234,255,392 | 2.6% |
[ 0.0% - 0.5% ] 0.45% | 107,460,190 | 2.4% |
[ 0.5% - 1.0% ] 0.79% | 39,810,988 | 2.3% |
[ 1.0% - 1.5% ] 1.11% | 26,426,396 | 2.5% |
[ 1.0% - 1.5% ] 1.42% | 13,465,129 | 2.3% |
[ 1.5% - 2.0% ] 1.75% | 10,816,685 | 2.3% |
[ 2.0% - 2.5% ] 2.06% | 6,179,954 | 2.3% |
[ 2.0% - 2.5% ] 2.36% | 4,660,811 | 2.1% |
[ 2.5% - 3.0% ] 2.73% | 2,630,118 | 2.1% |
[ 3.0% - 3.5% ] 3.03% | 1,536,573 | 2.2% |
[ 3.0% - 3.5% ] 3.34% | 1,242,311 | 1.9% |
[ 3.5% - 4.0% ] 3.63% | 900,995 | 2.0% |
[ 4.0% - 4.5% ] 4.02% | 110,662 | 2.1% |
[ 4.0% - 4.5% ] 4.31% | 618,204 | 2.1% |
[ 4.5% - 5.0% ] 4.68% | 164,657 | 2.1% |
[ 4.5% - 5.0% ] 4.93% | 285,263 | 1.5% |
[ 5.0% - 5.5% ] 5.26% | 158,985 | 1.7% |
[ 5.5% - 6.0% ] 5.59% | 167,552 | 1.8% |
[ 5.5% - 6.0% ] 5.87% | 35,799 | 2.7% |
[ 6.0% - 6.5% ] 6.26% | 98,663 | 2.7% |
[ 6.5% - 7.0% ] 6.55% | 104,693 | 2.7% |
[ 6.5% - 7.0% ] 6.86% | 35,344 | 2.1% |
[ 7.0% - 7.5% ] 7.27% | 55,123 | 2.8% |
[ 7.0% - 7.5% ] 7.43% | 65,647 | 1.7% |
[ 7.5% - 8.0% ] 7.78% | 37,952 | 3.4% |
[ 8.0% - 8.5% ] 8.19% | 39,156 | 2.9% |
[ 8.5% - 9.0% ] 8.51% | 75,580 | 2.6% |
[ 8.5% - 9.0% ] 8.77% | 21,961 | 2.1% |
[ 9.0% - 9.5% ] 9.21% | 148,039 | 2.5% |
[ 9.0% - 9.5% ] 9.40% | 58,328 | 2.1% |
[ 9.5% - 10.0% ] 9.69% | 49,597 | 2.2% |
[ 10.0% - 10.5% ] 10.15% | 35,497 | 1.7% |
[ 10.0% - 10.5% ] 10.41% | 101,047 | 2.4% |
[ 10.5% - 11.0% ] 10.80% | 109,080 | 2.5% |
[ 10.5% - 11.0% ] 10.91% | 3,345 | 5.3% |
[ 11.0% - 11.5% ] 11.40% | 51,425 | 2.6% |
[ 11.5% - 12.0% ] 11.64% | 28,560 | 2.6% |
[ 12.0% - 12.5% ] 12.08% | 44,828 | 2.4% |
[ 12.0% - 12.5% ] 12.35% | 68,477 | 2.3% |
[ 12.5% - 13.0% ] 12.62% | 63,412 | 3.8% |
[ 12.5% - 13.0% ] 12.90% | 22,560 | 1.1% |
[ 13.0% - 13.5% ] 13.19% | 9,534 | 2.9% |
[ 13.5% - 14.0% ] 13.72% | 171,593 | 2.5% |
[ 13.5% - 14.0% ] 13.85% | 917 | 2.4% |
[ 14.0% - 14.5% ] 14.13% | 73,439 | 2.9% |
[ 14.5% - 15.0% ] 14.62% | 21,247 | 2.9% |
[ 14.5% - 15.0% ] 14.98% | 14,139 | 2.7% |
[ 15.0% - 15.5% ] 15.18% | 560 | 0.36% |
[ 15.5% - 16.0% ] 15.55% | 29,771 | 2.0% |
[ 15.5% - 16.0% ] 15.78% | 12,785 | 1.5% |
[ 16.0% - 16.5% ] 16.12% | 78,014 | 2.0% |
[ 16.0% - 16.5% ] 16.47% | 16,263 | 3.7% |
[ 16.5% - 17.0% ] 16.75% | 3,386 | 2.2% |
[ 17.0% - 17.5% ] 17.05% | 49,187 | 1.8% |
[ 17.0% - 17.5% ] 17.49% | 142,903 | 2.3% |
[ 17.5% - 18.0% ] 17.86% | 52,772 | 2.2% |
[ 17.5% - 18.0% ] 17.96% | 3,553 | 1.5% |
[ 18.5% - 19.0% ] 18.51% | 16,703 | 1.8% |
[ 18.5% - 19.0% ] 18.82% | 7,498 | 5.9% |
[ 19.0% - 19.5% ] 19.02% | 105,792 | 2.9% |
[ 19.0% - 19.5% ] 19.37% | 28,551 | 2.9% |
[ 19.5% - 20.0% ] 19.63% | 36,642 | 2.4% |
[ 20.0% - 20.5% ] 20.07% | 58,985 | 2.1% |
[ 20.0% - 20.5% ] 20.31% | 11,522 | 3.0% |
[ 20.5% - 21.0% ] 20.64% | 29,810 | 2.9% |
[ 20.5% - 21.0% ] 21.00% | 25,000 | 2.1% |
[ 21.5% - 22.0% ] 21.53% | 17,604 | 2.9% |
[ 21.5% - 22.0% ] 21.84% | 38,891 | 2.8% |
[ 22.0% - 22.5% ] 22.30% | 20,473 | 3.0% |
[ 22.5% - 23.0% ] 22.85% | 15,911 | 3.0% |
[ 23.0% - 23.5% ] 23.33% | 210 | 1.6% |
[ 23.0% - 23.5% ] 23.44% | 62,481 | 3.3% |
[ 23.5% - 24.0% ] 23.94% | 32,036 | 1.9% |
[ 24.0% - 24.5% ] 24.39% | 21,592 | 2.1% |
[ 25.0% - 25.5% ] 25.30% | 577 | 2.8% |
[ 26.5% - 27.0% ] 26.89% | 348,547 | 2.4% |
[ 27.0% - 27.5% ] 27.06% | 6,246 | 2.6% |
[ 27.0% - 27.5% ] 27.40% | 24,520 | 2.6% |
[ 27.5% - 28.0% ] 27.69% | 2,438 | 4.2% |
[ 29.0% - 29.5% ] 29.12% | 30,068 | 2.3% |
[ 29.5% - 30.0% ] 29.60% | 8,649 | 3.6% |
[ 30.0% - 30.5% ] 30.46% | 2,896 | 7.4% |
[ 30.5% - 31.0% ] 30.85% | 50,453 | 3.5% |
[ 31.0% - 31.5% ] 31.45% | 1,313 | 9.1% |
[ 31.5% - 32.0% ] 31.87% | 47,627 | 3.5% |
[ 32.0% - 32.5% ] 32.13% | 22,723 | 2.3% |
[ 32.5% - 33.0% ] 32.52% | 3,887 | 0.33% |
[ 33.5% - 34.0% ] 33.55% | 25,957 | 2.8% |
[ 33.5% - 34.0% ] 33.73% | 2,188 | 1.8% |
[ 34.0% - 34.5% ] 34.12% | 25,771 | 2.8% |
[ 34.5% - 35.0% ] 34.53% | 55,402 | 2.6% |
[ 35.0% - 35.5% ] 35.08% | 13,932 | 2.2% |
[ 35.5% - 36.0% ] 35.67% | 45,038 | 1.9% |
[ 36.0% - 36.5% ] 36.04% | 55,888 | 2.8% |
[ 36.0% - 36.5% ] 36.47% | 34,001 | 2.1% |
[ 37.0% - 37.5% ] 37.43% | 9,571 | 3.3% |
[ 37.5% - 38.0% ] 37.65% | 50,793 | 2.3% |
[ 37.5% - 38.0% ] 37.83% | 3,902 | 0.61% |
[ 38.0% - 38.5% ] 38.32% | 51,598 | 3.1% |
[ 38.5% - 39.0% ] 38.62% | 35,493 | 3.2% |
[ 38.5% - 39.0% ] 38.98% | 49,491 | 1.9% |
[ 39.0% - 39.5% ] 39.14% | 41,560 | 2.8% |
[ 39.5% - 40.0% ] 39.65% | 29,490 | 2.1% |
[ 40.0% - 40.5% ] 40.46% | 54,362 | 1.9% |
[ 42.5% - 43.0% ] 42.78% | 18,802 | 2.0% |
[ 43.5% - 44.0% ] 43.79% | 733 | 0.28% |
[ 44.5% - 45.0% ] 44.83% | 21,546 | 1.4% |
[ 64.0% - 64.5% ] 64.04% | 292 | 11.6% |