Bhutanese Receiving Food Stamps
COMPARE
Bhutanese
Select to Compare
Receiving Food Stamps
Bhutanese Receiving Food Stamps
9.2%
PUBLIC INCOME | FOOD STAMPS
99.8/ 100
METRIC RATING
27th/ 347
METRIC RANK
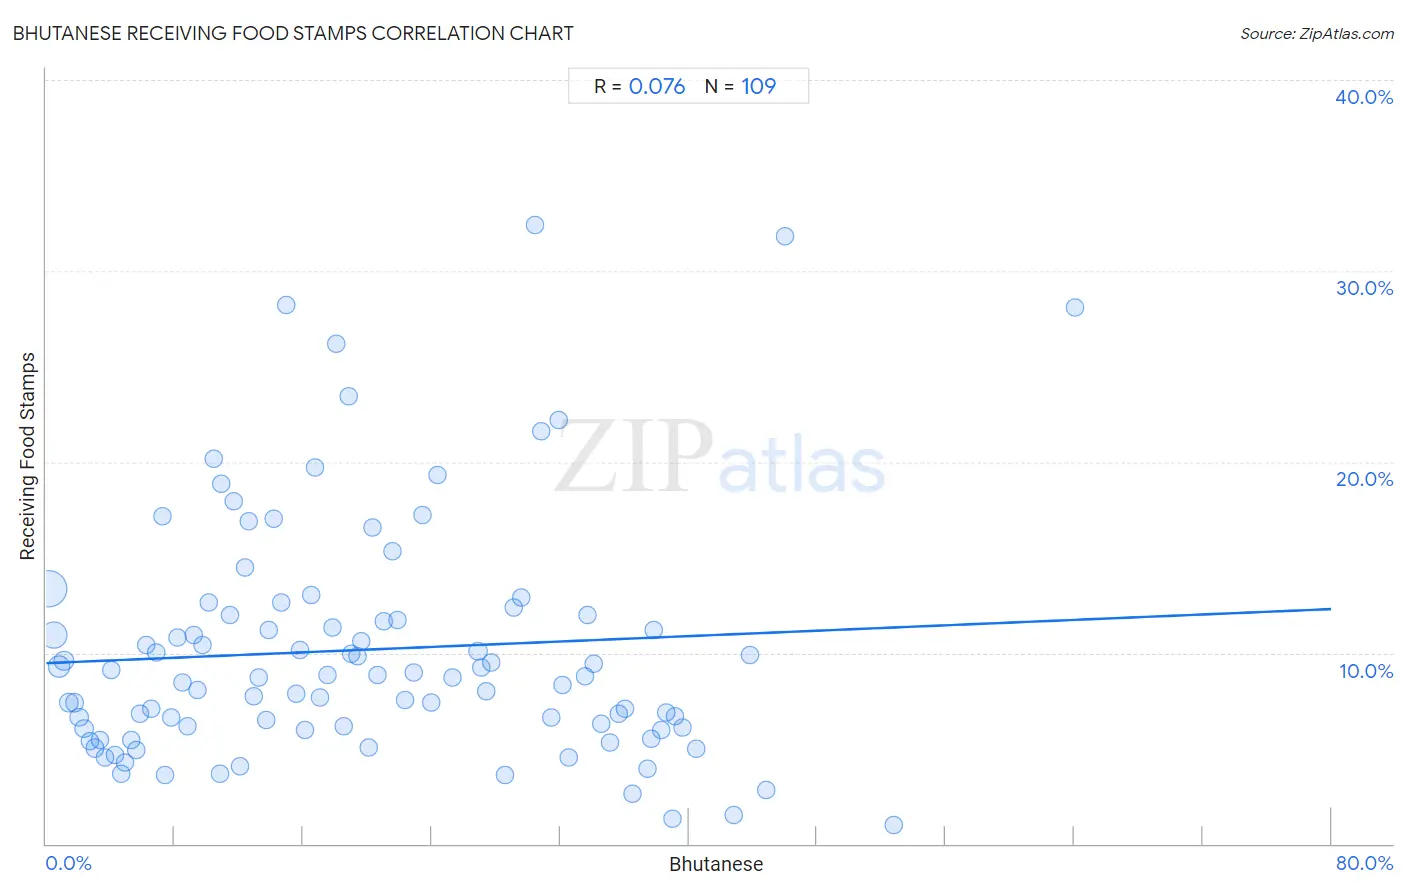
Bhutanese Receiving Food Stamps Correlation Chart
The statistical analysis conducted on geographies consisting of 453,770,052 people shows a slight positive correlation between the proportion of Bhutanese and percentage of population receiving government assistance and/or food stamps in the United States with a correlation coefficient (R) of 0.076 and weighted average of 9.2%. On average, for every 1% (one percent) increase in Bhutanese within a typical geography, there is an increase of 0.035% in percentage of population receiving government assistance and/or food stamps.
It is essential to understand that the correlation between the percentage of Bhutanese and percentage of population receiving government assistance and/or food stamps does not imply a direct cause-and-effect relationship. It remains uncertain whether the presence of Bhutanese influences an upward or downward trend in the level of percentage of population receiving government assistance and/or food stamps within an area, or if Bhutanese simply ended up residing in those areas with higher or lower levels of percentage of population receiving government assistance and/or food stamps due to other factors.
Demographics Similar to Bhutanese by Receiving Food Stamps
In terms of receiving food stamps, the demographic groups most similar to Bhutanese are Czech (9.2%, a difference of 0.010%), Swedish (9.2%, a difference of 0.24%), Immigrants from Lithuania (9.2%, a difference of 0.28%), Immigrants from Ireland (9.2%, a difference of 0.43%), and Immigrants from Northern Europe (9.2%, a difference of 0.54%).
| Demographics | Rating | Rank | Receiving Food Stamps |
| Latvians | 99.8 /100 | #20 | Exceptional 9.1% |
| Luxembourgers | 99.8 /100 | #21 | Exceptional 9.1% |
| Immigrants from Australia | 99.8 /100 | #22 | Exceptional 9.2% |
| Eastern Europeans | 99.8 /100 | #23 | Exceptional 9.2% |
| Immigrants from Northern Europe | 99.8 /100 | #24 | Exceptional 9.2% |
| Immigrants from Ireland | 99.8 /100 | #25 | Exceptional 9.2% |
| Swedes | 99.8 /100 | #26 | Exceptional 9.2% |
| Bhutanese | 99.8 /100 | #27 | Exceptional 9.2% |
| Czechs | 99.8 /100 | #28 | Exceptional 9.2% |
| Immigrants from Lithuania | 99.8 /100 | #29 | Exceptional 9.2% |
| Immigrants from Sweden | 99.7 /100 | #30 | Exceptional 9.3% |
| Immigrants from Eastern Asia | 99.7 /100 | #31 | Exceptional 9.3% |
| Bolivians | 99.7 /100 | #32 | Exceptional 9.3% |
| Zimbabweans | 99.6 /100 | #33 | Exceptional 9.5% |
| Turks | 99.6 /100 | #34 | Exceptional 9.5% |
Bhutanese Receiving Food Stamps Correlation Summary
| Measurement | Bhutanese Data | Receiving Food Stamps Data |
| Minimum | 0.15% | 1.0% |
| Maximum | 64.0% | 32.4% |
| Range | 63.9% | 31.4% |
| Mean | 19.9% | 10.2% |
| Median | 17.9% | 8.8% |
| Interquartile 25% (IQ1) | 8.6% | 6.0% |
| Interquartile 75% (IQ3) | 31.2% | 12.0% |
| Interquartile Range (IQR) | 22.5% | 6.0% |
| Standard Deviation (Sample) | 13.6% | 6.3% |
| Standard Deviation (Population) | 13.5% | 6.3% |
Correlation Details
| Bhutanese Percentile | Sample Size | Receiving Food Stamps |
[ 0.0% - 0.5% ] 0.15% | 233,944,684 | 13.3% |
[ 0.0% - 0.5% ] 0.45% | 107,261,341 | 10.9% |
[ 0.5% - 1.0% ] 0.79% | 39,654,610 | 9.3% |
[ 1.0% - 1.5% ] 1.11% | 26,366,237 | 9.6% |
[ 1.0% - 1.5% ] 1.42% | 13,385,411 | 7.4% |
[ 1.5% - 2.0% ] 1.75% | 10,831,620 | 7.4% |
[ 2.0% - 2.5% ] 2.06% | 6,185,642 | 6.6% |
[ 2.0% - 2.5% ] 2.36% | 4,652,275 | 6.0% |
[ 2.5% - 3.0% ] 2.73% | 2,622,453 | 5.4% |
[ 3.0% - 3.5% ] 3.03% | 1,506,408 | 5.0% |
[ 3.0% - 3.5% ] 3.34% | 1,233,275 | 5.5% |
[ 3.5% - 4.0% ] 3.63% | 900,012 | 4.5% |
[ 4.0% - 4.5% ] 4.02% | 103,908 | 9.1% |
[ 4.0% - 4.5% ] 4.31% | 617,347 | 4.6% |
[ 4.5% - 5.0% ] 4.68% | 166,650 | 3.7% |
[ 4.5% - 5.0% ] 4.93% | 278,206 | 4.3% |
[ 5.0% - 5.5% ] 5.26% | 159,060 | 5.4% |
[ 5.5% - 6.0% ] 5.59% | 165,094 | 4.9% |
[ 5.5% - 6.0% ] 5.87% | 35,272 | 6.8% |
[ 6.0% - 6.5% ] 6.26% | 98,429 | 10.4% |
[ 6.5% - 7.0% ] 6.54% | 103,506 | 7.0% |
[ 6.5% - 7.0% ] 6.86% | 34,818 | 10.0% |
[ 7.0% - 7.5% ] 7.27% | 50,979 | 17.2% |
[ 7.0% - 7.5% ] 7.43% | 65,647 | 3.6% |
[ 7.5% - 8.0% ] 7.78% | 36,822 | 6.6% |
[ 8.0% - 8.5% ] 8.19% | 38,629 | 10.8% |
[ 8.5% - 9.0% ] 8.51% | 77,534 | 8.5% |
[ 8.5% - 9.0% ] 8.77% | 21,961 | 6.2% |
[ 9.0% - 9.5% ] 9.21% | 148,474 | 10.9% |
[ 9.0% - 9.5% ] 9.40% | 58,328 | 8.1% |
[ 9.5% - 10.0% ] 9.69% | 49,157 | 10.4% |
[ 10.0% - 10.5% ] 10.15% | 36,308 | 12.7% |
[ 10.0% - 10.5% ] 10.41% | 101,047 | 20.1% |
[ 10.5% - 11.0% ] 10.80% | 109,080 | 3.7% |
[ 10.5% - 11.0% ] 10.91% | 3,345 | 18.9% |
[ 11.0% - 11.5% ] 11.40% | 51,425 | 12.0% |
[ 11.5% - 12.0% ] 11.64% | 28,560 | 17.9% |
[ 12.0% - 12.5% ] 12.08% | 44,828 | 4.1% |
[ 12.0% - 12.5% ] 12.35% | 68,477 | 14.5% |
[ 12.5% - 13.0% ] 12.62% | 63,412 | 16.9% |
[ 12.5% - 13.0% ] 12.90% | 22,560 | 7.7% |
[ 13.0% - 13.5% ] 13.19% | 9,534 | 8.7% |
[ 13.5% - 14.0% ] 13.72% | 172,262 | 6.5% |
[ 13.5% - 14.0% ] 13.85% | 917 | 11.2% |
[ 14.0% - 14.5% ] 14.13% | 73,593 | 17.0% |
[ 14.5% - 15.0% ] 14.62% | 21,492 | 12.6% |
[ 14.5% - 15.0% ] 14.98% | 14,299 | 28.2% |
[ 15.5% - 16.0% ] 15.55% | 30,266 | 7.9% |
[ 15.5% - 16.0% ] 15.78% | 12,885 | 10.1% |
[ 16.0% - 16.5% ] 16.12% | 76,992 | 5.9% |
[ 16.0% - 16.5% ] 16.47% | 16,263 | 13.0% |
[ 16.5% - 17.0% ] 16.75% | 3,386 | 19.7% |
[ 17.0% - 17.5% ] 17.05% | 49,187 | 7.6% |
[ 17.0% - 17.5% ] 17.49% | 142,903 | 8.8% |
[ 17.5% - 18.0% ] 17.86% | 52,772 | 11.4% |
[ 18.0% - 18.5% ] 18.03% | 5,080 | 26.2% |
[ 18.5% - 19.0% ] 18.51% | 16,703 | 6.2% |
[ 18.5% - 19.0% ] 18.82% | 7,498 | 23.4% |
[ 19.0% - 19.5% ] 19.02% | 105,792 | 10.0% |
[ 19.0% - 19.5% ] 19.37% | 28,551 | 9.8% |
[ 19.5% - 20.0% ] 19.63% | 36,642 | 10.6% |
[ 20.0% - 20.5% ] 20.07% | 58,985 | 5.1% |
[ 20.0% - 20.5% ] 20.31% | 11,522 | 16.5% |
[ 20.5% - 21.0% ] 20.64% | 29,810 | 8.8% |
[ 20.5% - 21.0% ] 21.00% | 25,091 | 11.7% |
[ 21.5% - 22.0% ] 21.53% | 17,604 | 15.3% |
[ 21.5% - 22.0% ] 21.84% | 38,891 | 11.7% |
[ 22.0% - 22.5% ] 22.30% | 20,473 | 7.5% |
[ 22.5% - 23.0% ] 22.85% | 15,911 | 9.0% |
[ 23.0% - 23.5% ] 23.44% | 61,785 | 17.2% |
[ 23.5% - 24.0% ] 23.94% | 32,036 | 7.4% |
[ 24.0% - 24.5% ] 24.39% | 21,592 | 19.3% |
[ 25.0% - 25.5% ] 25.30% | 577 | 8.7% |
[ 26.5% - 27.0% ] 26.89% | 348,547 | 10.1% |
[ 27.0% - 27.5% ] 27.06% | 6,246 | 9.2% |
[ 27.0% - 27.5% ] 27.40% | 24,520 | 8.0% |
[ 27.5% - 28.0% ] 27.69% | 2,438 | 9.5% |
[ 28.5% - 29.0% ] 28.53% | 368 | 3.6% |
[ 29.0% - 29.5% ] 29.12% | 30,068 | 12.4% |
[ 29.5% - 30.0% ] 29.60% | 8,649 | 12.9% |
[ 30.0% - 30.5% ] 30.46% | 2,896 | 32.4% |
[ 30.5% - 31.0% ] 30.85% | 50,453 | 21.6% |
[ 31.0% - 31.5% ] 31.45% | 1,313 | 6.6% |
[ 31.5% - 32.0% ] 31.87% | 47,627 | 22.2% |
[ 32.0% - 32.5% ] 32.13% | 22,723 | 8.3% |
[ 32.5% - 33.0% ] 32.52% | 3,887 | 4.5% |
[ 33.5% - 34.0% ] 33.55% | 25,957 | 8.8% |
[ 33.5% - 34.0% ] 33.73% | 2,188 | 12.0% |
[ 34.0% - 34.5% ] 34.12% | 25,771 | 9.4% |
[ 34.5% - 35.0% ] 34.53% | 55,402 | 6.3% |
[ 35.0% - 35.5% ] 35.08% | 13,932 | 5.3% |
[ 35.5% - 36.0% ] 35.67% | 45,038 | 6.8% |
[ 36.0% - 36.5% ] 36.04% | 55,888 | 7.1% |
[ 36.0% - 36.5% ] 36.47% | 34,001 | 2.6% |
[ 37.0% - 37.5% ] 37.43% | 9,571 | 3.9% |
[ 37.5% - 38.0% ] 37.65% | 50,793 | 5.5% |
[ 37.5% - 38.0% ] 37.83% | 3,902 | 11.2% |
[ 38.0% - 38.5% ] 38.32% | 51,598 | 5.9% |
[ 38.5% - 39.0% ] 38.62% | 35,493 | 6.9% |
[ 38.5% - 39.0% ] 38.98% | 49,491 | 1.3% |
[ 39.0% - 39.5% ] 39.14% | 41,748 | 6.7% |
[ 39.5% - 40.0% ] 39.65% | 29,490 | 6.1% |
[ 40.0% - 40.5% ] 40.46% | 54,362 | 5.0% |
[ 42.5% - 43.0% ] 42.78% | 18,802 | 1.5% |
[ 43.5% - 44.0% ] 43.79% | 733 | 9.9% |
[ 44.5% - 45.0% ] 44.83% | 21,546 | 2.8% |
[ 46.0% - 46.5% ] 46.00% | 50 | 31.8% |
[ 52.5% - 53.0% ] 52.78% | 144 | 1.0% |
[ 64.0% - 64.5% ] 64.04% | 292 | 28.1% |