Bhutanese 3 or more Vehicles in Household
COMPARE
Bhutanese
Select to Compare
3 or more Vehicles in Household
Bhutanese 3 or more Vehicles in Household
22.2%
3+ VEHICLES AVAILABLE
99.9/ 100
METRIC RATING
61st/ 347
METRIC RANK
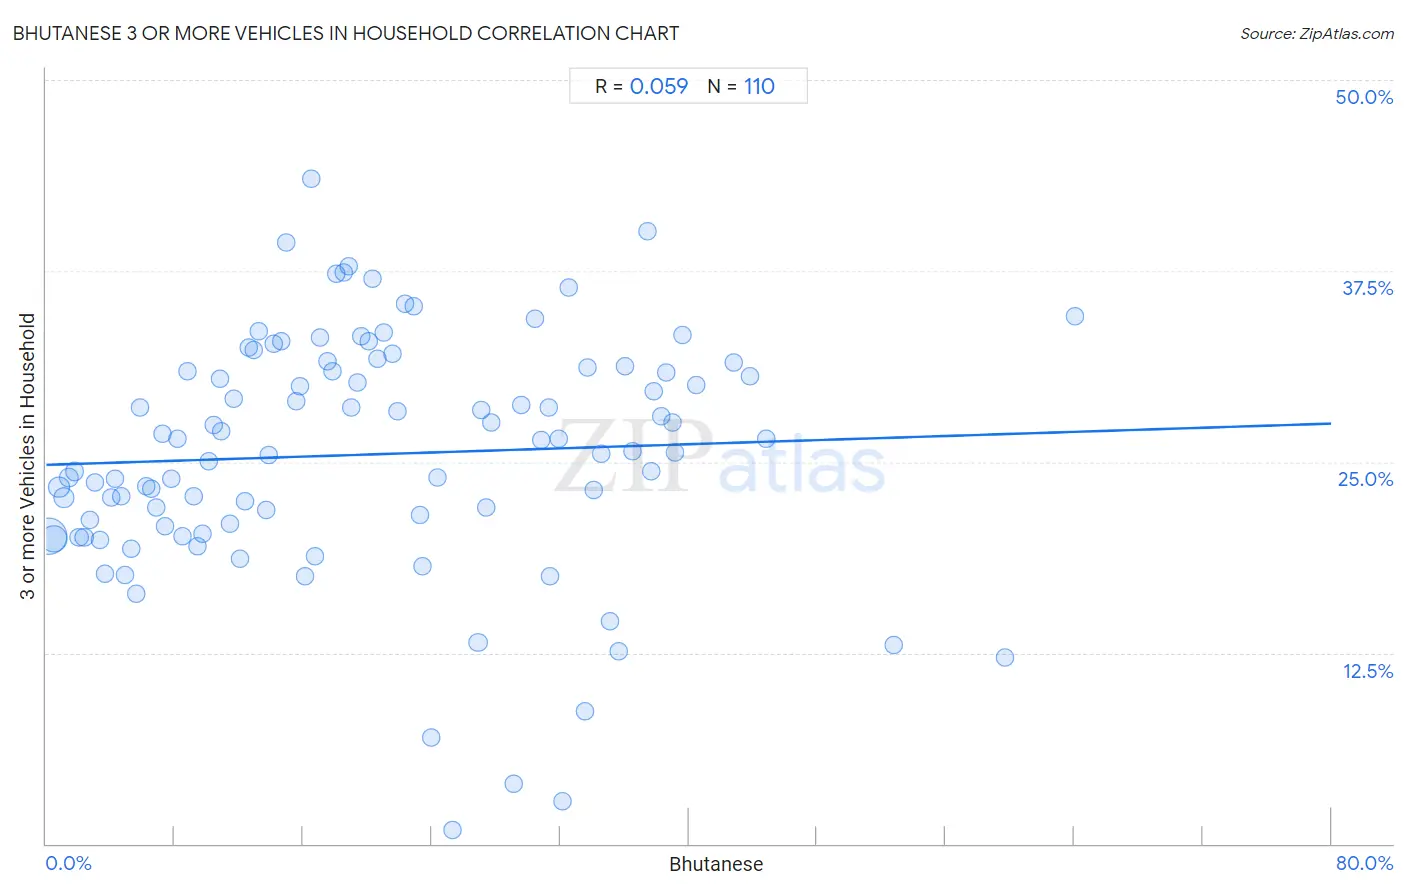
Bhutanese 3 or more Vehicles in Household Correlation Chart
The statistical analysis conducted on geographies consisting of 454,966,452 people shows a slight positive correlation between the proportion of Bhutanese and percentage of households with 3 or more vehicles available in the United States with a correlation coefficient (R) of 0.059 and weighted average of 22.2%. On average, for every 1% (one percent) increase in Bhutanese within a typical geography, there is an increase of 0.034% in percentage of households with 3 or more vehicles available.
It is essential to understand that the correlation between the percentage of Bhutanese and percentage of households with 3 or more vehicles available does not imply a direct cause-and-effect relationship. It remains uncertain whether the presence of Bhutanese influences an upward or downward trend in the level of percentage of households with 3 or more vehicles available within an area, or if Bhutanese simply ended up residing in those areas with higher or lower levels of percentage of households with 3 or more vehicles available due to other factors.
Demographics Similar to Bhutanese by 3 or more Vehicles in Household
In terms of 3 or more vehicles in household, the demographic groups most similar to Bhutanese are Fijian (22.2%, a difference of 0.040%), Finnish (22.3%, a difference of 0.16%), Chickasaw (22.2%, a difference of 0.20%), Navajo (22.3%, a difference of 0.24%), and Spaniard (22.3%, a difference of 0.30%).
| Demographics | Rating | Rank | 3 or more Vehicles in Household |
| Crow | 100.0 /100 | #54 | Exceptional 22.5% |
| Immigrants from Laos | 100.0 /100 | #55 | Exceptional 22.4% |
| Hispanics or Latinos | 100.0 /100 | #56 | Exceptional 22.4% |
| Pennsylvania Germans | 100.0 /100 | #57 | Exceptional 22.3% |
| Spaniards | 100.0 /100 | #58 | Exceptional 22.3% |
| Navajo | 100.0 /100 | #59 | Exceptional 22.3% |
| Finns | 99.9 /100 | #60 | Exceptional 22.3% |
| Bhutanese | 99.9 /100 | #61 | Exceptional 22.2% |
| Fijians | 99.9 /100 | #62 | Exceptional 22.2% |
| Chickasaw | 99.9 /100 | #63 | Exceptional 22.2% |
| Immigrants from Taiwan | 99.9 /100 | #64 | Exceptional 22.1% |
| Pima | 99.9 /100 | #65 | Exceptional 22.0% |
| Northern Europeans | 99.9 /100 | #66 | Exceptional 22.0% |
| Alaskan Athabascans | 99.9 /100 | #67 | Exceptional 21.9% |
| British | 99.9 /100 | #68 | Exceptional 21.9% |
Bhutanese 3 or more Vehicles in Household Correlation Summary
| Measurement | Bhutanese Data | 3 or more Vehicles in Household Data |
| Minimum | 0.15% | 0.93% |
| Maximum | 64.0% | 43.5% |
| Range | 63.9% | 42.6% |
| Mean | 20.1% | 25.5% |
| Median | 18.0% | 26.1% |
| Interquartile 25% (IQ1) | 8.8% | 20.7% |
| Interquartile 75% (IQ3) | 31.3% | 31.2% |
| Interquartile Range (IQR) | 22.5% | 10.4% |
| Standard Deviation (Sample) | 13.9% | 7.9% |
| Standard Deviation (Population) | 13.8% | 7.9% |
Correlation Details
| Bhutanese Percentile | Sample Size | 3 or more Vehicles in Household |
[ 0.0% - 0.5% ] 0.15% | 234,300,497 | 20.1% |
[ 0.0% - 0.5% ] 0.45% | 107,518,406 | 20.0% |
[ 0.5% - 1.0% ] 0.79% | 39,837,584 | 23.3% |
[ 1.0% - 1.5% ] 1.11% | 26,441,089 | 22.6% |
[ 1.0% - 1.5% ] 1.42% | 13,507,603 | 24.0% |
[ 1.5% - 2.0% ] 1.75% | 10,866,362 | 24.4% |
[ 2.0% - 2.5% ] 2.06% | 6,208,531 | 20.1% |
[ 2.0% - 2.5% ] 2.36% | 4,692,939 | 20.0% |
[ 2.5% - 3.0% ] 2.73% | 2,635,870 | 21.2% |
[ 3.0% - 3.5% ] 3.03% | 1,537,199 | 23.6% |
[ 3.0% - 3.5% ] 3.34% | 1,240,589 | 19.9% |
[ 3.5% - 4.0% ] 3.64% | 906,384 | 17.7% |
[ 4.0% - 4.5% ] 4.03% | 111,006 | 22.7% |
[ 4.0% - 4.5% ] 4.31% | 625,863 | 23.9% |
[ 4.5% - 5.0% ] 4.67% | 168,794 | 22.8% |
[ 4.5% - 5.0% ] 4.93% | 286,605 | 17.6% |
[ 5.0% - 5.5% ] 5.25% | 157,076 | 19.3% |
[ 5.5% - 6.0% ] 5.59% | 167,925 | 16.4% |
[ 5.5% - 6.0% ] 5.87% | 36,963 | 28.5% |
[ 6.0% - 6.5% ] 6.26% | 98,962 | 23.4% |
[ 6.5% - 7.0% ] 6.55% | 105,207 | 23.3% |
[ 6.5% - 7.0% ] 6.86% | 34,733 | 22.0% |
[ 7.0% - 7.5% ] 7.27% | 55,590 | 26.9% |
[ 7.0% - 7.5% ] 7.43% | 66,817 | 20.7% |
[ 7.5% - 8.0% ] 7.78% | 36,822 | 23.9% |
[ 8.0% - 8.5% ] 8.19% | 39,291 | 26.5% |
[ 8.5% - 9.0% ] 8.51% | 78,858 | 20.1% |
[ 8.5% - 9.0% ] 8.78% | 22,696 | 30.9% |
[ 9.0% - 9.5% ] 9.21% | 150,188 | 22.7% |
[ 9.0% - 9.5% ] 9.40% | 58,328 | 19.4% |
[ 9.5% - 10.0% ] 9.69% | 50,021 | 20.3% |
[ 10.0% - 10.5% ] 10.15% | 36,641 | 25.1% |
[ 10.0% - 10.5% ] 10.41% | 101,164 | 27.4% |
[ 10.5% - 11.0% ] 10.80% | 109,561 | 30.5% |
[ 10.5% - 11.0% ] 10.91% | 3,345 | 27.0% |
[ 11.0% - 11.5% ] 11.40% | 51,425 | 21.0% |
[ 11.5% - 12.0% ] 11.64% | 29,059 | 29.1% |
[ 12.0% - 12.5% ] 12.08% | 44,828 | 18.7% |
[ 12.0% - 12.5% ] 12.35% | 69,323 | 22.4% |
[ 12.5% - 13.0% ] 12.62% | 63,452 | 32.5% |
[ 12.5% - 13.0% ] 12.90% | 22,560 | 32.3% |
[ 13.0% - 13.5% ] 13.19% | 9,534 | 33.5% |
[ 13.5% - 14.0% ] 13.72% | 172,262 | 21.8% |
[ 13.5% - 14.0% ] 13.83% | 1,555 | 25.4% |
[ 14.0% - 14.5% ] 14.13% | 73,593 | 32.8% |
[ 14.5% - 15.0% ] 14.62% | 21,492 | 32.9% |
[ 14.5% - 15.0% ] 14.98% | 14,299 | 39.4% |
[ 15.5% - 16.0% ] 15.55% | 30,266 | 29.0% |
[ 15.5% - 16.0% ] 15.78% | 12,885 | 30.0% |
[ 16.0% - 16.5% ] 16.12% | 78,014 | 17.5% |
[ 16.0% - 16.5% ] 16.47% | 16,263 | 43.5% |
[ 16.5% - 17.0% ] 16.75% | 3,386 | 18.8% |
[ 17.0% - 17.5% ] 17.05% | 49,187 | 33.2% |
[ 17.0% - 17.5% ] 17.49% | 142,903 | 31.6% |
[ 17.5% - 18.0% ] 17.86% | 52,772 | 31.0% |
[ 18.0% - 18.5% ] 18.05% | 5,817 | 37.3% |
[ 18.5% - 19.0% ] 18.51% | 16,703 | 37.4% |
[ 18.5% - 19.0% ] 18.82% | 7,498 | 37.8% |
[ 19.0% - 19.5% ] 19.02% | 105,792 | 28.5% |
[ 19.0% - 19.5% ] 19.37% | 28,551 | 30.2% |
[ 19.5% - 20.0% ] 19.63% | 36,642 | 33.2% |
[ 20.0% - 20.5% ] 20.07% | 58,985 | 32.9% |
[ 20.0% - 20.5% ] 20.31% | 11,522 | 37.0% |
[ 20.5% - 21.0% ] 20.64% | 30,022 | 31.7% |
[ 20.5% - 21.0% ] 21.00% | 25,000 | 33.5% |
[ 21.5% - 22.0% ] 21.53% | 17,604 | 32.1% |
[ 21.5% - 22.0% ] 21.84% | 38,891 | 28.3% |
[ 22.0% - 22.5% ] 22.30% | 20,473 | 35.4% |
[ 22.5% - 23.0% ] 22.85% | 15,911 | 35.2% |
[ 23.0% - 23.5% ] 23.29% | 365 | 21.5% |
[ 23.0% - 23.5% ] 23.44% | 62,481 | 18.1% |
[ 23.5% - 24.0% ] 23.94% | 32,036 | 7.0% |
[ 24.0% - 24.5% ] 24.39% | 21,592 | 23.9% |
[ 25.0% - 25.5% ] 25.26% | 289 | 0.93% |
[ 26.5% - 27.0% ] 26.89% | 348,547 | 13.1% |
[ 27.0% - 27.5% ] 27.06% | 6,246 | 28.4% |
[ 27.0% - 27.5% ] 27.40% | 24,520 | 22.0% |
[ 27.5% - 28.0% ] 27.69% | 2,438 | 27.6% |
[ 29.0% - 29.5% ] 29.12% | 30,068 | 3.9% |
[ 29.5% - 30.0% ] 29.60% | 8,649 | 28.7% |
[ 30.0% - 30.5% ] 30.46% | 2,896 | 34.4% |
[ 30.5% - 31.0% ] 30.85% | 50,453 | 26.5% |
[ 31.0% - 31.5% ] 31.28% | 227 | 28.6% |
[ 31.0% - 31.5% ] 31.40% | 981 | 17.5% |
[ 31.5% - 32.0% ] 31.87% | 47,627 | 26.5% |
[ 32.0% - 32.5% ] 32.13% | 22,723 | 2.8% |
[ 32.5% - 33.0% ] 32.52% | 3,887 | 36.4% |
[ 33.5% - 34.0% ] 33.55% | 25,957 | 8.7% |
[ 33.5% - 34.0% ] 33.73% | 2,188 | 31.2% |
[ 34.0% - 34.5% ] 34.12% | 25,771 | 23.1% |
[ 34.5% - 35.0% ] 34.53% | 55,402 | 25.5% |
[ 35.0% - 35.5% ] 35.08% | 13,932 | 14.5% |
[ 35.5% - 36.0% ] 35.67% | 45,038 | 12.6% |
[ 36.0% - 36.5% ] 36.04% | 55,888 | 31.3% |
[ 36.0% - 36.5% ] 36.47% | 34,001 | 25.7% |
[ 37.0% - 37.5% ] 37.43% | 9,571 | 40.1% |
[ 37.5% - 38.0% ] 37.65% | 50,976 | 24.4% |
[ 37.5% - 38.0% ] 37.83% | 3,902 | 29.6% |
[ 38.0% - 38.5% ] 38.32% | 51,598 | 28.0% |
[ 38.5% - 39.0% ] 38.62% | 35,493 | 30.8% |
[ 38.5% - 39.0% ] 38.98% | 49,491 | 27.5% |
[ 39.0% - 39.5% ] 39.14% | 41,748 | 25.6% |
[ 39.5% - 40.0% ] 39.65% | 29,490 | 33.3% |
[ 40.0% - 40.5% ] 40.46% | 54,362 | 30.0% |
[ 42.5% - 43.0% ] 42.78% | 18,802 | 31.5% |
[ 43.5% - 44.0% ] 43.79% | 733 | 30.6% |
[ 44.5% - 45.0% ] 44.83% | 21,546 | 26.5% |
[ 52.5% - 53.0% ] 52.78% | 144 | 13.0% |
[ 59.5% - 60.0% ] 59.68% | 124 | 12.2% |
[ 64.0% - 64.5% ] 64.04% | 292 | 34.5% |