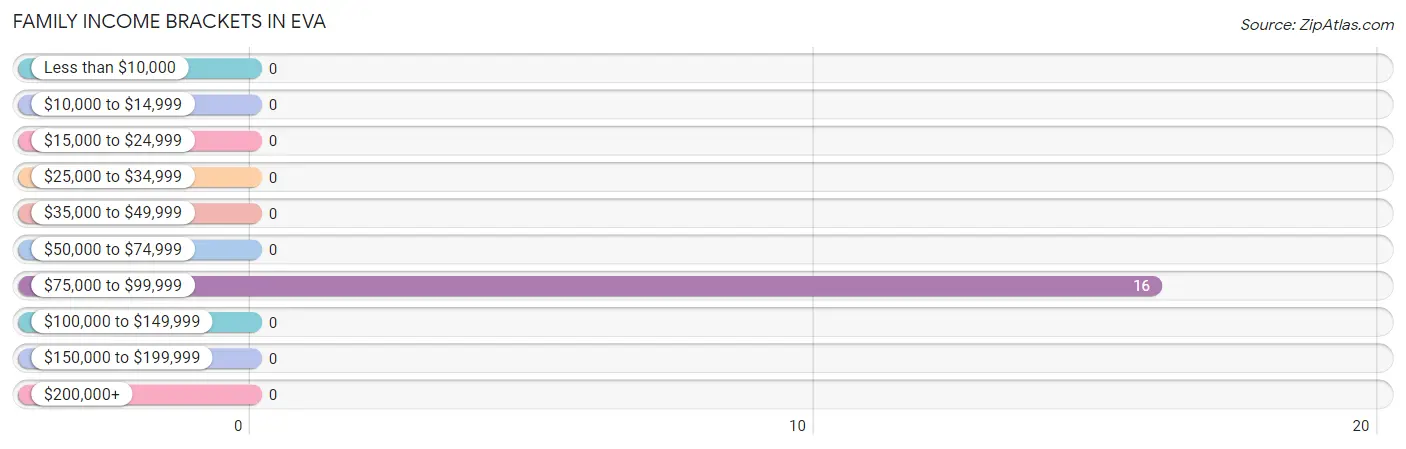
According to the Eva family income data, there are 16 families falling into the $75,000 to $99,999 income range, which is the most common income bracket and makes up 100.0% of all families.
Income Bracket
# Families
% Families
Less than $10,000
0
0.0%
$10,000 to $14,999
0
0.0%
$15,000 to $24,999
0
0.0%
$25,000 to $34,999
0
0.0%
$35,000 to $49,999
0
0.0%
$50,000 to $74,999
0
0.0%
$75,000 to $99,999
16
100.0%
$100,000 to $149,999
0
0.0%
$150,000 to $199,999
0
0.0%
$200,000+
0
0.0%
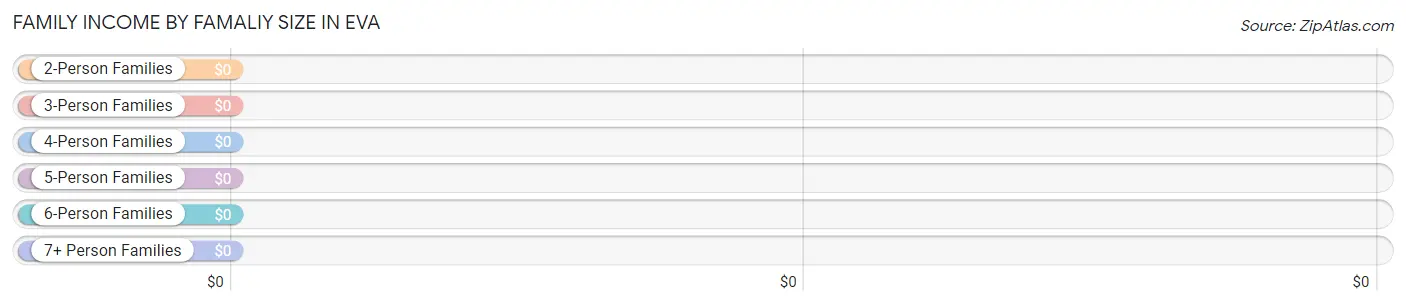
Family Income by Famaliy Size in Eva
Income Bracket
# Families
Median Income
2-Person Families
16 (100.0%)
$0
3-Person Families
0 (0.0%)
$0
4-Person Families
0 (0.0%)
$0
5-Person Families
0 (0.0%)
$0
6-Person Families
0 (0.0%)
$0
7+ Person Families
0 (0.0%)
$0
Total
16 (100.0%)
$0
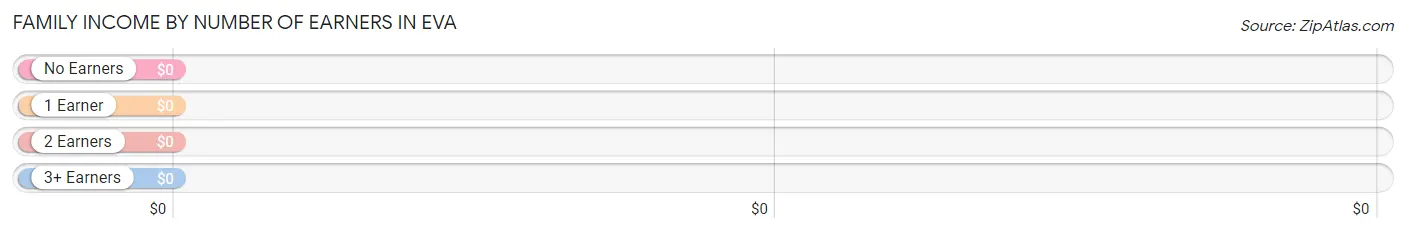
Family Income by Number of Earners in Eva
Number of Earners
# Families
Median Income
No Earners
16 (100.0%)
$0
1 Earner
0 (0.0%)
$0
2 Earners
0 (0.0%)
$0
3+ Earners
0 (0.0%)
$0
Total
16 (100.0%)
$0
Household Income in Eva
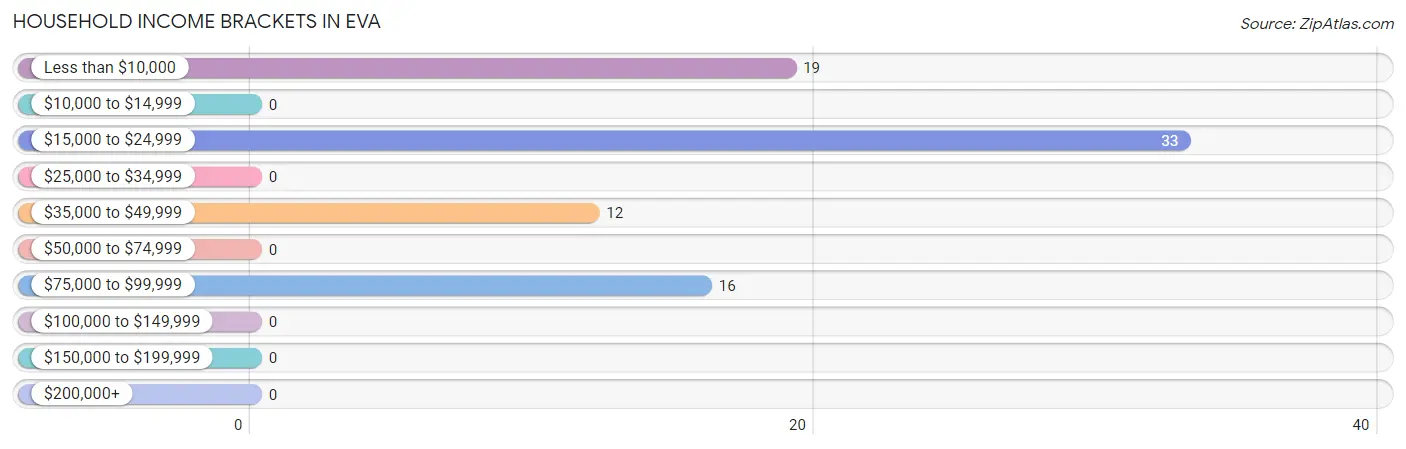
Household Income Brackets in Eva
With 33 households falling in the category, the $15,000 to $24,999 income range is the most frequent in Eva, accounting for 41.2% of all households.
Income Bracket
# Households
% Households
Less than $10,000
19
23.8%
$10,000 to $14,999
0
0.0%
$15,000 to $24,999
33
41.3%
$25,000 to $34,999
0
0.0%
$35,000 to $49,999
12
15.0%
$50,000 to $74,999
0
0.0%
$75,000 to $99,999
16
20.0%
$100,000 to $149,999
0
0.0%
$150,000 to $199,999
0
0.0%
$200,000+
0
0.0%
Household Income by Householder Age in Eva
Income Bracket
# Households
Median Income
15 to 24 Years
0 (0.0%)
$0
25 to 44 Years
0 (0.0%)
$0
45 to 64 Years
7 (8.7%)
$0
65+ Years
73 (91.2%)
$0
Total
80 (100.0%)
$0
Poverty in Eva
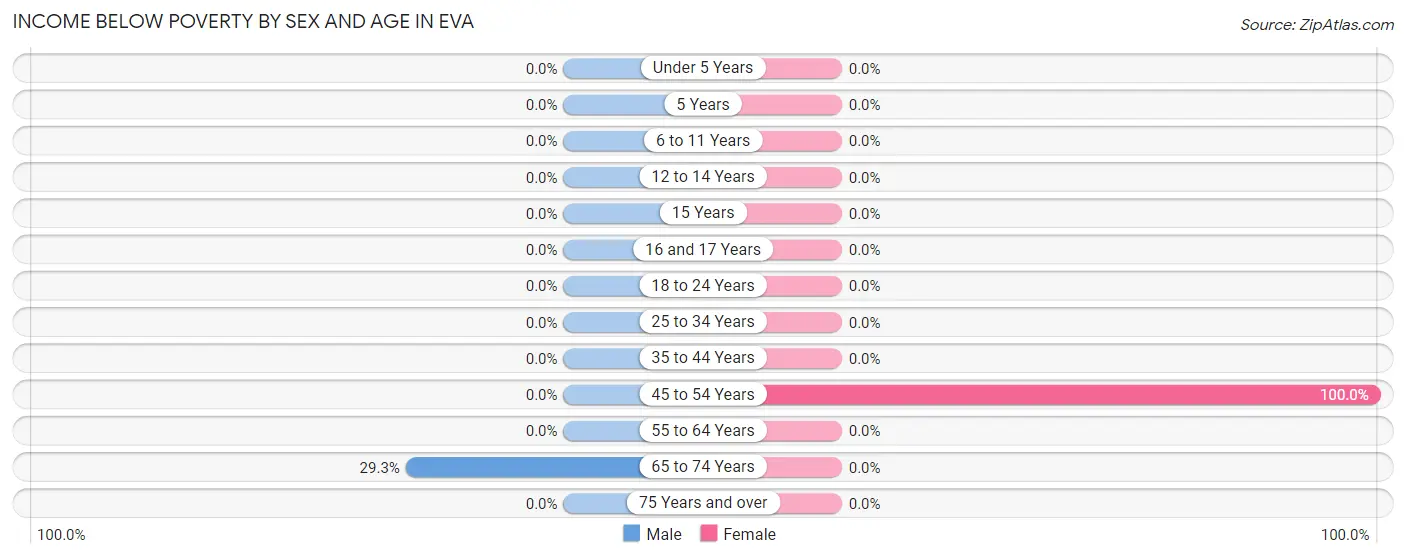
Income Below Poverty by Sex and Age in Eva
With 29.3% poverty level for males and 12.5% for females among the residents of Eva, 65 to 74 year old males and 45 to 54 year old females are the most vulnerable to poverty, with 12 males (29.3%) and 7 females (100.0%) in their respective age groups living below the poverty level.
Age Bracket
Male
Female
Under 5 Years
0 (0.0%)
0 (0.0%)
5 Years
0 (0.0%)
0 (0.0%)
6 to 11 Years
0 (0.0%)
0 (0.0%)
12 to 14 Years
0 (0.0%)
0 (0.0%)
15 Years
0 (0.0%)
0 (0.0%)
16 and 17 Years
0 (0.0%)
0 (0.0%)
18 to 24 Years
0 (0.0%)
0 (0.0%)
25 to 34 Years
0 (0.0%)
0 (0.0%)
35 to 44 Years
0 (0.0%)
0 (0.0%)
45 to 54 Years
0 (0.0%)
7 (100.0%)
55 to 64 Years
0 (0.0%)
0 (0.0%)
65 to 74 Years
12 (29.3%)
0 (0.0%)
75 Years and over
0 (0.0%)
0 (0.0%)
Total
12 (29.3%)
7 (12.5%)
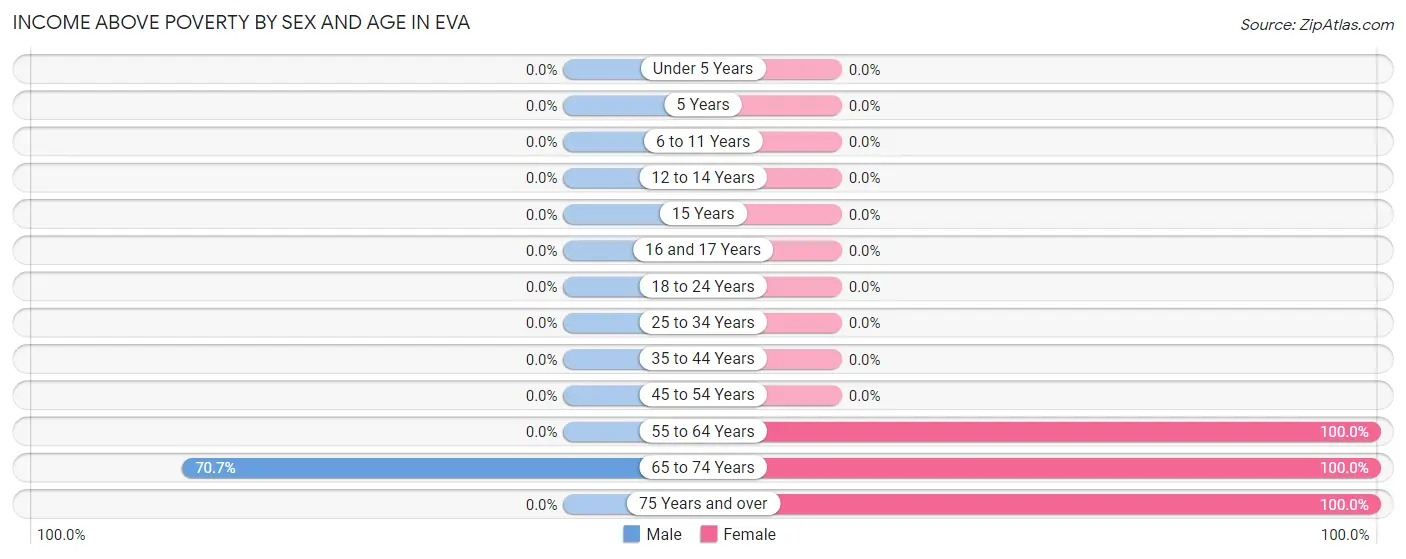
Income Above Poverty by Sex and Age in Eva
According to the poverty statistics in Eva, males aged 65 to 74 years and females aged 55 to 64 years are the age groups that are most secure financially, with 70.7% of males and 100.0% of females in these age groups living above the poverty line.
Age Bracket
Male
Female
Under 5 Years
0 (0.0%)
0 (0.0%)
5 Years
0 (0.0%)
0 (0.0%)
6 to 11 Years
0 (0.0%)
0 (0.0%)
12 to 14 Years
0 (0.0%)
0 (0.0%)
15 Years
0 (0.0%)
0 (0.0%)
16 and 17 Years
0 (0.0%)
0 (0.0%)
18 to 24 Years
0 (0.0%)
0 (0.0%)
25 to 34 Years
0 (0.0%)
0 (0.0%)
35 to 44 Years
0 (0.0%)
0 (0.0%)
45 to 54 Years
0 (0.0%)
0 (0.0%)
55 to 64 Years
0 (0.0%)
7 (100.0%)
65 to 74 Years
29 (70.7%)
18 (100.0%)
75 Years and over
0 (0.0%)
24 (100.0%)
Total
29 (70.7%)
49 (87.5%)
Income Below Poverty Among Married-Couple Families in Eva
Children
Above Poverty
Below Poverty
No Children
16 (100.0%)
0 (0.0%)
1 or 2 Children
0 (0.0%)
0 (0.0%)
3 or 4 Children
0 (0.0%)
0 (0.0%)
5 or more Children
0 (0.0%)
0 (0.0%)
Total
16 (100.0%)
0 (0.0%)
Income Below Poverty Among Single-Parent Households in Eva
Children
Single Father
Single Mother
No Children
0 (0.0%)
0 (0.0%)
1 or 2 Children
0 (0.0%)
0 (0.0%)
3 or 4 Children
0 (0.0%)
0 (0.0%)
5 or more Children
0 (0.0%)
0 (0.0%)
Total
0 (0.0%)
0 (0.0%)
Income Below Poverty Among Married-Couple vs Single-Parent Households in Eva
Children
Married-Couple Families
Single-Parent Households
No Children
0 (0.0%)
0 (0.0%)
1 or 2 Children
0 (0.0%)
0 (0.0%)
3 or 4 Children
0 (0.0%)
0 (0.0%)
5 or more Children
0 (0.0%)
0 (0.0%)
Total
0 (0.0%)
0 (0.0%)
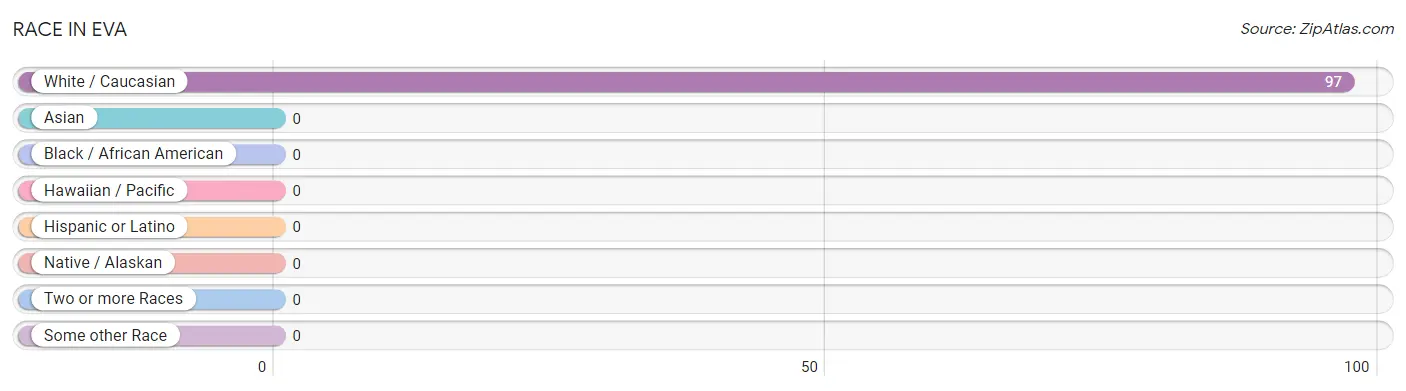
Race in Eva
The most populous races in Eva are , and White / Caucasian (97 | 100.0%).
Race
# Population
% Population
Asian
0
0.0%
Black / African American
0
0.0%
Hawaiian / Pacific
0
0.0%
Hispanic or Latino
0
0.0%
Native / Alaskan
0
0.0%
White / Caucasian
97
100.0%
Two or more Races
0
0.0%
Some other Race
0
0.0%
Total
97
100.0%
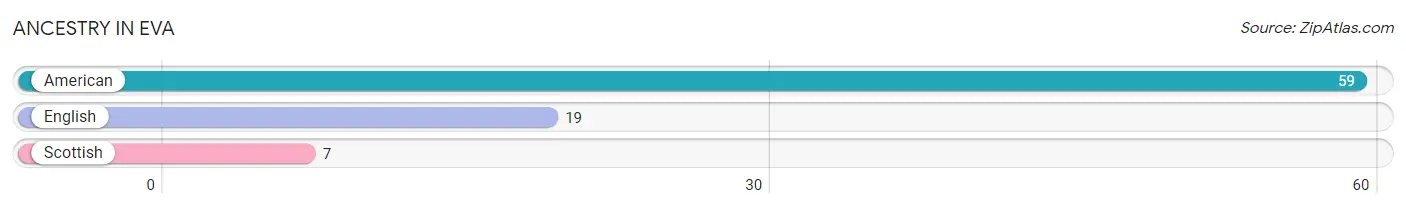
Ancestry in Eva
The most populous ancestries reported in Eva are American (59 | 60.8%), English (19 | 19.6%), and Scottish (7 | 7.2%), together accounting for 87.6% of all Eva residents.
Ancestry
# Population
% Population
American
59
60.8%
English
19
19.6%
Scottish
7
7.2%
View All 3 Rows
Immigrants in Eva
Immigration Origin
# Population
% Population
View All 0 Rows
Sex and Age in Eva
Sex and Age in Eva
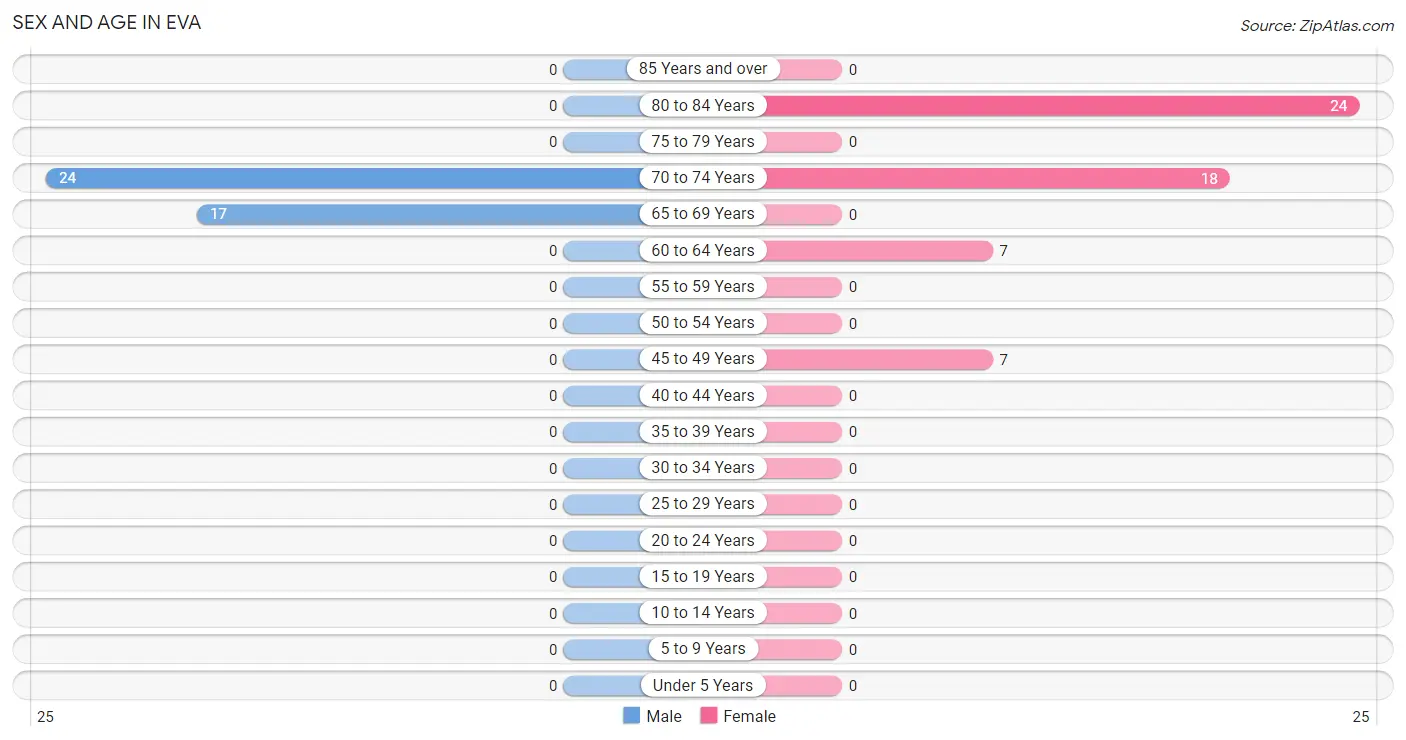
The most populous age groups in Eva are 70 to 74 Years (24 | 58.5%) for men and 80 to 84 Years (24 | 42.9%) for women.
Age Bracket
Male
Female
Under 5 Years
0 (0.0%)
0 (0.0%)
5 to 9 Years
0 (0.0%)
0 (0.0%)
10 to 14 Years
0 (0.0%)
0 (0.0%)
15 to 19 Years
0 (0.0%)
0 (0.0%)
20 to 24 Years
0 (0.0%)
0 (0.0%)
25 to 29 Years
0 (0.0%)
0 (0.0%)
30 to 34 Years
0 (0.0%)
0 (0.0%)
35 to 39 Years
0 (0.0%)
0 (0.0%)
40 to 44 Years
0 (0.0%)
0 (0.0%)
45 to 49 Years
0 (0.0%)
7 (12.5%)
50 to 54 Years
0 (0.0%)
0 (0.0%)
55 to 59 Years
0 (0.0%)
0 (0.0%)
60 to 64 Years
0 (0.0%)
7 (12.5%)
65 to 69 Years
17 (41.5%)
0 (0.0%)
70 to 74 Years
24 (58.5%)
18 (32.1%)
75 to 79 Years
0 (0.0%)
0 (0.0%)
80 to 84 Years
0 (0.0%)
24 (42.9%)
85 Years and over
0 (0.0%)
0 (0.0%)
Total
41 (100.0%)
56 (100.0%)
Families and Households in Eva
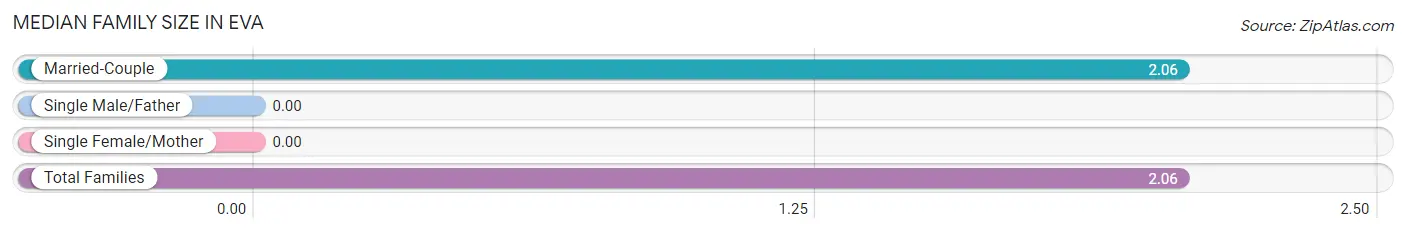
Median Family Size in Eva
Family Type
# Families
Family Size
Married-Couple
16 (100.0%)
2.06
Single Male/Father
0 (0.0%)
-
Single Female/Mother
0 (0.0%)
-
Total Families
16 (100.0%)
2.06
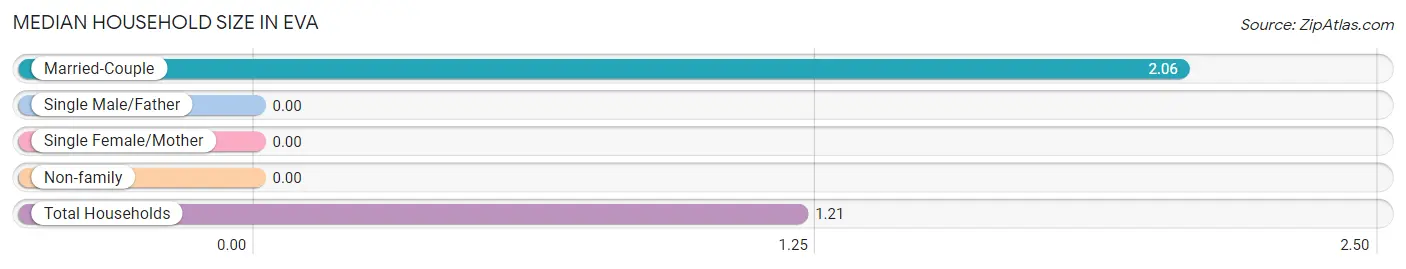
Median Household Size in Eva
Household Type
# Households
Household Size
Married-Couple
16 (20.0%)
2.06
Single Male/Father
0 (0.0%)
-
Single Female/Mother
0 (0.0%)
-
Non-family
64 (80.0%)
-
Total Households
80 (100.0%)
1.21
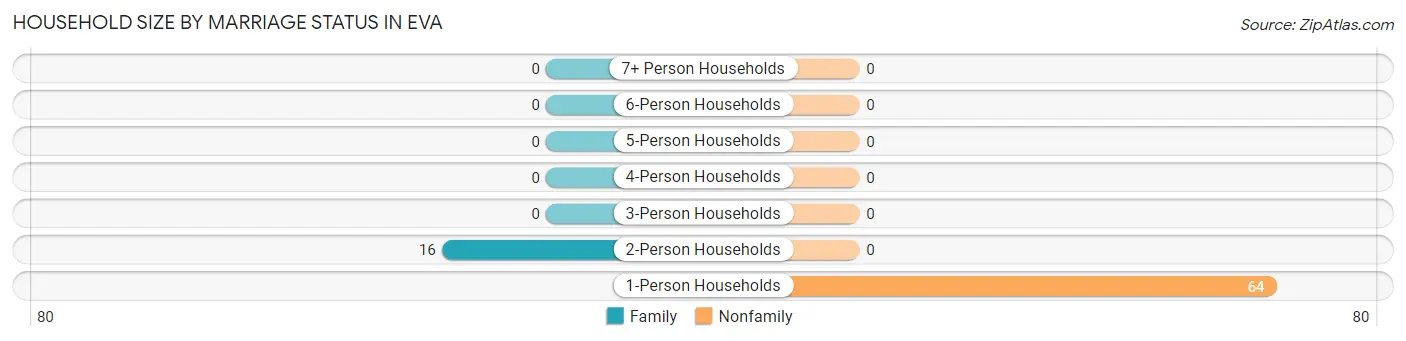
Household Size by Marriage Status in Eva
Out of a total of 80 households in Eva, 16 (20.0%) are family households, while 64 (80.0%) are nonfamily households. The most numerous type of family households are 2-person households, comprising 16, and the most common type of nonfamily households are 1-person households, comprising 64.
Household Size
Family Households
Nonfamily Households
1-Person Households
-
64 (80.0%)
2-Person Households
16 (20.0%)
0 (0.0%)
3-Person Households
0 (0.0%)
0 (0.0%)
4-Person Households
0 (0.0%)
0 (0.0%)
5-Person Households
0 (0.0%)
0 (0.0%)
6-Person Households
0 (0.0%)
0 (0.0%)
7+ Person Households
0 (0.0%)
0 (0.0%)
Total
16 (20.0%)
64 (80.0%)
Female Fertility in Eva
Fertility by Age in Eva
Age Bracket
Women with Births
Births / 1,000 Women
15 to 19 years
0 (0.0%)
0.0
20 to 34 years
0 (0.0%)
0.0
35 to 50 years
0 (0.0%)
0.0
Total
0 (0.0%)
0.0
Fertility by Age by Marriage Status in Eva
Age Bracket
Married
Unmarried
15 to 19 years
0 (0.0%)
0 (0.0%)
20 to 34 years
0 (0.0%)
0 (0.0%)
35 to 50 years
0 (0.0%)
0 (0.0%)
Total
0 (0.0%)
0 (0.0%)
Fertility by Education in Eva
Educational Attainment
Women with Births
Births / 1,000 Women
Less than High School
0 (0.0%)
0.0
High School Diploma
0 (0.0%)
0.0
College or Associate's Degree
0 (0.0%)
0.0
Bachelor's Degree
0 (0.0%)
0.0
Graduate Degree
0 (0.0%)
0.0
Total
0 (0.0%)
0.0
Fertility by Education by Marriage Status in Eva
Educational Attainment
Married
Unmarried
Less than High School
0 (0.0%)
0 (0.0%)
High School Diploma
0 (0.0%)
0 (0.0%)
College or Associate's Degree
0 (0.0%)
0 (0.0%)
Bachelor's Degree
0 (0.0%)
0 (0.0%)
Graduate Degree
0 (0.0%)
0 (0.0%)
Total
0 (0.0%)
0 (0.0%)
Employment Characteristics in Eva
Employment by Class of Employer in Eva
Employer Class
# Employees
% Employees
Private Company Employees
0
0.0%
Self-Employed (Incorporated)
0
0.0%
Self-Employed (Not Incorporated)
0
0.0%
Not-for-profit Organizations
0
0.0%
Local Government Employees
0
0.0%
State Government Employees
0
0.0%
Federal Government Employees
0
0.0%
Unpaid Family Workers
0
0.0%
Total
0
0.0%
Employment Status by Age in Eva
Age Bracket
In Labor Force
Unemployed
16 to 19 Years
0 (0.0%)
0 (0.0%)
20 to 24 Years
0 (0.0%)
0 (0.0%)
25 to 29 Years
0 (0.0%)
0 (0.0%)
30 to 34 Years
0 (0.0%)
0 (0.0%)
35 to 44 Years
0 (0.0%)
0 (0.0%)
45 to 54 Years
0 (0.0%)
0 (0.0%)
55 to 59 Years
0 (0.0%)
0 (0.0%)
60 to 64 Years
0 (0.0%)
0 (0.0%)
65 to 74 Years
0 (0.0%)
0 (0.0%)
75 Years and over
0 (0.0%)
0 (0.0%)
Total
0 (0.0%)
0 (0.0%)
Employment Status by Educational Attainment in Eva
Educational Attainment
In Labor Force
Unemployed
Less than High School
0 (0.0%)
0 (0.0%)
High School Diploma
0 (0.0%)
0 (0.0%)
College / Associate Degree
0 (0.0%)
0 (0.0%)
Bachelor's Degree or higher
0 (0.0%)
0 (0.0%)
Total
0 (0.0%)
0 (0.0%)
Employment Occupations by Sex in Eva
Management, Business, Science and Arts Occupations
Management, Business, Science and Arts Occupations by Sex
Occupation
Male
Female
Management
0 (0.0%)
0 (0.0%)
Business & Financial
0 (0.0%)
0 (0.0%)
Computers, Engineering & Science
0 (0.0%)
0 (0.0%)
Computers & Mathematics
0 (0.0%)
0 (0.0%)
Architecture & Engineering
0 (0.0%)
0 (0.0%)
Life, Physical & Social Science
0 (0.0%)
0 (0.0%)
Community & Social Service
0 (0.0%)
0 (0.0%)
Education, Arts & Media
0 (0.0%)
0 (0.0%)
Legal Services & Support
0 (0.0%)
0 (0.0%)
Education Instruction & Library
0 (0.0%)
0 (0.0%)
Arts, Media & Entertainment
0 (0.0%)
0 (0.0%)
Health Diagnosing & Treating
0 (0.0%)
0 (0.0%)
Health Technologists
0 (0.0%)
0 (0.0%)
Total (Category)
0 (0.0%)
0 (0.0%)
Total (Overall)
0 (0.0%)
0 (0.0%)
Services Occupations
Services Occupations by Sex
Occupation
Male
Female
Healthcare Support
0 (0.0%)
0 (0.0%)
Security & Protection
0 (0.0%)
0 (0.0%)
Firefighting & Prevention
0 (0.0%)
0 (0.0%)
Law Enforcement
0 (0.0%)
0 (0.0%)
Food Preparation & Serving
0 (0.0%)
0 (0.0%)
Cleaning & Maintenance
0 (0.0%)
0 (0.0%)
Personal Care & Service
0 (0.0%)
0 (0.0%)
Total (Category)
0 (0.0%)
0 (0.0%)
Total (Overall)
0 (0.0%)
0 (0.0%)
Sales and Office Occupations
Sales and Office Occupations by Sex
Occupation
Male
Female
Sales & Related
0 (0.0%)
0 (0.0%)
Office & Administration
0 (0.0%)
0 (0.0%)
Total (Category)
0 (0.0%)
0 (0.0%)
Total (Overall)
0 (0.0%)
0 (0.0%)
Natural Resources, Construction and Maintenance Occupations
Natural Resources, Construction and Maintenance Occupations by Sex
Occupation
Male
Female
Farming, Fishing & Forestry
0 (0.0%)
0 (0.0%)
Construction & Extraction
0 (0.0%)
0 (0.0%)
Installation, Maintenance & Repair
0 (0.0%)
0 (0.0%)
Total (Category)
0 (0.0%)
0 (0.0%)
Total (Overall)
0 (0.0%)
0 (0.0%)
Production, Transportation and Moving Occupations
Production, Transportation and Moving Occupations by Sex
Occupation
Male
Female
Production
0 (0.0%)
0 (0.0%)
Transportation
0 (0.0%)
0 (0.0%)
Material Moving
0 (0.0%)
0 (0.0%)
Total (Category)
0 (0.0%)
0 (0.0%)
Total (Overall)
0 (0.0%)
0 (0.0%)
Employment Industries by Sex in Eva
Employment Industries in Eva
Employment Industries by Sex in Eva
Industry
Male
Female
Agriculture, Fishing & Hunting
0 (0.0%)
0 (0.0%)
Mining, Quarrying, & Extraction
0 (0.0%)
0 (0.0%)
Construction
0 (0.0%)
0 (0.0%)
Manufacturing
0 (0.0%)
0 (0.0%)
Wholesale Trade
0 (0.0%)
0 (0.0%)
Retail Trade
0 (0.0%)
0 (0.0%)
Transportation & Warehousing
0 (0.0%)
0 (0.0%)
Utilities
0 (0.0%)
0 (0.0%)
Information
0 (0.0%)
0 (0.0%)
Finance & Insurance
0 (0.0%)
0 (0.0%)
Real Estate, Rental & Leasing
0 (0.0%)
0 (0.0%)
Professional & Scientific
0 (0.0%)
0 (0.0%)
Enterprise Management
0 (0.0%)
0 (0.0%)
Administrative & Support
0 (0.0%)
0 (0.0%)
Educational Services
0 (0.0%)
0 (0.0%)
Health Care & Social Assistance
0 (0.0%)
0 (0.0%)
Arts, Entertainment & Recreation
0 (0.0%)
0 (0.0%)
Accommodation & Food Services
0 (0.0%)
0 (0.0%)
Public Administration
0 (0.0%)
0 (0.0%)
Total
0 (0.0%)
0 (0.0%)
Education in Eva
School Enrollment in Eva
School Level
# Students
% Students
Nursery / Preschool
0
0.0%
Kindergarten
0
0.0%
Elementary School
0
0.0%
Middle School
0
0.0%
High School
0
0.0%
College / Undergraduate
0
0.0%
Graduate / Professional
0
0.0%
Total
0
0.0%
School Enrollment by Age by Funding Source in Eva
Age Bracket
Public School
Private School
3 to 4 Year Olds
0 (0.0%)
0 (0.0%)
5 to 9 Year Old
0 (0.0%)
0 (0.0%)
10 to 14 Year Olds
0 (0.0%)
0 (0.0%)
15 to 17 Year Olds
0 (0.0%)
0 (0.0%)
18 to 19 Year Olds
0 (0.0%)
0 (0.0%)
20 to 24 Year Olds
0 (0.0%)
0 (0.0%)
25 to 34 Year Olds
0 (0.0%)
0 (0.0%)
35 Years and over
0 (0.0%)
0 (0.0%)
Total
0 (0.0%)
0 (0.0%)
Educational Attainment by Field of Study in Eva
Field of Study
# Graduates
% Graduates
Computers & Mathematics
0
0.0%
Bio, Nature & Agricultural
0
0.0%
Physical & Health Sciences
0
0.0%
Psychology
0
0.0%
Social Sciences
0
0.0%
Engineering
0
0.0%
Multidisciplinary Studies
0
0.0%
Science & Technology
0
0.0%
Business
0
0.0%
Education
0
0.0%
Literature & Languages
0
0.0%
Liberal Arts & History
0
0.0%
Visual & Performing Arts
0
0.0%
Communications
0
0.0%
Arts & Humanities
0
0.0%
Total
0
0.0%
Transportation & Commute in Eva
Vehicle Availability by Sex in Eva
Vehicles Available
Male
Female
No Vehicle
0 (0.0%)
0 (0.0%)
1 Vehicle
0 (0.0%)
0 (0.0%)
2 Vehicles
0 (0.0%)
0 (0.0%)
3 Vehicles
0 (0.0%)
0 (0.0%)
4 Vehicles
0 (0.0%)
0 (0.0%)
5 or more Vehicles
0 (0.0%)
0 (0.0%)
Total
0 (0.0%)
0 (0.0%)
Commute Time in Eva
Commute Time
# Commuters
% Commuters
Less than 5 Minutes
0
0.0%
5 to 9 Minutes
0
0.0%
10 to 14 Minutes
0
0.0%
15 to 19 Minutes
0
0.0%
20 to 24 Minutes
0
0.0%
25 to 29 Minutes
0
0.0%
30 to 34 Minutes
0
0.0%
35 to 39 Minutes
0
0.0%
40 to 44 Minutes
0
0.0%
45 to 59 Minutes
0
0.0%
60 to 89 Minutes
0
0.0%
90 or more Minutes
0
0.0%
Commute Time by Sex in Eva
Commute Time
Male
Female
Less than 5 Minutes
0 (0.0%)
0 (0.0%)
5 to 9 Minutes
0 (0.0%)
0 (0.0%)
10 to 14 Minutes
0 (0.0%)
0 (0.0%)
15 to 19 Minutes
0 (0.0%)
0 (0.0%)
20 to 24 Minutes
0 (0.0%)
0 (0.0%)
25 to 29 Minutes
0 (0.0%)
0 (0.0%)
30 to 34 Minutes
0 (0.0%)
0 (0.0%)
35 to 39 Minutes
0 (0.0%)
0 (0.0%)
40 to 44 Minutes
0 (0.0%)
0 (0.0%)
45 to 59 Minutes
0 (0.0%)
0 (0.0%)
60 to 89 Minutes
0 (0.0%)
0 (0.0%)
90 or more Minutes
0 (0.0%)
0 (0.0%)
Time of Departure to Work by Sex in Eva
Time of Departure
Male
Female
12:00 AM to 4:59 AM
0 (0.0%)
0 (0.0%)
5:00 AM to 5:29 AM
0 (0.0%)
0 (0.0%)
5:30 AM to 5:59 AM
0 (0.0%)
0 (0.0%)
6:00 AM to 6:29 AM
0 (0.0%)
0 (0.0%)
6:30 AM to 6:59 AM
0 (0.0%)
0 (0.0%)
7:00 AM to 7:29 AM
0 (0.0%)
0 (0.0%)
7:30 AM to 7:59 AM
0 (0.0%)
0 (0.0%)
8:00 AM to 8:29 AM
0 (0.0%)
0 (0.0%)
8:30 AM to 8:59 AM
0 (0.0%)
0 (0.0%)
9:00 AM to 9:59 AM
0 (0.0%)
0 (0.0%)
10:00 AM to 10:59 AM
0 (0.0%)
0 (0.0%)
11:00 AM to 11:59 AM
0 (0.0%)
0 (0.0%)
12:00 PM to 3:59 PM
0 (0.0%)
0 (0.0%)
4:00 PM to 11:59 PM
0 (0.0%)
0 (0.0%)
Total
0 (0.0%)
0 (0.0%)
Housing Occupancy in Eva
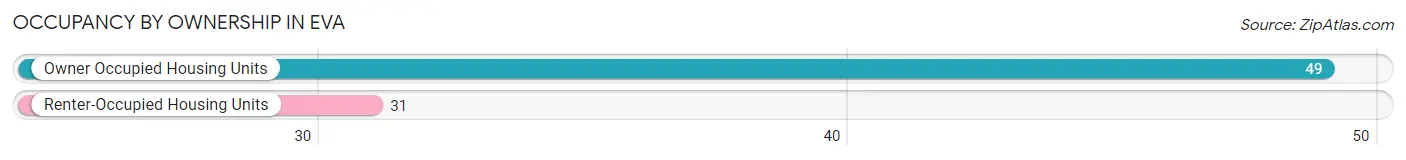
Occupancy by Ownership in Eva
Of the total 80 dwellings in Eva, owner-occupied units account for 49 (61.3%), while renter-occupied units make up 31 (38.8%).
Occupancy
# Housing Units
% Housing Units
Owner Occupied Housing Units
49
61.3%
Renter-Occupied Housing Units
31
38.8%
Total Occupied Housing Units
80
100.0%
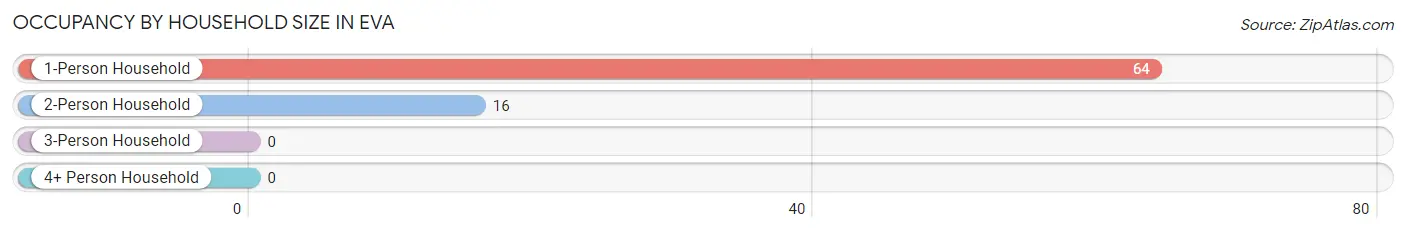
Occupancy by Household Size in Eva
Household Size
# Housing Units
% Housing Units
1-Person Household
64
80.0%
2-Person Household
16
20.0%
3-Person Household
0
0.0%
4+ Person Household
0
0.0%
Total Housing Units
80
100.0%
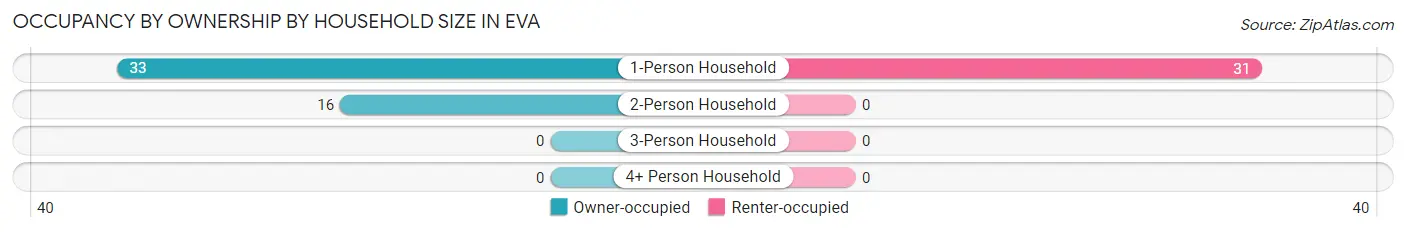
Occupancy by Ownership by Household Size in Eva
Household Size
Owner-occupied
Renter-occupied
1-Person Household
33 (51.6%)
31 (48.4%)
2-Person Household
16 (100.0%)
0 (0.0%)
3-Person Household
0 (0.0%)
0 (0.0%)
4+ Person Household
0 (0.0%)
0 (0.0%)
Total Housing Units
49 (61.3%)
31 (38.8%)
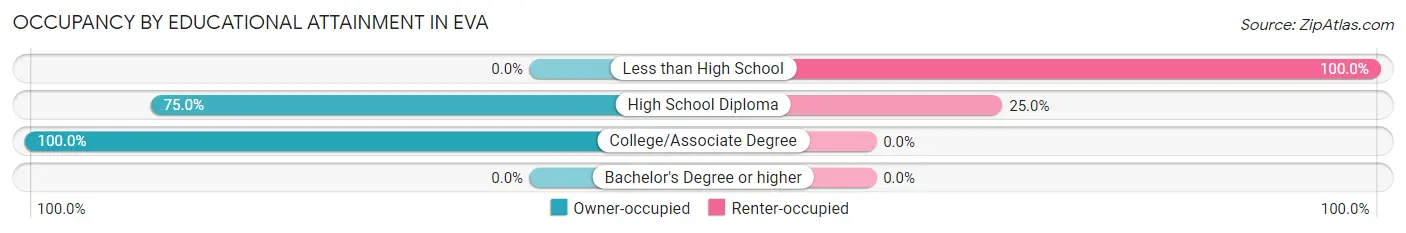
Occupancy by Educational Attainment in Eva
Household Size
Owner-occupied
Renter-occupied
Less than High School
0 (0.0%)
24 (100.0%)
High School Diploma
21 (75.0%)
7 (25.0%)
College/Associate Degree
28 (100.0%)
0 (0.0%)
Bachelor's Degree or higher
0 (0.0%)
0 (0.0%)
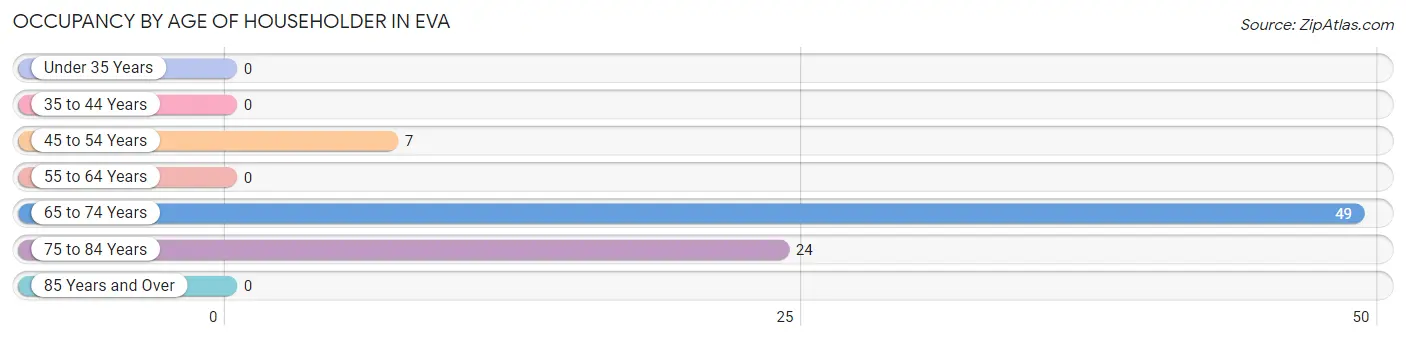
Occupancy by Age of Householder in Eva
Age Bracket
# Households
% Households
Under 35 Years
0
0.0%
35 to 44 Years
0
0.0%
45 to 54 Years
7
8.7%
55 to 64 Years
0
0.0%
65 to 74 Years
49
61.3%
75 to 84 Years
24
30.0%
85 Years and Over
0
0.0%
Total
80
100.0%
Housing Finances in Eva
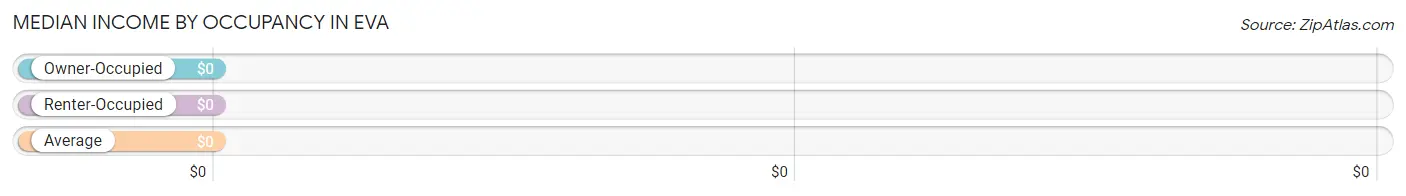
Median Income by Occupancy in Eva
Occupancy Type
# Households
Median Income
Owner-Occupied
49 (61.3%)
$0
Renter-Occupied
31 (38.8%)
$0
Average
80 (100.0%)
$0
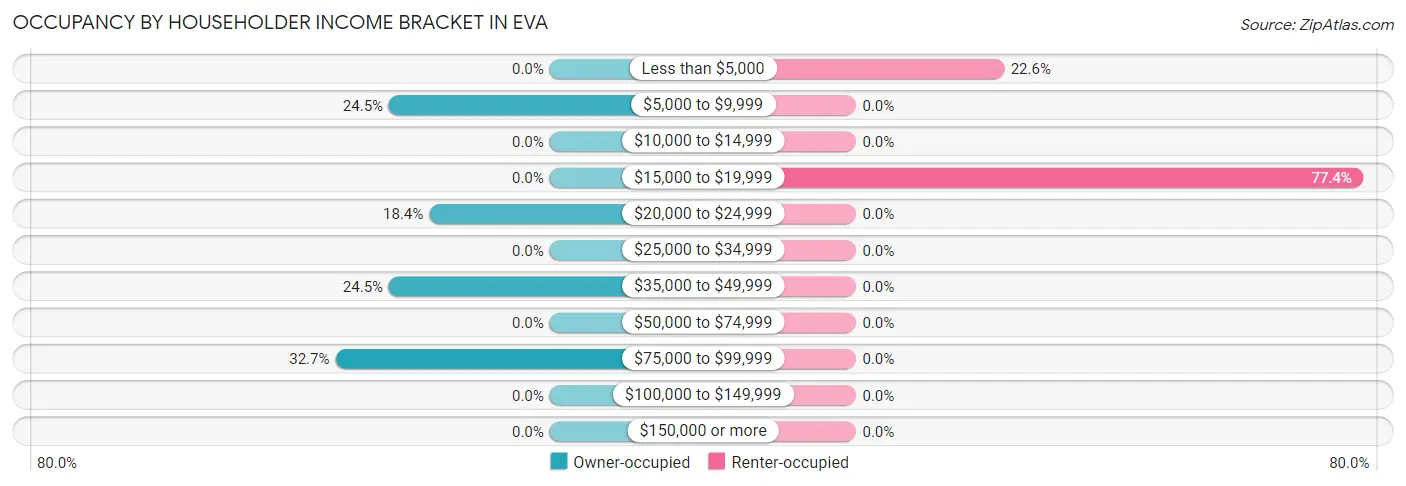
Occupancy by Householder Income Bracket in Eva
Income Bracket
Owner-occupied
Renter-occupied
Less than $5,000
0 (0.0%)
7 (22.6%)
$5,000 to $9,999
12 (24.5%)
0 (0.0%)
$10,000 to $14,999
0 (0.0%)
0 (0.0%)
$15,000 to $19,999
0 (0.0%)
24 (77.4%)
$20,000 to $24,999
9 (18.4%)
0 (0.0%)
$25,000 to $34,999
0 (0.0%)
0 (0.0%)
$35,000 to $49,999
12 (24.5%)
0 (0.0%)
$50,000 to $74,999
0 (0.0%)
0 (0.0%)
$75,000 to $99,999
16 (32.7%)
0 (0.0%)
$100,000 to $149,999
0 (0.0%)
0 (0.0%)
$150,000 or more
0 (0.0%)
0 (0.0%)
Total
49 (100.0%)
31 (100.0%)
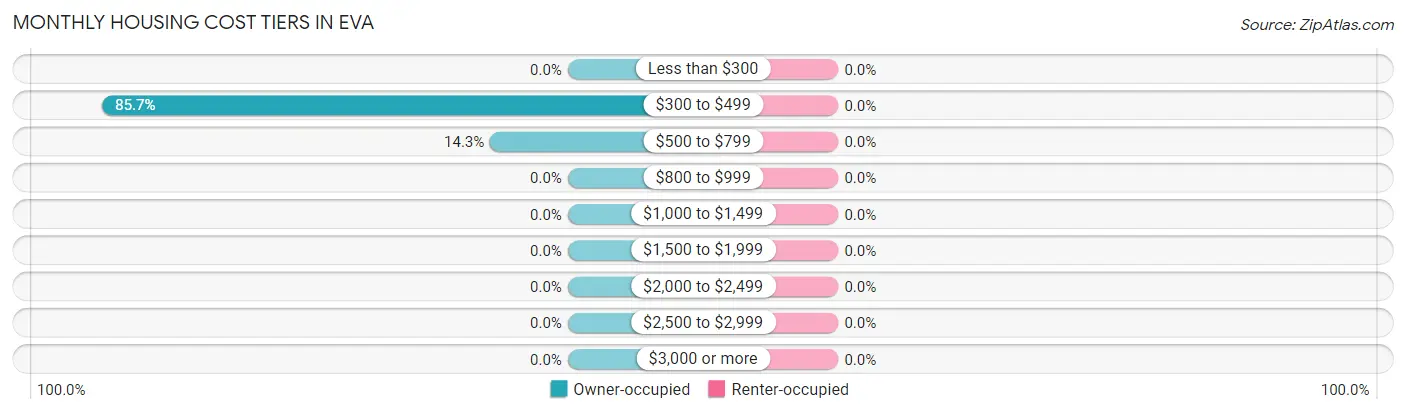
Monthly Housing Cost Tiers in Eva
Monthly Cost
Owner-occupied
Renter-occupied
Less than $300
0 (0.0%)
0 (0.0%)
$300 to $499
42 (85.7%)
0 (0.0%)
$500 to $799
7 (14.3%)
0 (0.0%)
$800 to $999
0 (0.0%)
0 (0.0%)
$1,000 to $1,499
0 (0.0%)
0 (0.0%)
$1,500 to $1,999
0 (0.0%)
0 (0.0%)
$2,000 to $2,499
0 (0.0%)
0 (0.0%)
$2,500 to $2,999
0 (0.0%)
0 (0.0%)
$3,000 or more
0 (0.0%)
0 (0.0%)
Total
49 (100.0%)
31 (100.0%)
Physical Housing Characteristics in Eva
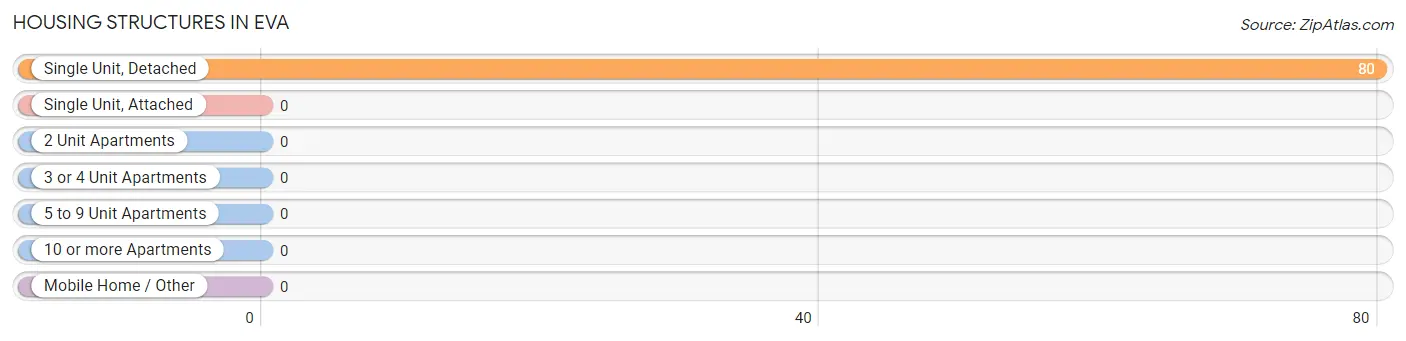
Housing Structures in Eva
Structure Type
# Housing Units
% Housing Units
Single Unit, Detached
80
100.0%
Single Unit, Attached
0
0.0%
2 Unit Apartments
0
0.0%
3 or 4 Unit Apartments
0
0.0%
5 to 9 Unit Apartments
0
0.0%
10 or more Apartments
0
0.0%
Mobile Home / Other
0
0.0%
Total
80
100.0%
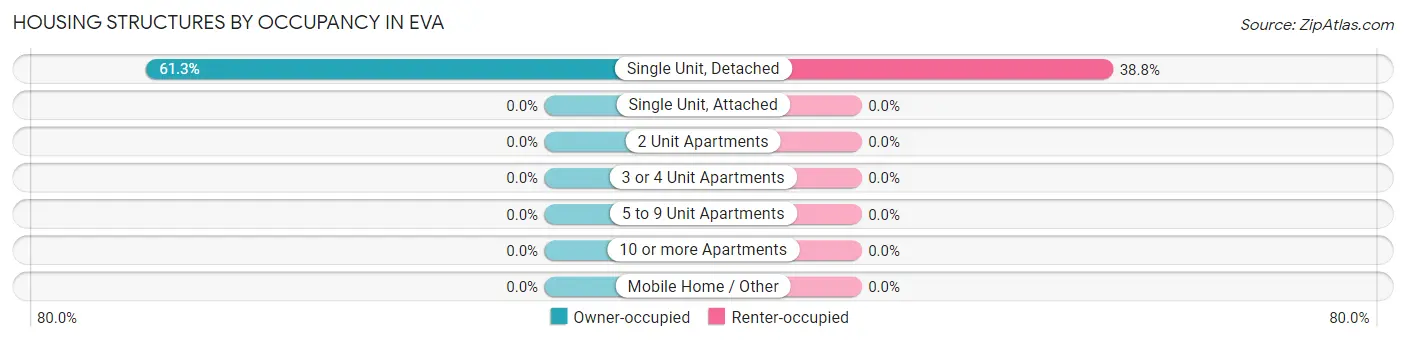
Housing Structures by Occupancy in Eva
Structure Type
Owner-occupied
Renter-occupied
Single Unit, Detached
49 (61.3%)
31 (38.8%)
Single Unit, Attached
0 (0.0%)
0 (0.0%)
2 Unit Apartments
0 (0.0%)
0 (0.0%)
3 or 4 Unit Apartments
0 (0.0%)
0 (0.0%)
5 to 9 Unit Apartments
0 (0.0%)
0 (0.0%)
10 or more Apartments
0 (0.0%)
0 (0.0%)
Mobile Home / Other
0 (0.0%)
0 (0.0%)
Total
49 (61.3%)
31 (38.8%)
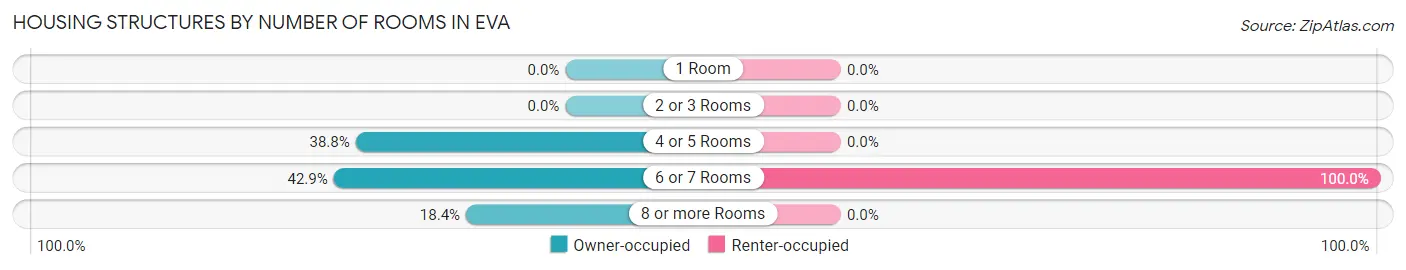
Housing Structures by Number of Rooms in Eva
Number of Rooms
Owner-occupied
Renter-occupied
1 Room
0 (0.0%)
0 (0.0%)
2 or 3 Rooms
0 (0.0%)
0 (0.0%)
4 or 5 Rooms
19 (38.8%)
0 (0.0%)
6 or 7 Rooms
21 (42.9%)
31 (100.0%)
8 or more Rooms
9 (18.4%)
0 (0.0%)
Total
49 (100.0%)
31 (100.0%)
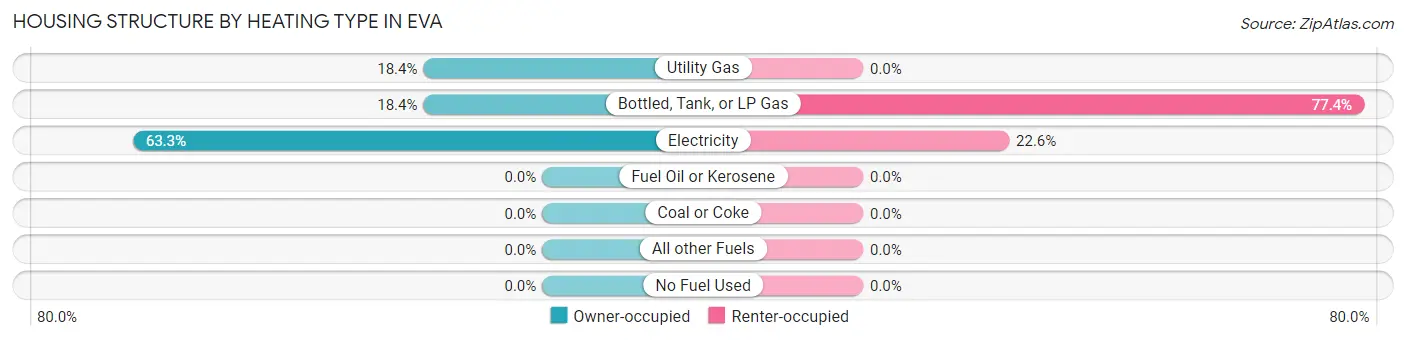
Housing Structure by Heating Type in Eva
Heating Type
Owner-occupied
Renter-occupied
Utility Gas
9 (18.4%)
0 (0.0%)
Bottled, Tank, or LP Gas
9 (18.4%)
24 (77.4%)
Electricity
31 (63.3%)
7 (22.6%)
Fuel Oil or Kerosene
0 (0.0%)
0 (0.0%)
Coal or Coke
0 (0.0%)
0 (0.0%)
All other Fuels
0 (0.0%)
0 (0.0%)
No Fuel Used
0 (0.0%)
0 (0.0%)
Total
49 (100.0%)
31 (100.0%)
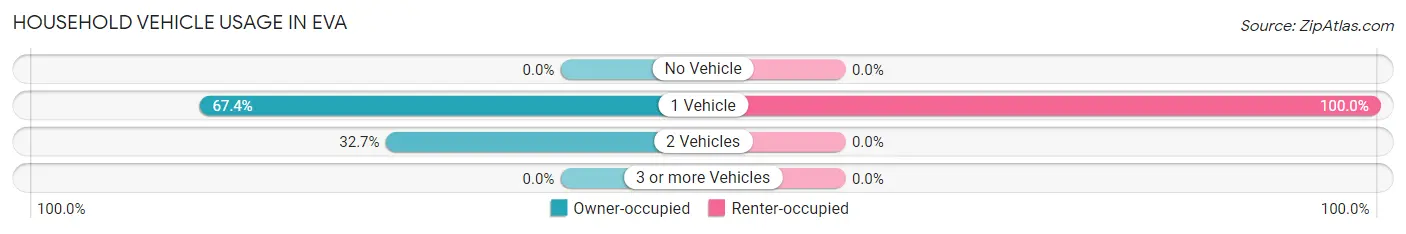
Household Vehicle Usage in Eva
Vehicles per Household
Owner-occupied
Renter-occupied
No Vehicle
0 (0.0%)
0 (0.0%)
1 Vehicle
33 (67.3%)
31 (100.0%)
2 Vehicles
16 (32.7%)
0 (0.0%)
3 or more Vehicles
0 (0.0%)
0 (0.0%)
Total
49 (100.0%)
31 (100.0%)
Real Estate & Mortgages in Eva
Real Estate and Mortgage Overview in Eva
Characteristic
Without Mortgage
With Mortgage
Housing Units
42
7
Median Property Value
-
-
Median Household Income
-
-
Monthly Housing Costs
$375
$0
Real Estate Taxes
$1,000
$0
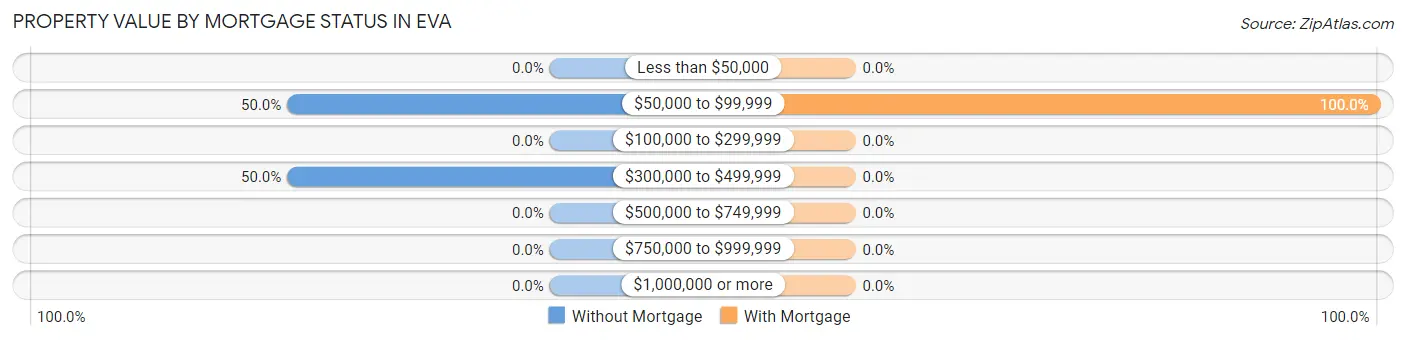
Property Value by Mortgage Status in Eva
Property Value
Without Mortgage
With Mortgage
Less than $50,000
0 (0.0%)
0 (0.0%)
$50,000 to $99,999
21 (50.0%)
7 (100.0%)
$100,000 to $299,999
0 (0.0%)
0 (0.0%)
$300,000 to $499,999
21 (50.0%)
0 (0.0%)
$500,000 to $749,999
0 (0.0%)
0 (0.0%)
$750,000 to $999,999
0 (0.0%)
0 (0.0%)
$1,000,000 or more
0 (0.0%)
0 (0.0%)
Total
42 (100.0%)
7 (100.0%)
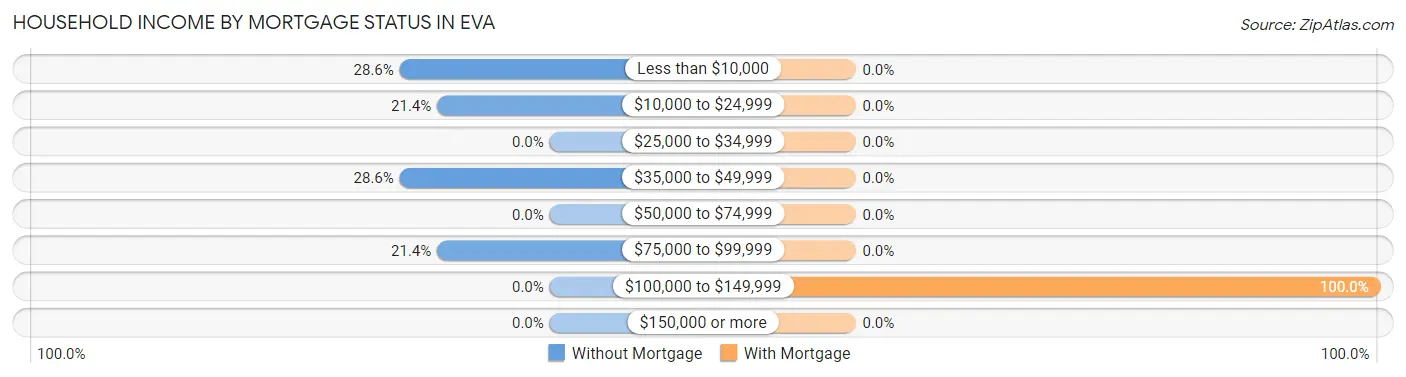
Household Income by Mortgage Status in Eva
Household Income
Without Mortgage
With Mortgage
Less than $10,000
12 (28.6%)
0 (0.0%)
$10,000 to $24,999
9 (21.4%)
0 (0.0%)
$25,000 to $34,999
0 (0.0%)
0 (0.0%)
$35,000 to $49,999
12 (28.6%)
0 (0.0%)
$50,000 to $74,999
0 (0.0%)
0 (0.0%)
$75,000 to $99,999
9 (21.4%)
0 (0.0%)
$100,000 to $149,999
0 (0.0%)
7 (100.0%)
$150,000 or more
0 (0.0%)
0 (0.0%)
Total
42 (100.0%)
7 (100.0%)
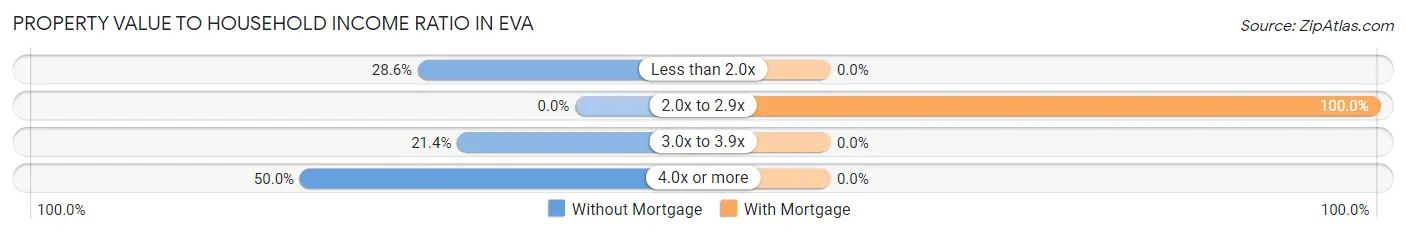
Property Value to Household Income Ratio in Eva
Value-to-Income Ratio
Without Mortgage
With Mortgage
Less than 2.0x
12 (28.6%)
0 (0.0%)
2.0x to 2.9x
0 (0.0%)
7 (100.0%)
3.0x to 3.9x
9 (21.4%)
0 (0.0%)
4.0x or more
21 (50.0%)
0 (0.0%)
Total
42 (100.0%)
7 (100.0%)
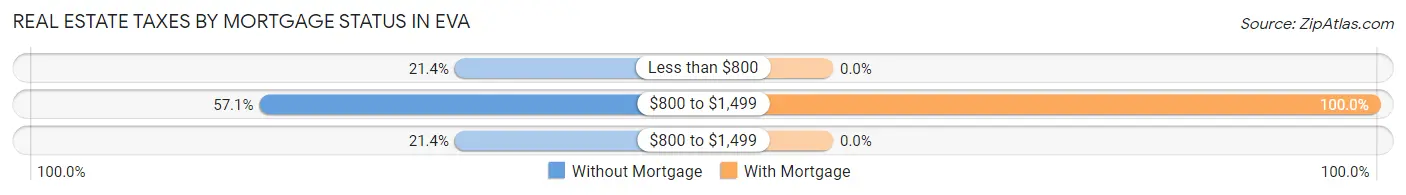
Real Estate Taxes by Mortgage Status in Eva
Property Taxes
Without Mortgage
With Mortgage
Less than $800
9 (21.4%)
0 (0.0%)
$800 to $1,499
24 (57.1%)
7 (100.0%)
$800 to $1,499
9 (21.4%)
0 (0.0%)
Total
42 (100.0%)
7 (100.0%)
Health & Disability in Eva
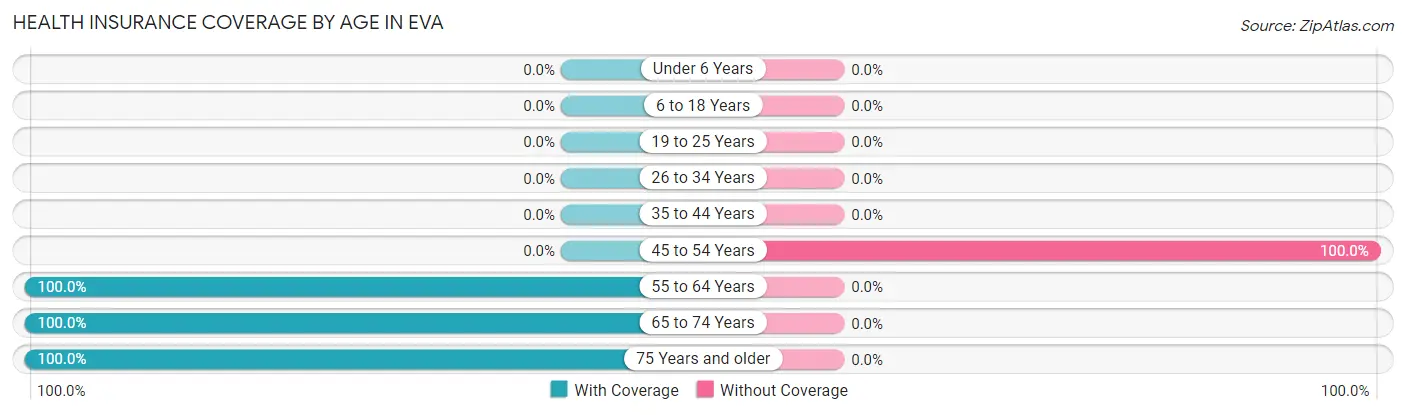
Health Insurance Coverage by Age in Eva
Age Bracket
With Coverage
Without Coverage
Under 6 Years
0 (0.0%)
0 (0.0%)
6 to 18 Years
0 (0.0%)
0 (0.0%)
19 to 25 Years
0 (0.0%)
0 (0.0%)
26 to 34 Years
0 (0.0%)
0 (0.0%)
35 to 44 Years
0 (0.0%)
0 (0.0%)
45 to 54 Years
0 (0.0%)
7 (100.0%)
55 to 64 Years
7 (100.0%)
0 (0.0%)
65 to 74 Years
59 (100.0%)
0 (0.0%)
75 Years and older
24 (100.0%)
0 (0.0%)
Total
90 (92.8%)
7 (7.2%)
Health Insurance Coverage by Citizenship Status in Eva
Citizenship Status
With Coverage
Without Coverage
Native Born
0 (0.0%)
0 (0.0%)
Foreign Born, Citizen
0 (0.0%)
0 (0.0%)
Foreign Born, not a Citizen
0 (0.0%)
0 (0.0%)
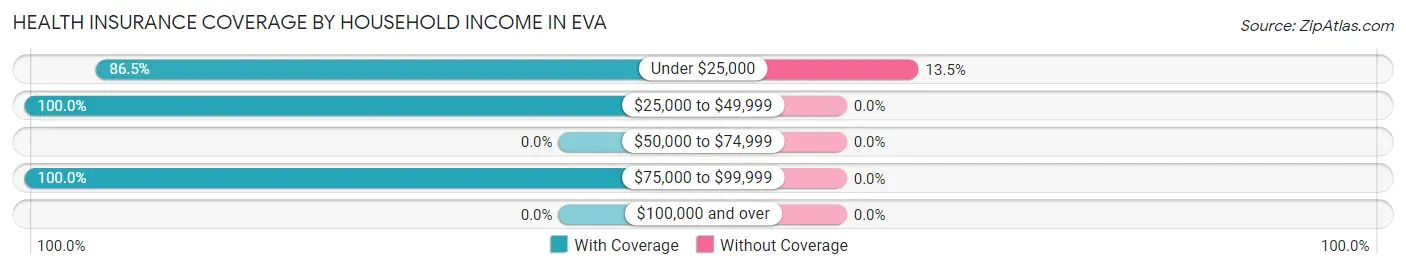
Health Insurance Coverage by Household Income in Eva
Household Income
With Coverage
Without Coverage
Under $25,000
45 (86.5%)
7 (13.5%)
$25,000 to $49,999
12 (100.0%)
0 (0.0%)
$50,000 to $74,999
0 (0.0%)
0 (0.0%)
$75,000 to $99,999
33 (100.0%)
0 (0.0%)
$100,000 and over
0 (0.0%)
0 (0.0%)
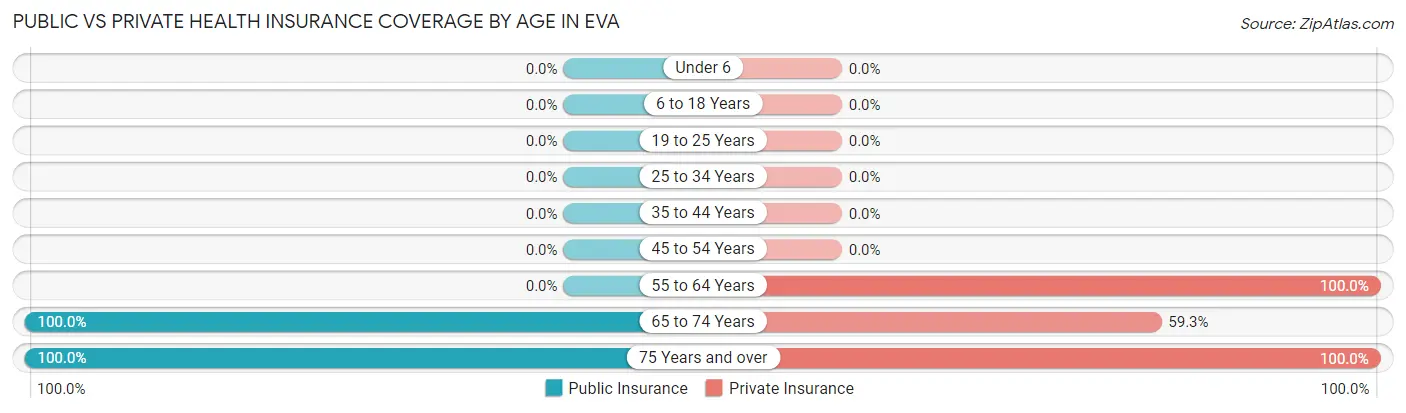
Public vs Private Health Insurance Coverage by Age in Eva
Age Bracket
Public Insurance
Private Insurance
Under 6
0 (0.0%)
0 (0.0%)
6 to 18 Years
0 (0.0%)
0 (0.0%)
19 to 25 Years
0 (0.0%)
0 (0.0%)
25 to 34 Years
0 (0.0%)
0 (0.0%)
35 to 44 Years
0 (0.0%)
0 (0.0%)
45 to 54 Years
0 (0.0%)
0 (0.0%)
55 to 64 Years
0 (0.0%)
7 (100.0%)
65 to 74 Years
59 (100.0%)
35 (59.3%)
75 Years and over
24 (100.0%)
24 (100.0%)
Total
83 (85.6%)
66 (68.0%)
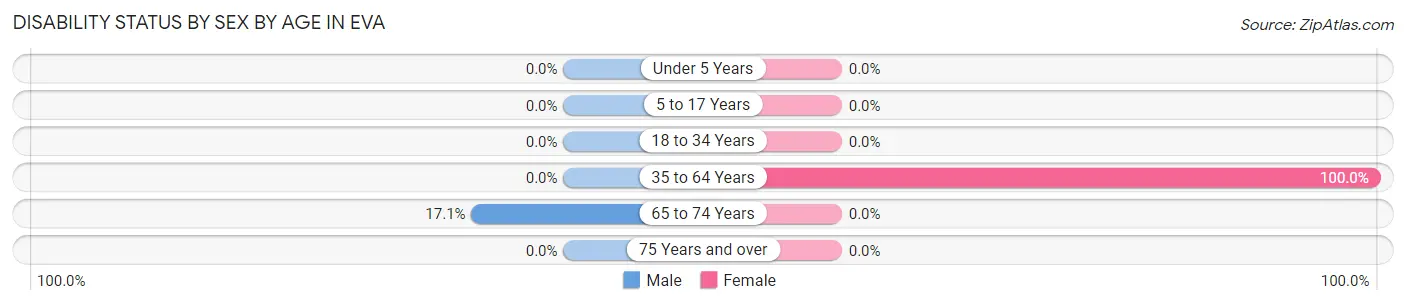
Disability Status by Sex by Age in Eva
Age Bracket
Male
Female
Under 5 Years
0 (0.0%)
0 (0.0%)
5 to 17 Years
0 (0.0%)
0 (0.0%)
18 to 34 Years
0 (0.0%)
0 (0.0%)
35 to 64 Years
0 (0.0%)
14 (100.0%)
65 to 74 Years
7 (17.1%)
0 (0.0%)
75 Years and over
0 (0.0%)
0 (0.0%)
Disability Class by Sex by Age in Eva
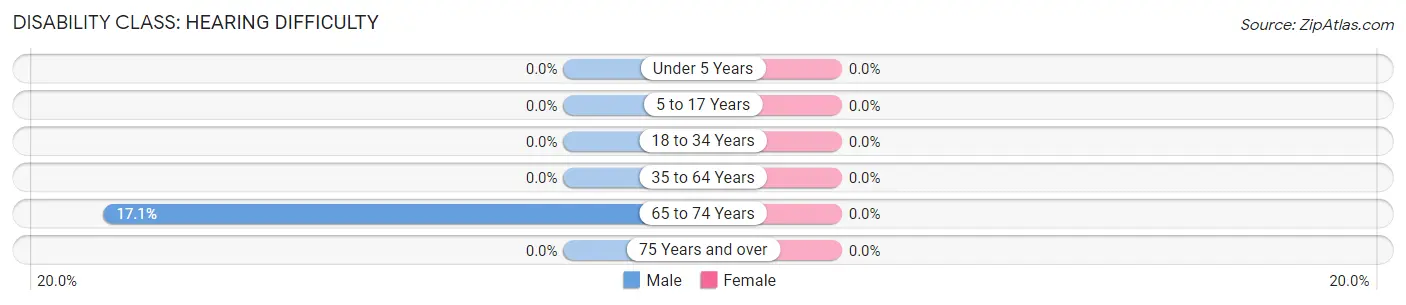
Disability Class: Hearing Difficulty
Age Bracket
Male
Female
Under 5 Years
0 (0.0%)
0 (0.0%)
5 to 17 Years
0 (0.0%)
0 (0.0%)
18 to 34 Years
0 (0.0%)
0 (0.0%)
35 to 64 Years
0 (0.0%)
0 (0.0%)
65 to 74 Years
7 (17.1%)
0 (0.0%)
75 Years and over
0 (0.0%)
0 (0.0%)
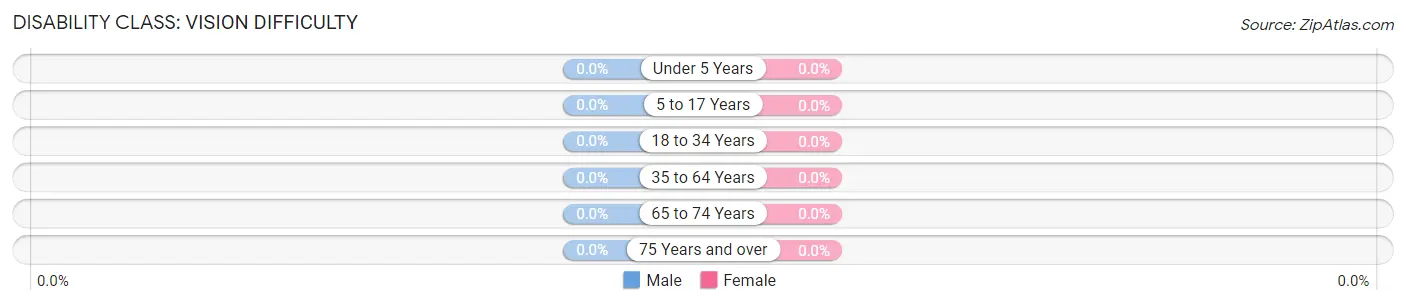
Disability Class: Vision Difficulty
Age Bracket
Male
Female
Under 5 Years
0 (0.0%)
0 (0.0%)
5 to 17 Years
0 (0.0%)
0 (0.0%)
18 to 34 Years
0 (0.0%)
0 (0.0%)
35 to 64 Years
0 (0.0%)
0 (0.0%)
65 to 74 Years
0 (0.0%)
0 (0.0%)
75 Years and over
0 (0.0%)
0 (0.0%)
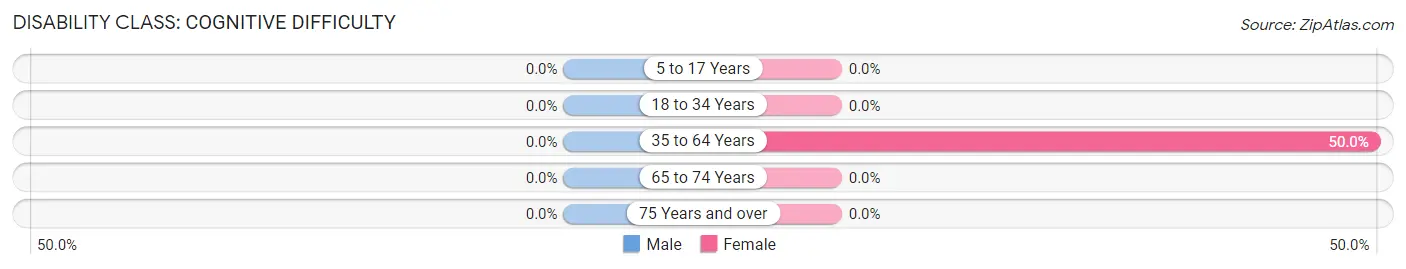
Disability Class: Cognitive Difficulty
Age Bracket
Male
Female
5 to 17 Years
0 (0.0%)
0 (0.0%)
18 to 34 Years
0 (0.0%)
0 (0.0%)
35 to 64 Years
0 (0.0%)
7 (50.0%)
65 to 74 Years
0 (0.0%)
0 (0.0%)
75 Years and over
0 (0.0%)
0 (0.0%)
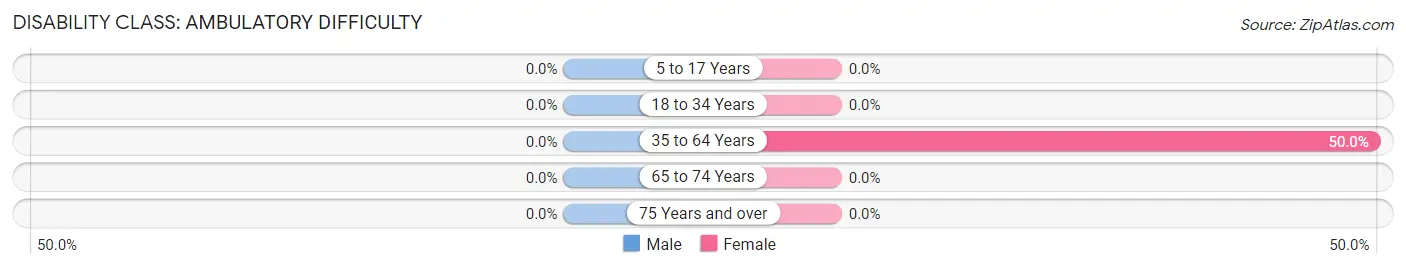
Disability Class: Ambulatory Difficulty
Age Bracket
Male
Female
5 to 17 Years
0 (0.0%)
0 (0.0%)
18 to 34 Years
0 (0.0%)
0 (0.0%)
35 to 64 Years
0 (0.0%)
7 (50.0%)
65 to 74 Years
0 (0.0%)
0 (0.0%)
75 Years and over
0 (0.0%)
0 (0.0%)
Disability Class: Self-Care Difficulty
Age Bracket
Male
Female
5 to 17 Years
0 (0.0%)
0 (0.0%)
18 to 34 Years
0 (0.0%)
0 (0.0%)
35 to 64 Years
0 (0.0%)
0 (0.0%)
65 to 74 Years
0 (0.0%)
0 (0.0%)
75 Years and over
0 (0.0%)
0 (0.0%)
Technology Access in Eva
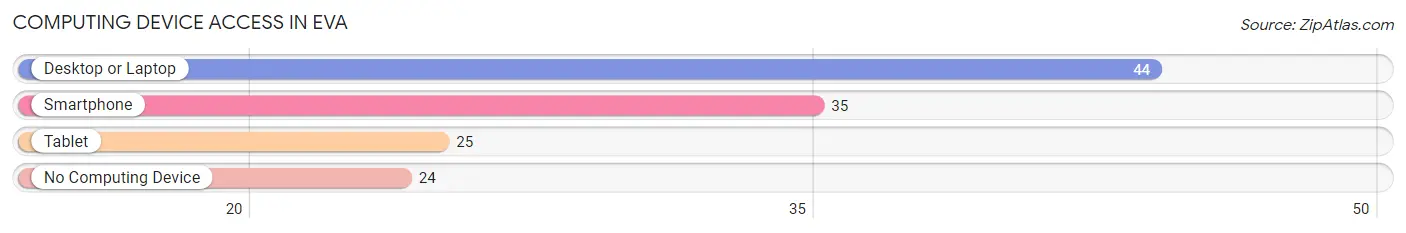
Computing Device Access in Eva
Device Type
# Households
% Households
Desktop or Laptop
44
55.0%
Smartphone
35
43.8%
Tablet
25
31.2%
No Computing Device
24
30.0%
Total
80
100.0%
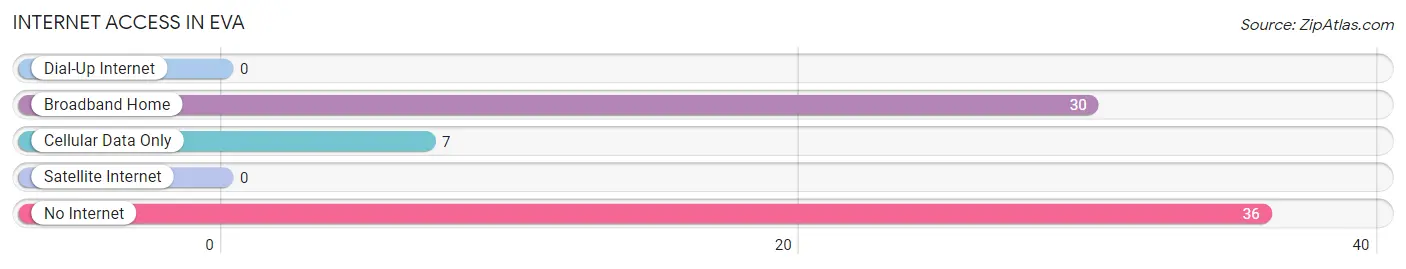
Internet Access in Eva
Internet Type
# Households
% Households
Dial-Up Internet
0
0.0%
Broadband Home
30
37.5%
Cellular Data Only
7
8.7%
Satellite Internet
0
0.0%
No Internet
36
45.0%
Total
80
100.0%
Eva Summary
Eva, Tennessee is a small town located in the northwest corner of McNairy County, Tennessee. It is situated on the banks of the Hatchie River, and is part of the Jackson metropolitan area. The town has a population of approximately 1,000 people, and is known for its rural charm and friendly atmosphere.
Geography
Eva is located in the northwest corner of McNairy County, Tennessee, and is situated on the banks of the Hatchie River. The town is located approximately 25 miles east of Jackson, Tennessee, and is part of the Jackson metropolitan area. The town is surrounded by rolling hills and farmland, and is home to a variety of wildlife, including deer, turkey, and other small game. The town is also home to several small lakes, which provide recreational opportunities for fishing and boating.
History
Eva was founded in 1845 by a group of settlers from North Carolina. The town was named after the daughter of one of the settlers, and was originally known as Eva’s Crossroads. The town grew slowly over the years, and by the early 1900s, it had become a thriving agricultural community. The town was home to several cotton gins, and the local economy was largely based on the production of cotton and other agricultural products.
In the late 1950s, the town began to experience a period of growth and development. Several new businesses were established, and the town began to attract new residents. The town was also home to several churches, and the local school system was expanded to accommodate the growing population.
Economy
The economy of Eva is largely based on agriculture and tourism. The town is home to several farms, which produce a variety of crops, including cotton, soybeans, corn, and wheat. The town is also home to several small businesses, including restaurants, retail stores, and service providers. The town is also home to several tourist attractions, including the Hatchie River, which is popular for fishing and boating.
Demographics
As of the 2010 census, the population of Eva was 1,000 people. The town is predominantly white, with approximately 95% of the population identifying as Caucasian. The median household income is approximately $35,000, and the median home value is approximately $90,000. The town is home to several churches, and the local school system is part of the McNairy County School District.
Common Questions
What is Per Capita Income in Eva?
Per Capita income in Eva is $27,505.
What is Inequality or Gini Index in Eva?
Inequality or Gini Index in Eva is 0.48.
What is the Total Population of Eva?
Total Population of Eva is 97.
What is the Total Male Population of Eva?
Total Male Population of Eva is 41.
What is the Total Female Population of Eva?
Total Female Population of Eva is 56.
What is the Ratio of Males per 100 Females in Eva?
There are 73.21 Males per 100 Females in Eva.
What is the Ratio of Females per 100 Males in Eva?
There are 136.59 Females per 100 Males in Eva.
What is the Median Population Age in Eva?
Median Population Age in Eva is 71.5 Years.
What is the Average Family Size in Eva
Average Family Size in Eva is 2.1 People.
What is the Average Household Size in Eva
Average Household Size in Eva is 1.2 People.
Report Title
Report Link
HTML Copy & Paste Link
Social Media
Copy and paste the folowing code into any webpage where you would like this interactive chart to display