Zip Codes with the Highest Percentage of Population with a Degree in Science and Engineering in Mississippi
RELATED REPORTS & OPTIONS
Science and Engineering
Mississippi
Compare Zip Codes
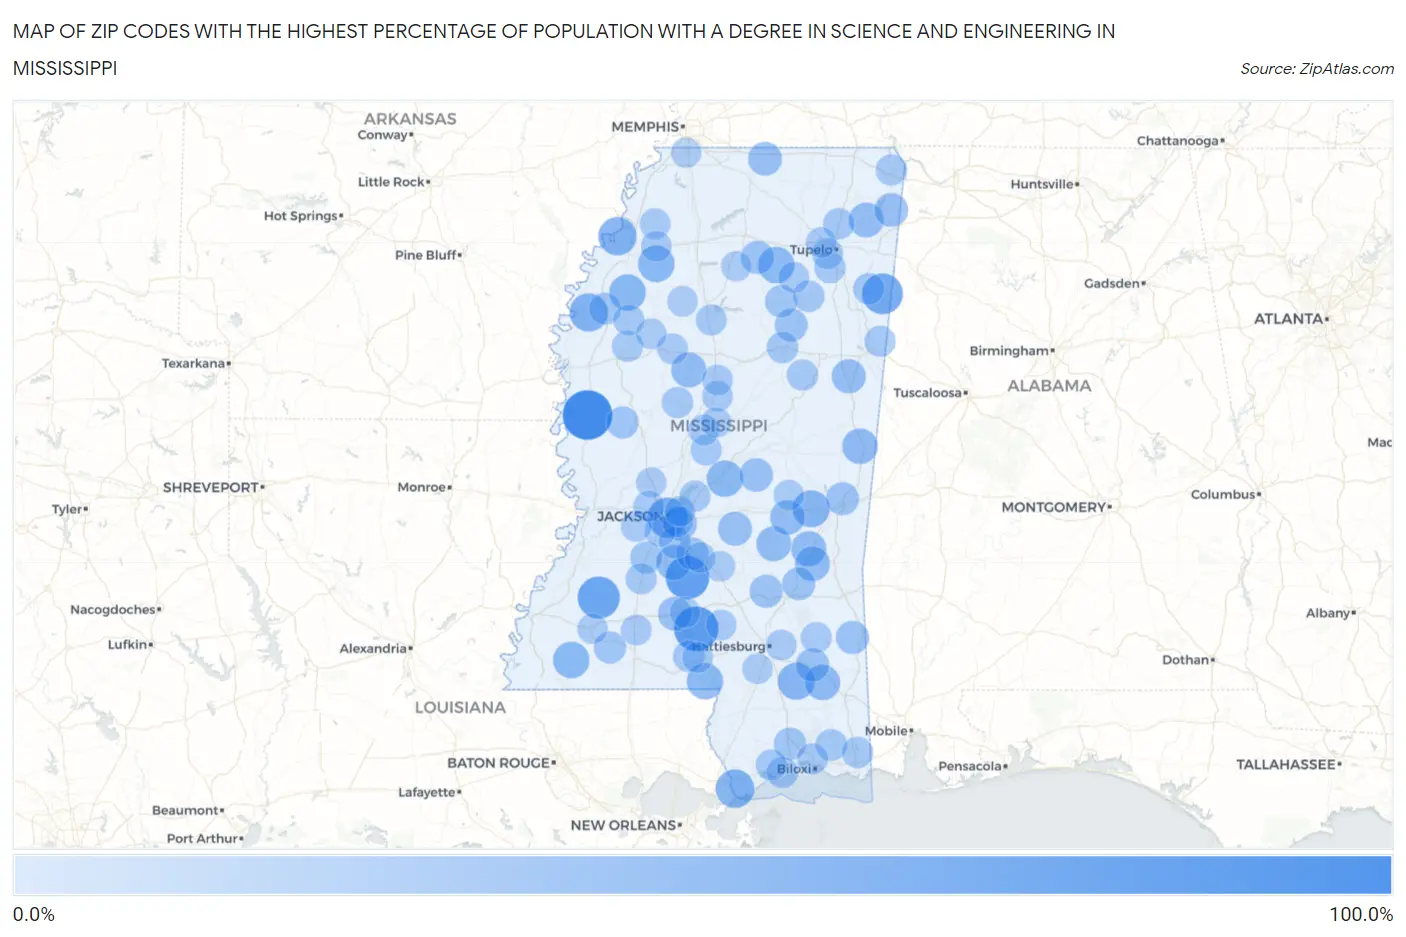
Map of Zip Codes with the Highest Percentage of Population with a Degree in Science and Engineering in Mississippi
0.0%
100.0%
Zip Codes with the Highest Percentage of Population with a Degree in Science and Engineering in Mississippi
| Zip Code | % Graduates | vs State | vs National | |
| 1. | 38765 | 100.0% | 13.2%(+86.8)#1 | 9.8%(+90.2)#86 |
| 2. | 39656 | 77.8% | 13.2%(+64.6)#2 | 9.8%(+68.0)#141 |
| 3. | 39149 | 73.3% | 13.2%(+60.1)#3 | 9.8%(+63.6)#160 |
| 4. | 39668 | 67.0% | 13.2%(+53.8)#4 | 9.8%(+57.2)#199 |
| 5. | 38848 | 61.5% | 13.2%(+48.3)#5 | 9.8%(+51.8)#241 |
| 6. | 39201 | 58.1% | 13.2%(+44.9)#6 | 9.8%(+48.3)#282 |
| 7. | 39572 | 52.3% | 13.2%(+39.0)#7 | 9.8%(+42.5)#357 |
| 8. | 38631 | 50.7% | 13.2%(+37.5)#8 | 9.8%(+41.0)#370 |
| 9. | 38764 | 50.0% | 13.2%(+36.8)#9 | 9.8%(+40.2)#393 |
| 10. | 39323 | 45.5% | 13.2%(+32.3)#10 | 9.8%(+35.8)#504 |
| 11. | 39425 | 45.1% | 13.2%(+31.9)#11 | 9.8%(+35.3)#523 |
| 12. | 38643 | 43.4% | 13.2%(+30.1)#12 | 9.8%(+33.6)#565 |
| 13. | 38738 | 43.0% | 13.2%(+29.8)#13 | 9.8%(+33.2)#569 |
| 14. | 39094 | 42.7% | 13.2%(+29.4)#14 | 9.8%(+32.9)#586 |
| 15. | 39638 | 42.6% | 13.2%(+29.4)#15 | 9.8%(+32.9)#587 |
| 16. | 38864 | 42.5% | 13.2%(+29.3)#16 | 9.8%(+32.7)#591 |
| 17. | 39478 | 42.3% | 13.2%(+29.1)#17 | 9.8%(+32.5)#601 |
| 18. | 39358 | 39.0% | 13.2%(+25.8)#18 | 9.8%(+29.2)#715 |
| 19. | 39456 | 38.6% | 13.2%(+25.4)#19 | 9.8%(+28.8)#729 |
| 20. | 39347 | 37.3% | 13.2%(+24.1)#20 | 9.8%(+27.5)#792 |
| 21. | 39082 | 37.2% | 13.2%(+24.0)#21 | 9.8%(+27.4)#799 |
| 22. | 38923 | 36.8% | 13.2%(+23.6)#22 | 9.8%(+27.0)#822 |
| 23. | 39338 | 36.1% | 13.2%(+22.9)#23 | 9.8%(+26.4)#864 |
| 24. | 39366 | 35.9% | 13.2%(+22.7)#24 | 9.8%(+26.2)#875 |
| 25. | 38856 | 35.8% | 13.2%(+22.5)#25 | 9.8%(+26.0)#885 |
| 26. | 39345 | 35.6% | 13.2%(+22.4)#26 | 9.8%(+25.8)#899 |
| 27. | 39743 | 32.7% | 13.2%(+19.5)#27 | 9.8%(+22.9)#1,088 |
| 28. | 39654 | 32.2% | 13.2%(+18.9)#28 | 9.8%(+22.4)#1,125 |
| 29. | 39152 | 31.8% | 13.2%(+18.6)#29 | 9.8%(+22.0)#1,146 |
| 30. | 38642 | 31.5% | 13.2%(+18.3)#30 | 9.8%(+21.8)#1,173 |
| 31. | 38827 | 31.3% | 13.2%(+18.1)#31 | 9.8%(+21.5)#1,195 |
| 32. | 39193 | 31.2% | 13.2%(+18.0)#32 | 9.8%(+21.5)#1,204 |
| 33. | 39189 | 30.1% | 13.2%(+16.9)#33 | 9.8%(+20.3)#1,303 |
| 34. | 39423 | 30.1% | 13.2%(+16.8)#34 | 9.8%(+20.3)#1,307 |
| 35. | 38949 | 29.2% | 13.2%(+16.0)#35 | 9.8%(+19.4)#1,398 |
| 36. | 39362 | 28.9% | 13.2%(+15.7)#36 | 9.8%(+19.1)#1,417 |
| 37. | 39480 | 28.5% | 13.2%(+15.3)#37 | 9.8%(+18.7)#1,479 |
| 38. | 39342 | 28.2% | 13.2%(+15.0)#38 | 9.8%(+18.4)#1,512 |
| 39. | 39477 | 28.1% | 13.2%(+14.9)#39 | 9.8%(+18.3)#1,518 |
| 40. | 39751 | 27.5% | 13.2%(+14.2)#40 | 9.8%(+17.7)#1,601 |
| 41. | 39044 | 26.1% | 13.2%(+12.9)#41 | 9.8%(+16.4)#1,769 |
| 42. | 38878 | 25.5% | 13.2%(+12.3)#42 | 9.8%(+15.8)#1,851 |
| 43. | 39574 | 25.3% | 13.2%(+12.1)#43 | 9.8%(+15.5)#1,899 |
| 44. | 39097 | 25.0% | 13.2%(+11.8)#44 | 9.8%(+15.2)#1,979 |
| 45. | 39664 | 24.5% | 13.2%(+11.3)#45 | 9.8%(+14.7)#2,070 |
| 46. | 39059 | 24.0% | 13.2%(+10.8)#46 | 9.8%(+14.2)#2,157 |
| 47. | 38759 | 23.4% | 13.2%(+10.2)#47 | 9.8%(+13.6)#2,296 |
| 48. | 39073 | 23.1% | 13.2%(+9.88)#48 | 9.8%(+13.3)#2,362 |
| 49. | 39565 | 22.6% | 13.2%(+9.38)#49 | 9.8%(+12.8)#2,479 |
| 50. | 38851 | 21.9% | 13.2%(+8.68)#50 | 9.8%(+12.1)#2,670 |
| 51. | 39643 | 21.9% | 13.2%(+8.66)#51 | 9.8%(+12.1)#2,673 |
| 52. | 39752 | 21.9% | 13.2%(+8.64)#52 | 9.8%(+12.1)#2,683 |
| 53. | 38849 | 21.2% | 13.2%(+7.99)#53 | 9.8%(+11.4)#2,888 |
| 54. | 39560 | 21.1% | 13.2%(+7.92)#54 | 9.8%(+11.4)#2,910 |
| 55. | 38821 | 21.1% | 13.2%(+7.88)#55 | 9.8%(+11.3)#2,928 |
| 56. | 39562 | 21.1% | 13.2%(+7.84)#56 | 9.8%(+11.3)#2,938 |
| 57. | 39769 | 20.9% | 13.2%(+7.65)#57 | 9.8%(+11.1)#3,013 |
| 58. | 38868 | 20.9% | 13.2%(+7.65)#58 | 9.8%(+11.1)#3,014 |
| 59. | 39095 | 20.7% | 13.2%(+7.49)#59 | 9.8%(+10.9)#3,071 |
| 60. | 39083 | 20.5% | 13.2%(+7.31)#60 | 9.8%(+10.7)#3,134 |
| 61. | 38801 | 20.5% | 13.2%(+7.27)#61 | 9.8%(+10.7)#3,146 |
| 62. | 38778 | 20.5% | 13.2%(+7.25)#62 | 9.8%(+10.7)#3,152 |
| 63. | 39766 | 20.3% | 13.2%(+7.06)#63 | 9.8%(+10.5)#3,237 |
| 64. | 39571 | 20.2% | 13.2%(+7.02)#64 | 9.8%(+10.4)#3,254 |
| 65. | 39208 | 20.2% | 13.2%(+6.95)#65 | 9.8%(+10.4)#3,280 |
| 66. | 38852 | 19.9% | 13.2%(+6.69)#66 | 9.8%(+10.1)#3,412 |
| 67. | 39047 | 19.8% | 13.2%(+6.62)#67 | 9.8%(+10.1)#3,442 |
| 68. | 39045 | 19.6% | 13.2%(+6.42)#68 | 9.8%(+9.85)#3,502 |
| 69. | 38901 | 19.5% | 13.2%(+6.25)#69 | 9.8%(+9.68)#3,583 |
| 70. | 38771 | 19.4% | 13.2%(+6.22)#70 | 9.8%(+9.65)#3,596 |
| 71. | 39540 | 19.4% | 13.2%(+6.14)#71 | 9.8%(+9.58)#3,624 |
| 72. | 39079 | 19.2% | 13.2%(+6.02)#72 | 9.8%(+9.45)#3,686 |
| 73. | 38670 | 19.2% | 13.2%(+6.02)#73 | 9.8%(+9.45)#3,689 |
| 74. | 38850 | 19.2% | 13.2%(+5.96)#74 | 9.8%(+9.39)#3,720 |
| 75. | 39272 | 19.2% | 13.2%(+5.96)#75 | 9.8%(+9.39)#3,722 |
| 76. | 38930 | 19.1% | 13.2%(+5.87)#76 | 9.8%(+9.30)#3,757 |
| 77. | 39476 | 19.0% | 13.2%(+5.83)#77 | 9.8%(+9.26)#3,787 |
| 78. | 39154 | 18.9% | 13.2%(+5.73)#78 | 9.8%(+9.16)#3,827 |
| 79. | 39483 | 18.7% | 13.2%(+5.52)#79 | 9.8%(+8.95)#3,926 |
| 80. | 39192 | 18.7% | 13.2%(+5.44)#80 | 9.8%(+8.88)#3,956 |
| 81. | 39176 | 18.6% | 13.2%(+5.41)#81 | 9.8%(+8.84)#3,980 |
| 82. | 39629 | 18.6% | 13.2%(+5.36)#82 | 9.8%(+8.79)#4,007 |
| 83. | 39056 | 18.5% | 13.2%(+5.31)#83 | 9.8%(+8.75)#4,026 |
| 84. | 39465 | 18.5% | 13.2%(+5.28)#84 | 9.8%(+8.72)#4,046 |
| 85. | 38646 | 18.4% | 13.2%(+5.15)#85 | 9.8%(+8.59)#4,104 |
| 86. | 38826 | 18.3% | 13.2%(+5.08)#86 | 9.8%(+8.51)#4,138 |
| 87. | 39062 | 18.2% | 13.2%(+4.97)#87 | 9.8%(+8.40)#4,209 |
| 88. | 39421 | 18.2% | 13.2%(+4.95)#88 | 9.8%(+8.38)#4,228 |
| 89. | 38952 | 17.9% | 13.2%(+4.68)#89 | 9.8%(+8.11)#4,377 |
| 90. | 39475 | 17.8% | 13.2%(+4.57)#90 | 9.8%(+8.00)#4,433 |
| 91. | 38920 | 17.6% | 13.2%(+4.43)#91 | 9.8%(+7.87)#4,514 |
| 92. | 39663 | 17.4% | 13.2%(+4.20)#92 | 9.8%(+7.63)#4,677 |
| 93. | 39232 | 17.3% | 13.2%(+4.07)#93 | 9.8%(+7.50)#4,747 |
| 94. | 39111 | 17.2% | 13.2%(+4.01)#94 | 9.8%(+7.44)#4,775 |
| 95. | 38965 | 17.1% | 13.2%(+3.92)#95 | 9.8%(+7.36)#4,837 |
| 96. | 39327 | 17.1% | 13.2%(+3.90)#96 | 9.8%(+7.34)#4,858 |
| 97. | 39160 | 17.1% | 13.2%(+3.88)#97 | 9.8%(+7.31)#4,871 |
| 98. | 39630 | 17.0% | 13.2%(+3.81)#98 | 9.8%(+7.24)#4,933 |
| 99. | 39071 | 17.0% | 13.2%(+3.78)#99 | 9.8%(+7.22)#4,950 |
| 100. | 38671 | 16.9% | 13.2%(+3.68)#100 | 9.8%(+7.12)#5,027 |
Common Questions
What are the Top 10 Zip Codes with the Highest Percentage of Population with a Degree in Science and Engineering in Mississippi?
Top 10 Zip Codes with the Highest Percentage of Population with a Degree in Science and Engineering in Mississippi are:
What zip code has the Highest Percentage of Population with a Degree in Science and Engineering in Mississippi?
38765 has the Highest Percentage of Population with a Degree in Science and Engineering in Mississippi with 100.0%.
What is the Percentage of Population with a Degree in Science and Engineering in the State of Mississippi?
Percentage of Population with a Degree in Science and Engineering in Mississippi is 13.2%.
What is the Percentage of Population with a Degree in Science and Engineering in the United States?
Percentage of Population with a Degree in Science and Engineering in the United States is 9.8%.