State Line, MS Map & Demographics
State Line Map
State Line Overview
$20,102
PER CAPITA INCOME
0.65
INEQUALITY / GINI INDEX
824
TOTAL POPULATION
467
MALE POPULATION
357
FEMALE POPULATION
130.81
MALES / 100 FEMALES
76.45
FEMALES / 100 MALES
34.0
MEDIAN AGE
4.2
AVG FAMILY SIZE
2.7
AVG HOUSEHOLD SIZE
386
LABOR FORCE [ PEOPLE ]
56.4%
PERCENT IN LABOR FORCE
40.4%
UNEMPLOYMENT RATE
State Line Zip Codes
State Line Area Codes
Income in State Line
Income Overview in State Line
| Characteristic | Number | Measure |
| Per Capita Income | 824 | $20,102 |
| Median Family Income | 164 | $0 |
| Mean Family Income | 164 | $89,342 |
| Median Household Income | 304 | $0 |
| Mean Household Income | 304 | $54,171 |
| Income Deficit | 164 | $0 |
| Wage / Income Gap (%) | 824 | 0.00% |
| Wage / Income Gap ($) | 824 | 100.00¢ per $1 |
| Gini / Inequality Index | 824 | 0.65 |
Earnings by Sex in State Line
| Sex | Number | Average Earnings |
| Male | 278 (75.3%) | $0 |
| Female | 91 (24.7%) | $0 |
| Total | 369 (100.0%) | $0 |
Earnings by Sex by Income Bracket in State Line
The most common earnings brackets in State Line are $2,499 or less for men (99 | 35.6%) and $2,499 or less for women (43 | 47.2%).
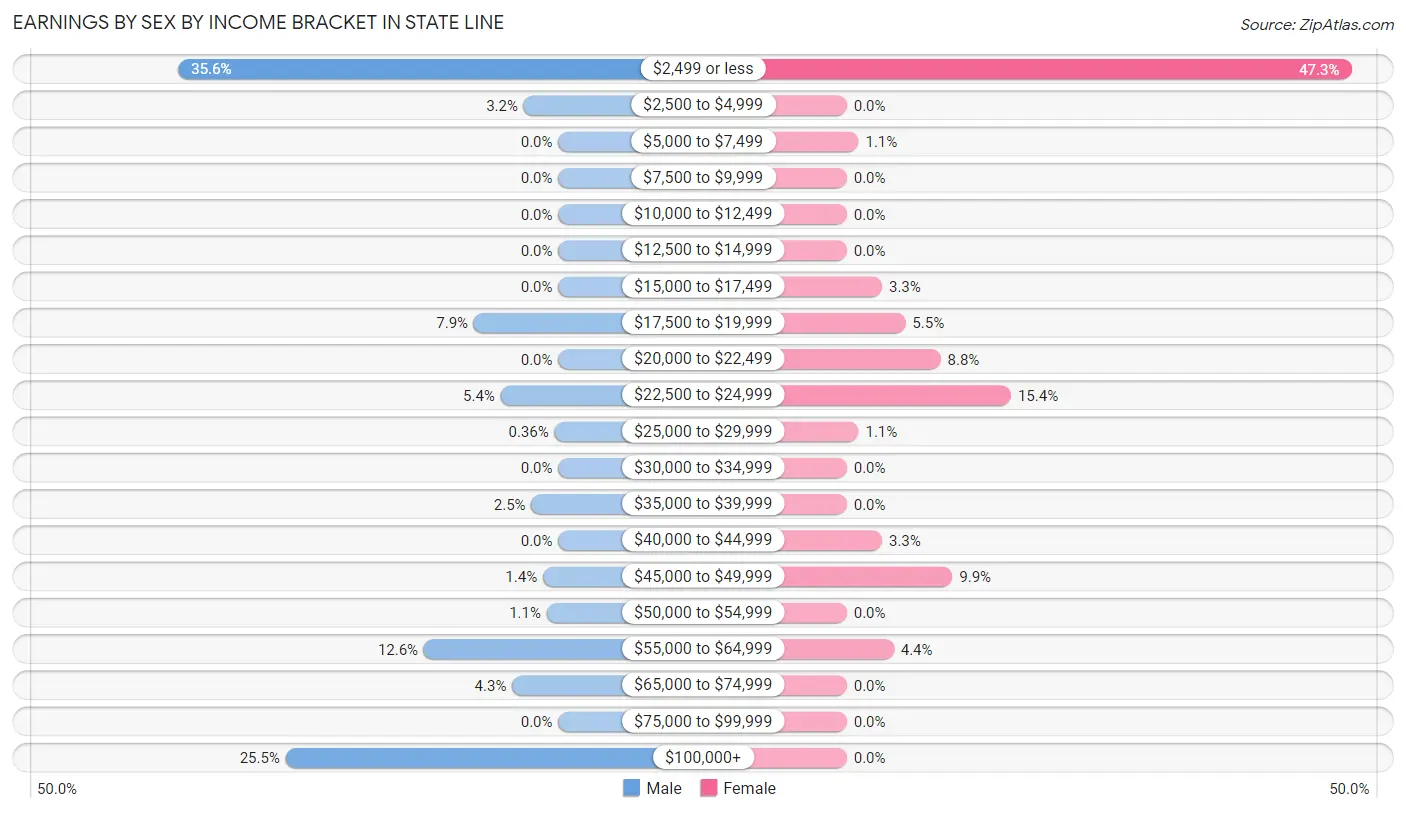
| Income | Male | Female |
| $2,499 or less | 99 (35.6%) | 43 (47.2%) |
| $2,500 to $4,999 | 9 (3.2%) | 0 (0.0%) |
| $5,000 to $7,499 | 0 (0.0%) | 1 (1.1%) |
| $7,500 to $9,999 | 0 (0.0%) | 0 (0.0%) |
| $10,000 to $12,499 | 0 (0.0%) | 0 (0.0%) |
| $12,500 to $14,999 | 0 (0.0%) | 0 (0.0%) |
| $15,000 to $17,499 | 0 (0.0%) | 3 (3.3%) |
| $17,500 to $19,999 | 22 (7.9%) | 5 (5.5%) |
| $20,000 to $22,499 | 0 (0.0%) | 8 (8.8%) |
| $22,500 to $24,999 | 15 (5.4%) | 14 (15.4%) |
| $25,000 to $29,999 | 1 (0.4%) | 1 (1.1%) |
| $30,000 to $34,999 | 0 (0.0%) | 0 (0.0%) |
| $35,000 to $39,999 | 7 (2.5%) | 0 (0.0%) |
| $40,000 to $44,999 | 0 (0.0%) | 3 (3.3%) |
| $45,000 to $49,999 | 4 (1.4%) | 9 (9.9%) |
| $50,000 to $54,999 | 3 (1.1%) | 0 (0.0%) |
| $55,000 to $64,999 | 35 (12.6%) | 4 (4.4%) |
| $65,000 to $74,999 | 12 (4.3%) | 0 (0.0%) |
| $75,000 to $99,999 | 0 (0.0%) | 0 (0.0%) |
| $100,000+ | 71 (25.5%) | 0 (0.0%) |
| Total | 278 (100.0%) | 91 (100.0%) |
Earnings by Sex by Educational Attainment in State Line
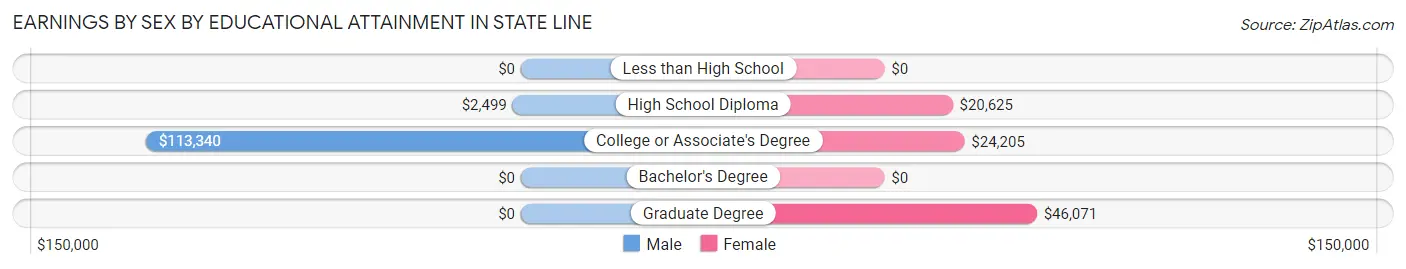
| Educational Attainment | Male Income | Female Income |
| Less than High School | - | - |
| High School Diploma | $2,499 | $20,625 |
| College or Associate's Degree | $113,340 | $24,205 |
| Bachelor's Degree | - | - |
| Graduate Degree | - | - |
| Total | - | - |
Family Income in State Line
Family Income Brackets in State Line
According to the State Line family income data, there are 57 families falling into the $150,000 to $199,999 income range, which is the most common income bracket and makes up 34.8% of all families.
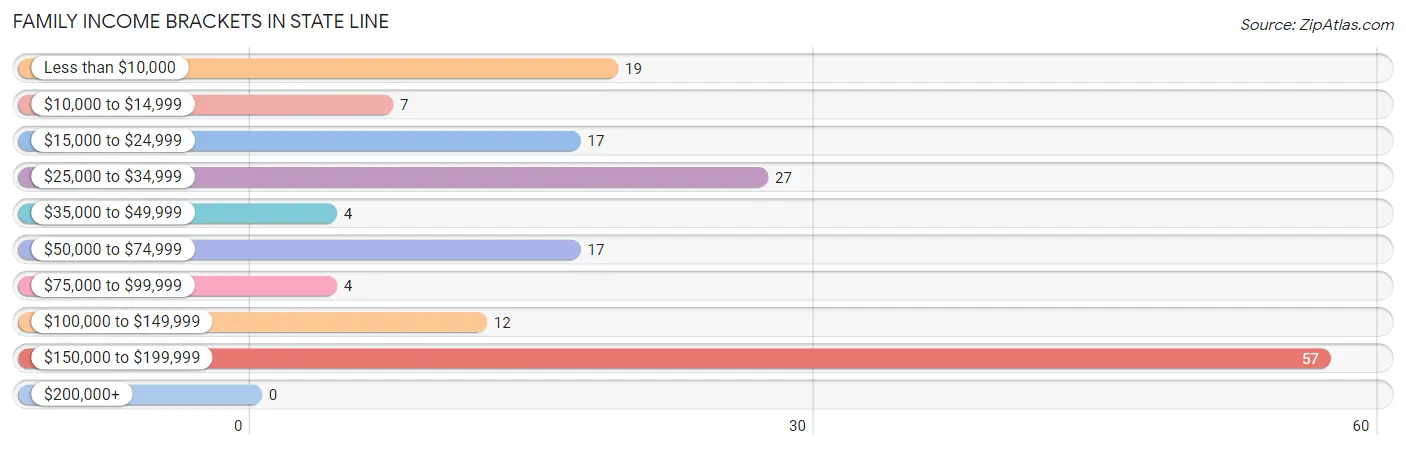
| Income Bracket | # Families | % Families |
| Less than $10,000 | 19 | 11.6% |
| $10,000 to $14,999 | 7 | 4.3% |
| $15,000 to $24,999 | 17 | 10.4% |
| $25,000 to $34,999 | 27 | 16.5% |
| $35,000 to $49,999 | 4 | 2.4% |
| $50,000 to $74,999 | 17 | 10.4% |
| $75,000 to $99,999 | 4 | 2.4% |
| $100,000 to $149,999 | 12 | 7.3% |
| $150,000 to $199,999 | 57 | 34.8% |
| $200,000+ | 0 | 0.0% |
Family Income by Famaliy Size in State Line
4-person families (63 | 38.4%) account for the highest median family income in State Line with $183,568 per family, while 4-person families (63 | 38.4%) have the highest median income of $45,892 per family member.
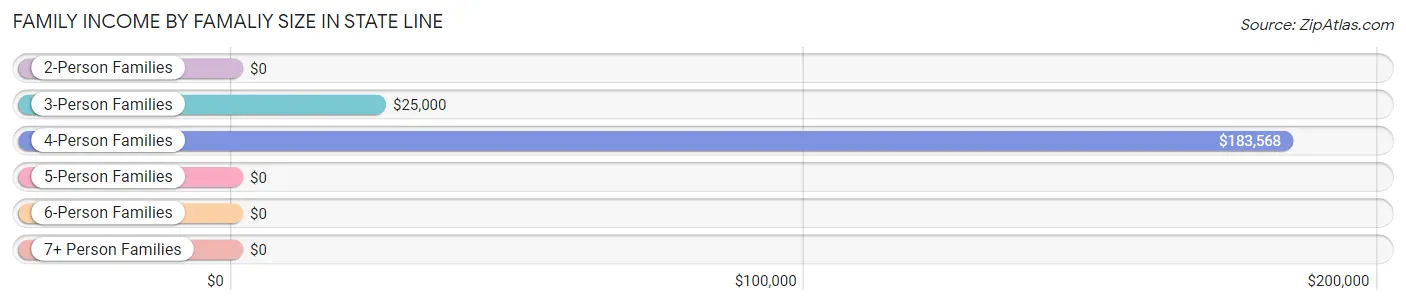
| Income Bracket | # Families | Median Income |
| 2-Person Families | 42 (25.6%) | $0 |
| 3-Person Families | 44 (26.8%) | $25,000 |
| 4-Person Families | 63 (38.4%) | $183,568 |
| 5-Person Families | 11 (6.7%) | $0 |
| 6-Person Families | 4 (2.4%) | $0 |
| 7+ Person Families | 0 (0.0%) | $0 |
| Total | 164 (100.0%) | $0 |
Family Income by Number of Earners in State Line
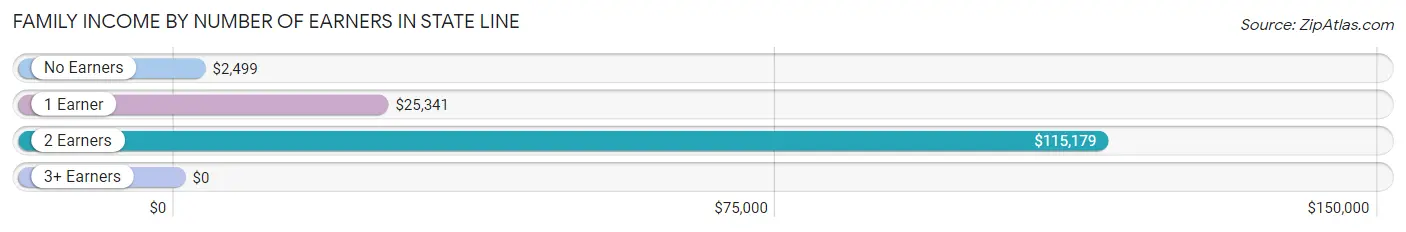
| Number of Earners | # Families | Median Income |
| No Earners | 31 (18.9%) | $2,499 |
| 1 Earner | 57 (34.8%) | $25,341 |
| 2 Earners | 13 (7.9%) | $115,179 |
| 3+ Earners | 63 (38.4%) | $0 |
| Total | 164 (100.0%) | $0 |
Household Income in State Line
Household Income Brackets in State Line
With 126 households falling in the category, the less than $10,000 income range is the most frequent in State Line, accounting for 41.4% of all households.
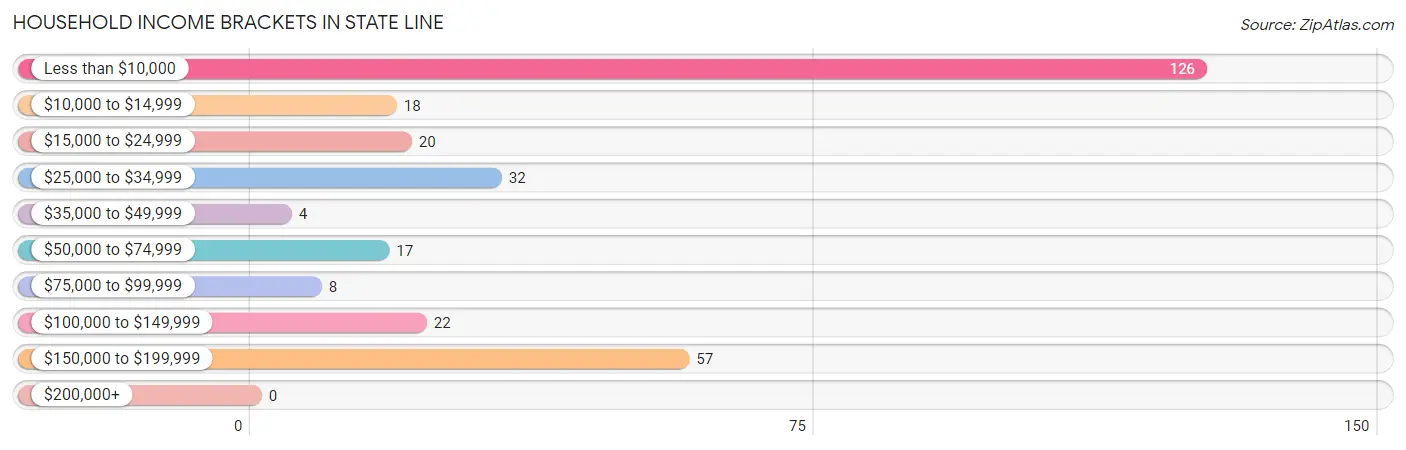
| Income Bracket | # Households | % Households |
| Less than $10,000 | 126 | 41.4% |
| $10,000 to $14,999 | 18 | 5.9% |
| $15,000 to $24,999 | 20 | 6.6% |
| $25,000 to $34,999 | 32 | 10.5% |
| $35,000 to $49,999 | 4 | 1.3% |
| $50,000 to $74,999 | 17 | 5.6% |
| $75,000 to $99,999 | 8 | 2.6% |
| $100,000 to $149,999 | 22 | 7.2% |
| $150,000 to $199,999 | 57 | 18.8% |
| $200,000+ | 0 | 0.0% |
Household Income by Householder Age in State Line
The median household income in State Line is $0, with the highest median household income of $19,688 found in the 45 to 64 years age bracket for the primary householder. A total of 81 households (26.6%) fall into this category. Meanwhile, the 15 to 24 years age bracket for the primary householder has the lowest median household income of $0, with 5 households (1.6%) in this group.
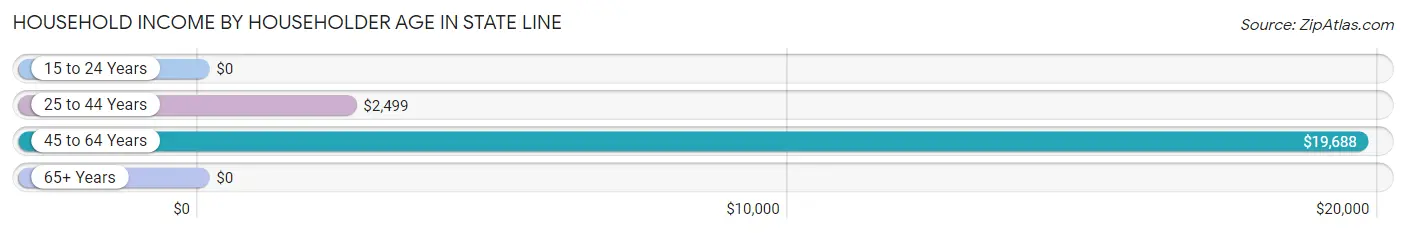
| Income Bracket | # Households | Median Income |
| 15 to 24 Years | 5 (1.6%) | $0 |
| 25 to 44 Years | 193 (63.5%) | $2,499 |
| 45 to 64 Years | 81 (26.6%) | $19,688 |
| 65+ Years | 25 (8.2%) | $0 |
| Total | 304 (100.0%) | $0 |
Poverty in State Line
Income Below Poverty by Sex and Age in State Line
With 49.7% poverty level for males and 26.3% for females among the residents of State Line, 25 to 34 year old males and 45 to 54 year old females are the most vulnerable to poverty, with 99 males (87.6%) and 63 females (88.7%) in their respective age groups living below the poverty level.
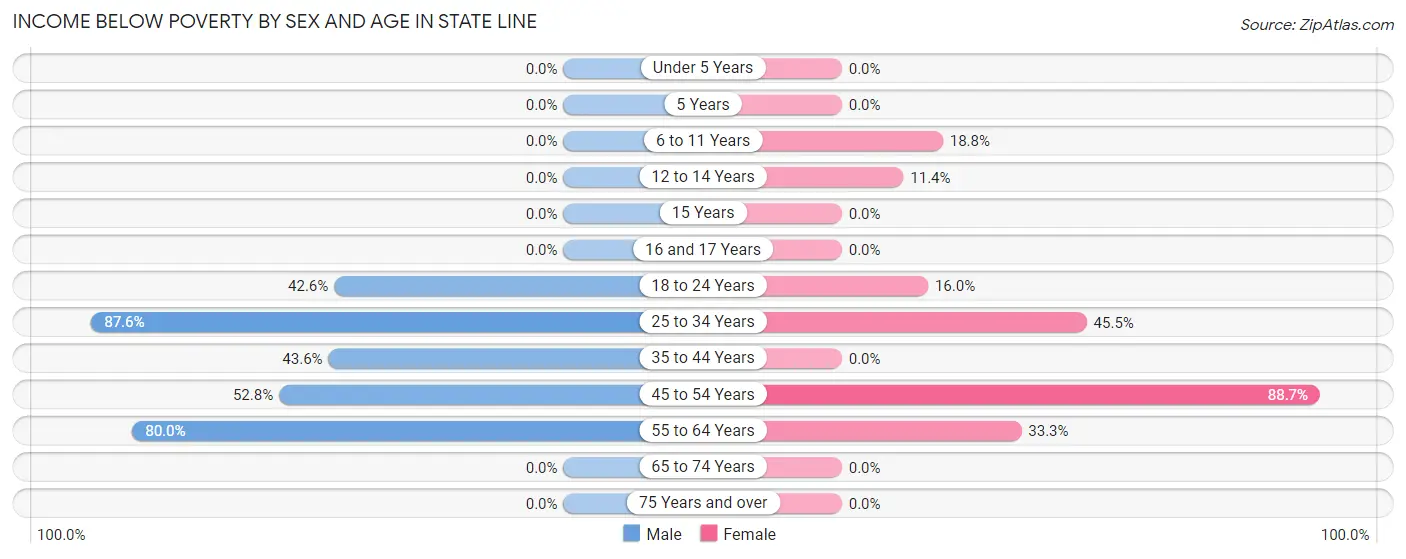
| Age Bracket | Male | Female |
| Under 5 Years | 0 (0.0%) | 0 (0.0%) |
| 5 Years | 0 (0.0%) | 0 (0.0%) |
| 6 to 11 Years | 0 (0.0%) | 3 (18.8%) |
| 12 to 14 Years | 0 (0.0%) | 4 (11.4%) |
| 15 Years | 0 (0.0%) | 0 (0.0%) |
| 16 and 17 Years | 0 (0.0%) | 0 (0.0%) |
| 18 to 24 Years | 40 (42.5%) | 8 (16.0%) |
| 25 to 34 Years | 99 (87.6%) | 10 (45.5%) |
| 35 to 44 Years | 58 (43.6%) | 0 (0.0%) |
| 45 to 54 Years | 19 (52.8%) | 63 (88.7%) |
| 55 to 64 Years | 16 (80.0%) | 6 (33.3%) |
| 65 to 74 Years | 0 (0.0%) | 0 (0.0%) |
| 75 Years and over | 0 (0.0%) | 0 (0.0%) |
| Total | 232 (49.7%) | 94 (26.3%) |
Income Above Poverty by Sex and Age in State Line
According to the poverty statistics in State Line, males aged under 5 years and females aged under 5 years are the age groups that are most secure financially, with 100.0% of males and 100.0% of females in these age groups living above the poverty line.
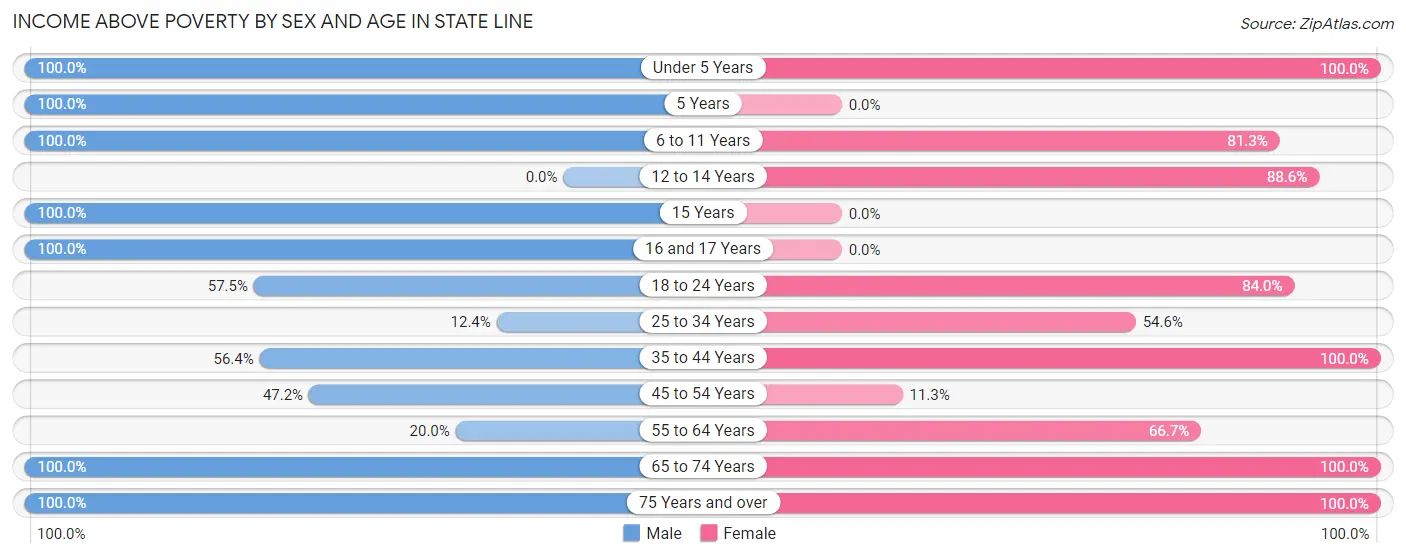
| Age Bracket | Male | Female |
| Under 5 Years | 10 (100.0%) | 46 (100.0%) |
| 5 Years | 10 (100.0%) | 0 (0.0%) |
| 6 to 11 Years | 15 (100.0%) | 13 (81.2%) |
| 12 to 14 Years | 0 (0.0%) | 31 (88.6%) |
| 15 Years | 7 (100.0%) | 0 (0.0%) |
| 16 and 17 Years | 10 (100.0%) | 0 (0.0%) |
| 18 to 24 Years | 54 (57.5%) | 42 (84.0%) |
| 25 to 34 Years | 14 (12.4%) | 12 (54.5%) |
| 35 to 44 Years | 75 (56.4%) | 78 (100.0%) |
| 45 to 54 Years | 17 (47.2%) | 8 (11.3%) |
| 55 to 64 Years | 4 (20.0%) | 12 (66.7%) |
| 65 to 74 Years | 15 (100.0%) | 13 (100.0%) |
| 75 Years and over | 4 (100.0%) | 8 (100.0%) |
| Total | 235 (50.3%) | 263 (73.7%) |
Income Below Poverty Among Married-Couple Families in State Line
The poverty statistics for married-couple families in State Line show that 13.0% or 15 of the total 115 families live below the poverty line. Families with no children have the highest poverty rate of 15.1%, comprising of 13 families. On the other hand, families with 3 or 4 children have the lowest poverty rate of 0.0%, which includes 0 families.
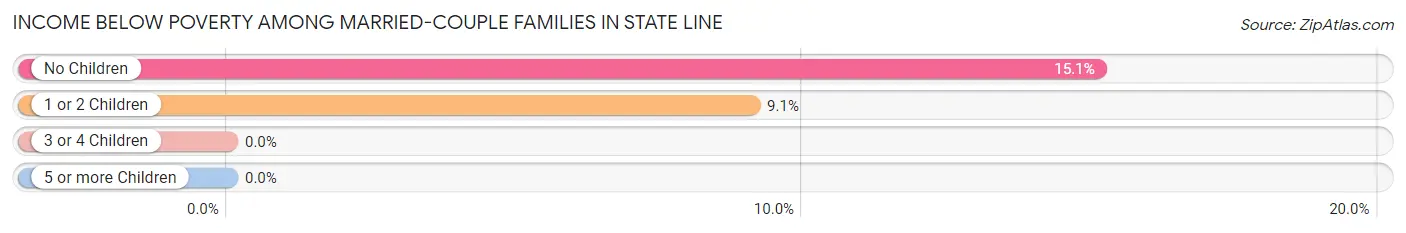
| Children | Above Poverty | Below Poverty |
| No Children | 73 (84.9%) | 13 (15.1%) |
| 1 or 2 Children | 20 (90.9%) | 2 (9.1%) |
| 3 or 4 Children | 7 (100.0%) | 0 (0.0%) |
| 5 or more Children | 0 (0.0%) | 0 (0.0%) |
| Total | 100 (87.0%) | 15 (13.0%) |
Income Below Poverty Among Single-Parent Households in State Line
According to the poverty data in State Line, 100.0% or 14 single-father households and 40.0% or 14 single-mother households are living below the poverty line. Among single-father households, those with no children have the highest poverty rate, with 14 households (100.0%) experiencing poverty. Likewise, among single-mother households, those with no children have the highest poverty rate, with 11 households (91.7%) falling below the poverty line.
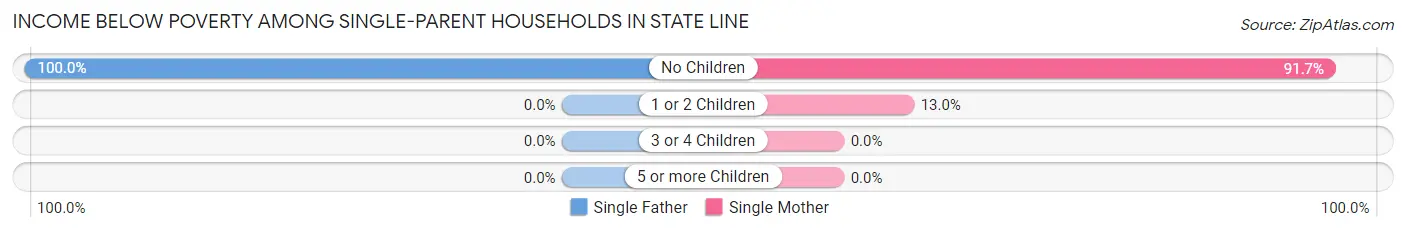
| Children | Single Father | Single Mother |
| No Children | 14 (100.0%) | 11 (91.7%) |
| 1 or 2 Children | 0 (0.0%) | 3 (13.0%) |
| 3 or 4 Children | 0 (0.0%) | 0 (0.0%) |
| 5 or more Children | 0 (0.0%) | 0 (0.0%) |
| Total | 14 (100.0%) | 14 (40.0%) |
Income Below Poverty Among Married-Couple vs Single-Parent Households in State Line
The poverty data for State Line shows that 15 of the married-couple family households (13.0%) and 28 of the single-parent households (57.1%) are living below the poverty level. Within the married-couple family households, those with no children have the highest poverty rate, with 13 households (15.1%) falling below the poverty line. Among the single-parent households, those with no children have the highest poverty rate, with 25 household (96.2%) living below poverty.
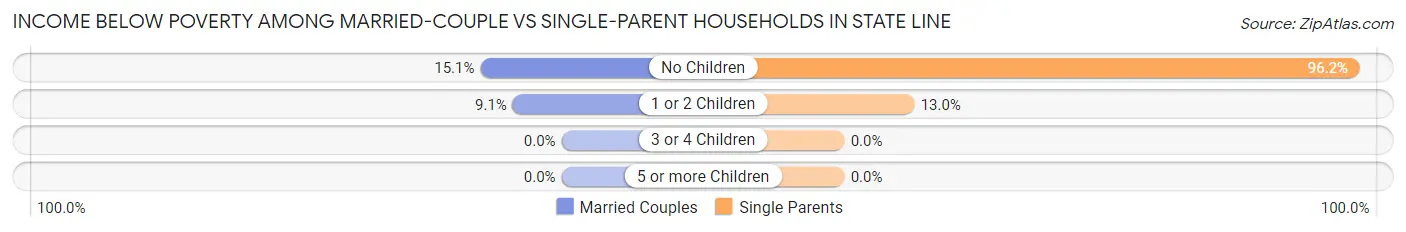
| Children | Married-Couple Families | Single-Parent Households |
| No Children | 13 (15.1%) | 25 (96.2%) |
| 1 or 2 Children | 2 (9.1%) | 3 (13.0%) |
| 3 or 4 Children | 0 (0.0%) | 0 (0.0%) |
| 5 or more Children | 0 (0.0%) | 0 (0.0%) |
| Total | 15 (13.0%) | 28 (57.1%) |
Race in State Line
The most populous races in State Line are Black / African American (443 | 53.8%), and White / Caucasian (381 | 46.2%).
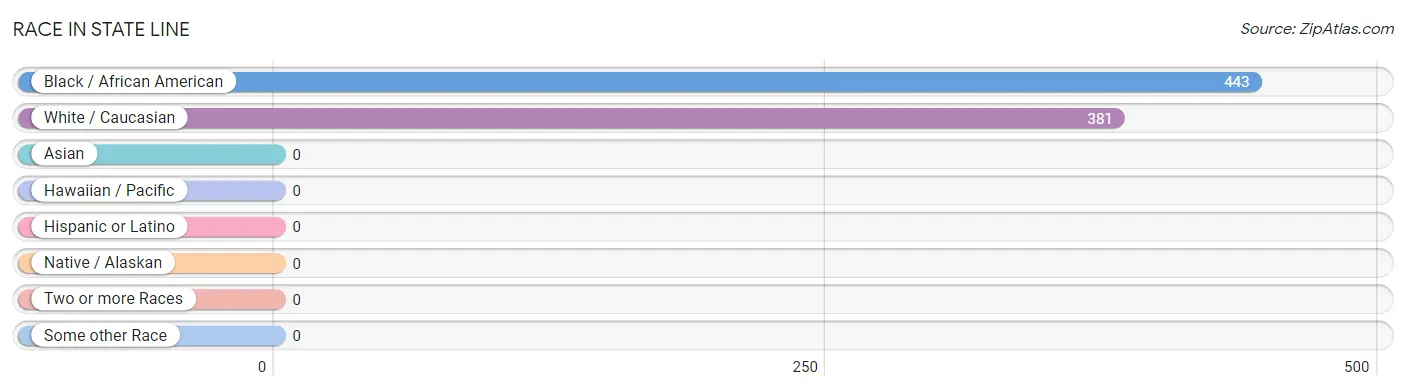
| Race | # Population | % Population |
| Asian | 0 | 0.0% |
| Black / African American | 443 | 53.8% |
| Hawaiian / Pacific | 0 | 0.0% |
| Hispanic or Latino | 0 | 0.0% |
| Native / Alaskan | 0 | 0.0% |
| White / Caucasian | 381 | 46.2% |
| Two or more Races | 0 | 0.0% |
| Some other Race | 0 | 0.0% |
| Total | 824 | 100.0% |
Ancestry in State Line
The most populous ancestries reported in State Line are English (256 | 31.1%), African (22 | 2.7%), Subsaharan African (22 | 2.7%), Irish (12 | 1.5%), and German (8 | 1.0%), together accounting for 38.8% of all State Line residents.
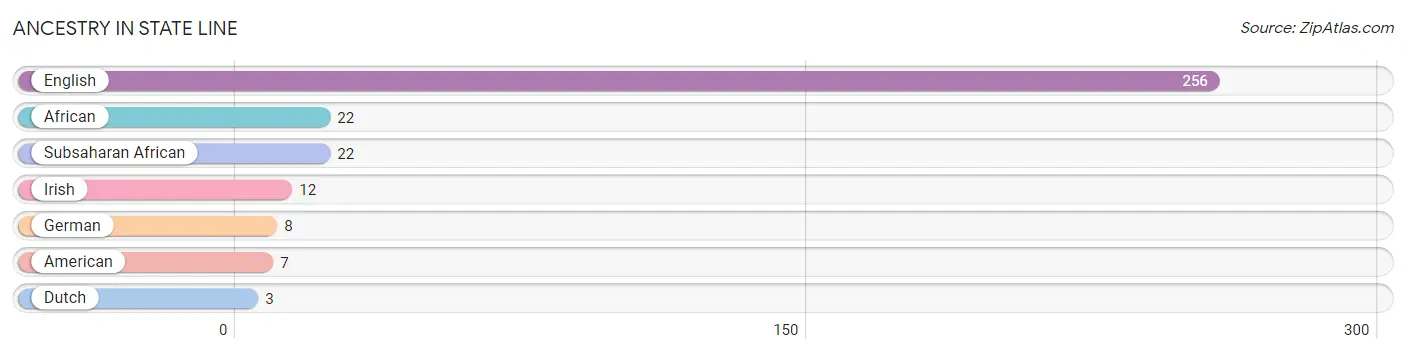
| Ancestry | # Population | % Population |
| African | 22 | 2.7% |
| American | 7 | 0.9% |
| Dutch | 3 | 0.4% |
| English | 256 | 31.1% |
| German | 8 | 1.0% |
| Irish | 12 | 1.5% |
| Subsaharan African | 22 | 2.7% | View All 7 Rows |
Immigrants in State Line

| Immigration Origin | # Population | % Population | View All 0 Rows |
Sex and Age in State Line
Sex and Age in State Line
The most populous age groups in State Line are 40 to 44 Years (130 | 27.8%) for men and 40 to 44 Years (64 | 17.9%) for women.
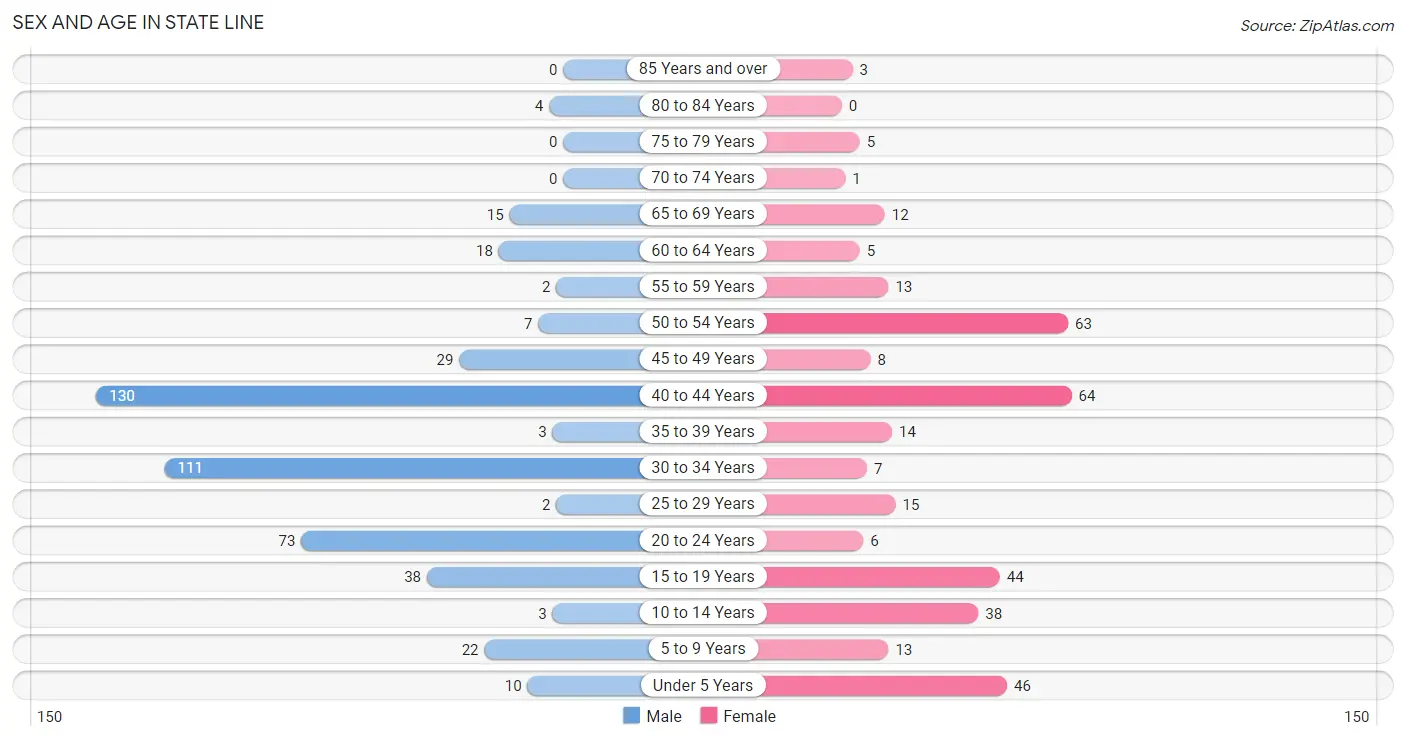
| Age Bracket | Male | Female |
| Under 5 Years | 10 (2.1%) | 46 (12.9%) |
| 5 to 9 Years | 22 (4.7%) | 13 (3.6%) |
| 10 to 14 Years | 3 (0.6%) | 38 (10.6%) |
| 15 to 19 Years | 38 (8.1%) | 44 (12.3%) |
| 20 to 24 Years | 73 (15.6%) | 6 (1.7%) |
| 25 to 29 Years | 2 (0.4%) | 15 (4.2%) |
| 30 to 34 Years | 111 (23.8%) | 7 (2.0%) |
| 35 to 39 Years | 3 (0.6%) | 14 (3.9%) |
| 40 to 44 Years | 130 (27.8%) | 64 (17.9%) |
| 45 to 49 Years | 29 (6.2%) | 8 (2.2%) |
| 50 to 54 Years | 7 (1.5%) | 63 (17.6%) |
| 55 to 59 Years | 2 (0.4%) | 13 (3.6%) |
| 60 to 64 Years | 18 (3.8%) | 5 (1.4%) |
| 65 to 69 Years | 15 (3.2%) | 12 (3.4%) |
| 70 to 74 Years | 0 (0.0%) | 1 (0.3%) |
| 75 to 79 Years | 0 (0.0%) | 5 (1.4%) |
| 80 to 84 Years | 4 (0.9%) | 0 (0.0%) |
| 85 Years and over | 0 (0.0%) | 3 (0.8%) |
| Total | 467 (100.0%) | 357 (100.0%) |
Families and Households in State Line
Median Family Size in State Line
The median family size in State Line is 4.17 persons per family, with single male/father families (14 | 8.5%) accounting for the largest median family size of 4.86 persons per family. On the other hand, single female/mother families (35 | 21.3%) represent the smallest median family size with 3.89 persons per family.
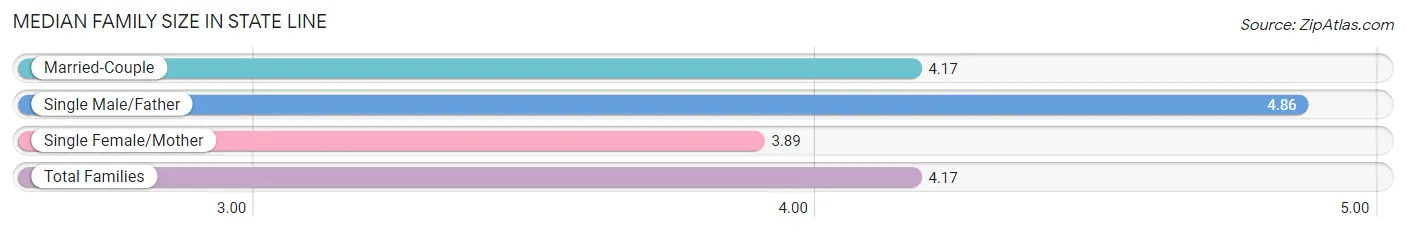
| Family Type | # Families | Family Size |
| Married-Couple | 115 (70.1%) | 4.17 |
| Single Male/Father | 14 (8.5%) | 4.86 |
| Single Female/Mother | 35 (21.3%) | 3.89 |
| Total Families | 164 (100.0%) | 4.17 |
Median Household Size in State Line
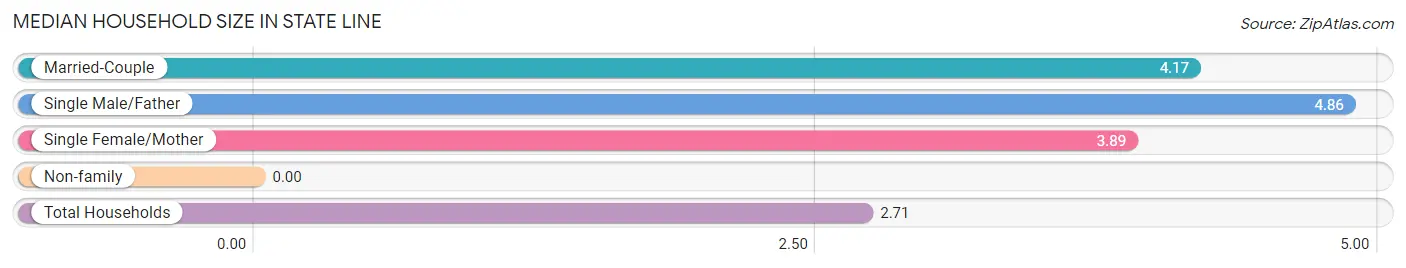
| Household Type | # Households | Household Size |
| Married-Couple | 115 (37.8%) | 4.17 |
| Single Male/Father | 14 (4.6%) | 4.86 |
| Single Female/Mother | 35 (11.5%) | 3.89 |
| Non-family | 140 (46.1%) | - |
| Total Households | 304 (100.0%) | 2.71 |
Household Size by Marriage Status in State Line
Out of a total of 304 households in State Line, 164 (53.9%) are family households, while 140 (46.1%) are nonfamily households. The most numerous type of family households are 4-person households, comprising 63, and the most common type of nonfamily households are 1-person households, comprising 140.
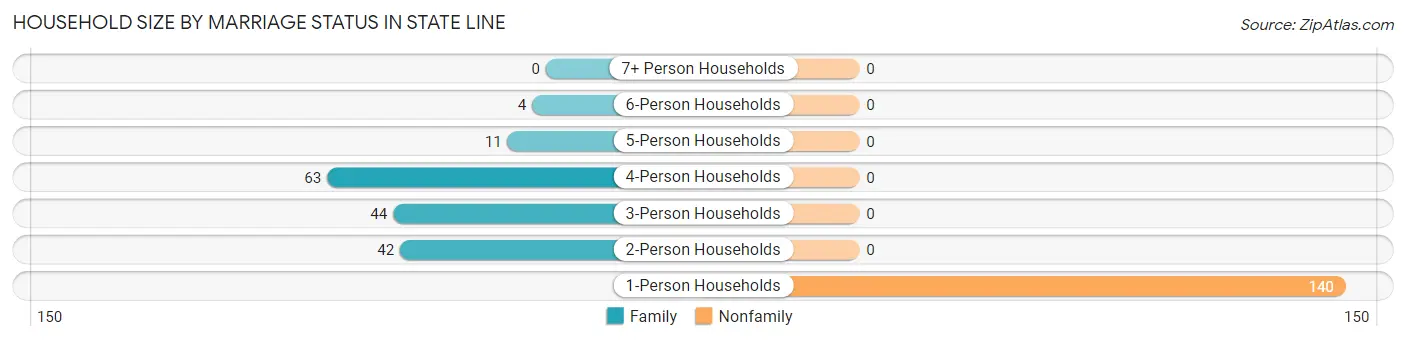
| Household Size | Family Households | Nonfamily Households |
| 1-Person Households | - | 140 (46.1%) |
| 2-Person Households | 42 (13.8%) | 0 (0.0%) |
| 3-Person Households | 44 (14.5%) | 0 (0.0%) |
| 4-Person Households | 63 (20.7%) | 0 (0.0%) |
| 5-Person Households | 11 (3.6%) | 0 (0.0%) |
| 6-Person Households | 4 (1.3%) | 0 (0.0%) |
| 7+ Person Households | 0 (0.0%) | 0 (0.0%) |
| Total | 164 (53.9%) | 140 (46.1%) |
Female Fertility in State Line
Fertility by Age in State Line
Average fertility rate in State Line is 25.0 births per 1,000 women. Women in the age bracket of 20 to 34 years have the highest fertility rate with 143.0 births per 1,000 women. Women in the age bracket of 20 to 34 years acount for 100.0% of all women with births.
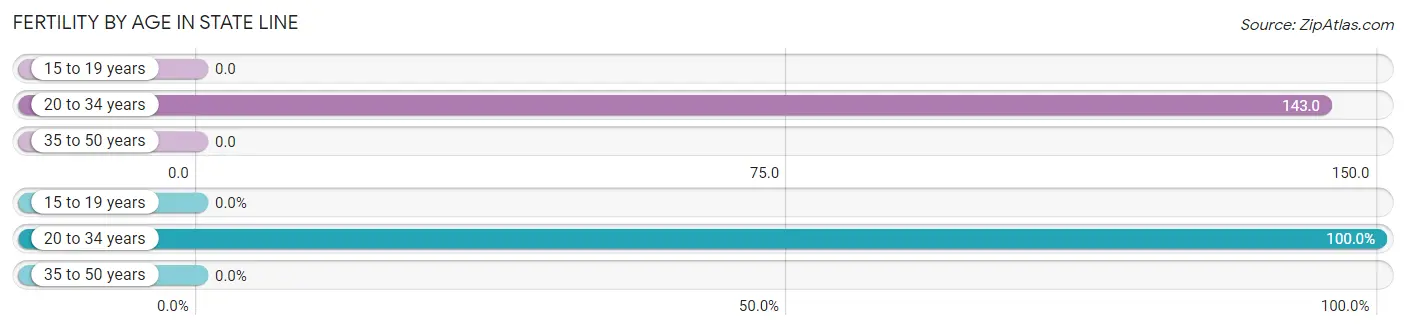
| Age Bracket | Women with Births | Births / 1,000 Women |
| 15 to 19 years | 0 (0.0%) | 0.0 |
| 20 to 34 years | 4 (100.0%) | 143.0 |
| 35 to 50 years | 0 (0.0%) | 0.0 |
| Total | 4 (100.0%) | 25.0 |
Fertility by Age by Marriage Status in State Line
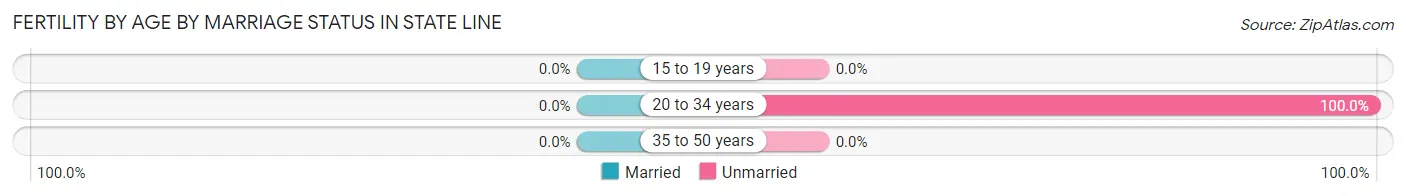
| Age Bracket | Married | Unmarried |
| 15 to 19 years | 0 (0.0%) | 0 (0.0%) |
| 20 to 34 years | 0 (0.0%) | 4 (100.0%) |
| 35 to 50 years | 0 (0.0%) | 0 (0.0%) |
| Total | 0 (0.0%) | 4 (100.0%) |
Fertility by Education in State Line
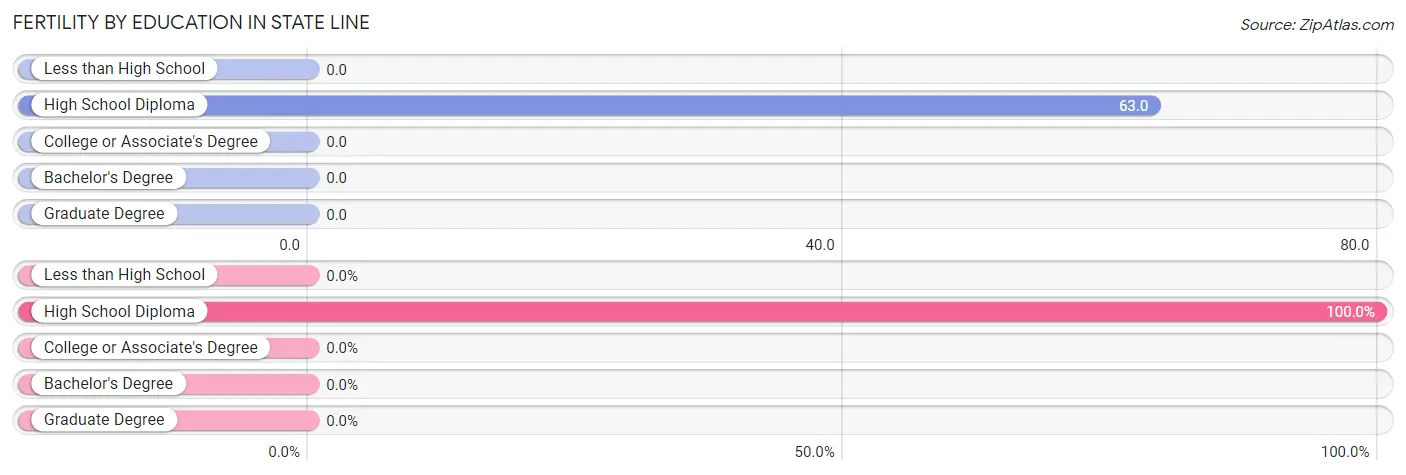
| Educational Attainment | Women with Births | Births / 1,000 Women |
| Less than High School | 0 (0.0%) | 0.0 |
| High School Diploma | 4 (100.0%) | 63.0 |
| College or Associate's Degree | 0 (0.0%) | 0.0 |
| Bachelor's Degree | 0 (0.0%) | 0.0 |
| Graduate Degree | 0 (0.0%) | 0.0 |
| Total | 4 (100.0%) | 25.0 |
Fertility by Education by Marriage Status in State Line
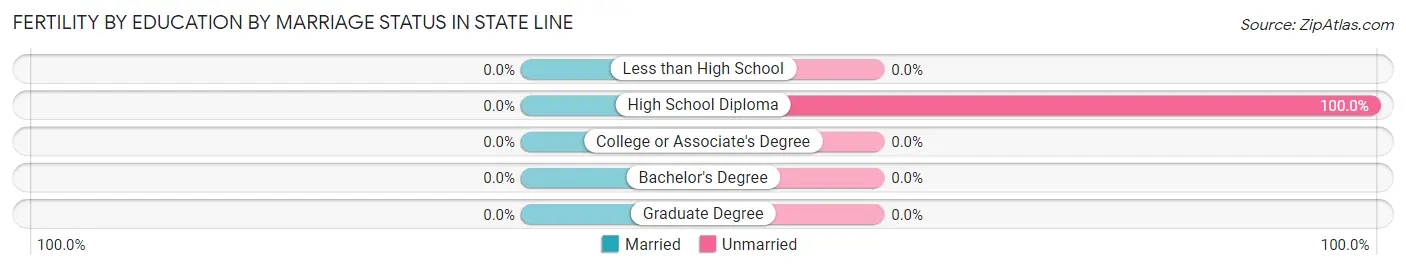
| Educational Attainment | Married | Unmarried |
| Less than High School | 0 (0.0%) | 0 (0.0%) |
| High School Diploma | 0 (0.0%) | 4 (100.0%) |
| College or Associate's Degree | 0 (0.0%) | 0 (0.0%) |
| Bachelor's Degree | 0 (0.0%) | 0 (0.0%) |
| Graduate Degree | 0 (0.0%) | 0 (0.0%) |
| Total | 0 (0.0%) | 4 (100.0%) |
Employment Characteristics in State Line
Employment by Class of Employer in State Line
Among the 204 employed individuals in State Line, private company employees (160 | 78.4%), state government employees (20 | 9.8%), and self-employed (not incorporated) (14 | 6.9%) make up the most common classes of employment.
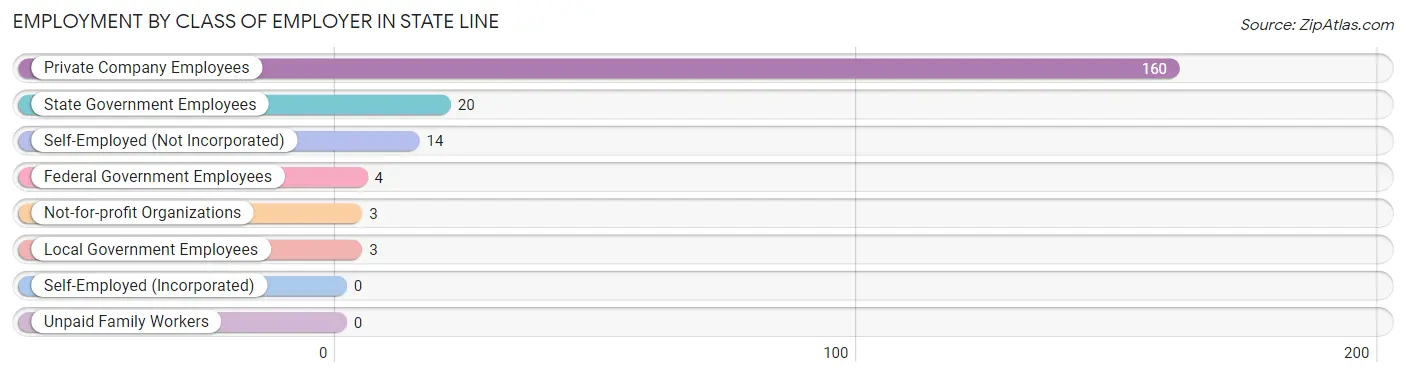
| Employer Class | # Employees | % Employees |
| Private Company Employees | 160 | 78.4% |
| Self-Employed (Incorporated) | 0 | 0.0% |
| Self-Employed (Not Incorporated) | 14 | 6.9% |
| Not-for-profit Organizations | 3 | 1.5% |
| Local Government Employees | 3 | 1.5% |
| State Government Employees | 20 | 9.8% |
| Federal Government Employees | 4 | 2.0% |
| Unpaid Family Workers | 0 | 0.0% |
| Total | 204 | 100.0% |
Employment Status by Age in State Line
According to the labor force statistics for State Line, out of the total population over 16 years of age (685), 56.4% or 386 individuals are in the labor force, with 40.4% or 156 of them unemployed. The age group with the highest labor force participation rate is 30 to 34 years, with 100.0% or 118 individuals in the labor force. Within the labor force, the 30 to 34 years age range has the highest percentage of unemployed individuals, with 83.9% or 99 of them being unemployed.
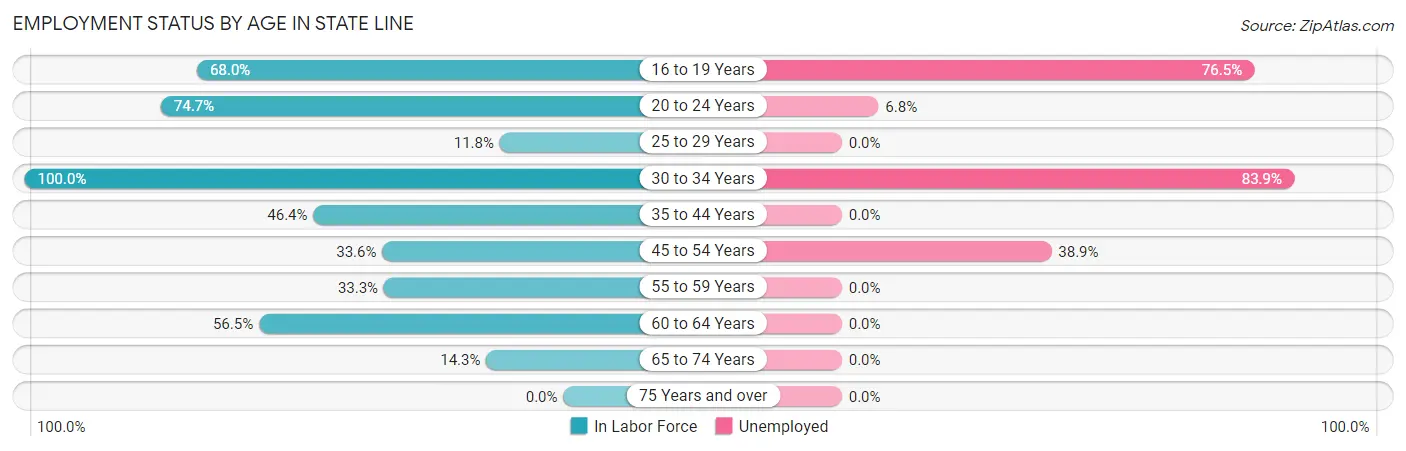
| Age Bracket | In Labor Force | Unemployed |
| 16 to 19 Years | 51 (68.0%) | 39 (76.5%) |
| 20 to 24 Years | 59 (74.7%) | 4 (6.8%) |
| 25 to 29 Years | 2 (11.8%) | 0 (0.0%) |
| 30 to 34 Years | 118 (100.0%) | 99 (83.9%) |
| 35 to 44 Years | 98 (46.4%) | 0 (0.0%) |
| 45 to 54 Years | 36 (33.6%) | 14 (38.9%) |
| 55 to 59 Years | 5 (33.3%) | 0 (0.0%) |
| 60 to 64 Years | 13 (56.5%) | 0 (0.0%) |
| 65 to 74 Years | 4 (14.3%) | 0 (0.0%) |
| 75 Years and over | 0 (0.0%) | 0 (0.0%) |
| Total | 386 (56.4%) | 156 (40.4%) |
Employment Status by Educational Attainment in State Line
According to labor force statistics for State Line, 55.4% of individuals (272) out of the total population between 25 and 64 years of age (491) are in the labor force, with 41.5% or 113 of them being unemployed. The group with the highest labor force participation rate are those with the educational attainment of bachelor's degree or higher, with 100.0% or 15 individuals in the labor force. Within the labor force, individuals with high school diploma education have the highest percentage of unemployment, with 75.3% or 113 of them being unemployed.
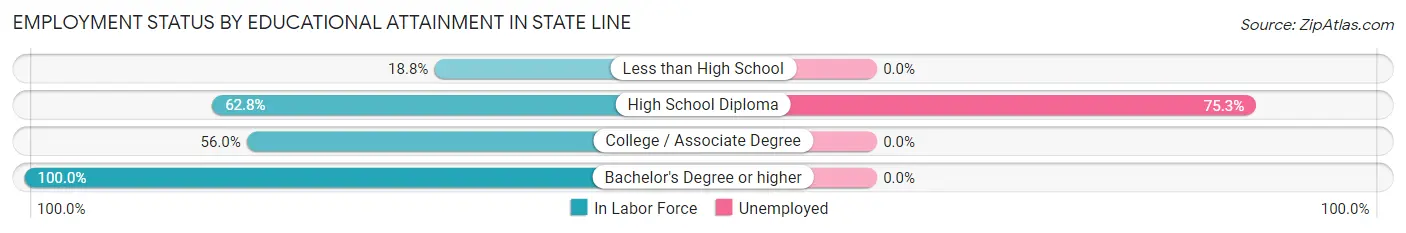
| Educational Attainment | In Labor Force | Unemployed |
| Less than High School | 13 (18.8%) | 0 (0.0%) |
| High School Diploma | 150 (62.8%) | 180 (75.3%) |
| College / Associate Degree | 94 (56.0%) | 0 (0.0%) |
| Bachelor's Degree or higher | 15 (100.0%) | 0 (0.0%) |
| Total | 272 (55.4%) | 204 (41.5%) |
Employment Occupations by Sex in State Line
Management, Business, Science and Arts Occupations
The most common Management, Business, Science and Arts occupations in State Line are Community & Social Service (15 | 6.5%), Education Instruction & Library (10 | 4.3%), Education, Arts & Media (5 | 2.2%), Management (4 | 1.7%), and Health Diagnosing & Treating (3 | 1.3%).
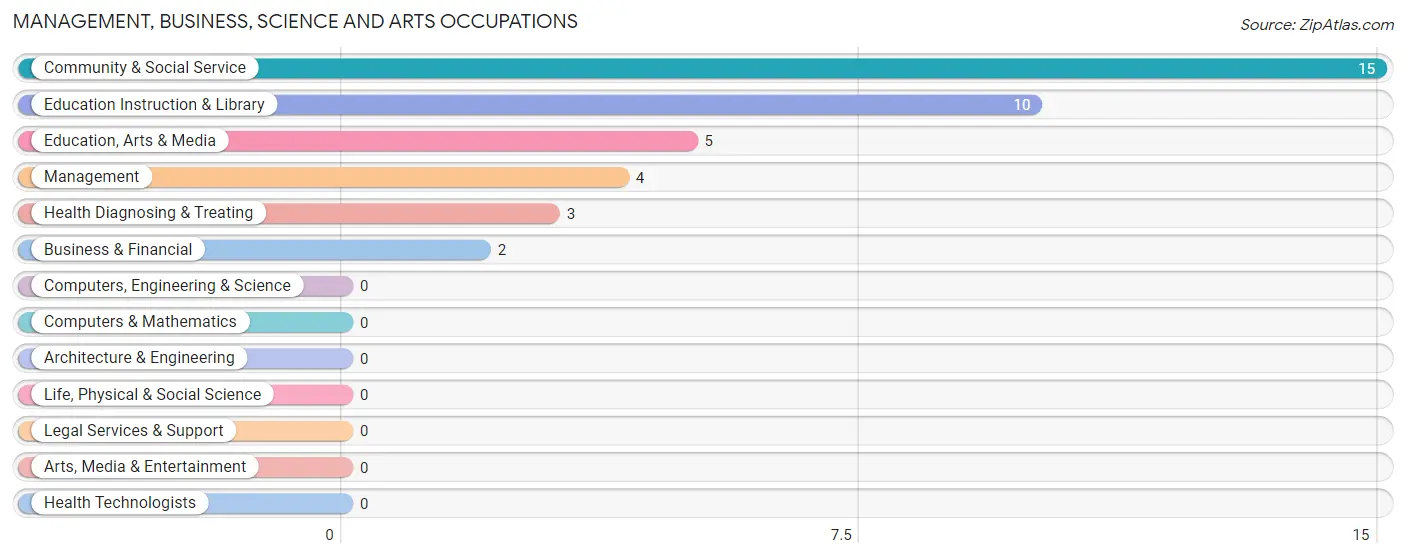
Management, Business, Science and Arts Occupations by Sex
Within the Management, Business, Science and Arts occupations in State Line, the most male-oriented occupations are Management (100.0%), Education, Arts & Media (60.0%), and Community & Social Service (20.0%), while the most female-oriented occupations are Business & Financial (100.0%), Education Instruction & Library (100.0%), and Health Diagnosing & Treating (100.0%).
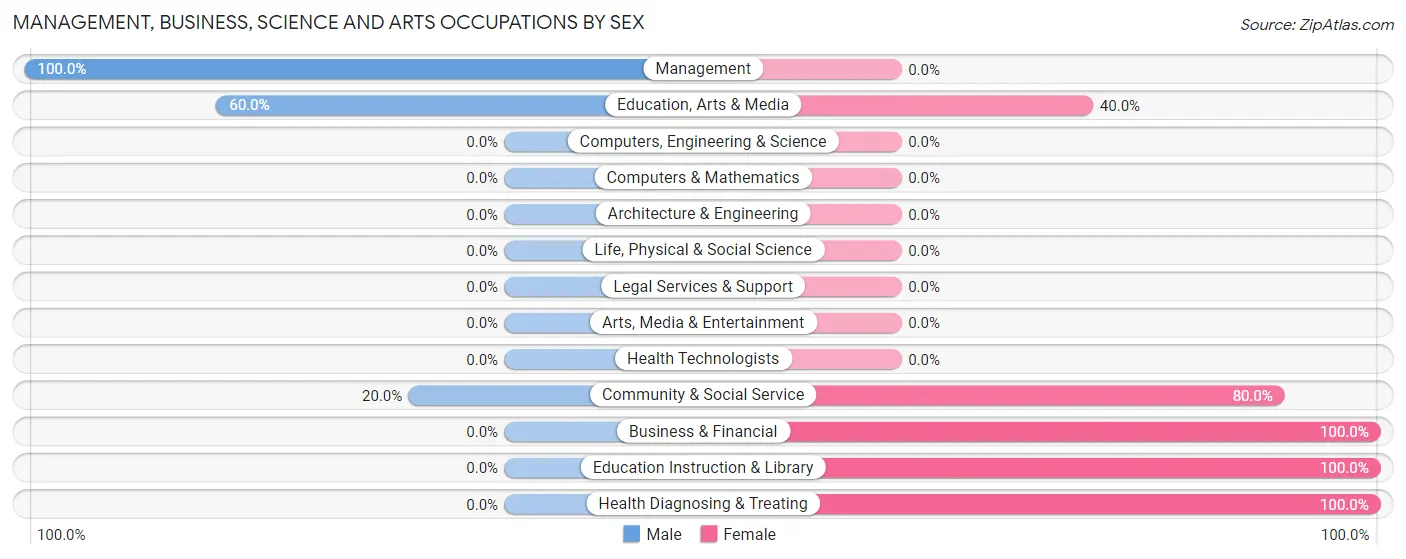
| Occupation | Male | Female |
| Management | 4 (100.0%) | 0 (0.0%) |
| Business & Financial | 0 (0.0%) | 2 (100.0%) |
| Computers, Engineering & Science | 0 (0.0%) | 0 (0.0%) |
| Computers & Mathematics | 0 (0.0%) | 0 (0.0%) |
| Architecture & Engineering | 0 (0.0%) | 0 (0.0%) |
| Life, Physical & Social Science | 0 (0.0%) | 0 (0.0%) |
| Community & Social Service | 3 (20.0%) | 12 (80.0%) |
| Education, Arts & Media | 3 (60.0%) | 2 (40.0%) |
| Legal Services & Support | 0 (0.0%) | 0 (0.0%) |
| Education Instruction & Library | 0 (0.0%) | 10 (100.0%) |
| Arts, Media & Entertainment | 0 (0.0%) | 0 (0.0%) |
| Health Diagnosing & Treating | 0 (0.0%) | 3 (100.0%) |
| Health Technologists | 0 (0.0%) | 0 (0.0%) |
| Total (Category) | 7 (29.2%) | 17 (70.8%) |
| Total (Overall) | 179 (77.8%) | 51 (22.2%) |
Services Occupations
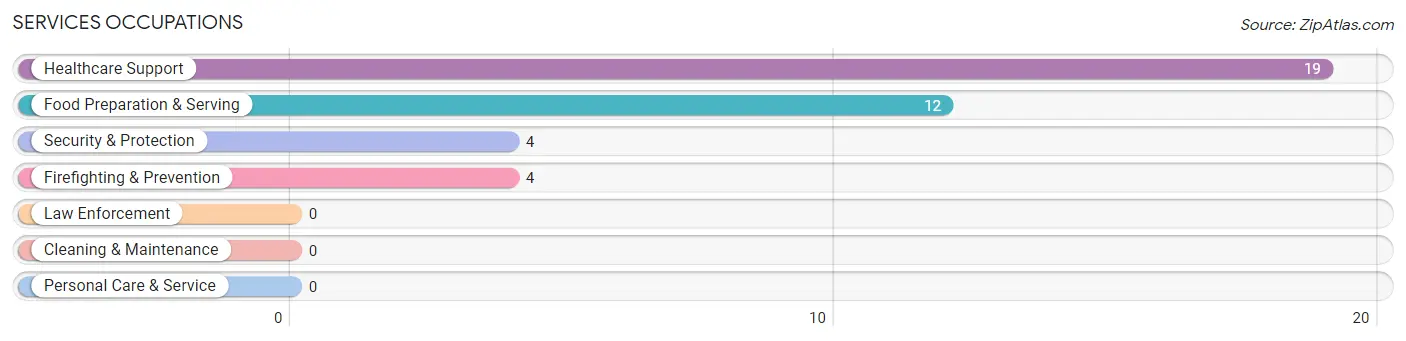
The most common Services occupations in State Line are Healthcare Support (19 | 8.3%), Food Preparation & Serving (12 | 5.2%), Security & Protection (4 | 1.7%), and Firefighting & Prevention (4 | 1.7%).
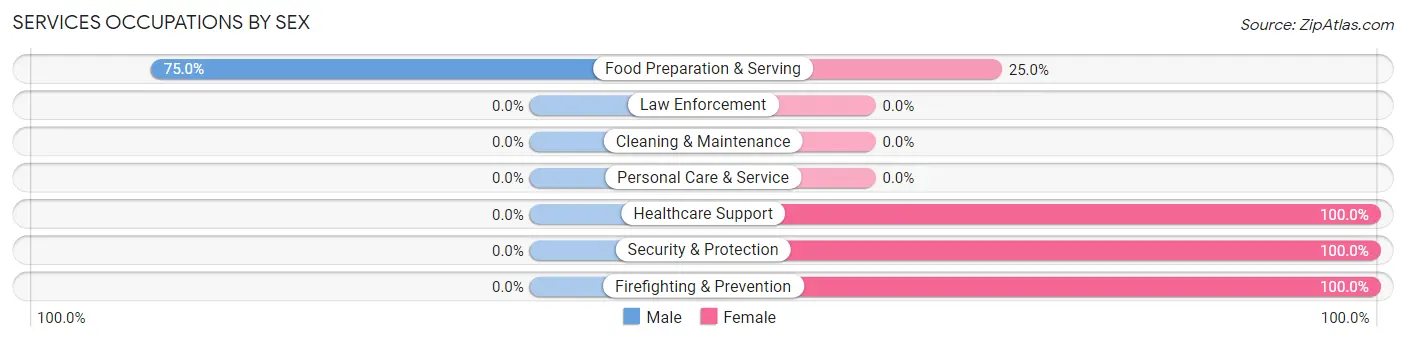
Services Occupations by Sex
| Occupation | Male | Female |
| Healthcare Support | 0 (0.0%) | 19 (100.0%) |
| Security & Protection | 0 (0.0%) | 4 (100.0%) |
| Firefighting & Prevention | 0 (0.0%) | 4 (100.0%) |
| Law Enforcement | 0 (0.0%) | 0 (0.0%) |
| Food Preparation & Serving | 9 (75.0%) | 3 (25.0%) |
| Cleaning & Maintenance | 0 (0.0%) | 0 (0.0%) |
| Personal Care & Service | 0 (0.0%) | 0 (0.0%) |
| Total (Category) | 9 (25.7%) | 26 (74.3%) |
| Total (Overall) | 179 (77.8%) | 51 (22.2%) |
Sales and Office Occupations
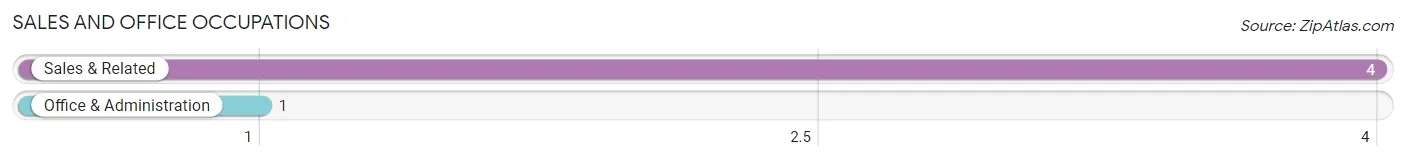
The most common Sales and Office occupations in State Line are Sales & Related (4 | 1.7%), and Office & Administration (1 | 0.4%).
Sales and Office Occupations by Sex
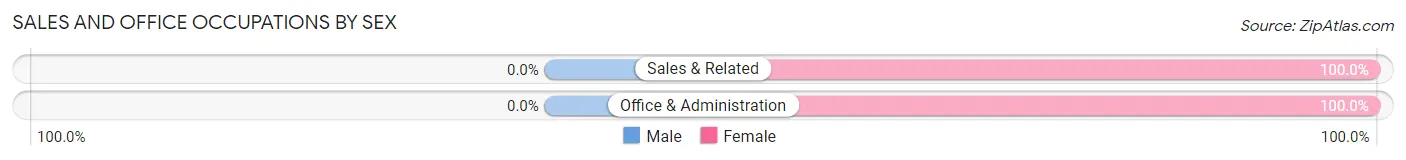
| Occupation | Male | Female |
| Sales & Related | 0 (0.0%) | 4 (100.0%) |
| Office & Administration | 0 (0.0%) | 1 (100.0%) |
| Total (Category) | 0 (0.0%) | 5 (100.0%) |
| Total (Overall) | 179 (77.8%) | 51 (22.2%) |
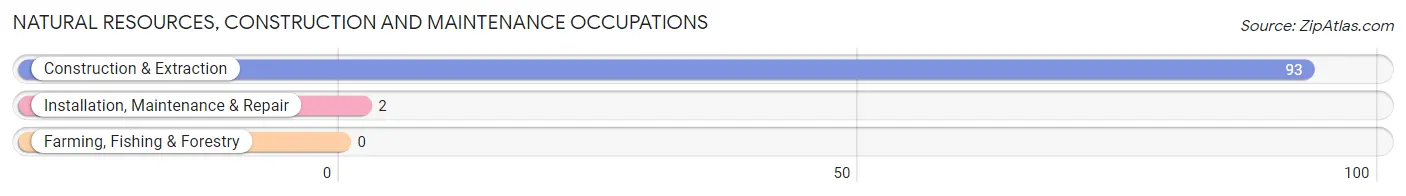
Natural Resources, Construction and Maintenance Occupations
The most common Natural Resources, Construction and Maintenance occupations in State Line are Construction & Extraction (93 | 40.4%), and Installation, Maintenance & Repair (2 | 0.9%).
Natural Resources, Construction and Maintenance Occupations by Sex
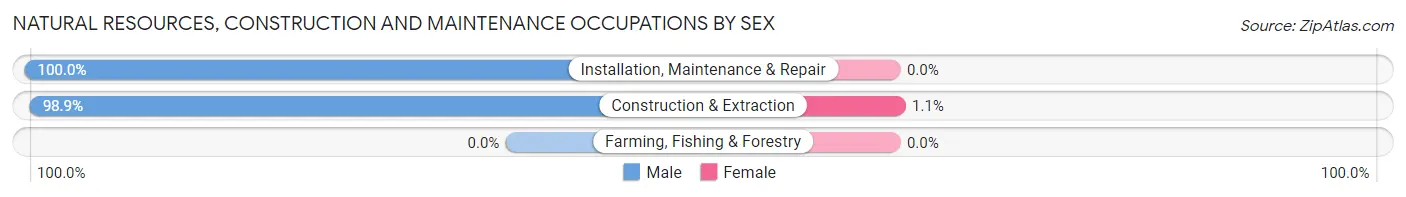
| Occupation | Male | Female |
| Farming, Fishing & Forestry | 0 (0.0%) | 0 (0.0%) |
| Construction & Extraction | 92 (98.9%) | 1 (1.1%) |
| Installation, Maintenance & Repair | 2 (100.0%) | 0 (0.0%) |
| Total (Category) | 94 (99.0%) | 1 (1.1%) |
| Total (Overall) | 179 (77.8%) | 51 (22.2%) |
Production, Transportation and Moving Occupations
The most common Production, Transportation and Moving occupations in State Line are Material Moving (30 | 13.0%), Transportation (29 | 12.6%), and Production (12 | 5.2%).
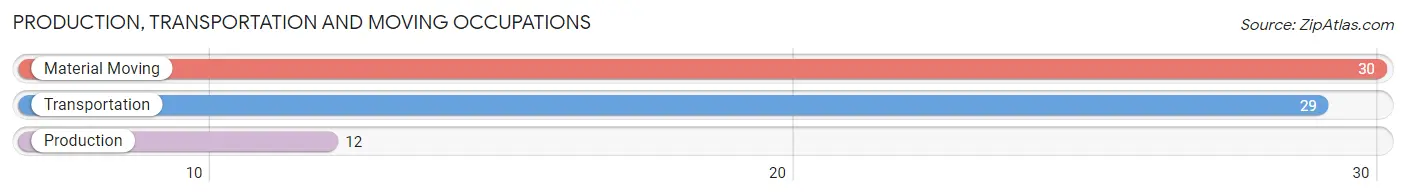
Production, Transportation and Moving Occupations by Sex
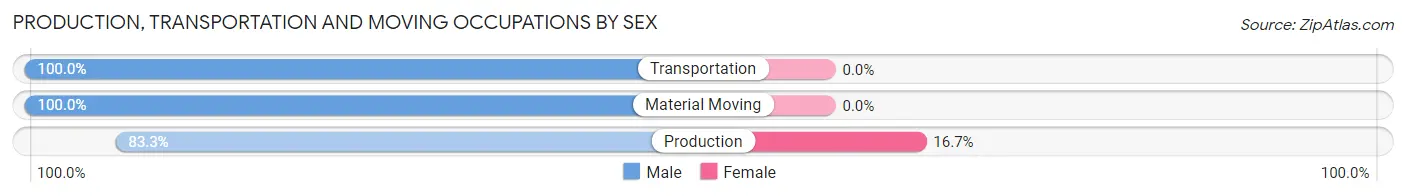
| Occupation | Male | Female |
| Production | 10 (83.3%) | 2 (16.7%) |
| Transportation | 29 (100.0%) | 0 (0.0%) |
| Material Moving | 30 (100.0%) | 0 (0.0%) |
| Total (Category) | 69 (97.2%) | 2 (2.8%) |
| Total (Overall) | 179 (77.8%) | 51 (22.2%) |
Employment Industries by Sex in State Line
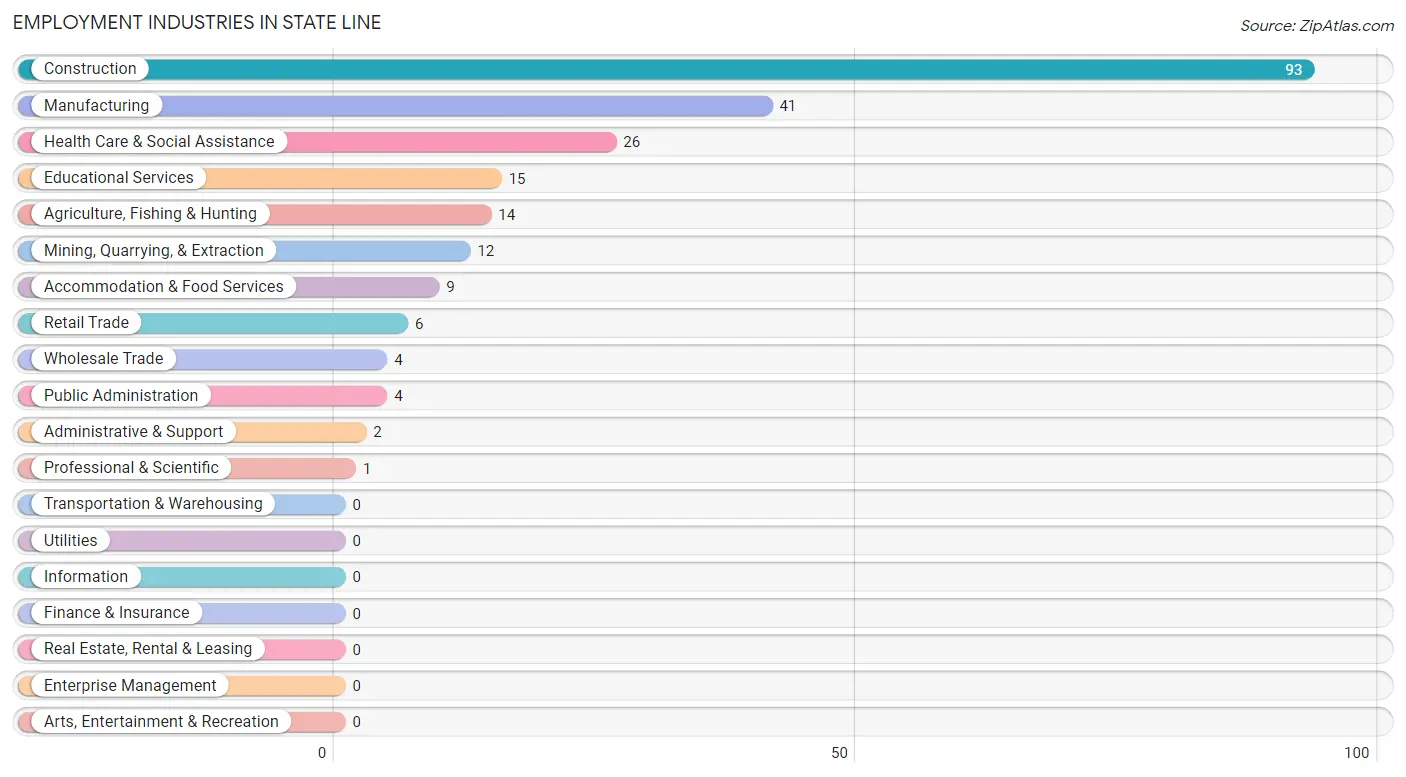
Employment Industries in State Line
The major employment industries in State Line include Construction (93 | 40.4%), Manufacturing (41 | 17.8%), Health Care & Social Assistance (26 | 11.3%), Educational Services (15 | 6.5%), and Agriculture, Fishing & Hunting (14 | 6.1%).
Employment Industries by Sex in State Line
The State Line industries that see more men than women are Agriculture, Fishing & Hunting (100.0%), Mining, Quarrying, & Extraction (100.0%), and Wholesale Trade (100.0%), whereas the industries that tend to have a higher number of women are Retail Trade (100.0%), Professional & Scientific (100.0%), and Educational Services (100.0%).
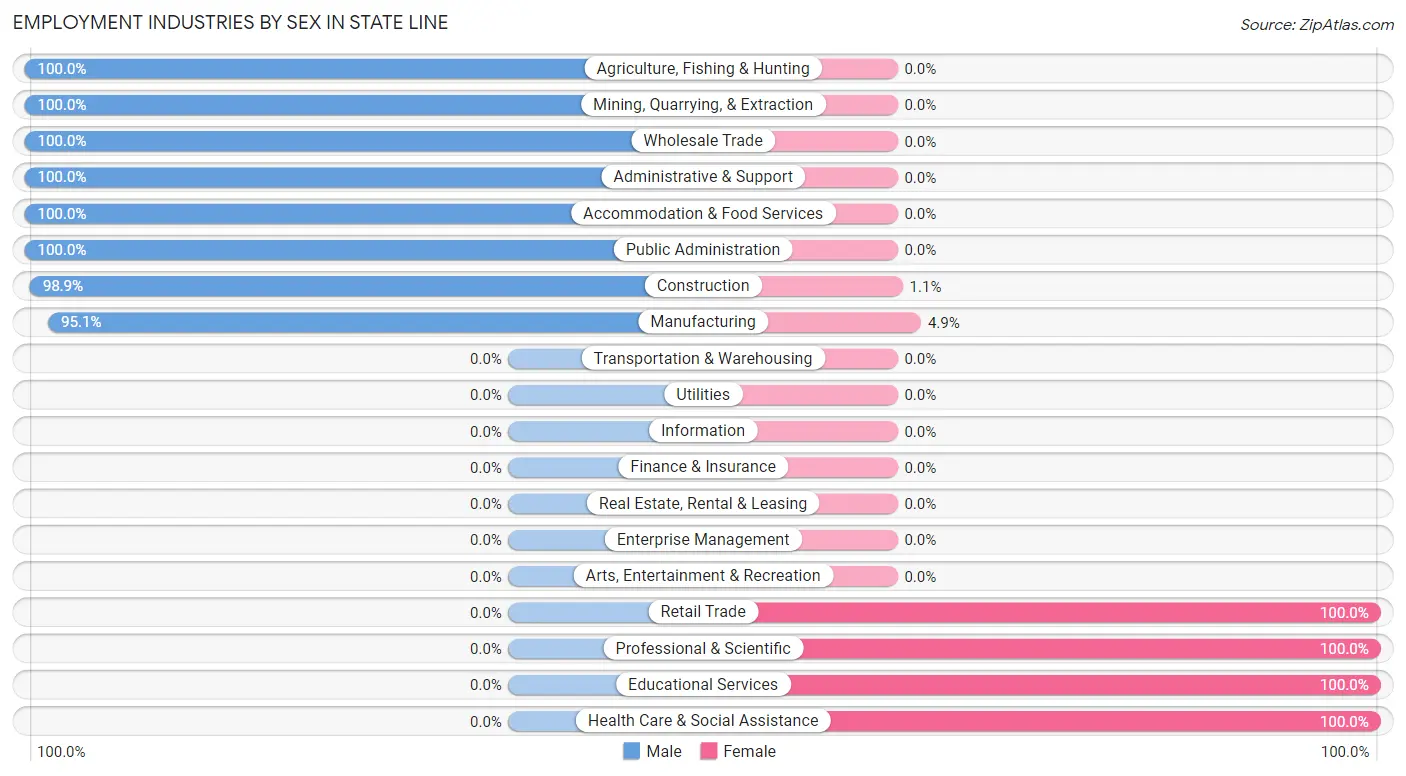
| Industry | Male | Female |
| Agriculture, Fishing & Hunting | 14 (100.0%) | 0 (0.0%) |
| Mining, Quarrying, & Extraction | 12 (100.0%) | 0 (0.0%) |
| Construction | 92 (98.9%) | 1 (1.1%) |
| Manufacturing | 39 (95.1%) | 2 (4.9%) |
| Wholesale Trade | 4 (100.0%) | 0 (0.0%) |
| Retail Trade | 0 (0.0%) | 6 (100.0%) |
| Transportation & Warehousing | 0 (0.0%) | 0 (0.0%) |
| Utilities | 0 (0.0%) | 0 (0.0%) |
| Information | 0 (0.0%) | 0 (0.0%) |
| Finance & Insurance | 0 (0.0%) | 0 (0.0%) |
| Real Estate, Rental & Leasing | 0 (0.0%) | 0 (0.0%) |
| Professional & Scientific | 0 (0.0%) | 1 (100.0%) |
| Enterprise Management | 0 (0.0%) | 0 (0.0%) |
| Administrative & Support | 2 (100.0%) | 0 (0.0%) |
| Educational Services | 0 (0.0%) | 15 (100.0%) |
| Health Care & Social Assistance | 0 (0.0%) | 26 (100.0%) |
| Arts, Entertainment & Recreation | 0 (0.0%) | 0 (0.0%) |
| Accommodation & Food Services | 9 (100.0%) | 0 (0.0%) |
| Public Administration | 4 (100.0%) | 0 (0.0%) |
| Total | 179 (77.8%) | 51 (22.2%) |
Education in State Line
School Enrollment in State Line
The most common levels of schooling among the 154 students in State Line are college / undergraduate (43 | 27.9%), middle school (38 | 24.7%), and elementary school (25 | 16.2%).
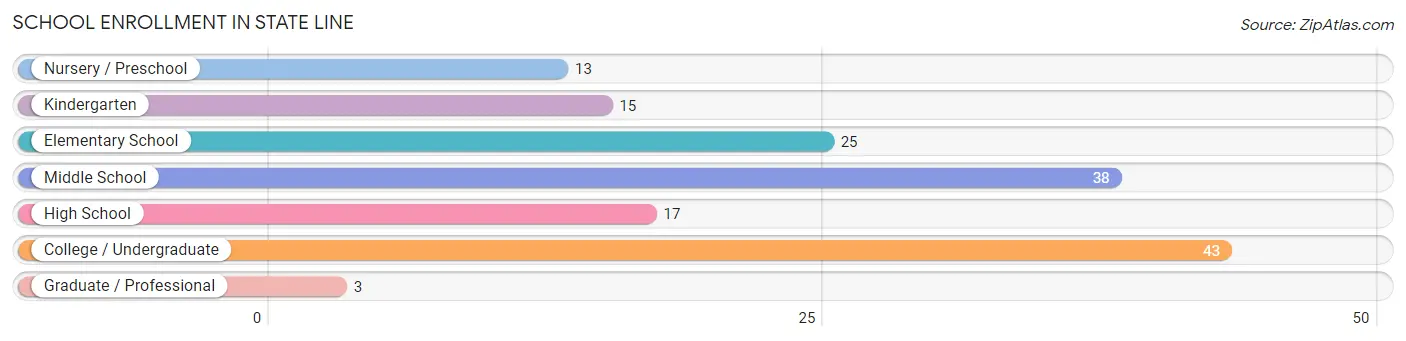
| School Level | # Students | % Students |
| Nursery / Preschool | 13 | 8.4% |
| Kindergarten | 15 | 9.7% |
| Elementary School | 25 | 16.2% |
| Middle School | 38 | 24.7% |
| High School | 17 | 11.0% |
| College / Undergraduate | 43 | 27.9% |
| Graduate / Professional | 3 | 1.9% |
| Total | 154 | 100.0% |
School Enrollment by Age by Funding Source in State Line
Out of a total of 154 students who are enrolled in schools in State Line, 43 (27.9%) attend a private institution, while the remaining 111 (72.1%) are enrolled in public schools. The age group of 18 to 19 year olds has the highest likelihood of being enrolled in private schools, with 39 (95.1% in the age bracket) enrolled. Conversely, the age group of 3 to 4 year olds has the lowest likelihood of being enrolled in a private school, with 22 (100.0% in the age bracket) attending a public institution.
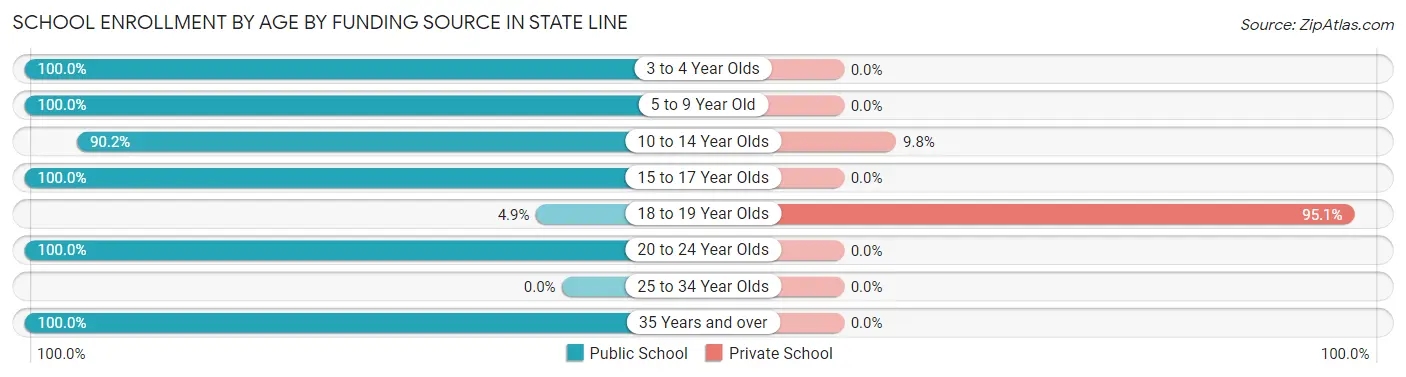
| Age Bracket | Public School | Private School |
| 3 to 4 Year Olds | 22 (100.0%) | 0 (0.0%) |
| 5 to 9 Year Old | 28 (100.0%) | 0 (0.0%) |
| 10 to 14 Year Olds | 37 (90.2%) | 4 (9.8%) |
| 15 to 17 Year Olds | 17 (100.0%) | 0 (0.0%) |
| 18 to 19 Year Olds | 2 (4.9%) | 39 (95.1%) |
| 20 to 24 Year Olds | 2 (100.0%) | 0 (0.0%) |
| 25 to 34 Year Olds | 0 (0.0%) | 0 (0.0%) |
| 35 Years and over | 3 (100.0%) | 0 (0.0%) |
| Total | 111 (72.1%) | 43 (27.9%) |
Educational Attainment by Field of Study in State Line
Education (9 | 47.4%), science & technology (3 | 15.8%), liberal arts & history (3 | 15.8%), business (2 | 10.5%), and arts & humanities (2 | 10.5%) are the most common fields of study among 19 individuals in State Line who have obtained a bachelor's degree or higher.
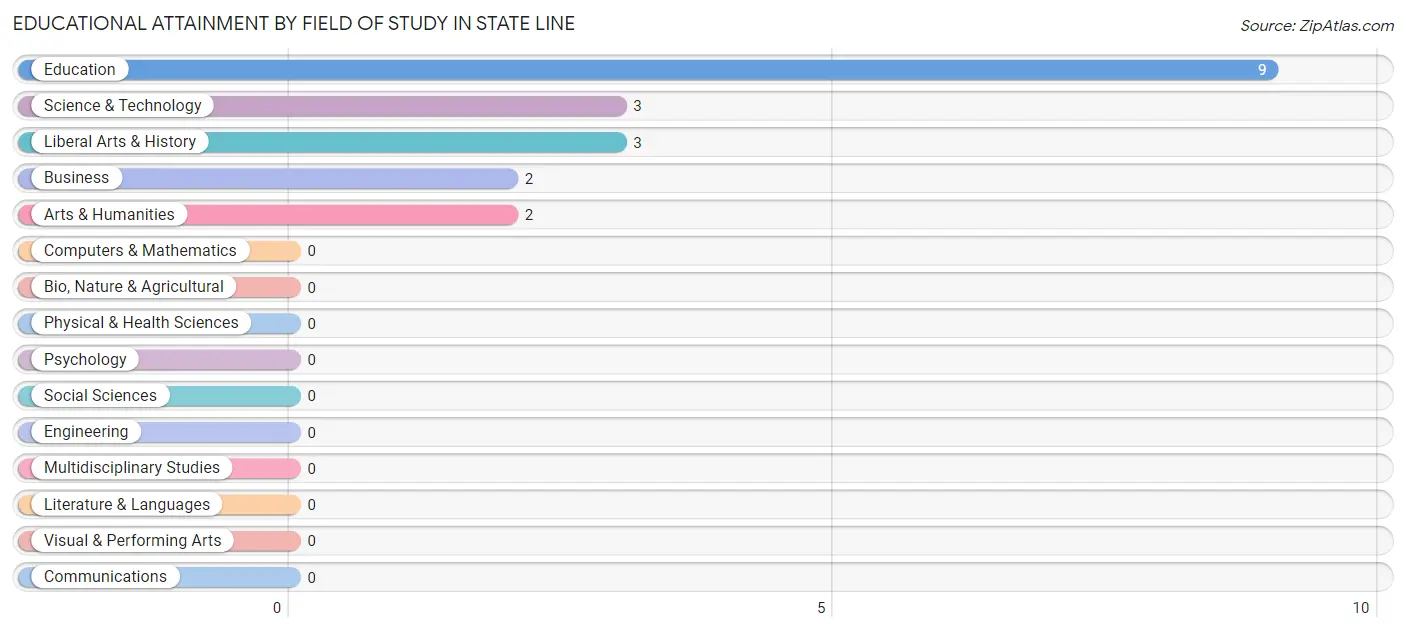
| Field of Study | # Graduates | % Graduates |
| Computers & Mathematics | 0 | 0.0% |
| Bio, Nature & Agricultural | 0 | 0.0% |
| Physical & Health Sciences | 0 | 0.0% |
| Psychology | 0 | 0.0% |
| Social Sciences | 0 | 0.0% |
| Engineering | 0 | 0.0% |
| Multidisciplinary Studies | 0 | 0.0% |
| Science & Technology | 3 | 15.8% |
| Business | 2 | 10.5% |
| Education | 9 | 47.4% |
| Literature & Languages | 0 | 0.0% |
| Liberal Arts & History | 3 | 15.8% |
| Visual & Performing Arts | 0 | 0.0% |
| Communications | 0 | 0.0% |
| Arts & Humanities | 2 | 10.5% |
| Total | 19 | 100.0% |
Transportation & Commute in State Line
Vehicle Availability by Sex in State Line
The most prevalent vehicle ownership categories in State Line are males with 3 vehicles (132, accounting for 84.1%) and females with 3 vehicles (13, making up 280.8%).
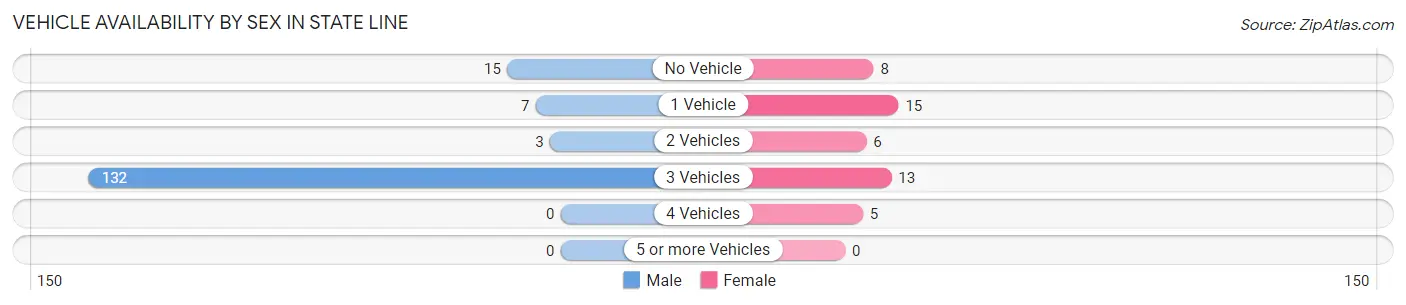
| Vehicles Available | Male | Female |
| No Vehicle | 15 (9.6%) | 8 (17.0%) |
| 1 Vehicle | 7 (4.5%) | 15 (31.9%) |
| 2 Vehicles | 3 (1.9%) | 6 (12.8%) |
| 3 Vehicles | 132 (84.1%) | 13 (27.7%) |
| 4 Vehicles | 0 (0.0%) | 5 (10.6%) |
| 5 or more Vehicles | 0 (0.0%) | 0 (0.0%) |
| Total | 157 (100.0%) | 47 (100.0%) |
Commute Time in State Line
The most frequently occuring commute durations in State Line are 45 to 59 minutes (107 commuters, 52.4%), 30 to 34 minutes (33 commuters, 16.2%), and 5 to 9 minutes (16 commuters, 7.8%).
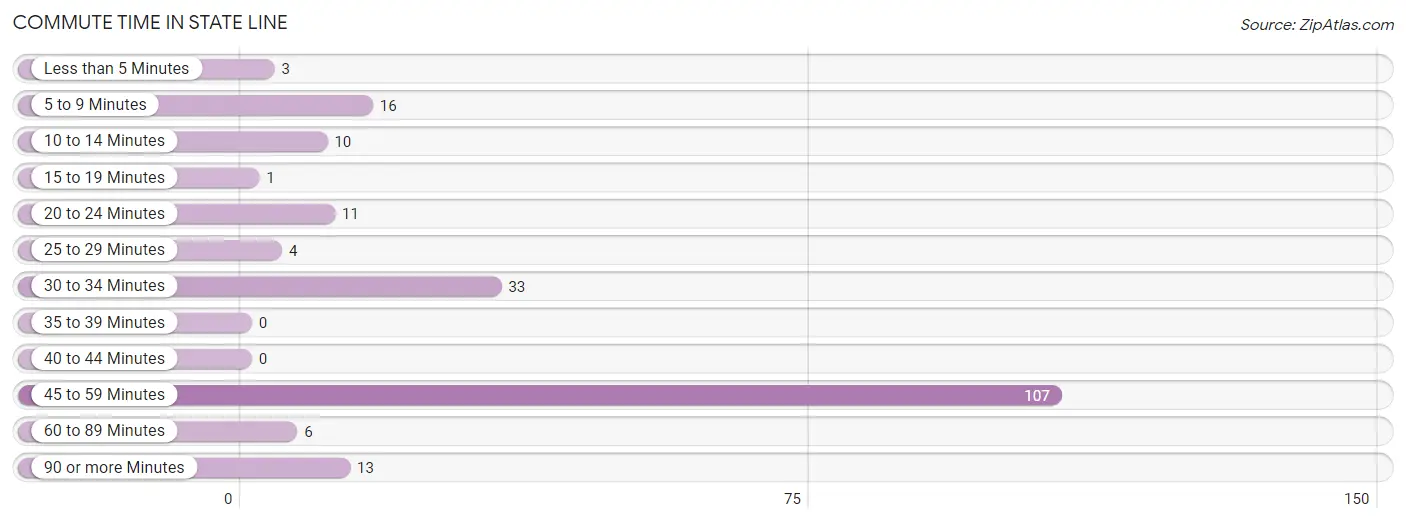
| Commute Time | # Commuters | % Commuters |
| Less than 5 Minutes | 3 | 1.5% |
| 5 to 9 Minutes | 16 | 7.8% |
| 10 to 14 Minutes | 10 | 4.9% |
| 15 to 19 Minutes | 1 | 0.5% |
| 20 to 24 Minutes | 11 | 5.4% |
| 25 to 29 Minutes | 4 | 2.0% |
| 30 to 34 Minutes | 33 | 16.2% |
| 35 to 39 Minutes | 0 | 0.0% |
| 40 to 44 Minutes | 0 | 0.0% |
| 45 to 59 Minutes | 107 | 52.4% |
| 60 to 89 Minutes | 6 | 2.9% |
| 90 or more Minutes | 13 | 6.4% |
Commute Time by Sex in State Line
The most common commute times in State Line are 45 to 59 minutes (102 commuters, 65.0%) for males and 30 to 34 minutes (12 commuters, 25.5%) for females.
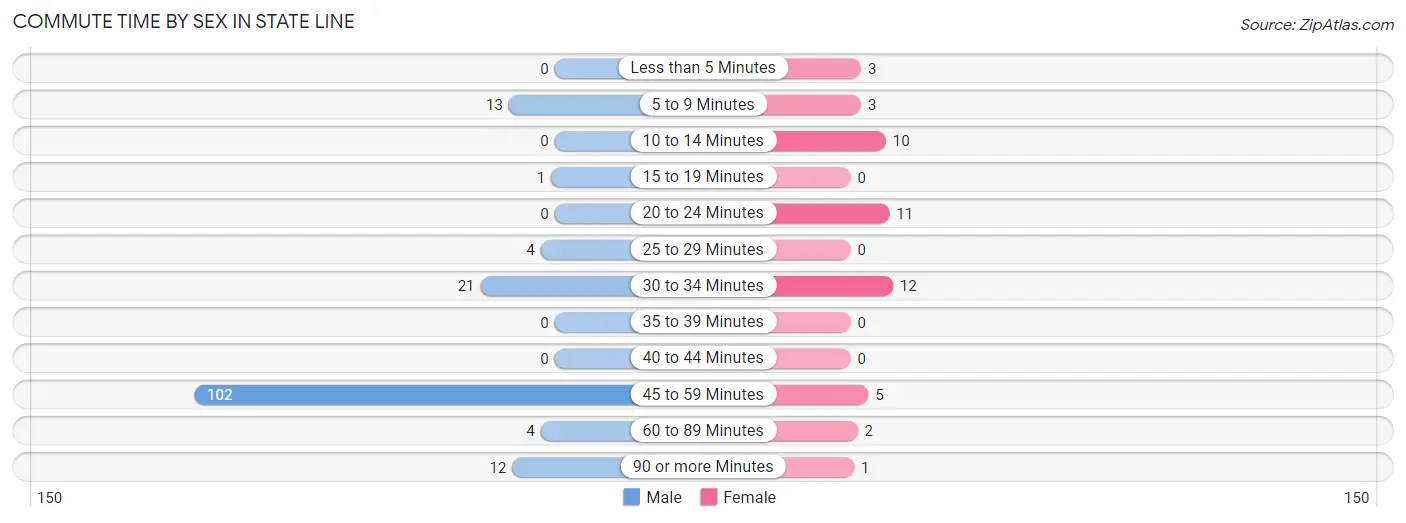
| Commute Time | Male | Female |
| Less than 5 Minutes | 0 (0.0%) | 3 (6.4%) |
| 5 to 9 Minutes | 13 (8.3%) | 3 (6.4%) |
| 10 to 14 Minutes | 0 (0.0%) | 10 (21.3%) |
| 15 to 19 Minutes | 1 (0.6%) | 0 (0.0%) |
| 20 to 24 Minutes | 0 (0.0%) | 11 (23.4%) |
| 25 to 29 Minutes | 4 (2.5%) | 0 (0.0%) |
| 30 to 34 Minutes | 21 (13.4%) | 12 (25.5%) |
| 35 to 39 Minutes | 0 (0.0%) | 0 (0.0%) |
| 40 to 44 Minutes | 0 (0.0%) | 0 (0.0%) |
| 45 to 59 Minutes | 102 (65.0%) | 5 (10.6%) |
| 60 to 89 Minutes | 4 (2.5%) | 2 (4.3%) |
| 90 or more Minutes | 12 (7.6%) | 1 (2.1%) |
Time of Departure to Work by Sex in State Line
The most frequent times of departure to work in State Line are 5:00 AM to 5:29 AM (93, 59.2%) for males and 6:00 AM to 6:29 AM (18, 38.3%) for females.
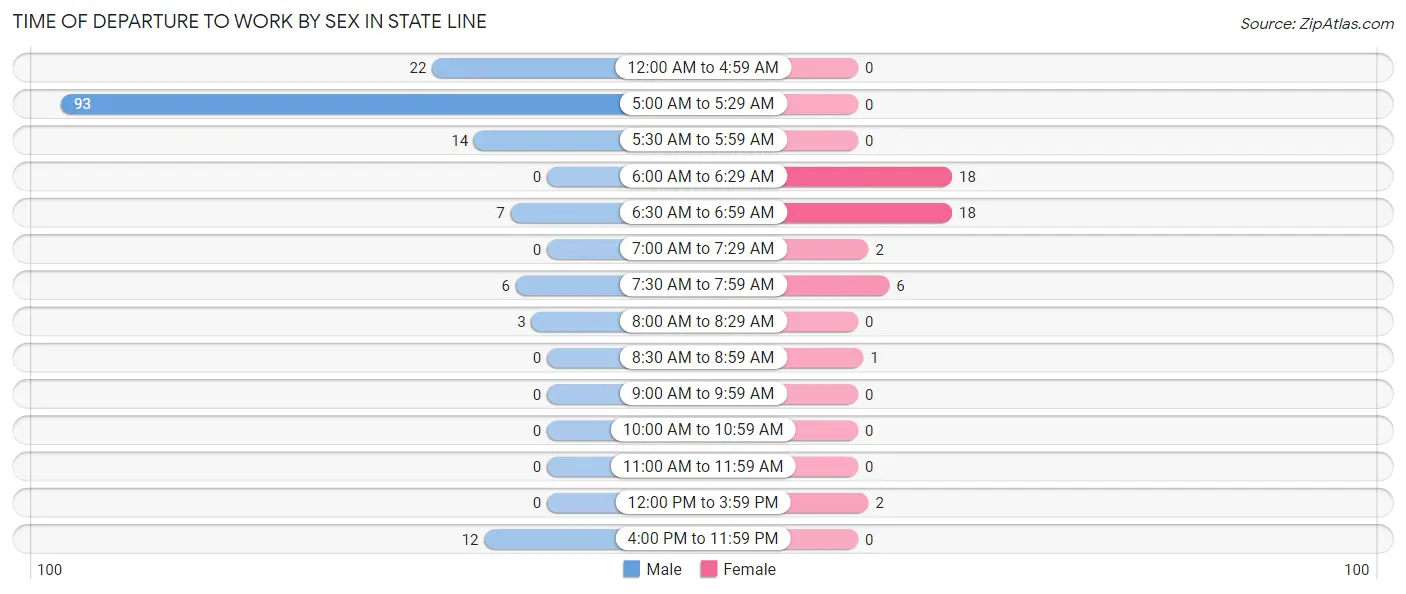
| Time of Departure | Male | Female |
| 12:00 AM to 4:59 AM | 22 (14.0%) | 0 (0.0%) |
| 5:00 AM to 5:29 AM | 93 (59.2%) | 0 (0.0%) |
| 5:30 AM to 5:59 AM | 14 (8.9%) | 0 (0.0%) |
| 6:00 AM to 6:29 AM | 0 (0.0%) | 18 (38.3%) |
| 6:30 AM to 6:59 AM | 7 (4.5%) | 18 (38.3%) |
| 7:00 AM to 7:29 AM | 0 (0.0%) | 2 (4.3%) |
| 7:30 AM to 7:59 AM | 6 (3.8%) | 6 (12.8%) |
| 8:00 AM to 8:29 AM | 3 (1.9%) | 0 (0.0%) |
| 8:30 AM to 8:59 AM | 0 (0.0%) | 1 (2.1%) |
| 9:00 AM to 9:59 AM | 0 (0.0%) | 0 (0.0%) |
| 10:00 AM to 10:59 AM | 0 (0.0%) | 0 (0.0%) |
| 11:00 AM to 11:59 AM | 0 (0.0%) | 0 (0.0%) |
| 12:00 PM to 3:59 PM | 0 (0.0%) | 2 (4.3%) |
| 4:00 PM to 11:59 PM | 12 (7.6%) | 0 (0.0%) |
| Total | 157 (100.0%) | 47 (100.0%) |
Housing Occupancy in State Line
Occupancy by Ownership in State Line
Of the total 304 dwellings in State Line, owner-occupied units account for 160 (52.6%), while renter-occupied units make up 144 (47.4%).
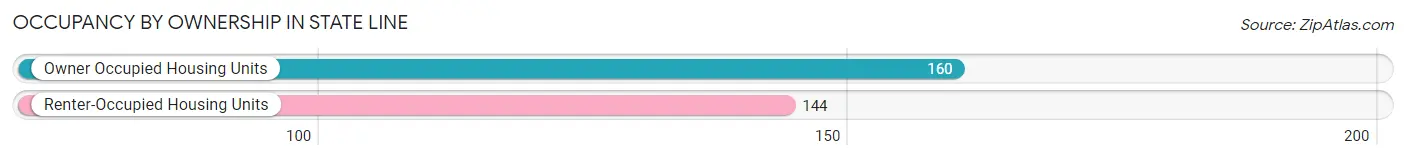
| Occupancy | # Housing Units | % Housing Units |
| Owner Occupied Housing Units | 160 | 52.6% |
| Renter-Occupied Housing Units | 144 | 47.4% |
| Total Occupied Housing Units | 304 | 100.0% |
Occupancy by Household Size in State Line
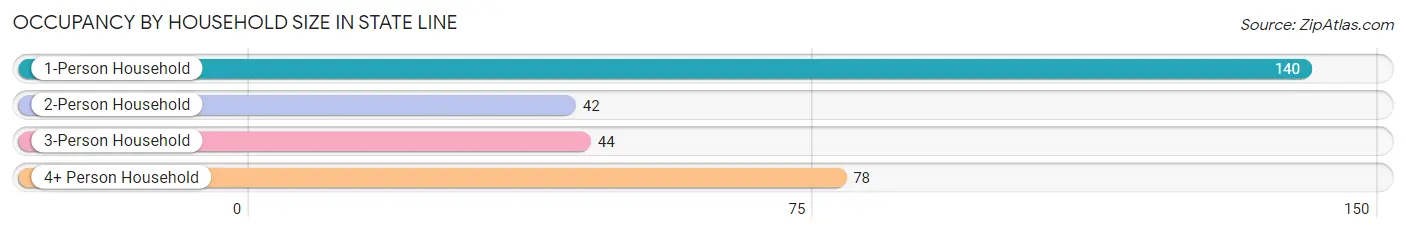
| Household Size | # Housing Units | % Housing Units |
| 1-Person Household | 140 | 46.1% |
| 2-Person Household | 42 | 13.8% |
| 3-Person Household | 44 | 14.5% |
| 4+ Person Household | 78 | 25.7% |
| Total Housing Units | 304 | 100.0% |
Occupancy by Ownership by Household Size in State Line
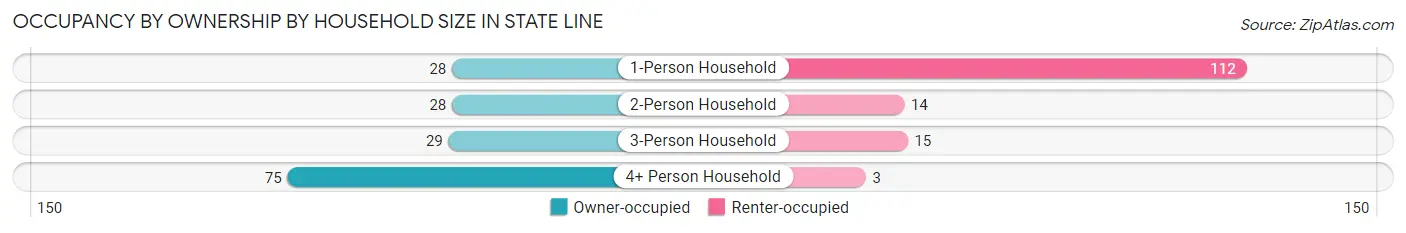
| Household Size | Owner-occupied | Renter-occupied |
| 1-Person Household | 28 (20.0%) | 112 (80.0%) |
| 2-Person Household | 28 (66.7%) | 14 (33.3%) |
| 3-Person Household | 29 (65.9%) | 15 (34.1%) |
| 4+ Person Household | 75 (96.2%) | 3 (3.8%) |
| Total Housing Units | 160 (52.6%) | 144 (47.4%) |
Occupancy by Educational Attainment in State Line
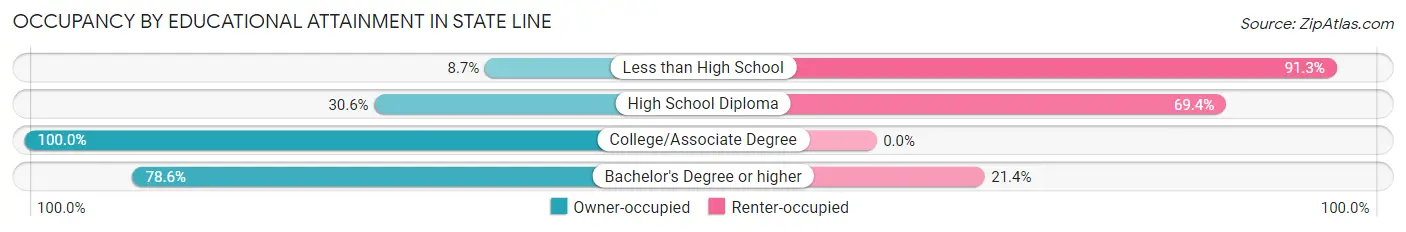
| Household Size | Owner-occupied | Renter-occupied |
| Less than High School | 2 (8.7%) | 21 (91.3%) |
| High School Diploma | 53 (30.6%) | 120 (69.4%) |
| College/Associate Degree | 94 (100.0%) | 0 (0.0%) |
| Bachelor's Degree or higher | 11 (78.6%) | 3 (21.4%) |
Occupancy by Age of Householder in State Line
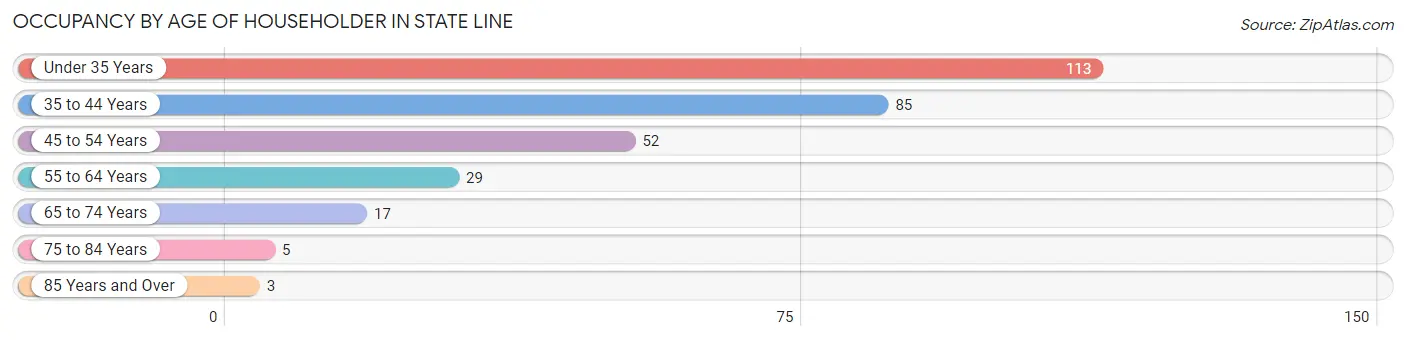
| Age Bracket | # Households | % Households |
| Under 35 Years | 113 | 37.2% |
| 35 to 44 Years | 85 | 28.0% |
| 45 to 54 Years | 52 | 17.1% |
| 55 to 64 Years | 29 | 9.5% |
| 65 to 74 Years | 17 | 5.6% |
| 75 to 84 Years | 5 | 1.6% |
| 85 Years and Over | 3 | 1.0% |
| Total | 304 | 100.0% |
Housing Finances in State Line
Median Income by Occupancy in State Line
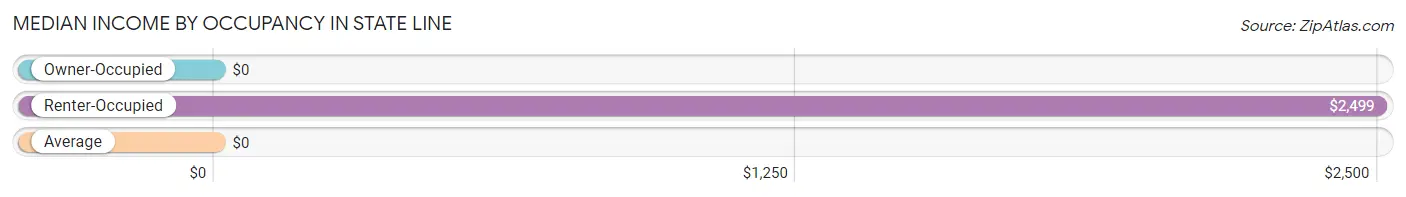
| Occupancy Type | # Households | Median Income |
| Owner-Occupied | 160 (52.6%) | $0 |
| Renter-Occupied | 144 (47.4%) | $2,499 |
| Average | 304 (100.0%) | $0 |
Occupancy by Householder Income Bracket in State Line
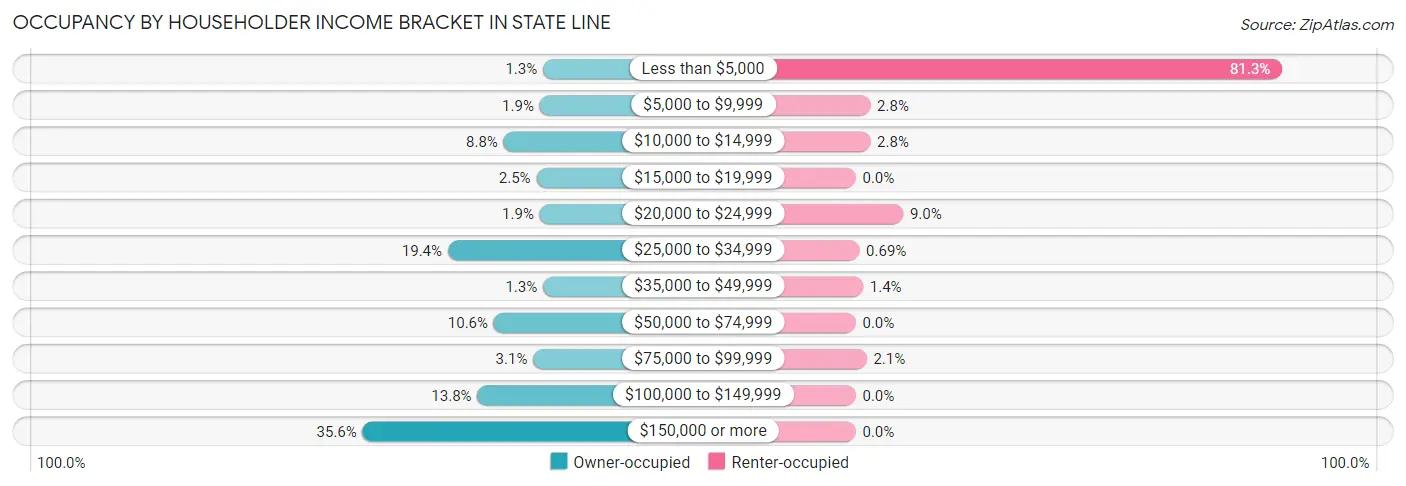
| Income Bracket | Owner-occupied | Renter-occupied |
| Less than $5,000 | 2 (1.3%) | 117 (81.2%) |
| $5,000 to $9,999 | 3 (1.9%) | 4 (2.8%) |
| $10,000 to $14,999 | 14 (8.7%) | 4 (2.8%) |
| $15,000 to $19,999 | 4 (2.5%) | 0 (0.0%) |
| $20,000 to $24,999 | 3 (1.9%) | 13 (9.0%) |
| $25,000 to $34,999 | 31 (19.4%) | 1 (0.7%) |
| $35,000 to $49,999 | 2 (1.3%) | 2 (1.4%) |
| $50,000 to $74,999 | 17 (10.6%) | 0 (0.0%) |
| $75,000 to $99,999 | 5 (3.1%) | 3 (2.1%) |
| $100,000 to $149,999 | 22 (13.8%) | 0 (0.0%) |
| $150,000 or more | 57 (35.6%) | 0 (0.0%) |
| Total | 160 (100.0%) | 144 (100.0%) |
Monthly Housing Cost Tiers in State Line
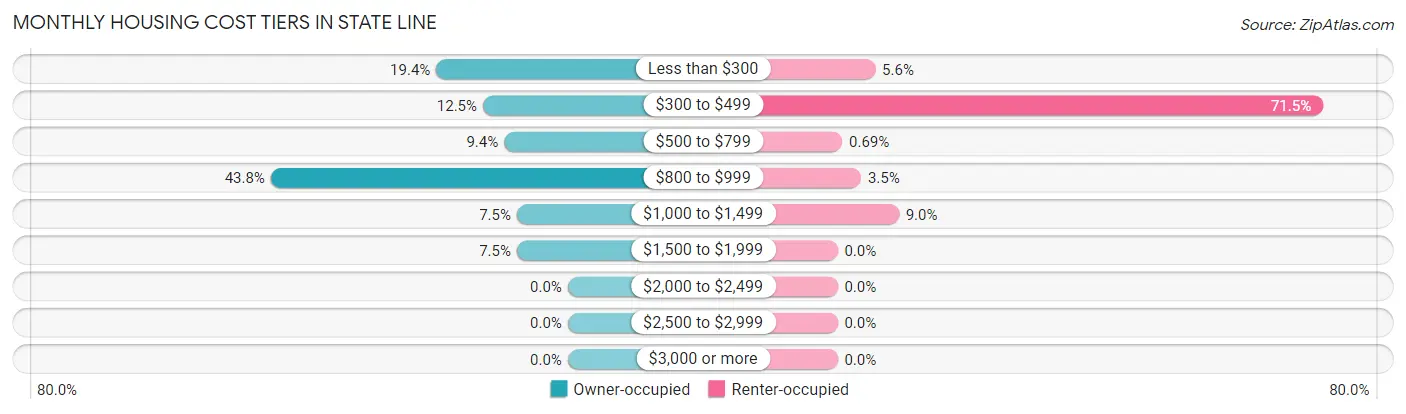
| Monthly Cost | Owner-occupied | Renter-occupied |
| Less than $300 | 31 (19.4%) | 8 (5.6%) |
| $300 to $499 | 20 (12.5%) | 103 (71.5%) |
| $500 to $799 | 15 (9.4%) | 1 (0.7%) |
| $800 to $999 | 70 (43.8%) | 5 (3.5%) |
| $1,000 to $1,499 | 12 (7.5%) | 13 (9.0%) |
| $1,500 to $1,999 | 12 (7.5%) | 0 (0.0%) |
| $2,000 to $2,499 | 0 (0.0%) | 0 (0.0%) |
| $2,500 to $2,999 | 0 (0.0%) | 0 (0.0%) |
| $3,000 or more | 0 (0.0%) | 0 (0.0%) |
| Total | 160 (100.0%) | 144 (100.0%) |
Physical Housing Characteristics in State Line
Housing Structures in State Line
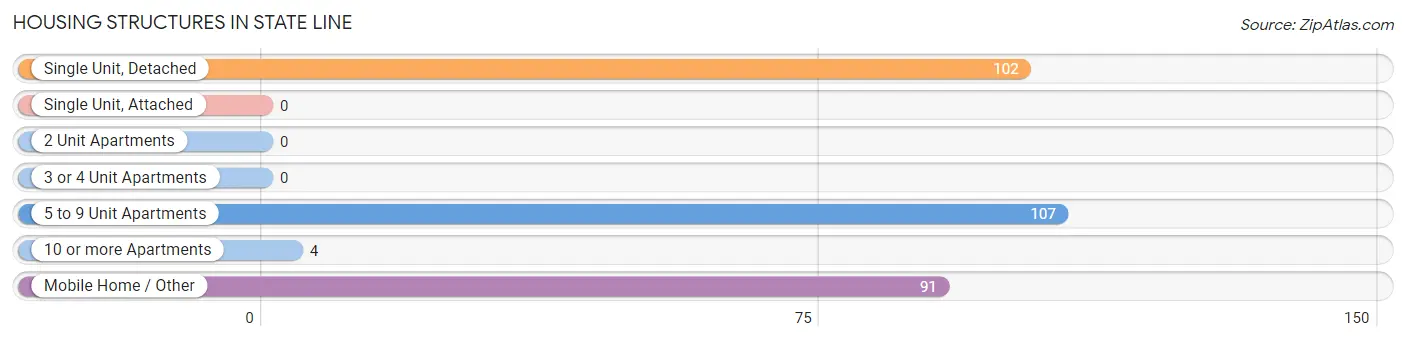
| Structure Type | # Housing Units | % Housing Units |
| Single Unit, Detached | 102 | 33.6% |
| Single Unit, Attached | 0 | 0.0% |
| 2 Unit Apartments | 0 | 0.0% |
| 3 or 4 Unit Apartments | 0 | 0.0% |
| 5 to 9 Unit Apartments | 107 | 35.2% |
| 10 or more Apartments | 4 | 1.3% |
| Mobile Home / Other | 91 | 29.9% |
| Total | 304 | 100.0% |
Housing Structures by Occupancy in State Line
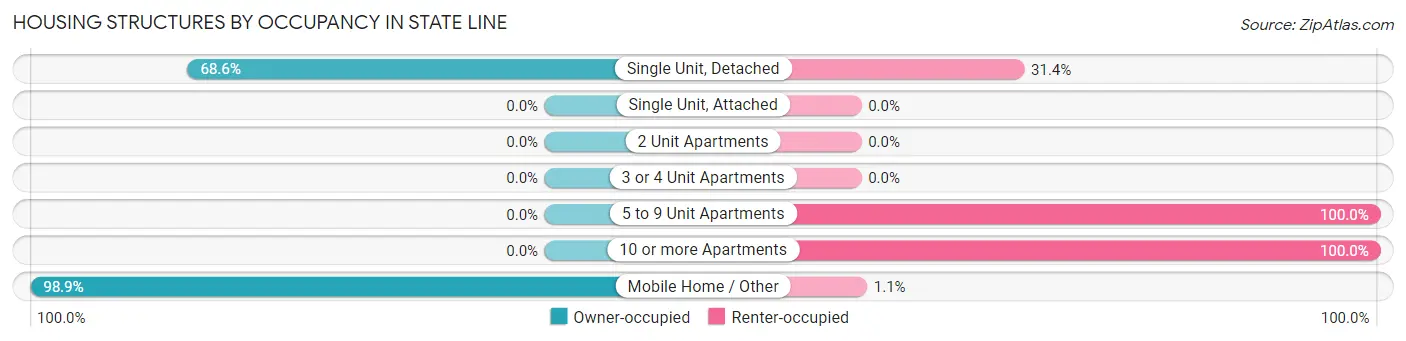
| Structure Type | Owner-occupied | Renter-occupied |
| Single Unit, Detached | 70 (68.6%) | 32 (31.4%) |
| Single Unit, Attached | 0 (0.0%) | 0 (0.0%) |
| 2 Unit Apartments | 0 (0.0%) | 0 (0.0%) |
| 3 or 4 Unit Apartments | 0 (0.0%) | 0 (0.0%) |
| 5 to 9 Unit Apartments | 0 (0.0%) | 107 (100.0%) |
| 10 or more Apartments | 0 (0.0%) | 4 (100.0%) |
| Mobile Home / Other | 90 (98.9%) | 1 (1.1%) |
| Total | 160 (52.6%) | 144 (47.4%) |
Housing Structures by Number of Rooms in State Line
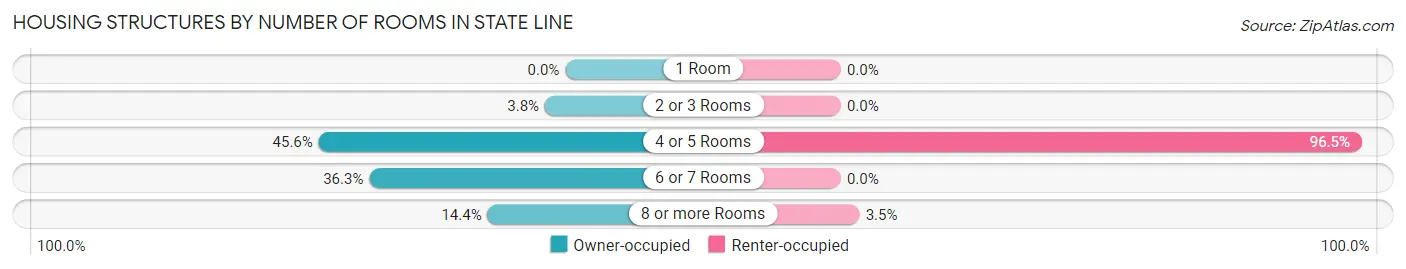
| Number of Rooms | Owner-occupied | Renter-occupied |
| 1 Room | 0 (0.0%) | 0 (0.0%) |
| 2 or 3 Rooms | 6 (3.7%) | 0 (0.0%) |
| 4 or 5 Rooms | 73 (45.6%) | 139 (96.5%) |
| 6 or 7 Rooms | 58 (36.2%) | 0 (0.0%) |
| 8 or more Rooms | 23 (14.4%) | 5 (3.5%) |
| Total | 160 (100.0%) | 144 (100.0%) |
Housing Structure by Heating Type in State Line
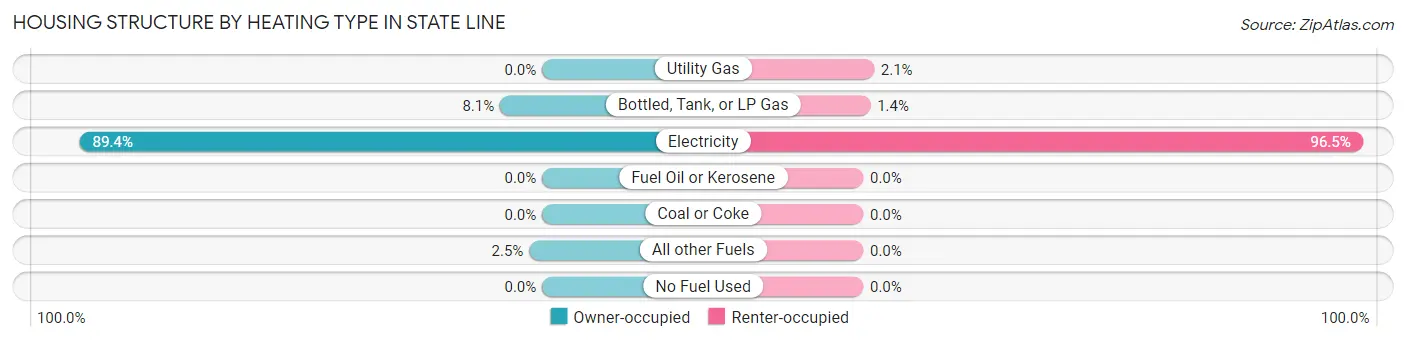
| Heating Type | Owner-occupied | Renter-occupied |
| Utility Gas | 0 (0.0%) | 3 (2.1%) |
| Bottled, Tank, or LP Gas | 13 (8.1%) | 2 (1.4%) |
| Electricity | 143 (89.4%) | 139 (96.5%) |
| Fuel Oil or Kerosene | 0 (0.0%) | 0 (0.0%) |
| Coal or Coke | 0 (0.0%) | 0 (0.0%) |
| All other Fuels | 4 (2.5%) | 0 (0.0%) |
| No Fuel Used | 0 (0.0%) | 0 (0.0%) |
| Total | 160 (100.0%) | 144 (100.0%) |
Household Vehicle Usage in State Line
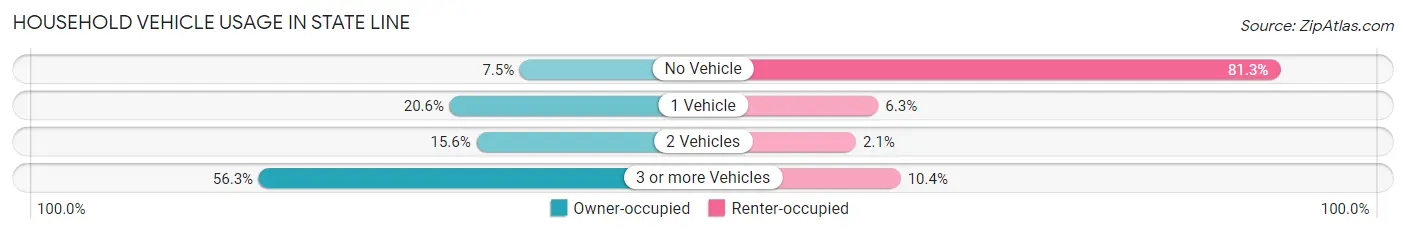
| Vehicles per Household | Owner-occupied | Renter-occupied |
| No Vehicle | 12 (7.5%) | 117 (81.2%) |
| 1 Vehicle | 33 (20.6%) | 9 (6.2%) |
| 2 Vehicles | 25 (15.6%) | 3 (2.1%) |
| 3 or more Vehicles | 90 (56.2%) | 15 (10.4%) |
| Total | 160 (100.0%) | 144 (100.0%) |
Real Estate & Mortgages in State Line
Real Estate and Mortgage Overview in State Line
| Characteristic | Without Mortgage | With Mortgage |
| Housing Units | 64 | 96 |
| Median Property Value | $41,100 | $58,400 |
| Median Household Income | $33,462 | $57 |
| Monthly Housing Costs | $303 | $0 |
| Real Estate Taxes | $284 | $17 |
Property Value by Mortgage Status in State Line
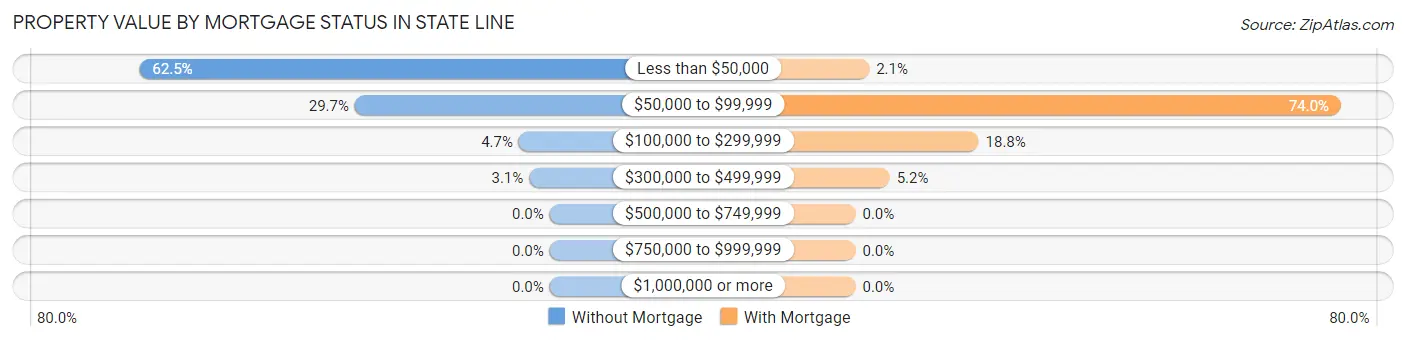
| Property Value | Without Mortgage | With Mortgage |
| Less than $50,000 | 40 (62.5%) | 2 (2.1%) |
| $50,000 to $99,999 | 19 (29.7%) | 71 (74.0%) |
| $100,000 to $299,999 | 3 (4.7%) | 18 (18.8%) |
| $300,000 to $499,999 | 2 (3.1%) | 5 (5.2%) |
| $500,000 to $749,999 | 0 (0.0%) | 0 (0.0%) |
| $750,000 to $999,999 | 0 (0.0%) | 0 (0.0%) |
| $1,000,000 or more | 0 (0.0%) | 0 (0.0%) |
| Total | 64 (100.0%) | 96 (100.0%) |
Household Income by Mortgage Status in State Line
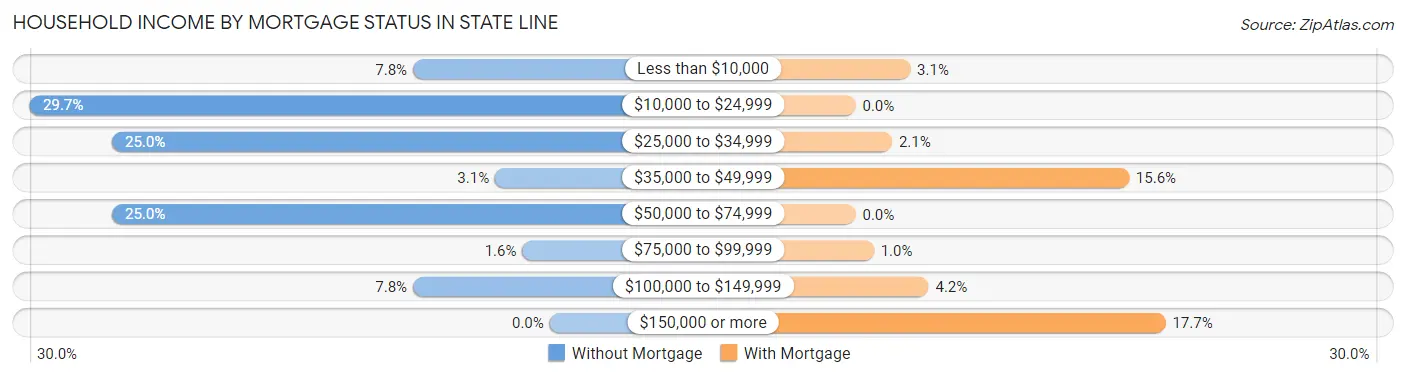
| Household Income | Without Mortgage | With Mortgage |
| Less than $10,000 | 5 (7.8%) | 3 (3.1%) |
| $10,000 to $24,999 | 19 (29.7%) | 0 (0.0%) |
| $25,000 to $34,999 | 16 (25.0%) | 2 (2.1%) |
| $35,000 to $49,999 | 2 (3.1%) | 15 (15.6%) |
| $50,000 to $74,999 | 16 (25.0%) | 0 (0.0%) |
| $75,000 to $99,999 | 1 (1.6%) | 1 (1.0%) |
| $100,000 to $149,999 | 5 (7.8%) | 4 (4.2%) |
| $150,000 or more | 0 (0.0%) | 17 (17.7%) |
| Total | 64 (100.0%) | 96 (100.0%) |
Property Value to Household Income Ratio in State Line
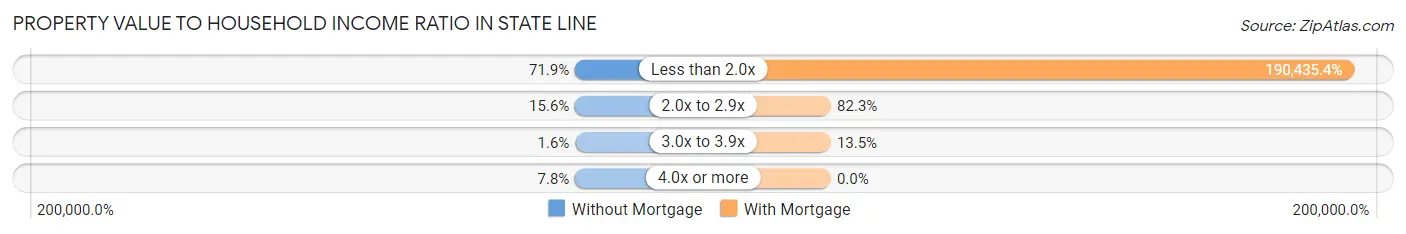
| Value-to-Income Ratio | Without Mortgage | With Mortgage |
| Less than 2.0x | 46 (71.9%) | 182,818 (190,435.4%) |
| 2.0x to 2.9x | 10 (15.6%) | 79 (82.3%) |
| 3.0x to 3.9x | 1 (1.6%) | 13 (13.5%) |
| 4.0x or more | 5 (7.8%) | 0 (0.0%) |
| Total | 64 (100.0%) | 96 (100.0%) |
Real Estate Taxes by Mortgage Status in State Line
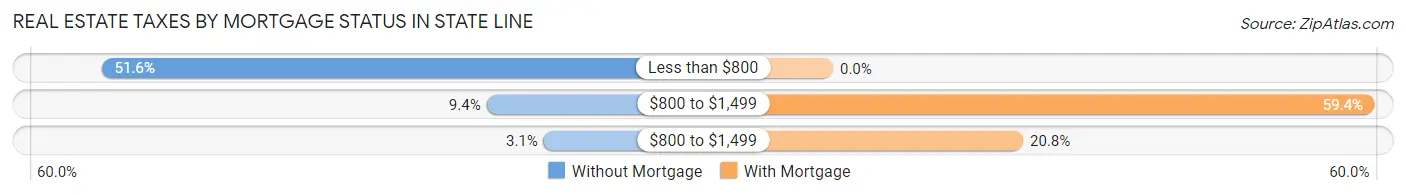
| Property Taxes | Without Mortgage | With Mortgage |
| Less than $800 | 33 (51.6%) | 0 (0.0%) |
| $800 to $1,499 | 6 (9.4%) | 57 (59.4%) |
| $800 to $1,499 | 2 (3.1%) | 20 (20.8%) |
| Total | 64 (100.0%) | 96 (100.0%) |
Health & Disability in State Line
Health Insurance Coverage by Age in State Line
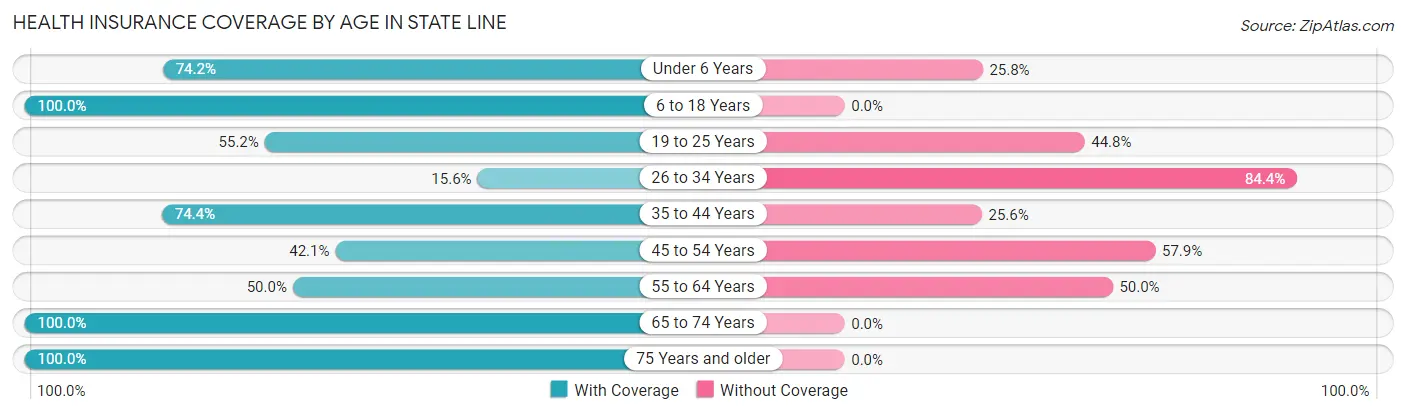
| Age Bracket | With Coverage | Without Coverage |
| Under 6 Years | 49 (74.2%) | 17 (25.8%) |
| 6 to 18 Years | 122 (100.0%) | 0 (0.0%) |
| 19 to 25 Years | 58 (55.2%) | 47 (44.8%) |
| 26 to 34 Years | 21 (15.6%) | 114 (84.4%) |
| 35 to 44 Years | 157 (74.4%) | 54 (25.6%) |
| 45 to 54 Years | 45 (42.1%) | 62 (57.9%) |
| 55 to 64 Years | 19 (50.0%) | 19 (50.0%) |
| 65 to 74 Years | 28 (100.0%) | 0 (0.0%) |
| 75 Years and older | 12 (100.0%) | 0 (0.0%) |
| Total | 511 (62.0%) | 313 (38.0%) |
Health Insurance Coverage by Citizenship Status in State Line
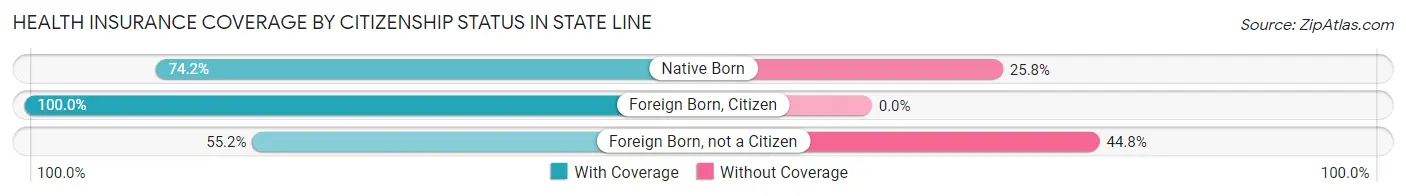
| Citizenship Status | With Coverage | Without Coverage |
| Native Born | 49 (74.2%) | 17 (25.8%) |
| Foreign Born, Citizen | 122 (100.0%) | 0 (0.0%) |
| Foreign Born, not a Citizen | 58 (55.2%) | 47 (44.8%) |
Health Insurance Coverage by Household Income in State Line
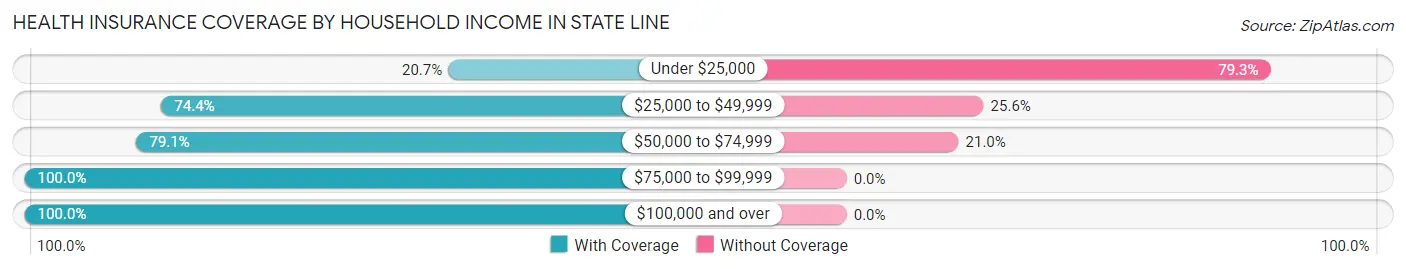
| Household Income | With Coverage | Without Coverage |
| Under $25,000 | 68 (20.7%) | 261 (79.3%) |
| $25,000 to $49,999 | 87 (74.4%) | 30 (25.6%) |
| $50,000 to $74,999 | 83 (79.0%) | 22 (20.9%) |
| $75,000 to $99,999 | 22 (100.0%) | 0 (0.0%) |
| $100,000 and over | 251 (100.0%) | 0 (0.0%) |
Public vs Private Health Insurance Coverage by Age in State Line
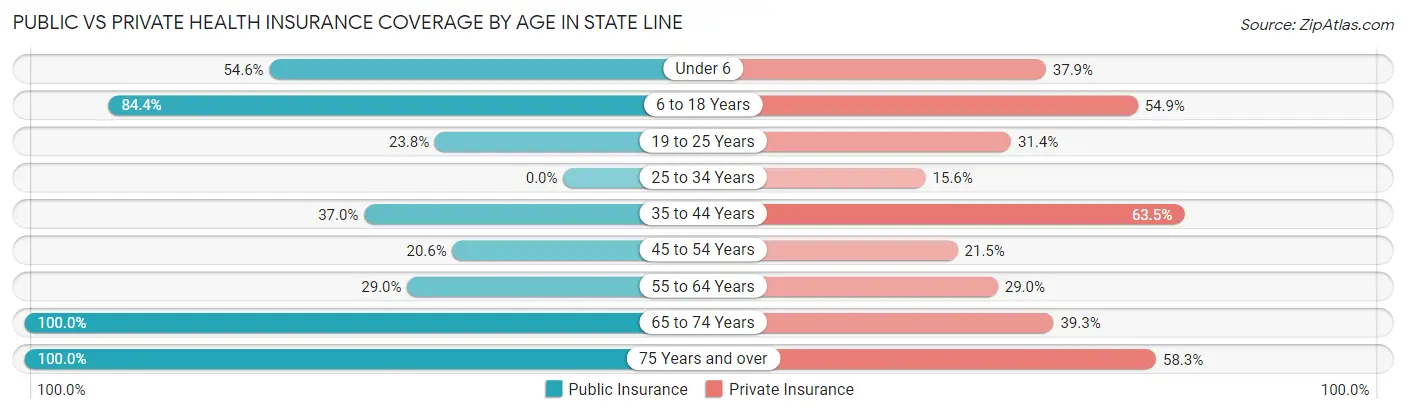
| Age Bracket | Public Insurance | Private Insurance |
| Under 6 | 36 (54.5%) | 25 (37.9%) |
| 6 to 18 Years | 103 (84.4%) | 67 (54.9%) |
| 19 to 25 Years | 25 (23.8%) | 33 (31.4%) |
| 25 to 34 Years | 0 (0.0%) | 21 (15.6%) |
| 35 to 44 Years | 78 (37.0%) | 134 (63.5%) |
| 45 to 54 Years | 22 (20.6%) | 23 (21.5%) |
| 55 to 64 Years | 11 (28.9%) | 11 (28.9%) |
| 65 to 74 Years | 28 (100.0%) | 11 (39.3%) |
| 75 Years and over | 12 (100.0%) | 7 (58.3%) |
| Total | 315 (38.2%) | 332 (40.3%) |
Disability Status by Sex by Age in State Line
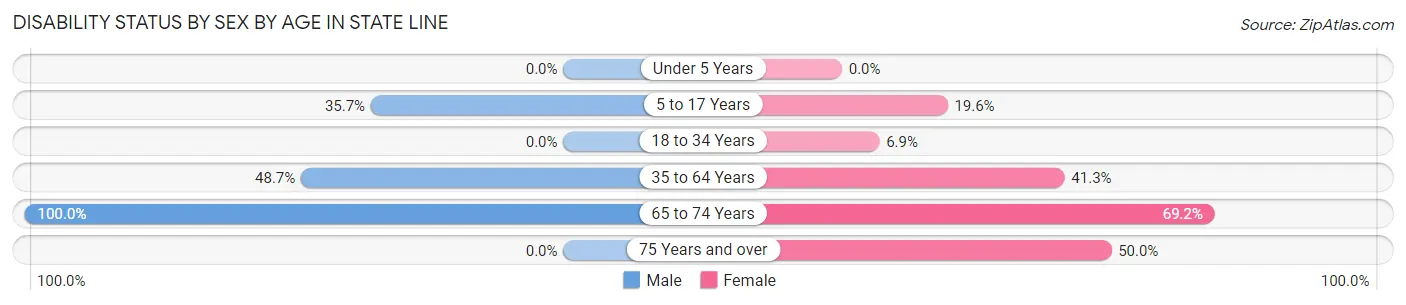
| Age Bracket | Male | Female |
| Under 5 Years | 0 (0.0%) | 0 (0.0%) |
| 5 to 17 Years | 15 (35.7%) | 10 (19.6%) |
| 18 to 34 Years | 0 (0.0%) | 5 (6.9%) |
| 35 to 64 Years | 92 (48.7%) | 69 (41.3%) |
| 65 to 74 Years | 15 (100.0%) | 9 (69.2%) |
| 75 Years and over | 0 (0.0%) | 4 (50.0%) |
Disability Class by Sex by Age in State Line
Disability Class: Hearing Difficulty
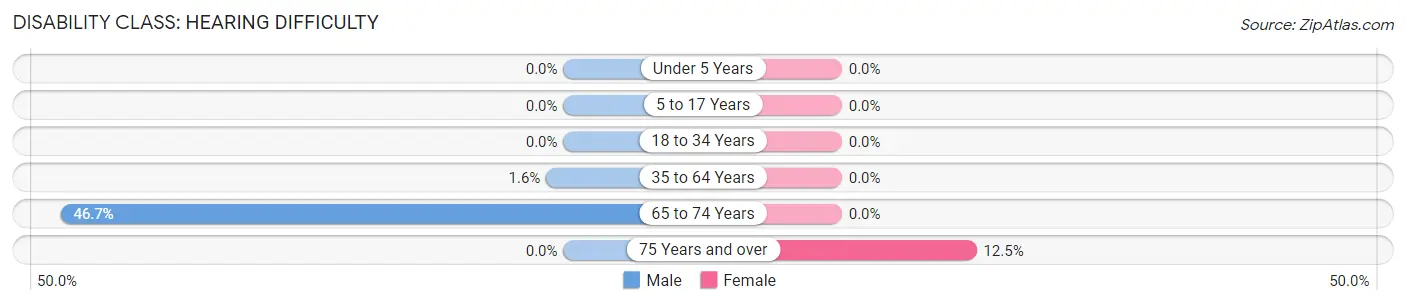
| Age Bracket | Male | Female |
| Under 5 Years | 0 (0.0%) | 0 (0.0%) |
| 5 to 17 Years | 0 (0.0%) | 0 (0.0%) |
| 18 to 34 Years | 0 (0.0%) | 0 (0.0%) |
| 35 to 64 Years | 3 (1.6%) | 0 (0.0%) |
| 65 to 74 Years | 7 (46.7%) | 0 (0.0%) |
| 75 Years and over | 0 (0.0%) | 1 (12.5%) |
Disability Class: Vision Difficulty
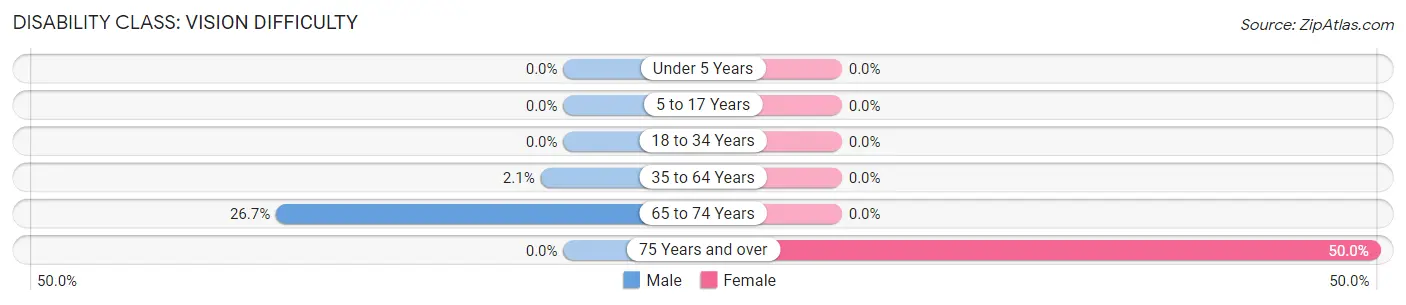
| Age Bracket | Male | Female |
| Under 5 Years | 0 (0.0%) | 0 (0.0%) |
| 5 to 17 Years | 0 (0.0%) | 0 (0.0%) |
| 18 to 34 Years | 0 (0.0%) | 0 (0.0%) |
| 35 to 64 Years | 4 (2.1%) | 0 (0.0%) |
| 65 to 74 Years | 4 (26.7%) | 0 (0.0%) |
| 75 Years and over | 0 (0.0%) | 4 (50.0%) |
Disability Class: Cognitive Difficulty
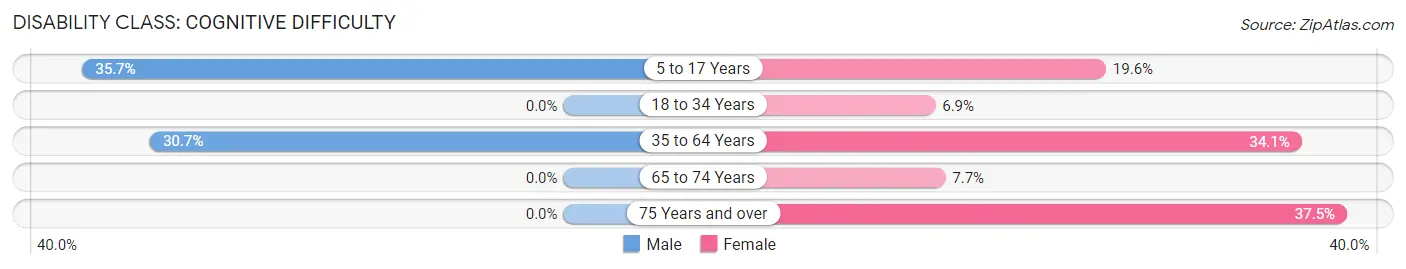
| Age Bracket | Male | Female |
| 5 to 17 Years | 15 (35.7%) | 10 (19.6%) |
| 18 to 34 Years | 0 (0.0%) | 5 (6.9%) |
| 35 to 64 Years | 58 (30.7%) | 57 (34.1%) |
| 65 to 74 Years | 0 (0.0%) | 1 (7.7%) |
| 75 Years and over | 0 (0.0%) | 3 (37.5%) |
Disability Class: Ambulatory Difficulty
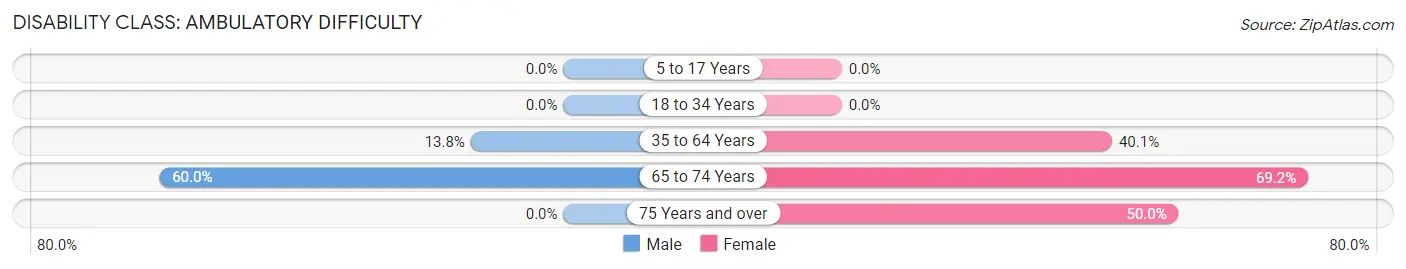
| Age Bracket | Male | Female |
| 5 to 17 Years | 0 (0.0%) | 0 (0.0%) |
| 18 to 34 Years | 0 (0.0%) | 0 (0.0%) |
| 35 to 64 Years | 26 (13.8%) | 67 (40.1%) |
| 65 to 74 Years | 9 (60.0%) | 9 (69.2%) |
| 75 Years and over | 0 (0.0%) | 4 (50.0%) |
Disability Class: Self-Care Difficulty
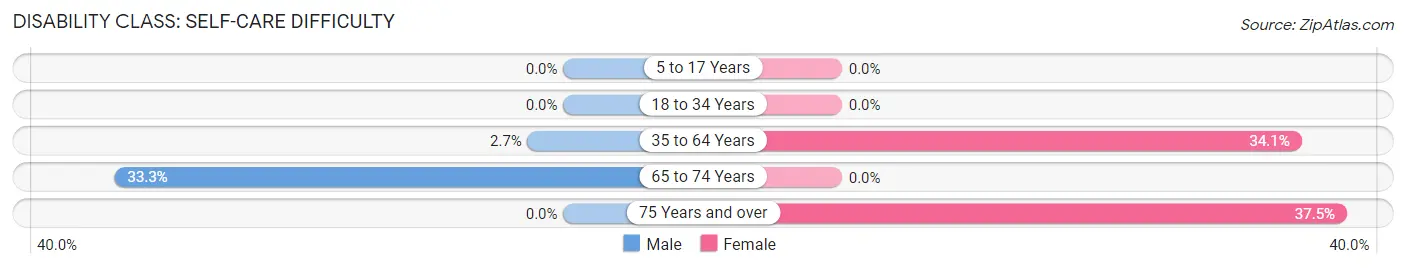
| Age Bracket | Male | Female |
| 5 to 17 Years | 0 (0.0%) | 0 (0.0%) |
| 18 to 34 Years | 0 (0.0%) | 0 (0.0%) |
| 35 to 64 Years | 5 (2.6%) | 57 (34.1%) |
| 65 to 74 Years | 5 (33.3%) | 0 (0.0%) |
| 75 Years and over | 0 (0.0%) | 3 (37.5%) |
Technology Access in State Line
Computing Device Access in State Line
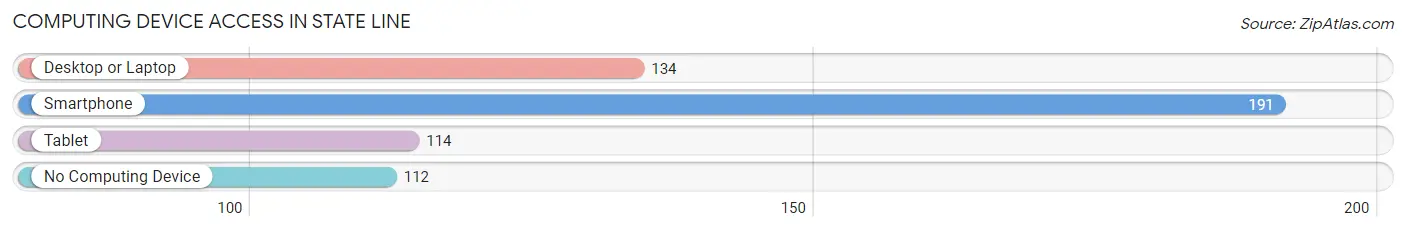
| Device Type | # Households | % Households |
| Desktop or Laptop | 134 | 44.1% |
| Smartphone | 191 | 62.8% |
| Tablet | 114 | 37.5% |
| No Computing Device | 112 | 36.8% |
| Total | 304 | 100.0% |
Internet Access in State Line
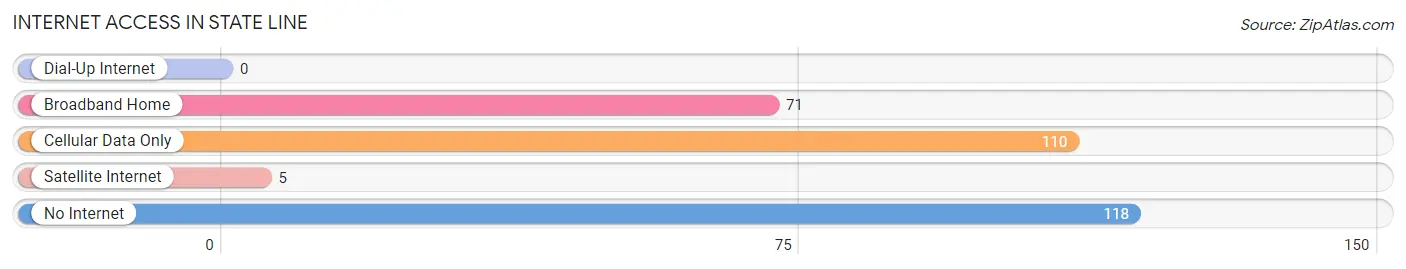
| Internet Type | # Households | % Households |
| Dial-Up Internet | 0 | 0.0% |
| Broadband Home | 71 | 23.4% |
| Cellular Data Only | 110 | 36.2% |
| Satellite Internet | 5 | 1.6% |
| No Internet | 118 | 38.8% |
| Total | 304 | 100.0% |
State Line Summary
State Line, Mississippi is a small town located in the southeastern corner of the state, near the Alabama border. It is part of Jones County and is situated along the Leaf River. The town has a population of approximately 1,000 people and is known for its rural charm and friendly atmosphere.
History
State Line was founded in 1837 by a group of settlers from Georgia and Alabama. The town was originally called “State Line Station” because it was located on the state line between Mississippi and Alabama. The town was officially incorporated in 1845 and the name was changed to State Line.
The town was an important stop on the Mobile and Ohio Railroad, which ran through the area in the late 19th century. The railroad brought economic growth to the area and helped to spur the development of the town.
In the early 20th century, State Line was a thriving agricultural community. Cotton was the main crop grown in the area and the town was home to several cotton gins. The town also had a sawmill, a gristmill, and a brickyard.
Geography
State Line is located in the southeastern corner of Mississippi, near the Alabama border. The town is situated along the Leaf River and is surrounded by rolling hills and forests. The town is located about 25 miles south of Hattiesburg and about 50 miles north of Mobile, Alabama.
The climate in State Line is humid subtropical, with hot summers and mild winters. The average annual temperature is around 70 degrees Fahrenheit. The town receives an average of 50 inches of rain per year.
Economy
State Line’s economy is largely based on agriculture. Cotton is the main crop grown in the area, and the town is home to several cotton gins. The town also has a sawmill, a gristmill, and a brickyard.
The town is also home to several small businesses, including a grocery store, a hardware store, and a few restaurants. There is also a small airport located in the town.
Demographics
As of the 2010 census, State Line had a population of 1,000 people. The racial makeup of the town was 95.2% White, 2.7% African American, 0.2% Native American, 0.2% Asian, and 1.7% from other races.
The median household income in State Line was $30,000, and the median family income was $35,000. The per capita income was $14,000. About 17.5% of the population was below the poverty line.
State Line is a small, rural town with a friendly atmosphere and a strong sense of community. The town is known for its agricultural heritage and its rural charm. The town is a great place to live and work, and it offers a peaceful and relaxed lifestyle.
Common Questions
What is Per Capita Income in State Line?
Per Capita income in State Line is $20,102.
What is Inequality or Gini Index in State Line?
Inequality or Gini Index in State Line is 0.65.
What is the Total Population of State Line?
Total Population of State Line is 824.
What is the Total Male Population of State Line?
Total Male Population of State Line is 467.
What is the Total Female Population of State Line?
Total Female Population of State Line is 357.
What is the Ratio of Males per 100 Females in State Line?
There are 130.81 Males per 100 Females in State Line.
What is the Ratio of Females per 100 Males in State Line?
There are 76.45 Females per 100 Males in State Line.
What is the Median Population Age in State Line?
Median Population Age in State Line is 34.0 Years.
What is the Average Family Size in State Line
Average Family Size in State Line is 4.2 People.
What is the Average Household Size in State Line
Average Household Size in State Line is 2.7 People.
How Large is the Labor Force in State Line?
There are 386 People in the Labor Forcein in State Line.
What is the Percentage of People in the Labor Force in State Line?
56.4% of People are in the Labor Force in State Line.
What is the Unemployment Rate in State Line?
Unemployment Rate in State Line is 40.4%.