Zip Codes with the Highest Percentage of Families with Income Below $10,000 in Brandon, MS
RELATED REPORTS & OPTIONS
Family Income | $0-10k
Brandon
Compare Zip Codes
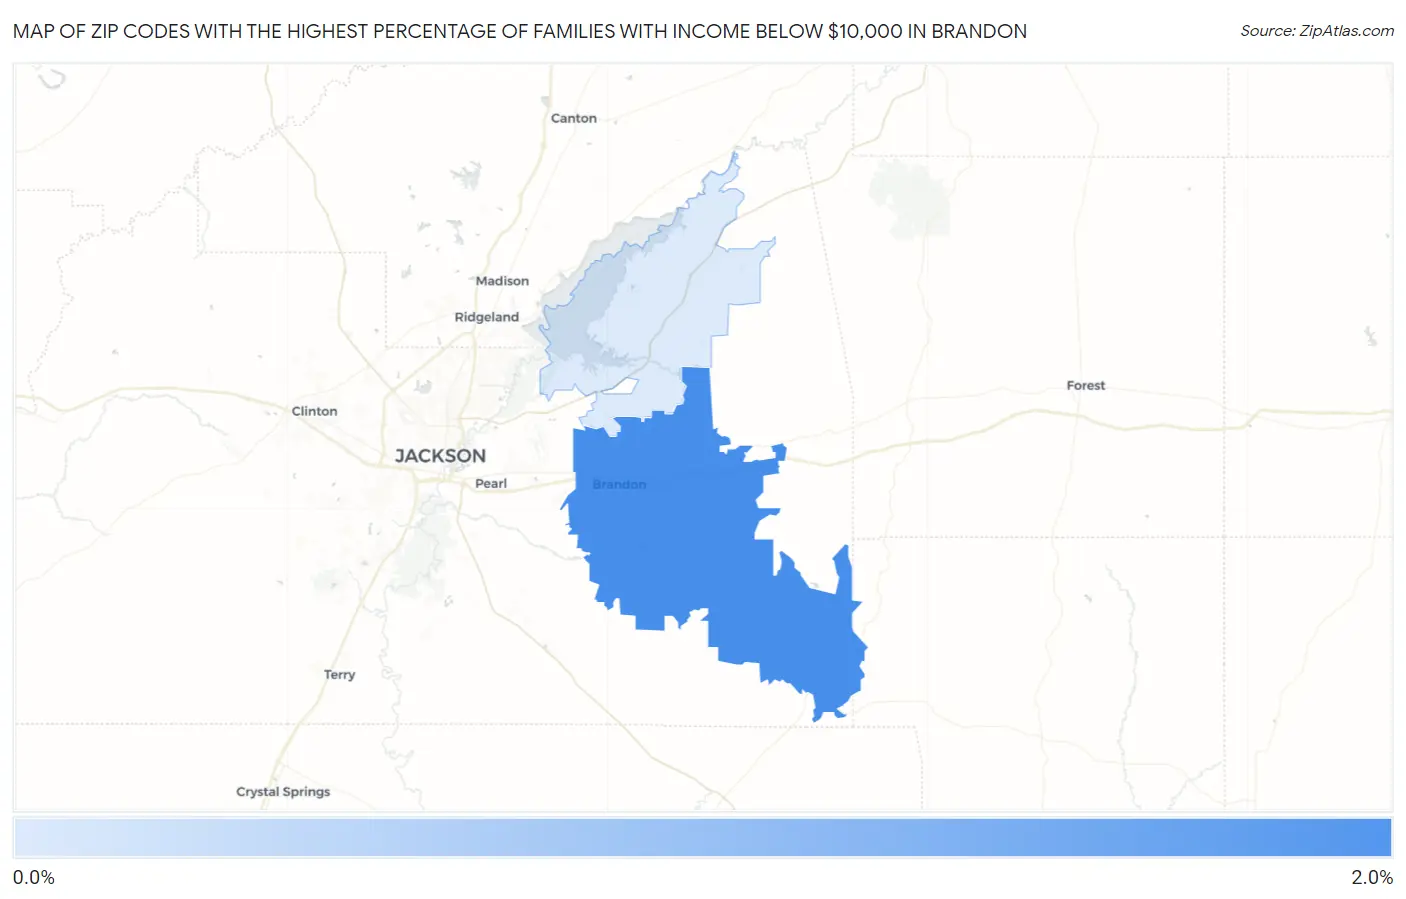
Map of Zip Codes with the Highest Percentage of Families with Income Below $10,000 in Brandon
0.20%
1.6%
Zip Codes with the Highest Percentage of Families with Income Below $10,000 in Brandon, MS
| Zip Code | Families with Income < $10k | vs State | vs National | |
| 1. | 39042 | 1.6% | 5.0%(-3.40)#284 | 3.1%(-1.50)#17,223 |
| 2. | 39047 | 0.20% | 5.0%(-4.80)#323 | 3.1%(-2.90)#23,643 |
1
Common Questions
What are the Top Zip Codes with the Highest Percentage of Families with Income Below $10,000 in Brandon, MS?
Top Zip Codes with the Highest Percentage of Families with Income Below $10,000 in Brandon, MS are:
What zip code has the Highest Percentage of Families with Income Below $10,000 in Brandon, MS?
39042 has the Highest Percentage of Families with Income Below $10,000 in Brandon, MS with 1.6%.
What is the Percentage of Families with Income Below $10,000 in Brandon, MS?
Percentage of Families with Income Below $10,000 in Brandon is 1.9%.
What is the Percentage of Families with Income Below $10,000 in Mississippi?
Percentage of Families with Income Below $10,000 in Mississippi is 5.0%.
What is the Percentage of Families with Income Below $10,000 in the United States?
Percentage of Families with Income Below $10,000 in the United States is 3.1%.