Zip Codes with the Highest Percentage of Families with Income Below $10,000 in Moss Point, MS
RELATED REPORTS & OPTIONS
Family Income | $0-10k
Moss Point
Compare Zip Codes
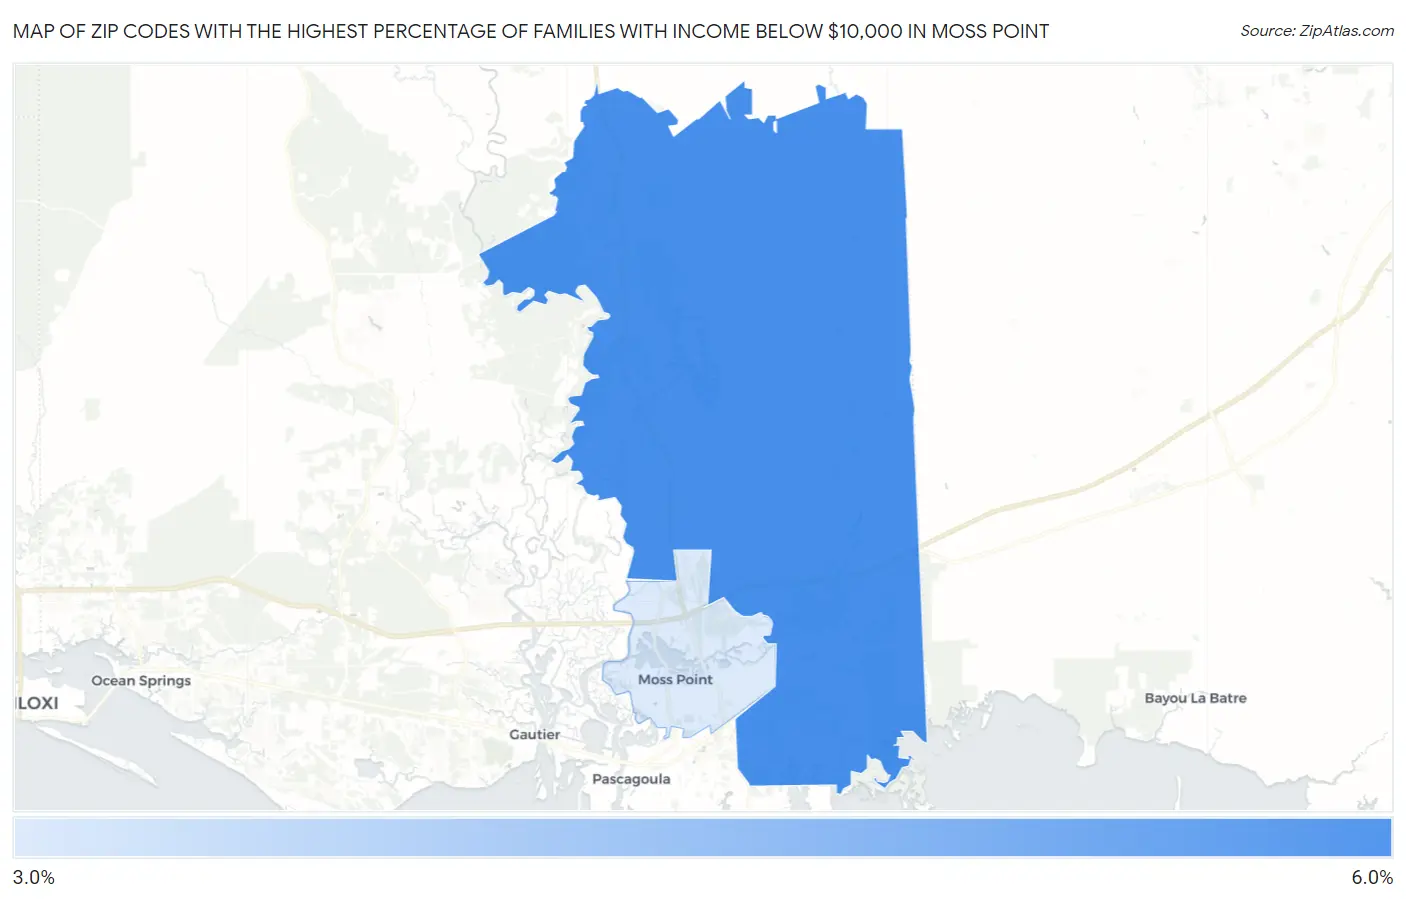
Map of Zip Codes with the Highest Percentage of Families with Income Below $10,000 in Moss Point
3.3%
5.3%
Zip Codes with the Highest Percentage of Families with Income Below $10,000 in Moss Point, MS
| Zip Code | Families with Income < $10k | vs State | vs National | |
| 1. | 39562 | 5.3% | 5.0%(+0.300)#152 | 3.1%(+2.20)#5,627 |
| 2. | 39563 | 3.3% | 5.0%(-1.70)#229 | 3.1%(+0.200)#10,220 |
1
Common Questions
What are the Top Zip Codes with the Highest Percentage of Families with Income Below $10,000 in Moss Point, MS?
Top Zip Codes with the Highest Percentage of Families with Income Below $10,000 in Moss Point, MS are:
What zip code has the Highest Percentage of Families with Income Below $10,000 in Moss Point, MS?
39562 has the Highest Percentage of Families with Income Below $10,000 in Moss Point, MS with 5.3%.
What is the Percentage of Families with Income Below $10,000 in Moss Point, MS?
Percentage of Families with Income Below $10,000 in Moss Point is 3.2%.
What is the Percentage of Families with Income Below $10,000 in Mississippi?
Percentage of Families with Income Below $10,000 in Mississippi is 5.0%.
What is the Percentage of Families with Income Below $10,000 in the United States?
Percentage of Families with Income Below $10,000 in the United States is 3.1%.