Morgan City, MS Map & Demographics
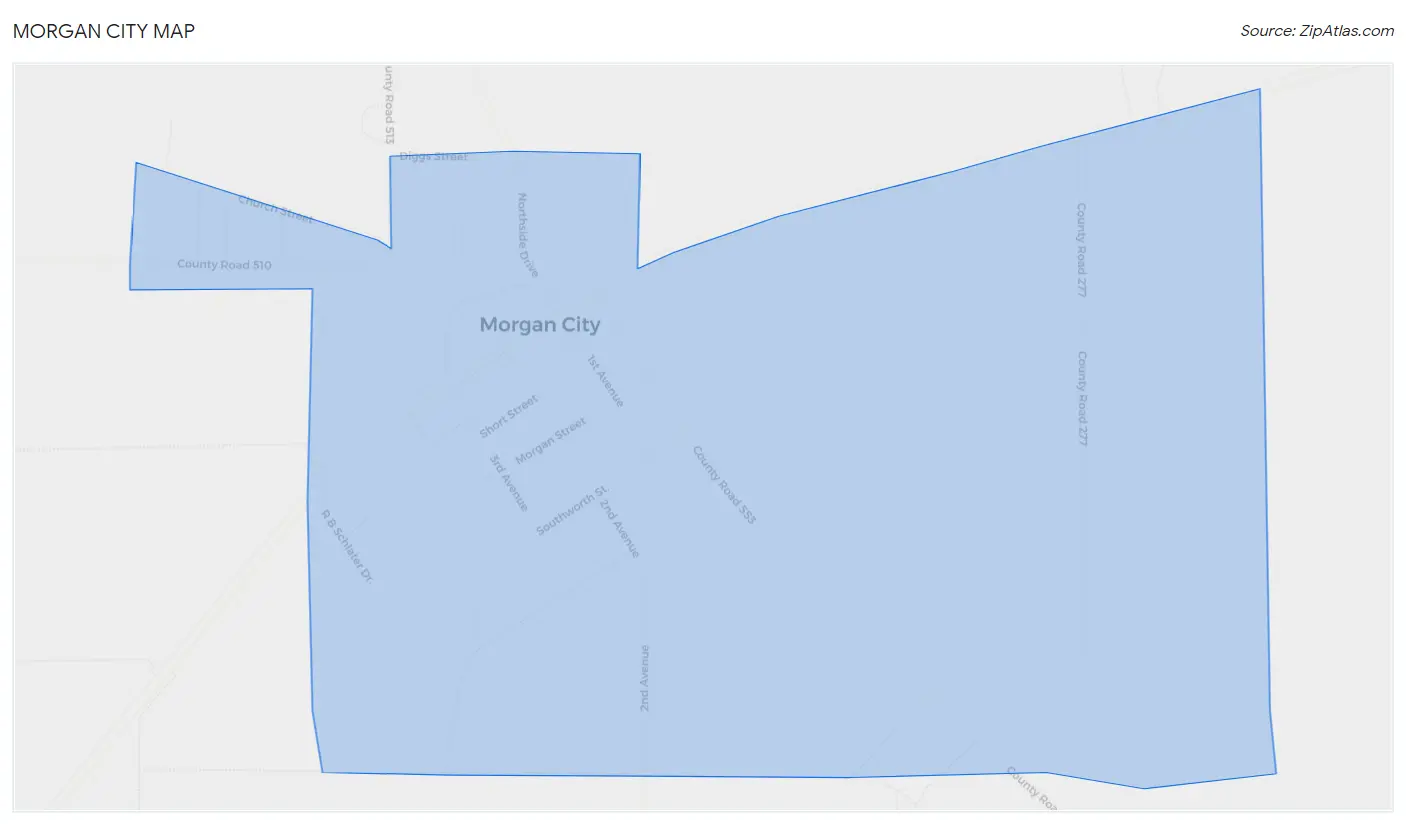
Morgan City Map
Morgan City Overview
$12,474
PER CAPITA INCOME
$17,292
AVG HOUSEHOLD INCOME
0.43
INEQUALITY / GINI INDEX
186
TOTAL POPULATION
92
MALE POPULATION
94
FEMALE POPULATION
97.87
MALES / 100 FEMALES
102.17
FEMALES / 100 MALES
34.8
MEDIAN AGE
4.9
AVG FAMILY SIZE
2.8
AVG HOUSEHOLD SIZE
72
LABOR FORCE [ PEOPLE ]
51.4%
PERCENT IN LABOR FORCE
9.7%
UNEMPLOYMENT RATE
Morgan City Zip Codes
Morgan City Area Codes
Income in Morgan City
Income Overview in Morgan City
| Characteristic | Number | Measure |
| Per Capita Income | 186 | $12,474 |
| Median Family Income | 30 | $0 |
| Mean Family Income | 30 | $32,320 |
| Median Household Income | 67 | $17,292 |
| Mean Household Income | 67 | $25,651 |
| Income Deficit | 30 | $0 |
| Wage / Income Gap (%) | 186 | 0.00% |
| Wage / Income Gap ($) | 186 | 100.00¢ per $1 |
| Gini / Inequality Index | 186 | 0.43 |
Earnings by Sex in Morgan City
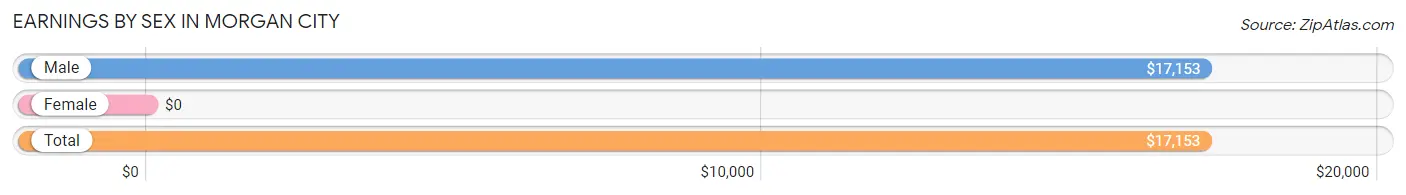
| Sex | Number | Average Earnings |
| Male | 45 (58.4%) | $17,153 |
| Female | 32 (41.6%) | $0 |
| Total | 77 (100.0%) | $17,153 |
Earnings by Sex by Income Bracket in Morgan City
The most common earnings brackets in Morgan City are $15,000 to $17,499 for men (18 | 40.0%) and $10,000 to $12,499 for women (13 | 40.6%).
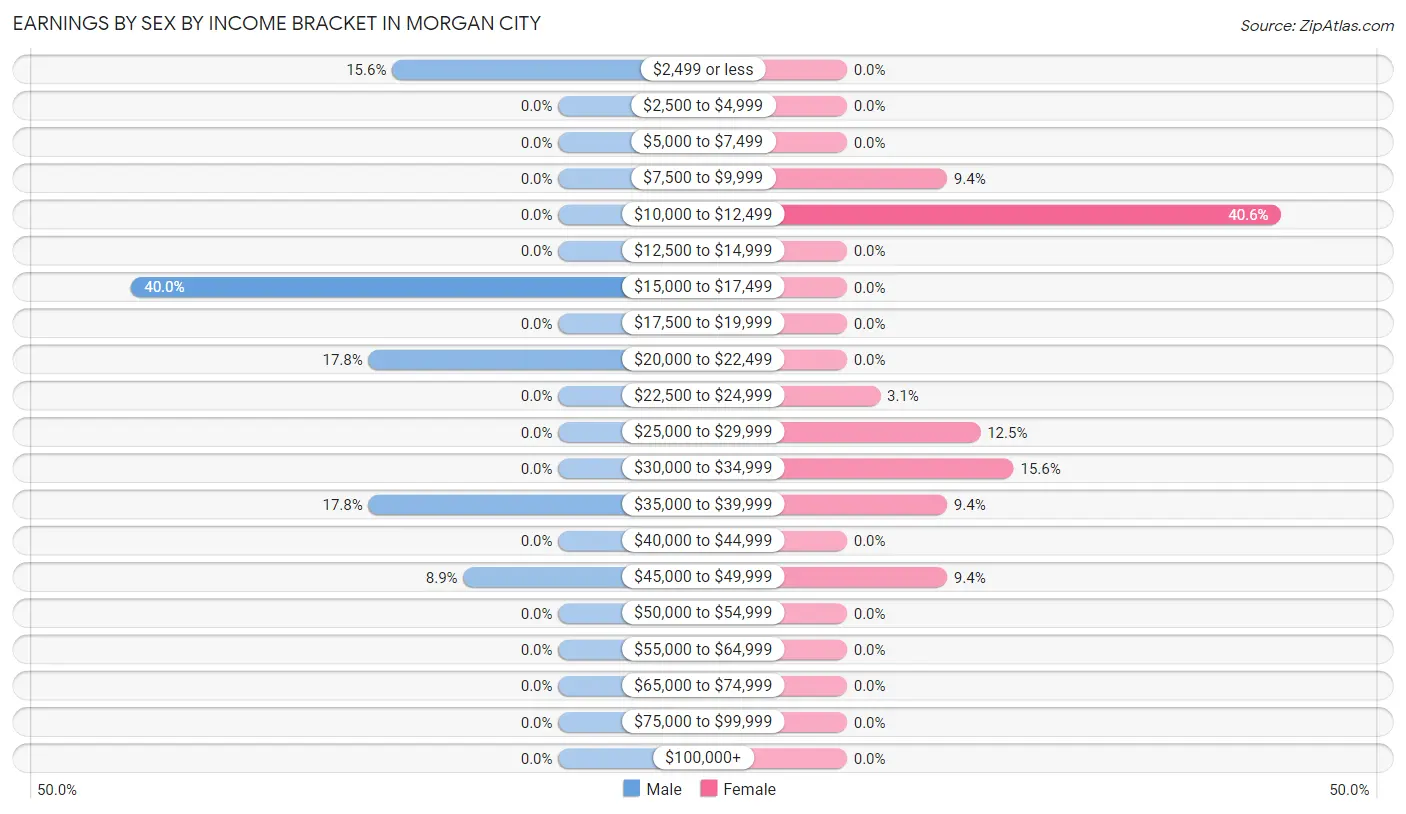
| Income | Male | Female |
| $2,499 or less | 7 (15.6%) | 0 (0.0%) |
| $2,500 to $4,999 | 0 (0.0%) | 0 (0.0%) |
| $5,000 to $7,499 | 0 (0.0%) | 0 (0.0%) |
| $7,500 to $9,999 | 0 (0.0%) | 3 (9.4%) |
| $10,000 to $12,499 | 0 (0.0%) | 13 (40.6%) |
| $12,500 to $14,999 | 0 (0.0%) | 0 (0.0%) |
| $15,000 to $17,499 | 18 (40.0%) | 0 (0.0%) |
| $17,500 to $19,999 | 0 (0.0%) | 0 (0.0%) |
| $20,000 to $22,499 | 8 (17.8%) | 0 (0.0%) |
| $22,500 to $24,999 | 0 (0.0%) | 1 (3.1%) |
| $25,000 to $29,999 | 0 (0.0%) | 4 (12.5%) |
| $30,000 to $34,999 | 0 (0.0%) | 5 (15.6%) |
| $35,000 to $39,999 | 8 (17.8%) | 3 (9.4%) |
| $40,000 to $44,999 | 0 (0.0%) | 0 (0.0%) |
| $45,000 to $49,999 | 4 (8.9%) | 3 (9.4%) |
| $50,000 to $54,999 | 0 (0.0%) | 0 (0.0%) |
| $55,000 to $64,999 | 0 (0.0%) | 0 (0.0%) |
| $65,000 to $74,999 | 0 (0.0%) | 0 (0.0%) |
| $75,000 to $99,999 | 0 (0.0%) | 0 (0.0%) |
| $100,000+ | 0 (0.0%) | 0 (0.0%) |
| Total | 45 (100.0%) | 32 (100.0%) |
Earnings by Sex by Educational Attainment in Morgan City
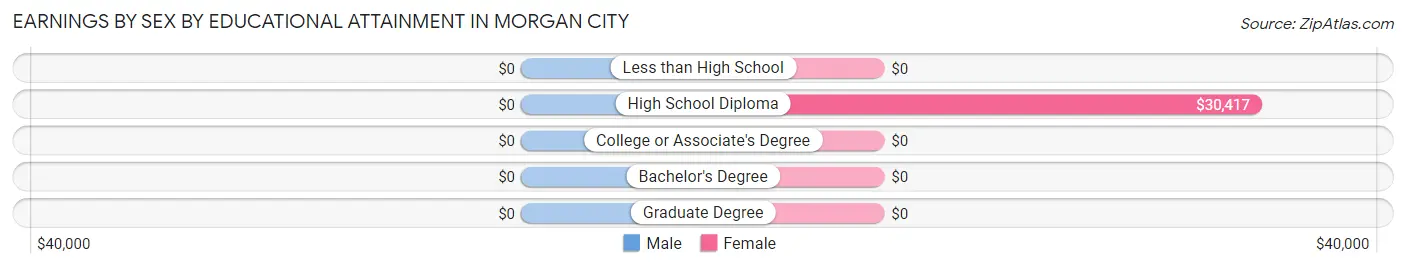
| Educational Attainment | Male Income | Female Income |
| Less than High School | - | - |
| High School Diploma | - | - |
| College or Associate's Degree | - | - |
| Bachelor's Degree | - | - |
| Graduate Degree | - | - |
| Total | $16,597 | $28,750 |
Family Income in Morgan City
Family Income Brackets in Morgan City
According to the Morgan City family income data, there are 10 families falling into the less than $10,000 income range, which is the most common income bracket and makes up 33.3% of all families.
| Income Bracket | # Families | % Families |
| Less than $10,000 | 10 | 33.3% |
| $10,000 to $14,999 | 0 | 0.0% |
| $15,000 to $24,999 | 6 | 20.0% |
| $25,000 to $34,999 | 0 | 0.0% |
| $35,000 to $49,999 | 3 | 10.0% |
| $50,000 to $74,999 | 9 | 30.0% |
| $75,000 to $99,999 | 2 | 6.7% |
| $100,000 to $149,999 | 0 | 0.0% |
| $150,000 to $199,999 | 0 | 0.0% |
| $200,000+ | 0 | 0.0% |
Family Income by Famaliy Size in Morgan City
4-person families (12 | 40.0%) account for the highest median family income in Morgan City with $57,857 per family, while 4-person families (12 | 40.0%) have the highest median income of $14,464 per family member.
| Income Bracket | # Families | Median Income |
| 2-Person Families | 11 (36.7%) | $0 |
| 3-Person Families | 2 (6.7%) | $0 |
| 4-Person Families | 12 (40.0%) | $57,857 |
| 5-Person Families | 3 (10.0%) | $0 |
| 6-Person Families | 2 (6.7%) | $0 |
| 7+ Person Families | 0 (0.0%) | $0 |
| Total | 30 (100.0%) | $0 |
Family Income by Number of Earners in Morgan City
| Number of Earners | # Families | Median Income |
| No Earners | 9 (30.0%) | $16,875 |
| 1 Earner | 18 (60.0%) | $0 |
| 2 Earners | 1 (3.3%) | $0 |
| 3+ Earners | 2 (6.7%) | $0 |
| Total | 30 (100.0%) | $0 |
Household Income in Morgan City
Household Income Brackets in Morgan City
With 24 households falling in the category, the $15,000 to $24,999 income range is the most frequent in Morgan City, accounting for 35.8% of all households.
| Income Bracket | # Households | % Households |
| Less than $10,000 | 15 | 22.4% |
| $10,000 to $14,999 | 2 | 3.0% |
| $15,000 to $24,999 | 24 | 35.8% |
| $25,000 to $34,999 | 10 | 14.9% |
| $35,000 to $49,999 | 4 | 6.0% |
| $50,000 to $74,999 | 10 | 14.9% |
| $75,000 to $99,999 | 2 | 3.0% |
| $100,000 to $149,999 | 0 | 0.0% |
| $150,000 to $199,999 | 0 | 0.0% |
| $200,000+ | 0 | 0.0% |
Household Income by Householder Age in Morgan City
The median household income in Morgan City is $17,292, with the highest median household income of $58,036 found in the 25 to 44 years age bracket for the primary householder. A total of 11 households (16.4%) fall into this category.
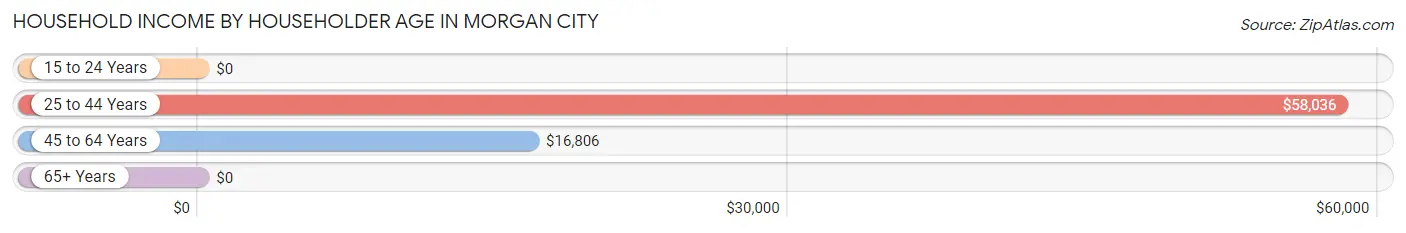
| Income Bracket | # Households | Median Income |
| 15 to 24 Years | 0 (0.0%) | $0 |
| 25 to 44 Years | 11 (16.4%) | $58,036 |
| 45 to 64 Years | 46 (68.7%) | $16,806 |
| 65+ Years | 10 (14.9%) | $0 |
| Total | 67 (100.0%) | $17,292 |
Poverty in Morgan City
Income Below Poverty by Sex and Age in Morgan City
With 30.4% poverty level for males and 43.6% for females among the residents of Morgan City, under 5 year old males and 6 to 11 year old females are the most vulnerable to poverty, with 8 males (100.0%) and 3 females (100.0%) in their respective age groups living below the poverty level.
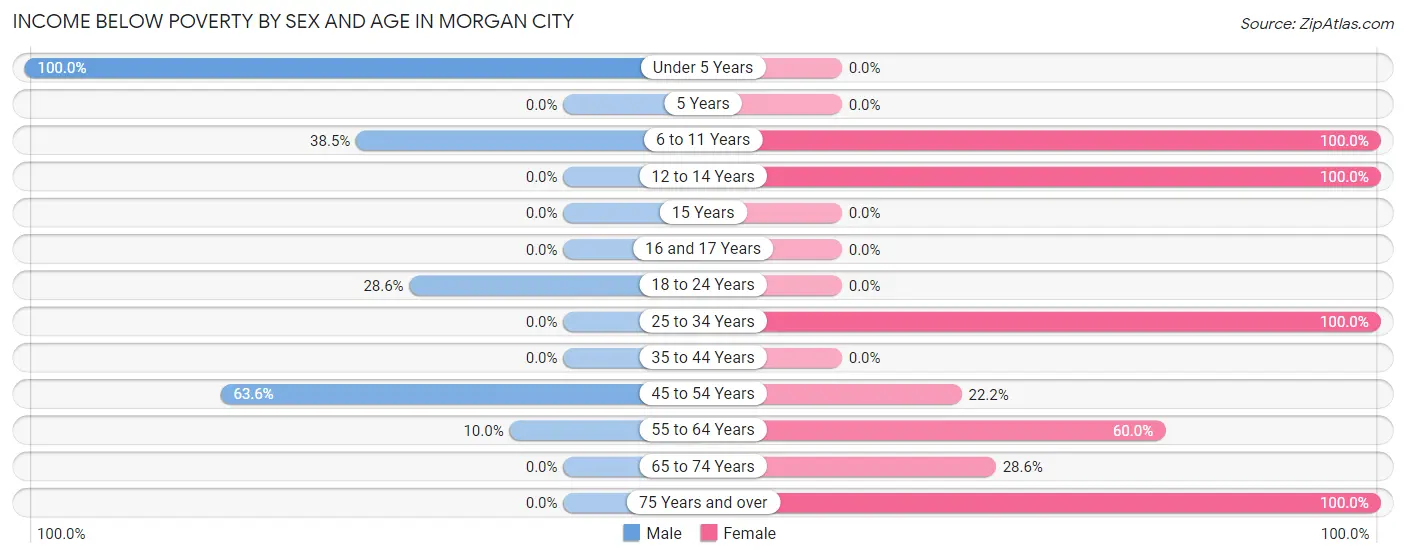
| Age Bracket | Male | Female |
| Under 5 Years | 8 (100.0%) | 0 (0.0%) |
| 5 Years | 0 (0.0%) | 0 (0.0%) |
| 6 to 11 Years | 5 (38.5%) | 3 (100.0%) |
| 12 to 14 Years | 0 (0.0%) | 4 (100.0%) |
| 15 Years | 0 (0.0%) | 0 (0.0%) |
| 16 and 17 Years | 0 (0.0%) | 0 (0.0%) |
| 18 to 24 Years | 6 (28.6%) | 0 (0.0%) |
| 25 to 34 Years | 0 (0.0%) | 14 (100.0%) |
| 35 to 44 Years | 0 (0.0%) | 0 (0.0%) |
| 45 to 54 Years | 7 (63.6%) | 4 (22.2%) |
| 55 to 64 Years | 2 (10.0%) | 12 (60.0%) |
| 65 to 74 Years | 0 (0.0%) | 2 (28.6%) |
| 75 Years and over | 0 (0.0%) | 2 (100.0%) |
| Total | 28 (30.4%) | 41 (43.6%) |
Income Above Poverty by Sex and Age in Morgan City
According to the poverty statistics in Morgan City, males aged 12 to 14 years and females aged 15 years are the age groups that are most secure financially, with 100.0% of males and 100.0% of females in these age groups living above the poverty line.
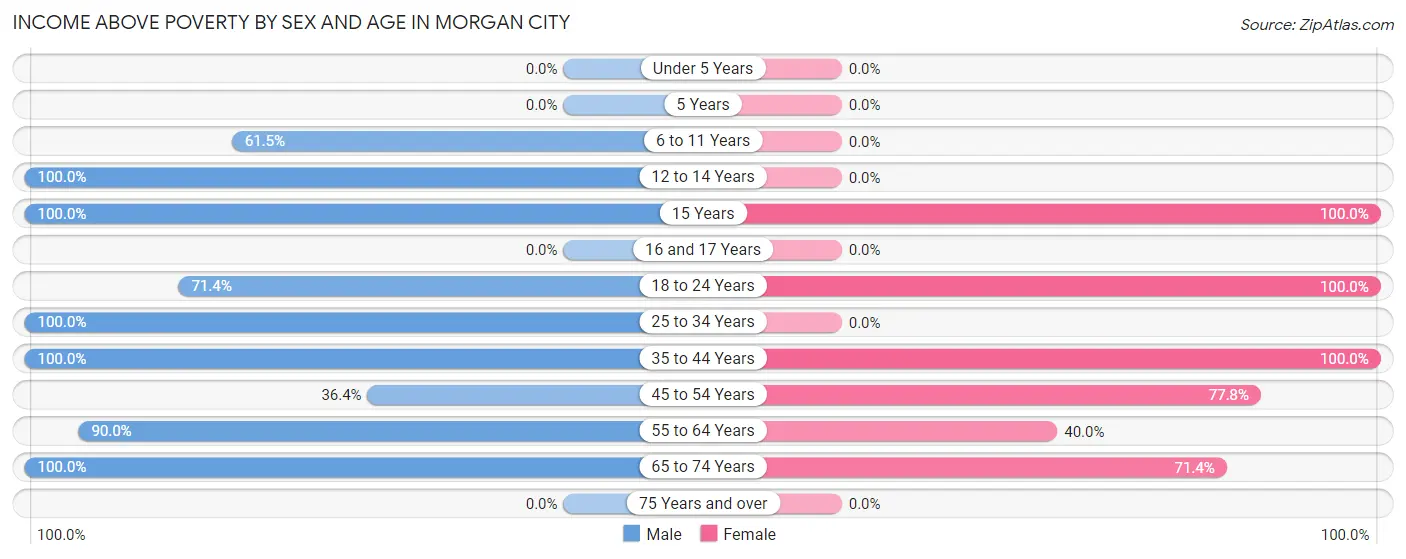
| Age Bracket | Male | Female |
| Under 5 Years | 0 (0.0%) | 0 (0.0%) |
| 5 Years | 0 (0.0%) | 0 (0.0%) |
| 6 to 11 Years | 8 (61.5%) | 0 (0.0%) |
| 12 to 14 Years | 3 (100.0%) | 0 (0.0%) |
| 15 Years | 3 (100.0%) | 12 (100.0%) |
| 16 and 17 Years | 0 (0.0%) | 0 (0.0%) |
| 18 to 24 Years | 15 (71.4%) | 6 (100.0%) |
| 25 to 34 Years | 8 (100.0%) | 0 (0.0%) |
| 35 to 44 Years | 2 (100.0%) | 8 (100.0%) |
| 45 to 54 Years | 4 (36.4%) | 14 (77.8%) |
| 55 to 64 Years | 18 (90.0%) | 8 (40.0%) |
| 65 to 74 Years | 3 (100.0%) | 5 (71.4%) |
| 75 Years and over | 0 (0.0%) | 0 (0.0%) |
| Total | 64 (69.6%) | 53 (56.4%) |
Income Below Poverty Among Married-Couple Families in Morgan City
The poverty statistics for married-couple families in Morgan City show that 40.0% or 2 of the total 5 families live below the poverty line. Families with no children have the highest poverty rate of 40.0%, comprising of 2 families. On the other hand, families with no children have the lowest poverty rate of 40.0%, which includes 2 families.
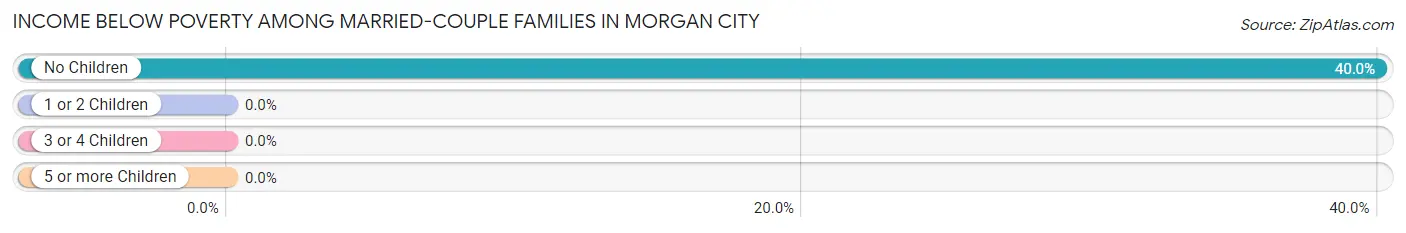
| Children | Above Poverty | Below Poverty |
| No Children | 3 (60.0%) | 2 (40.0%) |
| 1 or 2 Children | 0 (0.0%) | 0 (0.0%) |
| 3 or 4 Children | 0 (0.0%) | 0 (0.0%) |
| 5 or more Children | 0 (0.0%) | 0 (0.0%) |
| Total | 3 (60.0%) | 2 (40.0%) |
Income Below Poverty Among Single-Parent Households in Morgan City
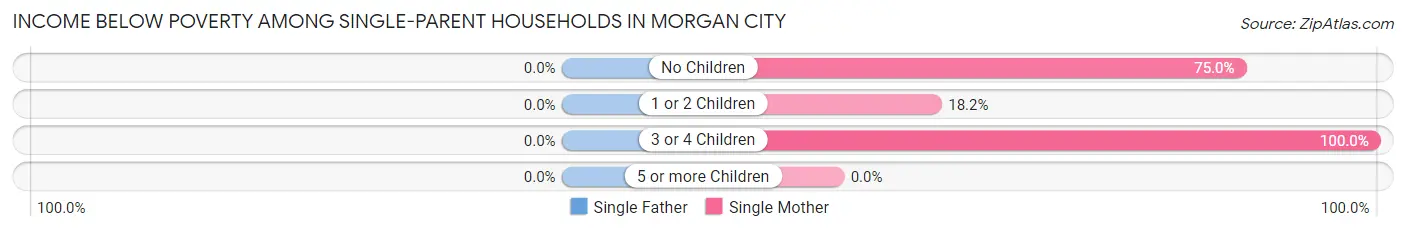
| Children | Single Father | Single Mother |
| No Children | 0 (0.0%) | 6 (75.0%) |
| 1 or 2 Children | 0 (0.0%) | 2 (18.2%) |
| 3 or 4 Children | 0 (0.0%) | 6 (100.0%) |
| 5 or more Children | 0 (0.0%) | 0 (0.0%) |
| Total | 0 (0.0%) | 14 (56.0%) |
Income Below Poverty Among Married-Couple vs Single-Parent Households in Morgan City
The poverty data for Morgan City shows that 2 of the married-couple family households (40.0%) and 14 of the single-parent households (56.0%) are living below the poverty level. Within the married-couple family households, those with no children have the highest poverty rate, with 2 households (40.0%) falling below the poverty line. Among the single-parent households, those with 3 or 4 children have the highest poverty rate, with 6 household (100.0%) living below poverty.
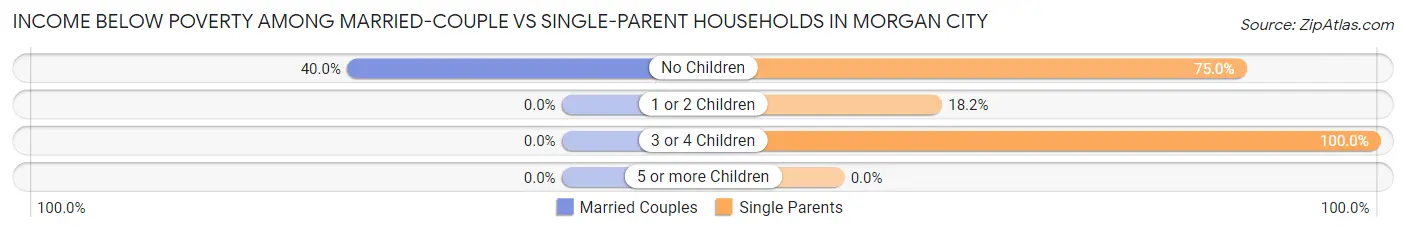
| Children | Married-Couple Families | Single-Parent Households |
| No Children | 2 (40.0%) | 6 (75.0%) |
| 1 or 2 Children | 0 (0.0%) | 2 (18.2%) |
| 3 or 4 Children | 0 (0.0%) | 6 (100.0%) |
| 5 or more Children | 0 (0.0%) | 0 (0.0%) |
| Total | 2 (40.0%) | 14 (56.0%) |
Race in Morgan City
The most populous races in Morgan City are Black / African American (160 | 86.0%), and White / Caucasian (26 | 14.0%).
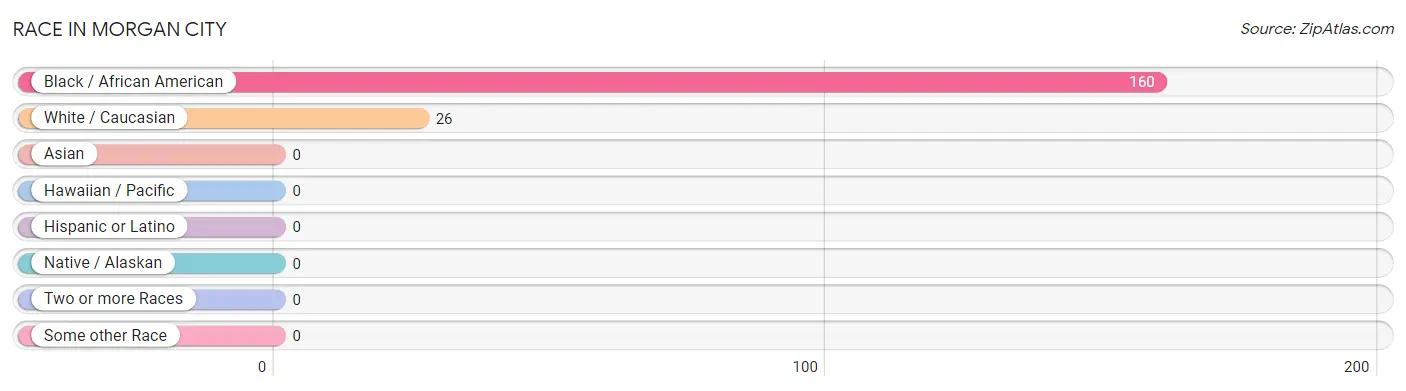
| Race | # Population | % Population |
| Asian | 0 | 0.0% |
| Black / African American | 160 | 86.0% |
| Hawaiian / Pacific | 0 | 0.0% |
| Hispanic or Latino | 0 | 0.0% |
| Native / Alaskan | 0 | 0.0% |
| White / Caucasian | 26 | 14.0% |
| Two or more Races | 0 | 0.0% |
| Some other Race | 0 | 0.0% |
| Total | 186 | 100.0% |
Ancestry in Morgan City
The most populous ancestries reported in Morgan City are , and American (16 | 8.6%), together accounting for 8.6% of all Morgan City residents.

| Ancestry | # Population | % Population |
| American | 16 | 8.6% | View All 1 Rows |
Immigrants in Morgan City

| Immigration Origin | # Population | % Population | View All 0 Rows |
Sex and Age in Morgan City
Sex and Age in Morgan City
The most populous age groups in Morgan City are 20 to 24 Years (21 | 22.8%) for men and 45 to 49 Years (18 | 19.2%) for women.
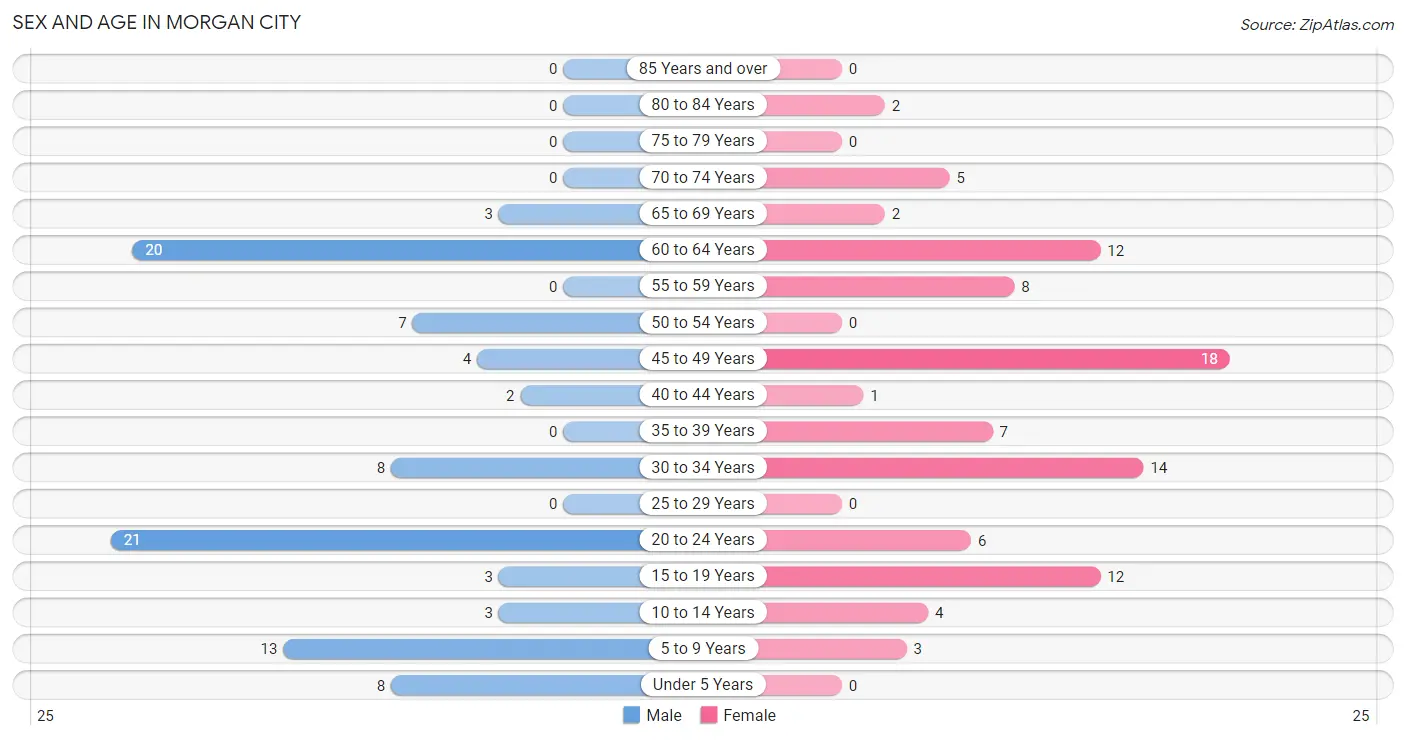
| Age Bracket | Male | Female |
| Under 5 Years | 8 (8.7%) | 0 (0.0%) |
| 5 to 9 Years | 13 (14.1%) | 3 (3.2%) |
| 10 to 14 Years | 3 (3.3%) | 4 (4.3%) |
| 15 to 19 Years | 3 (3.3%) | 12 (12.8%) |
| 20 to 24 Years | 21 (22.8%) | 6 (6.4%) |
| 25 to 29 Years | 0 (0.0%) | 0 (0.0%) |
| 30 to 34 Years | 8 (8.7%) | 14 (14.9%) |
| 35 to 39 Years | 0 (0.0%) | 7 (7.4%) |
| 40 to 44 Years | 2 (2.2%) | 1 (1.1%) |
| 45 to 49 Years | 4 (4.3%) | 18 (19.2%) |
| 50 to 54 Years | 7 (7.6%) | 0 (0.0%) |
| 55 to 59 Years | 0 (0.0%) | 8 (8.5%) |
| 60 to 64 Years | 20 (21.7%) | 12 (12.8%) |
| 65 to 69 Years | 3 (3.3%) | 2 (2.1%) |
| 70 to 74 Years | 0 (0.0%) | 5 (5.3%) |
| 75 to 79 Years | 0 (0.0%) | 0 (0.0%) |
| 80 to 84 Years | 0 (0.0%) | 2 (2.1%) |
| 85 Years and over | 0 (0.0%) | 0 (0.0%) |
| Total | 92 (100.0%) | 94 (100.0%) |
Families and Households in Morgan City
Median Family Size in Morgan City
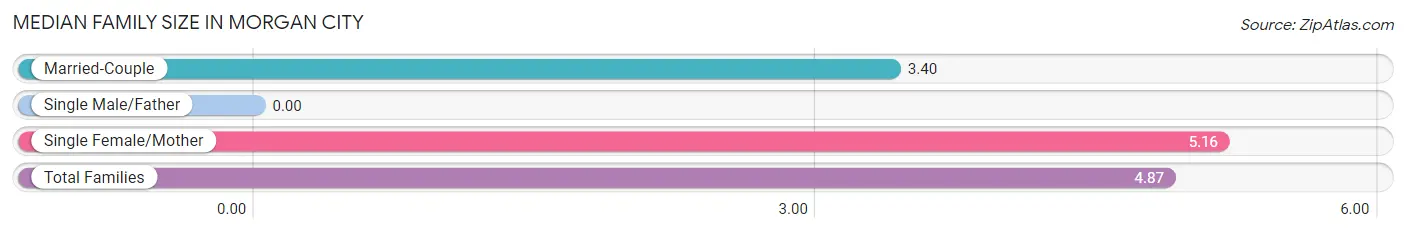
| Family Type | # Families | Family Size |
| Married-Couple | 5 (16.7%) | 3.40 |
| Single Male/Father | 0 (0.0%) | - |
| Single Female/Mother | 25 (83.3%) | 5.16 |
| Total Families | 30 (100.0%) | 4.87 |
Median Household Size in Morgan City
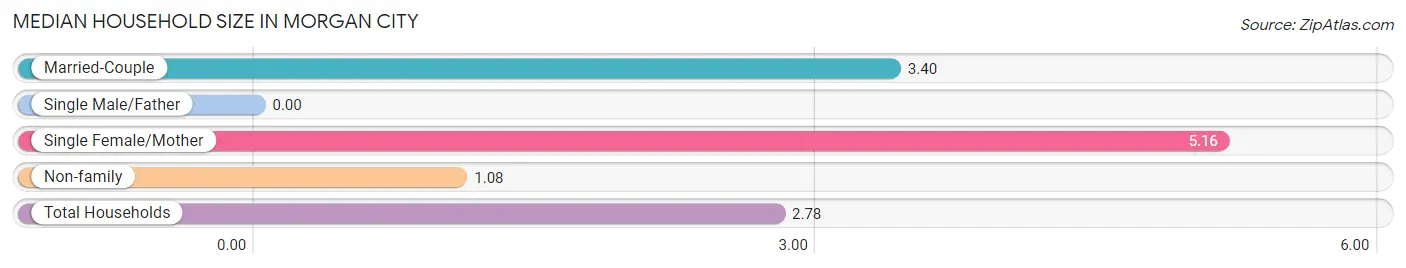
| Household Type | # Households | Household Size |
| Married-Couple | 5 (7.5%) | 3.40 |
| Single Male/Father | 0 (0.0%) | - |
| Single Female/Mother | 25 (37.3%) | 5.16 |
| Non-family | 37 (55.2%) | 1.08 |
| Total Households | 67 (100.0%) | 2.78 |
Household Size by Marriage Status in Morgan City
Out of a total of 67 households in Morgan City, 30 (44.8%) are family households, while 37 (55.2%) are nonfamily households. The most numerous type of family households are 4-person households, comprising 12, and the most common type of nonfamily households are 1-person households, comprising 36.
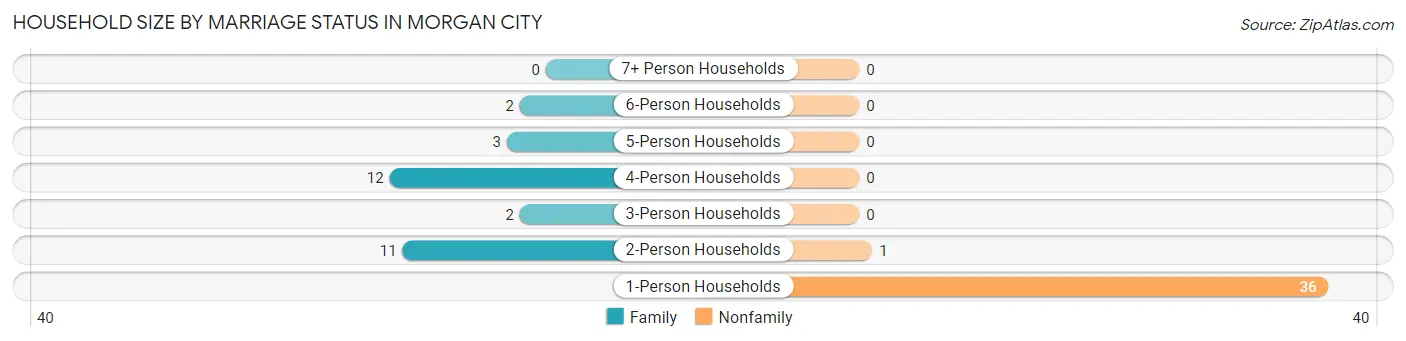
| Household Size | Family Households | Nonfamily Households |
| 1-Person Households | - | 36 (53.7%) |
| 2-Person Households | 11 (16.4%) | 1 (1.5%) |
| 3-Person Households | 2 (3.0%) | 0 (0.0%) |
| 4-Person Households | 12 (17.9%) | 0 (0.0%) |
| 5-Person Households | 3 (4.5%) | 0 (0.0%) |
| 6-Person Households | 2 (3.0%) | 0 (0.0%) |
| 7+ Person Households | 0 (0.0%) | 0 (0.0%) |
| Total | 30 (44.8%) | 37 (55.2%) |
Female Fertility in Morgan City
Fertility by Age in Morgan City
| Age Bracket | Women with Births | Births / 1,000 Women |
| 15 to 19 years | 0 (0.0%) | 0.0 |
| 20 to 34 years | 0 (0.0%) | 0.0 |
| 35 to 50 years | 0 (0.0%) | 0.0 |
| Total | 0 (0.0%) | 0.0 |
Fertility by Age by Marriage Status in Morgan City
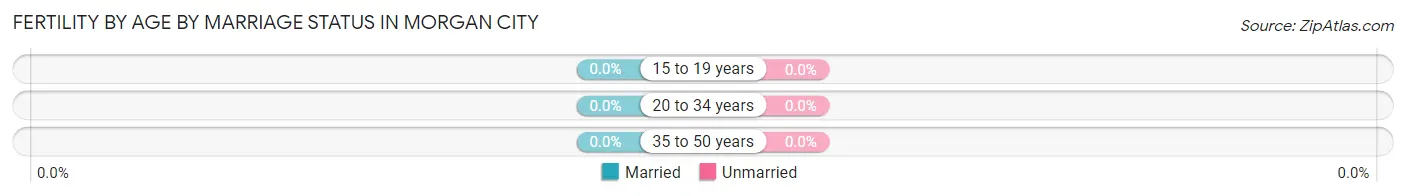
| Age Bracket | Married | Unmarried |
| 15 to 19 years | 0 (0.0%) | 0 (0.0%) |
| 20 to 34 years | 0 (0.0%) | 0 (0.0%) |
| 35 to 50 years | 0 (0.0%) | 0 (0.0%) |
| Total | 0 (0.0%) | 0 (0.0%) |
Fertility by Education in Morgan City
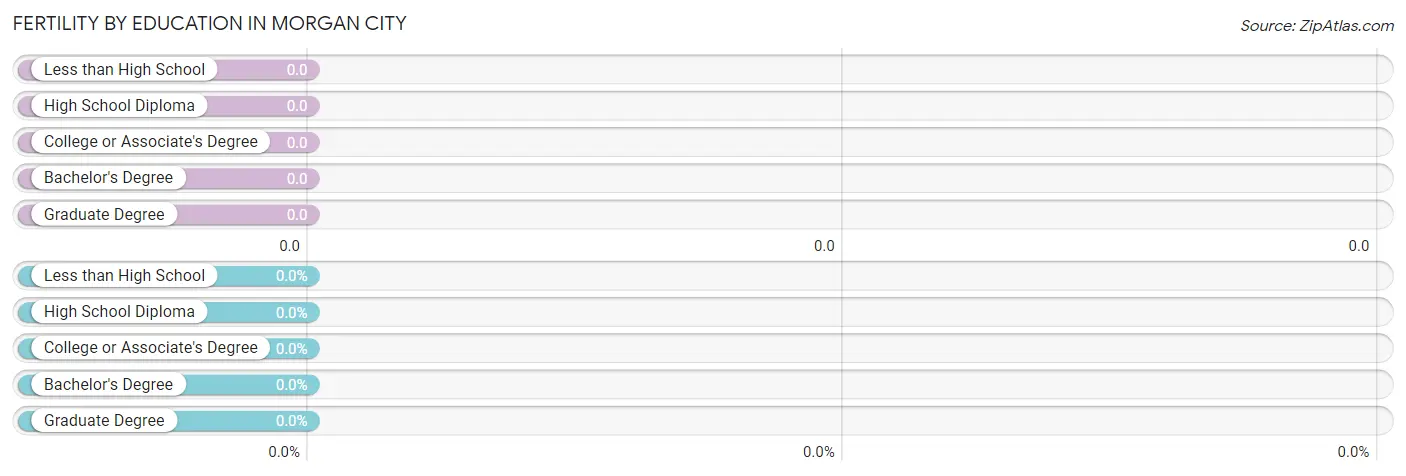
| Educational Attainment | Women with Births | Births / 1,000 Women |
| Less than High School | 0 (0.0%) | 0.0 |
| High School Diploma | 0 (0.0%) | 0.0 |
| College or Associate's Degree | 0 (0.0%) | 0.0 |
| Bachelor's Degree | 0 (0.0%) | 0.0 |
| Graduate Degree | 0 (0.0%) | 0.0 |
| Total | 0 (0.0%) | 0.0 |
Fertility by Education by Marriage Status in Morgan City
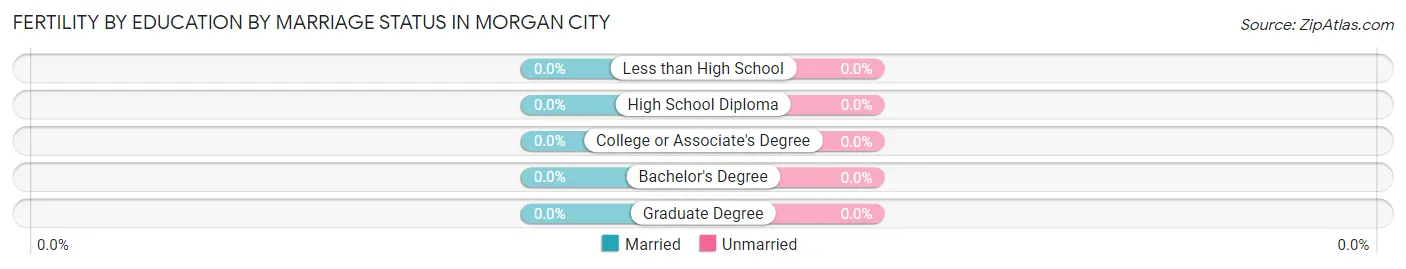
| Educational Attainment | Married | Unmarried |
| Less than High School | 0 (0.0%) | 0 (0.0%) |
| High School Diploma | 0 (0.0%) | 0 (0.0%) |
| College or Associate's Degree | 0 (0.0%) | 0 (0.0%) |
| Bachelor's Degree | 0 (0.0%) | 0 (0.0%) |
| Graduate Degree | 0 (0.0%) | 0 (0.0%) |
| Total | 0 (0.0%) | 0 (0.0%) |
Employment Characteristics in Morgan City
Employment by Class of Employer in Morgan City
Among the 65 employed individuals in Morgan City, private company employees (42 | 64.6%), self-employed (not incorporated) (16 | 24.6%), and local government employees (4 | 6.1%) make up the most common classes of employment.
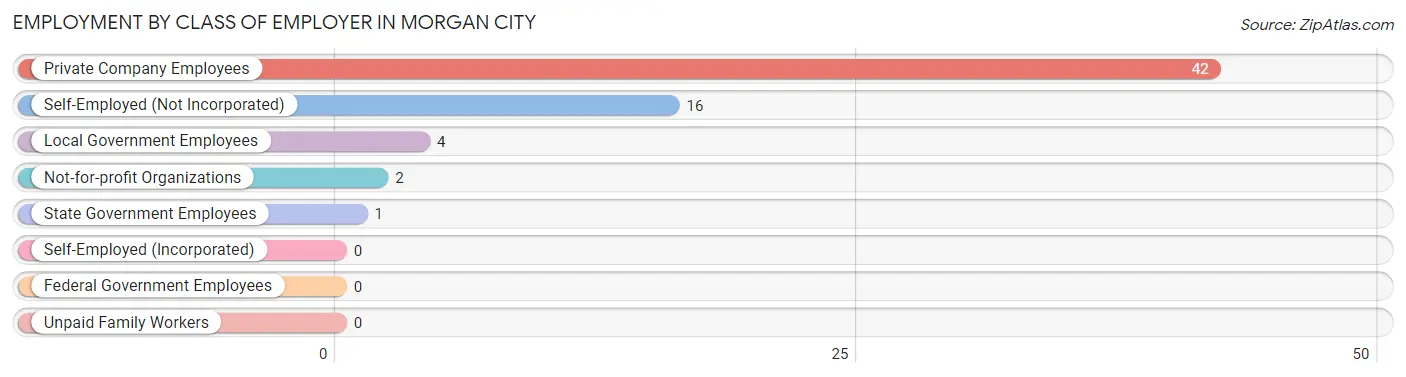
| Employer Class | # Employees | % Employees |
| Private Company Employees | 42 | 64.6% |
| Self-Employed (Incorporated) | 0 | 0.0% |
| Self-Employed (Not Incorporated) | 16 | 24.6% |
| Not-for-profit Organizations | 2 | 3.1% |
| Local Government Employees | 4 | 6.1% |
| State Government Employees | 1 | 1.5% |
| Federal Government Employees | 0 | 0.0% |
| Unpaid Family Workers | 0 | 0.0% |
| Total | 65 | 100.0% |
Employment Status by Age in Morgan City
According to the labor force statistics for Morgan City, out of the total population over 16 years of age (140), 51.4% or 72 individuals are in the labor force, with 9.7% or 7 of them unemployed. The age group with the highest labor force participation rate is 45 to 54 years, with 86.2% or 25 individuals in the labor force. Within the labor force, the 45 to 54 years age range has the highest percentage of unemployed individuals, with 28.0% or 7 of them being unemployed.
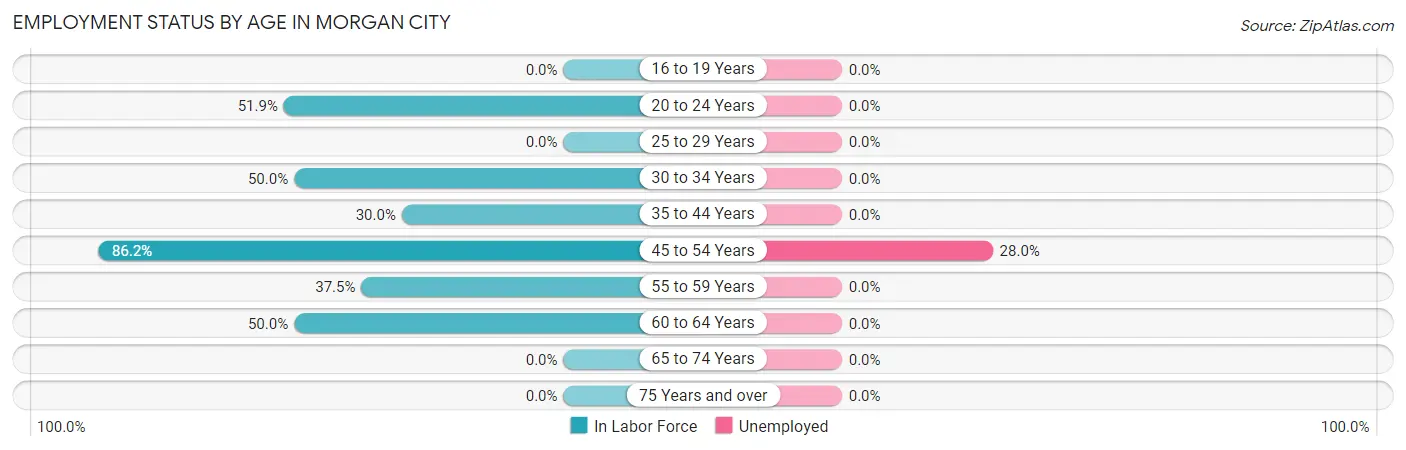
| Age Bracket | In Labor Force | Unemployed |
| 16 to 19 Years | 0 (0.0%) | 0 (0.0%) |
| 20 to 24 Years | 14 (51.9%) | 0 (0.0%) |
| 25 to 29 Years | 0 (0.0%) | 0 (0.0%) |
| 30 to 34 Years | 11 (50.0%) | 0 (0.0%) |
| 35 to 44 Years | 3 (30.0%) | 0 (0.0%) |
| 45 to 54 Years | 25 (86.2%) | 7 (28.0%) |
| 55 to 59 Years | 3 (37.5%) | 0 (0.0%) |
| 60 to 64 Years | 16 (50.0%) | 0 (0.0%) |
| 65 to 74 Years | 0 (0.0%) | 0 (0.0%) |
| 75 Years and over | 0 (0.0%) | 0 (0.0%) |
| Total | 72 (51.4%) | 7 (9.7%) |
Employment Status by Educational Attainment in Morgan City
According to labor force statistics for Morgan City, 57.4% of individuals (58) out of the total population between 25 and 64 years of age (101) are in the labor force, with 12.1% or 7 of them being unemployed. The group with the highest labor force participation rate are those with the educational attainment of college / associate degree, with 100.0% or 29 individuals in the labor force. Within the labor force, individuals with high school diploma education have the highest percentage of unemployment, with 63.6% or 7 of them being unemployed.
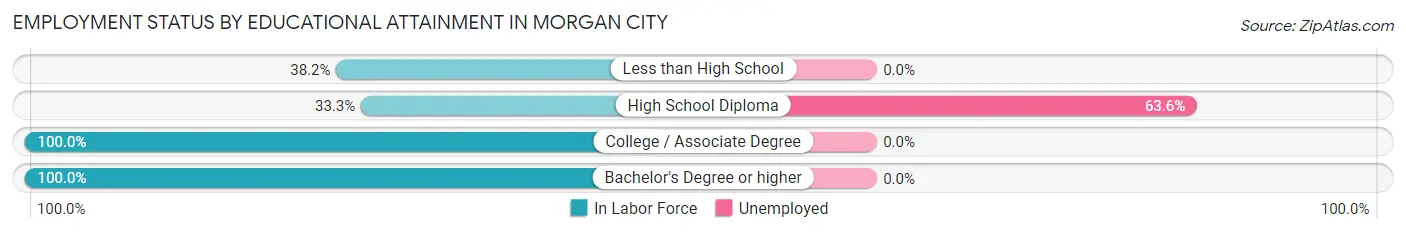
| Educational Attainment | In Labor Force | Unemployed |
| Less than High School | 13 (38.2%) | 0 (0.0%) |
| High School Diploma | 11 (33.3%) | 21 (63.6%) |
| College / Associate Degree | 29 (100.0%) | 0 (0.0%) |
| Bachelor's Degree or higher | 5 (100.0%) | 0 (0.0%) |
| Total | 58 (57.4%) | 12 (12.1%) |
Employment Occupations by Sex in Morgan City
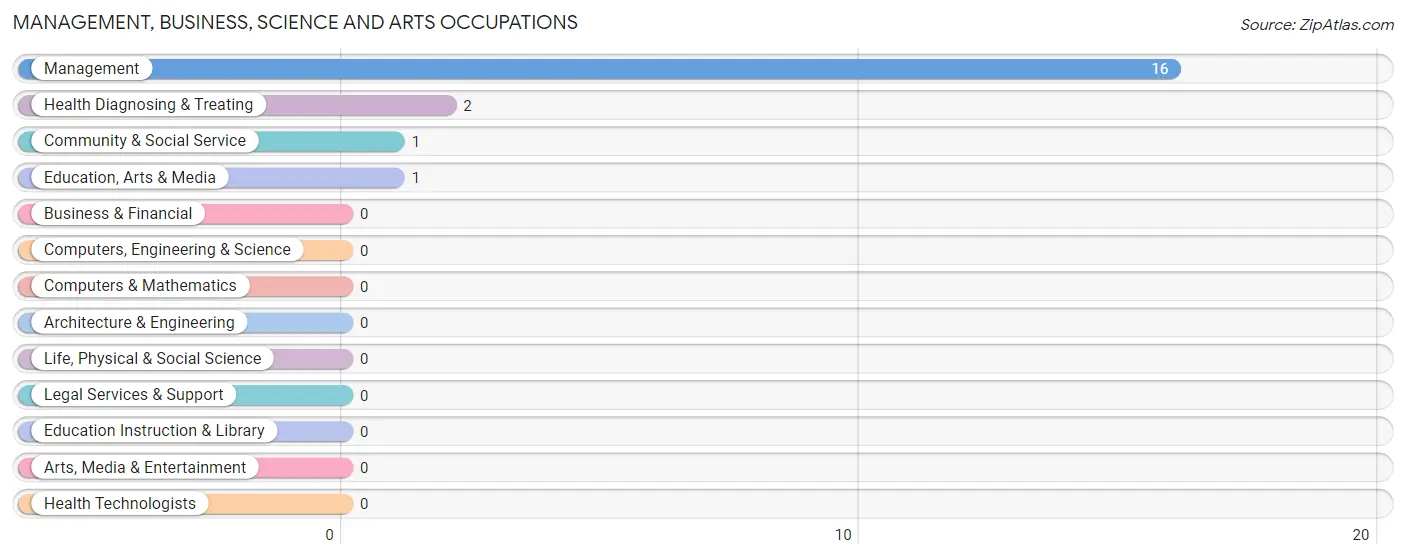
Management, Business, Science and Arts Occupations
The most common Management, Business, Science and Arts occupations in Morgan City are Management (16 | 24.6%), Health Diagnosing & Treating (2 | 3.1%), Community & Social Service (1 | 1.5%), and Education, Arts & Media (1 | 1.5%).
Management, Business, Science and Arts Occupations by Sex
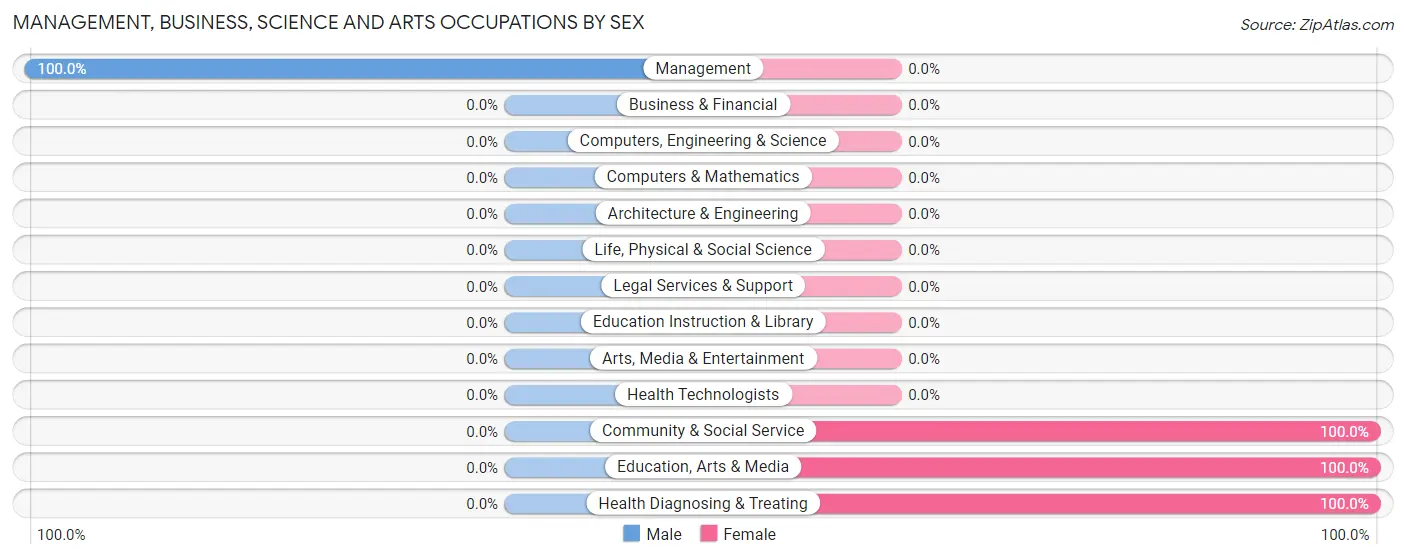
| Occupation | Male | Female |
| Management | 16 (100.0%) | 0 (0.0%) |
| Business & Financial | 0 (0.0%) | 0 (0.0%) |
| Computers, Engineering & Science | 0 (0.0%) | 0 (0.0%) |
| Computers & Mathematics | 0 (0.0%) | 0 (0.0%) |
| Architecture & Engineering | 0 (0.0%) | 0 (0.0%) |
| Life, Physical & Social Science | 0 (0.0%) | 0 (0.0%) |
| Community & Social Service | 0 (0.0%) | 1 (100.0%) |
| Education, Arts & Media | 0 (0.0%) | 1 (100.0%) |
| Legal Services & Support | 0 (0.0%) | 0 (0.0%) |
| Education Instruction & Library | 0 (0.0%) | 0 (0.0%) |
| Arts, Media & Entertainment | 0 (0.0%) | 0 (0.0%) |
| Health Diagnosing & Treating | 0 (0.0%) | 2 (100.0%) |
| Health Technologists | 0 (0.0%) | 0 (0.0%) |
| Total (Category) | 16 (84.2%) | 3 (15.8%) |
| Total (Overall) | 38 (58.5%) | 27 (41.5%) |
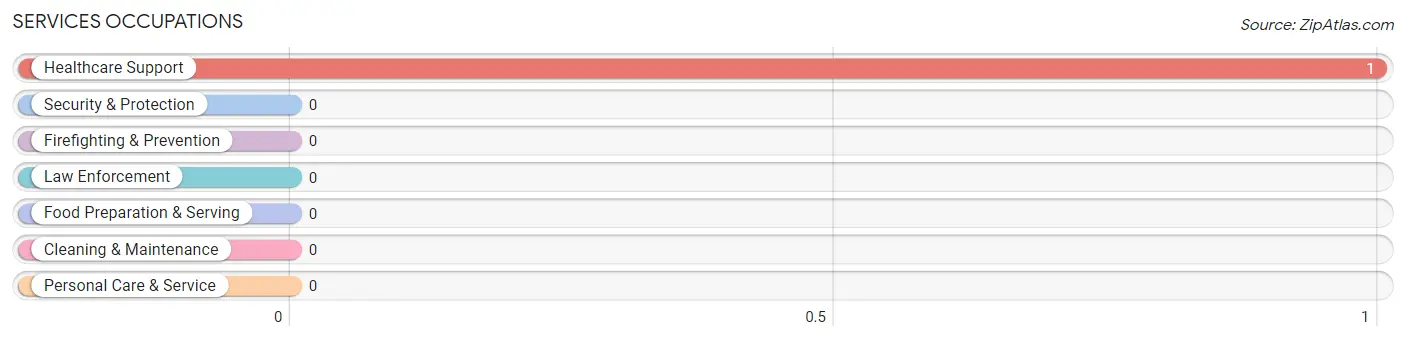
Services Occupations
The most common Services occupations in Morgan City are , and Healthcare Support (1 | 1.5%).
Services Occupations by Sex
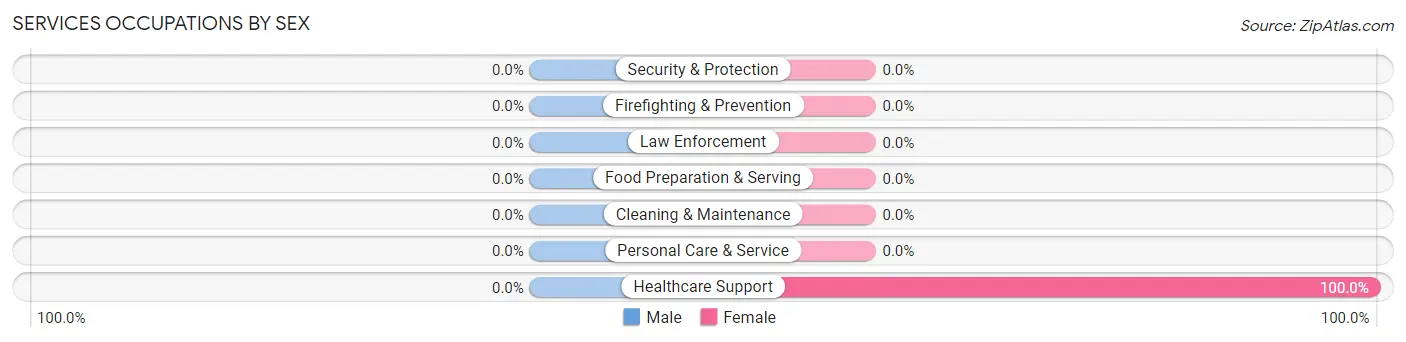
| Occupation | Male | Female |
| Healthcare Support | 0 (0.0%) | 1 (100.0%) |
| Security & Protection | 0 (0.0%) | 0 (0.0%) |
| Firefighting & Prevention | 0 (0.0%) | 0 (0.0%) |
| Law Enforcement | 0 (0.0%) | 0 (0.0%) |
| Food Preparation & Serving | 0 (0.0%) | 0 (0.0%) |
| Cleaning & Maintenance | 0 (0.0%) | 0 (0.0%) |
| Personal Care & Service | 0 (0.0%) | 0 (0.0%) |
| Total (Category) | 0 (0.0%) | 1 (100.0%) |
| Total (Overall) | 38 (58.5%) | 27 (41.5%) |
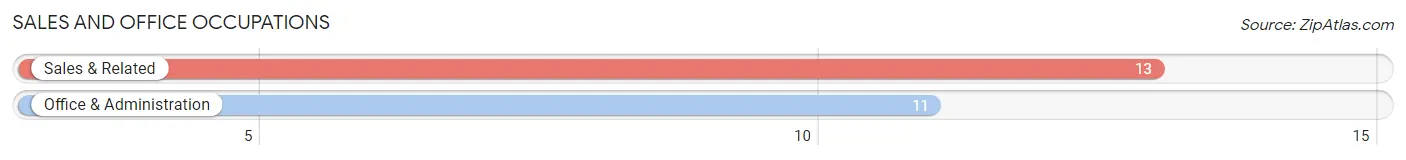
Sales and Office Occupations
The most common Sales and Office occupations in Morgan City are Sales & Related (13 | 20.0%), and Office & Administration (11 | 16.9%).
Sales and Office Occupations by Sex
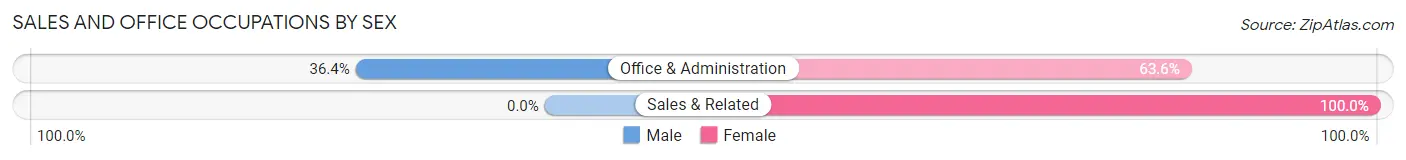
| Occupation | Male | Female |
| Sales & Related | 0 (0.0%) | 13 (100.0%) |
| Office & Administration | 4 (36.4%) | 7 (63.6%) |
| Total (Category) | 4 (16.7%) | 20 (83.3%) |
| Total (Overall) | 38 (58.5%) | 27 (41.5%) |
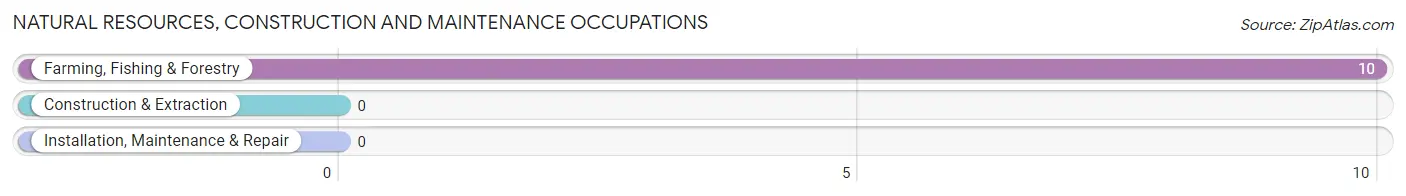
Natural Resources, Construction and Maintenance Occupations
The most common Natural Resources, Construction and Maintenance occupations in Morgan City are , and Farming, Fishing & Forestry (10 | 15.4%).
Natural Resources, Construction and Maintenance Occupations by Sex
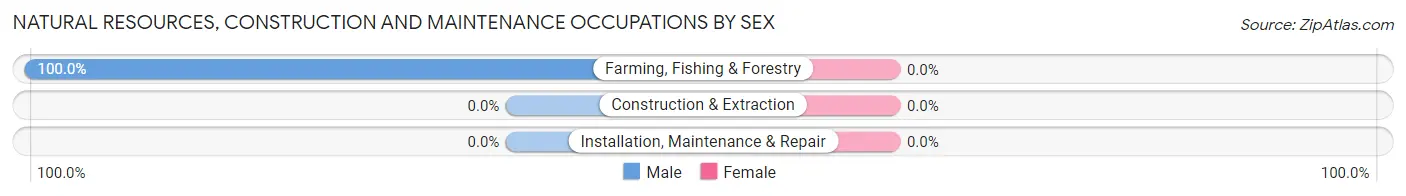
| Occupation | Male | Female |
| Farming, Fishing & Forestry | 10 (100.0%) | 0 (0.0%) |
| Construction & Extraction | 0 (0.0%) | 0 (0.0%) |
| Installation, Maintenance & Repair | 0 (0.0%) | 0 (0.0%) |
| Total (Category) | 10 (100.0%) | 0 (0.0%) |
| Total (Overall) | 38 (58.5%) | 27 (41.5%) |
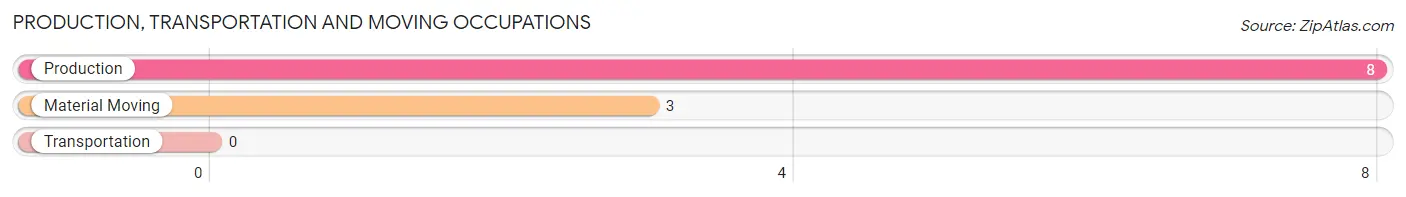
Production, Transportation and Moving Occupations
The most common Production, Transportation and Moving occupations in Morgan City are Production (8 | 12.3%), and Material Moving (3 | 4.6%).
Production, Transportation and Moving Occupations by Sex
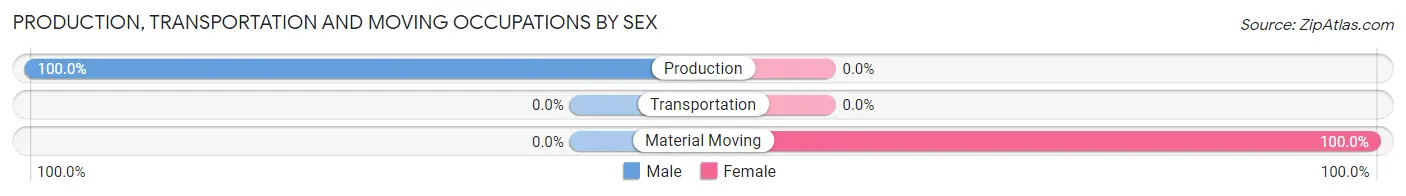
| Occupation | Male | Female |
| Production | 8 (100.0%) | 0 (0.0%) |
| Transportation | 0 (0.0%) | 0 (0.0%) |
| Material Moving | 0 (0.0%) | 3 (100.0%) |
| Total (Category) | 8 (72.7%) | 3 (27.3%) |
| Total (Overall) | 38 (58.5%) | 27 (41.5%) |
Employment Industries by Sex in Morgan City
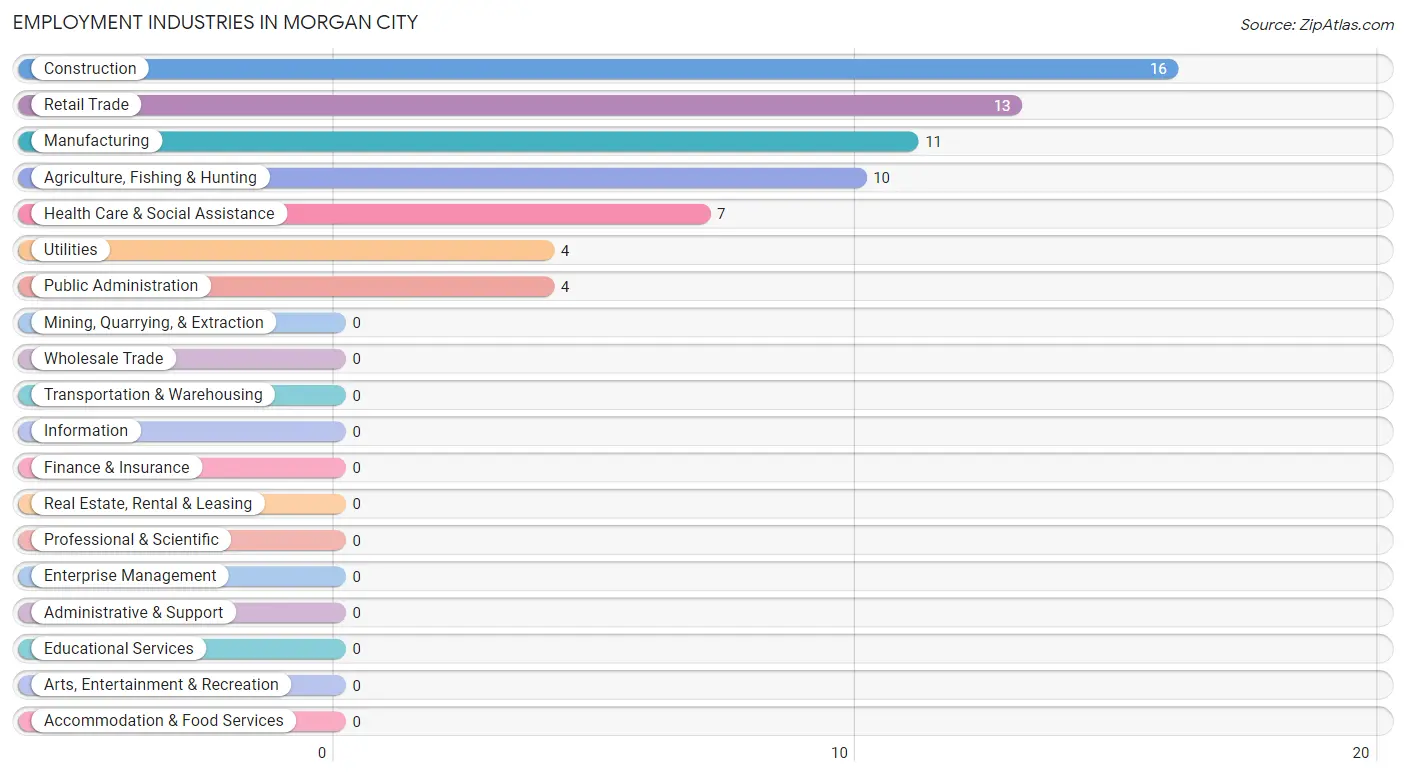
Employment Industries in Morgan City
The major employment industries in Morgan City include Construction (16 | 24.6%), Retail Trade (13 | 20.0%), Manufacturing (11 | 16.9%), Agriculture, Fishing & Hunting (10 | 15.4%), and Health Care & Social Assistance (7 | 10.8%).
Employment Industries by Sex in Morgan City
The Morgan City industries that see more men than women are Agriculture, Fishing & Hunting (100.0%), Construction (100.0%), and Utilities (100.0%), whereas the industries that tend to have a higher number of women are Retail Trade (100.0%), Health Care & Social Assistance (100.0%), and Public Administration (100.0%).
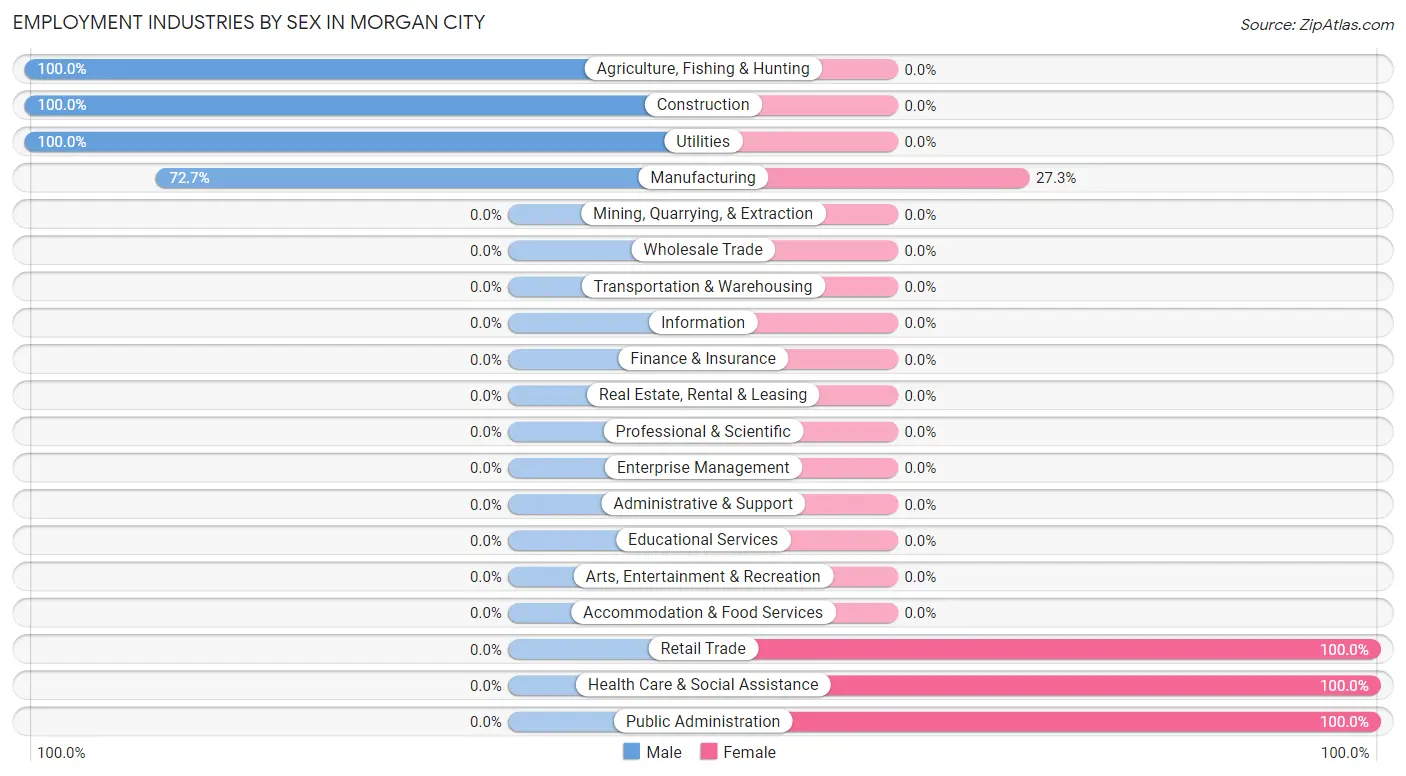
| Industry | Male | Female |
| Agriculture, Fishing & Hunting | 10 (100.0%) | 0 (0.0%) |
| Mining, Quarrying, & Extraction | 0 (0.0%) | 0 (0.0%) |
| Construction | 16 (100.0%) | 0 (0.0%) |
| Manufacturing | 8 (72.7%) | 3 (27.3%) |
| Wholesale Trade | 0 (0.0%) | 0 (0.0%) |
| Retail Trade | 0 (0.0%) | 13 (100.0%) |
| Transportation & Warehousing | 0 (0.0%) | 0 (0.0%) |
| Utilities | 4 (100.0%) | 0 (0.0%) |
| Information | 0 (0.0%) | 0 (0.0%) |
| Finance & Insurance | 0 (0.0%) | 0 (0.0%) |
| Real Estate, Rental & Leasing | 0 (0.0%) | 0 (0.0%) |
| Professional & Scientific | 0 (0.0%) | 0 (0.0%) |
| Enterprise Management | 0 (0.0%) | 0 (0.0%) |
| Administrative & Support | 0 (0.0%) | 0 (0.0%) |
| Educational Services | 0 (0.0%) | 0 (0.0%) |
| Health Care & Social Assistance | 0 (0.0%) | 7 (100.0%) |
| Arts, Entertainment & Recreation | 0 (0.0%) | 0 (0.0%) |
| Accommodation & Food Services | 0 (0.0%) | 0 (0.0%) |
| Public Administration | 0 (0.0%) | 4 (100.0%) |
| Total | 38 (58.5%) | 27 (41.5%) |
Education in Morgan City
School Enrollment in Morgan City
The most common levels of schooling among the 51 students in Morgan City are elementary school (16 | 31.4%), high school (14 | 27.5%), and college / undergraduate (10 | 19.6%).
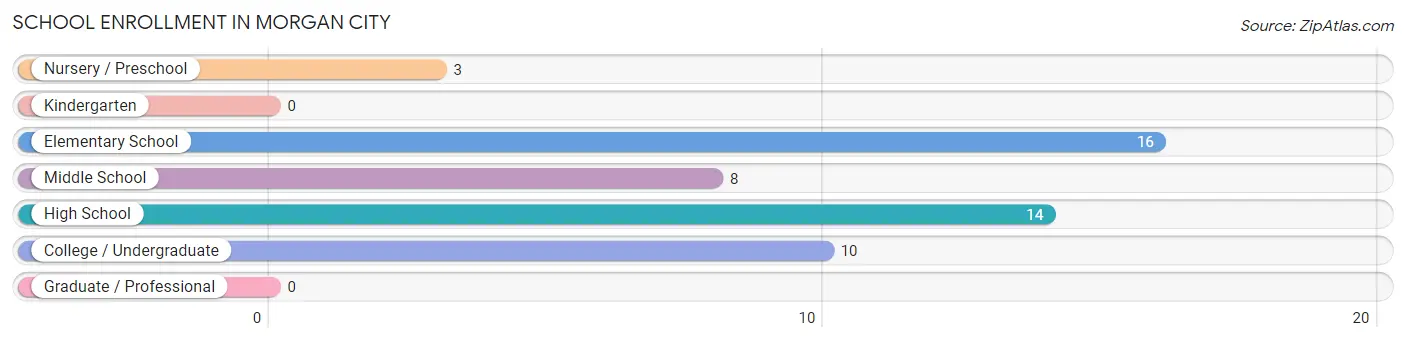
| School Level | # Students | % Students |
| Nursery / Preschool | 3 | 5.9% |
| Kindergarten | 0 | 0.0% |
| Elementary School | 16 | 31.4% |
| Middle School | 8 | 15.7% |
| High School | 14 | 27.5% |
| College / Undergraduate | 10 | 19.6% |
| Graduate / Professional | 0 | 0.0% |
| Total | 51 | 100.0% |
School Enrollment by Age by Funding Source in Morgan City
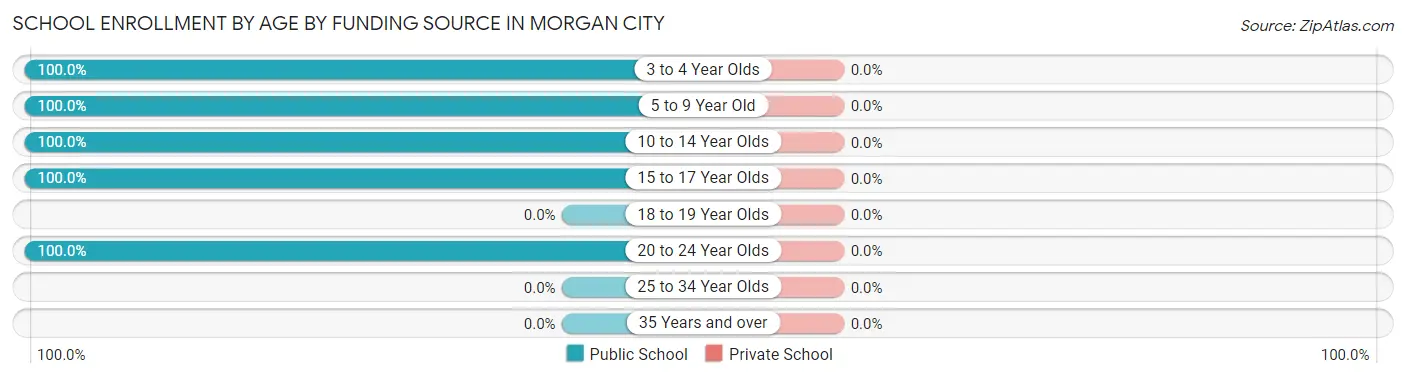
| Age Bracket | Public School | Private School |
| 3 to 4 Year Olds | 3 (100.0%) | 0 (0.0%) |
| 5 to 9 Year Old | 16 (100.0%) | 0 (0.0%) |
| 10 to 14 Year Olds | 7 (100.0%) | 0 (0.0%) |
| 15 to 17 Year Olds | 15 (100.0%) | 0 (0.0%) |
| 18 to 19 Year Olds | 0 (0.0%) | 0 (0.0%) |
| 20 to 24 Year Olds | 10 (100.0%) | 0 (0.0%) |
| 25 to 34 Year Olds | 0 (0.0%) | 0 (0.0%) |
| 35 Years and over | 0 (0.0%) | 0 (0.0%) |
| Total | 51 (100.0%) | 0 (0.0%) |
Educational Attainment by Field of Study in Morgan City
Business (4 | 80.0%), and arts & humanities (1 | 20.0%) are the most common fields of study among 5 individuals in Morgan City who have obtained a bachelor's degree or higher.
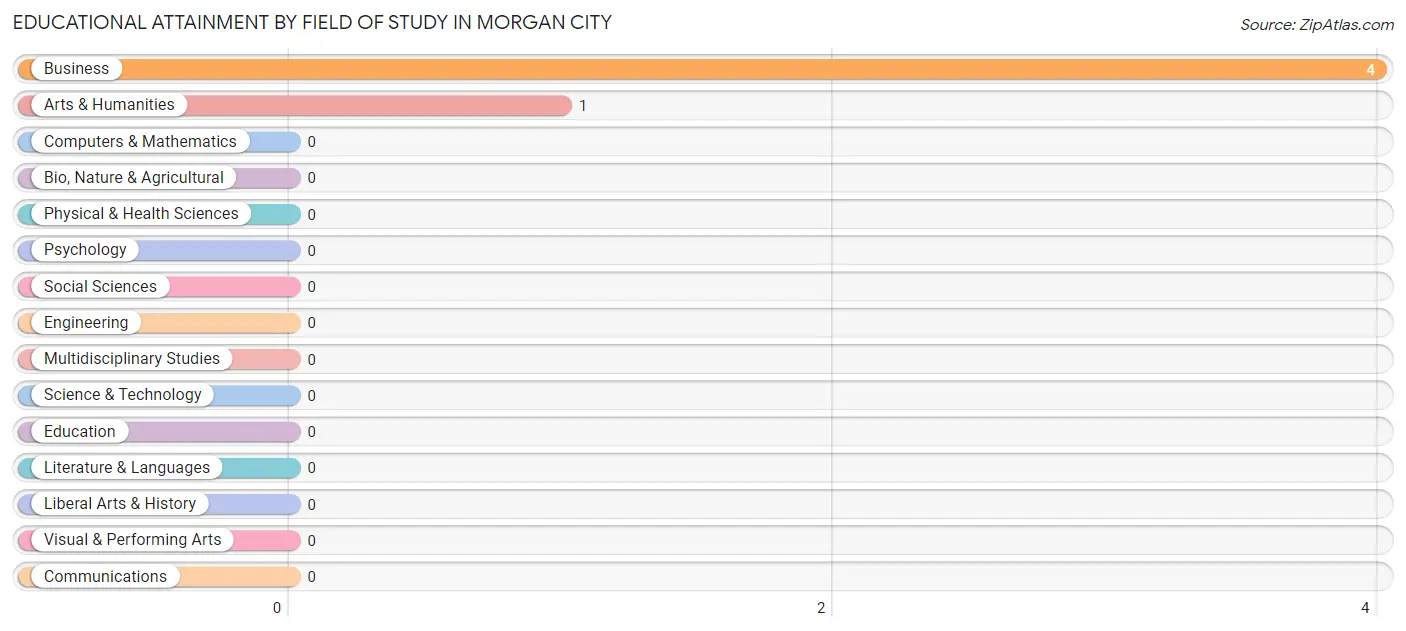
| Field of Study | # Graduates | % Graduates |
| Computers & Mathematics | 0 | 0.0% |
| Bio, Nature & Agricultural | 0 | 0.0% |
| Physical & Health Sciences | 0 | 0.0% |
| Psychology | 0 | 0.0% |
| Social Sciences | 0 | 0.0% |
| Engineering | 0 | 0.0% |
| Multidisciplinary Studies | 0 | 0.0% |
| Science & Technology | 0 | 0.0% |
| Business | 4 | 80.0% |
| Education | 0 | 0.0% |
| Literature & Languages | 0 | 0.0% |
| Liberal Arts & History | 0 | 0.0% |
| Visual & Performing Arts | 0 | 0.0% |
| Communications | 0 | 0.0% |
| Arts & Humanities | 1 | 20.0% |
| Total | 5 | 100.0% |
Transportation & Commute in Morgan City
Vehicle Availability by Sex in Morgan City
The most prevalent vehicle ownership categories in Morgan City are males with 2 vehicles (20, accounting for 52.6%) and females with 2 vehicles (6, making up 74.1%).
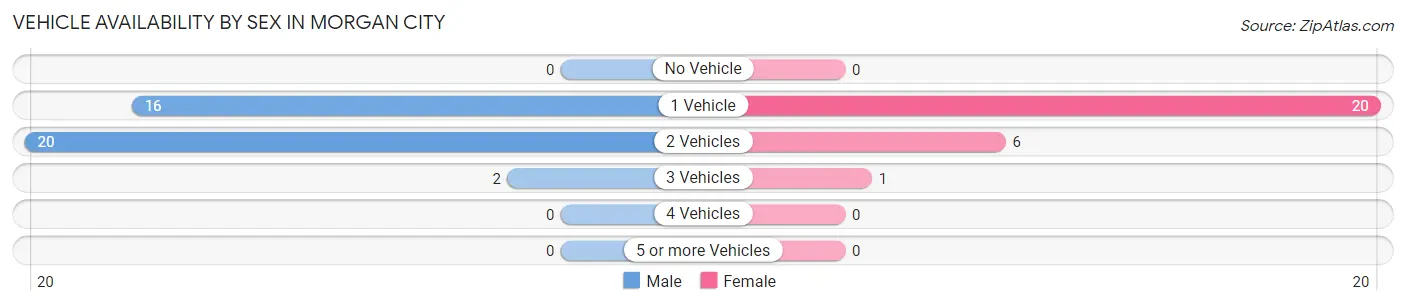
| Vehicles Available | Male | Female |
| No Vehicle | 0 (0.0%) | 0 (0.0%) |
| 1 Vehicle | 16 (42.1%) | 20 (74.1%) |
| 2 Vehicles | 20 (52.6%) | 6 (22.2%) |
| 3 Vehicles | 2 (5.3%) | 1 (3.7%) |
| 4 Vehicles | 0 (0.0%) | 0 (0.0%) |
| 5 or more Vehicles | 0 (0.0%) | 0 (0.0%) |
| Total | 38 (100.0%) | 27 (100.0%) |
Commute Time in Morgan City
The most frequently occuring commute durations in Morgan City are 15 to 19 minutes (23 commuters, 35.4%), 10 to 14 minutes (19 commuters, 29.2%), and 5 to 9 minutes (8 commuters, 12.3%).
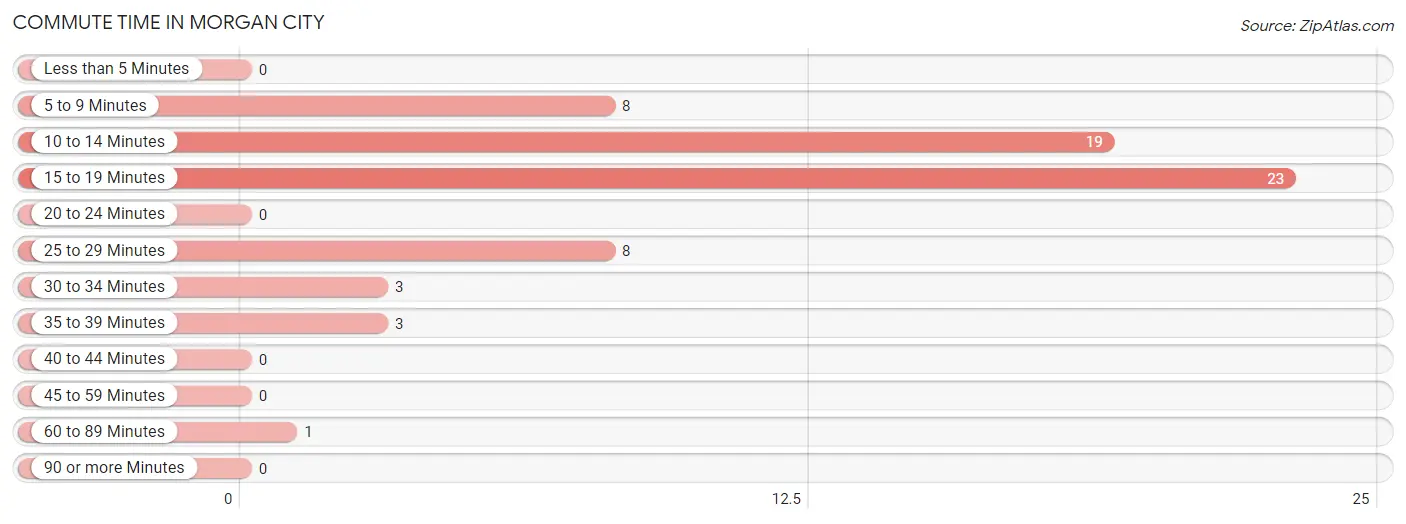
| Commute Time | # Commuters | % Commuters |
| Less than 5 Minutes | 0 | 0.0% |
| 5 to 9 Minutes | 8 | 12.3% |
| 10 to 14 Minutes | 19 | 29.2% |
| 15 to 19 Minutes | 23 | 35.4% |
| 20 to 24 Minutes | 0 | 0.0% |
| 25 to 29 Minutes | 8 | 12.3% |
| 30 to 34 Minutes | 3 | 4.6% |
| 35 to 39 Minutes | 3 | 4.6% |
| 40 to 44 Minutes | 0 | 0.0% |
| 45 to 59 Minutes | 0 | 0.0% |
| 60 to 89 Minutes | 1 | 1.5% |
| 90 or more Minutes | 0 | 0.0% |
Commute Time by Sex in Morgan City
The most common commute times in Morgan City are 10 to 14 minutes (16 commuters, 42.1%) for males and 15 to 19 minutes (17 commuters, 63.0%) for females.
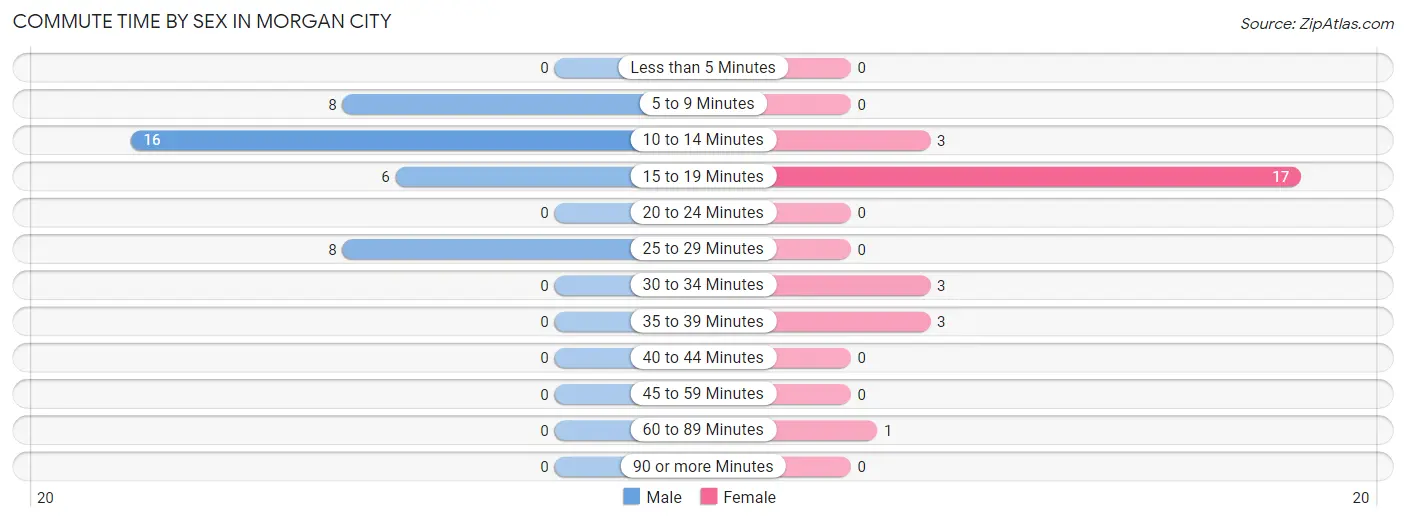
| Commute Time | Male | Female |
| Less than 5 Minutes | 0 (0.0%) | 0 (0.0%) |
| 5 to 9 Minutes | 8 (21.0%) | 0 (0.0%) |
| 10 to 14 Minutes | 16 (42.1%) | 3 (11.1%) |
| 15 to 19 Minutes | 6 (15.8%) | 17 (63.0%) |
| 20 to 24 Minutes | 0 (0.0%) | 0 (0.0%) |
| 25 to 29 Minutes | 8 (21.0%) | 0 (0.0%) |
| 30 to 34 Minutes | 0 (0.0%) | 3 (11.1%) |
| 35 to 39 Minutes | 0 (0.0%) | 3 (11.1%) |
| 40 to 44 Minutes | 0 (0.0%) | 0 (0.0%) |
| 45 to 59 Minutes | 0 (0.0%) | 0 (0.0%) |
| 60 to 89 Minutes | 0 (0.0%) | 1 (3.7%) |
| 90 or more Minutes | 0 (0.0%) | 0 (0.0%) |
Time of Departure to Work by Sex in Morgan City
The most frequent times of departure to work in Morgan City are 7:30 AM to 7:59 AM (24, 63.2%) for males and 6:30 AM to 6:59 AM (16, 59.3%) for females.
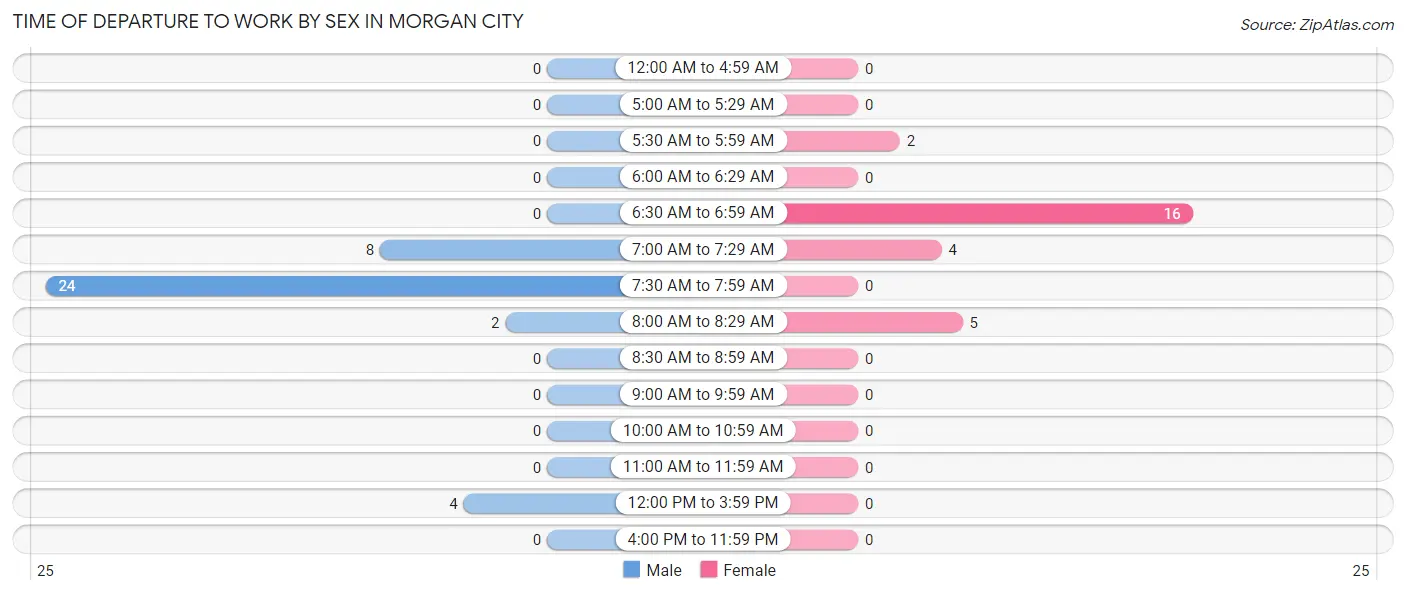
| Time of Departure | Male | Female |
| 12:00 AM to 4:59 AM | 0 (0.0%) | 0 (0.0%) |
| 5:00 AM to 5:29 AM | 0 (0.0%) | 0 (0.0%) |
| 5:30 AM to 5:59 AM | 0 (0.0%) | 2 (7.4%) |
| 6:00 AM to 6:29 AM | 0 (0.0%) | 0 (0.0%) |
| 6:30 AM to 6:59 AM | 0 (0.0%) | 16 (59.3%) |
| 7:00 AM to 7:29 AM | 8 (21.0%) | 4 (14.8%) |
| 7:30 AM to 7:59 AM | 24 (63.2%) | 0 (0.0%) |
| 8:00 AM to 8:29 AM | 2 (5.3%) | 5 (18.5%) |
| 8:30 AM to 8:59 AM | 0 (0.0%) | 0 (0.0%) |
| 9:00 AM to 9:59 AM | 0 (0.0%) | 0 (0.0%) |
| 10:00 AM to 10:59 AM | 0 (0.0%) | 0 (0.0%) |
| 11:00 AM to 11:59 AM | 0 (0.0%) | 0 (0.0%) |
| 12:00 PM to 3:59 PM | 4 (10.5%) | 0 (0.0%) |
| 4:00 PM to 11:59 PM | 0 (0.0%) | 0 (0.0%) |
| Total | 38 (100.0%) | 27 (100.0%) |
Housing Occupancy in Morgan City
Occupancy by Ownership in Morgan City
Of the total 67 dwellings in Morgan City, owner-occupied units account for 44 (65.7%), while renter-occupied units make up 23 (34.3%).
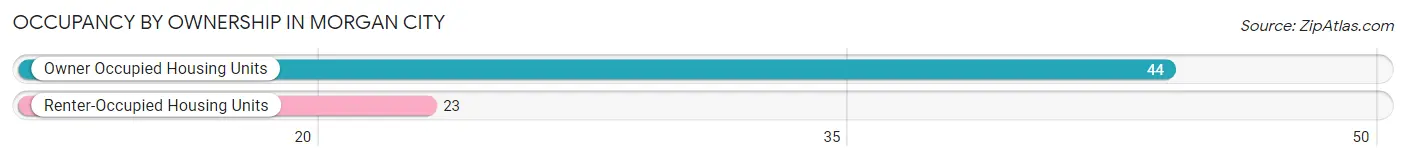
| Occupancy | # Housing Units | % Housing Units |
| Owner Occupied Housing Units | 44 | 65.7% |
| Renter-Occupied Housing Units | 23 | 34.3% |
| Total Occupied Housing Units | 67 | 100.0% |
Occupancy by Household Size in Morgan City
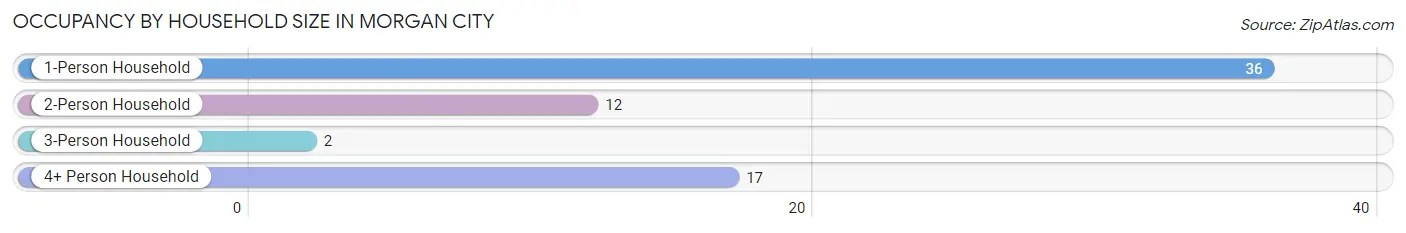
| Household Size | # Housing Units | % Housing Units |
| 1-Person Household | 36 | 53.7% |
| 2-Person Household | 12 | 17.9% |
| 3-Person Household | 2 | 3.0% |
| 4+ Person Household | 17 | 25.4% |
| Total Housing Units | 67 | 100.0% |
Occupancy by Ownership by Household Size in Morgan City
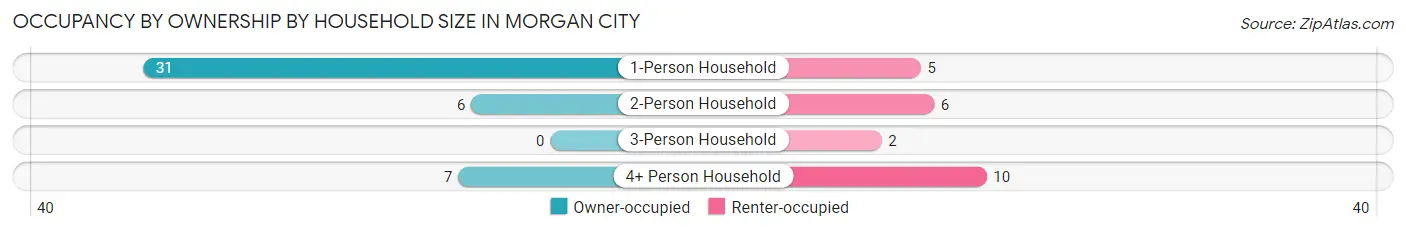
| Household Size | Owner-occupied | Renter-occupied |
| 1-Person Household | 31 (86.1%) | 5 (13.9%) |
| 2-Person Household | 6 (50.0%) | 6 (50.0%) |
| 3-Person Household | 0 (0.0%) | 2 (100.0%) |
| 4+ Person Household | 7 (41.2%) | 10 (58.8%) |
| Total Housing Units | 44 (65.7%) | 23 (34.3%) |
Occupancy by Educational Attainment in Morgan City
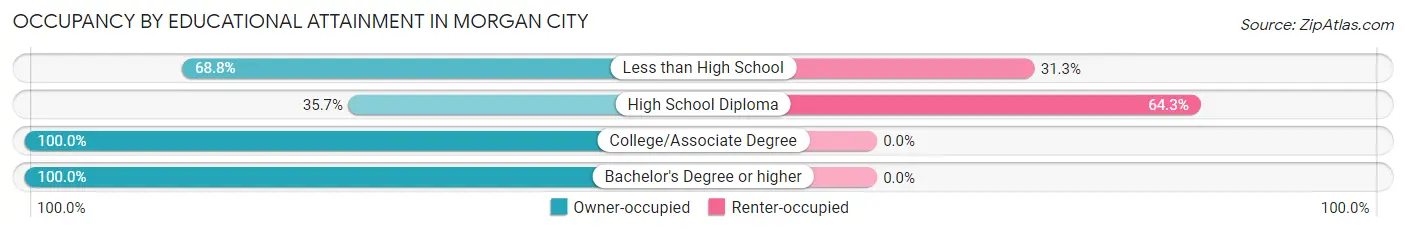
| Household Size | Owner-occupied | Renter-occupied |
| Less than High School | 11 (68.8%) | 5 (31.2%) |
| High School Diploma | 10 (35.7%) | 18 (64.3%) |
| College/Associate Degree | 18 (100.0%) | 0 (0.0%) |
| Bachelor's Degree or higher | 5 (100.0%) | 0 (0.0%) |
Occupancy by Age of Householder in Morgan City
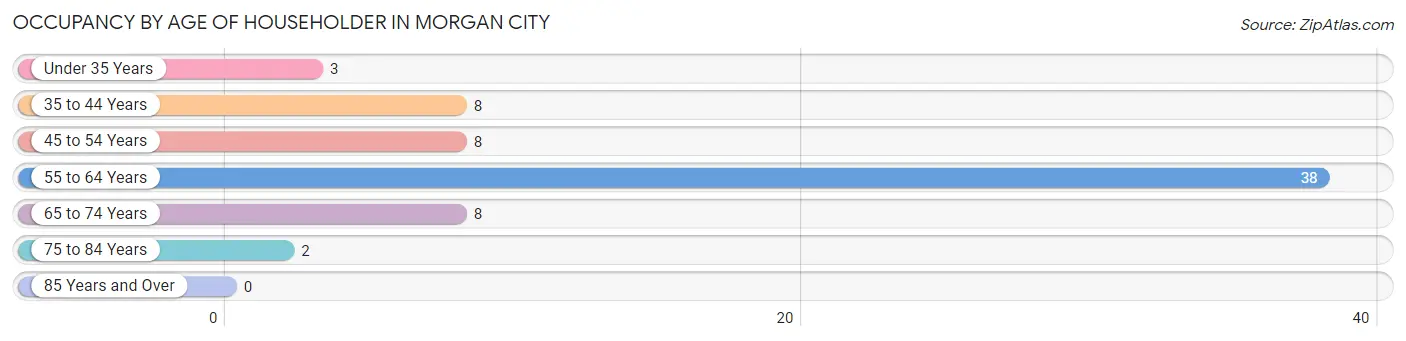
| Age Bracket | # Households | % Households |
| Under 35 Years | 3 | 4.5% |
| 35 to 44 Years | 8 | 11.9% |
| 45 to 54 Years | 8 | 11.9% |
| 55 to 64 Years | 38 | 56.7% |
| 65 to 74 Years | 8 | 11.9% |
| 75 to 84 Years | 2 | 3.0% |
| 85 Years and Over | 0 | 0.0% |
| Total | 67 | 100.0% |
Housing Finances in Morgan City
Median Income by Occupancy in Morgan City
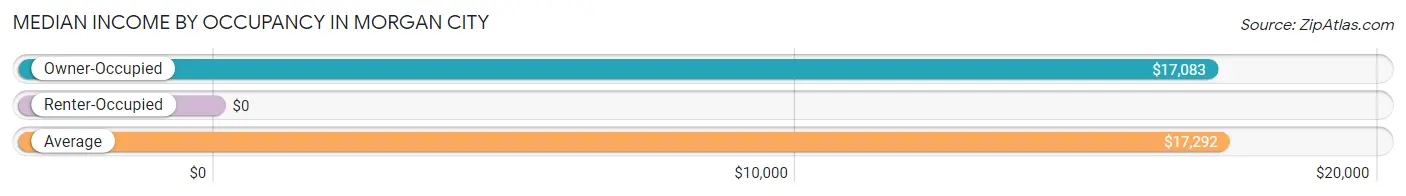
| Occupancy Type | # Households | Median Income |
| Owner-Occupied | 44 (65.7%) | $17,083 |
| Renter-Occupied | 23 (34.3%) | $0 |
| Average | 67 (100.0%) | $17,292 |
Occupancy by Householder Income Bracket in Morgan City
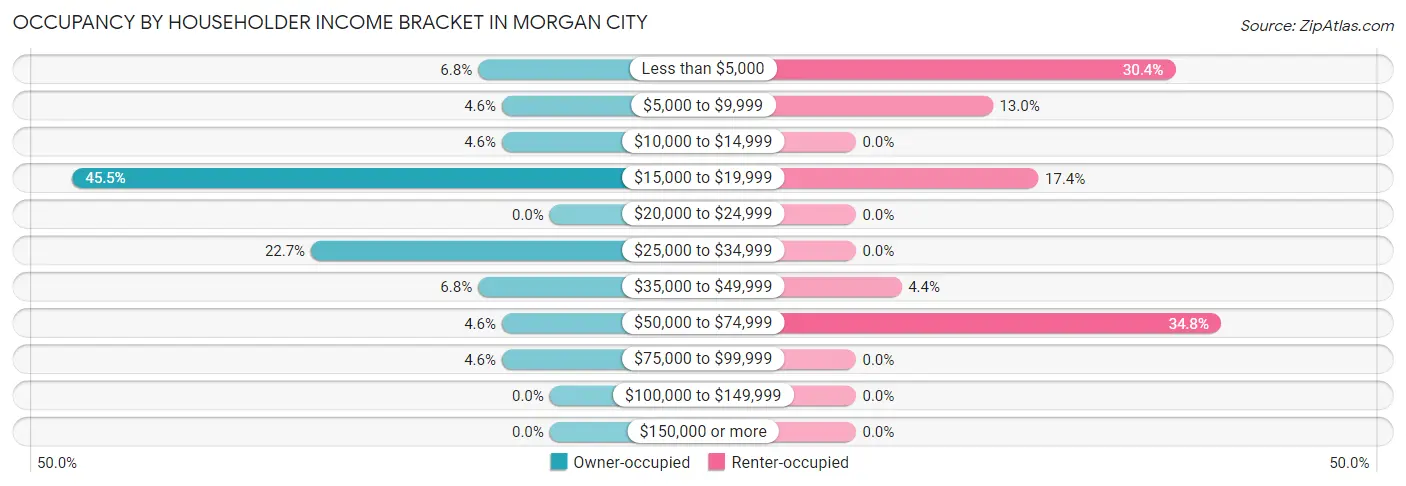
| Income Bracket | Owner-occupied | Renter-occupied |
| Less than $5,000 | 3 (6.8%) | 7 (30.4%) |
| $5,000 to $9,999 | 2 (4.5%) | 3 (13.0%) |
| $10,000 to $14,999 | 2 (4.5%) | 0 (0.0%) |
| $15,000 to $19,999 | 20 (45.5%) | 4 (17.4%) |
| $20,000 to $24,999 | 0 (0.0%) | 0 (0.0%) |
| $25,000 to $34,999 | 10 (22.7%) | 0 (0.0%) |
| $35,000 to $49,999 | 3 (6.8%) | 1 (4.3%) |
| $50,000 to $74,999 | 2 (4.5%) | 8 (34.8%) |
| $75,000 to $99,999 | 2 (4.5%) | 0 (0.0%) |
| $100,000 to $149,999 | 0 (0.0%) | 0 (0.0%) |
| $150,000 or more | 0 (0.0%) | 0 (0.0%) |
| Total | 44 (100.0%) | 23 (100.0%) |
Monthly Housing Cost Tiers in Morgan City
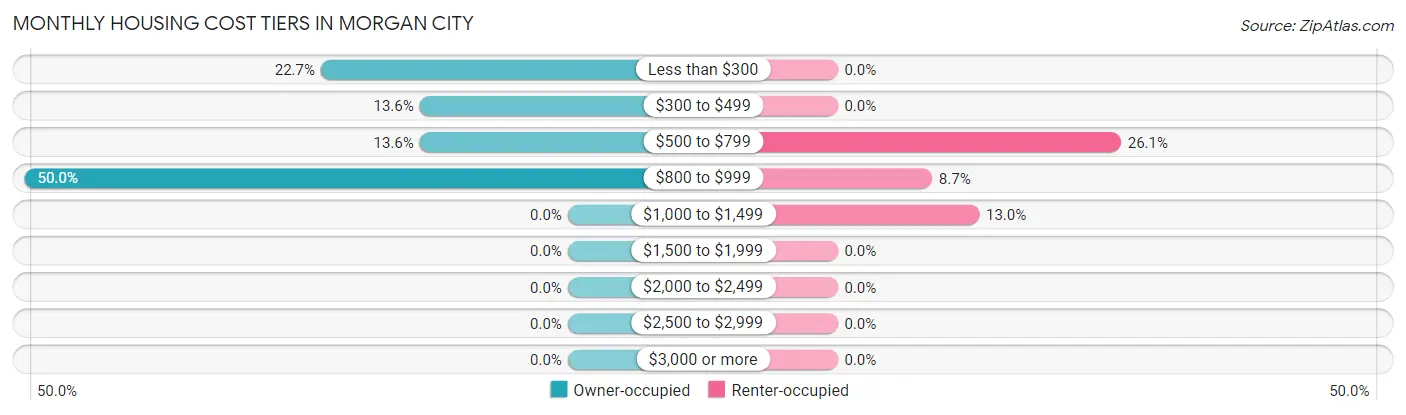
| Monthly Cost | Owner-occupied | Renter-occupied |
| Less than $300 | 10 (22.7%) | 0 (0.0%) |
| $300 to $499 | 6 (13.6%) | 0 (0.0%) |
| $500 to $799 | 6 (13.6%) | 6 (26.1%) |
| $800 to $999 | 22 (50.0%) | 2 (8.7%) |
| $1,000 to $1,499 | 0 (0.0%) | 3 (13.0%) |
| $1,500 to $1,999 | 0 (0.0%) | 0 (0.0%) |
| $2,000 to $2,499 | 0 (0.0%) | 0 (0.0%) |
| $2,500 to $2,999 | 0 (0.0%) | 0 (0.0%) |
| $3,000 or more | 0 (0.0%) | 0 (0.0%) |
| Total | 44 (100.0%) | 23 (100.0%) |
Physical Housing Characteristics in Morgan City
Housing Structures in Morgan City
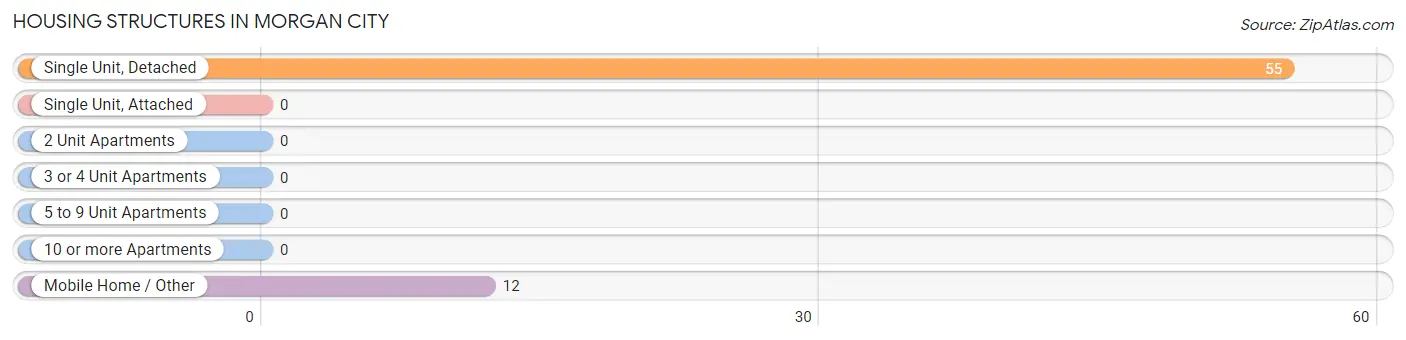
| Structure Type | # Housing Units | % Housing Units |
| Single Unit, Detached | 55 | 82.1% |
| Single Unit, Attached | 0 | 0.0% |
| 2 Unit Apartments | 0 | 0.0% |
| 3 or 4 Unit Apartments | 0 | 0.0% |
| 5 to 9 Unit Apartments | 0 | 0.0% |
| 10 or more Apartments | 0 | 0.0% |
| Mobile Home / Other | 12 | 17.9% |
| Total | 67 | 100.0% |
Housing Structures by Occupancy in Morgan City
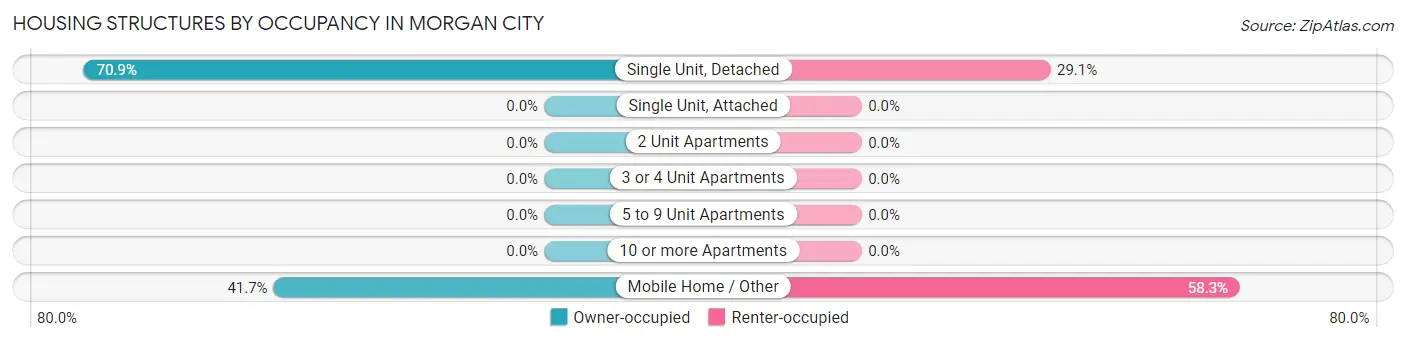
| Structure Type | Owner-occupied | Renter-occupied |
| Single Unit, Detached | 39 (70.9%) | 16 (29.1%) |
| Single Unit, Attached | 0 (0.0%) | 0 (0.0%) |
| 2 Unit Apartments | 0 (0.0%) | 0 (0.0%) |
| 3 or 4 Unit Apartments | 0 (0.0%) | 0 (0.0%) |
| 5 to 9 Unit Apartments | 0 (0.0%) | 0 (0.0%) |
| 10 or more Apartments | 0 (0.0%) | 0 (0.0%) |
| Mobile Home / Other | 5 (41.7%) | 7 (58.3%) |
| Total | 44 (65.7%) | 23 (34.3%) |
Housing Structures by Number of Rooms in Morgan City
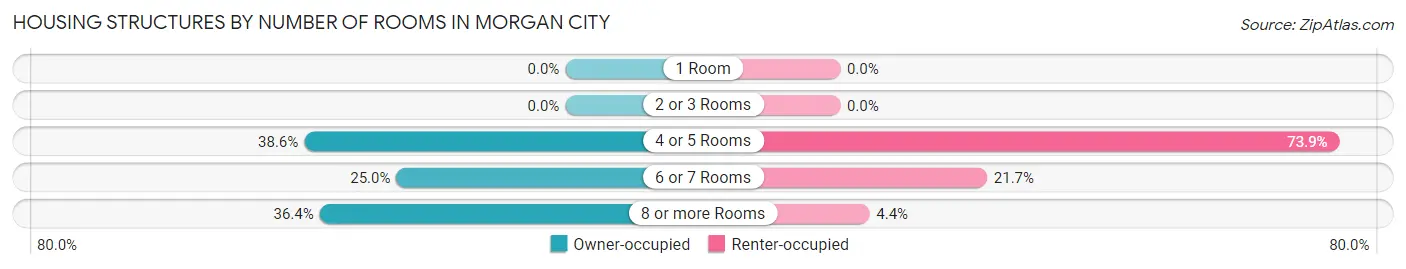
| Number of Rooms | Owner-occupied | Renter-occupied |
| 1 Room | 0 (0.0%) | 0 (0.0%) |
| 2 or 3 Rooms | 0 (0.0%) | 0 (0.0%) |
| 4 or 5 Rooms | 17 (38.6%) | 17 (73.9%) |
| 6 or 7 Rooms | 11 (25.0%) | 5 (21.7%) |
| 8 or more Rooms | 16 (36.4%) | 1 (4.3%) |
| Total | 44 (100.0%) | 23 (100.0%) |
Housing Structure by Heating Type in Morgan City
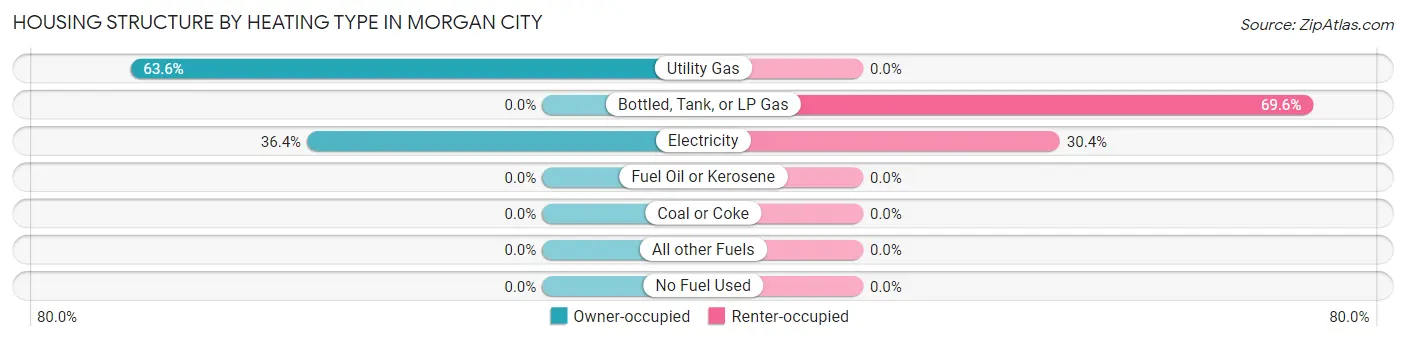
| Heating Type | Owner-occupied | Renter-occupied |
| Utility Gas | 28 (63.6%) | 0 (0.0%) |
| Bottled, Tank, or LP Gas | 0 (0.0%) | 16 (69.6%) |
| Electricity | 16 (36.4%) | 7 (30.4%) |
| Fuel Oil or Kerosene | 0 (0.0%) | 0 (0.0%) |
| Coal or Coke | 0 (0.0%) | 0 (0.0%) |
| All other Fuels | 0 (0.0%) | 0 (0.0%) |
| No Fuel Used | 0 (0.0%) | 0 (0.0%) |
| Total | 44 (100.0%) | 23 (100.0%) |
Household Vehicle Usage in Morgan City
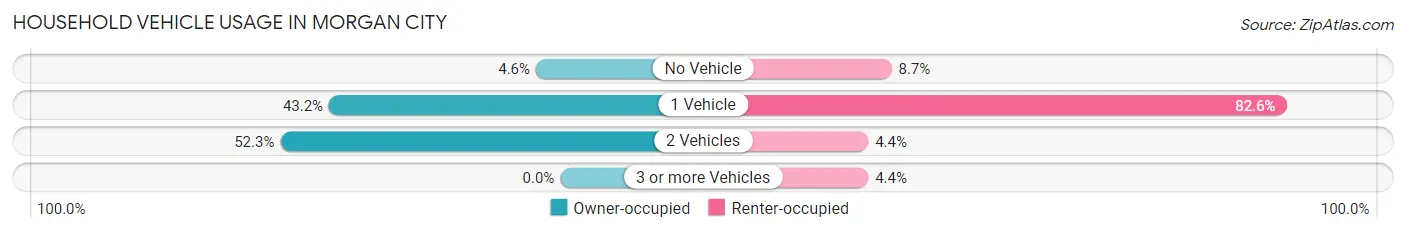
| Vehicles per Household | Owner-occupied | Renter-occupied |
| No Vehicle | 2 (4.5%) | 2 (8.7%) |
| 1 Vehicle | 19 (43.2%) | 19 (82.6%) |
| 2 Vehicles | 23 (52.3%) | 1 (4.3%) |
| 3 or more Vehicles | 0 (0.0%) | 1 (4.3%) |
| Total | 44 (100.0%) | 23 (100.0%) |
Real Estate & Mortgages in Morgan City
Real Estate and Mortgage Overview in Morgan City
| Characteristic | Without Mortgage | With Mortgage |
| Housing Units | 17 | 27 |
| Median Property Value | $51,000 | $132,000 |
| Median Household Income | $16,875 | $0 |
| Monthly Housing Costs | $291 | $0 |
| Real Estate Taxes | $500 | $7 |
Property Value by Mortgage Status in Morgan City
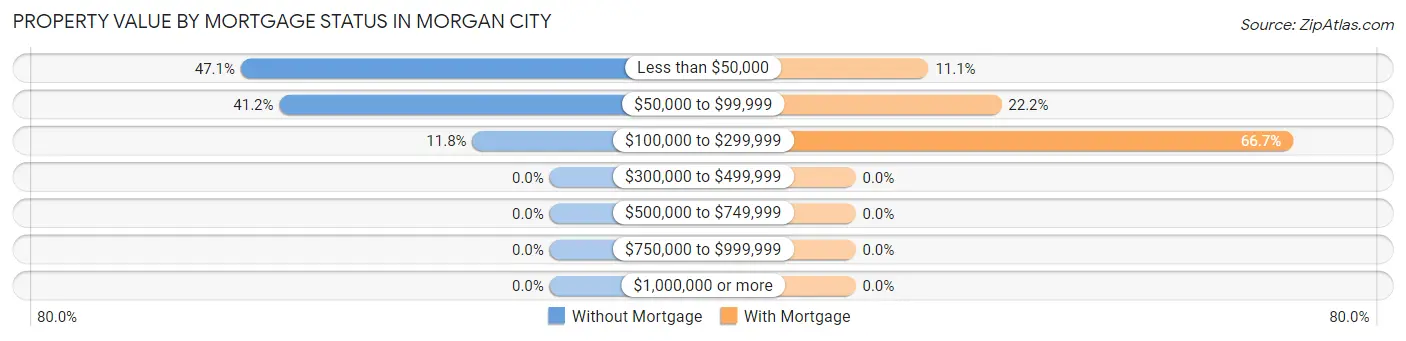
| Property Value | Without Mortgage | With Mortgage |
| Less than $50,000 | 8 (47.1%) | 3 (11.1%) |
| $50,000 to $99,999 | 7 (41.2%) | 6 (22.2%) |
| $100,000 to $299,999 | 2 (11.8%) | 18 (66.7%) |
| $300,000 to $499,999 | 0 (0.0%) | 0 (0.0%) |
| $500,000 to $749,999 | 0 (0.0%) | 0 (0.0%) |
| $750,000 to $999,999 | 0 (0.0%) | 0 (0.0%) |
| $1,000,000 or more | 0 (0.0%) | 0 (0.0%) |
| Total | 17 (100.0%) | 27 (100.0%) |
Household Income by Mortgage Status in Morgan City
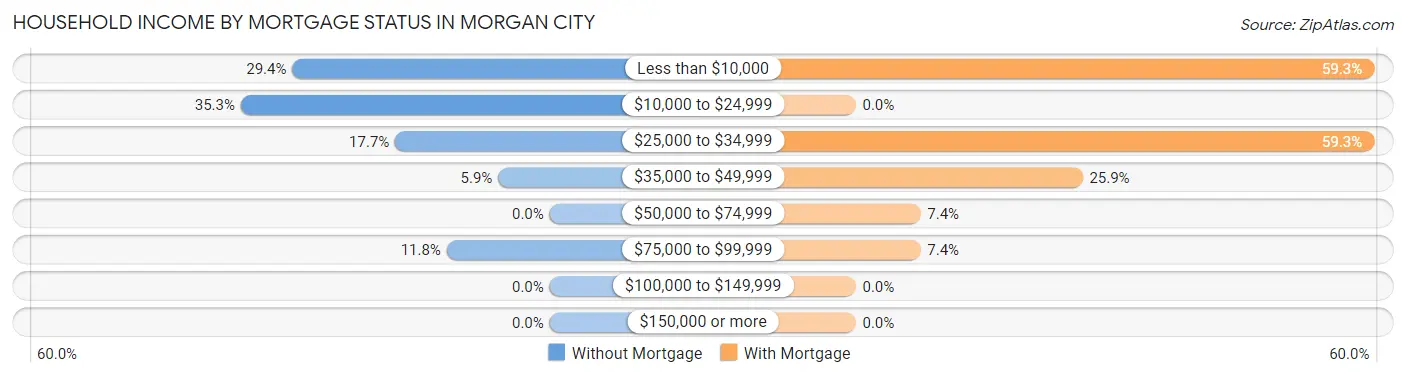
| Household Income | Without Mortgage | With Mortgage |
| Less than $10,000 | 5 (29.4%) | 16 (59.3%) |
| $10,000 to $24,999 | 6 (35.3%) | 0 (0.0%) |
| $25,000 to $34,999 | 3 (17.6%) | 16 (59.3%) |
| $35,000 to $49,999 | 1 (5.9%) | 7 (25.9%) |
| $50,000 to $74,999 | 0 (0.0%) | 2 (7.4%) |
| $75,000 to $99,999 | 2 (11.8%) | 2 (7.4%) |
| $100,000 to $149,999 | 0 (0.0%) | 0 (0.0%) |
| $150,000 or more | 0 (0.0%) | 0 (0.0%) |
| Total | 17 (100.0%) | 27 (100.0%) |
Property Value to Household Income Ratio in Morgan City
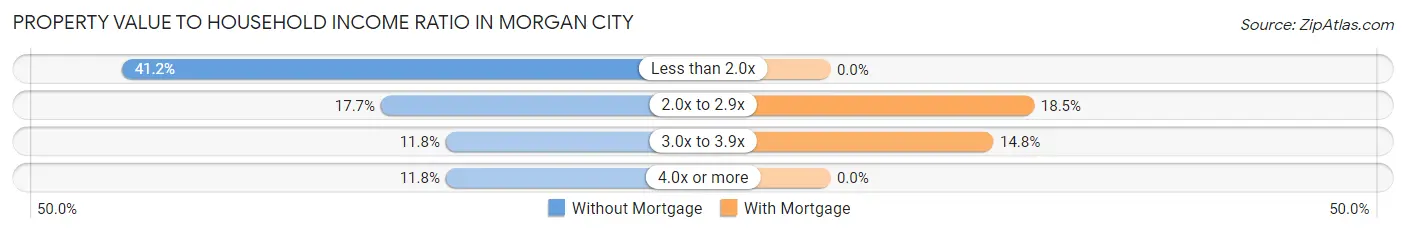
| Value-to-Income Ratio | Without Mortgage | With Mortgage |
| Less than 2.0x | 7 (41.2%) | 0 (0.0%) |
| 2.0x to 2.9x | 3 (17.6%) | 5 (18.5%) |
| 3.0x to 3.9x | 2 (11.8%) | 4 (14.8%) |
| 4.0x or more | 2 (11.8%) | 0 (0.0%) |
| Total | 17 (100.0%) | 27 (100.0%) |
Real Estate Taxes by Mortgage Status in Morgan City
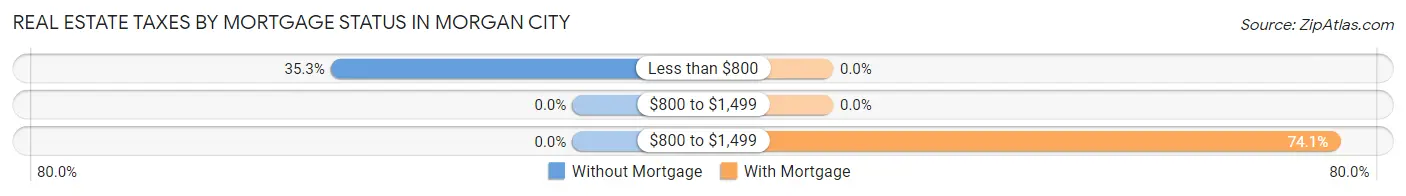
| Property Taxes | Without Mortgage | With Mortgage |
| Less than $800 | 6 (35.3%) | 0 (0.0%) |
| $800 to $1,499 | 0 (0.0%) | 0 (0.0%) |
| $800 to $1,499 | 0 (0.0%) | 20 (74.1%) |
| Total | 17 (100.0%) | 27 (100.0%) |
Health & Disability in Morgan City
Health Insurance Coverage by Age in Morgan City
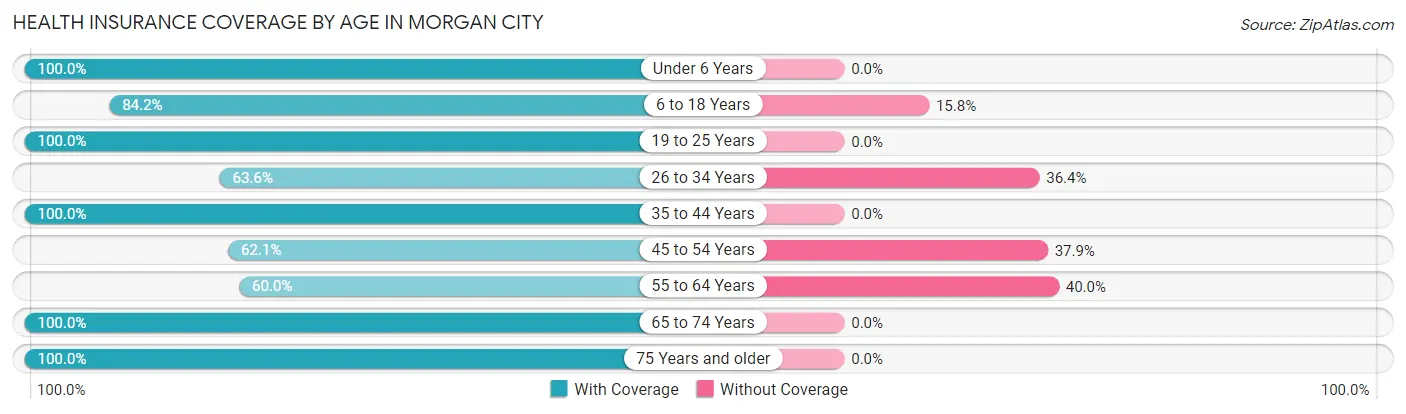
| Age Bracket | With Coverage | Without Coverage |
| Under 6 Years | 8 (100.0%) | 0 (0.0%) |
| 6 to 18 Years | 32 (84.2%) | 6 (15.8%) |
| 19 to 25 Years | 27 (100.0%) | 0 (0.0%) |
| 26 to 34 Years | 14 (63.6%) | 8 (36.4%) |
| 35 to 44 Years | 10 (100.0%) | 0 (0.0%) |
| 45 to 54 Years | 18 (62.1%) | 11 (37.9%) |
| 55 to 64 Years | 24 (60.0%) | 16 (40.0%) |
| 65 to 74 Years | 10 (100.0%) | 0 (0.0%) |
| 75 Years and older | 2 (100.0%) | 0 (0.0%) |
| Total | 145 (78.0%) | 41 (22.0%) |
Health Insurance Coverage by Citizenship Status in Morgan City
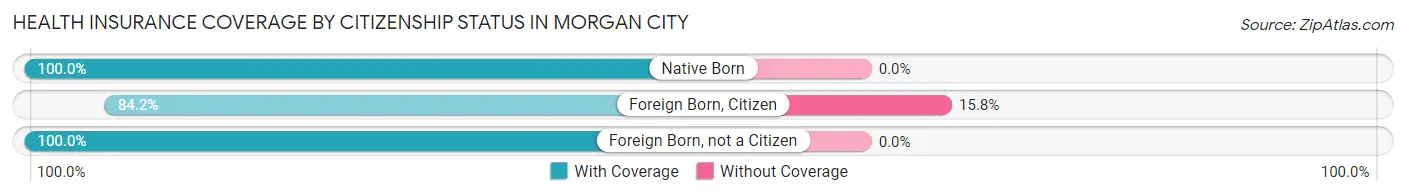
| Citizenship Status | With Coverage | Without Coverage |
| Native Born | 8 (100.0%) | 0 (0.0%) |
| Foreign Born, Citizen | 32 (84.2%) | 6 (15.8%) |
| Foreign Born, not a Citizen | 27 (100.0%) | 0 (0.0%) |
Health Insurance Coverage by Household Income in Morgan City
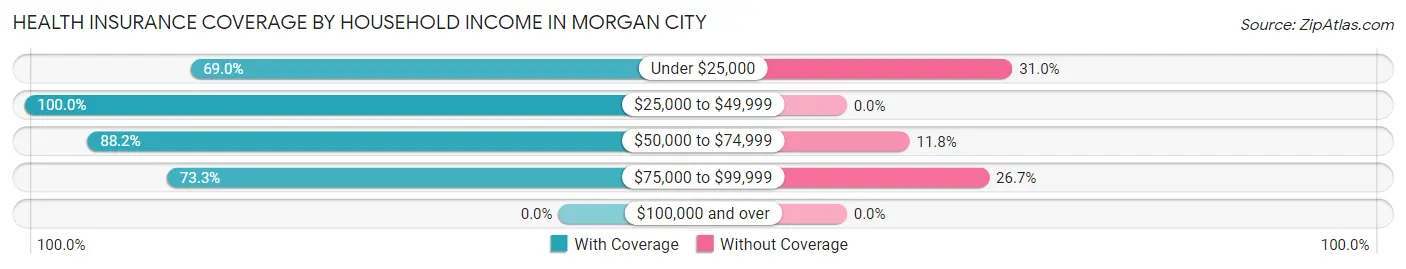
| Household Income | With Coverage | Without Coverage |
| Under $25,000 | 60 (69.0%) | 27 (31.0%) |
| $25,000 to $49,999 | 18 (100.0%) | 0 (0.0%) |
| $50,000 to $74,999 | 45 (88.2%) | 6 (11.8%) |
| $75,000 to $99,999 | 22 (73.3%) | 8 (26.7%) |
| $100,000 and over | 0 (0.0%) | 0 (0.0%) |
Public vs Private Health Insurance Coverage by Age in Morgan City
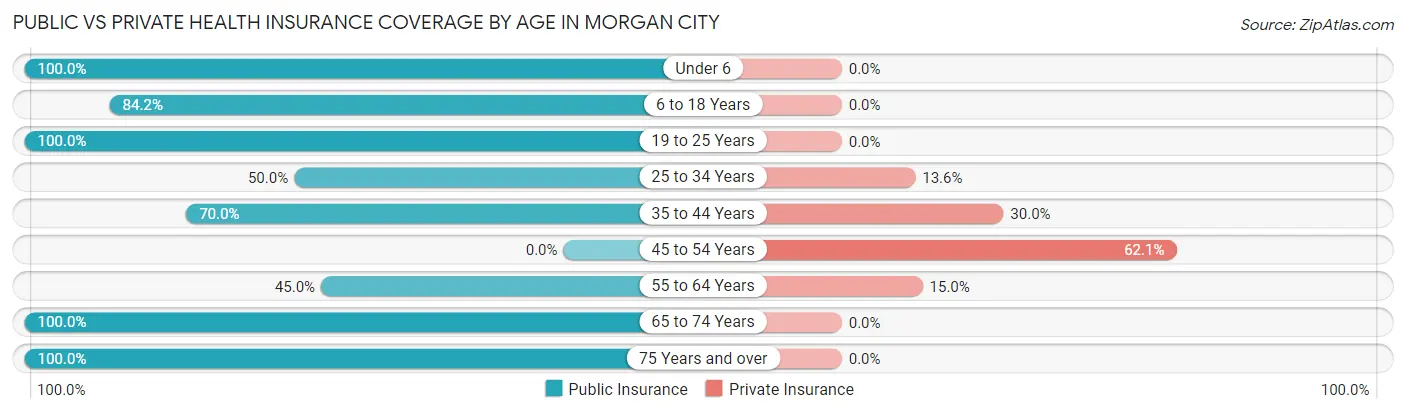
| Age Bracket | Public Insurance | Private Insurance |
| Under 6 | 8 (100.0%) | 0 (0.0%) |
| 6 to 18 Years | 32 (84.2%) | 0 (0.0%) |
| 19 to 25 Years | 27 (100.0%) | 0 (0.0%) |
| 25 to 34 Years | 11 (50.0%) | 3 (13.6%) |
| 35 to 44 Years | 7 (70.0%) | 3 (30.0%) |
| 45 to 54 Years | 0 (0.0%) | 18 (62.1%) |
| 55 to 64 Years | 18 (45.0%) | 6 (15.0%) |
| 65 to 74 Years | 10 (100.0%) | 0 (0.0%) |
| 75 Years and over | 2 (100.0%) | 0 (0.0%) |
| Total | 115 (61.8%) | 30 (16.1%) |
Disability Status by Sex by Age in Morgan City
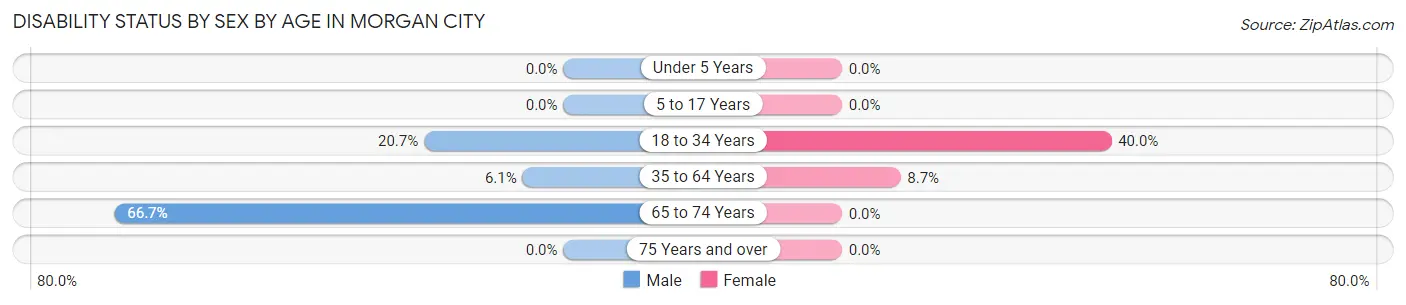
| Age Bracket | Male | Female |
| Under 5 Years | 0 (0.0%) | 0 (0.0%) |
| 5 to 17 Years | 0 (0.0%) | 0 (0.0%) |
| 18 to 34 Years | 6 (20.7%) | 8 (40.0%) |
| 35 to 64 Years | 2 (6.1%) | 4 (8.7%) |
| 65 to 74 Years | 2 (66.7%) | 0 (0.0%) |
| 75 Years and over | 0 (0.0%) | 0 (0.0%) |
Disability Class by Sex by Age in Morgan City
Disability Class: Hearing Difficulty
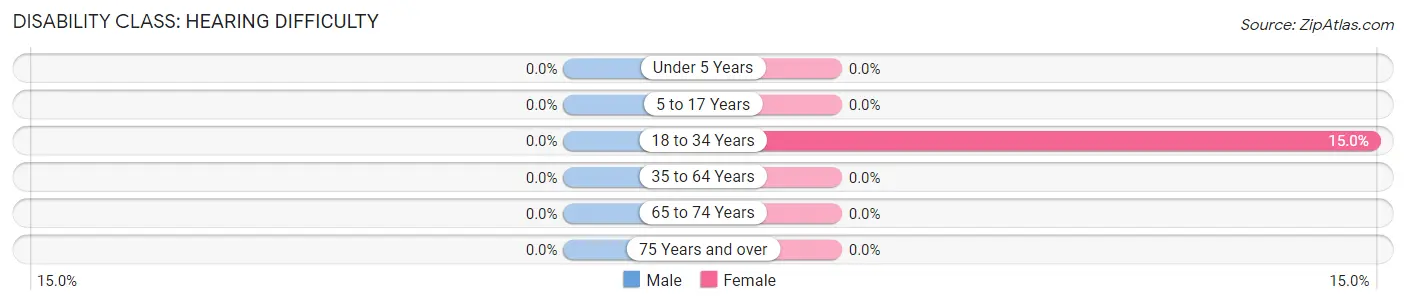
| Age Bracket | Male | Female |
| Under 5 Years | 0 (0.0%) | 0 (0.0%) |
| 5 to 17 Years | 0 (0.0%) | 0 (0.0%) |
| 18 to 34 Years | 0 (0.0%) | 3 (15.0%) |
| 35 to 64 Years | 0 (0.0%) | 0 (0.0%) |
| 65 to 74 Years | 0 (0.0%) | 0 (0.0%) |
| 75 Years and over | 0 (0.0%) | 0 (0.0%) |
Disability Class: Vision Difficulty
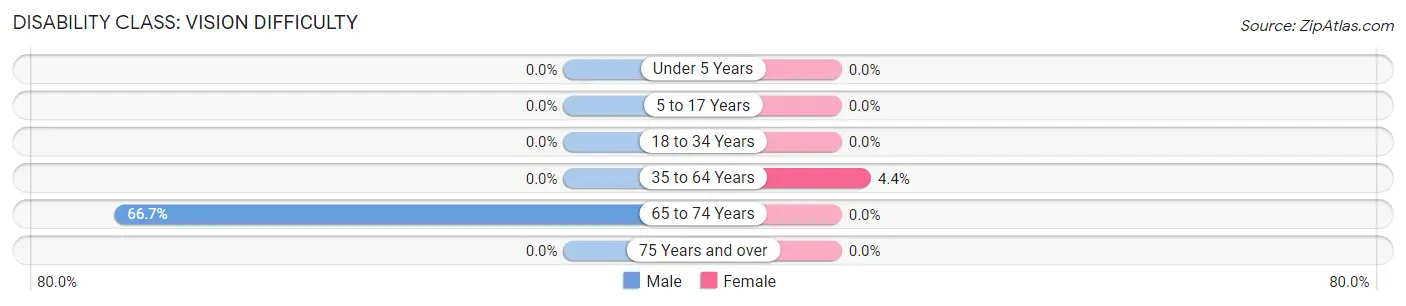
| Age Bracket | Male | Female |
| Under 5 Years | 0 (0.0%) | 0 (0.0%) |
| 5 to 17 Years | 0 (0.0%) | 0 (0.0%) |
| 18 to 34 Years | 0 (0.0%) | 0 (0.0%) |
| 35 to 64 Years | 0 (0.0%) | 2 (4.3%) |
| 65 to 74 Years | 2 (66.7%) | 0 (0.0%) |
| 75 Years and over | 0 (0.0%) | 0 (0.0%) |
Disability Class: Cognitive Difficulty
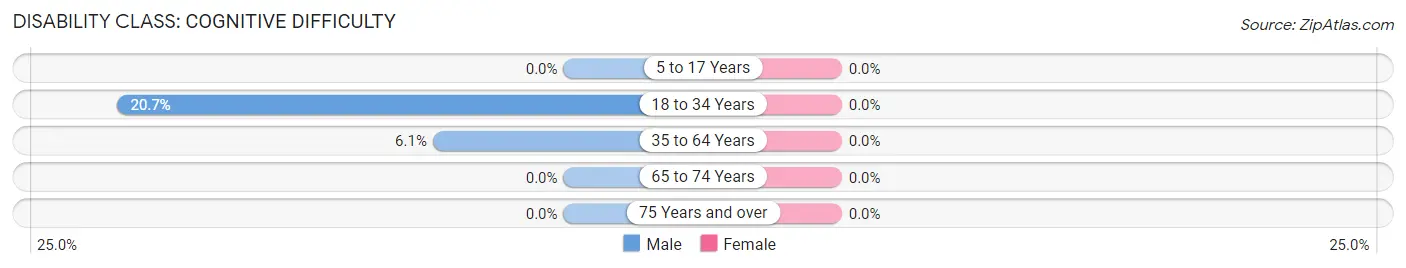
| Age Bracket | Male | Female |
| 5 to 17 Years | 0 (0.0%) | 0 (0.0%) |
| 18 to 34 Years | 6 (20.7%) | 0 (0.0%) |
| 35 to 64 Years | 2 (6.1%) | 0 (0.0%) |
| 65 to 74 Years | 0 (0.0%) | 0 (0.0%) |
| 75 Years and over | 0 (0.0%) | 0 (0.0%) |
Disability Class: Ambulatory Difficulty
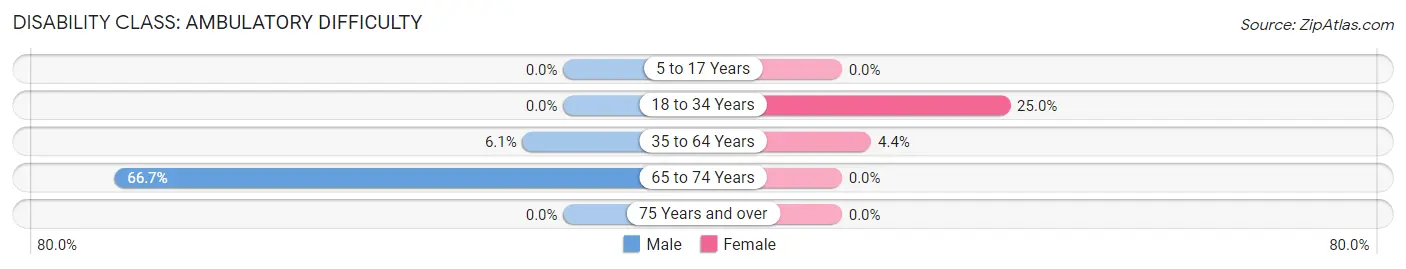
| Age Bracket | Male | Female |
| 5 to 17 Years | 0 (0.0%) | 0 (0.0%) |
| 18 to 34 Years | 0 (0.0%) | 5 (25.0%) |
| 35 to 64 Years | 2 (6.1%) | 2 (4.3%) |
| 65 to 74 Years | 2 (66.7%) | 0 (0.0%) |
| 75 Years and over | 0 (0.0%) | 0 (0.0%) |
Disability Class: Self-Care Difficulty
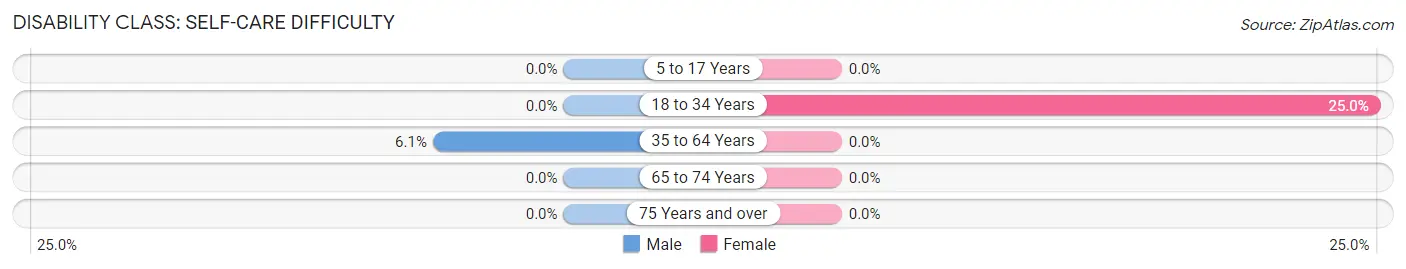
| Age Bracket | Male | Female |
| 5 to 17 Years | 0 (0.0%) | 0 (0.0%) |
| 18 to 34 Years | 0 (0.0%) | 5 (25.0%) |
| 35 to 64 Years | 2 (6.1%) | 0 (0.0%) |
| 65 to 74 Years | 0 (0.0%) | 0 (0.0%) |
| 75 Years and over | 0 (0.0%) | 0 (0.0%) |
Technology Access in Morgan City
Computing Device Access in Morgan City
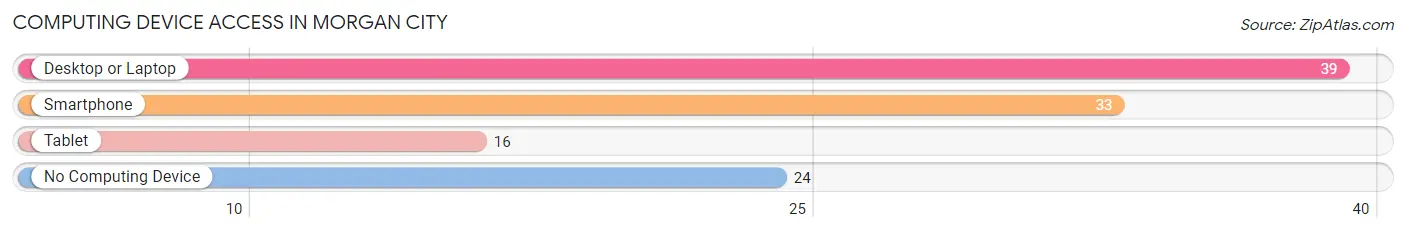
| Device Type | # Households | % Households |
| Desktop or Laptop | 39 | 58.2% |
| Smartphone | 33 | 49.2% |
| Tablet | 16 | 23.9% |
| No Computing Device | 24 | 35.8% |
| Total | 67 | 100.0% |
Internet Access in Morgan City
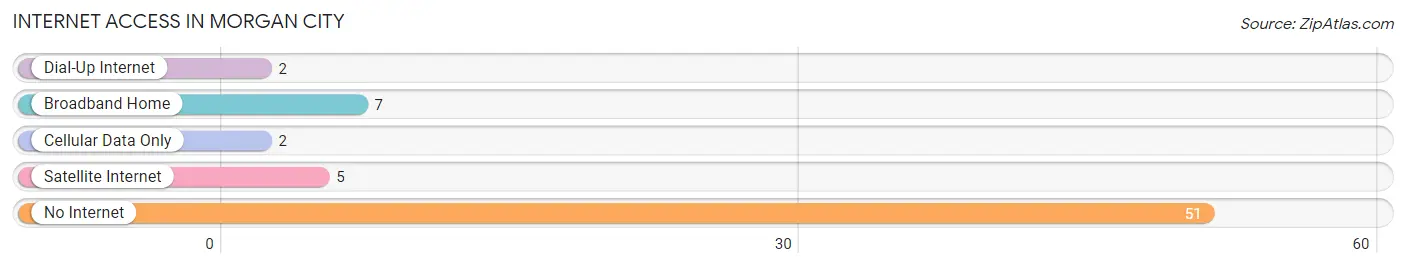
| Internet Type | # Households | % Households |
| Dial-Up Internet | 2 | 3.0% |
| Broadband Home | 7 | 10.4% |
| Cellular Data Only | 2 | 3.0% |
| Satellite Internet | 5 | 7.5% |
| No Internet | 51 | 76.1% |
| Total | 67 | 100.0% |
Morgan City Summary
Introduction
Morgan City is a small town located in Mississippi, United States. It is situated in the south-central part of the state, in the county of Clarke. The town is known for its rich history, diverse geography, and vibrant economy. This paper will provide an overview of Morgan City’s history, geography, economy, and demographics in 2000 words.
History
Morgan City was founded in 1837 by a group of settlers from Georgia. The town was named after the first settler, John Morgan. The town was originally a small farming community, but it soon grew into a bustling trading center. The town was a major stop on the Mobile and Ohio Railroad, which connected the town to other parts of the state.
In the late 19th century, Morgan City became a major cotton-producing center. The town was also home to several sawmills and other industries. The town’s economy was further bolstered by the discovery of oil in the area in the early 20th century.
Geography
Morgan City is located in the south-central part of Mississippi, in the county of Clarke. The town is situated on the banks of the Tombigbee River, which flows through the town. The town is surrounded by rolling hills and forests, and is located near the Natchez Trace Parkway.
The town has a humid subtropical climate, with hot summers and mild winters. The average annual temperature is around 70 degrees Fahrenheit. The town receives an average of 48 inches of rain per year.
Economy
Morgan City’s economy is largely based on agriculture and manufacturing. The town is home to several large farms, which produce cotton, soybeans, corn, and other crops. The town is also home to several manufacturing plants, which produce a variety of products, including furniture, clothing, and electronics.
The town is also home to several small businesses, including restaurants, shops, and other services. The town is also home to several tourist attractions, including the Natchez Trace Parkway and the Tombigbee River.
Demographics
As of the 2010 census, the population of Morgan City was 2,845. The town is predominantly white, with a small African American population. The median household income is around $30,000, and the median age is around 40 years old.
Conclusion
Morgan City is a small town located in Mississippi, United States. It is known for its rich history, diverse geography, and vibrant economy. The town is home to several large farms, manufacturing plants, and small businesses. The town is predominantly white, with a small African American population. The median household income is around $30,000, and the median age is around 40 years old.
Common Questions
What is Per Capita Income in Morgan City?
Per Capita income in Morgan City is $12,474.
What is the Median Household income in Morgan City?
Median Household Income in Morgan City is $17,292.
What is Inequality or Gini Index in Morgan City?
Inequality or Gini Index in Morgan City is 0.43.
What is the Total Population of Morgan City?
Total Population of Morgan City is 186.
What is the Total Male Population of Morgan City?
Total Male Population of Morgan City is 92.
What is the Total Female Population of Morgan City?
Total Female Population of Morgan City is 94.
What is the Ratio of Males per 100 Females in Morgan City?
There are 97.87 Males per 100 Females in Morgan City.
What is the Ratio of Females per 100 Males in Morgan City?
There are 102.17 Females per 100 Males in Morgan City.
What is the Median Population Age in Morgan City?
Median Population Age in Morgan City is 34.8 Years.
What is the Average Family Size in Morgan City
Average Family Size in Morgan City is 4.9 People.
What is the Average Household Size in Morgan City
Average Household Size in Morgan City is 2.8 People.
How Large is the Labor Force in Morgan City?
There are 72 People in the Labor Forcein in Morgan City.
What is the Percentage of People in the Labor Force in Morgan City?
51.4% of People are in the Labor Force in Morgan City.
What is the Unemployment Rate in Morgan City?
Unemployment Rate in Morgan City is 9.7%.