Falmouth Foreside, ME Map & Demographics
Falmouth Foreside Map
Falmouth Foreside Overview
$86,742
PER CAPITA INCOME
$194,643
AVG FAMILY INCOME
$190,476
AVG HOUSEHOLD INCOME
49.4%
WAGE / INCOME GAP [ % ]
50.6¢/ $1
WAGE / INCOME GAP [ $ ]
0.48
INEQUALITY / GINI INDEX
2,022
TOTAL POPULATION
924
MALE POPULATION
1,098
FEMALE POPULATION
84.15
MALES / 100 FEMALES
118.83
FEMALES / 100 MALES
53.7
MEDIAN AGE
2.9
AVG FAMILY SIZE
2.5
AVG HOUSEHOLD SIZE
929
LABOR FORCE [ PEOPLE ]
56.4%
PERCENT IN LABOR FORCE
2.8%
UNEMPLOYMENT RATE
Income in Falmouth Foreside
Income Overview in Falmouth Foreside
Per Capita Income in Falmouth Foreside is $86,742, while median incomes of families and households are $194,643 and $190,476 respectively.
| Characteristic | Number | Measure |
| Per Capita Income | 2,022 | $86,742 |
| Median Family Income | 588 | $194,643 |
| Mean Family Income | 588 | $288,029 |
| Median Household Income | 759 | $190,476 |
| Mean Household Income | 759 | $241,544 |
| Income Deficit | 588 | $0 |
| Wage / Income Gap (%) | 2,022 | 49.35% |
| Wage / Income Gap ($) | 2,022 | 50.65¢ per $1 |
| Gini / Inequality Index | 2,022 | 0.48 |
Earnings by Sex in Falmouth Foreside
Average Earnings in Falmouth Foreside are $69,821, $92,083 for men and $46,639 for women, a difference of 49.3%.
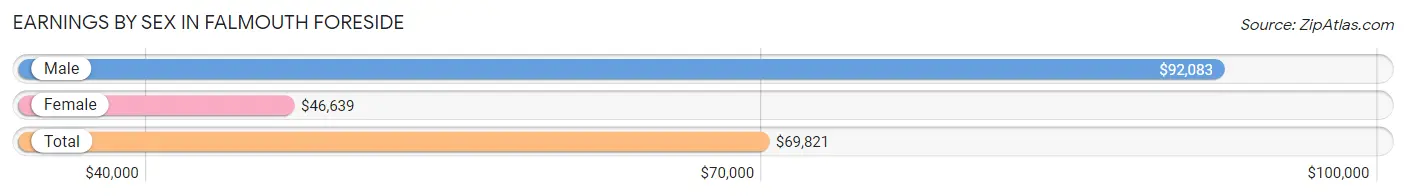
| Sex | Number | Average Earnings |
| Male | 503 (48.1%) | $92,083 |
| Female | 543 (51.9%) | $46,639 |
| Total | 1,046 (100.0%) | $69,821 |
Earnings by Sex by Income Bracket in Falmouth Foreside
The most common earnings brackets in Falmouth Foreside are $100,000+ for men (248 | 49.3%) and $100,000+ for women (171 | 31.5%).
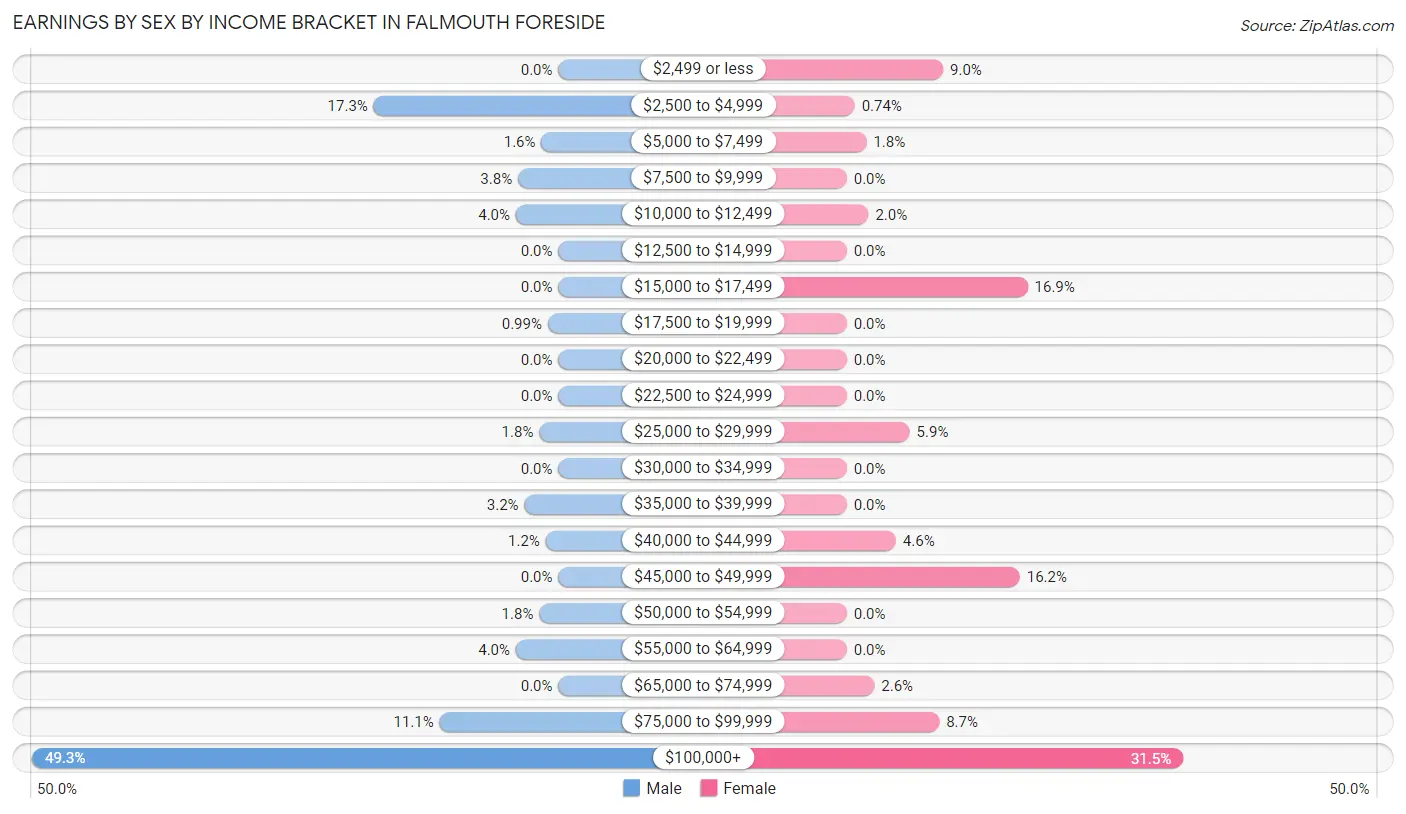
| Income | Male | Female |
| $2,499 or less | 0 (0.0%) | 49 (9.0%) |
| $2,500 to $4,999 | 87 (17.3%) | 4 (0.7%) |
| $5,000 to $7,499 | 8 (1.6%) | 10 (1.8%) |
| $7,500 to $9,999 | 19 (3.8%) | 0 (0.0%) |
| $10,000 to $12,499 | 20 (4.0%) | 11 (2.0%) |
| $12,500 to $14,999 | 0 (0.0%) | 0 (0.0%) |
| $15,000 to $17,499 | 0 (0.0%) | 92 (16.9%) |
| $17,500 to $19,999 | 5 (1.0%) | 0 (0.0%) |
| $20,000 to $22,499 | 0 (0.0%) | 0 (0.0%) |
| $22,500 to $24,999 | 0 (0.0%) | 0 (0.0%) |
| $25,000 to $29,999 | 9 (1.8%) | 32 (5.9%) |
| $30,000 to $34,999 | 0 (0.0%) | 0 (0.0%) |
| $35,000 to $39,999 | 16 (3.2%) | 0 (0.0%) |
| $40,000 to $44,999 | 6 (1.2%) | 25 (4.6%) |
| $45,000 to $49,999 | 0 (0.0%) | 88 (16.2%) |
| $50,000 to $54,999 | 9 (1.8%) | 0 (0.0%) |
| $55,000 to $64,999 | 20 (4.0%) | 0 (0.0%) |
| $65,000 to $74,999 | 0 (0.0%) | 14 (2.6%) |
| $75,000 to $99,999 | 56 (11.1%) | 47 (8.7%) |
| $100,000+ | 248 (49.3%) | 171 (31.5%) |
| Total | 503 (100.0%) | 543 (100.0%) |
Earnings by Sex by Educational Attainment in Falmouth Foreside
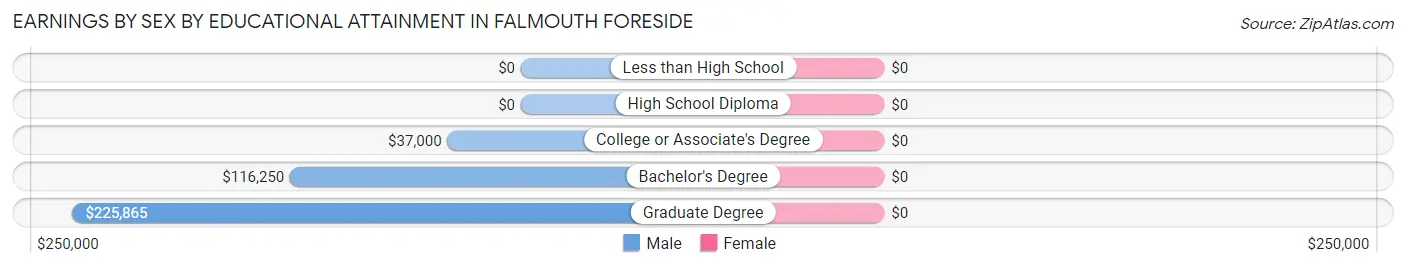
| Educational Attainment | Male Income | Female Income |
| Less than High School | - | - |
| High School Diploma | - | - |
| College or Associate's Degree | $37,000 | $0 |
| Bachelor's Degree | $116,250 | $0 |
| Graduate Degree | $225,865 | $0 |
| Total | $115,000 | $0 |
Family Income in Falmouth Foreside
Family Income Brackets in Falmouth Foreside
According to the Falmouth Foreside family income data, there are 293 families falling into the $200,000+ income range, which is the most common income bracket and makes up 49.8% of all families.
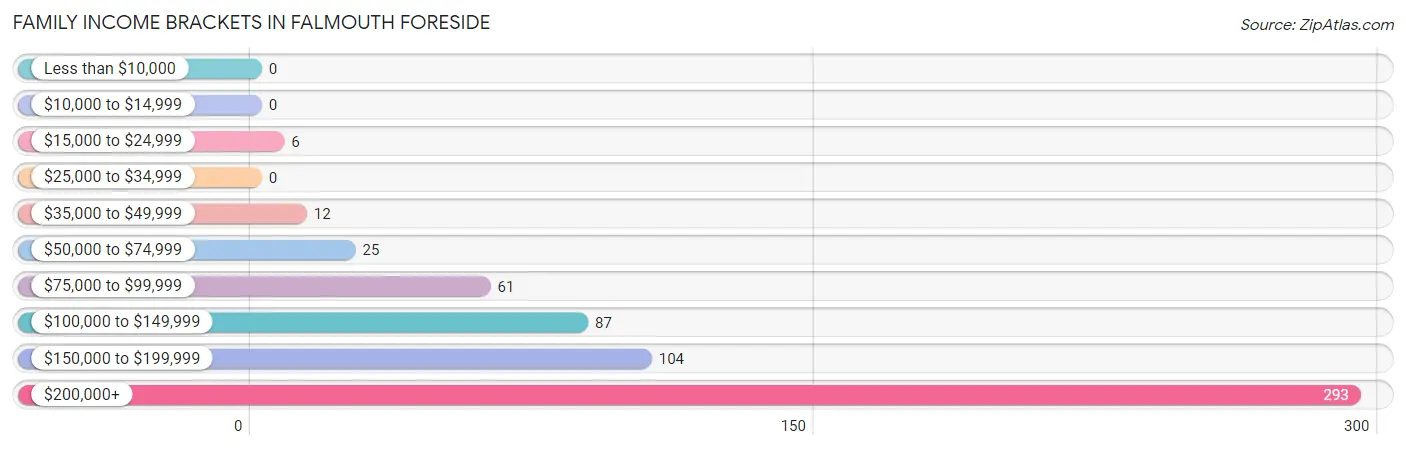
| Income Bracket | # Families | % Families |
| Less than $10,000 | 0 | 0.0% |
| $10,000 to $14,999 | 0 | 0.0% |
| $15,000 to $24,999 | 6 | 1.0% |
| $25,000 to $34,999 | 0 | 0.0% |
| $35,000 to $49,999 | 12 | 2.0% |
| $50,000 to $74,999 | 25 | 4.3% |
| $75,000 to $99,999 | 61 | 10.4% |
| $100,000 to $149,999 | 87 | 14.8% |
| $150,000 to $199,999 | 104 | 17.7% |
| $200,000+ | 293 | 49.8% |
Family Income by Famaliy Size in Falmouth Foreside
4-person families (121 | 20.6%) account for the highest median family income in Falmouth Foreside with $250,001 per family, while 2-person families (234 | 39.8%) have the highest median income of $68,940 per family member.
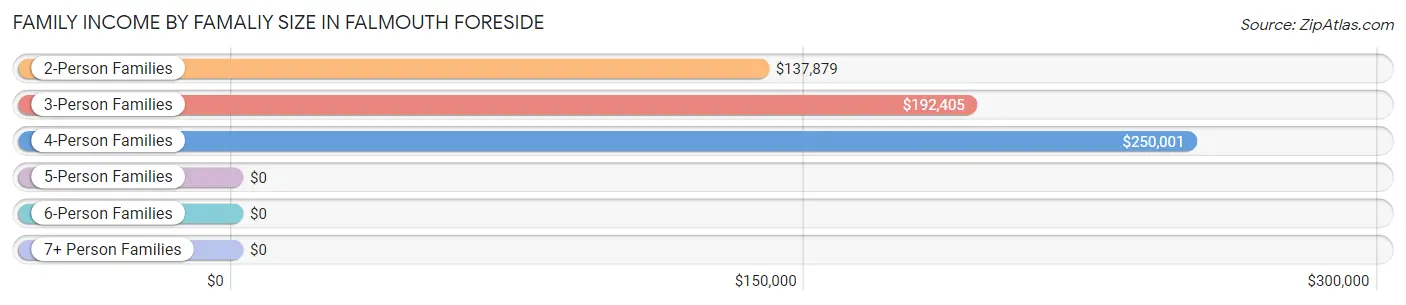
| Income Bracket | # Families | Median Income |
| 2-Person Families | 234 (39.8%) | $137,879 |
| 3-Person Families | 177 (30.1%) | $192,405 |
| 4-Person Families | 121 (20.6%) | $250,001 |
| 5-Person Families | 56 (9.5%) | $0 |
| 6-Person Families | 0 (0.0%) | $0 |
| 7+ Person Families | 0 (0.0%) | $0 |
| Total | 588 (100.0%) | $194,643 |
Family Income by Number of Earners in Falmouth Foreside
The median family income in Falmouth Foreside is $194,643, with families comprising 1 earner (114) having the highest median family income of $243,333, while families with no earners (94) have the lowest median family income of $82,059, accounting for 19.4% and 16.0% of families, respectively.
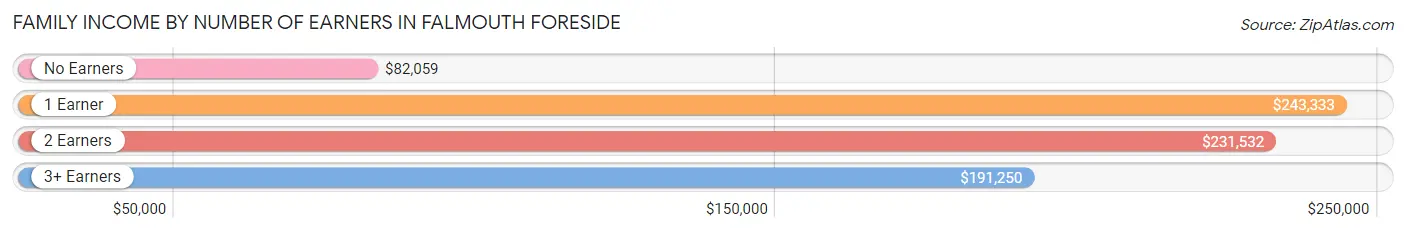
| Number of Earners | # Families | Median Income |
| No Earners | 94 (16.0%) | $82,059 |
| 1 Earner | 114 (19.4%) | $243,333 |
| 2 Earners | 262 (44.6%) | $231,532 |
| 3+ Earners | 118 (20.1%) | $191,250 |
| Total | 588 (100.0%) | $194,643 |
Household Income in Falmouth Foreside
Household Income Brackets in Falmouth Foreside
With 298 households falling in the category, the $200,000+ income range is the most frequent in Falmouth Foreside, accounting for 39.3% of all households. In contrast, only 6 households (0.8%) fall into the $10,000 to $14,999 income bracket, making it the least populous group.
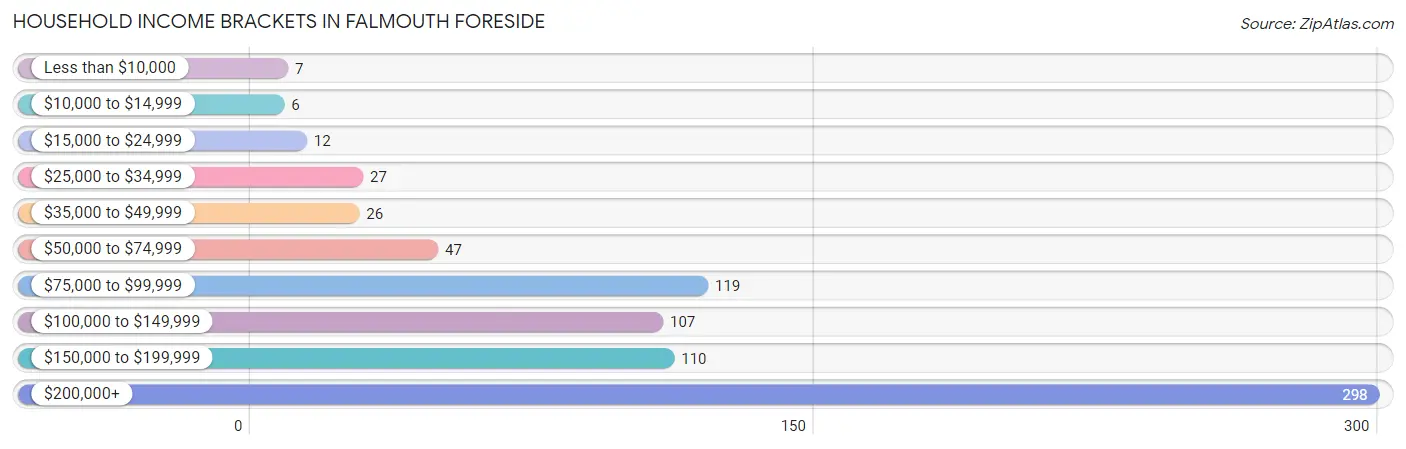
| Income Bracket | # Households | % Households |
| Less than $10,000 | 7 | 0.9% |
| $10,000 to $14,999 | 6 | 0.8% |
| $15,000 to $24,999 | 12 | 1.6% |
| $25,000 to $34,999 | 27 | 3.6% |
| $35,000 to $49,999 | 26 | 3.4% |
| $50,000 to $74,999 | 47 | 6.2% |
| $75,000 to $99,999 | 119 | 15.7% |
| $100,000 to $149,999 | 107 | 14.1% |
| $150,000 to $199,999 | 110 | 14.5% |
| $200,000+ | 298 | 39.3% |
Household Income by Householder Age in Falmouth Foreside
The median household income in Falmouth Foreside is $190,476, with the highest median household income of $209,250 found in the 25 to 44 years age bracket for the primary householder. A total of 154 households (20.3%) fall into this category.
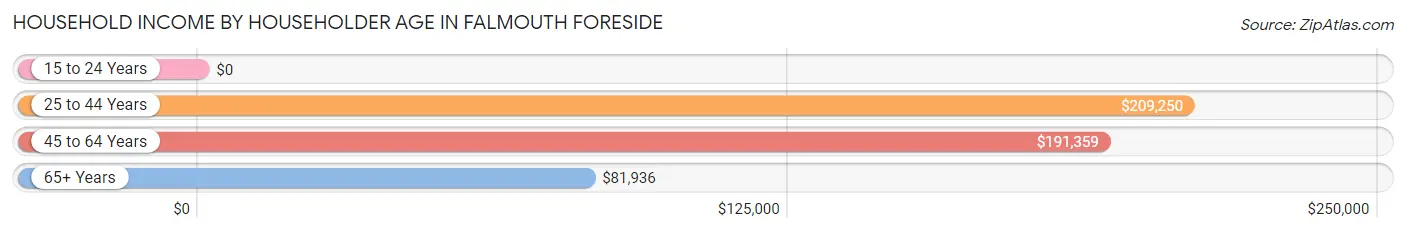
| Income Bracket | # Households | Median Income |
| 15 to 24 Years | 0 (0.0%) | $0 |
| 25 to 44 Years | 154 (20.3%) | $209,250 |
| 45 to 64 Years | 350 (46.1%) | $191,359 |
| 65+ Years | 255 (33.6%) | $81,936 |
| Total | 759 (100.0%) | $190,476 |
Poverty in Falmouth Foreside
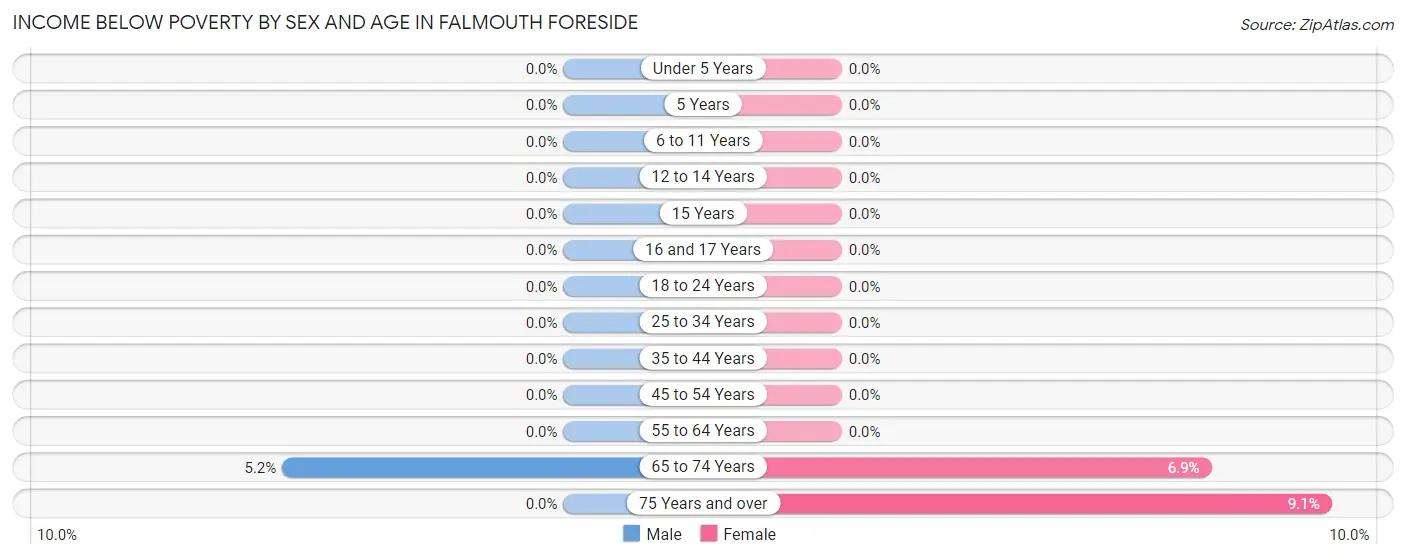
Income Below Poverty by Sex and Age in Falmouth Foreside
With 0.7% poverty level for males and 1.9% for females among the residents of Falmouth Foreside, 65 to 74 year old males and 75 year old and over females are the most vulnerable to poverty, with 6 males (5.2%) and 7 females (9.1%) in their respective age groups living below the poverty level.
| Age Bracket | Male | Female |
| Under 5 Years | 0 (0.0%) | 0 (0.0%) |
| 5 Years | 0 (0.0%) | 0 (0.0%) |
| 6 to 11 Years | 0 (0.0%) | 0 (0.0%) |
| 12 to 14 Years | 0 (0.0%) | 0 (0.0%) |
| 15 Years | 0 (0.0%) | 0 (0.0%) |
| 16 and 17 Years | 0 (0.0%) | 0 (0.0%) |
| 18 to 24 Years | 0 (0.0%) | 0 (0.0%) |
| 25 to 34 Years | 0 (0.0%) | 0 (0.0%) |
| 35 to 44 Years | 0 (0.0%) | 0 (0.0%) |
| 45 to 54 Years | 0 (0.0%) | 0 (0.0%) |
| 55 to 64 Years | 0 (0.0%) | 0 (0.0%) |
| 65 to 74 Years | 6 (5.2%) | 12 (6.9%) |
| 75 Years and over | 0 (0.0%) | 7 (9.1%) |
| Total | 6 (0.7%) | 19 (1.9%) |
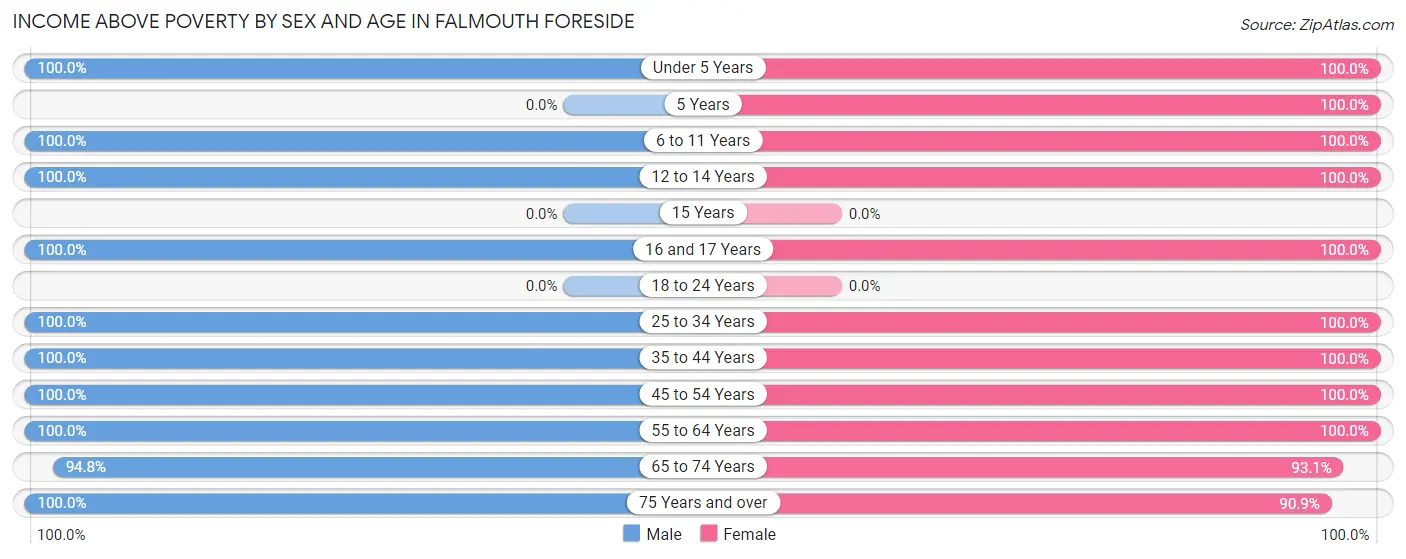
Income Above Poverty by Sex and Age in Falmouth Foreside
According to the poverty statistics in Falmouth Foreside, males aged under 5 years and females aged under 5 years are the age groups that are most secure financially, with 100.0% of males and 100.0% of females in these age groups living above the poverty line.
| Age Bracket | Male | Female |
| Under 5 Years | 37 (100.0%) | 47 (100.0%) |
| 5 Years | 0 (0.0%) | 6 (100.0%) |
| 6 to 11 Years | 121 (100.0%) | 69 (100.0%) |
| 12 to 14 Years | 57 (100.0%) | 37 (100.0%) |
| 15 Years | 0 (0.0%) | 0 (0.0%) |
| 16 and 17 Years | 95 (100.0%) | 59 (100.0%) |
| 18 to 24 Years | 0 (0.0%) | 0 (0.0%) |
| 25 to 34 Years | 17 (100.0%) | 37 (100.0%) |
| 35 to 44 Years | 115 (100.0%) | 120 (100.0%) |
| 45 to 54 Years | 145 (100.0%) | 129 (100.0%) |
| 55 to 64 Years | 122 (100.0%) | 231 (100.0%) |
| 65 to 74 Years | 109 (94.8%) | 163 (93.1%) |
| 75 Years and over | 68 (100.0%) | 70 (90.9%) |
| Total | 886 (99.3%) | 968 (98.1%) |
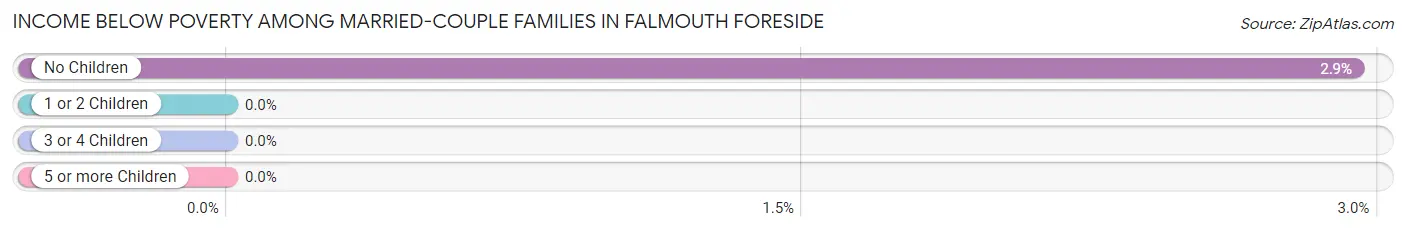
Income Below Poverty Among Married-Couple Families in Falmouth Foreside
The poverty statistics for married-couple families in Falmouth Foreside show that 1.1% or 6 of the total 551 families live below the poverty line. Families with no children have the highest poverty rate of 2.9%, comprising of 6 families. On the other hand, families with 1 or 2 children have the lowest poverty rate of 0.0%, which includes 0 families.
| Children | Above Poverty | Below Poverty |
| No Children | 198 (97.1%) | 6 (2.9%) |
| 1 or 2 Children | 324 (100.0%) | 0 (0.0%) |
| 3 or 4 Children | 23 (100.0%) | 0 (0.0%) |
| 5 or more Children | 0 (0.0%) | 0 (0.0%) |
| Total | 545 (98.9%) | 6 (1.1%) |
Income Below Poverty Among Single-Parent Households in Falmouth Foreside
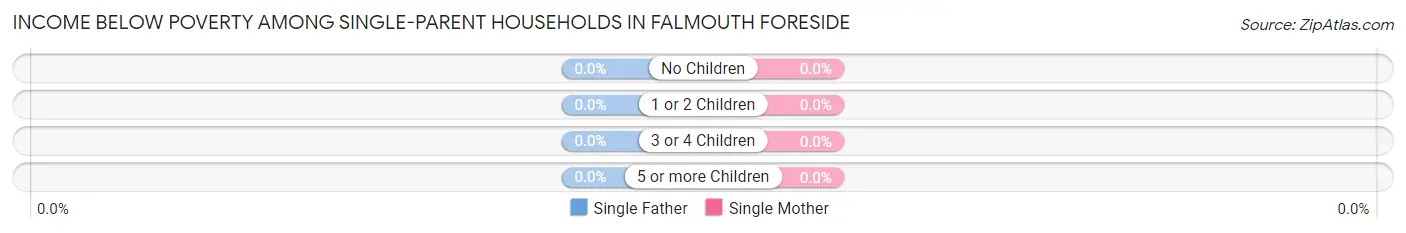
| Children | Single Father | Single Mother |
| No Children | 0 (0.0%) | 0 (0.0%) |
| 1 or 2 Children | 0 (0.0%) | 0 (0.0%) |
| 3 or 4 Children | 0 (0.0%) | 0 (0.0%) |
| 5 or more Children | 0 (0.0%) | 0 (0.0%) |
| Total | 0 (0.0%) | 0 (0.0%) |
Income Below Poverty Among Married-Couple vs Single-Parent Households in Falmouth Foreside
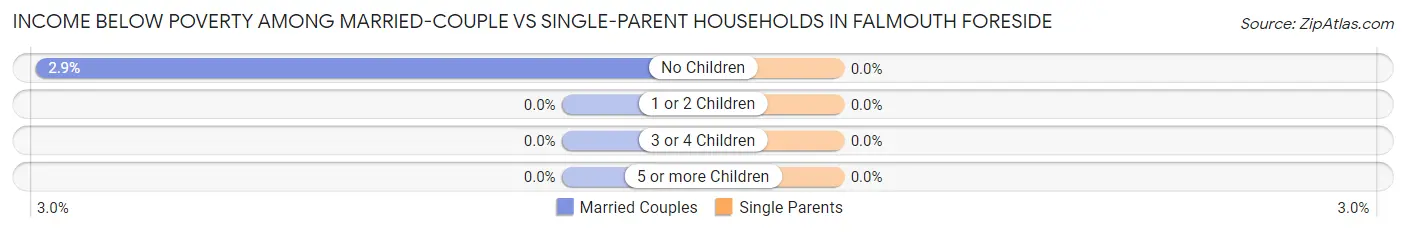
| Children | Married-Couple Families | Single-Parent Households |
| No Children | 6 (2.9%) | 0 (0.0%) |
| 1 or 2 Children | 0 (0.0%) | 0 (0.0%) |
| 3 or 4 Children | 0 (0.0%) | 0 (0.0%) |
| 5 or more Children | 0 (0.0%) | 0 (0.0%) |
| Total | 6 (1.1%) | 0 (0.0%) |
Race in Falmouth Foreside
The most populous races in Falmouth Foreside are White / Caucasian (1,798 | 88.9%), Two or more Races (193 | 9.6%), and Some other Race (24 | 1.2%).
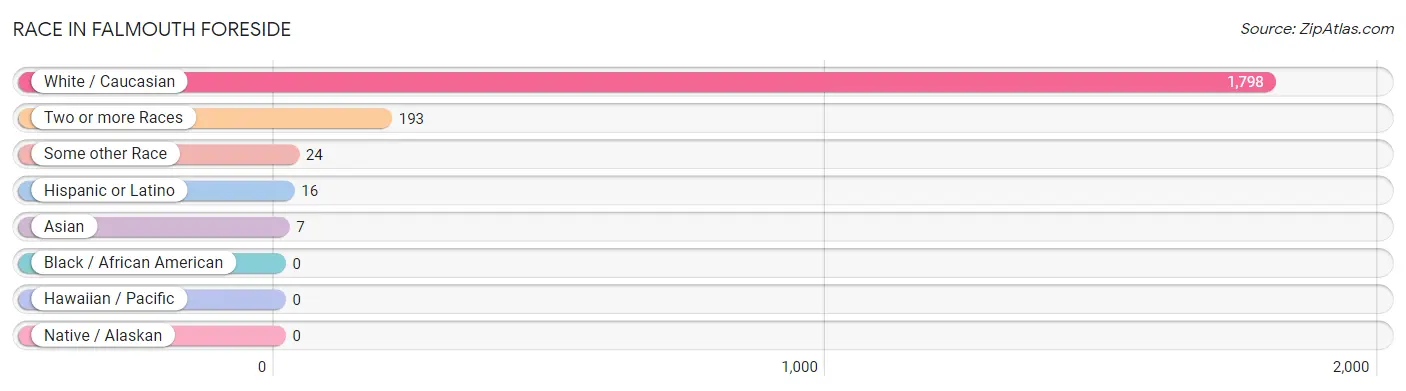
| Race | # Population | % Population |
| Asian | 7 | 0.4% |
| Black / African American | 0 | 0.0% |
| Hawaiian / Pacific | 0 | 0.0% |
| Hispanic or Latino | 16 | 0.8% |
| Native / Alaskan | 0 | 0.0% |
| White / Caucasian | 1,798 | 88.9% |
| Two or more Races | 193 | 9.6% |
| Some other Race | 24 | 1.2% |
| Total | 2,022 | 100.0% |
Ancestry in Falmouth Foreside
The most populous ancestries reported in Falmouth Foreside are English (572 | 28.3%), Irish (310 | 15.3%), Swedish (214 | 10.6%), Burmese (164 | 8.1%), and American (147 | 7.3%), together accounting for 69.6% of all Falmouth Foreside residents.
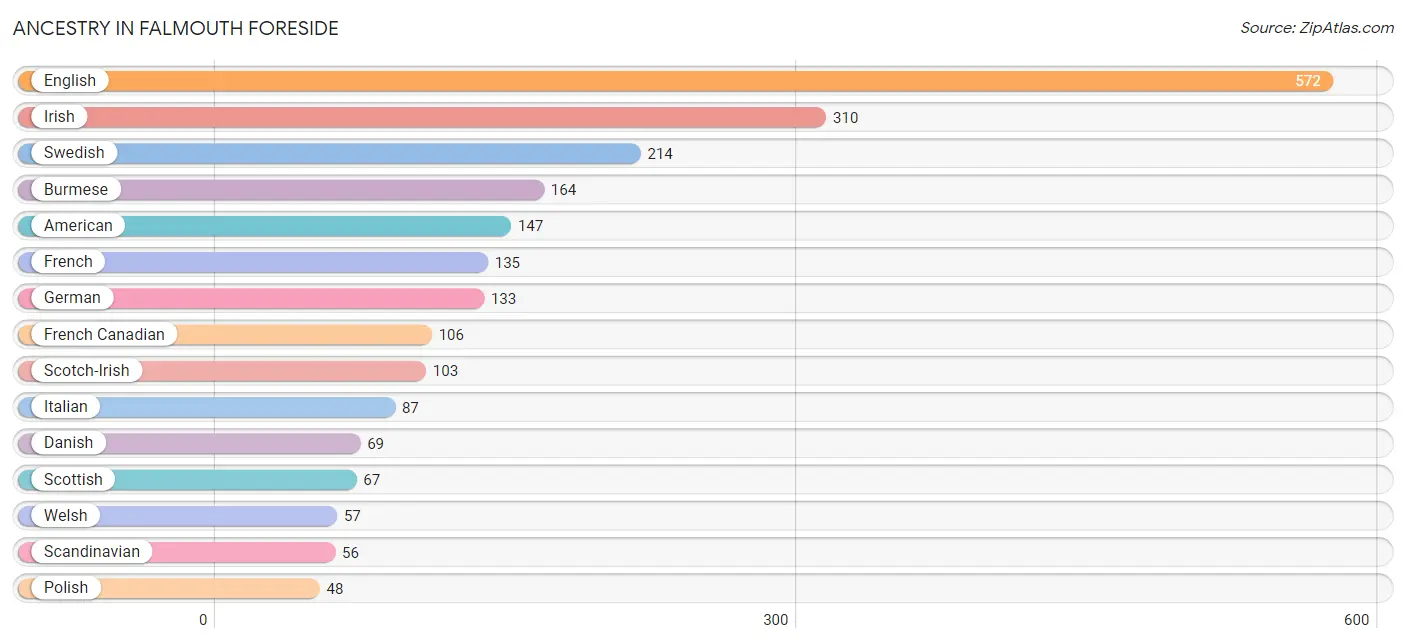
| Ancestry | # Population | % Population |
| American | 147 | 7.3% |
| Armenian | 37 | 1.8% |
| Barbadian | 20 | 1.0% |
| Bhutanese | 7 | 0.4% |
| British | 11 | 0.5% |
| Burmese | 164 | 8.1% |
| Czech | 41 | 2.0% |
| Danish | 69 | 3.4% |
| English | 572 | 28.3% |
| European | 21 | 1.0% |
| French | 135 | 6.7% |
| French Canadian | 106 | 5.2% |
| German | 133 | 6.6% |
| Greek | 44 | 2.2% |
| Irish | 310 | 15.3% |
| Italian | 87 | 4.3% |
| Latvian | 14 | 0.7% |
| Lithuanian | 5 | 0.3% |
| Northern European | 6 | 0.3% |
| Norwegian | 27 | 1.3% |
| Polish | 48 | 2.4% |
| Romanian | 6 | 0.3% |
| Russian | 21 | 1.0% |
| Scandinavian | 56 | 2.8% |
| Scotch-Irish | 103 | 5.1% |
| Scottish | 67 | 3.3% |
| South American | 16 | 0.8% |
| Swedish | 214 | 10.6% |
| Swiss | 27 | 1.3% |
| Venezuelan | 16 | 0.8% |
| Welsh | 57 | 2.8% | View All 31 Rows |
Immigrants in Falmouth Foreside
The most numerous immigrant groups reported in Falmouth Foreside came from Europe (53 | 2.6%), Northern Europe (53 | 2.6%), England (48 | 2.4%), Asia (24 | 1.2%), and Malaysia (24 | 1.2%), together accounting for 10.0% of all Falmouth Foreside residents.
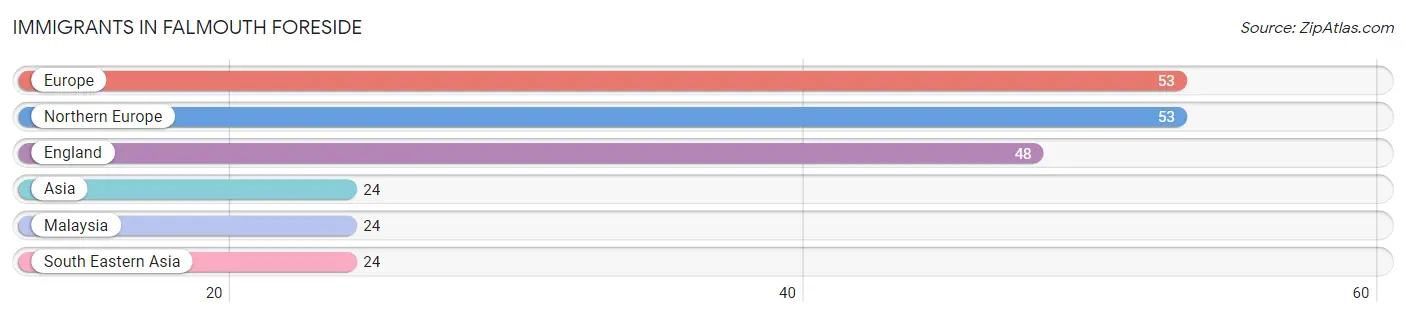
| Immigration Origin | # Population | % Population |
| Asia | 24 | 1.2% |
| England | 48 | 2.4% |
| Europe | 53 | 2.6% |
| Malaysia | 24 | 1.2% |
| Northern Europe | 53 | 2.6% |
| South Eastern Asia | 24 | 1.2% | View All 6 Rows |
Sex and Age in Falmouth Foreside
Sex and Age in Falmouth Foreside
The most populous age groups in Falmouth Foreside are 10 to 14 Years (111 | 12.0%) for men and 55 to 59 Years (205 | 18.7%) for women.
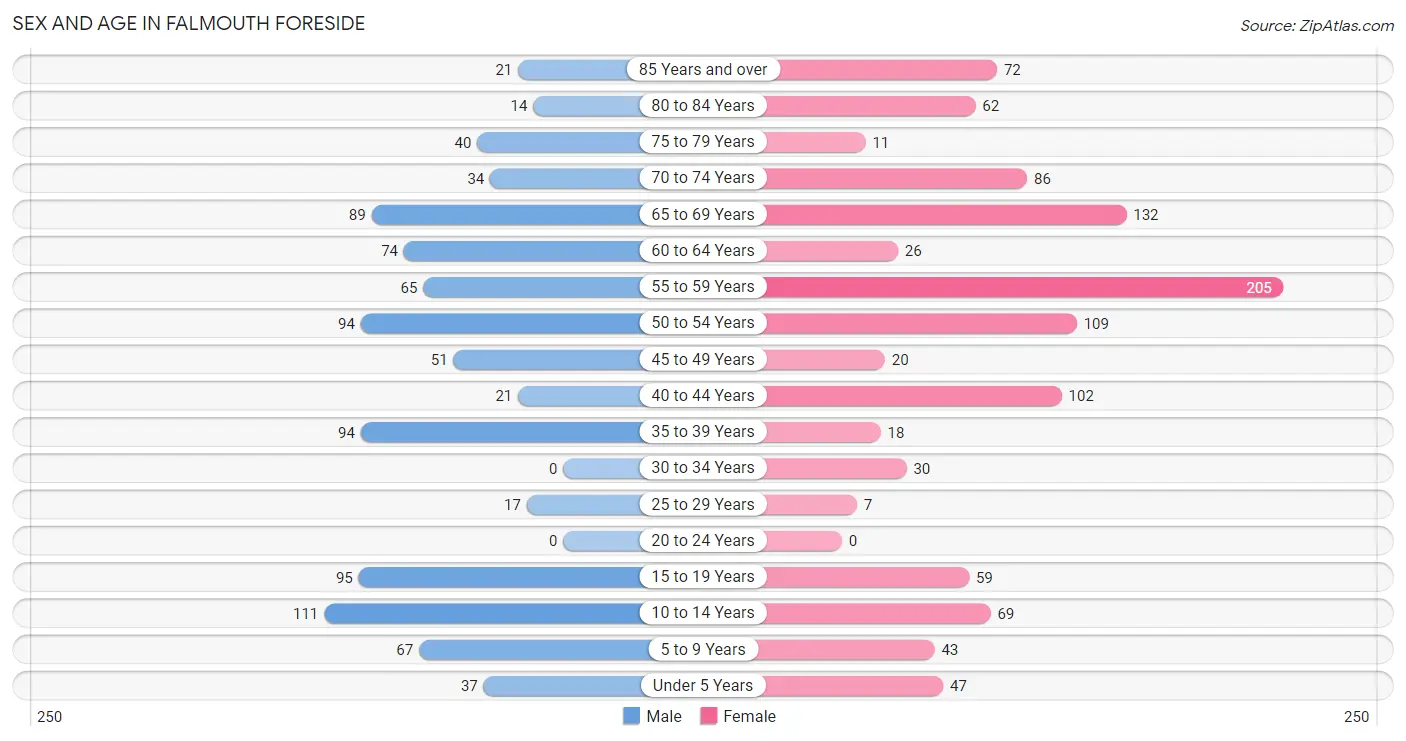
| Age Bracket | Male | Female |
| Under 5 Years | 37 (4.0%) | 47 (4.3%) |
| 5 to 9 Years | 67 (7.2%) | 43 (3.9%) |
| 10 to 14 Years | 111 (12.0%) | 69 (6.3%) |
| 15 to 19 Years | 95 (10.3%) | 59 (5.4%) |
| 20 to 24 Years | 0 (0.0%) | 0 (0.0%) |
| 25 to 29 Years | 17 (1.8%) | 7 (0.6%) |
| 30 to 34 Years | 0 (0.0%) | 30 (2.7%) |
| 35 to 39 Years | 94 (10.2%) | 18 (1.6%) |
| 40 to 44 Years | 21 (2.3%) | 102 (9.3%) |
| 45 to 49 Years | 51 (5.5%) | 20 (1.8%) |
| 50 to 54 Years | 94 (10.2%) | 109 (9.9%) |
| 55 to 59 Years | 65 (7.0%) | 205 (18.7%) |
| 60 to 64 Years | 74 (8.0%) | 26 (2.4%) |
| 65 to 69 Years | 89 (9.6%) | 132 (12.0%) |
| 70 to 74 Years | 34 (3.7%) | 86 (7.8%) |
| 75 to 79 Years | 40 (4.3%) | 11 (1.0%) |
| 80 to 84 Years | 14 (1.5%) | 62 (5.7%) |
| 85 Years and over | 21 (2.3%) | 72 (6.6%) |
| Total | 924 (100.0%) | 1,098 (100.0%) |
Families and Households in Falmouth Foreside
Median Family Size in Falmouth Foreside
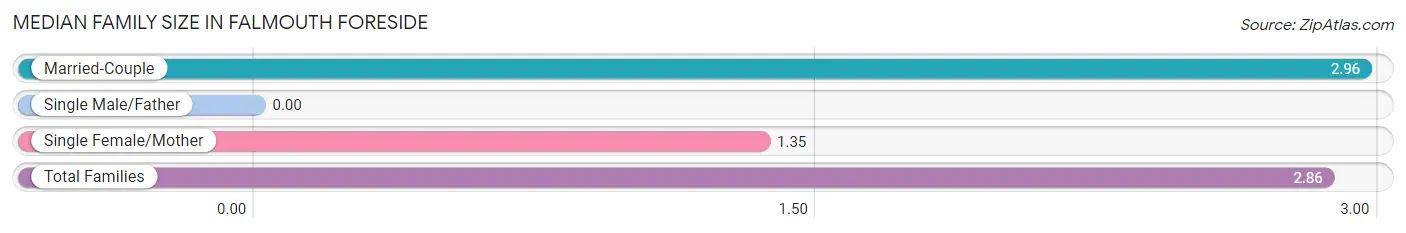
| Family Type | # Families | Family Size |
| Married-Couple | 551 (93.7%) | 2.96 |
| Single Male/Father | 0 (0.0%) | - |
| Single Female/Mother | 37 (6.3%) | 1.35 |
| Total Families | 588 (100.0%) | 2.86 |
Median Household Size in Falmouth Foreside
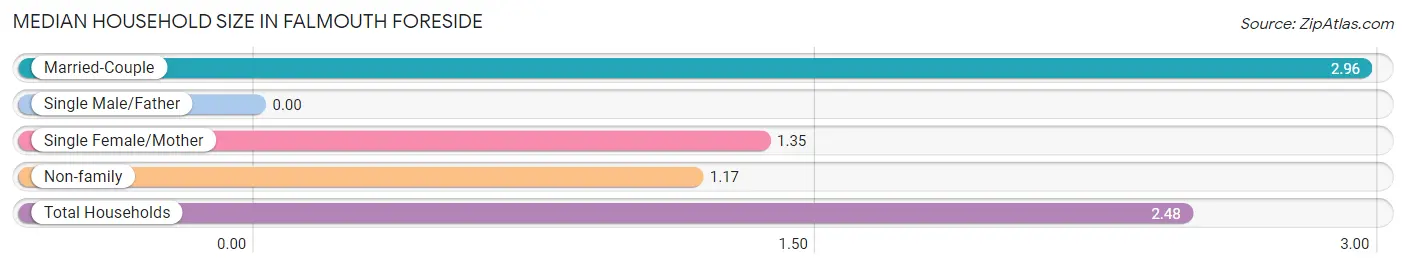
| Household Type | # Households | Household Size |
| Married-Couple | 551 (72.6%) | 2.96 |
| Single Male/Father | 0 (0.0%) | - |
| Single Female/Mother | 37 (4.9%) | 1.35 |
| Non-family | 171 (22.5%) | 1.17 |
| Total Households | 759 (100.0%) | 2.48 |
Household Size by Marriage Status in Falmouth Foreside
Out of a total of 759 households in Falmouth Foreside, 588 (77.5%) are family households, while 171 (22.5%) are nonfamily households. The most numerous type of family households are 2-person households, comprising 234, and the most common type of nonfamily households are 1-person households, comprising 147.
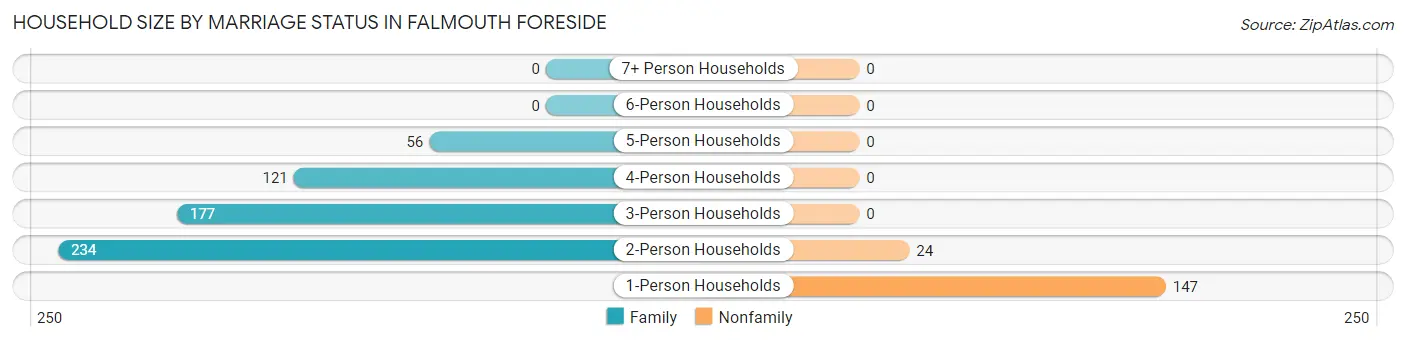
| Household Size | Family Households | Nonfamily Households |
| 1-Person Households | - | 147 (19.4%) |
| 2-Person Households | 234 (30.8%) | 24 (3.2%) |
| 3-Person Households | 177 (23.3%) | 0 (0.0%) |
| 4-Person Households | 121 (15.9%) | 0 (0.0%) |
| 5-Person Households | 56 (7.4%) | 0 (0.0%) |
| 6-Person Households | 0 (0.0%) | 0 (0.0%) |
| 7+ Person Households | 0 (0.0%) | 0 (0.0%) |
| Total | 588 (77.5%) | 171 (22.5%) |
Female Fertility in Falmouth Foreside
Fertility by Age in Falmouth Foreside
| Age Bracket | Women with Births | Births / 1,000 Women |
| 15 to 19 years | 0 (0.0%) | 0.0 |
| 20 to 34 years | 0 (0.0%) | 0.0 |
| 35 to 50 years | 0 (0.0%) | 0.0 |
| Total | 0 (0.0%) | 0.0 |
Fertility by Age by Marriage Status in Falmouth Foreside
| Age Bracket | Married | Unmarried |
| 15 to 19 years | 0 (0.0%) | 0 (0.0%) |
| 20 to 34 years | 0 (0.0%) | 0 (0.0%) |
| 35 to 50 years | 0 (0.0%) | 0 (0.0%) |
| Total | 0 (0.0%) | 0 (0.0%) |
Fertility by Education in Falmouth Foreside
| Educational Attainment | Women with Births | Births / 1,000 Women |
| Less than High School | 0 (0.0%) | 0.0 |
| High School Diploma | 0 (0.0%) | 0.0 |
| College or Associate's Degree | 0 (0.0%) | 0.0 |
| Bachelor's Degree | 0 (0.0%) | 0.0 |
| Graduate Degree | 0 (0.0%) | 0.0 |
| Total | 0 (0.0%) | 0.0 |
Fertility by Education by Marriage Status in Falmouth Foreside
| Educational Attainment | Married | Unmarried |
| Less than High School | 0 (0.0%) | 0 (0.0%) |
| High School Diploma | 0 (0.0%) | 0 (0.0%) |
| College or Associate's Degree | 0 (0.0%) | 0 (0.0%) |
| Bachelor's Degree | 0 (0.0%) | 0 (0.0%) |
| Graduate Degree | 0 (0.0%) | 0 (0.0%) |
| Total | 0 (0.0%) | 0 (0.0%) |
Employment Characteristics in Falmouth Foreside
Employment by Class of Employer in Falmouth Foreside
Among the 904 employed individuals in Falmouth Foreside, private company employees (547 | 60.5%), not-for-profit organizations (169 | 18.7%), and self-employed (incorporated) (67 | 7.4%) make up the most common classes of employment.
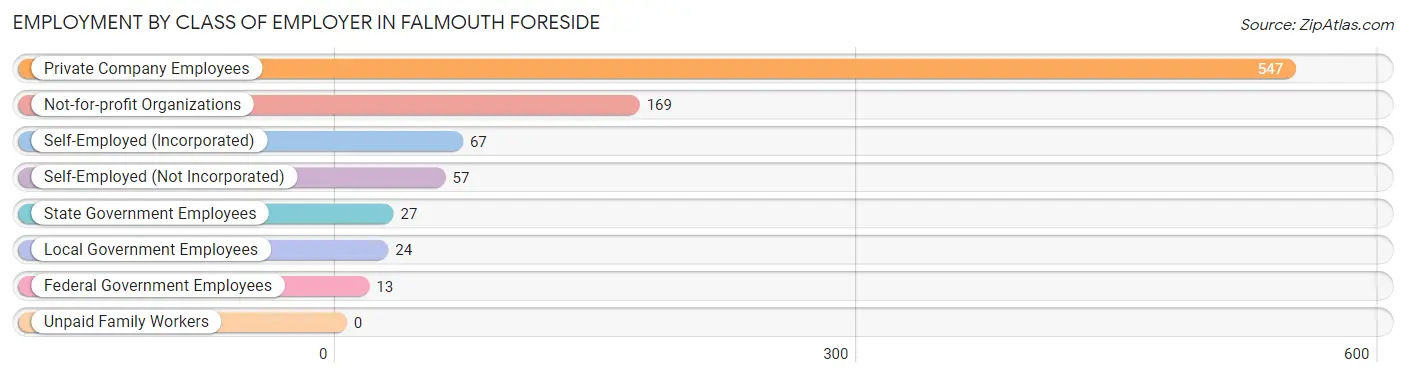
| Employer Class | # Employees | % Employees |
| Private Company Employees | 547 | 60.5% |
| Self-Employed (Incorporated) | 67 | 7.4% |
| Self-Employed (Not Incorporated) | 57 | 6.3% |
| Not-for-profit Organizations | 169 | 18.7% |
| Local Government Employees | 24 | 2.6% |
| State Government Employees | 27 | 3.0% |
| Federal Government Employees | 13 | 1.4% |
| Unpaid Family Workers | 0 | 0.0% |
| Total | 904 | 100.0% |
Employment Status by Age in Falmouth Foreside
According to the labor force statistics for Falmouth Foreside, out of the total population over 16 years of age (1,648), 56.4% or 929 individuals are in the labor force, with 2.8% or 26 of them unemployed. The age group with the highest labor force participation rate is 30 to 34 years, with 100.0% or 30 individuals in the labor force. Within the labor force, the 16 to 19 years age range has the highest percentage of unemployed individuals, with 25.4% or 15 of them being unemployed.
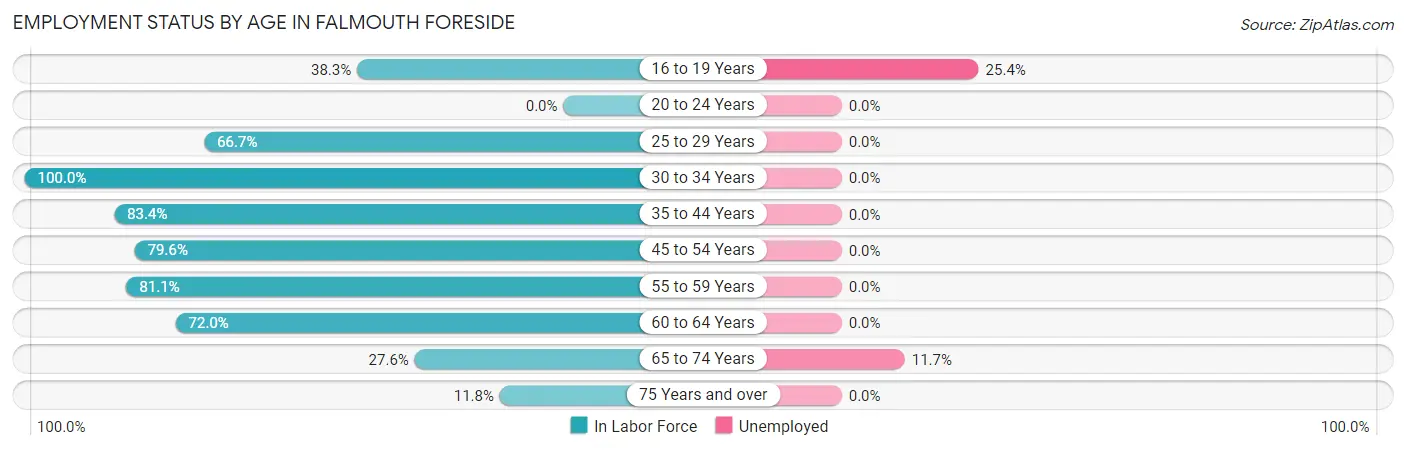
| Age Bracket | In Labor Force | Unemployed |
| 16 to 19 Years | 59 (38.3%) | 15 (25.4%) |
| 20 to 24 Years | 0 (0.0%) | 0 (0.0%) |
| 25 to 29 Years | 16 (66.7%) | 0 (0.0%) |
| 30 to 34 Years | 30 (100.0%) | 0 (0.0%) |
| 35 to 44 Years | 196 (83.4%) | 0 (0.0%) |
| 45 to 54 Years | 218 (79.6%) | 0 (0.0%) |
| 55 to 59 Years | 219 (81.1%) | 0 (0.0%) |
| 60 to 64 Years | 72 (72.0%) | 0 (0.0%) |
| 65 to 74 Years | 94 (27.6%) | 11 (11.7%) |
| 75 Years and over | 26 (11.8%) | 0 (0.0%) |
| Total | 929 (56.4%) | 26 (2.8%) |
Employment Status by Educational Attainment in Falmouth Foreside
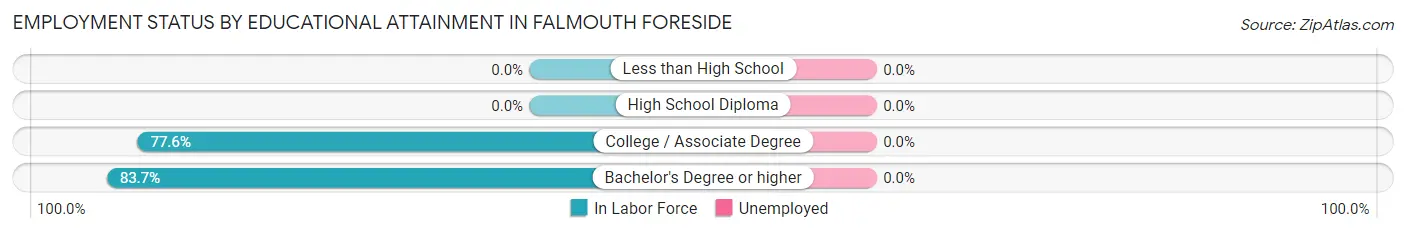
| Educational Attainment | In Labor Force | Unemployed |
| Less than High School | 0 (0.0%) | 0 (0.0%) |
| High School Diploma | 0 (0.0%) | 0 (0.0%) |
| College / Associate Degree | 38 (77.6%) | 0 (0.0%) |
| Bachelor's Degree or higher | 713 (83.7%) | 0 (0.0%) |
| Total | 751 (80.5%) | 0 (0.0%) |
Employment Occupations by Sex in Falmouth Foreside
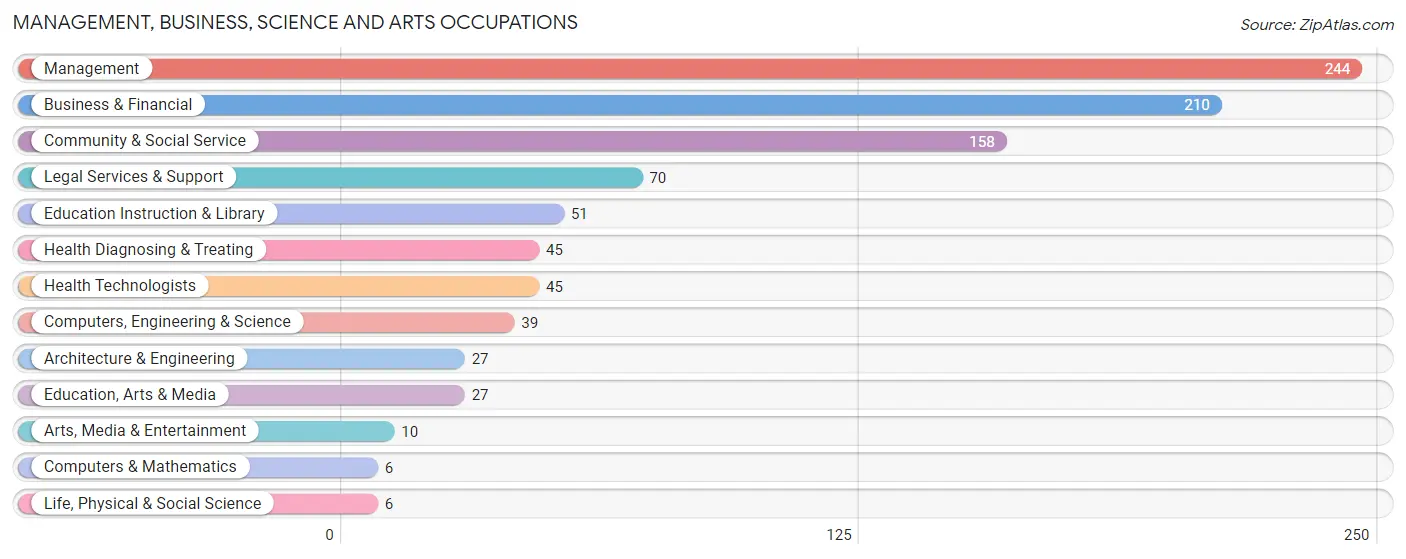
Management, Business, Science and Arts Occupations
The most common Management, Business, Science and Arts occupations in Falmouth Foreside are Management (244 | 27.0%), Business & Financial (210 | 23.2%), Community & Social Service (158 | 17.5%), Legal Services & Support (70 | 7.7%), and Education Instruction & Library (51 | 5.6%).
Management, Business, Science and Arts Occupations by Sex
Within the Management, Business, Science and Arts occupations in Falmouth Foreside, the most male-oriented occupations are Computers, Engineering & Science (100.0%), Computers & Mathematics (100.0%), and Architecture & Engineering (100.0%), while the most female-oriented occupations are Education, Arts & Media (100.0%), Education Instruction & Library (100.0%), and Health Diagnosing & Treating (100.0%).
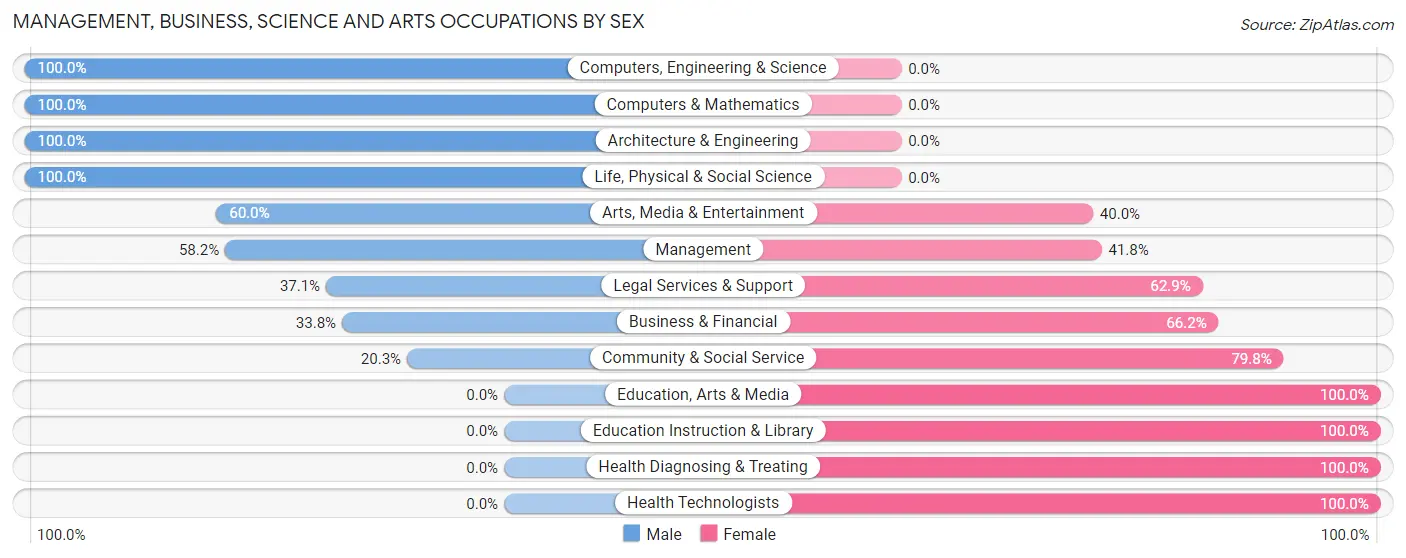
| Occupation | Male | Female |
| Management | 142 (58.2%) | 102 (41.8%) |
| Business & Financial | 71 (33.8%) | 139 (66.2%) |
| Computers, Engineering & Science | 39 (100.0%) | 0 (0.0%) |
| Computers & Mathematics | 6 (100.0%) | 0 (0.0%) |
| Architecture & Engineering | 27 (100.0%) | 0 (0.0%) |
| Life, Physical & Social Science | 6 (100.0%) | 0 (0.0%) |
| Community & Social Service | 32 (20.3%) | 126 (79.7%) |
| Education, Arts & Media | 0 (0.0%) | 27 (100.0%) |
| Legal Services & Support | 26 (37.1%) | 44 (62.9%) |
| Education Instruction & Library | 0 (0.0%) | 51 (100.0%) |
| Arts, Media & Entertainment | 6 (60.0%) | 4 (40.0%) |
| Health Diagnosing & Treating | 0 (0.0%) | 45 (100.0%) |
| Health Technologists | 0 (0.0%) | 45 (100.0%) |
| Total (Category) | 284 (40.8%) | 412 (59.2%) |
| Total (Overall) | 381 (42.1%) | 523 (57.9%) |
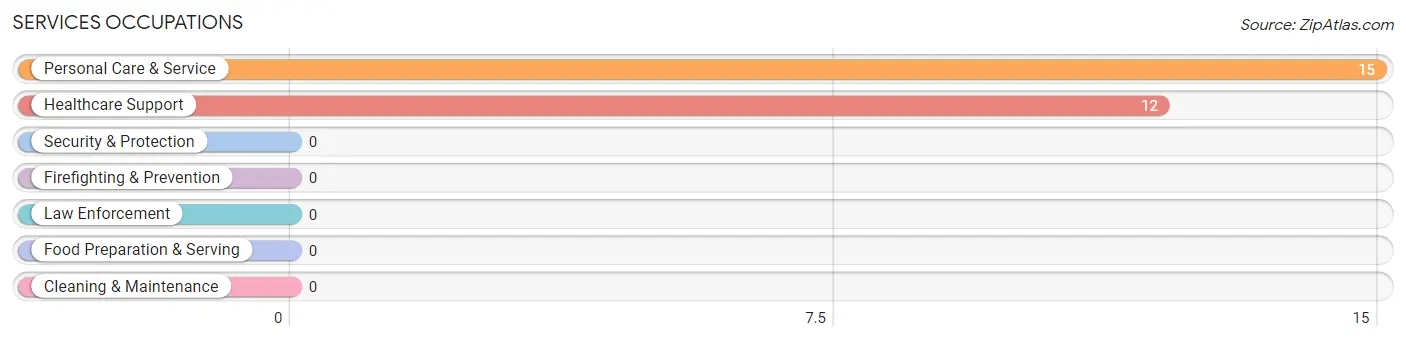
Services Occupations
The most common Services occupations in Falmouth Foreside are Personal Care & Service (15 | 1.7%), and Healthcare Support (12 | 1.3%).
Services Occupations by Sex
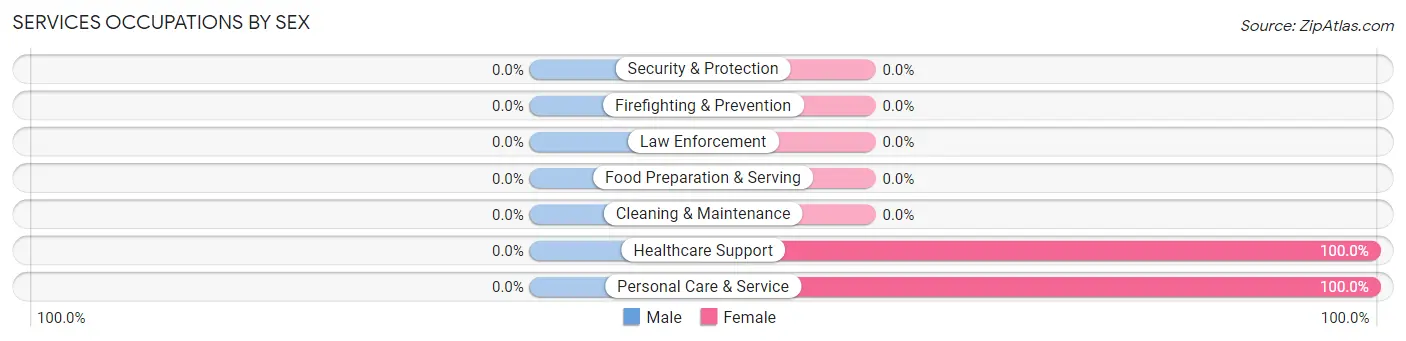
| Occupation | Male | Female |
| Healthcare Support | 0 (0.0%) | 12 (100.0%) |
| Security & Protection | 0 (0.0%) | 0 (0.0%) |
| Firefighting & Prevention | 0 (0.0%) | 0 (0.0%) |
| Law Enforcement | 0 (0.0%) | 0 (0.0%) |
| Food Preparation & Serving | 0 (0.0%) | 0 (0.0%) |
| Cleaning & Maintenance | 0 (0.0%) | 0 (0.0%) |
| Personal Care & Service | 0 (0.0%) | 15 (100.0%) |
| Total (Category) | 0 (0.0%) | 27 (100.0%) |
| Total (Overall) | 381 (42.1%) | 523 (57.9%) |
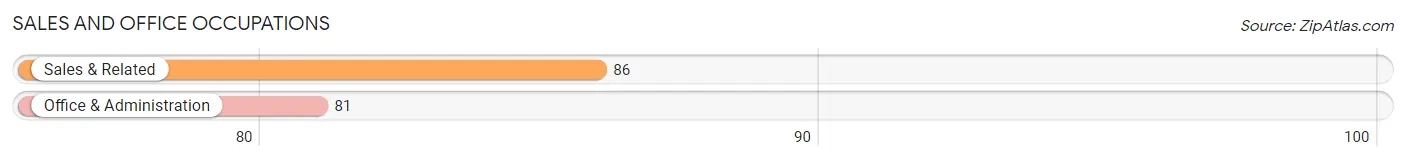
Sales and Office Occupations
The most common Sales and Office occupations in Falmouth Foreside are Sales & Related (86 | 9.5%), and Office & Administration (81 | 9.0%).
Sales and Office Occupations by Sex

| Occupation | Male | Female |
| Sales & Related | 57 (66.3%) | 29 (33.7%) |
| Office & Administration | 26 (32.1%) | 55 (67.9%) |
| Total (Category) | 83 (49.7%) | 84 (50.3%) |
| Total (Overall) | 381 (42.1%) | 523 (57.9%) |
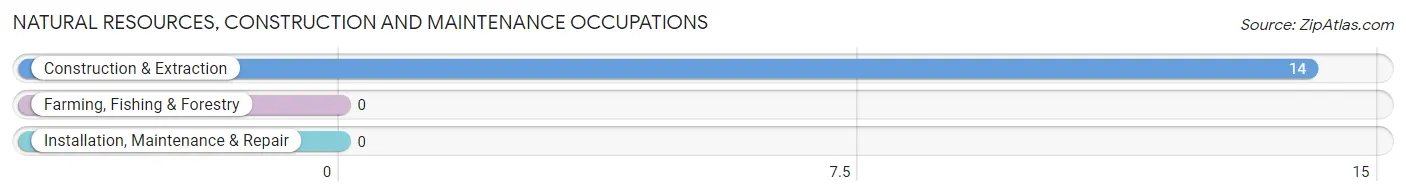
Natural Resources, Construction and Maintenance Occupations
The most common Natural Resources, Construction and Maintenance occupations in Falmouth Foreside are , and Construction & Extraction (14 | 1.5%).
Natural Resources, Construction and Maintenance Occupations by Sex
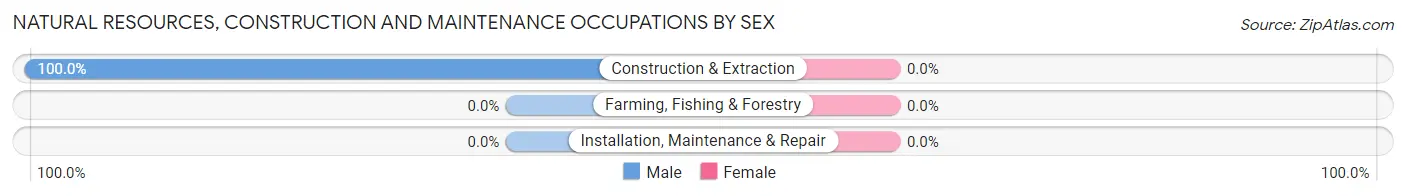
| Occupation | Male | Female |
| Farming, Fishing & Forestry | 0 (0.0%) | 0 (0.0%) |
| Construction & Extraction | 14 (100.0%) | 0 (0.0%) |
| Installation, Maintenance & Repair | 0 (0.0%) | 0 (0.0%) |
| Total (Category) | 14 (100.0%) | 0 (0.0%) |
| Total (Overall) | 381 (42.1%) | 523 (57.9%) |
Production, Transportation and Moving Occupations
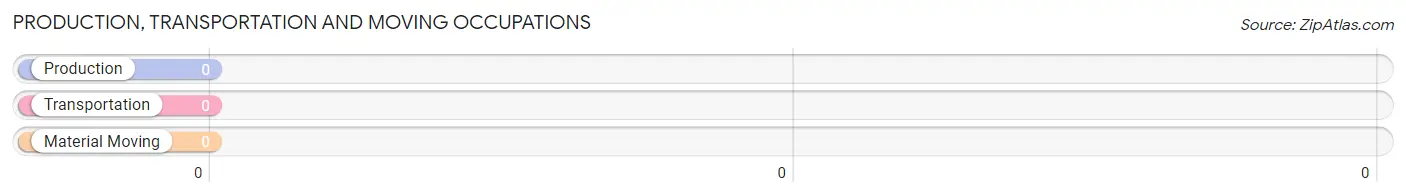
Production, Transportation and Moving Occupations by Sex
| Occupation | Male | Female |
| Production | 0 (0.0%) | 0 (0.0%) |
| Transportation | 0 (0.0%) | 0 (0.0%) |
| Material Moving | 0 (0.0%) | 0 (0.0%) |
| Total (Category) | 0 (0.0%) | 0 (0.0%) |
| Total (Overall) | 381 (42.1%) | 523 (57.9%) |
Employment Industries by Sex in Falmouth Foreside
Employment Industries in Falmouth Foreside
The major employment industries in Falmouth Foreside include Finance & Insurance (256 | 28.3%), Professional & Scientific (159 | 17.6%), Health Care & Social Assistance (103 | 11.4%), Educational Services (86 | 9.5%), and Real Estate, Rental & Leasing (66 | 7.3%).
Employment Industries by Sex in Falmouth Foreside
The Falmouth Foreside industries that see more men than women are Construction (100.0%), Manufacturing (100.0%), and Transportation & Warehousing (100.0%), whereas the industries that tend to have a higher number of women are Educational Services (100.0%), Accommodation & Food Services (100.0%), and Health Care & Social Assistance (81.6%).
| Industry | Male | Female |
| Agriculture, Fishing & Hunting | 0 (0.0%) | 0 (0.0%) |
| Mining, Quarrying, & Extraction | 0 (0.0%) | 0 (0.0%) |
| Construction | 14 (100.0%) | 0 (0.0%) |
| Manufacturing | 21 (100.0%) | 0 (0.0%) |
| Wholesale Trade | 0 (0.0%) | 0 (0.0%) |
| Retail Trade | 25 (62.5%) | 15 (37.5%) |
| Transportation & Warehousing | 14 (100.0%) | 0 (0.0%) |
| Utilities | 0 (0.0%) | 0 (0.0%) |
| Information | 0 (0.0%) | 0 (0.0%) |
| Finance & Insurance | 74 (28.9%) | 182 (71.1%) |
| Real Estate, Rental & Leasing | 52 (78.8%) | 14 (21.2%) |
| Professional & Scientific | 104 (65.4%) | 55 (34.6%) |
| Enterprise Management | 0 (0.0%) | 0 (0.0%) |
| Administrative & Support | 21 (100.0%) | 0 (0.0%) |
| Educational Services | 0 (0.0%) | 86 (100.0%) |
| Health Care & Social Assistance | 19 (18.4%) | 84 (81.6%) |
| Arts, Entertainment & Recreation | 0 (0.0%) | 0 (0.0%) |
| Accommodation & Food Services | 0 (0.0%) | 15 (100.0%) |
| Public Administration | 13 (100.0%) | 0 (0.0%) |
| Total | 381 (42.1%) | 523 (57.9%) |
Education in Falmouth Foreside
School Enrollment in Falmouth Foreside
The most common levels of schooling among the 521 students in Falmouth Foreside are high school (170 | 32.6%), middle school (160 | 30.7%), and elementary school (81 | 15.5%).
| School Level | # Students | % Students |
| Nursery / Preschool | 37 | 7.1% |
| Kindergarten | 29 | 5.6% |
| Elementary School | 81 | 15.5% |
| Middle School | 160 | 30.7% |
| High School | 170 | 32.6% |
| College / Undergraduate | 24 | 4.6% |
| Graduate / Professional | 20 | 3.8% |
| Total | 521 | 100.0% |
School Enrollment by Age by Funding Source in Falmouth Foreside
Out of a total of 521 students who are enrolled in schools in Falmouth Foreside, 170 (32.6%) attend a private institution, while the remaining 351 (67.4%) are enrolled in public schools. The age group of 3 to 4 year olds has the highest likelihood of being enrolled in private schools, with 24 (64.9% in the age bracket) enrolled. Conversely, the age group of 15 to 17 year olds has the lowest likelihood of being enrolled in a private school, with 139 (100.0% in the age bracket) attending a public institution.
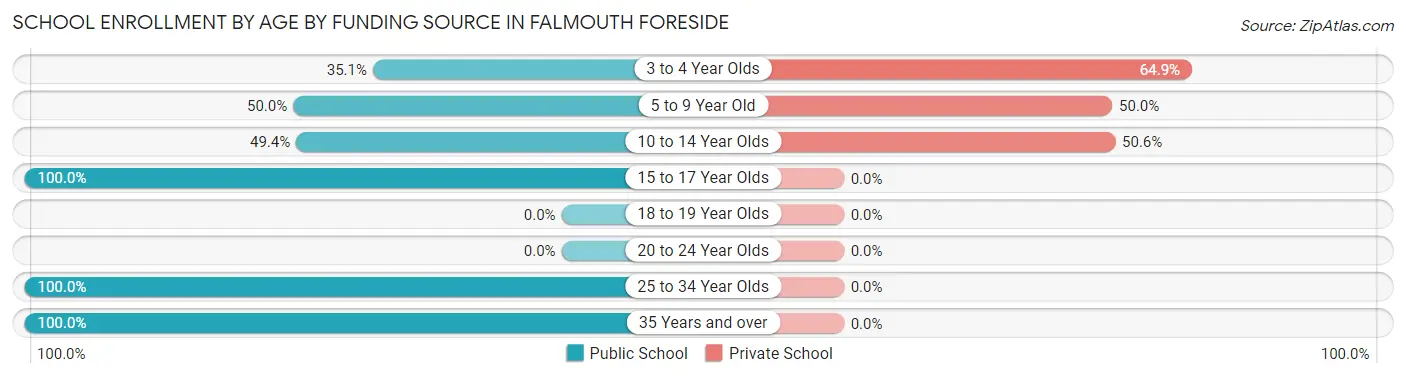
| Age Bracket | Public School | Private School |
| 3 to 4 Year Olds | 13 (35.1%) | 24 (64.9%) |
| 5 to 9 Year Old | 55 (50.0%) | 55 (50.0%) |
| 10 to 14 Year Olds | 89 (49.4%) | 91 (50.6%) |
| 15 to 17 Year Olds | 139 (100.0%) | 0 (0.0%) |
| 18 to 19 Year Olds | 0 (0.0%) | 0 (0.0%) |
| 20 to 24 Year Olds | 0 (0.0%) | 0 (0.0%) |
| 25 to 34 Year Olds | 24 (100.0%) | 0 (0.0%) |
| 35 Years and over | 31 (100.0%) | 0 (0.0%) |
| Total | 351 (67.4%) | 170 (32.6%) |
Educational Attainment by Field of Study in Falmouth Foreside
Business (316 | 24.5%), education (226 | 17.5%), liberal arts & history (182 | 14.1%), social sciences (152 | 11.8%), and arts & humanities (71 | 5.5%) are the most common fields of study among 1,288 individuals in Falmouth Foreside who have obtained a bachelor's degree or higher.
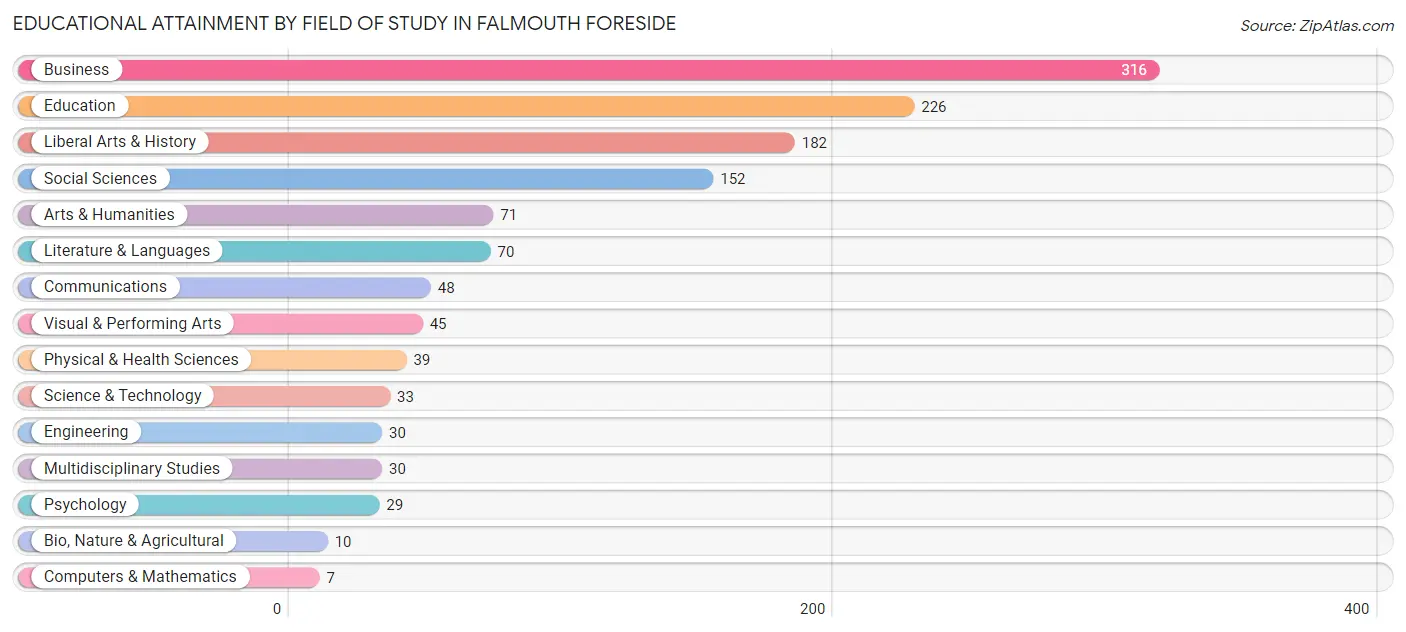
| Field of Study | # Graduates | % Graduates |
| Computers & Mathematics | 7 | 0.5% |
| Bio, Nature & Agricultural | 10 | 0.8% |
| Physical & Health Sciences | 39 | 3.0% |
| Psychology | 29 | 2.2% |
| Social Sciences | 152 | 11.8% |
| Engineering | 30 | 2.3% |
| Multidisciplinary Studies | 30 | 2.3% |
| Science & Technology | 33 | 2.6% |
| Business | 316 | 24.5% |
| Education | 226 | 17.5% |
| Literature & Languages | 70 | 5.4% |
| Liberal Arts & History | 182 | 14.1% |
| Visual & Performing Arts | 45 | 3.5% |
| Communications | 48 | 3.7% |
| Arts & Humanities | 71 | 5.5% |
| Total | 1,288 | 100.0% |
Transportation & Commute in Falmouth Foreside
Vehicle Availability by Sex in Falmouth Foreside
The most prevalent vehicle ownership categories in Falmouth Foreside are males with 2 vehicles (209, accounting for 54.9%) and females with 2 vehicles (187, making up 40.0%).
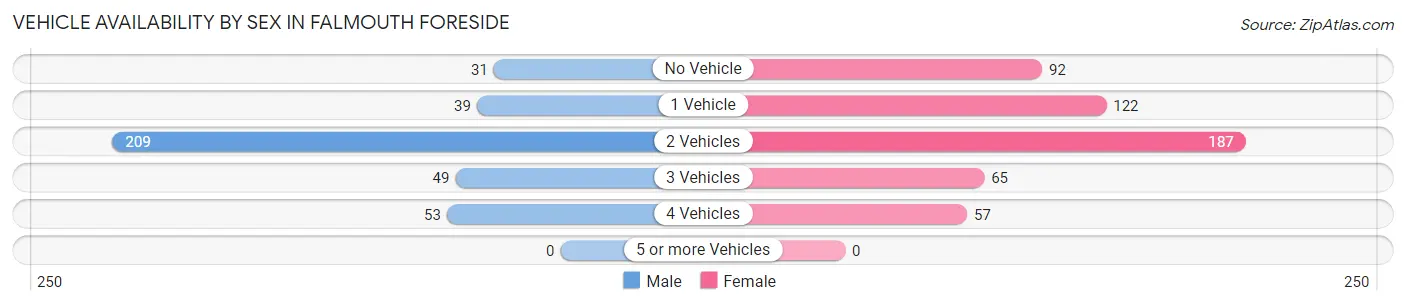
| Vehicles Available | Male | Female |
| No Vehicle | 31 (8.1%) | 92 (17.6%) |
| 1 Vehicle | 39 (10.2%) | 122 (23.3%) |
| 2 Vehicles | 209 (54.9%) | 187 (35.8%) |
| 3 Vehicles | 49 (12.9%) | 65 (12.4%) |
| 4 Vehicles | 53 (13.9%) | 57 (10.9%) |
| 5 or more Vehicles | 0 (0.0%) | 0 (0.0%) |
| Total | 381 (100.0%) | 523 (100.0%) |
Commute Time in Falmouth Foreside
The most frequently occuring commute durations in Falmouth Foreside are 15 to 19 minutes (160 commuters, 28.9%), 10 to 14 minutes (132 commuters, 23.8%), and 20 to 24 minutes (86 commuters, 15.5%).
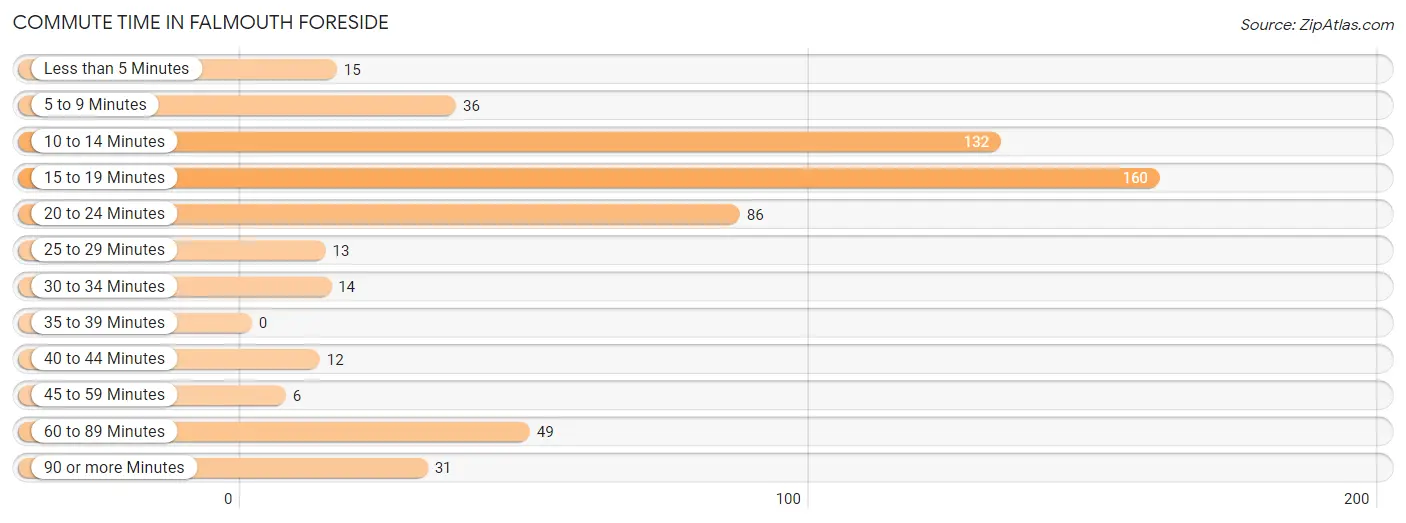
| Commute Time | # Commuters | % Commuters |
| Less than 5 Minutes | 15 | 2.7% |
| 5 to 9 Minutes | 36 | 6.5% |
| 10 to 14 Minutes | 132 | 23.8% |
| 15 to 19 Minutes | 160 | 28.9% |
| 20 to 24 Minutes | 86 | 15.5% |
| 25 to 29 Minutes | 13 | 2.4% |
| 30 to 34 Minutes | 14 | 2.5% |
| 35 to 39 Minutes | 0 | 0.0% |
| 40 to 44 Minutes | 12 | 2.2% |
| 45 to 59 Minutes | 6 | 1.1% |
| 60 to 89 Minutes | 49 | 8.8% |
| 90 or more Minutes | 31 | 5.6% |
Commute Time by Sex in Falmouth Foreside
The most common commute times in Falmouth Foreside are 10 to 14 minutes (80 commuters, 29.7%) for males and 15 to 19 minutes (95 commuters, 33.3%) for females.
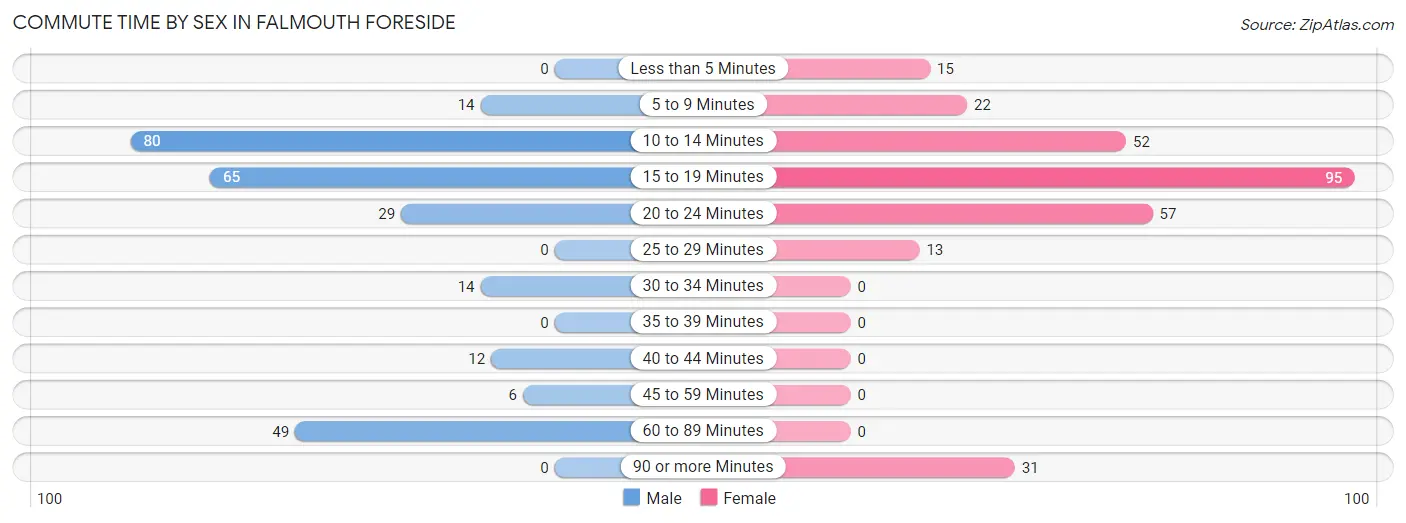
| Commute Time | Male | Female |
| Less than 5 Minutes | 0 (0.0%) | 15 (5.3%) |
| 5 to 9 Minutes | 14 (5.2%) | 22 (7.7%) |
| 10 to 14 Minutes | 80 (29.7%) | 52 (18.2%) |
| 15 to 19 Minutes | 65 (24.2%) | 95 (33.3%) |
| 20 to 24 Minutes | 29 (10.8%) | 57 (20.0%) |
| 25 to 29 Minutes | 0 (0.0%) | 13 (4.6%) |
| 30 to 34 Minutes | 14 (5.2%) | 0 (0.0%) |
| 35 to 39 Minutes | 0 (0.0%) | 0 (0.0%) |
| 40 to 44 Minutes | 12 (4.5%) | 0 (0.0%) |
| 45 to 59 Minutes | 6 (2.2%) | 0 (0.0%) |
| 60 to 89 Minutes | 49 (18.2%) | 0 (0.0%) |
| 90 or more Minutes | 0 (0.0%) | 31 (10.9%) |
Time of Departure to Work by Sex in Falmouth Foreside
The most frequent times of departure to work in Falmouth Foreside are 8:00 AM to 8:29 AM (74, 27.5%) for males and 8:00 AM to 8:29 AM (81, 28.4%) for females.
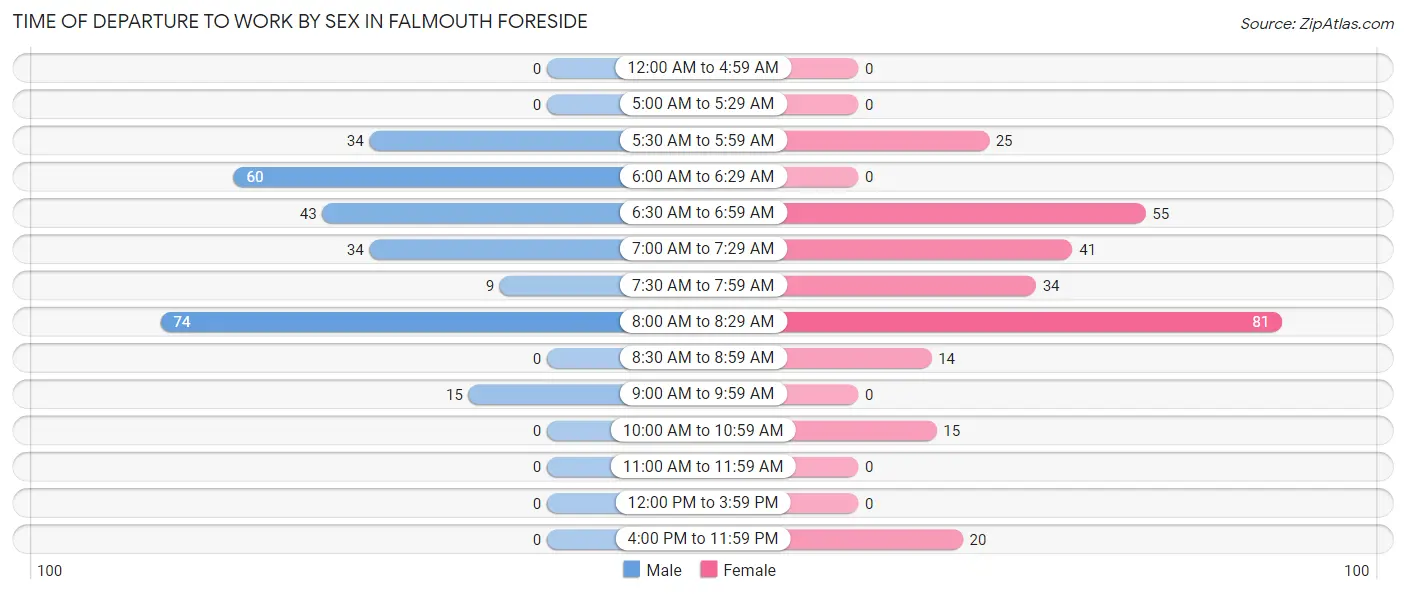
| Time of Departure | Male | Female |
| 12:00 AM to 4:59 AM | 0 (0.0%) | 0 (0.0%) |
| 5:00 AM to 5:29 AM | 0 (0.0%) | 0 (0.0%) |
| 5:30 AM to 5:59 AM | 34 (12.6%) | 25 (8.8%) |
| 6:00 AM to 6:29 AM | 60 (22.3%) | 0 (0.0%) |
| 6:30 AM to 6:59 AM | 43 (16.0%) | 55 (19.3%) |
| 7:00 AM to 7:29 AM | 34 (12.6%) | 41 (14.4%) |
| 7:30 AM to 7:59 AM | 9 (3.4%) | 34 (11.9%) |
| 8:00 AM to 8:29 AM | 74 (27.5%) | 81 (28.4%) |
| 8:30 AM to 8:59 AM | 0 (0.0%) | 14 (4.9%) |
| 9:00 AM to 9:59 AM | 15 (5.6%) | 0 (0.0%) |
| 10:00 AM to 10:59 AM | 0 (0.0%) | 15 (5.3%) |
| 11:00 AM to 11:59 AM | 0 (0.0%) | 0 (0.0%) |
| 12:00 PM to 3:59 PM | 0 (0.0%) | 0 (0.0%) |
| 4:00 PM to 11:59 PM | 0 (0.0%) | 20 (7.0%) |
| Total | 269 (100.0%) | 285 (100.0%) |
Housing Occupancy in Falmouth Foreside
Occupancy by Ownership in Falmouth Foreside
Of the total 759 dwellings in Falmouth Foreside, owner-occupied units account for 656 (86.4%), while renter-occupied units make up 103 (13.6%).
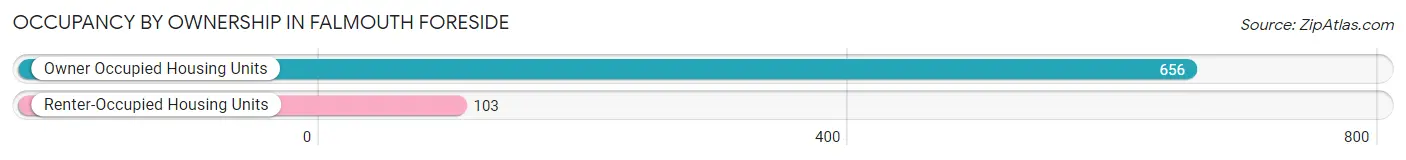
| Occupancy | # Housing Units | % Housing Units |
| Owner Occupied Housing Units | 656 | 86.4% |
| Renter-Occupied Housing Units | 103 | 13.6% |
| Total Occupied Housing Units | 759 | 100.0% |
Occupancy by Household Size in Falmouth Foreside
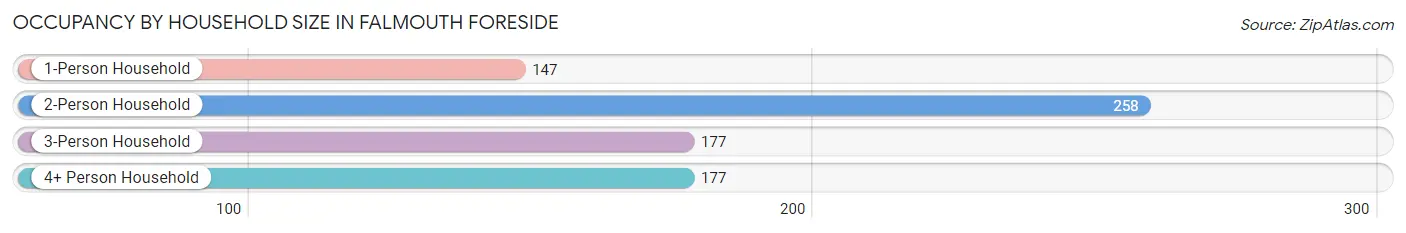
| Household Size | # Housing Units | % Housing Units |
| 1-Person Household | 147 | 19.4% |
| 2-Person Household | 258 | 34.0% |
| 3-Person Household | 177 | 23.3% |
| 4+ Person Household | 177 | 23.3% |
| Total Housing Units | 759 | 100.0% |
Occupancy by Ownership by Household Size in Falmouth Foreside
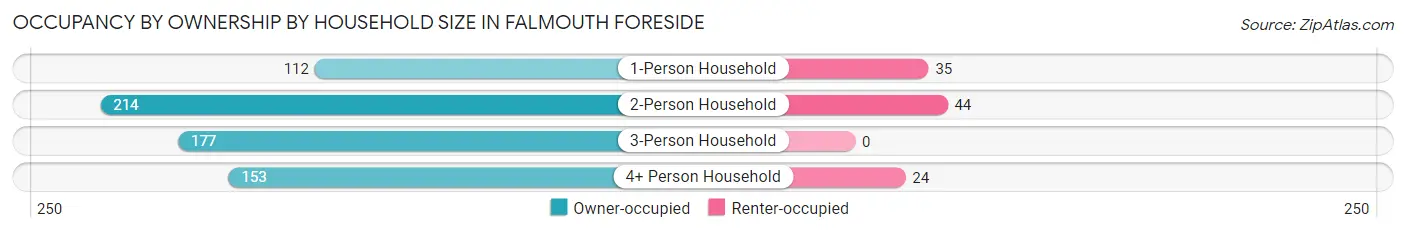
| Household Size | Owner-occupied | Renter-occupied |
| 1-Person Household | 112 (76.2%) | 35 (23.8%) |
| 2-Person Household | 214 (83.0%) | 44 (17.1%) |
| 3-Person Household | 177 (100.0%) | 0 (0.0%) |
| 4+ Person Household | 153 (86.4%) | 24 (13.6%) |
| Total Housing Units | 656 (86.4%) | 103 (13.6%) |
Occupancy by Educational Attainment in Falmouth Foreside
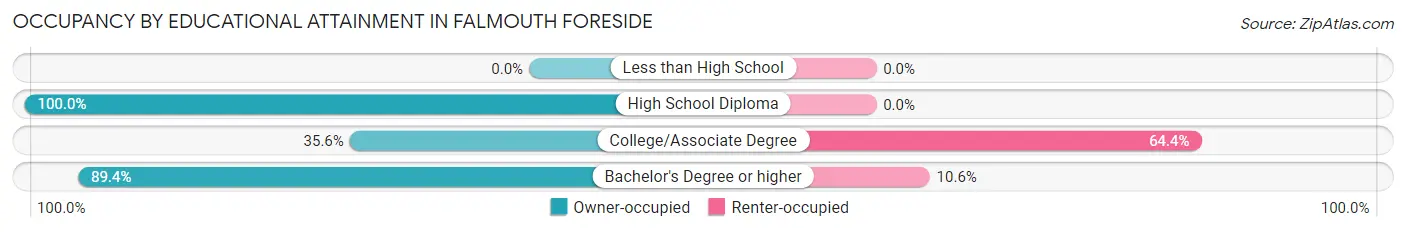
| Household Size | Owner-occupied | Renter-occupied |
| Less than High School | 0 (0.0%) | 0 (0.0%) |
| High School Diploma | 16 (100.0%) | 0 (0.0%) |
| College/Associate Degree | 16 (35.6%) | 29 (64.4%) |
| Bachelor's Degree or higher | 624 (89.4%) | 74 (10.6%) |
Occupancy by Age of Householder in Falmouth Foreside
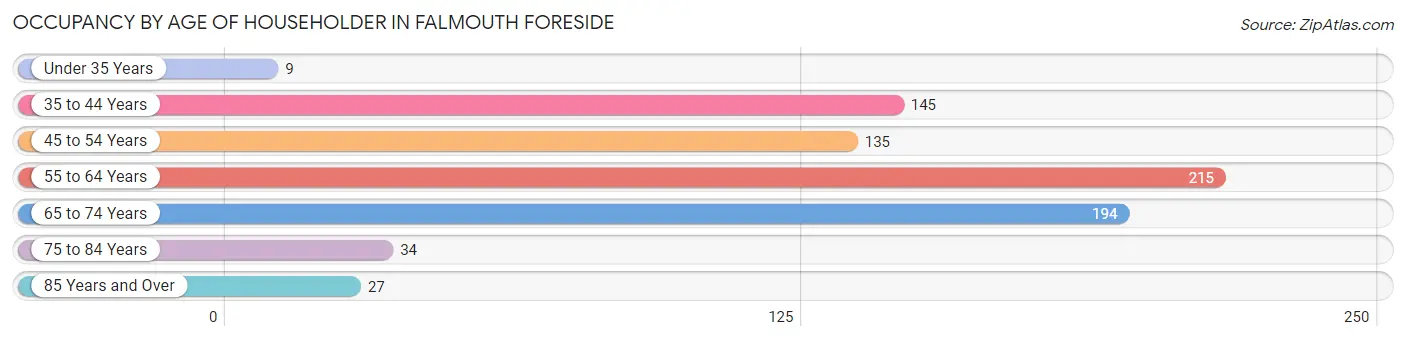
| Age Bracket | # Households | % Households |
| Under 35 Years | 9 | 1.2% |
| 35 to 44 Years | 145 | 19.1% |
| 45 to 54 Years | 135 | 17.8% |
| 55 to 64 Years | 215 | 28.3% |
| 65 to 74 Years | 194 | 25.6% |
| 75 to 84 Years | 34 | 4.5% |
| 85 Years and Over | 27 | 3.6% |
| Total | 759 | 100.0% |
Housing Finances in Falmouth Foreside
Median Income by Occupancy in Falmouth Foreside
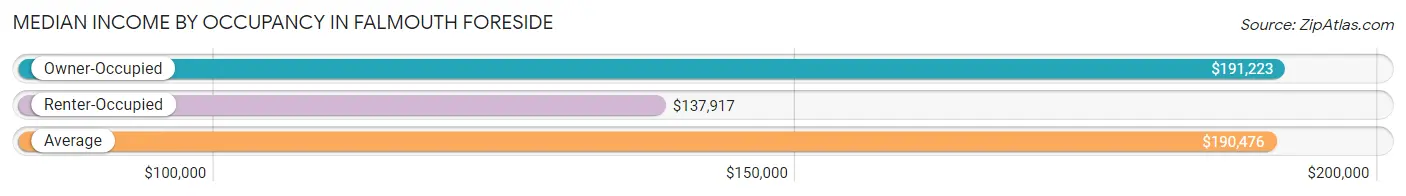
| Occupancy Type | # Households | Median Income |
| Owner-Occupied | 656 (86.4%) | $191,223 |
| Renter-Occupied | 103 (13.6%) | $137,917 |
| Average | 759 (100.0%) | $190,476 |
Occupancy by Householder Income Bracket in Falmouth Foreside
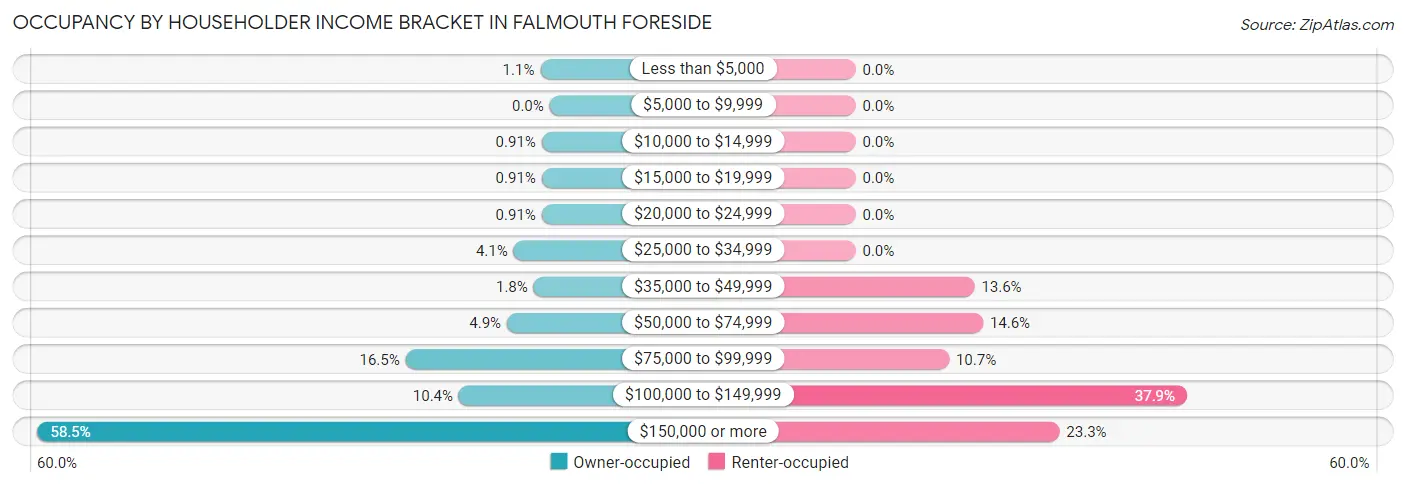
| Income Bracket | Owner-occupied | Renter-occupied |
| Less than $5,000 | 7 (1.1%) | 0 (0.0%) |
| $5,000 to $9,999 | 0 (0.0%) | 0 (0.0%) |
| $10,000 to $14,999 | 6 (0.9%) | 0 (0.0%) |
| $15,000 to $19,999 | 6 (0.9%) | 0 (0.0%) |
| $20,000 to $24,999 | 6 (0.9%) | 0 (0.0%) |
| $25,000 to $34,999 | 27 (4.1%) | 0 (0.0%) |
| $35,000 to $49,999 | 12 (1.8%) | 14 (13.6%) |
| $50,000 to $74,999 | 32 (4.9%) | 15 (14.6%) |
| $75,000 to $99,999 | 108 (16.5%) | 11 (10.7%) |
| $100,000 to $149,999 | 68 (10.4%) | 39 (37.9%) |
| $150,000 or more | 384 (58.5%) | 24 (23.3%) |
| Total | 656 (100.0%) | 103 (100.0%) |
Monthly Housing Cost Tiers in Falmouth Foreside
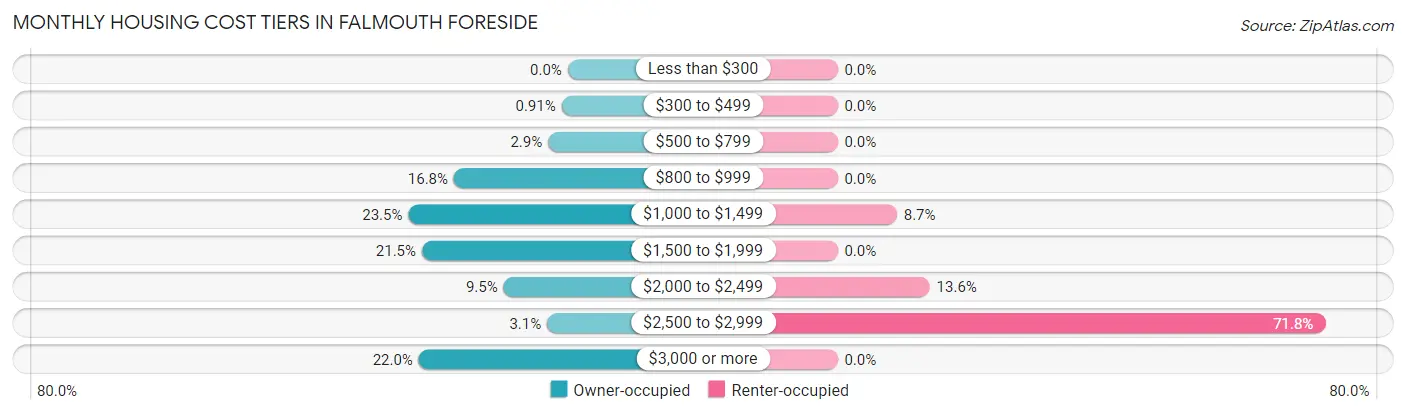
| Monthly Cost | Owner-occupied | Renter-occupied |
| Less than $300 | 0 (0.0%) | 0 (0.0%) |
| $300 to $499 | 6 (0.9%) | 0 (0.0%) |
| $500 to $799 | 19 (2.9%) | 0 (0.0%) |
| $800 to $999 | 110 (16.8%) | 0 (0.0%) |
| $1,000 to $1,499 | 154 (23.5%) | 9 (8.7%) |
| $1,500 to $1,999 | 141 (21.5%) | 0 (0.0%) |
| $2,000 to $2,499 | 62 (9.5%) | 14 (13.6%) |
| $2,500 to $2,999 | 20 (3.0%) | 74 (71.8%) |
| $3,000 or more | 144 (22.0%) | 0 (0.0%) |
| Total | 656 (100.0%) | 103 (100.0%) |
Physical Housing Characteristics in Falmouth Foreside
Housing Structures in Falmouth Foreside
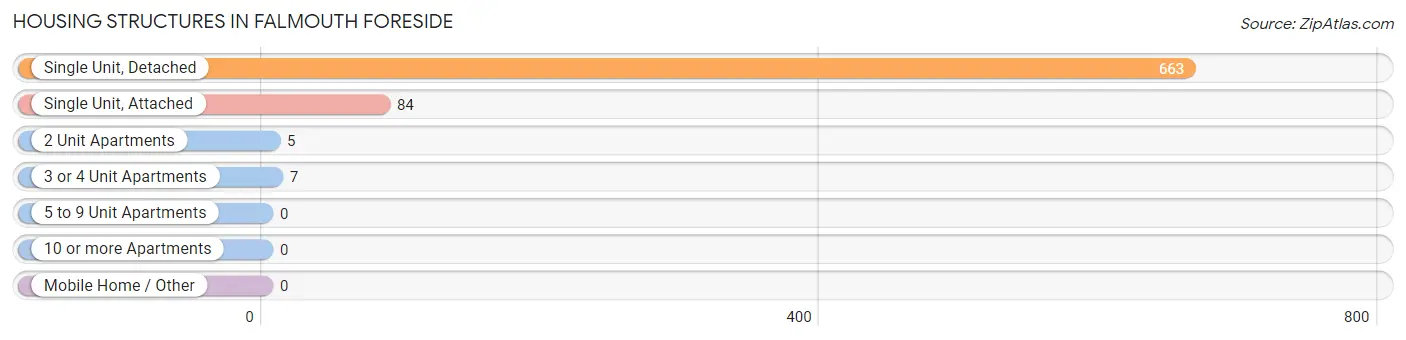
| Structure Type | # Housing Units | % Housing Units |
| Single Unit, Detached | 663 | 87.4% |
| Single Unit, Attached | 84 | 11.1% |
| 2 Unit Apartments | 5 | 0.7% |
| 3 or 4 Unit Apartments | 7 | 0.9% |
| 5 to 9 Unit Apartments | 0 | 0.0% |
| 10 or more Apartments | 0 | 0.0% |
| Mobile Home / Other | 0 | 0.0% |
| Total | 759 | 100.0% |
Housing Structures by Occupancy in Falmouth Foreside
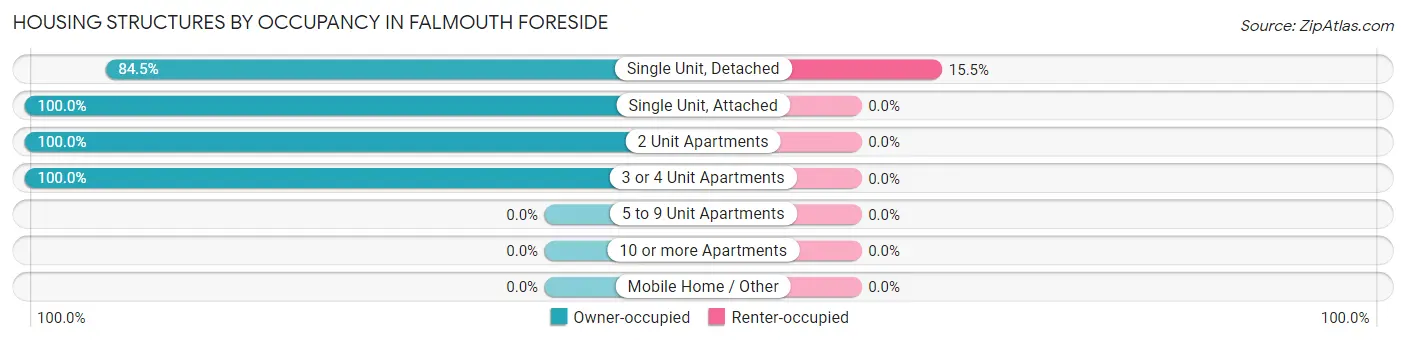
| Structure Type | Owner-occupied | Renter-occupied |
| Single Unit, Detached | 560 (84.5%) | 103 (15.5%) |
| Single Unit, Attached | 84 (100.0%) | 0 (0.0%) |
| 2 Unit Apartments | 5 (100.0%) | 0 (0.0%) |
| 3 or 4 Unit Apartments | 7 (100.0%) | 0 (0.0%) |
| 5 to 9 Unit Apartments | 0 (0.0%) | 0 (0.0%) |
| 10 or more Apartments | 0 (0.0%) | 0 (0.0%) |
| Mobile Home / Other | 0 (0.0%) | 0 (0.0%) |
| Total | 656 (86.4%) | 103 (13.6%) |
Housing Structures by Number of Rooms in Falmouth Foreside
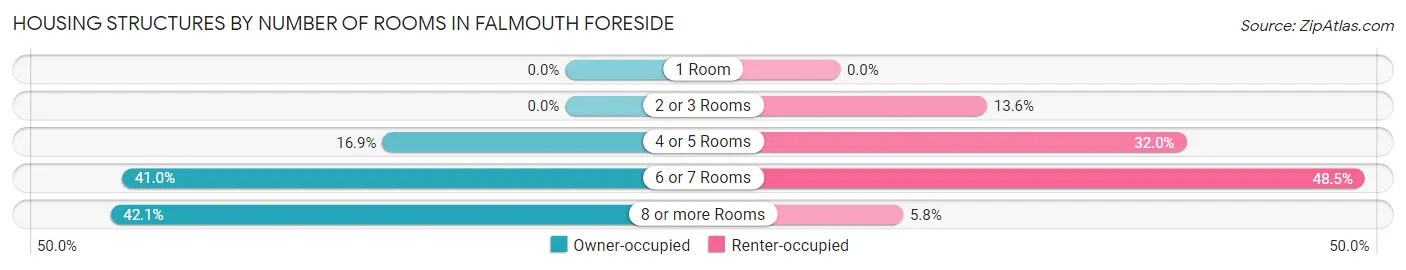
| Number of Rooms | Owner-occupied | Renter-occupied |
| 1 Room | 0 (0.0%) | 0 (0.0%) |
| 2 or 3 Rooms | 0 (0.0%) | 14 (13.6%) |
| 4 or 5 Rooms | 111 (16.9%) | 33 (32.0%) |
| 6 or 7 Rooms | 269 (41.0%) | 50 (48.5%) |
| 8 or more Rooms | 276 (42.1%) | 6 (5.8%) |
| Total | 656 (100.0%) | 103 (100.0%) |
Housing Structure by Heating Type in Falmouth Foreside
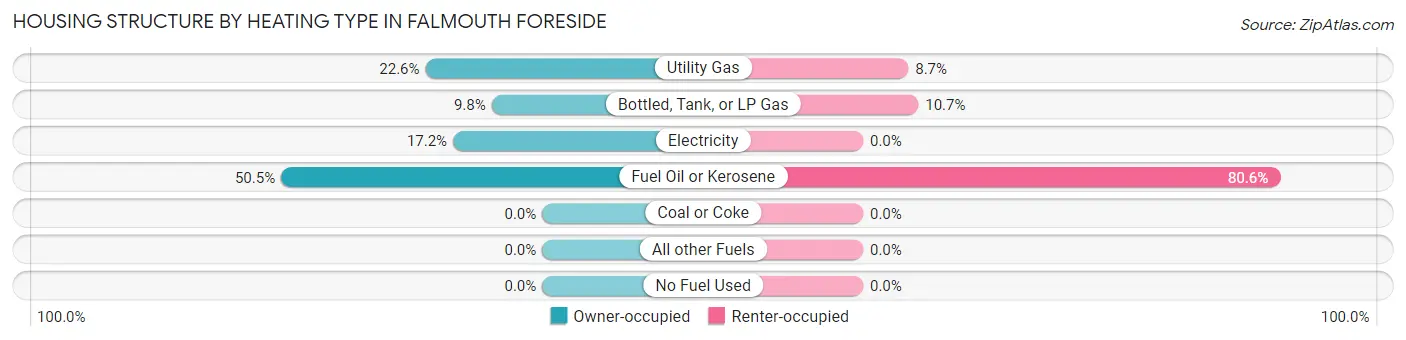
| Heating Type | Owner-occupied | Renter-occupied |
| Utility Gas | 148 (22.6%) | 9 (8.7%) |
| Bottled, Tank, or LP Gas | 64 (9.8%) | 11 (10.7%) |
| Electricity | 113 (17.2%) | 0 (0.0%) |
| Fuel Oil or Kerosene | 331 (50.5%) | 83 (80.6%) |
| Coal or Coke | 0 (0.0%) | 0 (0.0%) |
| All other Fuels | 0 (0.0%) | 0 (0.0%) |
| No Fuel Used | 0 (0.0%) | 0 (0.0%) |
| Total | 656 (100.0%) | 103 (100.0%) |
Household Vehicle Usage in Falmouth Foreside

| Vehicles per Household | Owner-occupied | Renter-occupied |
| No Vehicle | 92 (14.0%) | 0 (0.0%) |
| 1 Vehicle | 151 (23.0%) | 23 (22.3%) |
| 2 Vehicles | 303 (46.2%) | 41 (39.8%) |
| 3 or more Vehicles | 110 (16.8%) | 39 (37.9%) |
| Total | 656 (100.0%) | 103 (100.0%) |
Real Estate & Mortgages in Falmouth Foreside
Real Estate and Mortgage Overview in Falmouth Foreside
| Characteristic | Without Mortgage | With Mortgage |
| Housing Units | 345 | 311 |
| Median Property Value | $615,800 | $619,100 |
| Median Household Income | $148,393 | $216 |
| Monthly Housing Costs | $1,320 | $144 |
| Real Estate Taxes | $6,777 | $0 |
Property Value by Mortgage Status in Falmouth Foreside
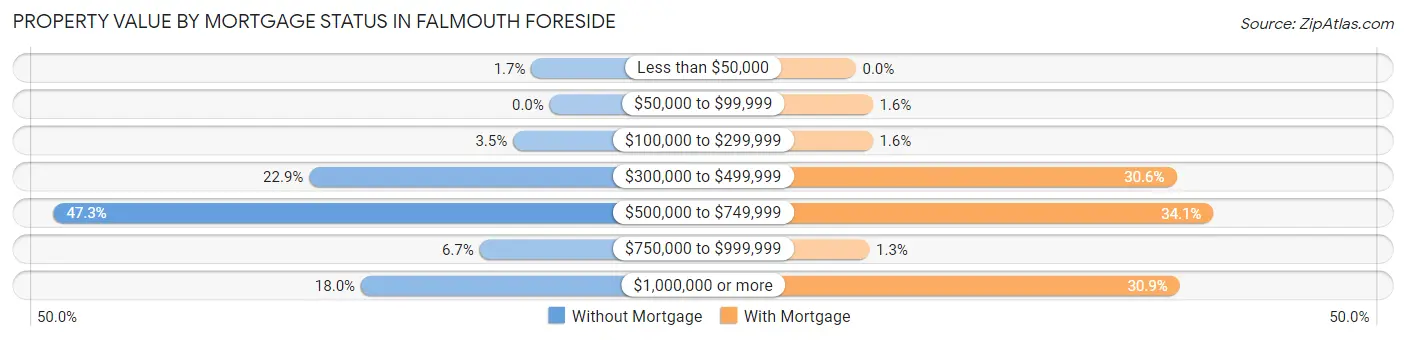
| Property Value | Without Mortgage | With Mortgage |
| Less than $50,000 | 6 (1.7%) | 0 (0.0%) |
| $50,000 to $99,999 | 0 (0.0%) | 5 (1.6%) |
| $100,000 to $299,999 | 12 (3.5%) | 5 (1.6%) |
| $300,000 to $499,999 | 79 (22.9%) | 95 (30.5%) |
| $500,000 to $749,999 | 163 (47.2%) | 106 (34.1%) |
| $750,000 to $999,999 | 23 (6.7%) | 4 (1.3%) |
| $1,000,000 or more | 62 (18.0%) | 96 (30.9%) |
| Total | 345 (100.0%) | 311 (100.0%) |
Household Income by Mortgage Status in Falmouth Foreside
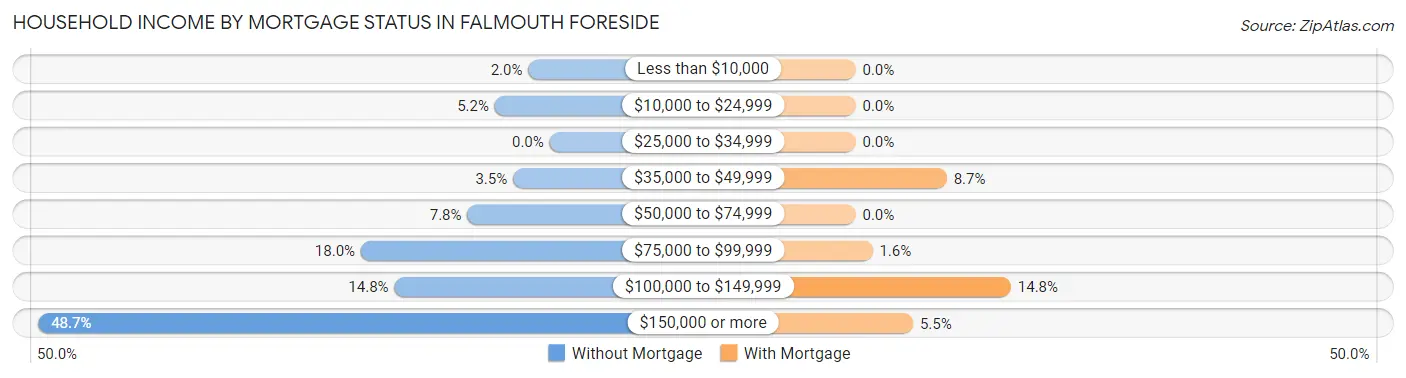
| Household Income | Without Mortgage | With Mortgage |
| Less than $10,000 | 7 (2.0%) | 0 (0.0%) |
| $10,000 to $24,999 | 18 (5.2%) | 0 (0.0%) |
| $25,000 to $34,999 | 0 (0.0%) | 0 (0.0%) |
| $35,000 to $49,999 | 12 (3.5%) | 27 (8.7%) |
| $50,000 to $74,999 | 27 (7.8%) | 0 (0.0%) |
| $75,000 to $99,999 | 62 (18.0%) | 5 (1.6%) |
| $100,000 to $149,999 | 51 (14.8%) | 46 (14.8%) |
| $150,000 or more | 168 (48.7%) | 17 (5.5%) |
| Total | 345 (100.0%) | 311 (100.0%) |
Property Value to Household Income Ratio in Falmouth Foreside
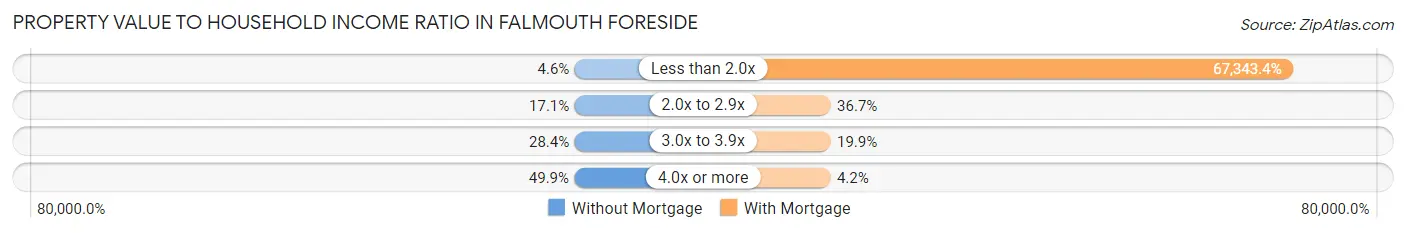
| Value-to-Income Ratio | Without Mortgage | With Mortgage |
| Less than 2.0x | 16 (4.6%) | 209,438 (67,343.4%) |
| 2.0x to 2.9x | 59 (17.1%) | 114 (36.7%) |
| 3.0x to 3.9x | 98 (28.4%) | 62 (19.9%) |
| 4.0x or more | 172 (49.9%) | 13 (4.2%) |
| Total | 345 (100.0%) | 311 (100.0%) |
Real Estate Taxes by Mortgage Status in Falmouth Foreside
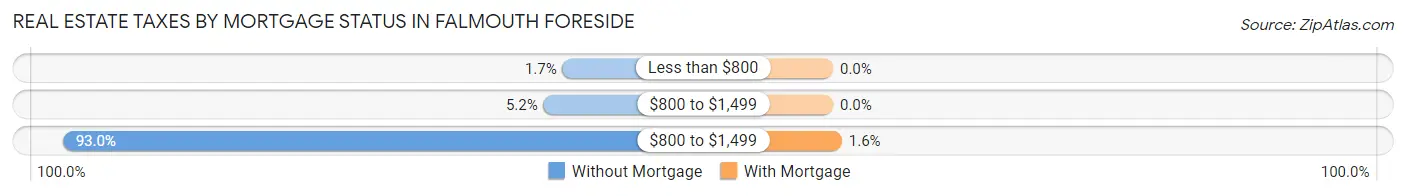
| Property Taxes | Without Mortgage | With Mortgage |
| Less than $800 | 6 (1.7%) | 0 (0.0%) |
| $800 to $1,499 | 18 (5.2%) | 0 (0.0%) |
| $800 to $1,499 | 321 (93.0%) | 5 (1.6%) |
| Total | 345 (100.0%) | 311 (100.0%) |
Health & Disability in Falmouth Foreside
Health Insurance Coverage by Age in Falmouth Foreside
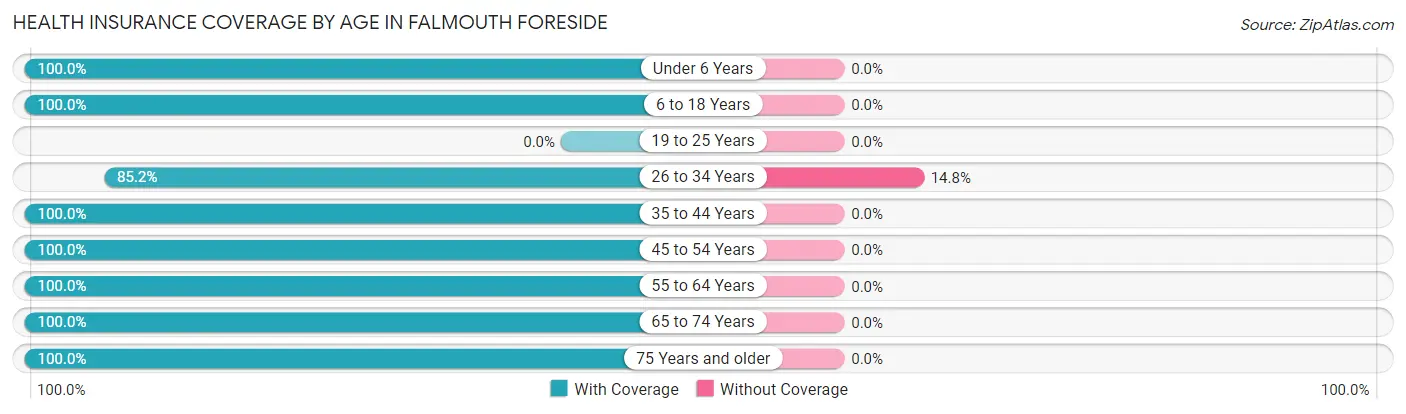
| Age Bracket | With Coverage | Without Coverage |
| Under 6 Years | 90 (100.0%) | 0 (0.0%) |
| 6 to 18 Years | 438 (100.0%) | 0 (0.0%) |
| 19 to 25 Years | 0 (0.0%) | 0 (0.0%) |
| 26 to 34 Years | 46 (85.2%) | 8 (14.8%) |
| 35 to 44 Years | 235 (100.0%) | 0 (0.0%) |
| 45 to 54 Years | 274 (100.0%) | 0 (0.0%) |
| 55 to 64 Years | 353 (100.0%) | 0 (0.0%) |
| 65 to 74 Years | 290 (100.0%) | 0 (0.0%) |
| 75 Years and older | 145 (100.0%) | 0 (0.0%) |
| Total | 1,871 (99.6%) | 8 (0.4%) |
Health Insurance Coverage by Citizenship Status in Falmouth Foreside
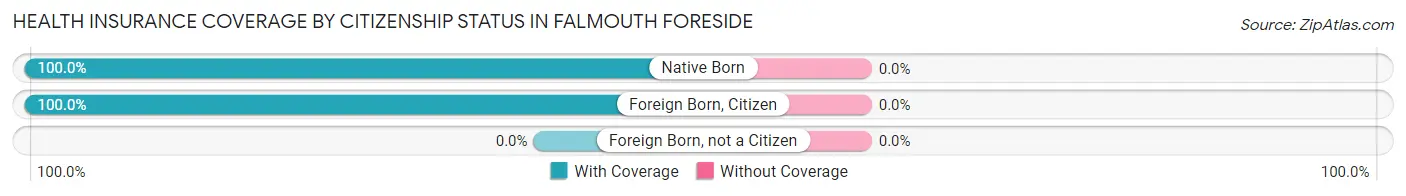
| Citizenship Status | With Coverage | Without Coverage |
| Native Born | 90 (100.0%) | 0 (0.0%) |
| Foreign Born, Citizen | 438 (100.0%) | 0 (0.0%) |
| Foreign Born, not a Citizen | 0 (0.0%) | 0 (0.0%) |
Health Insurance Coverage by Household Income in Falmouth Foreside
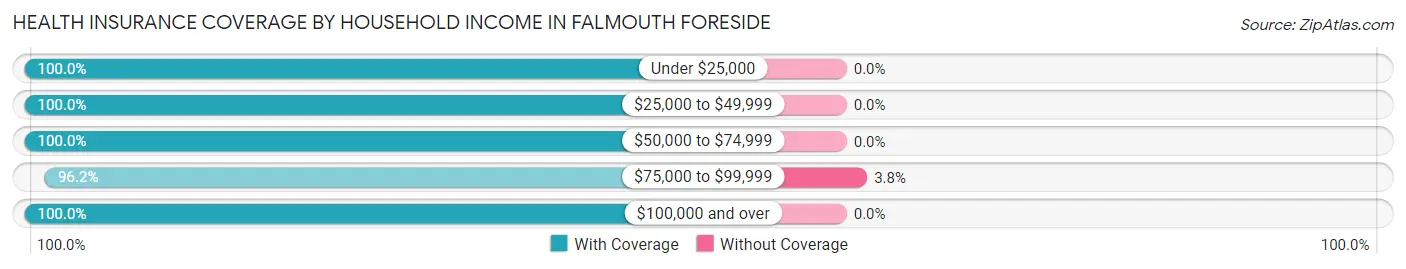
| Household Income | With Coverage | Without Coverage |
| Under $25,000 | 31 (100.0%) | 0 (0.0%) |
| $25,000 to $49,999 | 64 (100.0%) | 0 (0.0%) |
| $50,000 to $74,999 | 70 (100.0%) | 0 (0.0%) |
| $75,000 to $99,999 | 201 (96.2%) | 8 (3.8%) |
| $100,000 and over | 1,505 (100.0%) | 0 (0.0%) |
Public vs Private Health Insurance Coverage by Age in Falmouth Foreside
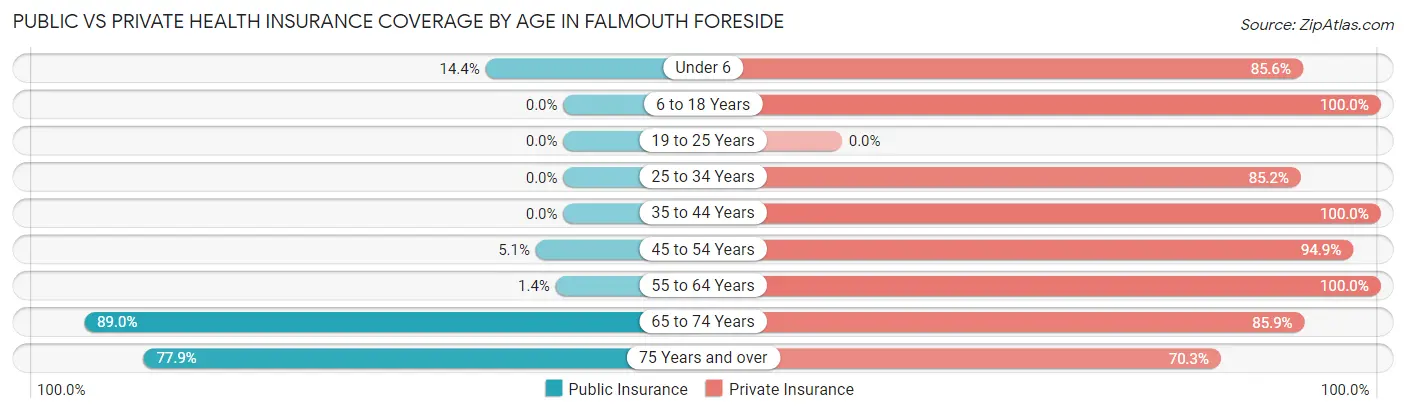
| Age Bracket | Public Insurance | Private Insurance |
| Under 6 | 13 (14.4%) | 77 (85.6%) |
| 6 to 18 Years | 0 (0.0%) | 438 (100.0%) |
| 19 to 25 Years | 0 (0.0%) | 0 (0.0%) |
| 25 to 34 Years | 0 (0.0%) | 46 (85.2%) |
| 35 to 44 Years | 0 (0.0%) | 235 (100.0%) |
| 45 to 54 Years | 14 (5.1%) | 260 (94.9%) |
| 55 to 64 Years | 5 (1.4%) | 353 (100.0%) |
| 65 to 74 Years | 258 (89.0%) | 249 (85.9%) |
| 75 Years and over | 113 (77.9%) | 102 (70.3%) |
| Total | 403 (21.4%) | 1,760 (93.7%) |
Disability Status by Sex by Age in Falmouth Foreside
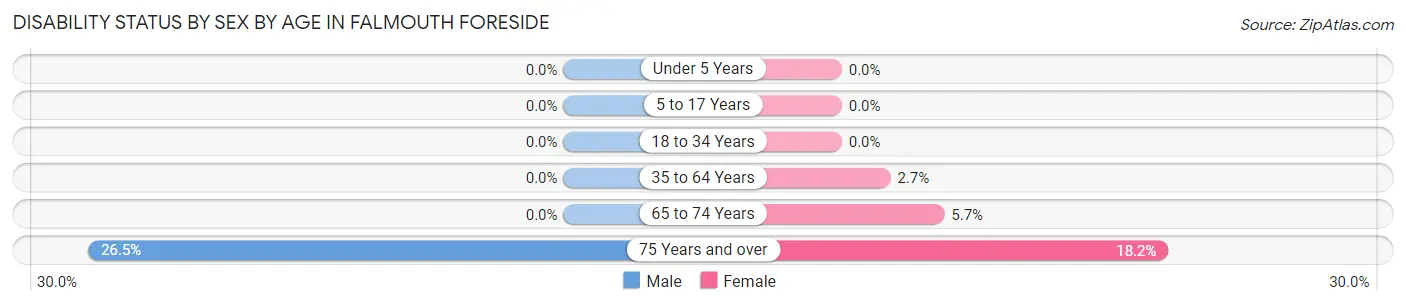
| Age Bracket | Male | Female |
| Under 5 Years | 0 (0.0%) | 0 (0.0%) |
| 5 to 17 Years | 0 (0.0%) | 0 (0.0%) |
| 18 to 34 Years | 0 (0.0%) | 0 (0.0%) |
| 35 to 64 Years | 0 (0.0%) | 13 (2.7%) |
| 65 to 74 Years | 0 (0.0%) | 10 (5.7%) |
| 75 Years and over | 18 (26.5%) | 14 (18.2%) |
Disability Class by Sex by Age in Falmouth Foreside
Disability Class: Hearing Difficulty
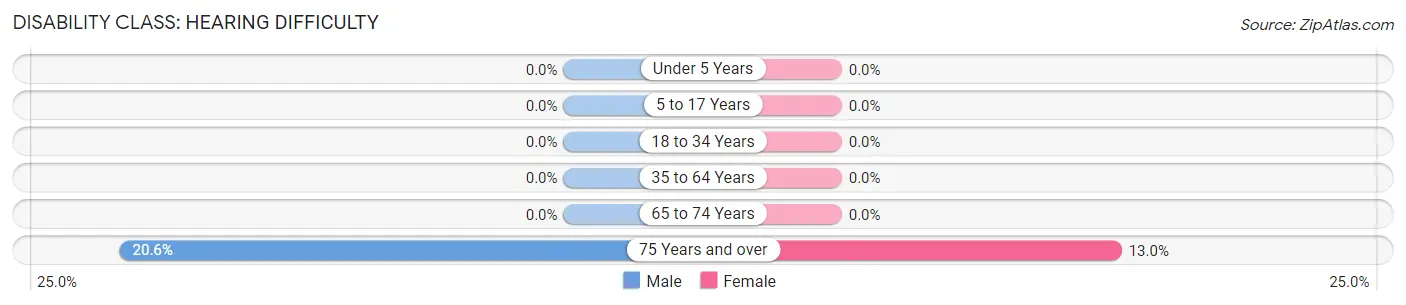
| Age Bracket | Male | Female |
| Under 5 Years | 0 (0.0%) | 0 (0.0%) |
| 5 to 17 Years | 0 (0.0%) | 0 (0.0%) |
| 18 to 34 Years | 0 (0.0%) | 0 (0.0%) |
| 35 to 64 Years | 0 (0.0%) | 0 (0.0%) |
| 65 to 74 Years | 0 (0.0%) | 0 (0.0%) |
| 75 Years and over | 14 (20.6%) | 10 (13.0%) |
Disability Class: Vision Difficulty
| Age Bracket | Male | Female |
| Under 5 Years | 0 (0.0%) | 0 (0.0%) |
| 5 to 17 Years | 0 (0.0%) | 0 (0.0%) |
| 18 to 34 Years | 0 (0.0%) | 0 (0.0%) |
| 35 to 64 Years | 0 (0.0%) | 0 (0.0%) |
| 65 to 74 Years | 0 (0.0%) | 0 (0.0%) |
| 75 Years and over | 0 (0.0%) | 0 (0.0%) |
Disability Class: Cognitive Difficulty
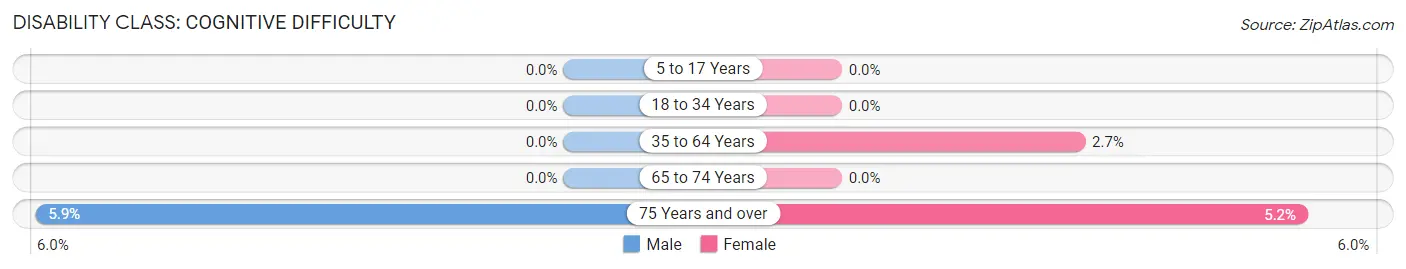
| Age Bracket | Male | Female |
| 5 to 17 Years | 0 (0.0%) | 0 (0.0%) |
| 18 to 34 Years | 0 (0.0%) | 0 (0.0%) |
| 35 to 64 Years | 0 (0.0%) | 13 (2.7%) |
| 65 to 74 Years | 0 (0.0%) | 0 (0.0%) |
| 75 Years and over | 4 (5.9%) | 4 (5.2%) |
Disability Class: Ambulatory Difficulty
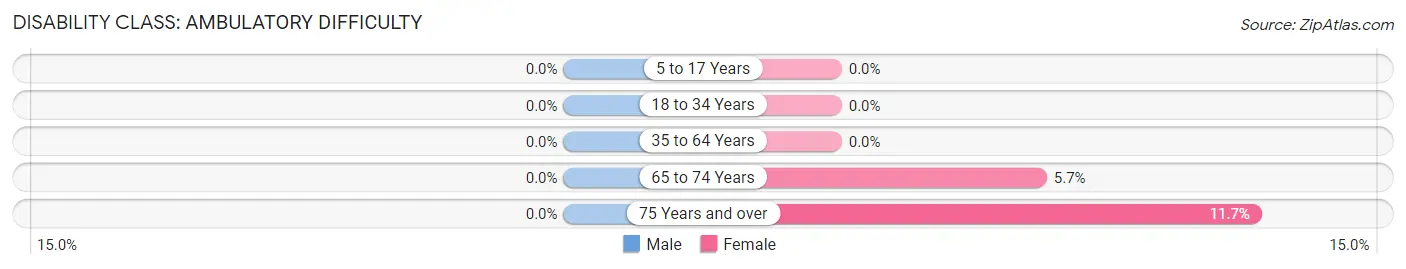
| Age Bracket | Male | Female |
| 5 to 17 Years | 0 (0.0%) | 0 (0.0%) |
| 18 to 34 Years | 0 (0.0%) | 0 (0.0%) |
| 35 to 64 Years | 0 (0.0%) | 0 (0.0%) |
| 65 to 74 Years | 0 (0.0%) | 10 (5.7%) |
| 75 Years and over | 0 (0.0%) | 9 (11.7%) |
Disability Class: Self-Care Difficulty
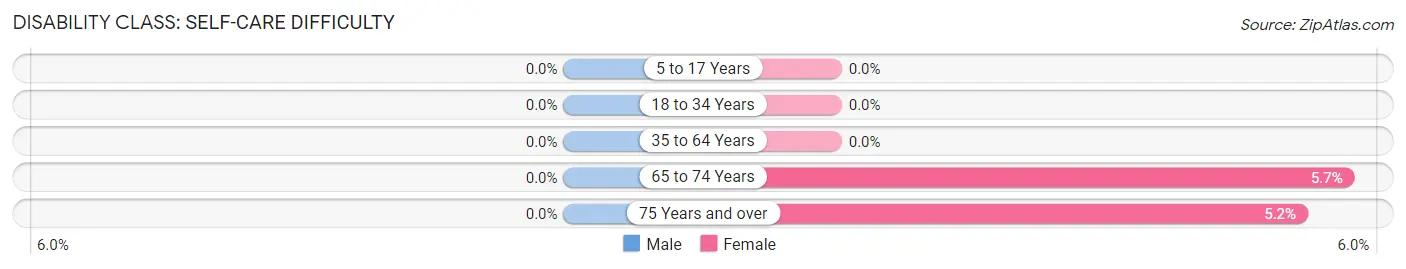
| Age Bracket | Male | Female |
| 5 to 17 Years | 0 (0.0%) | 0 (0.0%) |
| 18 to 34 Years | 0 (0.0%) | 0 (0.0%) |
| 35 to 64 Years | 0 (0.0%) | 0 (0.0%) |
| 65 to 74 Years | 0 (0.0%) | 10 (5.7%) |
| 75 Years and over | 0 (0.0%) | 4 (5.2%) |
Technology Access in Falmouth Foreside
Computing Device Access in Falmouth Foreside
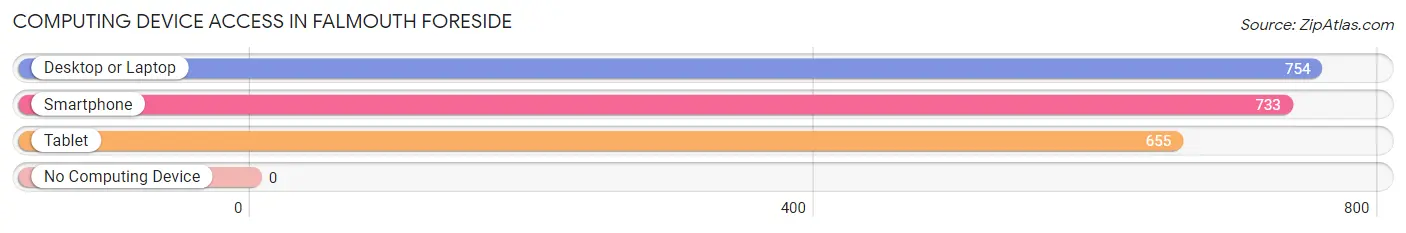
| Device Type | # Households | % Households |
| Desktop or Laptop | 754 | 99.3% |
| Smartphone | 733 | 96.6% |
| Tablet | 655 | 86.3% |
| No Computing Device | 0 | 0.0% |
| Total | 759 | 100.0% |
Internet Access in Falmouth Foreside
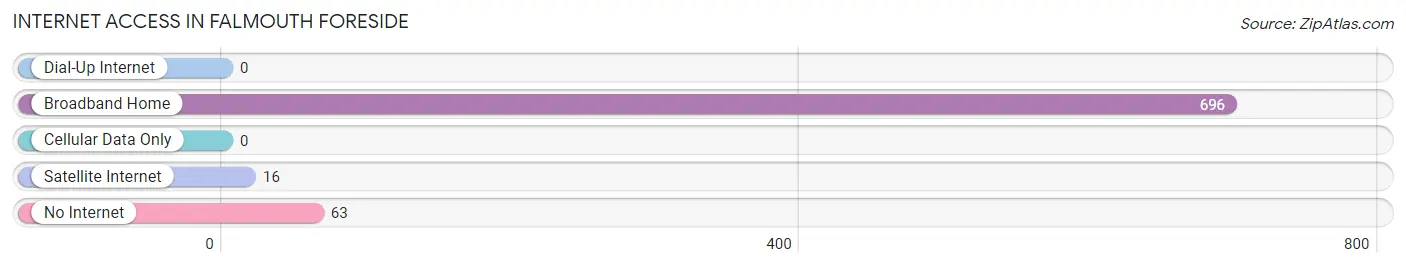
| Internet Type | # Households | % Households |
| Dial-Up Internet | 0 | 0.0% |
| Broadband Home | 696 | 91.7% |
| Cellular Data Only | 0 | 0.0% |
| Satellite Internet | 16 | 2.1% |
| No Internet | 63 | 8.3% |
| Total | 759 | 100.0% |
Falmouth Foreside Summary
Falmouth Foreside is a small, unincorporated village located in the town of Falmouth, Maine. It is situated on the western shore of Casco Bay, just south of Portland. The village is home to a variety of businesses, including restaurants, shops, and a marina. It is also home to a number of historic sites, including the Falmouth Foreside Historic District, which is listed on the National Register of Historic Places.
History
The area that is now Falmouth Foreside was first settled in the early 1700s by English settlers. The village was originally known as “The Foreside” and was a small fishing and farming community. In the late 1700s, the area was home to a number of shipbuilding yards, which produced vessels for the local fishing and trading industries.
In the early 1800s, the village began to grow and develop. The first post office was established in 1820, and the first school was built in 1825. The village was incorporated in 1837, and the name was changed to Falmouth Foreside.
In the late 1800s, the village began to attract wealthy summer residents from Portland and other nearby cities. These visitors built large summer homes in the area, and the village began to develop a reputation as a fashionable summer resort.
In the early 1900s, the village continued to grow and develop. The first public library was established in 1910, and the first fire station was built in 1912. The village also became a popular destination for tourists, and a number of hotels and inns were built in the area.
Geography
Falmouth Foreside is located on the western shore of Casco Bay, just south of Portland. The village is situated on a peninsula, with the Fore River to the east and the Presumpscot River to the west. The village is bordered by the towns of Falmouth, Cumberland, and Yarmouth.
The village is home to a variety of businesses, including restaurants, shops, and a marina. It is also home to a number of historic sites, including the Falmouth Foreside Historic District, which is listed on the National Register of Historic Places.
Economy
The economy of Falmouth Foreside is largely based on tourism and retail. The village is home to a number of restaurants, shops, and a marina. It is also home to a number of historic sites, which attract visitors from all over the world.
The village is also home to a number of businesses, including a number of professional services, such as lawyers, accountants, and real estate agents. The village is also home to a number of small businesses, such as art galleries, antique shops, and gift shops.
Demographics
As of the 2010 census, the population of Falmouth Foreside was 1,845. The population is largely white (94.3%), with a small percentage of African Americans (2.2%) and Asians (1.2%). The median household income is $77,917, and the median home value is $521,400.
Conclusion
Falmouth Foreside is a small, unincorporated village located in the town of Falmouth, Maine. It is situated on the western shore of Casco Bay, just south of Portland. The village is home to a variety of businesses, including restaurants, shops, and a marina. It is also home to a number of historic sites, including the Falmouth Foreside Historic District, which is listed on the National Register of Historic Places. The economy of Falmouth Foreside is largely based on tourism and retail, and the population is largely white.
Common Questions
What is Per Capita Income in Falmouth Foreside?
Per Capita income in Falmouth Foreside is $86,742.
What is the Median Family Income in Falmouth Foreside?
Median Family Income in Falmouth Foreside is $194,643.
What is the Median Household income in Falmouth Foreside?
Median Household Income in Falmouth Foreside is $190,476.
What is Income or Wage Gap in Falmouth Foreside?
Income or Wage Gap in Falmouth Foreside is 49.4%.
Women in Falmouth Foreside earn 50.6 cents for every dollar earned by a man.
What is Inequality or Gini Index in Falmouth Foreside?
Inequality or Gini Index in Falmouth Foreside is 0.48.
What is the Total Population of Falmouth Foreside?
Total Population of Falmouth Foreside is 2,022.
What is the Total Male Population of Falmouth Foreside?
Total Male Population of Falmouth Foreside is 924.
What is the Total Female Population of Falmouth Foreside?
Total Female Population of Falmouth Foreside is 1,098.
What is the Ratio of Males per 100 Females in Falmouth Foreside?
There are 84.15 Males per 100 Females in Falmouth Foreside.
What is the Ratio of Females per 100 Males in Falmouth Foreside?
There are 118.83 Females per 100 Males in Falmouth Foreside.
What is the Median Population Age in Falmouth Foreside?
Median Population Age in Falmouth Foreside is 53.7 Years.
What is the Average Family Size in Falmouth Foreside
Average Family Size in Falmouth Foreside is 2.9 People.
What is the Average Household Size in Falmouth Foreside
Average Household Size in Falmouth Foreside is 2.5 People.
How Large is the Labor Force in Falmouth Foreside?
There are 929 People in the Labor Forcein in Falmouth Foreside.
What is the Percentage of People in the Labor Force in Falmouth Foreside?
56.4% of People are in the Labor Force in Falmouth Foreside.
What is the Unemployment Rate in Falmouth Foreside?
Unemployment Rate in Falmouth Foreside is 2.8%.