North Windham, ME Map & Demographics
North Windham Map
North Windham Overview
$40,058
PER CAPITA INCOME
$92,359
AVG FAMILY INCOME
$90,604
AVG HOUSEHOLD INCOME
24.9%
WAGE / INCOME GAP [ % ]
75.1¢/ $1
WAGE / INCOME GAP [ $ ]
0.30
INEQUALITY / GINI INDEX
5,525
TOTAL POPULATION
2,484
MALE POPULATION
3,041
FEMALE POPULATION
81.68
MALES / 100 FEMALES
122.42
FEMALES / 100 MALES
43.4
MEDIAN AGE
2.7
AVG FAMILY SIZE
2.4
AVG HOUSEHOLD SIZE
3,288
LABOR FORCE [ PEOPLE ]
71.1%
PERCENT IN LABOR FORCE
1.3%
UNEMPLOYMENT RATE
North Windham Area Codes
Income in North Windham
Income Overview in North Windham
Per Capita Income in North Windham is $40,058, while median incomes of families and households are $92,359 and $90,604 respectively.
| Characteristic | Number | Measure |
| Per Capita Income | 5,525 | $40,058 |
| Median Family Income | 1,566 | $92,359 |
| Mean Family Income | 1,566 | $104,619 |
| Median Household Income | 2,294 | $90,604 |
| Mean Household Income | 2,294 | $95,868 |
| Income Deficit | 1,566 | $0 |
| Wage / Income Gap (%) | 5,525 | 24.86% |
| Wage / Income Gap ($) | 5,525 | 75.14¢ per $1 |
| Gini / Inequality Index | 5,525 | 0.30 |
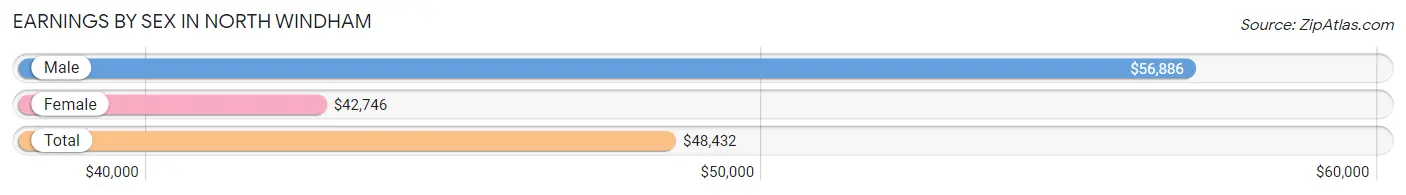
Earnings by Sex in North Windham
Average Earnings in North Windham are $48,432, $56,886 for men and $42,746 for women, a difference of 24.9%.
| Sex | Number | Average Earnings |
| Male | 1,541 (45.6%) | $56,886 |
| Female | 1,836 (54.4%) | $42,746 |
| Total | 3,377 (100.0%) | $48,432 |
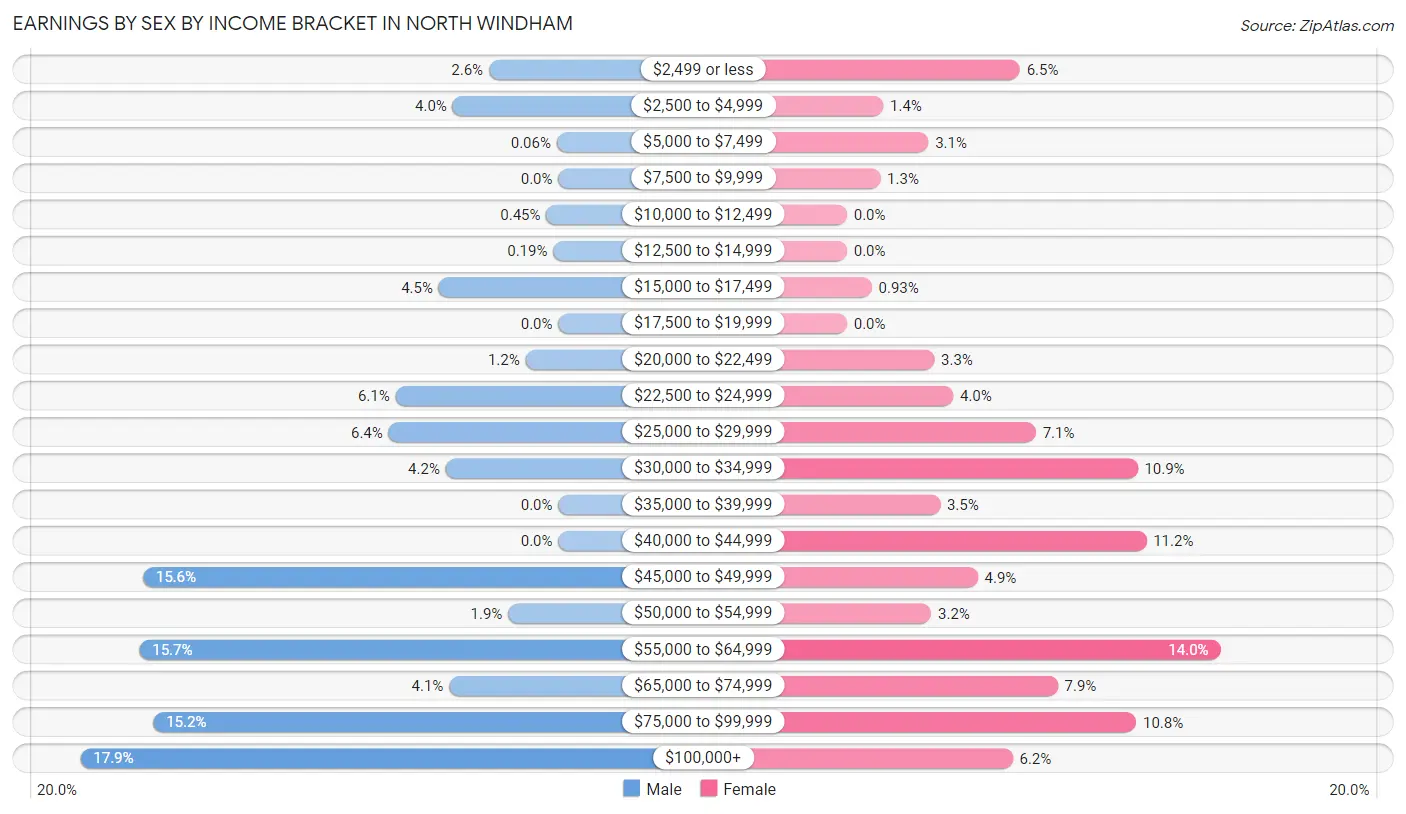
Earnings by Sex by Income Bracket in North Windham
The most common earnings brackets in North Windham are $100,000+ for men (276 | 17.9%) and $55,000 to $64,999 for women (257 | 14.0%).
| Income | Male | Female |
| $2,499 or less | 40 (2.6%) | 119 (6.5%) |
| $2,500 to $4,999 | 61 (4.0%) | 25 (1.4%) |
| $5,000 to $7,499 | 1 (0.1%) | 56 (3.0%) |
| $7,500 to $9,999 | 0 (0.0%) | 23 (1.3%) |
| $10,000 to $12,499 | 7 (0.4%) | 0 (0.0%) |
| $12,500 to $14,999 | 3 (0.2%) | 0 (0.0%) |
| $15,000 to $17,499 | 69 (4.5%) | 17 (0.9%) |
| $17,500 to $19,999 | 0 (0.0%) | 0 (0.0%) |
| $20,000 to $22,499 | 19 (1.2%) | 60 (3.3%) |
| $22,500 to $24,999 | 94 (6.1%) | 73 (4.0%) |
| $25,000 to $29,999 | 98 (6.4%) | 130 (7.1%) |
| $30,000 to $34,999 | 65 (4.2%) | 200 (10.9%) |
| $35,000 to $39,999 | 0 (0.0%) | 64 (3.5%) |
| $40,000 to $44,999 | 0 (0.0%) | 206 (11.2%) |
| $45,000 to $49,999 | 240 (15.6%) | 90 (4.9%) |
| $50,000 to $54,999 | 29 (1.9%) | 58 (3.2%) |
| $55,000 to $64,999 | 242 (15.7%) | 257 (14.0%) |
| $65,000 to $74,999 | 63 (4.1%) | 145 (7.9%) |
| $75,000 to $99,999 | 234 (15.2%) | 199 (10.8%) |
| $100,000+ | 276 (17.9%) | 114 (6.2%) |
| Total | 1,541 (100.0%) | 1,836 (100.0%) |
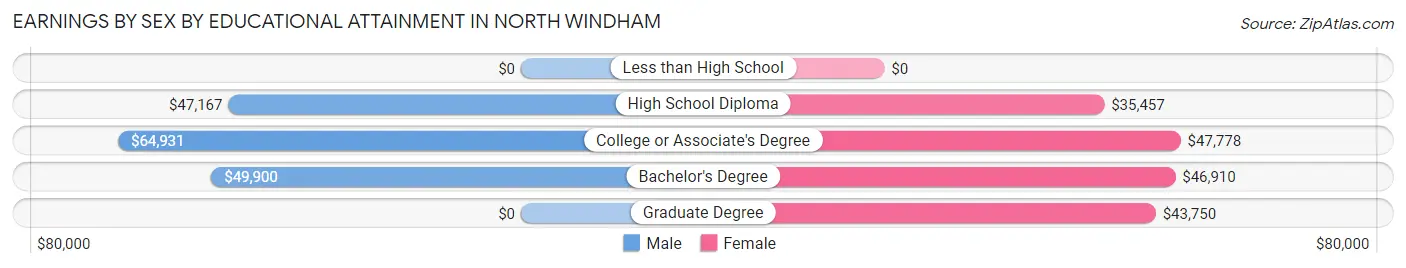
Earnings by Sex by Educational Attainment in North Windham
Average earnings in North Windham are $59,087 for men and $44,754 for women, a difference of 24.3%. Men with an educational attainment of college or associate's degree enjoy the highest average annual earnings of $64,931, while those with high school diploma education earn the least with $47,167. Women with an educational attainment of college or associate's degree earn the most with the average annual earnings of $47,778, while those with high school diploma education have the smallest earnings of $35,457.
| Educational Attainment | Male Income | Female Income |
| Less than High School | - | - |
| High School Diploma | $47,167 | $35,457 |
| College or Associate's Degree | $64,931 | $47,778 |
| Bachelor's Degree | $49,900 | $46,910 |
| Graduate Degree | - | - |
| Total | $59,087 | $44,754 |
Family Income in North Windham
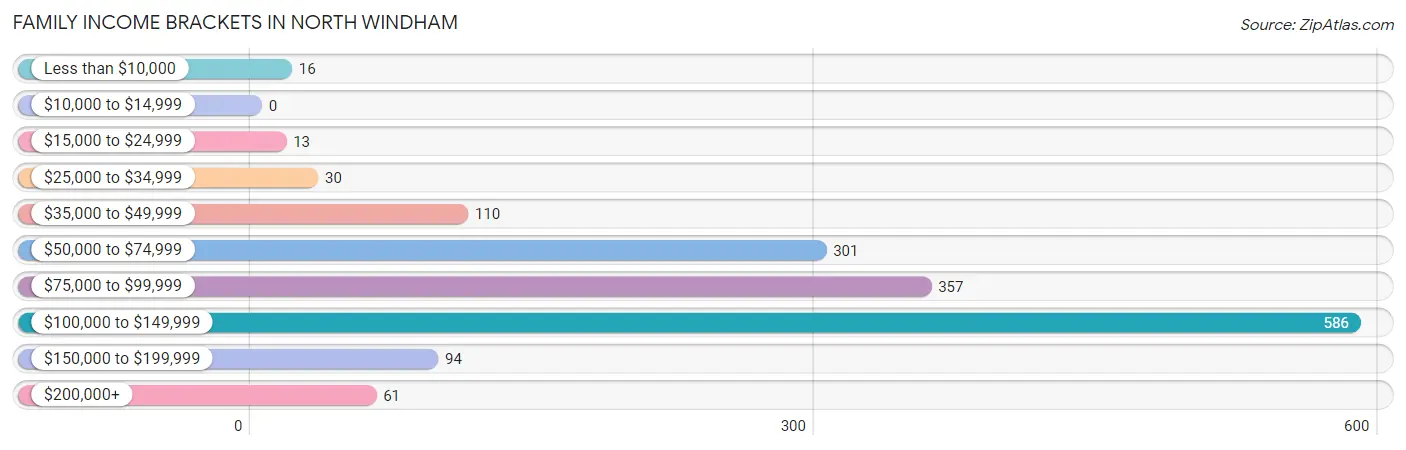
Family Income Brackets in North Windham
According to the North Windham family income data, there are 586 families falling into the $100,000 to $149,999 income range, which is the most common income bracket and makes up 37.4% of all families.
| Income Bracket | # Families | % Families |
| Less than $10,000 | 16 | 1.0% |
| $10,000 to $14,999 | 0 | 0.0% |
| $15,000 to $24,999 | 13 | 0.8% |
| $25,000 to $34,999 | 30 | 1.9% |
| $35,000 to $49,999 | 110 | 7.0% |
| $50,000 to $74,999 | 301 | 19.2% |
| $75,000 to $99,999 | 357 | 22.8% |
| $100,000 to $149,999 | 586 | 37.4% |
| $150,000 to $199,999 | 94 | 6.0% |
| $200,000+ | 61 | 3.9% |
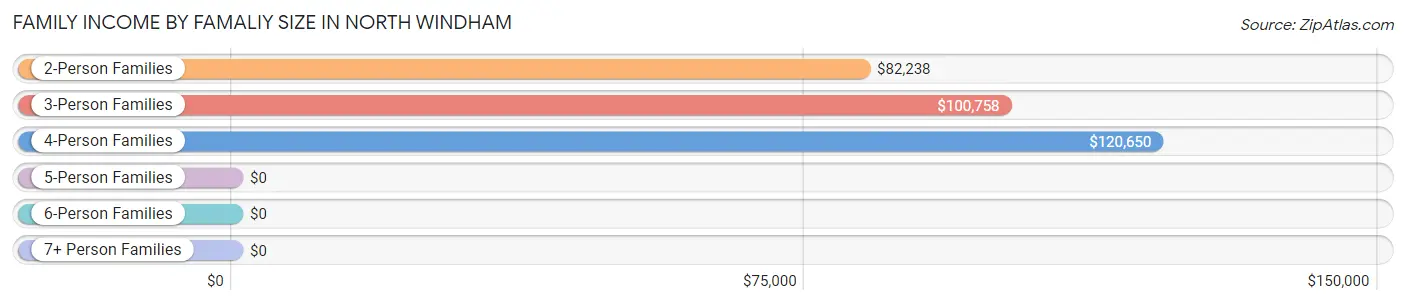
Family Income by Famaliy Size in North Windham
4-person families (199 | 12.7%) account for the highest median family income in North Windham with $120,650 per family, while 2-person families (789 | 50.4%) have the highest median income of $41,119 per family member.
| Income Bracket | # Families | Median Income |
| 2-Person Families | 789 (50.4%) | $82,238 |
| 3-Person Families | 521 (33.3%) | $100,758 |
| 4-Person Families | 199 (12.7%) | $120,650 |
| 5-Person Families | 35 (2.2%) | $0 |
| 6-Person Families | 0 (0.0%) | $0 |
| 7+ Person Families | 22 (1.4%) | $0 |
| Total | 1,566 (100.0%) | $92,359 |
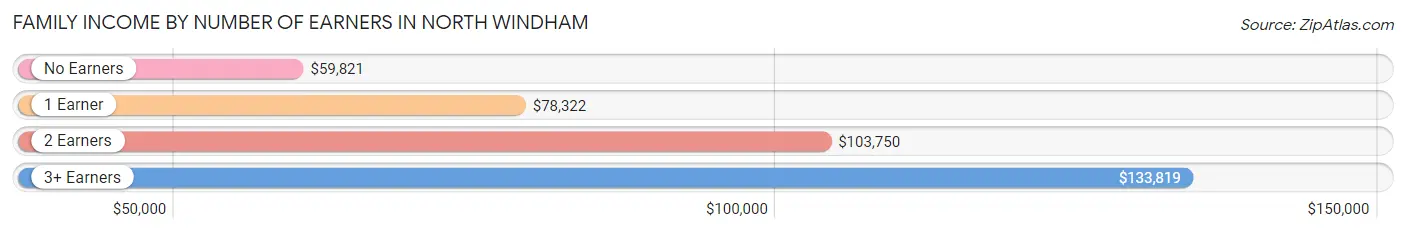
Family Income by Number of Earners in North Windham
The median family income in North Windham is $92,359, with families comprising 3+ earners (107) having the highest median family income of $133,819, while families with no earners (154) have the lowest median family income of $59,821, accounting for 6.8% and 9.8% of families, respectively.
| Number of Earners | # Families | Median Income |
| No Earners | 154 (9.8%) | $59,821 |
| 1 Earner | 407 (26.0%) | $78,322 |
| 2 Earners | 898 (57.3%) | $103,750 |
| 3+ Earners | 107 (6.8%) | $133,819 |
| Total | 1,566 (100.0%) | $92,359 |
Household Income in North Windham
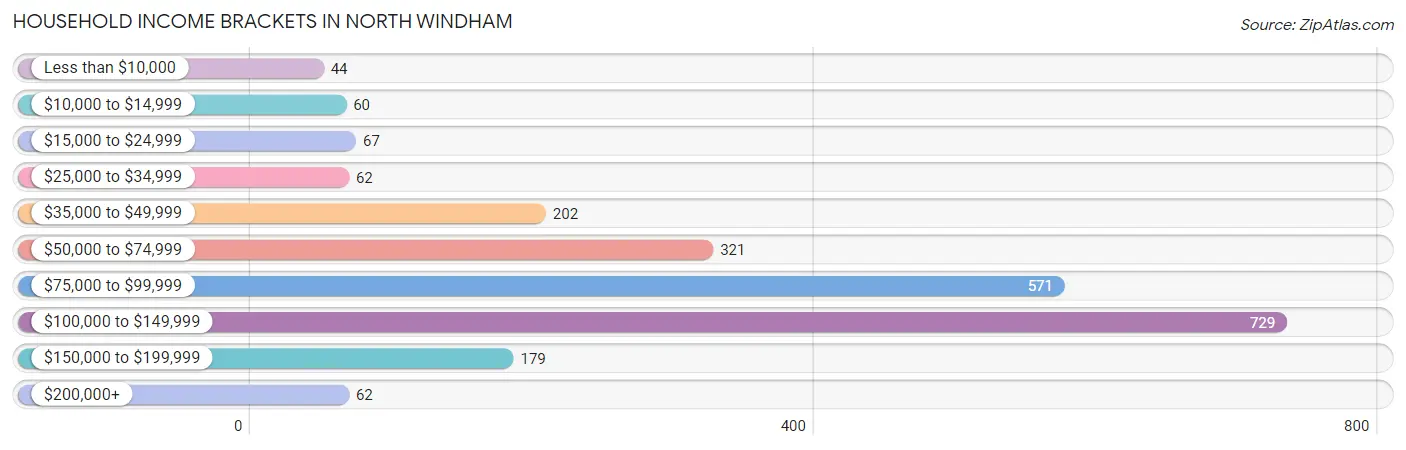
Household Income Brackets in North Windham
With 729 households falling in the category, the $100,000 to $149,999 income range is the most frequent in North Windham, accounting for 31.8% of all households. In contrast, only 44 households (1.9%) fall into the less than $10,000 income bracket, making it the least populous group.
| Income Bracket | # Households | % Households |
| Less than $10,000 | 44 | 1.9% |
| $10,000 to $14,999 | 60 | 2.6% |
| $15,000 to $24,999 | 67 | 2.9% |
| $25,000 to $34,999 | 62 | 2.7% |
| $35,000 to $49,999 | 202 | 8.8% |
| $50,000 to $74,999 | 321 | 14.0% |
| $75,000 to $99,999 | 571 | 24.9% |
| $100,000 to $149,999 | 729 | 31.8% |
| $150,000 to $199,999 | 179 | 7.8% |
| $200,000+ | 62 | 2.7% |
Household Income by Householder Age in North Windham
The median household income in North Windham is $90,604, with the highest median household income of $101,148 found in the 25 to 44 years age bracket for the primary householder. A total of 828 households (36.1%) fall into this category.
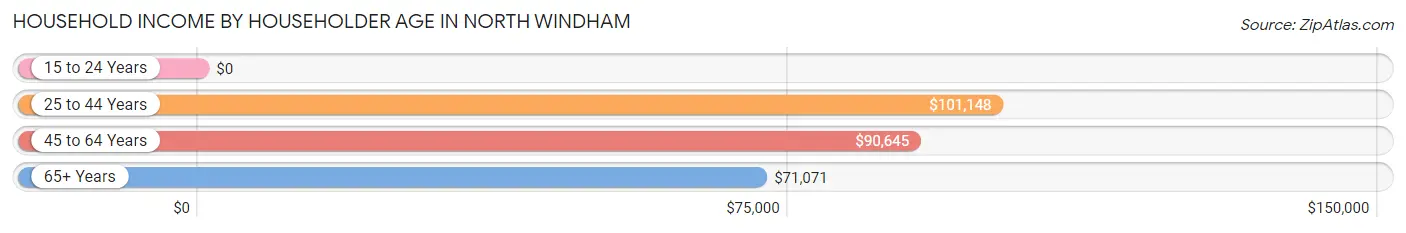
| Income Bracket | # Households | Median Income |
| 15 to 24 Years | 0 (0.0%) | $0 |
| 25 to 44 Years | 828 (36.1%) | $101,148 |
| 45 to 64 Years | 820 (35.7%) | $90,645 |
| 65+ Years | 646 (28.2%) | $71,071 |
| Total | 2,294 (100.0%) | $90,604 |
Poverty in North Windham
Income Below Poverty by Sex and Age in North Windham
With 4.8% poverty level for males and 5.3% for females among the residents of North Windham, 25 to 34 year old males and 75 year old and over females are the most vulnerable to poverty, with 95 males (20.6%) and 45 females (20.7%) in their respective age groups living below the poverty level.
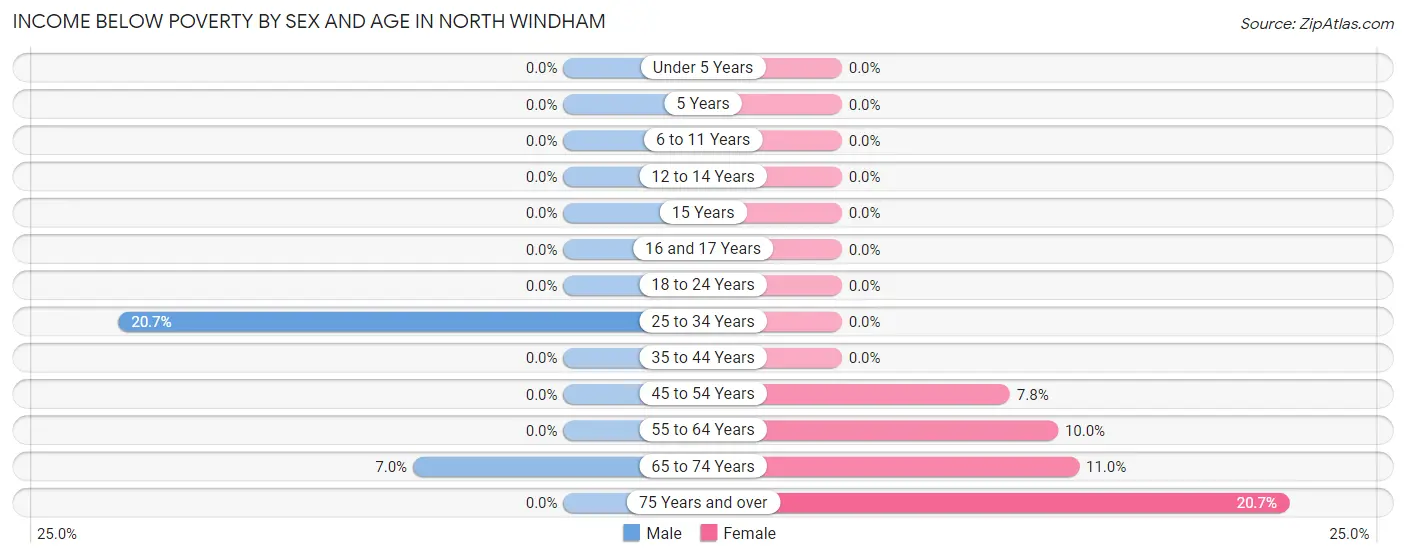
| Age Bracket | Male | Female |
| Under 5 Years | 0 (0.0%) | 0 (0.0%) |
| 5 Years | 0 (0.0%) | 0 (0.0%) |
| 6 to 11 Years | 0 (0.0%) | 0 (0.0%) |
| 12 to 14 Years | 0 (0.0%) | 0 (0.0%) |
| 15 Years | 0 (0.0%) | 0 (0.0%) |
| 16 and 17 Years | 0 (0.0%) | 0 (0.0%) |
| 18 to 24 Years | 0 (0.0%) | 0 (0.0%) |
| 25 to 34 Years | 95 (20.6%) | 0 (0.0%) |
| 35 to 44 Years | 0 (0.0%) | 0 (0.0%) |
| 45 to 54 Years | 0 (0.0%) | 46 (7.8%) |
| 55 to 64 Years | 0 (0.0%) | 33 (10.0%) |
| 65 to 74 Years | 22 (7.0%) | 37 (11.0%) |
| 75 Years and over | 0 (0.0%) | 45 (20.7%) |
| Total | 117 (4.8%) | 161 (5.3%) |
Income Above Poverty by Sex and Age in North Windham
According to the poverty statistics in North Windham, males aged under 5 years and females aged under 5 years are the age groups that are most secure financially, with 100.0% of males and 100.0% of females in these age groups living above the poverty line.
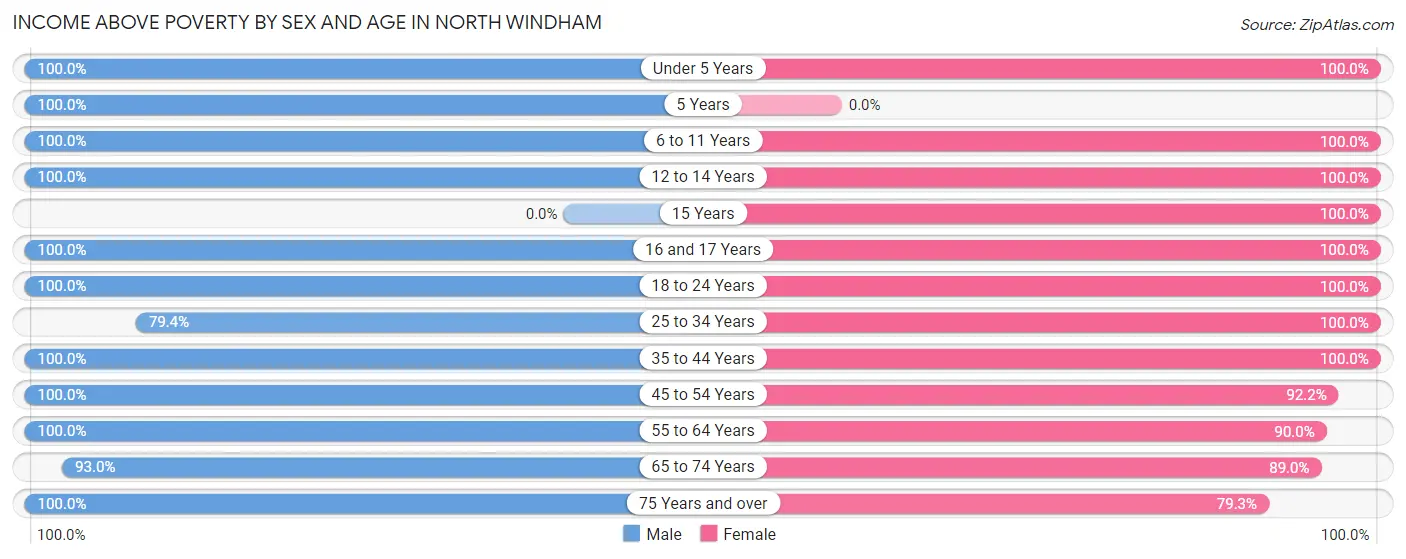
| Age Bracket | Male | Female |
| Under 5 Years | 53 (100.0%) | 169 (100.0%) |
| 5 Years | 21 (100.0%) | 0 (0.0%) |
| 6 to 11 Years | 211 (100.0%) | 143 (100.0%) |
| 12 to 14 Years | 116 (100.0%) | 88 (100.0%) |
| 15 Years | 0 (0.0%) | 40 (100.0%) |
| 16 and 17 Years | 6 (100.0%) | 31 (100.0%) |
| 18 to 24 Years | 102 (100.0%) | 115 (100.0%) |
| 25 to 34 Years | 365 (79.3%) | 377 (100.0%) |
| 35 to 44 Years | 407 (100.0%) | 596 (100.0%) |
| 45 to 54 Years | 332 (100.0%) | 544 (92.2%) |
| 55 to 64 Years | 284 (100.0%) | 296 (90.0%) |
| 65 to 74 Years | 293 (93.0%) | 299 (89.0%) |
| 75 Years and over | 125 (100.0%) | 172 (79.3%) |
| Total | 2,315 (95.2%) | 2,870 (94.7%) |
Income Below Poverty Among Married-Couple Families in North Windham
The poverty statistics for married-couple families in North Windham show that 1.3% or 16 of the total 1,193 families live below the poverty line. Families with no children have the highest poverty rate of 2.3%, comprising of 16 families. On the other hand, families with 1 or 2 children have the lowest poverty rate of 0.0%, which includes 0 families.
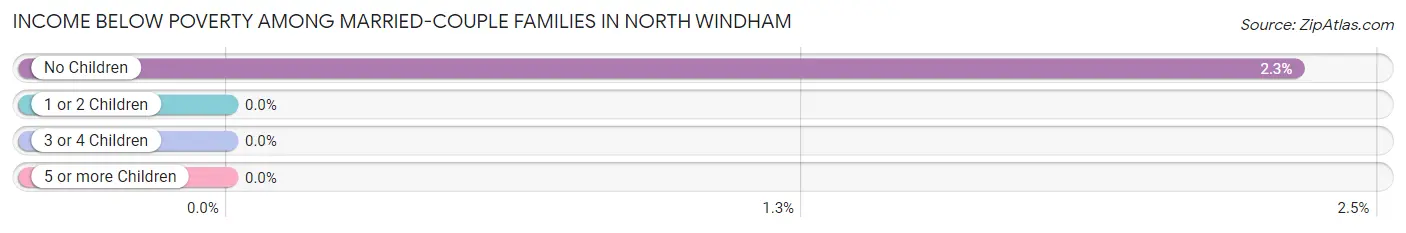
| Children | Above Poverty | Below Poverty |
| No Children | 674 (97.7%) | 16 (2.3%) |
| 1 or 2 Children | 462 (100.0%) | 0 (0.0%) |
| 3 or 4 Children | 41 (100.0%) | 0 (0.0%) |
| 5 or more Children | 0 (0.0%) | 0 (0.0%) |
| Total | 1,177 (98.7%) | 16 (1.3%) |
Income Below Poverty Among Single-Parent Households in North Windham
| Children | Single Father | Single Mother |
| No Children | 0 (0.0%) | 0 (0.0%) |
| 1 or 2 Children | 0 (0.0%) | 0 (0.0%) |
| 3 or 4 Children | 0 (0.0%) | 0 (0.0%) |
| 5 or more Children | 0 (0.0%) | 0 (0.0%) |
| Total | 0 (0.0%) | 0 (0.0%) |
Income Below Poverty Among Married-Couple vs Single-Parent Households in North Windham
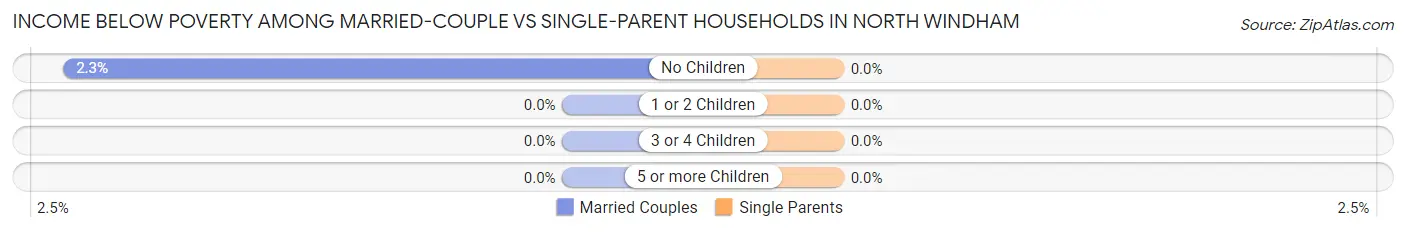
| Children | Married-Couple Families | Single-Parent Households |
| No Children | 16 (2.3%) | 0 (0.0%) |
| 1 or 2 Children | 0 (0.0%) | 0 (0.0%) |
| 3 or 4 Children | 0 (0.0%) | 0 (0.0%) |
| 5 or more Children | 0 (0.0%) | 0 (0.0%) |
| Total | 16 (1.3%) | 0 (0.0%) |
Race in North Windham
The most populous races in North Windham are White / Caucasian (5,082 | 92.0%), Asian (230 | 4.2%), and Two or more Races (188 | 3.4%).
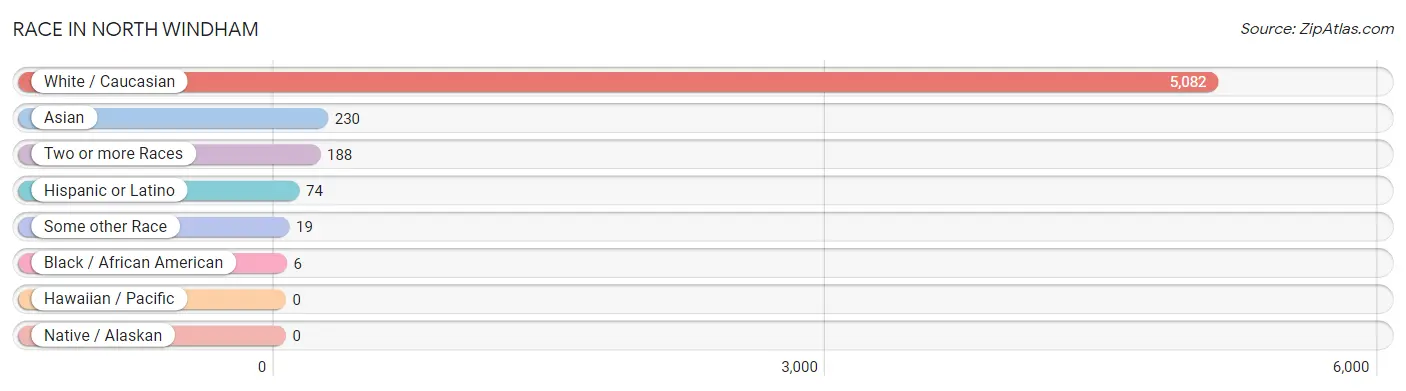
| Race | # Population | % Population |
| Asian | 230 | 4.2% |
| Black / African American | 6 | 0.1% |
| Hawaiian / Pacific | 0 | 0.0% |
| Hispanic or Latino | 74 | 1.3% |
| Native / Alaskan | 0 | 0.0% |
| White / Caucasian | 5,082 | 92.0% |
| Two or more Races | 188 | 3.4% |
| Some other Race | 19 | 0.3% |
| Total | 5,525 | 100.0% |
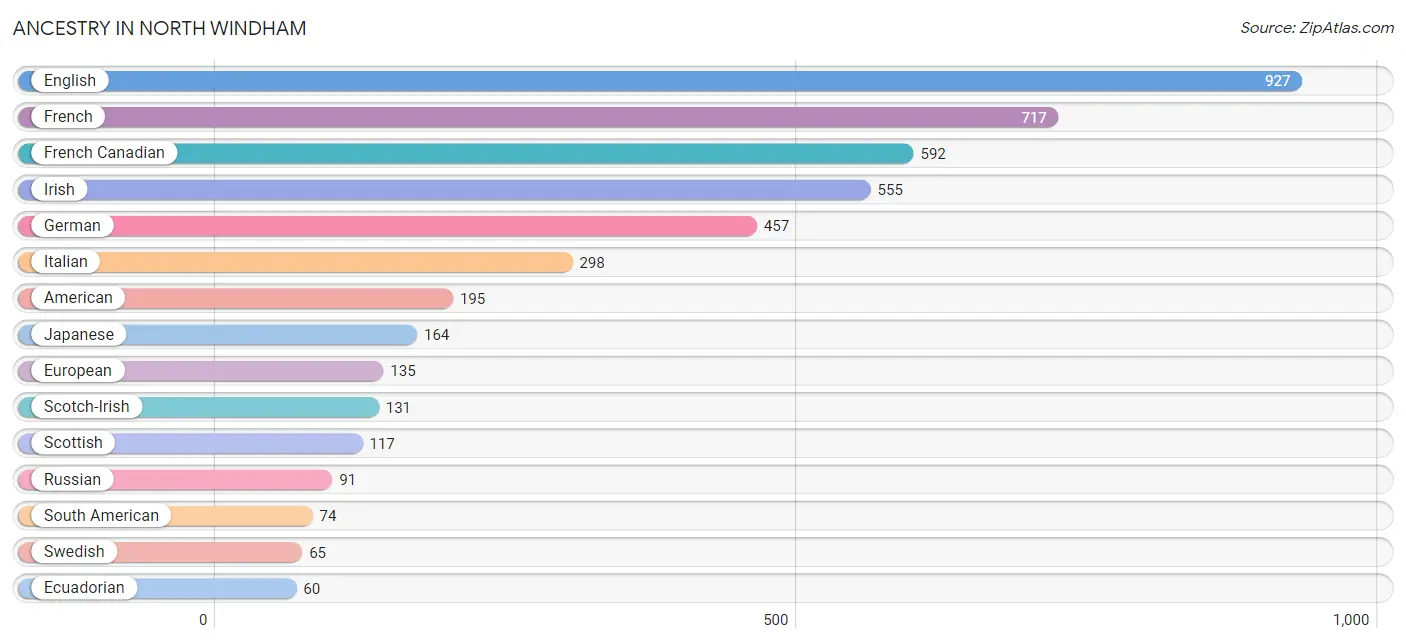
Ancestry in North Windham
The most populous ancestries reported in North Windham are English (927 | 16.8%), French (717 | 13.0%), French Canadian (592 | 10.7%), Irish (555 | 10.1%), and German (457 | 8.3%), together accounting for 58.8% of all North Windham residents.
| Ancestry | # Population | % Population |
| African | 6 | 0.1% |
| American | 195 | 3.5% |
| Cajun | 59 | 1.1% |
| Canadian | 13 | 0.2% |
| Czech | 9 | 0.2% |
| Dutch | 16 | 0.3% |
| Eastern European | 41 | 0.7% |
| Ecuadorian | 60 | 1.1% |
| English | 927 | 16.8% |
| European | 135 | 2.4% |
| Finnish | 18 | 0.3% |
| French | 717 | 13.0% |
| French Canadian | 592 | 10.7% |
| German | 457 | 8.3% |
| Greek | 11 | 0.2% |
| Hungarian | 14 | 0.3% |
| Irish | 555 | 10.1% |
| Italian | 298 | 5.4% |
| Japanese | 164 | 3.0% |
| Latvian | 34 | 0.6% |
| Norwegian | 19 | 0.3% |
| Pakistani | 45 | 0.8% |
| Peruvian | 14 | 0.3% |
| Polish | 59 | 1.1% |
| Russian | 91 | 1.7% |
| Scandinavian | 42 | 0.8% |
| Scotch-Irish | 131 | 2.4% |
| Scottish | 117 | 2.1% |
| Slovak | 22 | 0.4% |
| South American | 74 | 1.3% |
| Subsaharan African | 6 | 0.1% |
| Swedish | 65 | 1.2% |
| Thai | 22 | 0.4% |
| Welsh | 29 | 0.5% | View All 34 Rows |
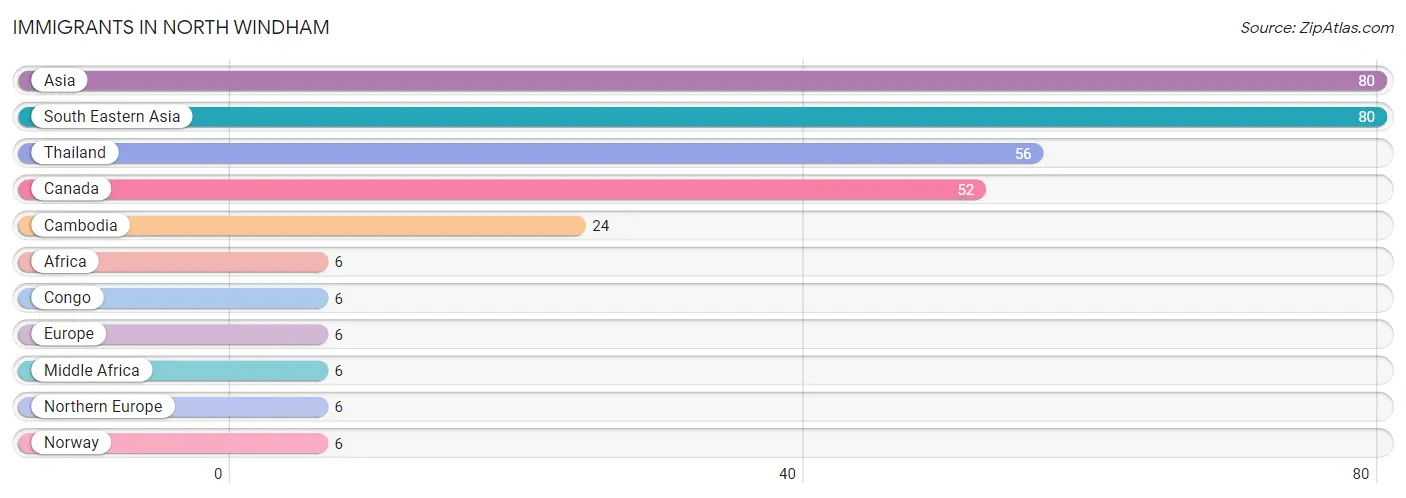
Immigrants in North Windham
The most numerous immigrant groups reported in North Windham came from Asia (80 | 1.5%), South Eastern Asia (80 | 1.5%), Thailand (56 | 1.0%), Canada (52 | 0.9%), and Cambodia (24 | 0.4%), together accounting for 5.3% of all North Windham residents.
| Immigration Origin | # Population | % Population |
| Africa | 6 | 0.1% |
| Asia | 80 | 1.5% |
| Cambodia | 24 | 0.4% |
| Canada | 52 | 0.9% |
| Congo | 6 | 0.1% |
| Europe | 6 | 0.1% |
| Middle Africa | 6 | 0.1% |
| Northern Europe | 6 | 0.1% |
| Norway | 6 | 0.1% |
| South Eastern Asia | 80 | 1.5% |
| Thailand | 56 | 1.0% | View All 11 Rows |
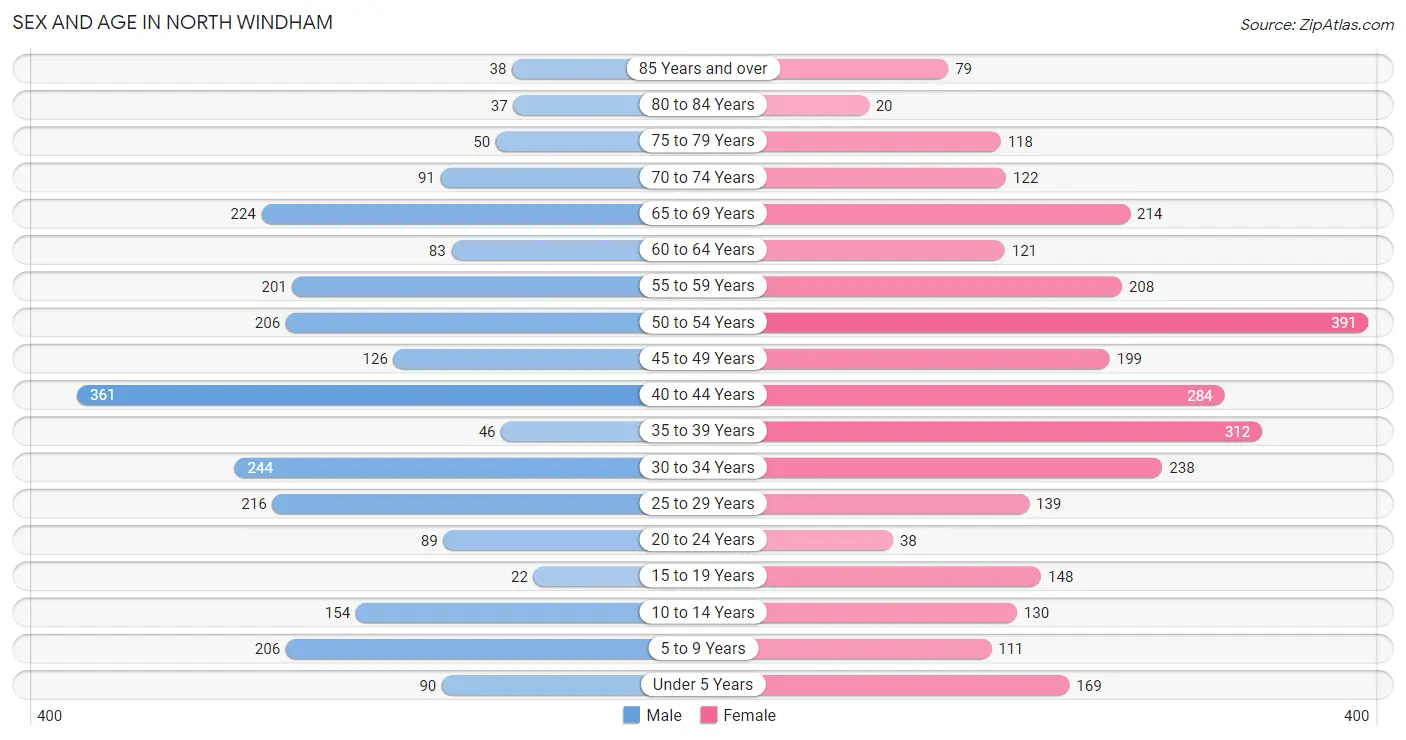
Sex and Age in North Windham
Sex and Age in North Windham
The most populous age groups in North Windham are 40 to 44 Years (361 | 14.5%) for men and 50 to 54 Years (391 | 12.9%) for women.
| Age Bracket | Male | Female |
| Under 5 Years | 90 (3.6%) | 169 (5.6%) |
| 5 to 9 Years | 206 (8.3%) | 111 (3.6%) |
| 10 to 14 Years | 154 (6.2%) | 130 (4.3%) |
| 15 to 19 Years | 22 (0.9%) | 148 (4.9%) |
| 20 to 24 Years | 89 (3.6%) | 38 (1.3%) |
| 25 to 29 Years | 216 (8.7%) | 139 (4.6%) |
| 30 to 34 Years | 244 (9.8%) | 238 (7.8%) |
| 35 to 39 Years | 46 (1.8%) | 312 (10.3%) |
| 40 to 44 Years | 361 (14.5%) | 284 (9.3%) |
| 45 to 49 Years | 126 (5.1%) | 199 (6.5%) |
| 50 to 54 Years | 206 (8.3%) | 391 (12.9%) |
| 55 to 59 Years | 201 (8.1%) | 208 (6.8%) |
| 60 to 64 Years | 83 (3.3%) | 121 (4.0%) |
| 65 to 69 Years | 224 (9.0%) | 214 (7.0%) |
| 70 to 74 Years | 91 (3.7%) | 122 (4.0%) |
| 75 to 79 Years | 50 (2.0%) | 118 (3.9%) |
| 80 to 84 Years | 37 (1.5%) | 20 (0.7%) |
| 85 Years and over | 38 (1.5%) | 79 (2.6%) |
| Total | 2,484 (100.0%) | 3,041 (100.0%) |
Families and Households in North Windham
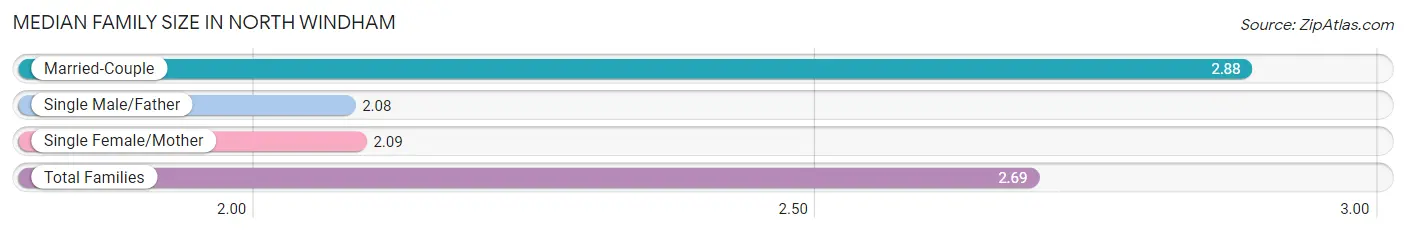
Median Family Size in North Windham
The median family size in North Windham is 2.69 persons per family, with married-couple families (1,193 | 76.2%) accounting for the largest median family size of 2.88 persons per family. On the other hand, single male/father families (91 | 5.8%) represent the smallest median family size with 2.08 persons per family.
| Family Type | # Families | Family Size |
| Married-Couple | 1,193 (76.2%) | 2.88 |
| Single Male/Father | 91 (5.8%) | 2.08 |
| Single Female/Mother | 282 (18.0%) | 2.09 |
| Total Families | 1,566 (100.0%) | 2.69 |
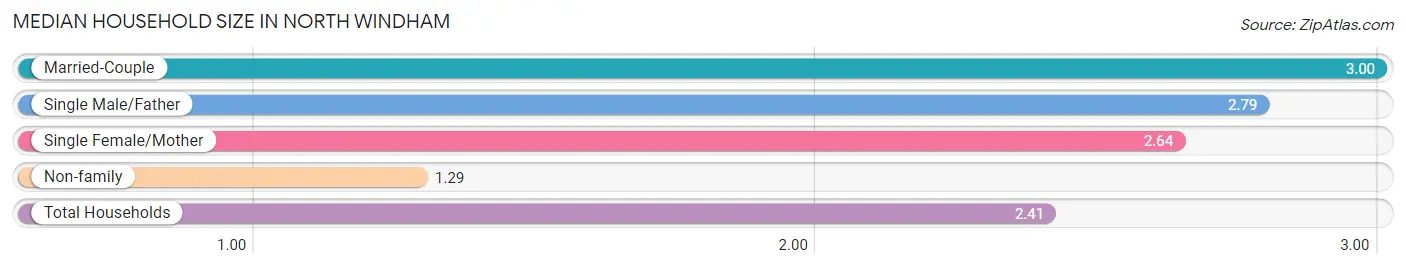
Median Household Size in North Windham
The median household size in North Windham is 2.41 persons per household, with married-couple households (1,193 | 52.0%) accounting for the largest median household size of 3 persons per household. non-family households (728 | 31.7%) represent the smallest median household size with 1.29 persons per household.
| Household Type | # Households | Household Size |
| Married-Couple | 1,193 (52.0%) | 3.00 |
| Single Male/Father | 91 (4.0%) | 2.79 |
| Single Female/Mother | 282 (12.3%) | 2.64 |
| Non-family | 728 (31.7%) | 1.29 |
| Total Households | 2,294 (100.0%) | 2.41 |
Household Size by Marriage Status in North Windham
Out of a total of 2,294 households in North Windham, 1,566 (68.3%) are family households, while 728 (31.7%) are nonfamily households. The most numerous type of family households are 2-person households, comprising 626, and the most common type of nonfamily households are 1-person households, comprising 573.
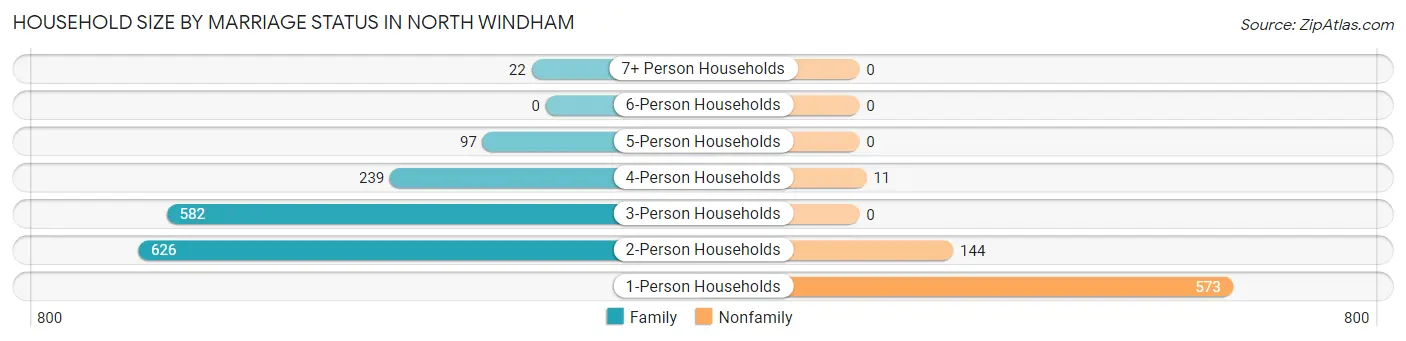
| Household Size | Family Households | Nonfamily Households |
| 1-Person Households | - | 573 (25.0%) |
| 2-Person Households | 626 (27.3%) | 144 (6.3%) |
| 3-Person Households | 582 (25.4%) | 0 (0.0%) |
| 4-Person Households | 239 (10.4%) | 11 (0.5%) |
| 5-Person Households | 97 (4.2%) | 0 (0.0%) |
| 6-Person Households | 0 (0.0%) | 0 (0.0%) |
| 7+ Person Households | 22 (1.0%) | 0 (0.0%) |
| Total | 1,566 (68.3%) | 728 (31.7%) |
Female Fertility in North Windham
Fertility by Age in North Windham
Average fertility rate in North Windham is 11.0 births per 1,000 women. Women in the age bracket of 35 to 50 years have the highest fertility rate with 18.0 births per 1,000 women. Women in the age bracket of 35 to 50 years acount for 100.0% of all women with births.
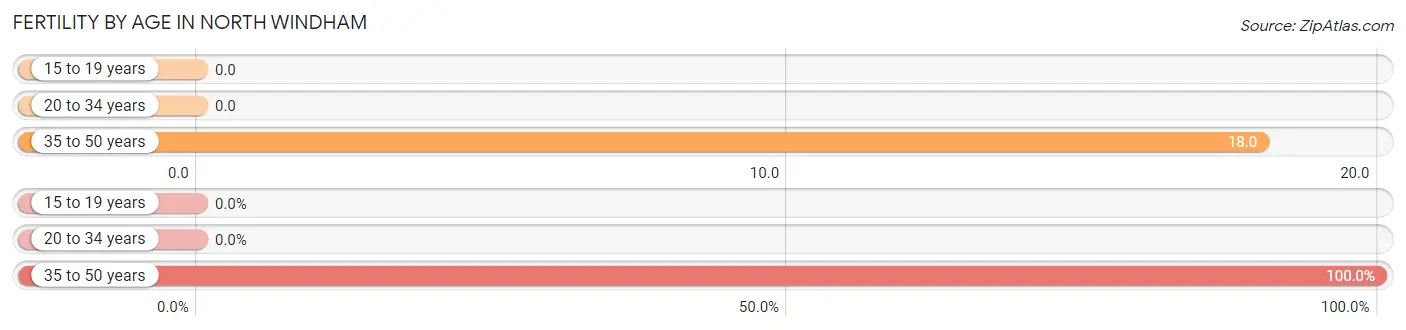
| Age Bracket | Women with Births | Births / 1,000 Women |
| 15 to 19 years | 0 (0.0%) | 0.0 |
| 20 to 34 years | 0 (0.0%) | 0.0 |
| 35 to 50 years | 16 (100.0%) | 18.0 |
| Total | 16 (100.0%) | 11.0 |
Fertility by Age by Marriage Status in North Windham
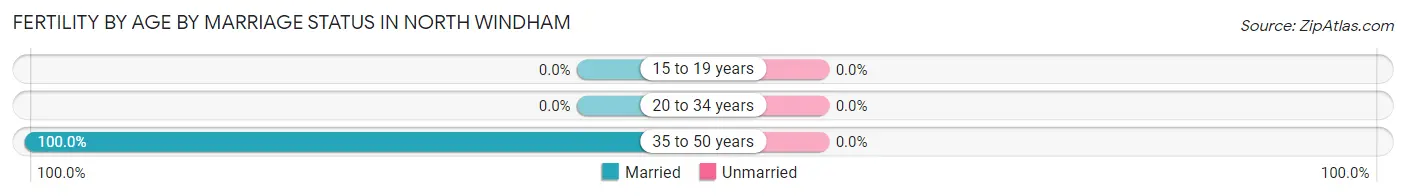
| Age Bracket | Married | Unmarried |
| 15 to 19 years | 0 (0.0%) | 0 (0.0%) |
| 20 to 34 years | 0 (0.0%) | 0 (0.0%) |
| 35 to 50 years | 16 (100.0%) | 0 (0.0%) |
| Total | 16 (100.0%) | 0 (0.0%) |
Fertility by Education in North Windham
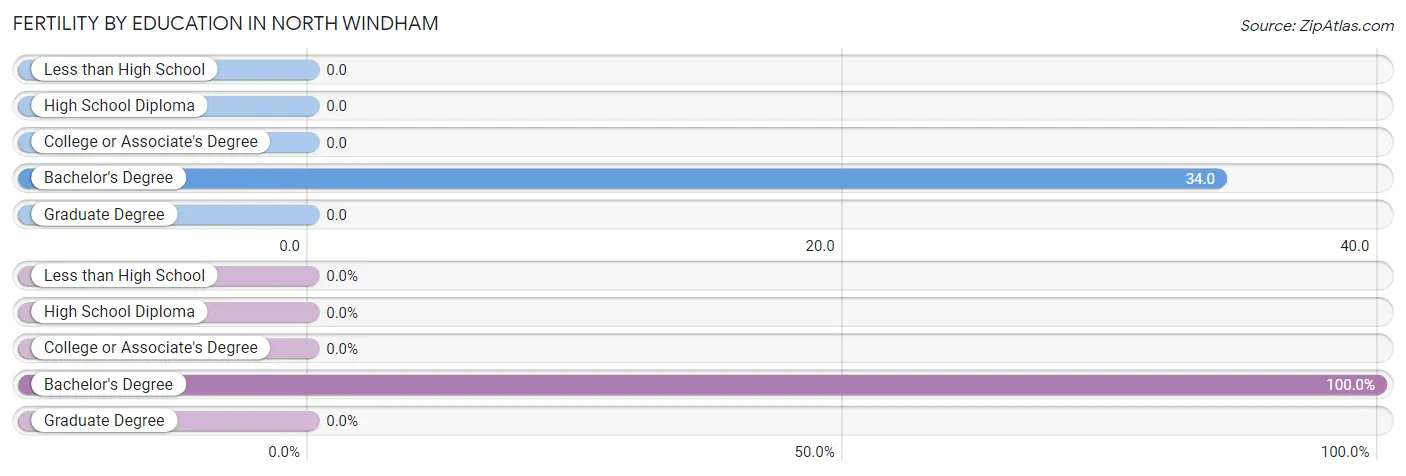
| Educational Attainment | Women with Births | Births / 1,000 Women |
| Less than High School | 0 (0.0%) | 0.0 |
| High School Diploma | 0 (0.0%) | 0.0 |
| College or Associate's Degree | 0 (0.0%) | 0.0 |
| Bachelor's Degree | 16 (100.0%) | 34.0 |
| Graduate Degree | 0 (0.0%) | 0.0 |
| Total | 16 (100.0%) | 11.0 |
Fertility by Education by Marriage Status in North Windham
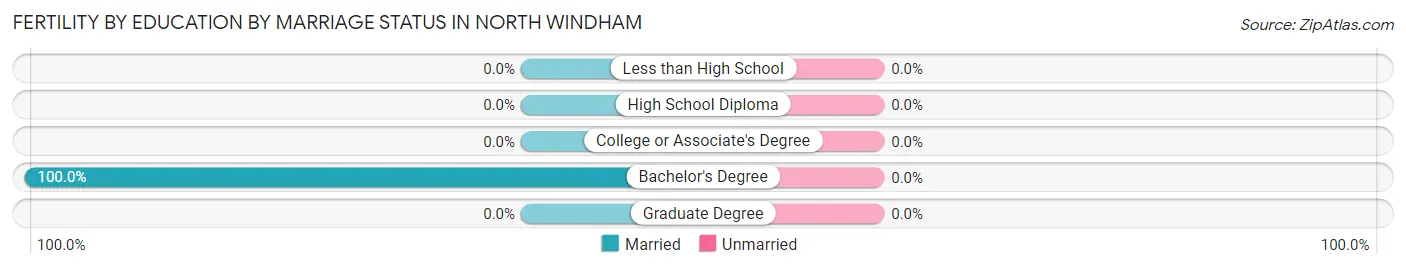
| Educational Attainment | Married | Unmarried |
| Less than High School | 0 (0.0%) | 0 (0.0%) |
| High School Diploma | 0 (0.0%) | 0 (0.0%) |
| College or Associate's Degree | 0 (0.0%) | 0 (0.0%) |
| Bachelor's Degree | 16 (100.0%) | 0 (0.0%) |
| Graduate Degree | 0 (0.0%) | 0 (0.0%) |
| Total | 16 (100.0%) | 0 (0.0%) |
Employment Characteristics in North Windham
Employment by Class of Employer in North Windham
Among the 3,232 employed individuals in North Windham, private company employees (2,097 | 64.9%), not-for-profit organizations (491 | 15.2%), and local government employees (212 | 6.6%) make up the most common classes of employment.
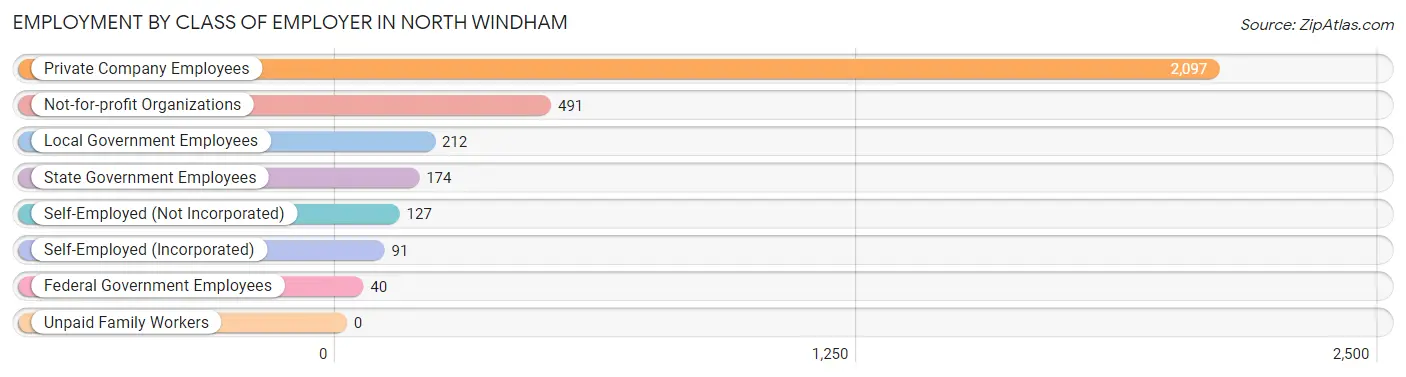
| Employer Class | # Employees | % Employees |
| Private Company Employees | 2,097 | 64.9% |
| Self-Employed (Incorporated) | 91 | 2.8% |
| Self-Employed (Not Incorporated) | 127 | 3.9% |
| Not-for-profit Organizations | 491 | 15.2% |
| Local Government Employees | 212 | 6.6% |
| State Government Employees | 174 | 5.4% |
| Federal Government Employees | 40 | 1.2% |
| Unpaid Family Workers | 0 | 0.0% |
| Total | 3,232 | 100.0% |
Employment Status by Age in North Windham
According to the labor force statistics for North Windham, out of the total population over 16 years of age (4,624), 71.1% or 3,288 individuals are in the labor force, with 1.3% or 43 of them unemployed. The age group with the highest labor force participation rate is 30 to 34 years, with 100.0% or 482 individuals in the labor force. Within the labor force, the 65 to 74 years age range has the highest percentage of unemployed individuals, with 3.7% or 9 of them being unemployed.
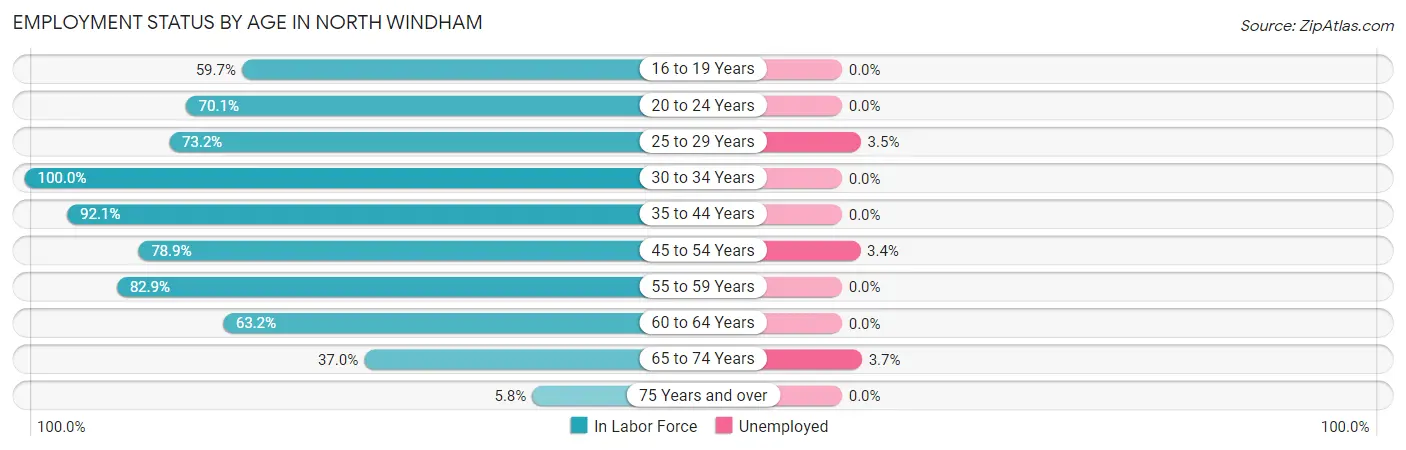
| Age Bracket | In Labor Force | Unemployed |
| 16 to 19 Years | 77 (59.7%) | 0 (0.0%) |
| 20 to 24 Years | 89 (70.1%) | 0 (0.0%) |
| 25 to 29 Years | 260 (73.2%) | 9 (3.5%) |
| 30 to 34 Years | 482 (100.0%) | 0 (0.0%) |
| 35 to 44 Years | 924 (92.1%) | 0 (0.0%) |
| 45 to 54 Years | 727 (78.9%) | 25 (3.4%) |
| 55 to 59 Years | 339 (82.9%) | 0 (0.0%) |
| 60 to 64 Years | 129 (63.2%) | 0 (0.0%) |
| 65 to 74 Years | 241 (37.0%) | 9 (3.7%) |
| 75 Years and over | 20 (5.8%) | 0 (0.0%) |
| Total | 3,288 (71.1%) | 43 (1.3%) |
Employment Status by Educational Attainment in North Windham
According to labor force statistics for North Windham, 84.8% of individuals (2,862) out of the total population between 25 and 64 years of age (3,375) are in the labor force, with 1.2% or 34 of them being unemployed. The group with the highest labor force participation rate are those with the educational attainment of less than high school, with 100.0% or 12 individuals in the labor force. Within the labor force, individuals with bachelor's degree or higher education have the highest percentage of unemployment, with 2.0% or 22 of them being unemployed.
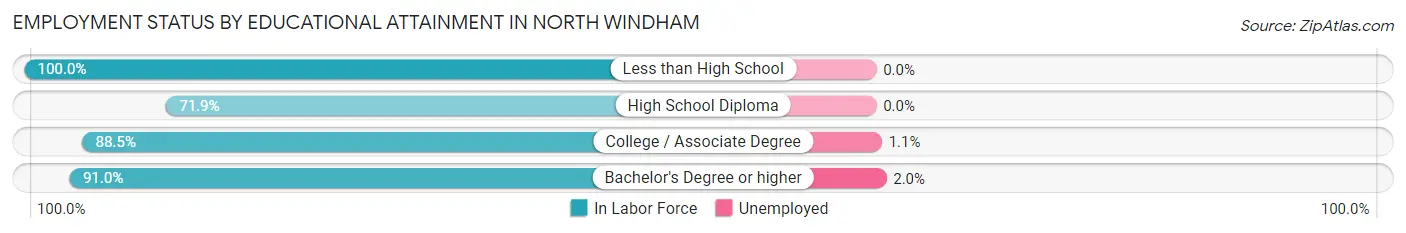
| Educational Attainment | In Labor Force | Unemployed |
| Less than High School | 12 (100.0%) | 0 (0.0%) |
| High School Diploma | 689 (71.9%) | 0 (0.0%) |
| College / Associate Degree | 1,035 (88.5%) | 13 (1.1%) |
| Bachelor's Degree or higher | 1,125 (91.0%) | 25 (2.0%) |
| Total | 2,862 (84.8%) | 40 (1.2%) |
Employment Occupations by Sex in North Windham
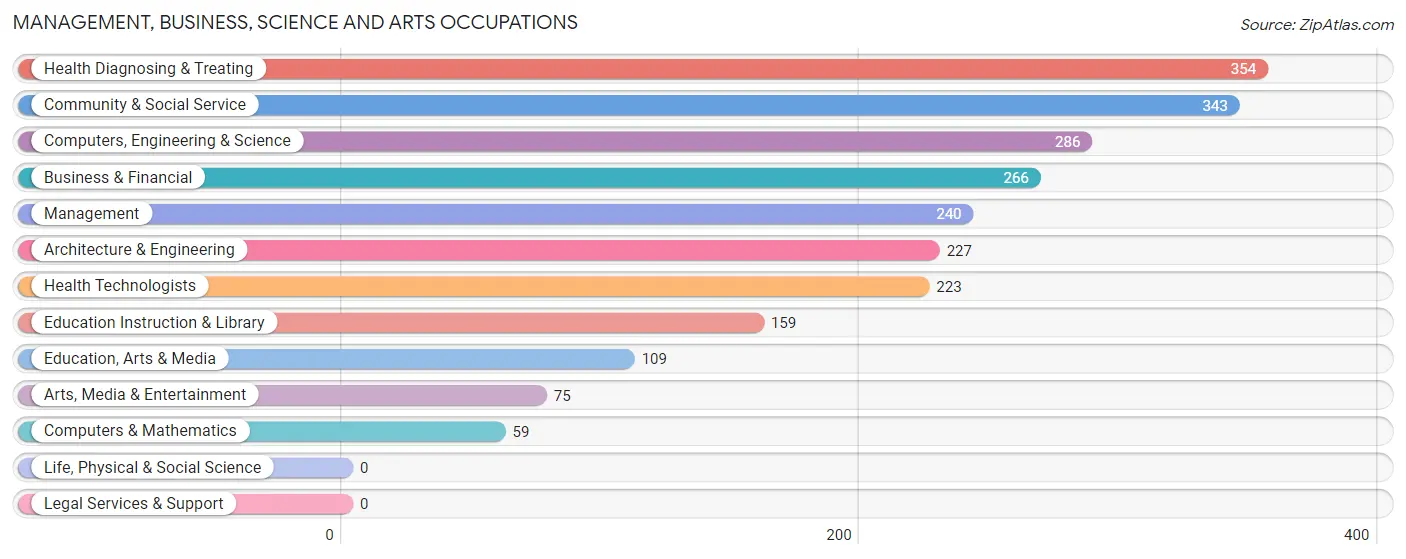
Management, Business, Science and Arts Occupations
The most common Management, Business, Science and Arts occupations in North Windham are Health Diagnosing & Treating (354 | 10.9%), Community & Social Service (343 | 10.6%), Computers, Engineering & Science (286 | 8.8%), Business & Financial (266 | 8.2%), and Management (240 | 7.4%).
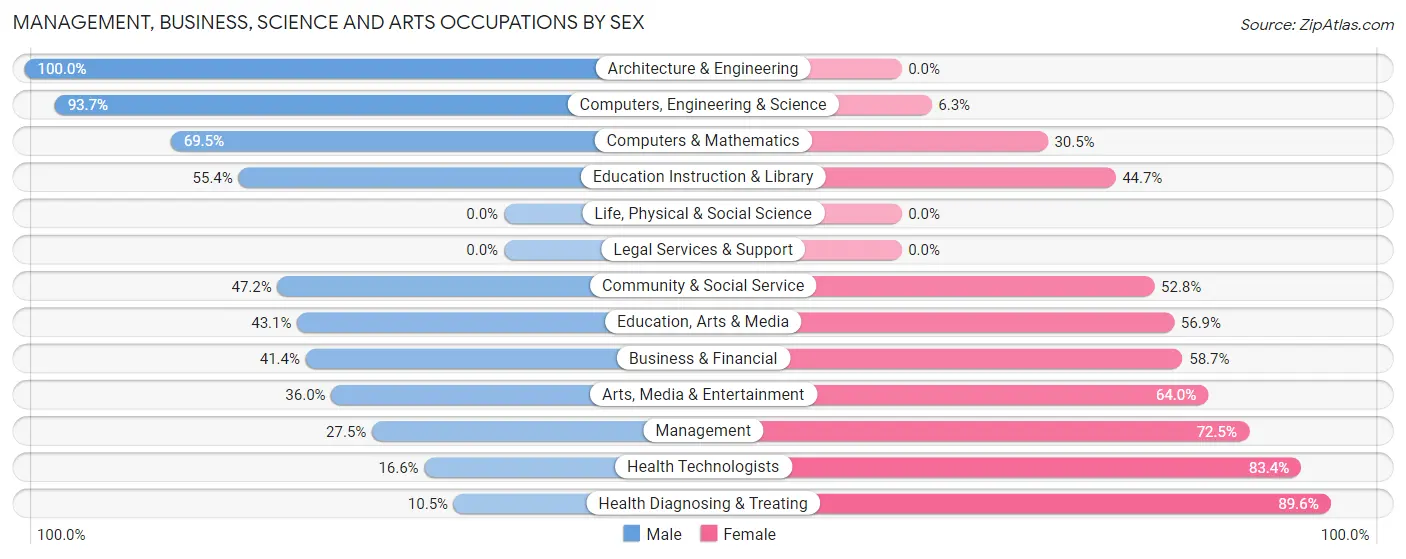
Management, Business, Science and Arts Occupations by Sex
Within the Management, Business, Science and Arts occupations in North Windham, the most male-oriented occupations are Architecture & Engineering (100.0%), Computers, Engineering & Science (93.7%), and Computers & Mathematics (69.5%), while the most female-oriented occupations are Health Diagnosing & Treating (89.5%), Health Technologists (83.4%), and Management (72.5%).
| Occupation | Male | Female |
| Management | 66 (27.5%) | 174 (72.5%) |
| Business & Financial | 110 (41.3%) | 156 (58.7%) |
| Computers, Engineering & Science | 268 (93.7%) | 18 (6.3%) |
| Computers & Mathematics | 41 (69.5%) | 18 (30.5%) |
| Architecture & Engineering | 227 (100.0%) | 0 (0.0%) |
| Life, Physical & Social Science | 0 (0.0%) | 0 (0.0%) |
| Community & Social Service | 162 (47.2%) | 181 (52.8%) |
| Education, Arts & Media | 47 (43.1%) | 62 (56.9%) |
| Legal Services & Support | 0 (0.0%) | 0 (0.0%) |
| Education Instruction & Library | 88 (55.3%) | 71 (44.7%) |
| Arts, Media & Entertainment | 27 (36.0%) | 48 (64.0%) |
| Health Diagnosing & Treating | 37 (10.4%) | 317 (89.5%) |
| Health Technologists | 37 (16.6%) | 186 (83.4%) |
| Total (Category) | 643 (43.2%) | 846 (56.8%) |
| Total (Overall) | 1,503 (46.3%) | 1,742 (53.7%) |
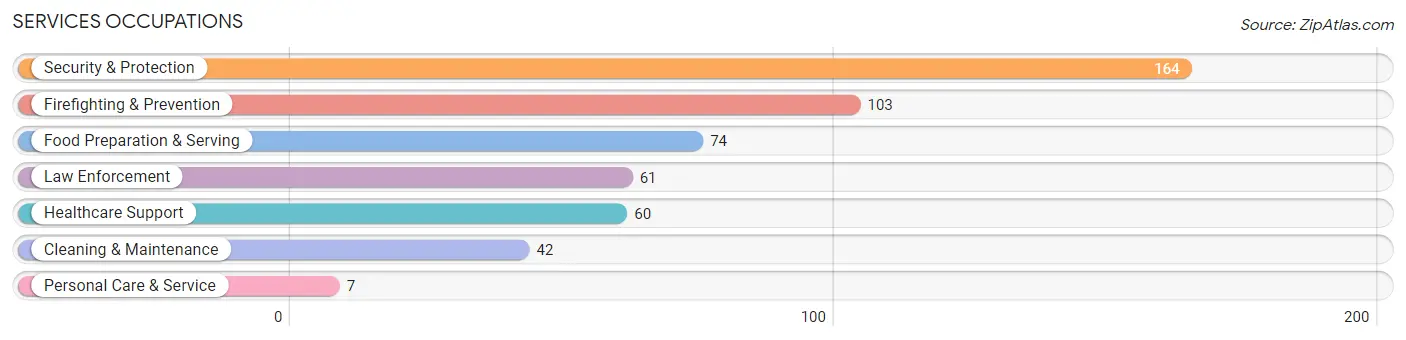
Services Occupations
The most common Services occupations in North Windham are Security & Protection (164 | 5.1%), Firefighting & Prevention (103 | 3.2%), Food Preparation & Serving (74 | 2.3%), Law Enforcement (61 | 1.9%), and Healthcare Support (60 | 1.8%).
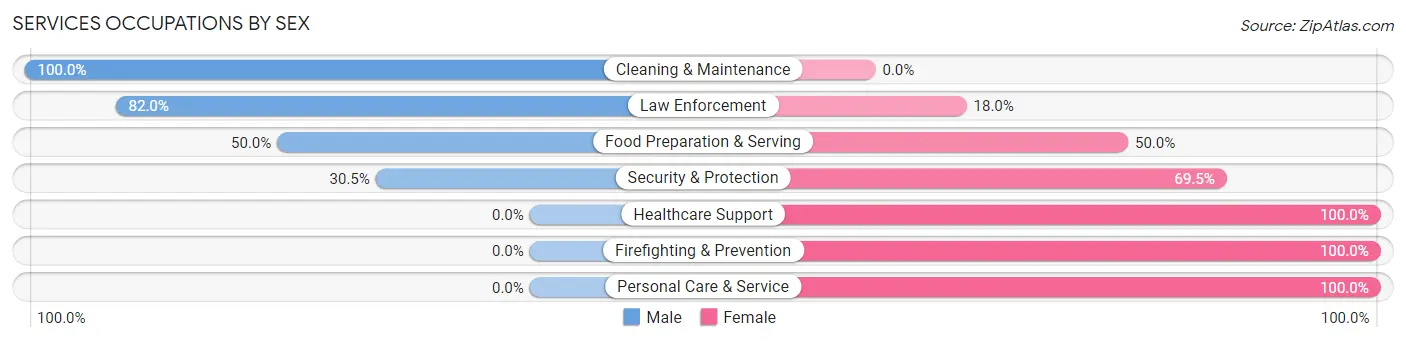
Services Occupations by Sex
Within the Services occupations in North Windham, the most male-oriented occupations are Cleaning & Maintenance (100.0%), Law Enforcement (82.0%), and Food Preparation & Serving (50.0%), while the most female-oriented occupations are Healthcare Support (100.0%), Firefighting & Prevention (100.0%), and Personal Care & Service (100.0%).
| Occupation | Male | Female |
| Healthcare Support | 0 (0.0%) | 60 (100.0%) |
| Security & Protection | 50 (30.5%) | 114 (69.5%) |
| Firefighting & Prevention | 0 (0.0%) | 103 (100.0%) |
| Law Enforcement | 50 (82.0%) | 11 (18.0%) |
| Food Preparation & Serving | 37 (50.0%) | 37 (50.0%) |
| Cleaning & Maintenance | 42 (100.0%) | 0 (0.0%) |
| Personal Care & Service | 0 (0.0%) | 7 (100.0%) |
| Total (Category) | 129 (37.2%) | 218 (62.8%) |
| Total (Overall) | 1,503 (46.3%) | 1,742 (53.7%) |
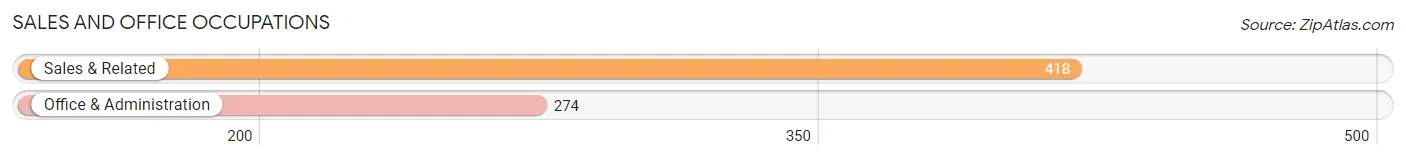
Sales and Office Occupations
The most common Sales and Office occupations in North Windham are Sales & Related (418 | 12.9%), and Office & Administration (274 | 8.4%).
Sales and Office Occupations by Sex
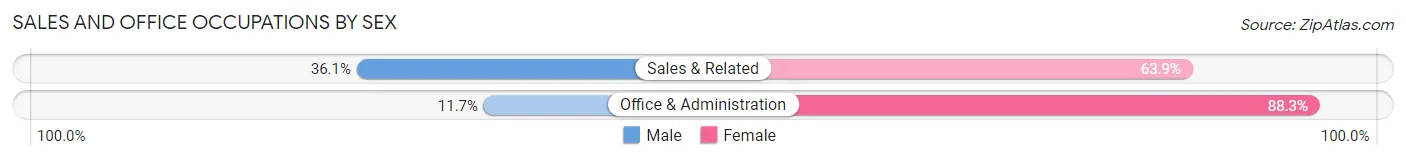
| Occupation | Male | Female |
| Sales & Related | 151 (36.1%) | 267 (63.9%) |
| Office & Administration | 32 (11.7%) | 242 (88.3%) |
| Total (Category) | 183 (26.5%) | 509 (73.6%) |
| Total (Overall) | 1,503 (46.3%) | 1,742 (53.7%) |
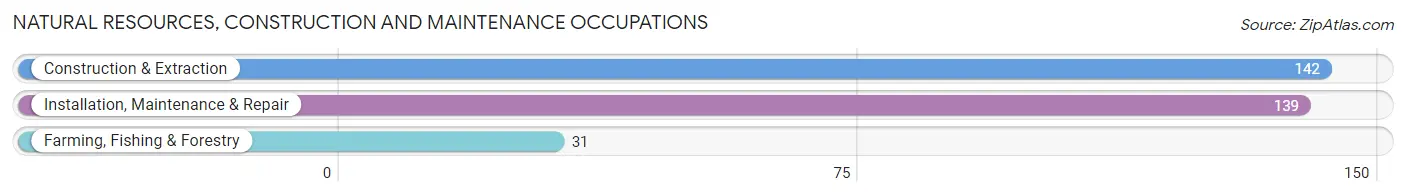
Natural Resources, Construction and Maintenance Occupations
The most common Natural Resources, Construction and Maintenance occupations in North Windham are Construction & Extraction (142 | 4.4%), Installation, Maintenance & Repair (139 | 4.3%), and Farming, Fishing & Forestry (31 | 1.0%).
Natural Resources, Construction and Maintenance Occupations by Sex
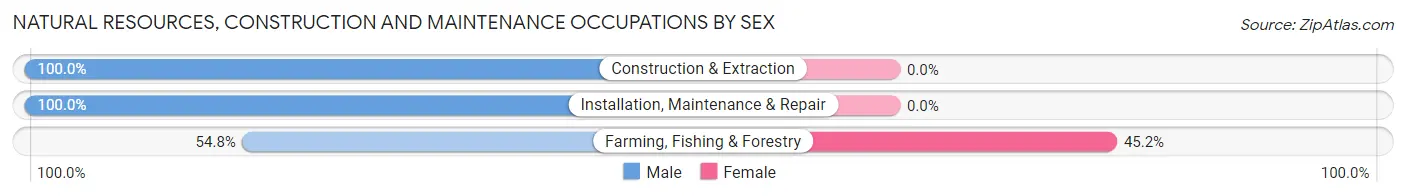
| Occupation | Male | Female |
| Farming, Fishing & Forestry | 17 (54.8%) | 14 (45.2%) |
| Construction & Extraction | 142 (100.0%) | 0 (0.0%) |
| Installation, Maintenance & Repair | 139 (100.0%) | 0 (0.0%) |
| Total (Category) | 298 (95.5%) | 14 (4.5%) |
| Total (Overall) | 1,503 (46.3%) | 1,742 (53.7%) |
Production, Transportation and Moving Occupations
The most common Production, Transportation and Moving occupations in North Windham are Transportation (174 | 5.4%), Production (135 | 4.2%), and Material Moving (96 | 3.0%).
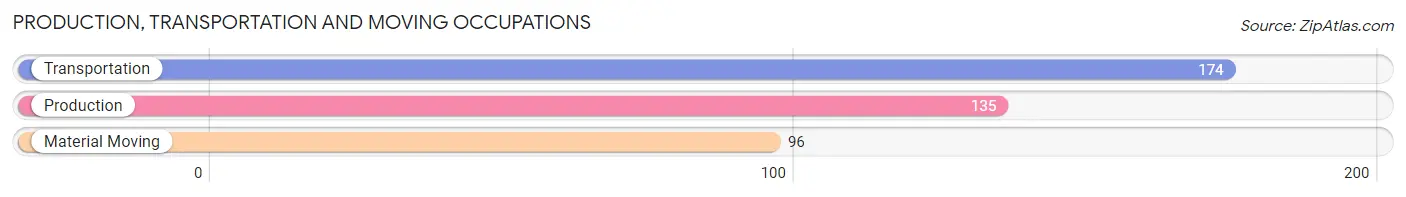
Production, Transportation and Moving Occupations by Sex
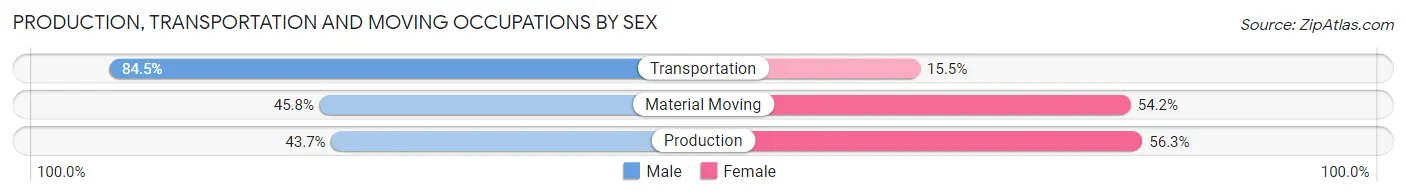
| Occupation | Male | Female |
| Production | 59 (43.7%) | 76 (56.3%) |
| Transportation | 147 (84.5%) | 27 (15.5%) |
| Material Moving | 44 (45.8%) | 52 (54.2%) |
| Total (Category) | 250 (61.7%) | 155 (38.3%) |
| Total (Overall) | 1,503 (46.3%) | 1,742 (53.7%) |
Employment Industries by Sex in North Windham
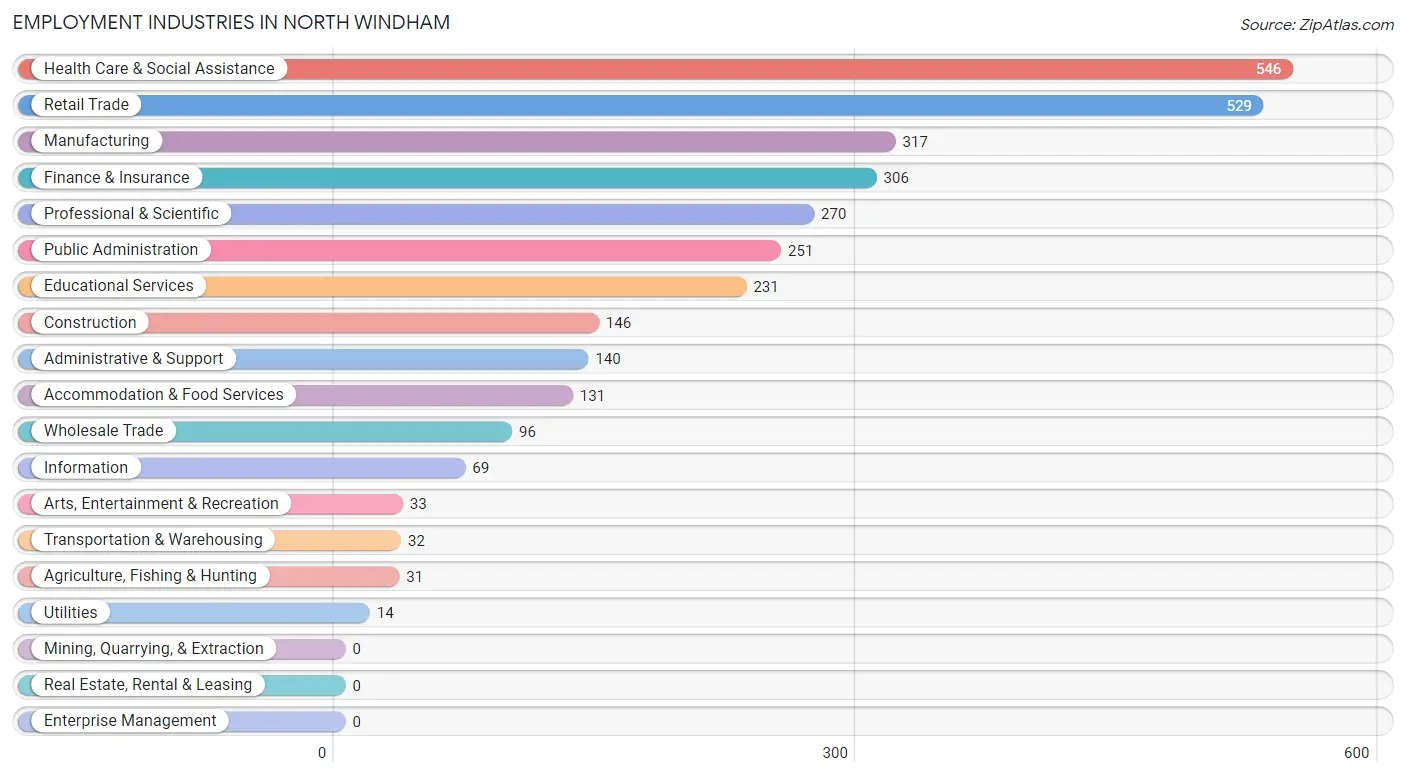
Employment Industries in North Windham
The major employment industries in North Windham include Health Care & Social Assistance (546 | 16.8%), Retail Trade (529 | 16.3%), Manufacturing (317 | 9.8%), Finance & Insurance (306 | 9.4%), and Professional & Scientific (270 | 8.3%).
Employment Industries by Sex in North Windham
The North Windham industries that see more men than women are Utilities (100.0%), Construction (97.3%), and Public Administration (77.7%), whereas the industries that tend to have a higher number of women are Information (100.0%), Health Care & Social Assistance (89.9%), and Finance & Insurance (78.8%).
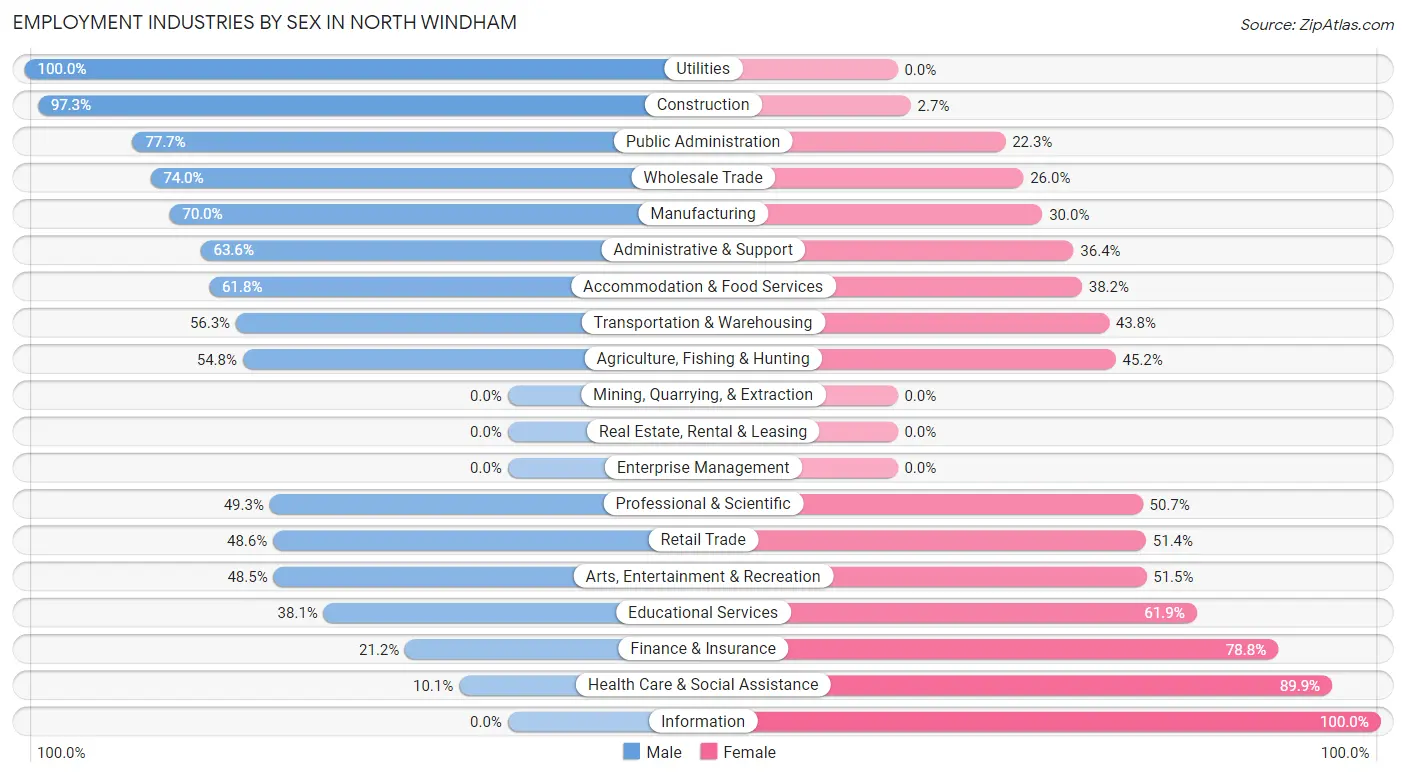
| Industry | Male | Female |
| Agriculture, Fishing & Hunting | 17 (54.8%) | 14 (45.2%) |
| Mining, Quarrying, & Extraction | 0 (0.0%) | 0 (0.0%) |
| Construction | 142 (97.3%) | 4 (2.7%) |
| Manufacturing | 222 (70.0%) | 95 (30.0%) |
| Wholesale Trade | 71 (74.0%) | 25 (26.0%) |
| Retail Trade | 257 (48.6%) | 272 (51.4%) |
| Transportation & Warehousing | 18 (56.2%) | 14 (43.8%) |
| Utilities | 14 (100.0%) | 0 (0.0%) |
| Information | 0 (0.0%) | 69 (100.0%) |
| Finance & Insurance | 65 (21.2%) | 241 (78.8%) |
| Real Estate, Rental & Leasing | 0 (0.0%) | 0 (0.0%) |
| Professional & Scientific | 133 (49.3%) | 137 (50.7%) |
| Enterprise Management | 0 (0.0%) | 0 (0.0%) |
| Administrative & Support | 89 (63.6%) | 51 (36.4%) |
| Educational Services | 88 (38.1%) | 143 (61.9%) |
| Health Care & Social Assistance | 55 (10.1%) | 491 (89.9%) |
| Arts, Entertainment & Recreation | 16 (48.5%) | 17 (51.5%) |
| Accommodation & Food Services | 81 (61.8%) | 50 (38.2%) |
| Public Administration | 195 (77.7%) | 56 (22.3%) |
| Total | 1,503 (46.3%) | 1,742 (53.7%) |
Education in North Windham
School Enrollment in North Windham
The most common levels of schooling among the 958 students in North Windham are middle school (260 | 27.1%), elementary school (202 | 21.1%), and college / undergraduate (165 | 17.2%).
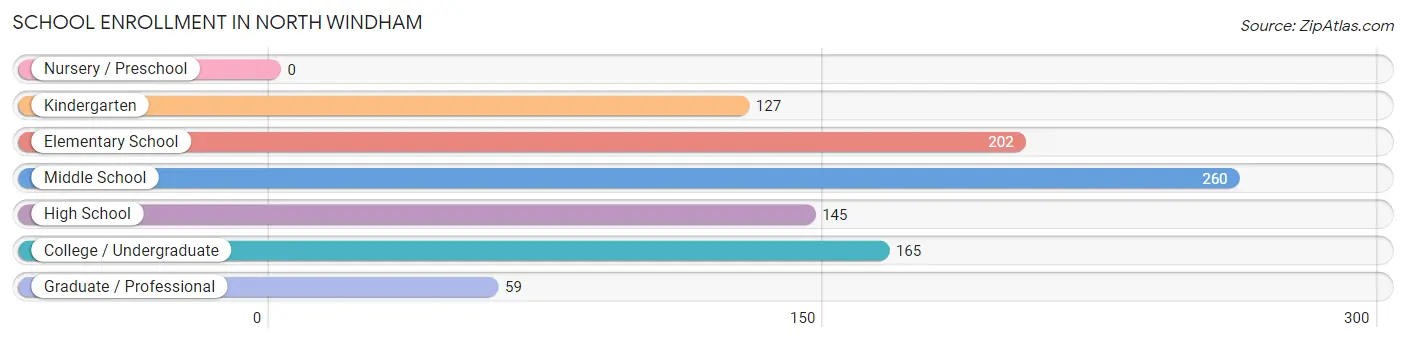
| School Level | # Students | % Students |
| Nursery / Preschool | 0 | 0.0% |
| Kindergarten | 127 | 13.3% |
| Elementary School | 202 | 21.1% |
| Middle School | 260 | 27.1% |
| High School | 145 | 15.1% |
| College / Undergraduate | 165 | 17.2% |
| Graduate / Professional | 59 | 6.2% |
| Total | 958 | 100.0% |
School Enrollment by Age by Funding Source in North Windham
Out of a total of 958 students who are enrolled in schools in North Windham, 10 (1.0%) attend a private institution, while the remaining 948 (99.0%) are enrolled in public schools. The age group of 35 years and over has the highest likelihood of being enrolled in private schools, with 10 (14.5% in the age bracket) enrolled. Conversely, the age group of 5 to 9 year old has the lowest likelihood of being enrolled in a private school, with 317 (100.0% in the age bracket) attending a public institution.
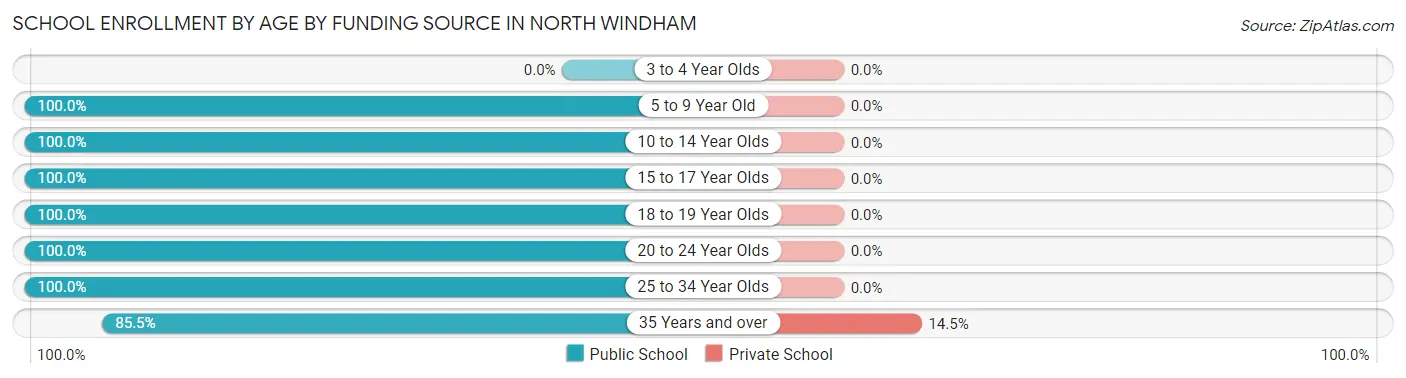
| Age Bracket | Public School | Private School |
| 3 to 4 Year Olds | 0 (0.0%) | 0 (0.0%) |
| 5 to 9 Year Old | 317 (100.0%) | 0 (0.0%) |
| 10 to 14 Year Olds | 284 (100.0%) | 0 (0.0%) |
| 15 to 17 Year Olds | 80 (100.0%) | 0 (0.0%) |
| 18 to 19 Year Olds | 90 (100.0%) | 0 (0.0%) |
| 20 to 24 Year Olds | 57 (100.0%) | 0 (0.0%) |
| 25 to 34 Year Olds | 61 (100.0%) | 0 (0.0%) |
| 35 Years and over | 59 (85.5%) | 10 (14.5%) |
| Total | 948 (99.0%) | 10 (1.0%) |
Educational Attainment by Field of Study in North Windham
Science & technology (335 | 19.2%), literature & languages (243 | 13.9%), arts & humanities (218 | 12.5%), psychology (173 | 9.9%), and social sciences (149 | 8.6%) are the most common fields of study among 1,743 individuals in North Windham who have obtained a bachelor's degree or higher.
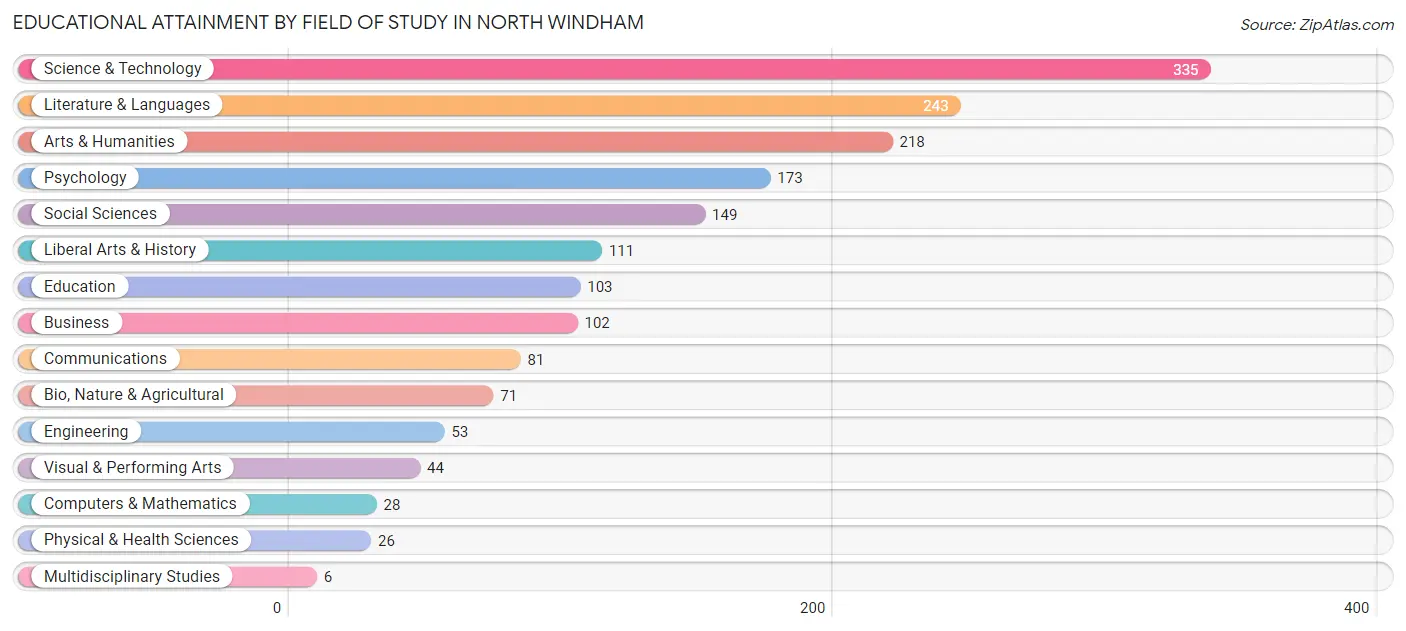
| Field of Study | # Graduates | % Graduates |
| Computers & Mathematics | 28 | 1.6% |
| Bio, Nature & Agricultural | 71 | 4.1% |
| Physical & Health Sciences | 26 | 1.5% |
| Psychology | 173 | 9.9% |
| Social Sciences | 149 | 8.6% |
| Engineering | 53 | 3.0% |
| Multidisciplinary Studies | 6 | 0.3% |
| Science & Technology | 335 | 19.2% |
| Business | 102 | 5.9% |
| Education | 103 | 5.9% |
| Literature & Languages | 243 | 13.9% |
| Liberal Arts & History | 111 | 6.4% |
| Visual & Performing Arts | 44 | 2.5% |
| Communications | 81 | 4.6% |
| Arts & Humanities | 218 | 12.5% |
| Total | 1,743 | 100.0% |
Transportation & Commute in North Windham
Vehicle Availability by Sex in North Windham
The most prevalent vehicle ownership categories in North Windham are males with 2 vehicles (900, accounting for 59.9%) and females with 2 vehicles (955, making up 52.0%).
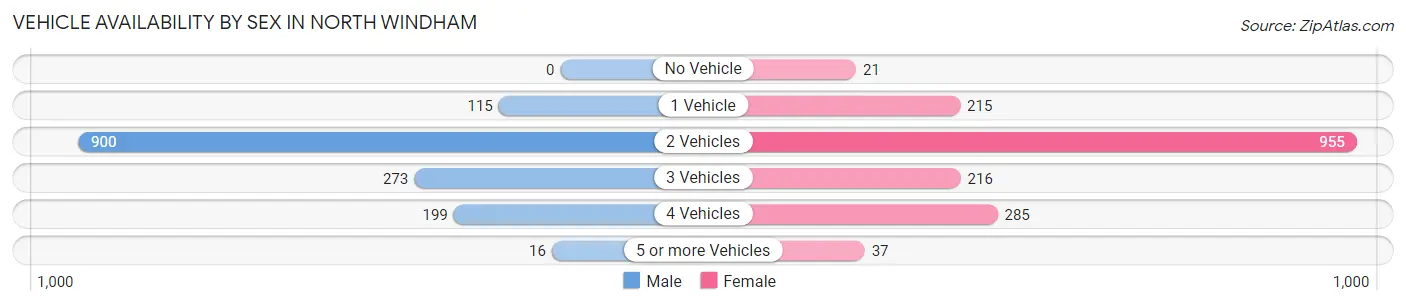
| Vehicles Available | Male | Female |
| No Vehicle | 0 (0.0%) | 21 (1.2%) |
| 1 Vehicle | 115 (7.6%) | 215 (12.4%) |
| 2 Vehicles | 900 (59.9%) | 955 (55.2%) |
| 3 Vehicles | 273 (18.2%) | 216 (12.5%) |
| 4 Vehicles | 199 (13.2%) | 285 (16.5%) |
| 5 or more Vehicles | 16 (1.1%) | 37 (2.1%) |
| Total | 1,503 (100.0%) | 1,729 (100.0%) |
Commute Time in North Windham
The most frequently occuring commute durations in North Windham are 30 to 34 minutes (442 commuters, 15.4%), 45 to 59 minutes (392 commuters, 13.6%), and 5 to 9 minutes (350 commuters, 12.2%).
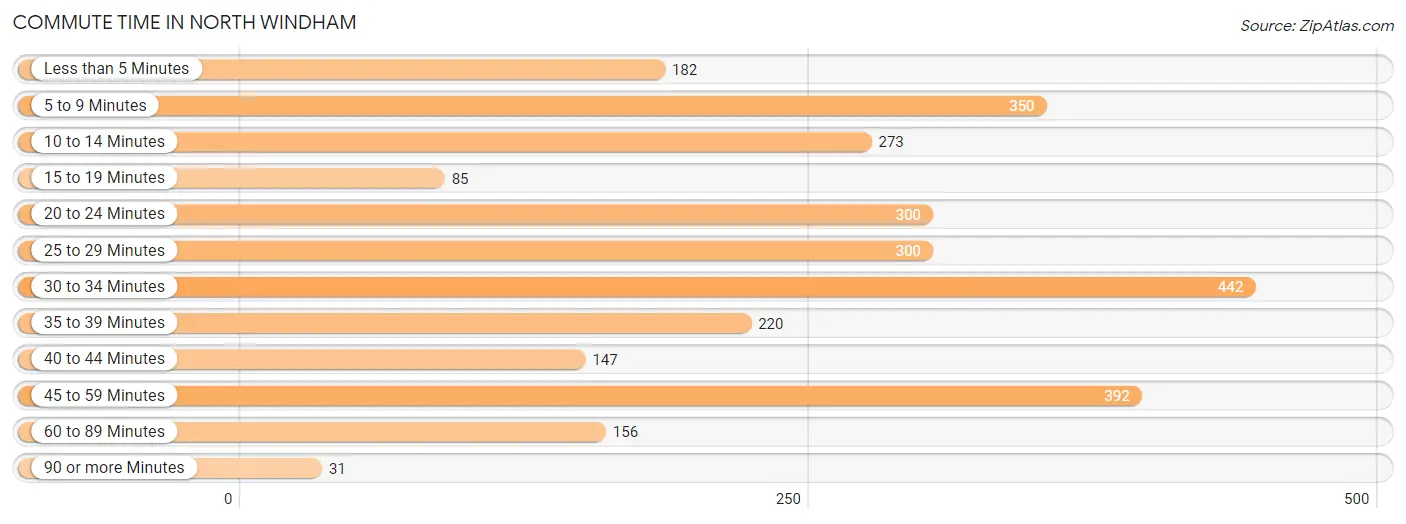
| Commute Time | # Commuters | % Commuters |
| Less than 5 Minutes | 182 | 6.3% |
| 5 to 9 Minutes | 350 | 12.2% |
| 10 to 14 Minutes | 273 | 9.5% |
| 15 to 19 Minutes | 85 | 2.9% |
| 20 to 24 Minutes | 300 | 10.4% |
| 25 to 29 Minutes | 300 | 10.4% |
| 30 to 34 Minutes | 442 | 15.4% |
| 35 to 39 Minutes | 220 | 7.6% |
| 40 to 44 Minutes | 147 | 5.1% |
| 45 to 59 Minutes | 392 | 13.6% |
| 60 to 89 Minutes | 156 | 5.4% |
| 90 or more Minutes | 31 | 1.1% |
Commute Time by Sex in North Windham
The most common commute times in North Windham are 30 to 34 minutes (277 commuters, 19.9%) for males and 5 to 9 minutes (258 commuters, 17.4%) for females.
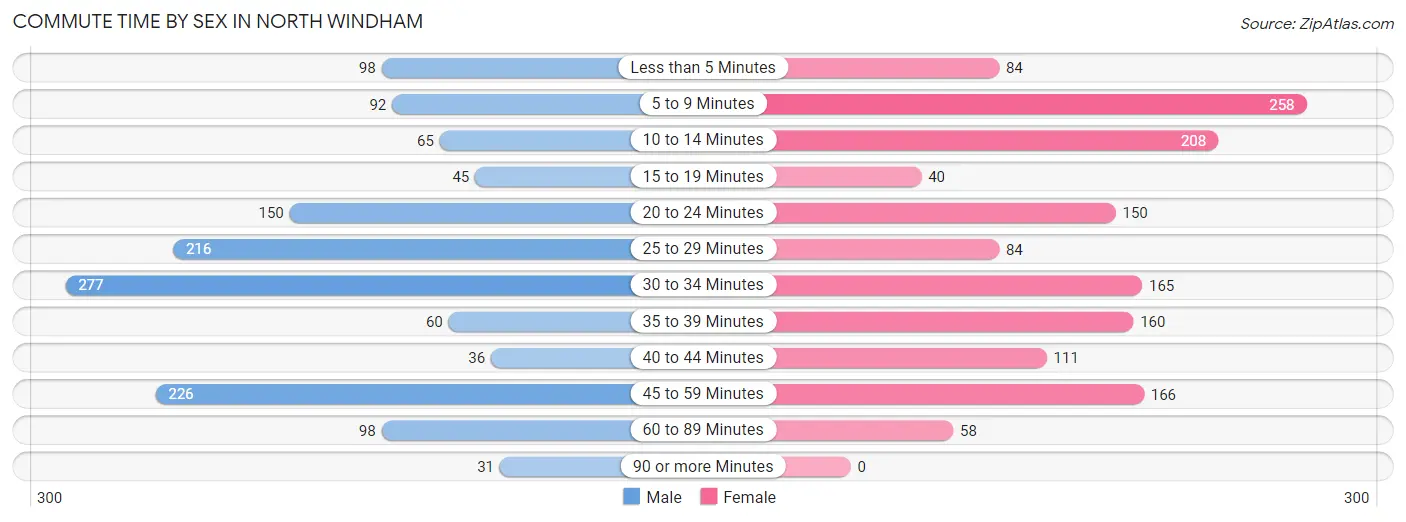
| Commute Time | Male | Female |
| Less than 5 Minutes | 98 (7.0%) | 84 (5.7%) |
| 5 to 9 Minutes | 92 (6.6%) | 258 (17.4%) |
| 10 to 14 Minutes | 65 (4.7%) | 208 (14.0%) |
| 15 to 19 Minutes | 45 (3.2%) | 40 (2.7%) |
| 20 to 24 Minutes | 150 (10.8%) | 150 (10.1%) |
| 25 to 29 Minutes | 216 (15.5%) | 84 (5.7%) |
| 30 to 34 Minutes | 277 (19.9%) | 165 (11.1%) |
| 35 to 39 Minutes | 60 (4.3%) | 160 (10.8%) |
| 40 to 44 Minutes | 36 (2.6%) | 111 (7.5%) |
| 45 to 59 Minutes | 226 (16.2%) | 166 (11.2%) |
| 60 to 89 Minutes | 98 (7.0%) | 58 (3.9%) |
| 90 or more Minutes | 31 (2.2%) | 0 (0.0%) |
Time of Departure to Work by Sex in North Windham
The most frequent times of departure to work in North Windham are 7:00 AM to 7:29 AM (310, 22.2%) for males and 7:30 AM to 7:59 AM (376, 25.3%) for females.
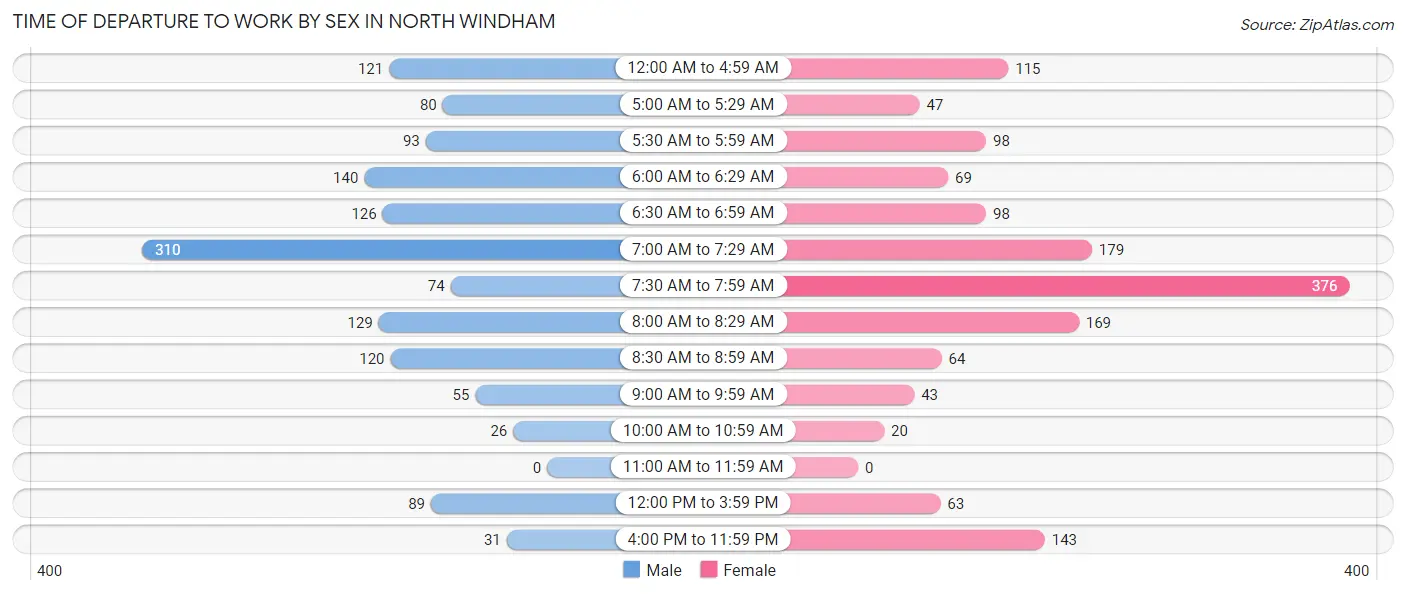
| Time of Departure | Male | Female |
| 12:00 AM to 4:59 AM | 121 (8.7%) | 115 (7.7%) |
| 5:00 AM to 5:29 AM | 80 (5.7%) | 47 (3.2%) |
| 5:30 AM to 5:59 AM | 93 (6.7%) | 98 (6.6%) |
| 6:00 AM to 6:29 AM | 140 (10.0%) | 69 (4.6%) |
| 6:30 AM to 6:59 AM | 126 (9.0%) | 98 (6.6%) |
| 7:00 AM to 7:29 AM | 310 (22.2%) | 179 (12.1%) |
| 7:30 AM to 7:59 AM | 74 (5.3%) | 376 (25.3%) |
| 8:00 AM to 8:29 AM | 129 (9.2%) | 169 (11.4%) |
| 8:30 AM to 8:59 AM | 120 (8.6%) | 64 (4.3%) |
| 9:00 AM to 9:59 AM | 55 (4.0%) | 43 (2.9%) |
| 10:00 AM to 10:59 AM | 26 (1.9%) | 20 (1.3%) |
| 11:00 AM to 11:59 AM | 0 (0.0%) | 0 (0.0%) |
| 12:00 PM to 3:59 PM | 89 (6.4%) | 63 (4.3%) |
| 4:00 PM to 11:59 PM | 31 (2.2%) | 143 (9.6%) |
| Total | 1,394 (100.0%) | 1,484 (100.0%) |
Housing Occupancy in North Windham
Occupancy by Ownership in North Windham
Of the total 2,294 dwellings in North Windham, owner-occupied units account for 1,834 (79.9%), while renter-occupied units make up 460 (20.1%).
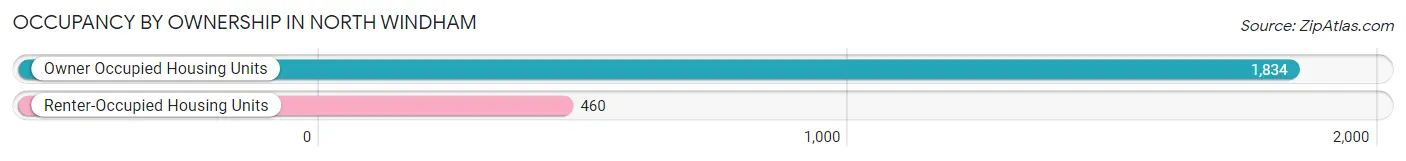
| Occupancy | # Housing Units | % Housing Units |
| Owner Occupied Housing Units | 1,834 | 79.9% |
| Renter-Occupied Housing Units | 460 | 20.1% |
| Total Occupied Housing Units | 2,294 | 100.0% |
Occupancy by Household Size in North Windham
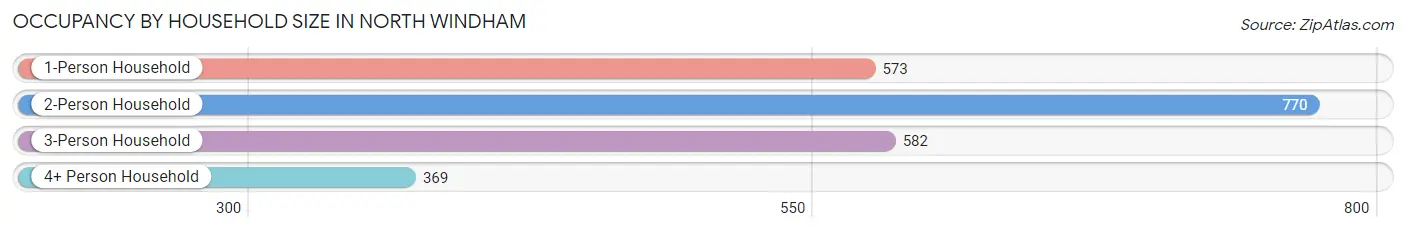
| Household Size | # Housing Units | % Housing Units |
| 1-Person Household | 573 | 25.0% |
| 2-Person Household | 770 | 33.6% |
| 3-Person Household | 582 | 25.4% |
| 4+ Person Household | 369 | 16.1% |
| Total Housing Units | 2,294 | 100.0% |
Occupancy by Ownership by Household Size in North Windham
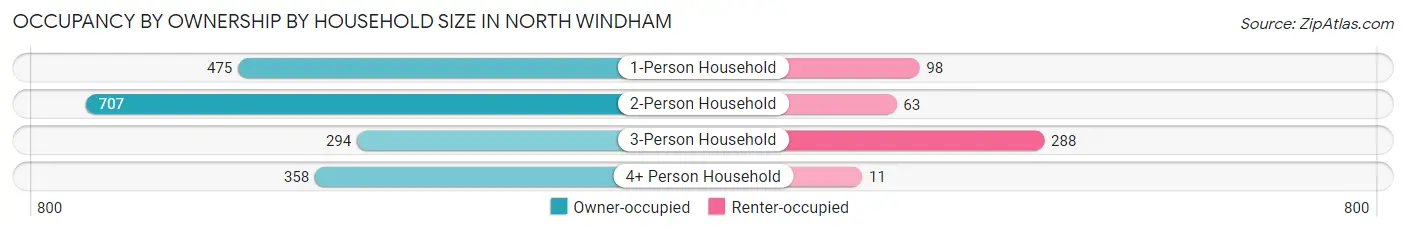
| Household Size | Owner-occupied | Renter-occupied |
| 1-Person Household | 475 (82.9%) | 98 (17.1%) |
| 2-Person Household | 707 (91.8%) | 63 (8.2%) |
| 3-Person Household | 294 (50.5%) | 288 (49.5%) |
| 4+ Person Household | 358 (97.0%) | 11 (3.0%) |
| Total Housing Units | 1,834 (79.9%) | 460 (20.1%) |
Occupancy by Educational Attainment in North Windham
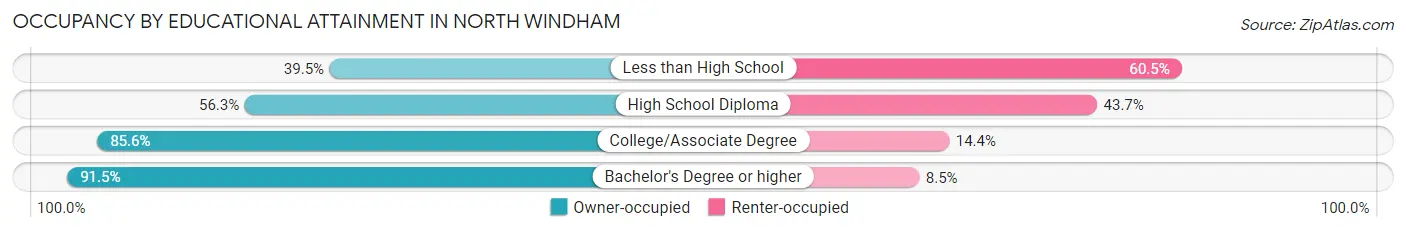
| Household Size | Owner-occupied | Renter-occupied |
| Less than High School | 15 (39.5%) | 23 (60.5%) |
| High School Diploma | 322 (56.3%) | 250 (43.7%) |
| College/Associate Degree | 642 (85.6%) | 108 (14.4%) |
| Bachelor's Degree or higher | 855 (91.5%) | 79 (8.5%) |
Occupancy by Age of Householder in North Windham
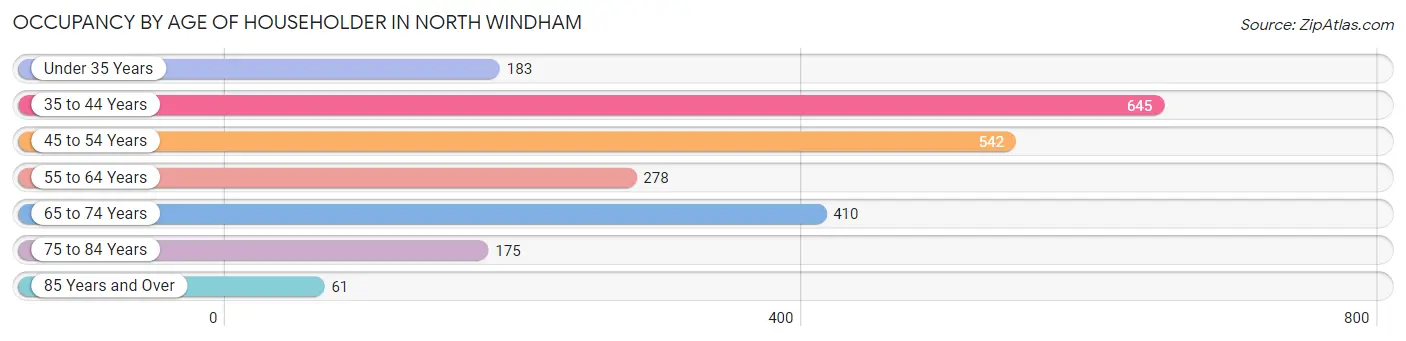
| Age Bracket | # Households | % Households |
| Under 35 Years | 183 | 8.0% |
| 35 to 44 Years | 645 | 28.1% |
| 45 to 54 Years | 542 | 23.6% |
| 55 to 64 Years | 278 | 12.1% |
| 65 to 74 Years | 410 | 17.9% |
| 75 to 84 Years | 175 | 7.6% |
| 85 Years and Over | 61 | 2.7% |
| Total | 2,294 | 100.0% |
Housing Finances in North Windham
Median Income by Occupancy in North Windham
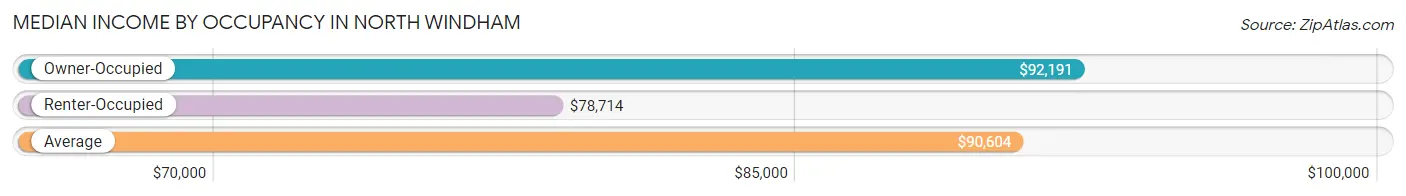
| Occupancy Type | # Households | Median Income |
| Owner-Occupied | 1,834 (79.9%) | $92,191 |
| Renter-Occupied | 460 (20.1%) | $78,714 |
| Average | 2,294 (100.0%) | $90,604 |
Occupancy by Householder Income Bracket in North Windham
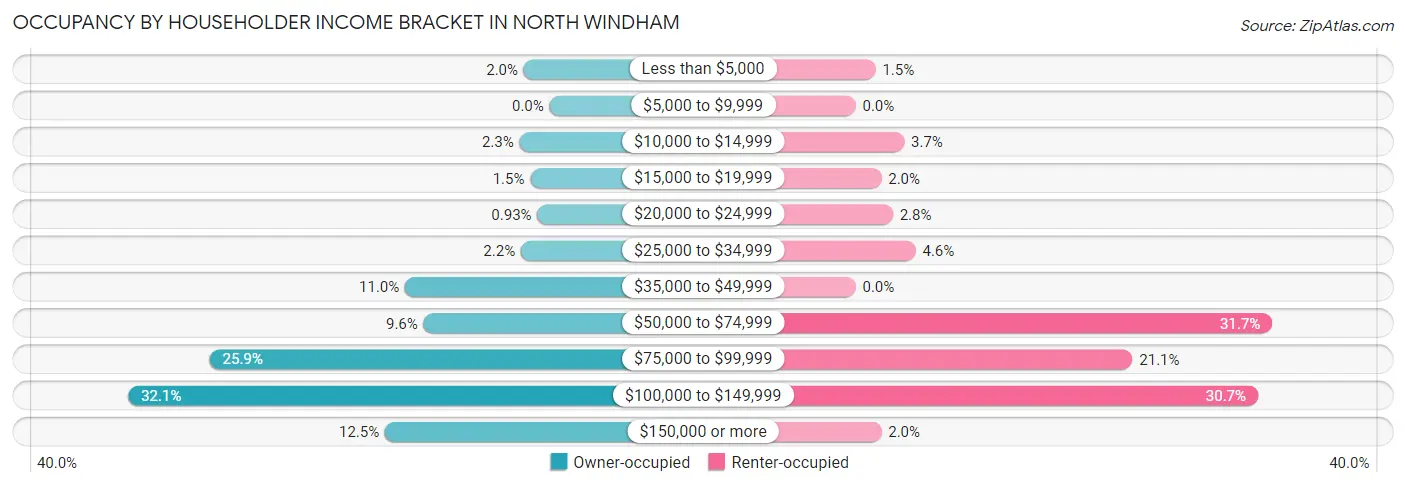
| Income Bracket | Owner-occupied | Renter-occupied |
| Less than $5,000 | 36 (2.0%) | 7 (1.5%) |
| $5,000 to $9,999 | 0 (0.0%) | 0 (0.0%) |
| $10,000 to $14,999 | 42 (2.3%) | 17 (3.7%) |
| $15,000 to $19,999 | 27 (1.5%) | 9 (2.0%) |
| $20,000 to $24,999 | 17 (0.9%) | 13 (2.8%) |
| $25,000 to $34,999 | 40 (2.2%) | 21 (4.6%) |
| $35,000 to $49,999 | 202 (11.0%) | 0 (0.0%) |
| $50,000 to $74,999 | 176 (9.6%) | 146 (31.7%) |
| $75,000 to $99,999 | 475 (25.9%) | 97 (21.1%) |
| $100,000 to $149,999 | 589 (32.1%) | 141 (30.6%) |
| $150,000 or more | 230 (12.5%) | 9 (2.0%) |
| Total | 1,834 (100.0%) | 460 (100.0%) |
Monthly Housing Cost Tiers in North Windham
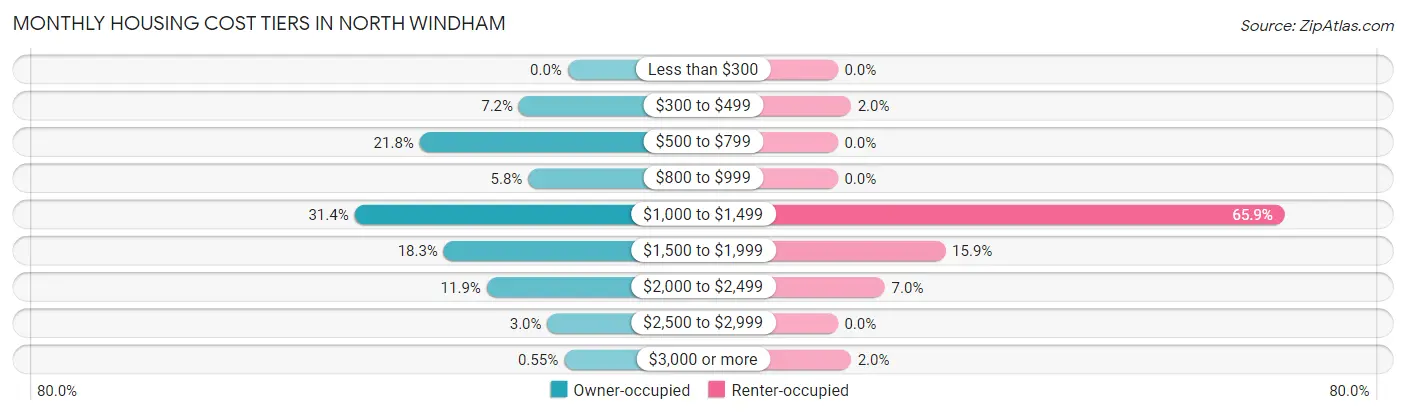
| Monthly Cost | Owner-occupied | Renter-occupied |
| Less than $300 | 0 (0.0%) | 0 (0.0%) |
| $300 to $499 | 132 (7.2%) | 9 (2.0%) |
| $500 to $799 | 400 (21.8%) | 0 (0.0%) |
| $800 to $999 | 107 (5.8%) | 0 (0.0%) |
| $1,000 to $1,499 | 576 (31.4%) | 303 (65.9%) |
| $1,500 to $1,999 | 335 (18.3%) | 73 (15.9%) |
| $2,000 to $2,499 | 219 (11.9%) | 32 (7.0%) |
| $2,500 to $2,999 | 55 (3.0%) | 0 (0.0%) |
| $3,000 or more | 10 (0.5%) | 9 (2.0%) |
| Total | 1,834 (100.0%) | 460 (100.0%) |
Physical Housing Characteristics in North Windham
Housing Structures in North Windham
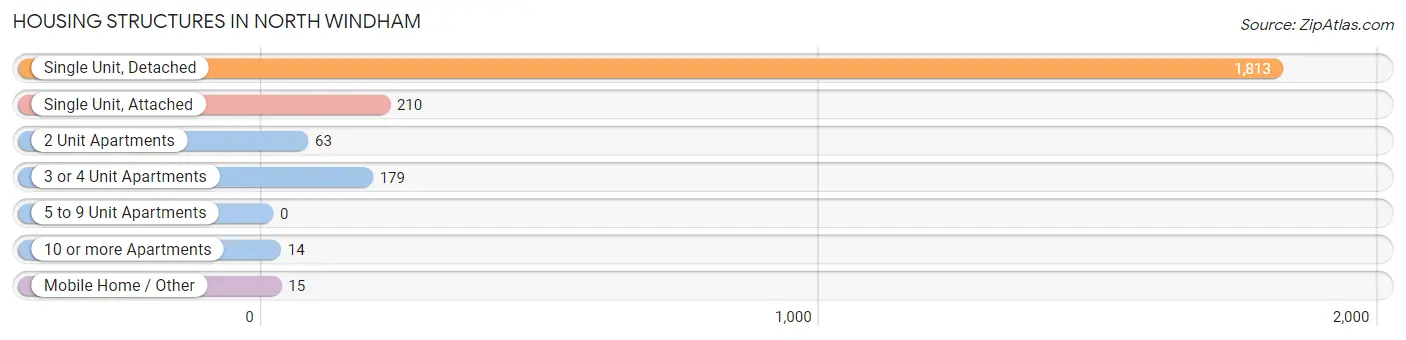
| Structure Type | # Housing Units | % Housing Units |
| Single Unit, Detached | 1,813 | 79.0% |
| Single Unit, Attached | 210 | 9.1% |
| 2 Unit Apartments | 63 | 2.8% |
| 3 or 4 Unit Apartments | 179 | 7.8% |
| 5 to 9 Unit Apartments | 0 | 0.0% |
| 10 or more Apartments | 14 | 0.6% |
| Mobile Home / Other | 15 | 0.6% |
| Total | 2,294 | 100.0% |
Housing Structures by Occupancy in North Windham
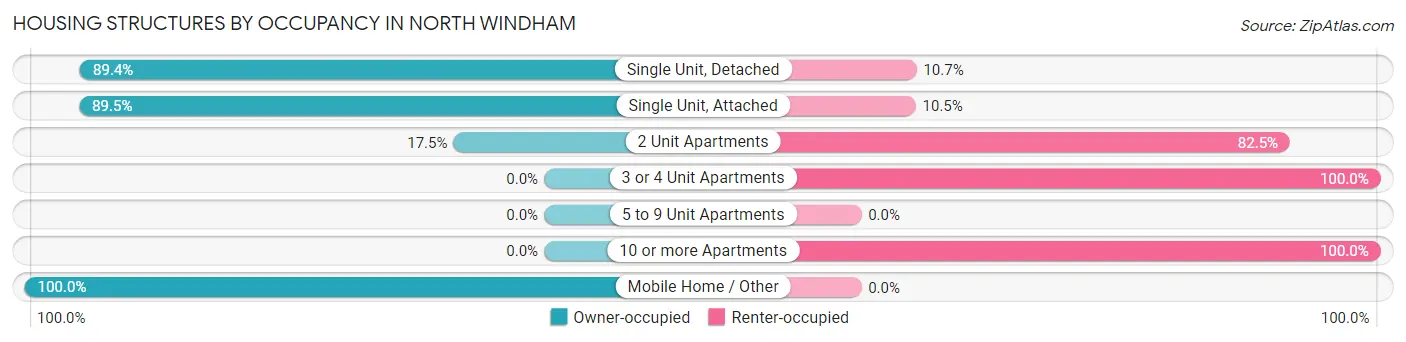
| Structure Type | Owner-occupied | Renter-occupied |
| Single Unit, Detached | 1,620 (89.3%) | 193 (10.6%) |
| Single Unit, Attached | 188 (89.5%) | 22 (10.5%) |
| 2 Unit Apartments | 11 (17.5%) | 52 (82.5%) |
| 3 or 4 Unit Apartments | 0 (0.0%) | 179 (100.0%) |
| 5 to 9 Unit Apartments | 0 (0.0%) | 0 (0.0%) |
| 10 or more Apartments | 0 (0.0%) | 14 (100.0%) |
| Mobile Home / Other | 15 (100.0%) | 0 (0.0%) |
| Total | 1,834 (79.9%) | 460 (20.1%) |
Housing Structures by Number of Rooms in North Windham
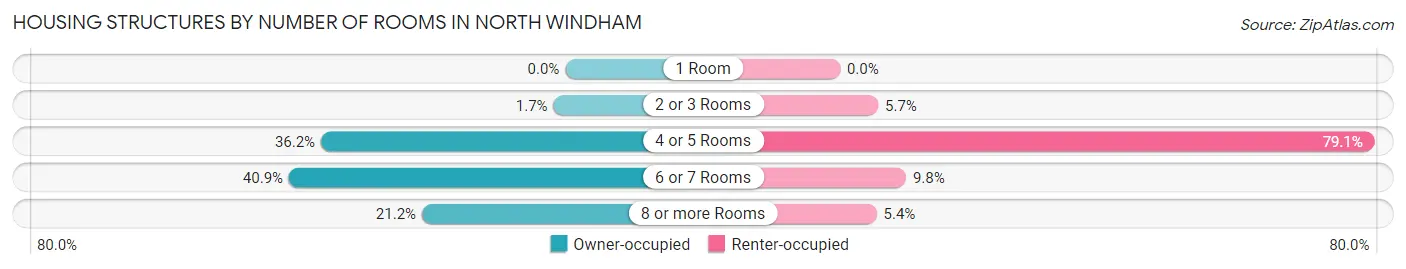
| Number of Rooms | Owner-occupied | Renter-occupied |
| 1 Room | 0 (0.0%) | 0 (0.0%) |
| 2 or 3 Rooms | 32 (1.7%) | 26 (5.7%) |
| 4 or 5 Rooms | 663 (36.1%) | 364 (79.1%) |
| 6 or 7 Rooms | 750 (40.9%) | 45 (9.8%) |
| 8 or more Rooms | 389 (21.2%) | 25 (5.4%) |
| Total | 1,834 (100.0%) | 460 (100.0%) |
Housing Structure by Heating Type in North Windham
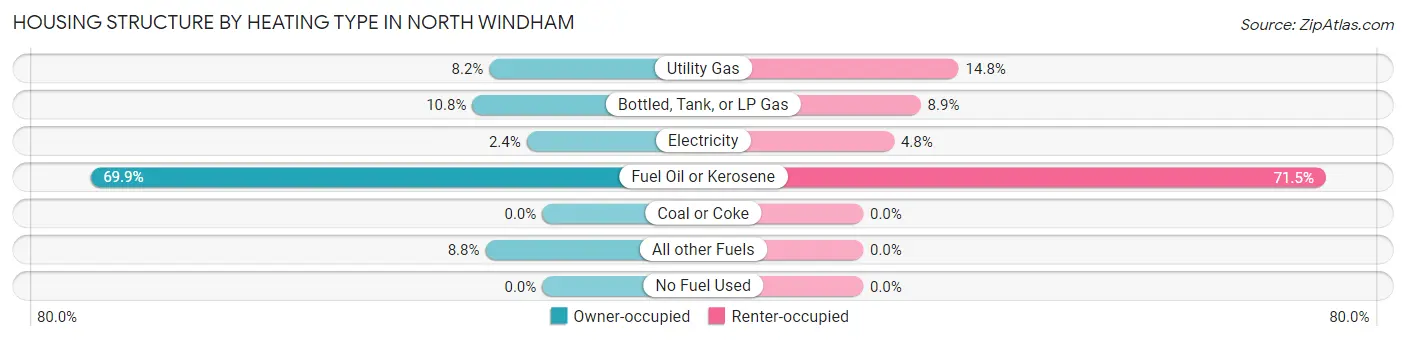
| Heating Type | Owner-occupied | Renter-occupied |
| Utility Gas | 150 (8.2%) | 68 (14.8%) |
| Bottled, Tank, or LP Gas | 198 (10.8%) | 41 (8.9%) |
| Electricity | 44 (2.4%) | 22 (4.8%) |
| Fuel Oil or Kerosene | 1,281 (69.9%) | 329 (71.5%) |
| Coal or Coke | 0 (0.0%) | 0 (0.0%) |
| All other Fuels | 161 (8.8%) | 0 (0.0%) |
| No Fuel Used | 0 (0.0%) | 0 (0.0%) |
| Total | 1,834 (100.0%) | 460 (100.0%) |
Household Vehicle Usage in North Windham
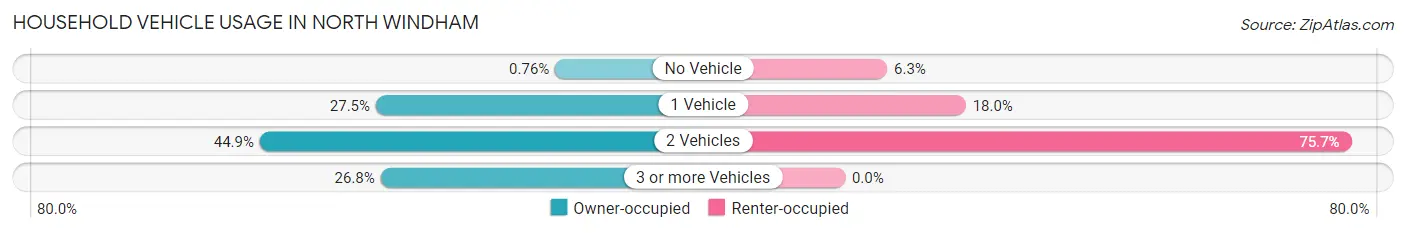
| Vehicles per Household | Owner-occupied | Renter-occupied |
| No Vehicle | 14 (0.8%) | 29 (6.3%) |
| 1 Vehicle | 505 (27.5%) | 83 (18.0%) |
| 2 Vehicles | 823 (44.9%) | 348 (75.6%) |
| 3 or more Vehicles | 492 (26.8%) | 0 (0.0%) |
| Total | 1,834 (100.0%) | 460 (100.0%) |
Real Estate & Mortgages in North Windham
Real Estate and Mortgage Overview in North Windham
| Characteristic | Without Mortgage | With Mortgage |
| Housing Units | 648 | 1,186 |
| Median Property Value | $282,100 | $265,100 |
| Median Household Income | $76,875 | $198 |
| Monthly Housing Costs | $605 | $10 |
| Real Estate Taxes | $3,456 | $0 |
Property Value by Mortgage Status in North Windham
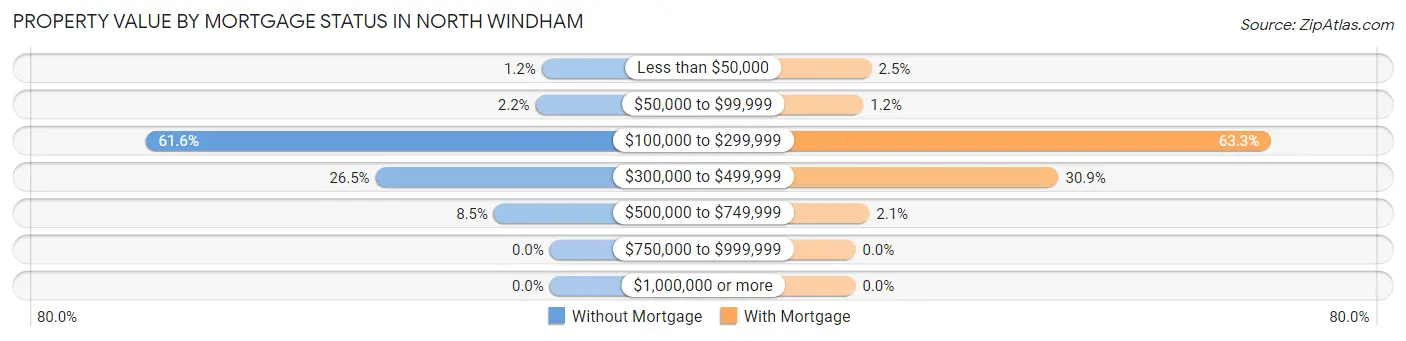
| Property Value | Without Mortgage | With Mortgage |
| Less than $50,000 | 8 (1.2%) | 29 (2.5%) |
| $50,000 to $99,999 | 14 (2.2%) | 14 (1.2%) |
| $100,000 to $299,999 | 399 (61.6%) | 751 (63.3%) |
| $300,000 to $499,999 | 172 (26.5%) | 367 (30.9%) |
| $500,000 to $749,999 | 55 (8.5%) | 25 (2.1%) |
| $750,000 to $999,999 | 0 (0.0%) | 0 (0.0%) |
| $1,000,000 or more | 0 (0.0%) | 0 (0.0%) |
| Total | 648 (100.0%) | 1,186 (100.0%) |
Household Income by Mortgage Status in North Windham
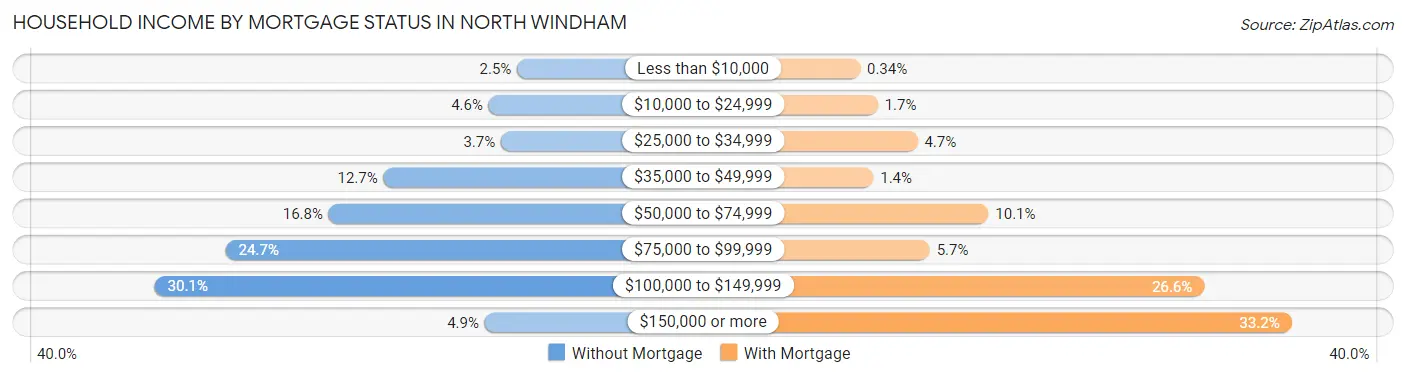
| Household Income | Without Mortgage | With Mortgage |
| Less than $10,000 | 16 (2.5%) | 4 (0.3%) |
| $10,000 to $24,999 | 30 (4.6%) | 20 (1.7%) |
| $25,000 to $34,999 | 24 (3.7%) | 56 (4.7%) |
| $35,000 to $49,999 | 82 (12.7%) | 16 (1.3%) |
| $50,000 to $74,999 | 109 (16.8%) | 120 (10.1%) |
| $75,000 to $99,999 | 160 (24.7%) | 67 (5.7%) |
| $100,000 to $149,999 | 195 (30.1%) | 315 (26.6%) |
| $150,000 or more | 32 (4.9%) | 394 (33.2%) |
| Total | 648 (100.0%) | 1,186 (100.0%) |
Property Value to Household Income Ratio in North Windham
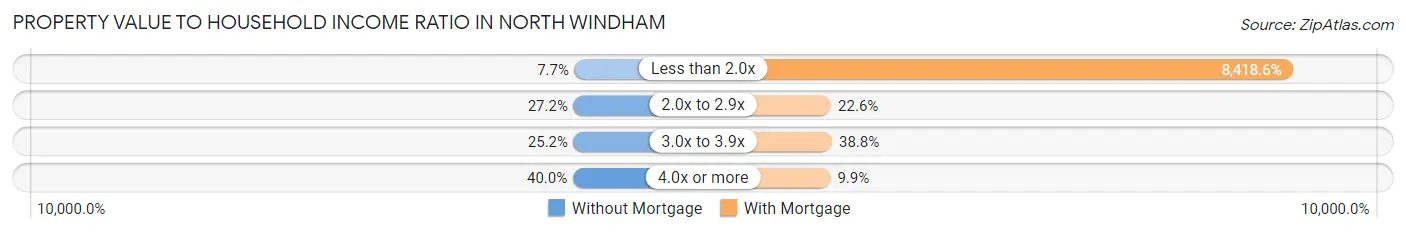
| Value-to-Income Ratio | Without Mortgage | With Mortgage |
| Less than 2.0x | 50 (7.7%) | 99,844 (8,418.6%) |
| 2.0x to 2.9x | 176 (27.2%) | 268 (22.6%) |
| 3.0x to 3.9x | 163 (25.2%) | 460 (38.8%) |
| 4.0x or more | 259 (40.0%) | 117 (9.9%) |
| Total | 648 (100.0%) | 1,186 (100.0%) |
Real Estate Taxes by Mortgage Status in North Windham
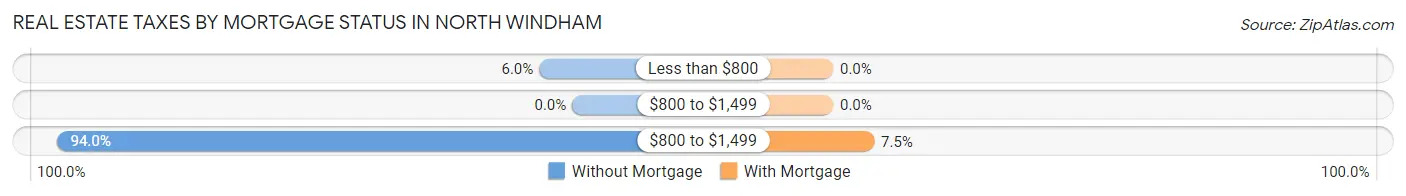
| Property Taxes | Without Mortgage | With Mortgage |
| Less than $800 | 39 (6.0%) | 0 (0.0%) |
| $800 to $1,499 | 0 (0.0%) | 0 (0.0%) |
| $800 to $1,499 | 609 (94.0%) | 89 (7.5%) |
| Total | 648 (100.0%) | 1,186 (100.0%) |
Health & Disability in North Windham
Health Insurance Coverage by Age in North Windham
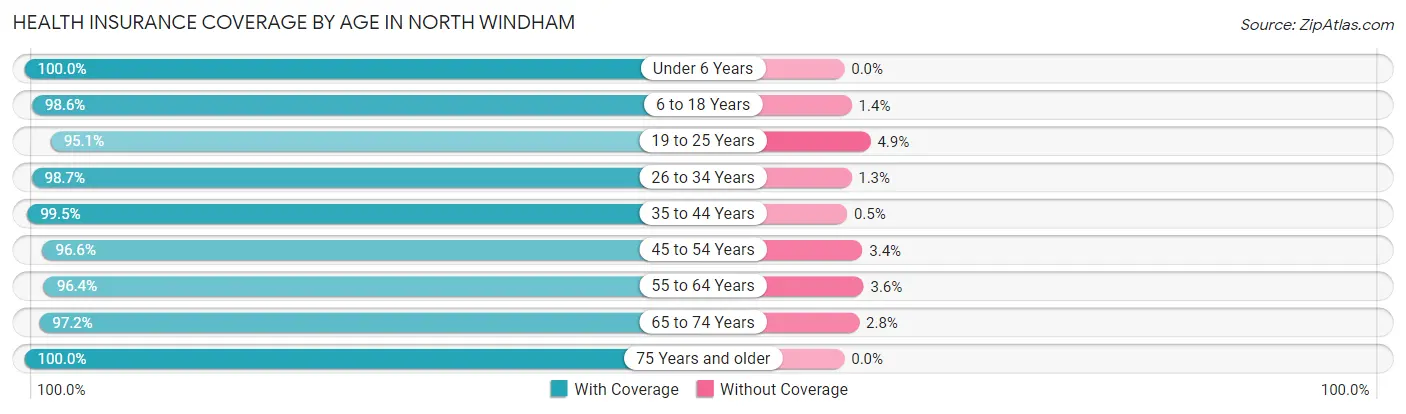
| Age Bracket | With Coverage | Without Coverage |
| Under 6 Years | 280 (100.0%) | 0 (0.0%) |
| 6 to 18 Years | 722 (98.6%) | 10 (1.4%) |
| 19 to 25 Years | 273 (95.1%) | 14 (4.9%) |
| 26 to 34 Years | 682 (98.7%) | 9 (1.3%) |
| 35 to 44 Years | 998 (99.5%) | 5 (0.5%) |
| 45 to 54 Years | 891 (96.6%) | 31 (3.4%) |
| 55 to 64 Years | 591 (96.4%) | 22 (3.6%) |
| 65 to 74 Years | 633 (97.2%) | 18 (2.8%) |
| 75 Years and older | 342 (100.0%) | 0 (0.0%) |
| Total | 5,412 (98.0%) | 109 (2.0%) |
Health Insurance Coverage by Citizenship Status in North Windham
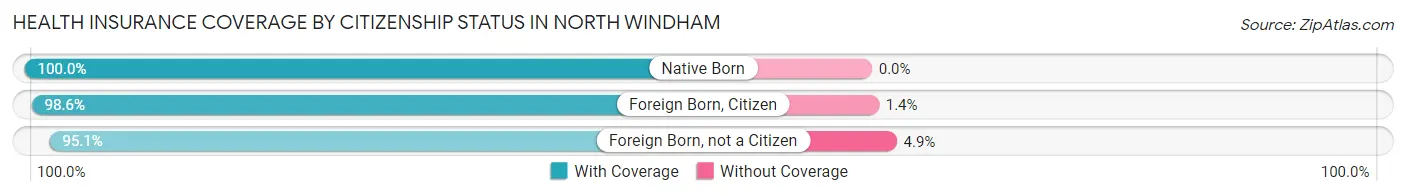
| Citizenship Status | With Coverage | Without Coverage |
| Native Born | 280 (100.0%) | 0 (0.0%) |
| Foreign Born, Citizen | 722 (98.6%) | 10 (1.4%) |
| Foreign Born, not a Citizen | 273 (95.1%) | 14 (4.9%) |
Health Insurance Coverage by Household Income in North Windham
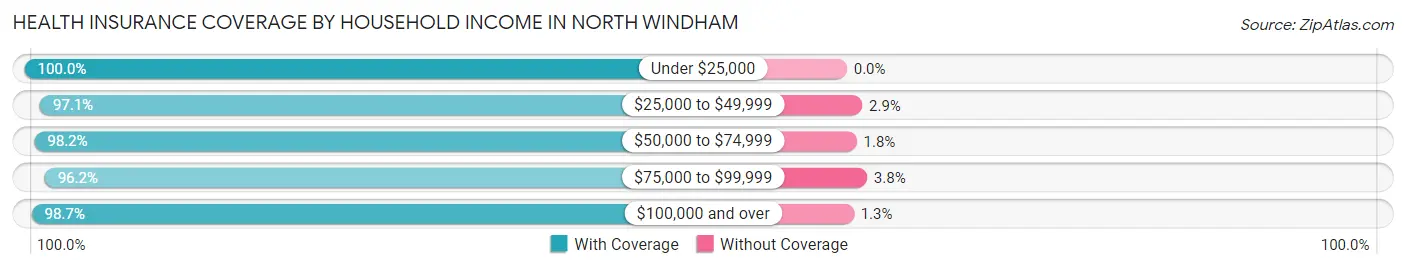
| Household Income | With Coverage | Without Coverage |
| Under $25,000 | 215 (100.0%) | 0 (0.0%) |
| $25,000 to $49,999 | 406 (97.1%) | 12 (2.9%) |
| $50,000 to $74,999 | 746 (98.2%) | 14 (1.8%) |
| $75,000 to $99,999 | 1,148 (96.2%) | 45 (3.8%) |
| $100,000 and over | 2,894 (98.7%) | 38 (1.3%) |
Public vs Private Health Insurance Coverage by Age in North Windham
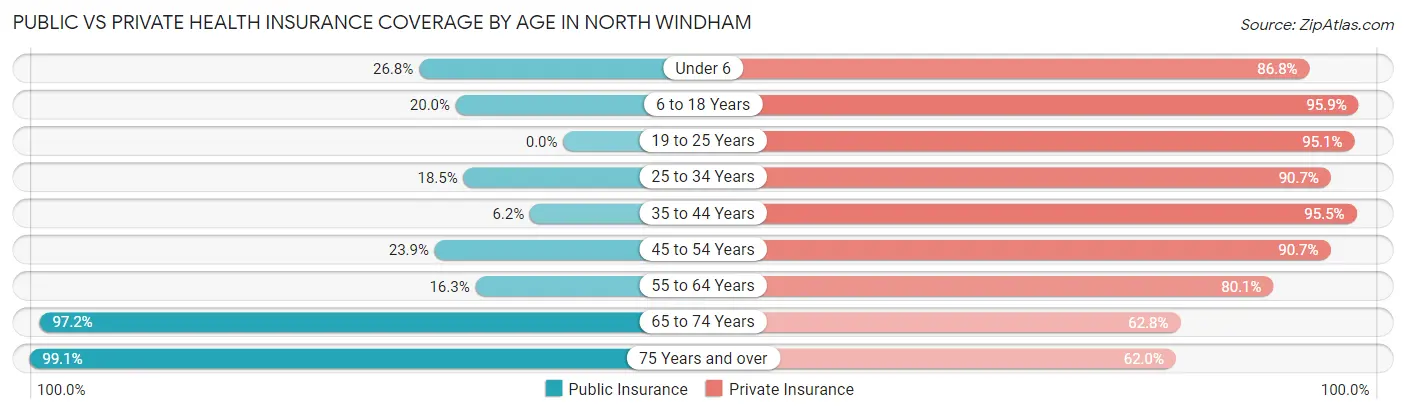
| Age Bracket | Public Insurance | Private Insurance |
| Under 6 | 75 (26.8%) | 243 (86.8%) |
| 6 to 18 Years | 146 (20.0%) | 702 (95.9%) |
| 19 to 25 Years | 0 (0.0%) | 273 (95.1%) |
| 25 to 34 Years | 128 (18.5%) | 627 (90.7%) |
| 35 to 44 Years | 62 (6.2%) | 958 (95.5%) |
| 45 to 54 Years | 220 (23.9%) | 836 (90.7%) |
| 55 to 64 Years | 100 (16.3%) | 491 (80.1%) |
| 65 to 74 Years | 633 (97.2%) | 409 (62.8%) |
| 75 Years and over | 339 (99.1%) | 212 (62.0%) |
| Total | 1,703 (30.8%) | 4,751 (86.1%) |
Disability Status by Sex by Age in North Windham
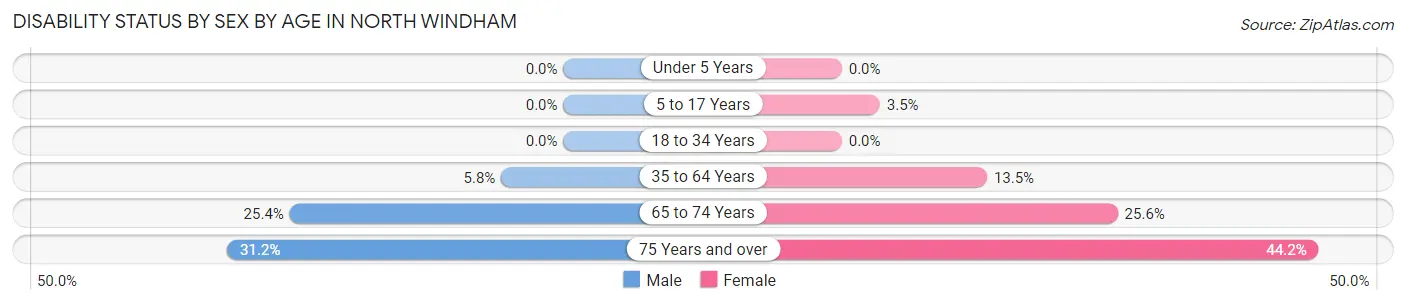
| Age Bracket | Male | Female |
| Under 5 Years | 0 (0.0%) | 0 (0.0%) |
| 5 to 17 Years | 0 (0.0%) | 11 (3.5%) |
| 18 to 34 Years | 0 (0.0%) | 0 (0.0%) |
| 35 to 64 Years | 59 (5.8%) | 204 (13.5%) |
| 65 to 74 Years | 80 (25.4%) | 86 (25.6%) |
| 75 Years and over | 39 (31.2%) | 96 (44.2%) |
Disability Class by Sex by Age in North Windham
Disability Class: Hearing Difficulty
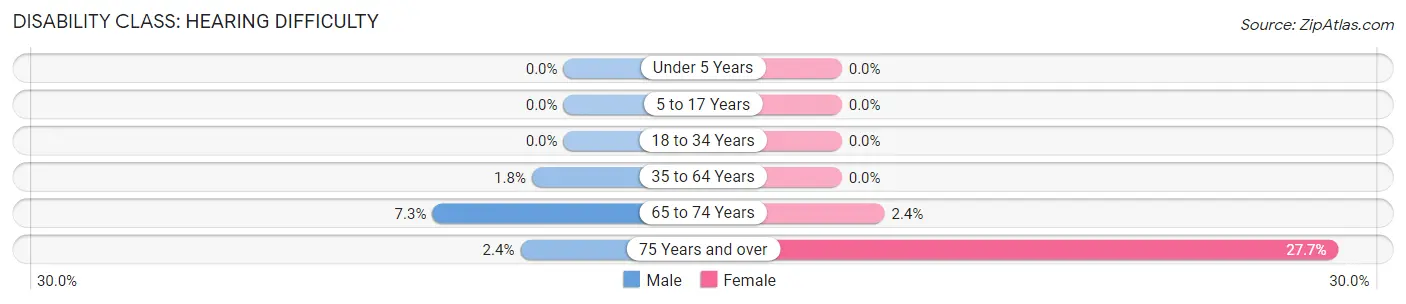
| Age Bracket | Male | Female |
| Under 5 Years | 0 (0.0%) | 0 (0.0%) |
| 5 to 17 Years | 0 (0.0%) | 0 (0.0%) |
| 18 to 34 Years | 0 (0.0%) | 0 (0.0%) |
| 35 to 64 Years | 18 (1.8%) | 0 (0.0%) |
| 65 to 74 Years | 23 (7.3%) | 8 (2.4%) |
| 75 Years and over | 3 (2.4%) | 60 (27.7%) |
Disability Class: Vision Difficulty
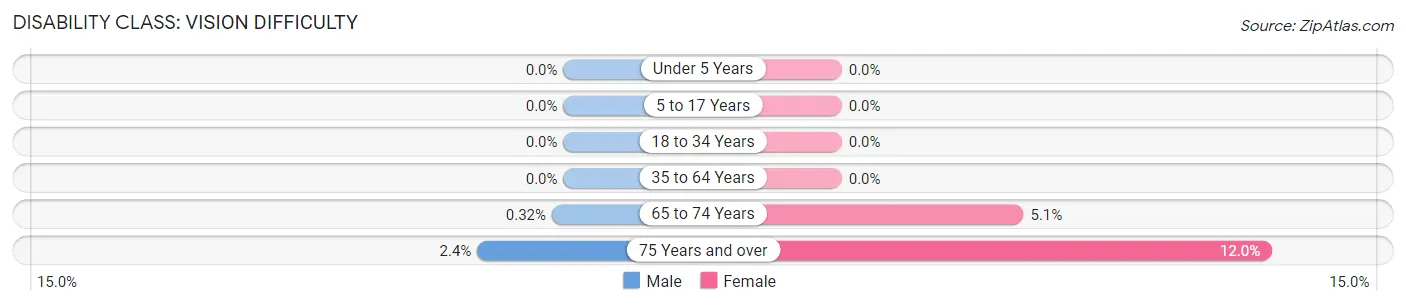
| Age Bracket | Male | Female |
| Under 5 Years | 0 (0.0%) | 0 (0.0%) |
| 5 to 17 Years | 0 (0.0%) | 0 (0.0%) |
| 18 to 34 Years | 0 (0.0%) | 0 (0.0%) |
| 35 to 64 Years | 0 (0.0%) | 0 (0.0%) |
| 65 to 74 Years | 1 (0.3%) | 17 (5.1%) |
| 75 Years and over | 3 (2.4%) | 26 (12.0%) |
Disability Class: Cognitive Difficulty
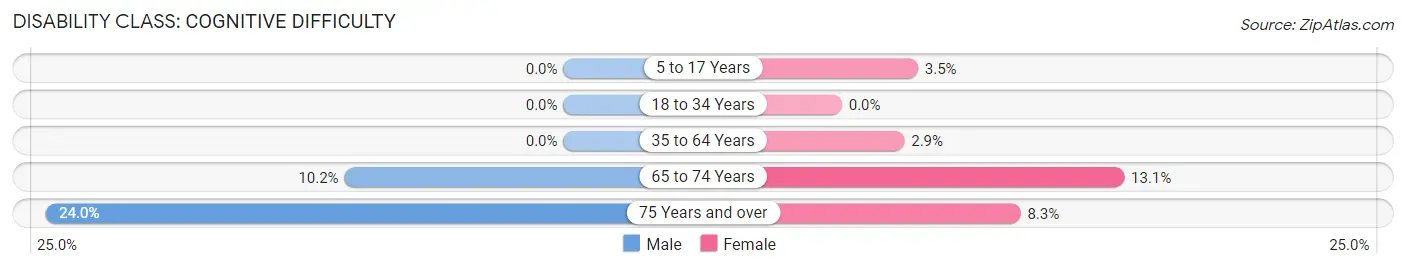
| Age Bracket | Male | Female |
| 5 to 17 Years | 0 (0.0%) | 11 (3.5%) |
| 18 to 34 Years | 0 (0.0%) | 0 (0.0%) |
| 35 to 64 Years | 0 (0.0%) | 44 (2.9%) |
| 65 to 74 Years | 32 (10.2%) | 44 (13.1%) |
| 75 Years and over | 30 (24.0%) | 18 (8.3%) |
Disability Class: Ambulatory Difficulty
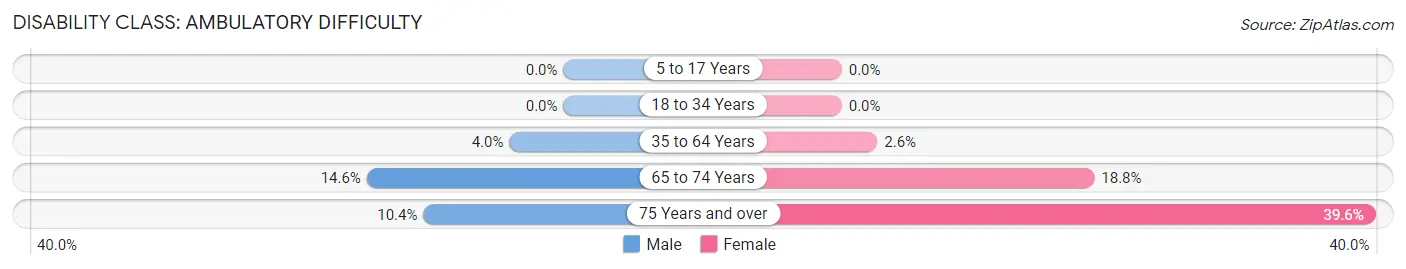
| Age Bracket | Male | Female |
| 5 to 17 Years | 0 (0.0%) | 0 (0.0%) |
| 18 to 34 Years | 0 (0.0%) | 0 (0.0%) |
| 35 to 64 Years | 41 (4.0%) | 40 (2.6%) |
| 65 to 74 Years | 46 (14.6%) | 63 (18.8%) |
| 75 Years and over | 13 (10.4%) | 86 (39.6%) |
Disability Class: Self-Care Difficulty
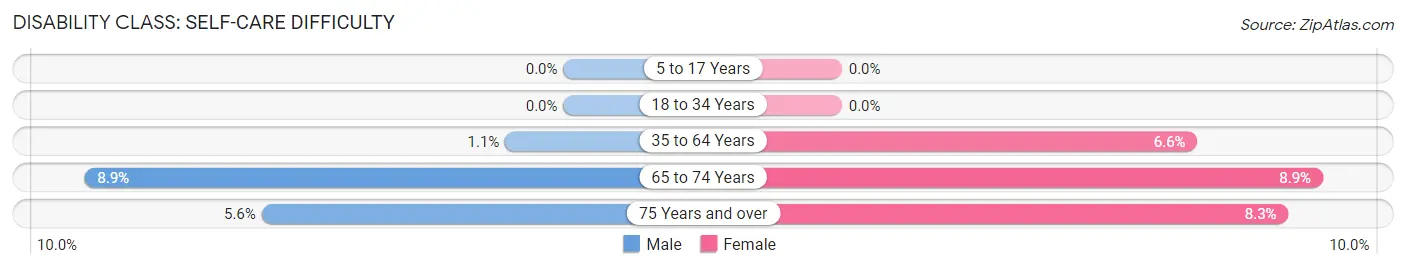
| Age Bracket | Male | Female |
| 5 to 17 Years | 0 (0.0%) | 0 (0.0%) |
| 18 to 34 Years | 0 (0.0%) | 0 (0.0%) |
| 35 to 64 Years | 11 (1.1%) | 100 (6.6%) |
| 65 to 74 Years | 28 (8.9%) | 30 (8.9%) |
| 75 Years and over | 7 (5.6%) | 18 (8.3%) |
Technology Access in North Windham
Computing Device Access in North Windham
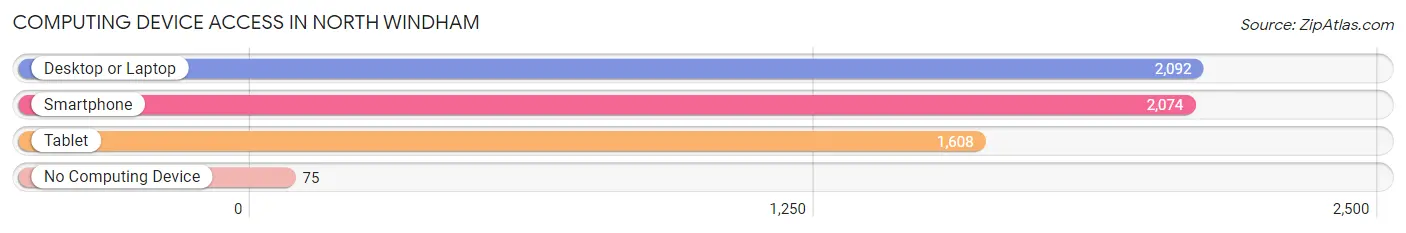
| Device Type | # Households | % Households |
| Desktop or Laptop | 2,092 | 91.2% |
| Smartphone | 2,074 | 90.4% |
| Tablet | 1,608 | 70.1% |
| No Computing Device | 75 | 3.3% |
| Total | 2,294 | 100.0% |
Internet Access in North Windham
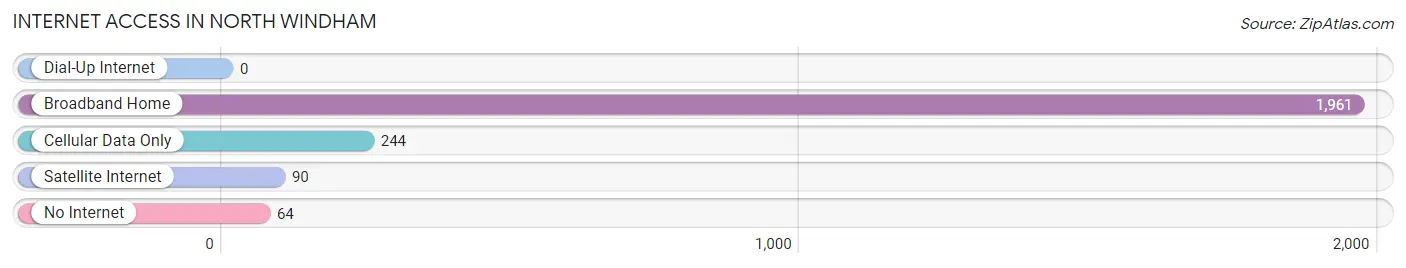
| Internet Type | # Households | % Households |
| Dial-Up Internet | 0 | 0.0% |
| Broadband Home | 1,961 | 85.5% |
| Cellular Data Only | 244 | 10.6% |
| Satellite Internet | 90 | 3.9% |
| No Internet | 64 | 2.8% |
| Total | 2,294 | 100.0% |
North Windham Summary
Windham is a town located in Cumberland County, Maine, United States. The population was 8,309 at the 2010 census. It is part of the Portland–South Portland–Biddeford, Maine metropolitan statistical area.
History
The area that is now Windham was first settled in 1734 by a group of Scots-Irish immigrants. The town was incorporated in 1762 and named after Windham, Connecticut. The town was originally part of Falmouth, Maine, which was incorporated in 1718.
In the early 19th century, Windham was a thriving agricultural community. The town was home to several mills, including a gristmill, sawmill, and a woolen mill. The town also had a tannery and a blacksmith shop.
Geography
Windham is located in southern Maine, about 10 miles north of Portland. The town is bordered by the towns of Gorham to the north, Standish to the east, Gray to the south, and Raymond to the west.
The town is situated on the Presumpscot River, which flows through the center of town. The river is a popular spot for fishing, canoeing, and kayaking.
The town is mostly rural, with a few small villages scattered throughout. The largest village is North Windham, which is located in the northern part of town.
Climate
Windham has a humid continental climate, with cold, snowy winters and warm, humid summers. The average annual temperature is 43°F (6°C). The average annual precipitation is 44 inches (112 cm).
Demographics
As of the 2010 census, there were 8,309 people, 3,093 households, and 2,279 families residing in the town. The population density was 166.3 people per square mile (64.2/km2). There were 3,309 housing units at an average density of 66.7 per square mile (25.7/km2).
The racial makeup of the town was 97.3% White, 0.5% African American, 0.3% Native American, 0.6% Asian, 0.1% Pacific Islander, 0.3% from other races, and 0.9% from two or more races. Hispanic or Latino of any race were 1.2% of the population.
There were 3,093 households, out of which 33.3% had children under the age of 18 living with them, 57.2% were married couples living together, 10.2% had a female householder with no husband present, and 28.2% were non-families. 22.2% of all households were made up of individuals, and 8.2% had someone living alone who was 65 years of age or older. The average household size was 2.63 and the average family size was 3.09.
The median age in the town was 40.3 years. 24.7% of residents were under the age of 18; 7.2% were between the ages of 18 and 24; 25.2% were from 25 to 44; 29.7% were from 45 to 64; and 13.2% were 65 years of age or older. The gender makeup of the town was 49.2% male and 50.8% female.
Economy
Windham is a largely residential community, with a few small businesses located in the town. The largest employers in the town are the Windham School District, the Windham Public Library, and the Windham Town Hall.
The town is also home to several small manufacturing companies, including a plastics manufacturer, a metal fabricator, and a machine shop.
Conclusion
Windham is a small town located in Cumberland County, Maine. The town has a long history, dating back to 1734 when it was first settled by Scots-Irish immigrants. The town is mostly rural, with a few small villages scattered throughout. The town has a humid continental climate, with cold, snowy winters and warm, humid summers. The population of Windham was 8,309 at the 2010 census. The town is largely residential, with a few small businesses located in the town. The largest employers in the town are the Windham School District, the Windham Public Library, and the Windham Town Hall.
Common Questions
What is Per Capita Income in North Windham?
Per Capita income in North Windham is $40,058.
What is the Median Family Income in North Windham?
Median Family Income in North Windham is $92,359.
What is the Median Household income in North Windham?
Median Household Income in North Windham is $90,604.
What is Income or Wage Gap in North Windham?
Income or Wage Gap in North Windham is 24.9%.
Women in North Windham earn 75.1 cents for every dollar earned by a man.
What is Inequality or Gini Index in North Windham?
Inequality or Gini Index in North Windham is 0.30.
What is the Total Population of North Windham?
Total Population of North Windham is 5,525.
What is the Total Male Population of North Windham?
Total Male Population of North Windham is 2,484.
What is the Total Female Population of North Windham?
Total Female Population of North Windham is 3,041.
What is the Ratio of Males per 100 Females in North Windham?
There are 81.68 Males per 100 Females in North Windham.
What is the Ratio of Females per 100 Males in North Windham?
There are 122.42 Females per 100 Males in North Windham.
What is the Median Population Age in North Windham?
Median Population Age in North Windham is 43.4 Years.
What is the Average Family Size in North Windham
Average Family Size in North Windham is 2.7 People.
What is the Average Household Size in North Windham
Average Household Size in North Windham is 2.4 People.
How Large is the Labor Force in North Windham?
There are 3,288 People in the Labor Forcein in North Windham.
What is the Percentage of People in the Labor Force in North Windham?
71.1% of People are in the Labor Force in North Windham.
What is the Unemployment Rate in North Windham?
Unemployment Rate in North Windham is 1.3%.