Skowhegan, ME Map & Demographics
Skowhegan Map
Skowhegan Overview
$28,149
PER CAPITA INCOME
$68,078
AVG FAMILY INCOME
$46,613
AVG HOUSEHOLD INCOME
29.2%
WAGE / INCOME GAP [ % ]
70.8¢/ $1
WAGE / INCOME GAP [ $ ]
0.42
INEQUALITY / GINI INDEX
6,270
TOTAL POPULATION
3,076
MALE POPULATION
3,194
FEMALE POPULATION
96.31
MALES / 100 FEMALES
103.84
FEMALES / 100 MALES
47.3
MEDIAN AGE
2.7
AVG FAMILY SIZE
2.1
AVG HOUSEHOLD SIZE
2,686
LABOR FORCE [ PEOPLE ]
51.6%
PERCENT IN LABOR FORCE
3.4%
UNEMPLOYMENT RATE
Skowhegan Zip Codes
Skowhegan Area Codes
Income in Skowhegan
Income Overview in Skowhegan
Per Capita Income in Skowhegan is $28,149, while median incomes of families and households are $68,078 and $46,613 respectively.
| Characteristic | Number | Measure |
| Per Capita Income | 6,270 | $28,149 |
| Median Family Income | 1,667 | $68,078 |
| Mean Family Income | 1,667 | $78,005 |
| Median Household Income | 2,884 | $46,613 |
| Mean Household Income | 2,884 | $59,673 |
| Income Deficit | 1,667 | $0 |
| Wage / Income Gap (%) | 6,270 | 29.17% |
| Wage / Income Gap ($) | 6,270 | 70.83¢ per $1 |
| Gini / Inequality Index | 6,270 | 0.42 |
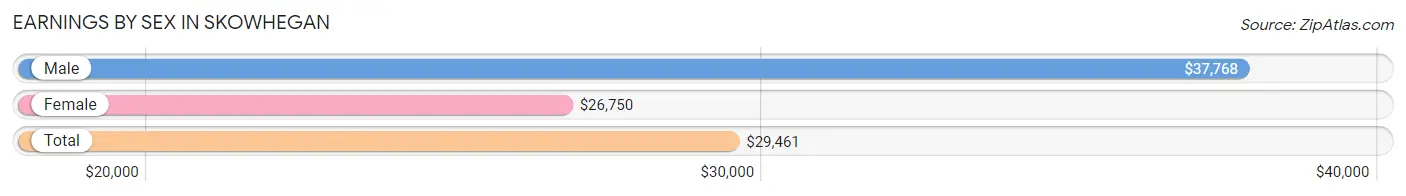
Earnings by Sex in Skowhegan
Average Earnings in Skowhegan are $29,461, $37,768 for men and $26,750 for women, a difference of 29.2%.
| Sex | Number | Average Earnings |
| Male | 1,431 (50.0%) | $37,768 |
| Female | 1,428 (49.9%) | $26,750 |
| Total | 2,859 (100.0%) | $29,461 |
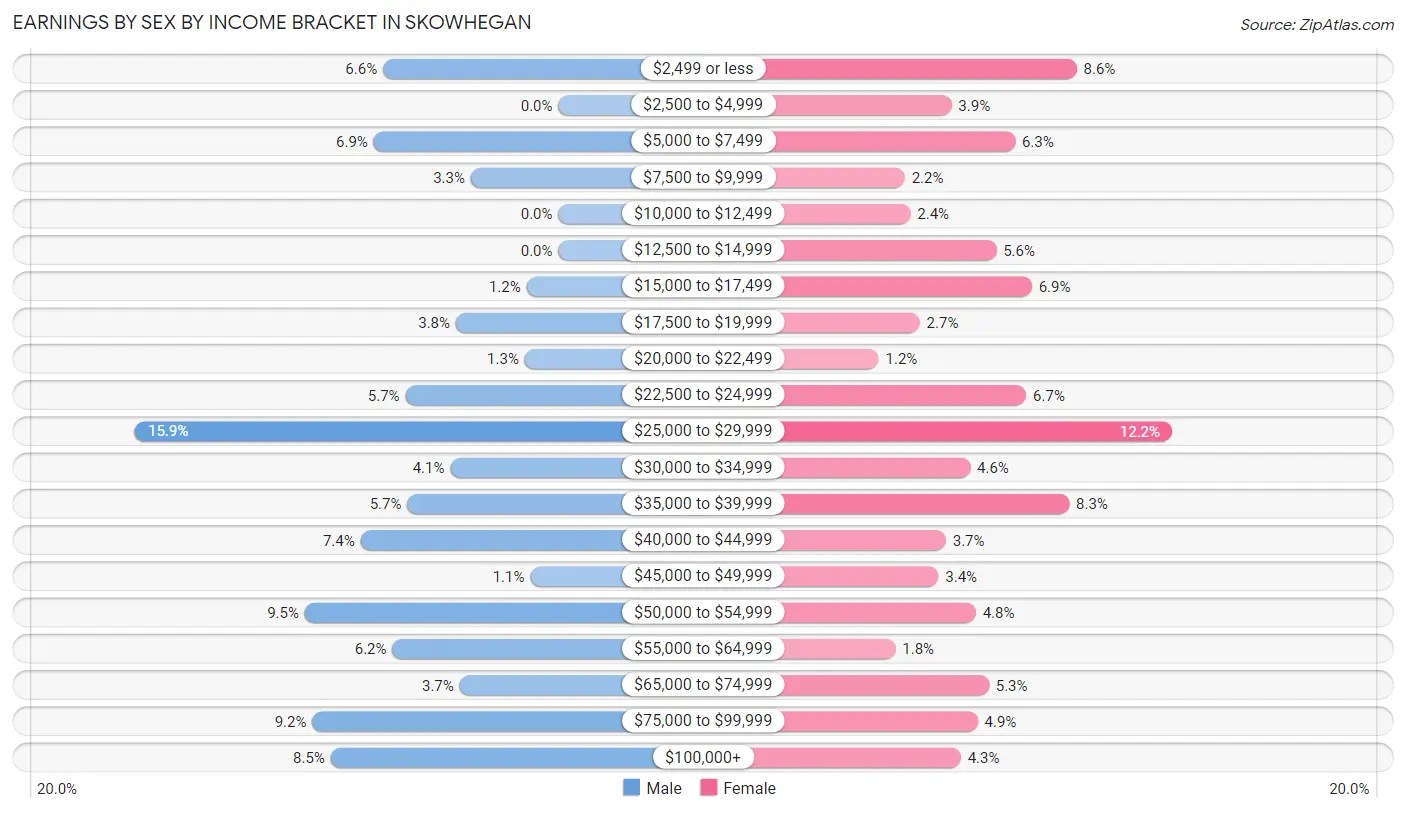
Earnings by Sex by Income Bracket in Skowhegan
The most common earnings brackets in Skowhegan are $25,000 to $29,999 for men (227 | 15.9%) and $25,000 to $29,999 for women (174 | 12.2%).
| Income | Male | Female |
| $2,499 or less | 94 (6.6%) | 123 (8.6%) |
| $2,500 to $4,999 | 0 (0.0%) | 56 (3.9%) |
| $5,000 to $7,499 | 99 (6.9%) | 90 (6.3%) |
| $7,500 to $9,999 | 47 (3.3%) | 31 (2.2%) |
| $10,000 to $12,499 | 0 (0.0%) | 34 (2.4%) |
| $12,500 to $14,999 | 0 (0.0%) | 80 (5.6%) |
| $15,000 to $17,499 | 17 (1.2%) | 99 (6.9%) |
| $17,500 to $19,999 | 55 (3.8%) | 39 (2.7%) |
| $20,000 to $22,499 | 18 (1.3%) | 17 (1.2%) |
| $22,500 to $24,999 | 82 (5.7%) | 96 (6.7%) |
| $25,000 to $29,999 | 227 (15.9%) | 174 (12.2%) |
| $30,000 to $34,999 | 58 (4.1%) | 66 (4.6%) |
| $35,000 to $39,999 | 81 (5.7%) | 119 (8.3%) |
| $40,000 to $44,999 | 106 (7.4%) | 53 (3.7%) |
| $45,000 to $49,999 | 15 (1.1%) | 49 (3.4%) |
| $50,000 to $54,999 | 136 (9.5%) | 69 (4.8%) |
| $55,000 to $64,999 | 89 (6.2%) | 26 (1.8%) |
| $65,000 to $74,999 | 53 (3.7%) | 76 (5.3%) |
| $75,000 to $99,999 | 132 (9.2%) | 70 (4.9%) |
| $100,000+ | 122 (8.5%) | 61 (4.3%) |
| Total | 1,431 (100.0%) | 1,428 (100.0%) |
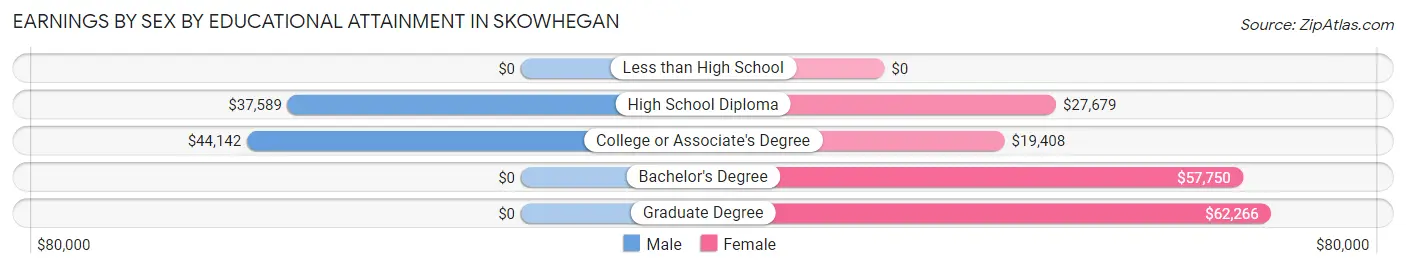
Earnings by Sex by Educational Attainment in Skowhegan
Average earnings in Skowhegan are $40,081 for men and $28,173 for women, a difference of 29.7%. Men with an educational attainment of college or associate's degree enjoy the highest average annual earnings of $44,142, while those with high school diploma education earn the least with $37,589. Women with an educational attainment of graduate degree earn the most with the average annual earnings of $62,266, while those with college or associate's degree education have the smallest earnings of $19,408.
| Educational Attainment | Male Income | Female Income |
| Less than High School | - | - |
| High School Diploma | $37,589 | $27,679 |
| College or Associate's Degree | $44,142 | $19,408 |
| Bachelor's Degree | - | - |
| Graduate Degree | - | - |
| Total | $40,081 | $28,173 |
Family Income in Skowhegan
Family Income Brackets in Skowhegan
According to the Skowhegan family income data, there are 448 families falling into the $75,000 to $99,999 income range, which is the most common income bracket and makes up 26.9% of all families.
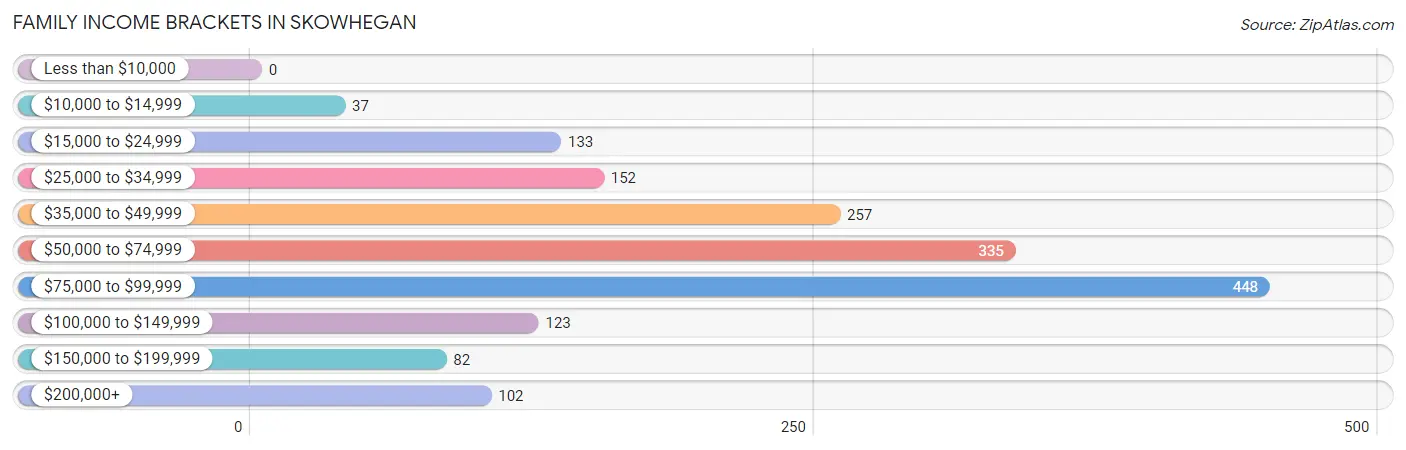
| Income Bracket | # Families | % Families |
| Less than $10,000 | 0 | 0.0% |
| $10,000 to $14,999 | 37 | 2.2% |
| $15,000 to $24,999 | 133 | 8.0% |
| $25,000 to $34,999 | 152 | 9.1% |
| $35,000 to $49,999 | 257 | 15.4% |
| $50,000 to $74,999 | 335 | 20.1% |
| $75,000 to $99,999 | 448 | 26.9% |
| $100,000 to $149,999 | 123 | 7.4% |
| $150,000 to $199,999 | 82 | 4.9% |
| $200,000+ | 102 | 6.1% |
Family Income by Famaliy Size in Skowhegan
4-person families (134 | 8.0%) account for the highest median family income in Skowhegan with $96,290 per family, while 2-person families (1,038 | 62.3%) have the highest median income of $29,297 per family member.
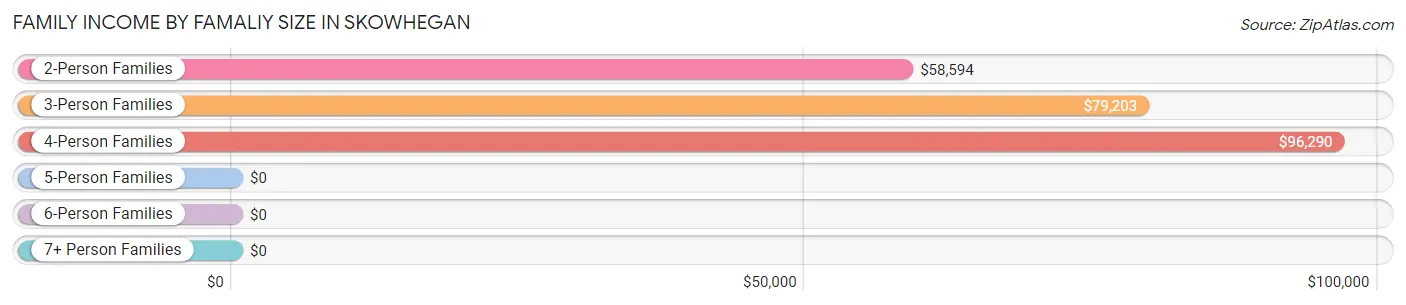
| Income Bracket | # Families | Median Income |
| 2-Person Families | 1,038 (62.3%) | $58,594 |
| 3-Person Families | 399 (23.9%) | $79,203 |
| 4-Person Families | 134 (8.0%) | $96,290 |
| 5-Person Families | 32 (1.9%) | $0 |
| 6-Person Families | 56 (3.4%) | $0 |
| 7+ Person Families | 8 (0.5%) | $0 |
| Total | 1,667 (100.0%) | $68,078 |
Family Income by Number of Earners in Skowhegan
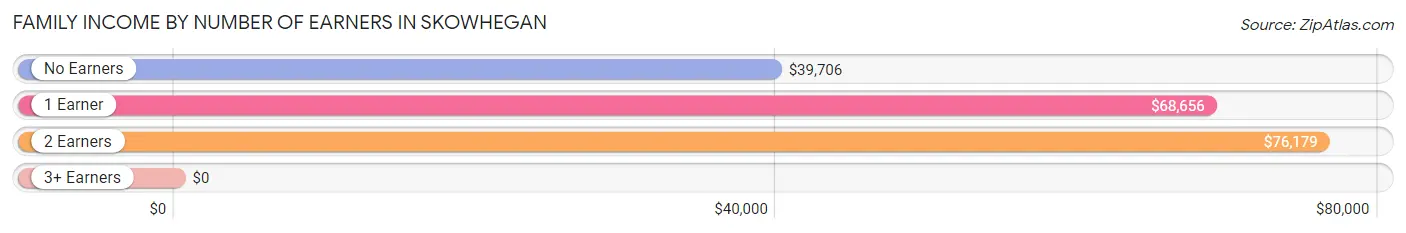
| Number of Earners | # Families | Median Income |
| No Earners | 428 (25.7%) | $39,706 |
| 1 Earner | 461 (27.7%) | $68,656 |
| 2 Earners | 635 (38.1%) | $76,179 |
| 3+ Earners | 143 (8.6%) | $0 |
| Total | 1,667 (100.0%) | $68,078 |
Household Income in Skowhegan
Household Income Brackets in Skowhegan
With 591 households falling in the category, the $50,000 to $74,999 income range is the most frequent in Skowhegan, accounting for 20.5% of all households. In contrast, only 89 households (3.1%) fall into the $150,000 to $199,999 income bracket, making it the least populous group.
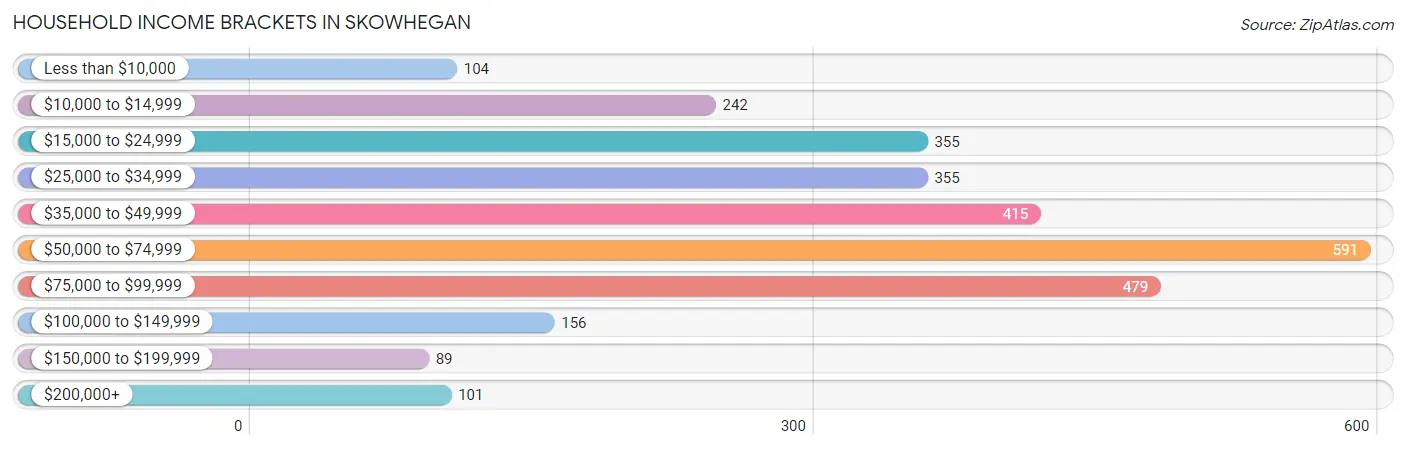
| Income Bracket | # Households | % Households |
| Less than $10,000 | 104 | 3.6% |
| $10,000 to $14,999 | 242 | 8.4% |
| $15,000 to $24,999 | 355 | 12.3% |
| $25,000 to $34,999 | 355 | 12.3% |
| $35,000 to $49,999 | 415 | 14.4% |
| $50,000 to $74,999 | 591 | 20.5% |
| $75,000 to $99,999 | 479 | 16.6% |
| $100,000 to $149,999 | 156 | 5.4% |
| $150,000 to $199,999 | 89 | 3.1% |
| $200,000+ | 101 | 3.5% |
Household Income by Householder Age in Skowhegan
The median household income in Skowhegan is $46,613, with the highest median household income of $54,007 found in the 45 to 64 years age bracket for the primary householder. A total of 871 households (30.2%) fall into this category. Meanwhile, the 15 to 24 years age bracket for the primary householder has the lowest median household income of $0, with 55 households (1.9%) in this group.
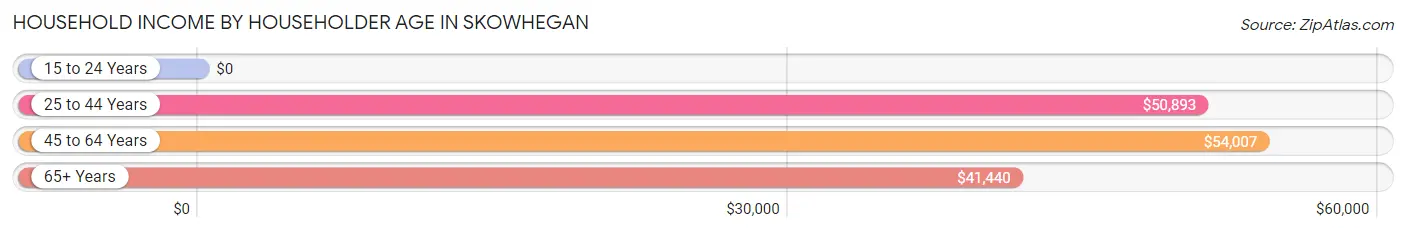
| Income Bracket | # Households | Median Income |
| 15 to 24 Years | 55 (1.9%) | $0 |
| 25 to 44 Years | 753 (26.1%) | $50,893 |
| 45 to 64 Years | 871 (30.2%) | $54,007 |
| 65+ Years | 1,205 (41.8%) | $41,440 |
| Total | 2,884 (100.0%) | $46,613 |
Poverty in Skowhegan
Income Below Poverty by Sex and Age in Skowhegan
With 11.6% poverty level for males and 16.2% for females among the residents of Skowhegan, 12 to 14 year old males and 18 to 24 year old females are the most vulnerable to poverty, with 24 males (43.6%) and 63 females (49.2%) in their respective age groups living below the poverty level.
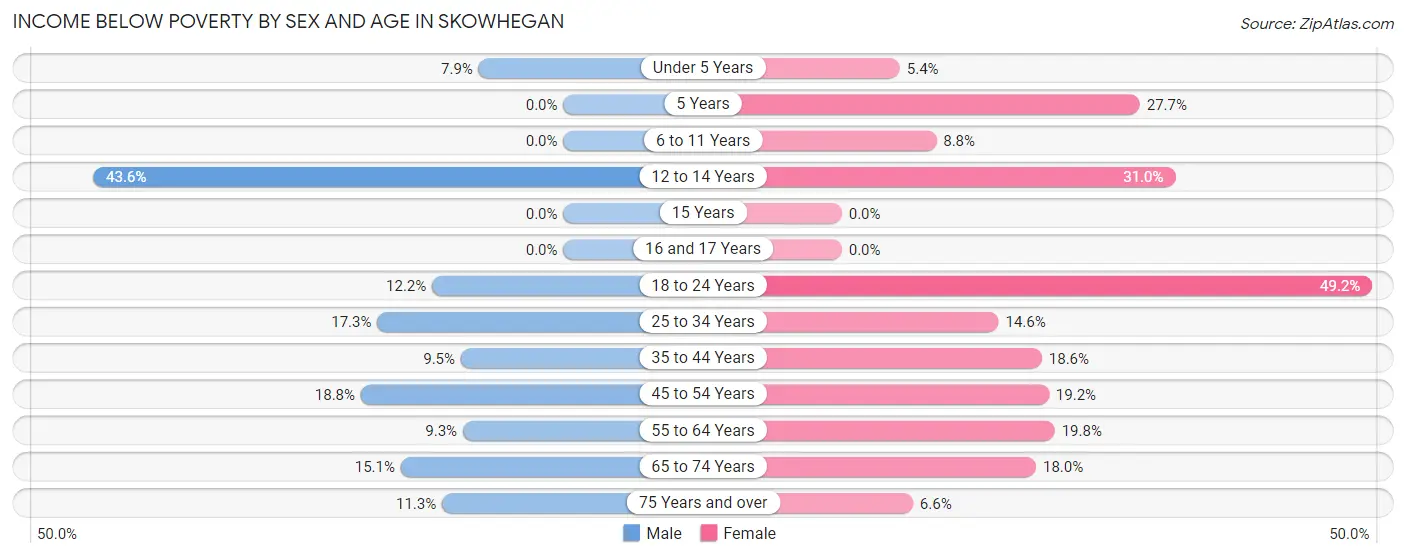
| Age Bracket | Male | Female |
| Under 5 Years | 11 (7.9%) | 11 (5.4%) |
| 5 Years | 0 (0.0%) | 13 (27.7%) |
| 6 to 11 Years | 0 (0.0%) | 10 (8.8%) |
| 12 to 14 Years | 24 (43.6%) | 13 (30.9%) |
| 15 Years | 0 (0.0%) | 0 (0.0%) |
| 16 and 17 Years | 0 (0.0%) | 0 (0.0%) |
| 18 to 24 Years | 19 (12.2%) | 63 (49.2%) |
| 25 to 34 Years | 72 (17.3%) | 64 (14.5%) |
| 35 to 44 Years | 27 (9.5%) | 65 (18.6%) |
| 45 to 54 Years | 53 (18.8%) | 49 (19.2%) |
| 55 to 64 Years | 34 (9.3%) | 100 (19.8%) |
| 65 to 74 Years | 51 (15.1%) | 77 (18.0%) |
| 75 Years and over | 52 (11.3%) | 38 (6.6%) |
| Total | 343 (11.6%) | 503 (16.2%) |
Income Above Poverty by Sex and Age in Skowhegan
According to the poverty statistics in Skowhegan, males aged 5 years and females aged 16 and 17 years are the age groups that are most secure financially, with 100.0% of males and 100.0% of females in these age groups living above the poverty line.
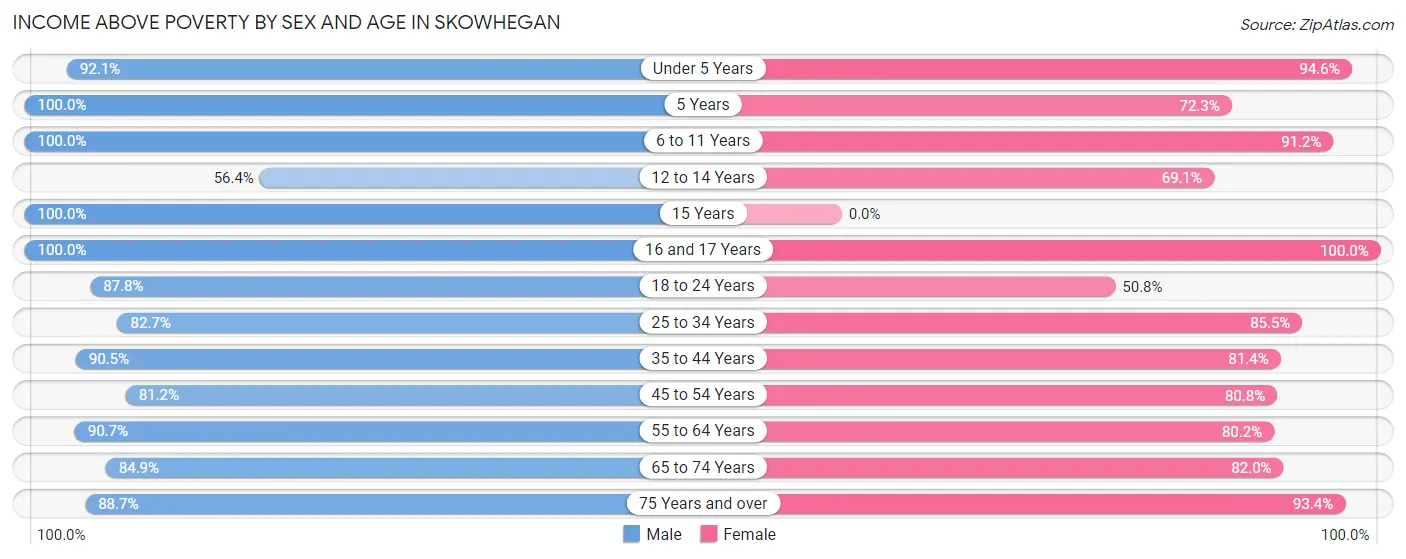
| Age Bracket | Male | Female |
| Under 5 Years | 129 (92.1%) | 193 (94.6%) |
| 5 Years | 36 (100.0%) | 34 (72.3%) |
| 6 to 11 Years | 355 (100.0%) | 104 (91.2%) |
| 12 to 14 Years | 31 (56.4%) | 29 (69.1%) |
| 15 Years | 19 (100.0%) | 0 (0.0%) |
| 16 and 17 Years | 50 (100.0%) | 8 (100.0%) |
| 18 to 24 Years | 137 (87.8%) | 65 (50.8%) |
| 25 to 34 Years | 345 (82.7%) | 376 (85.5%) |
| 35 to 44 Years | 257 (90.5%) | 285 (81.4%) |
| 45 to 54 Years | 229 (81.2%) | 206 (80.8%) |
| 55 to 64 Years | 331 (90.7%) | 406 (80.2%) |
| 65 to 74 Years | 287 (84.9%) | 350 (82.0%) |
| 75 Years and over | 410 (88.7%) | 538 (93.4%) |
| Total | 2,616 (88.4%) | 2,594 (83.8%) |
Income Below Poverty Among Married-Couple Families in Skowhegan
The poverty statistics for married-couple families in Skowhegan show that 3.8% or 48 of the total 1,247 families live below the poverty line. Families with 3 or 4 children have the highest poverty rate of 19.4%, comprising of 12 families. On the other hand, families with 5 or more children have the lowest poverty rate of 0.0%, which includes 0 families.
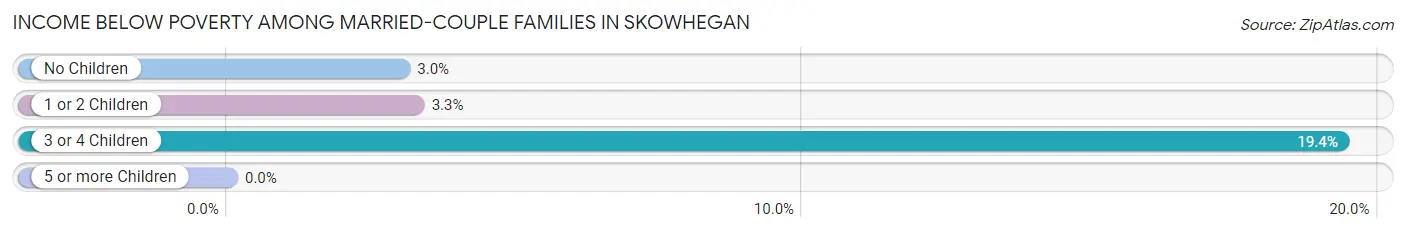
| Children | Above Poverty | Below Poverty |
| No Children | 873 (97.0%) | 27 (3.0%) |
| 1 or 2 Children | 268 (96.8%) | 9 (3.3%) |
| 3 or 4 Children | 50 (80.6%) | 12 (19.4%) |
| 5 or more Children | 8 (100.0%) | 0 (0.0%) |
| Total | 1,199 (96.2%) | 48 (3.8%) |
Income Below Poverty Among Single-Parent Households in Skowhegan
According to the poverty data in Skowhegan, 17.6% or 28 single-father households and 11.5% or 30 single-mother households are living below the poverty line. Among single-father households, those with no children have the highest poverty rate, with 17 households (30.4%) experiencing poverty. Likewise, among single-mother households, those with no children have the highest poverty rate, with 21 households (15.2%) falling below the poverty line.
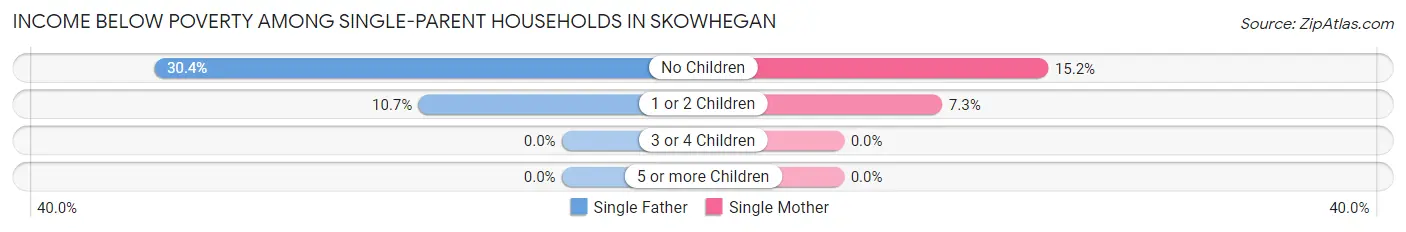
| Children | Single Father | Single Mother |
| No Children | 17 (30.4%) | 21 (15.2%) |
| 1 or 2 Children | 11 (10.7%) | 9 (7.3%) |
| 3 or 4 Children | 0 (0.0%) | 0 (0.0%) |
| 5 or more Children | 0 (0.0%) | 0 (0.0%) |
| Total | 28 (17.6%) | 30 (11.5%) |
Income Below Poverty Among Married-Couple vs Single-Parent Households in Skowhegan
The poverty data for Skowhegan shows that 48 of the married-couple family households (3.8%) and 58 of the single-parent households (13.8%) are living below the poverty level. Within the married-couple family households, those with 3 or 4 children have the highest poverty rate, with 12 households (19.4%) falling below the poverty line. Among the single-parent households, those with no children have the highest poverty rate, with 38 household (19.6%) living below poverty.
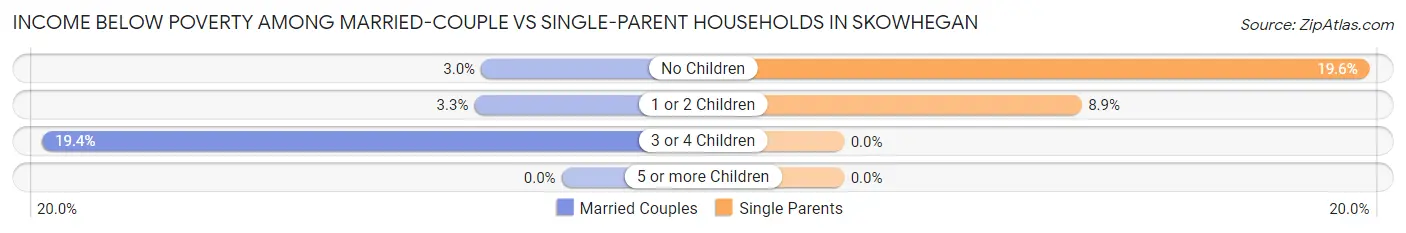
| Children | Married-Couple Families | Single-Parent Households |
| No Children | 27 (3.0%) | 38 (19.6%) |
| 1 or 2 Children | 9 (3.3%) | 20 (8.8%) |
| 3 or 4 Children | 12 (19.4%) | 0 (0.0%) |
| 5 or more Children | 0 (0.0%) | 0 (0.0%) |
| Total | 48 (3.8%) | 58 (13.8%) |
Race in Skowhegan
The most populous races in Skowhegan are White / Caucasian (5,990 | 95.5%), Two or more Races (192 | 3.1%), and Hispanic or Latino (176 | 2.8%).
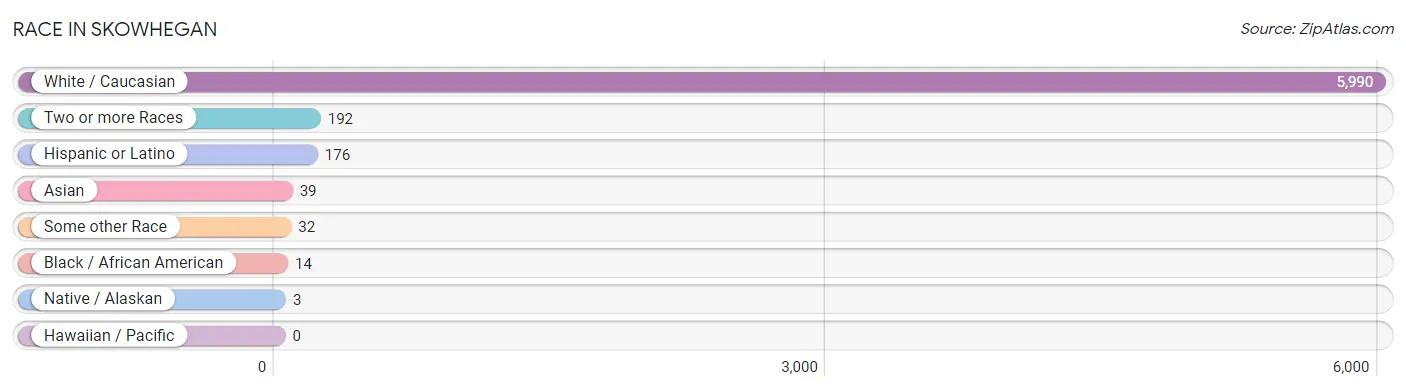
| Race | # Population | % Population |
| Asian | 39 | 0.6% |
| Black / African American | 14 | 0.2% |
| Hawaiian / Pacific | 0 | 0.0% |
| Hispanic or Latino | 176 | 2.8% |
| Native / Alaskan | 3 | 0.1% |
| White / Caucasian | 5,990 | 95.5% |
| Two or more Races | 192 | 3.1% |
| Some other Race | 32 | 0.5% |
| Total | 6,270 | 100.0% |
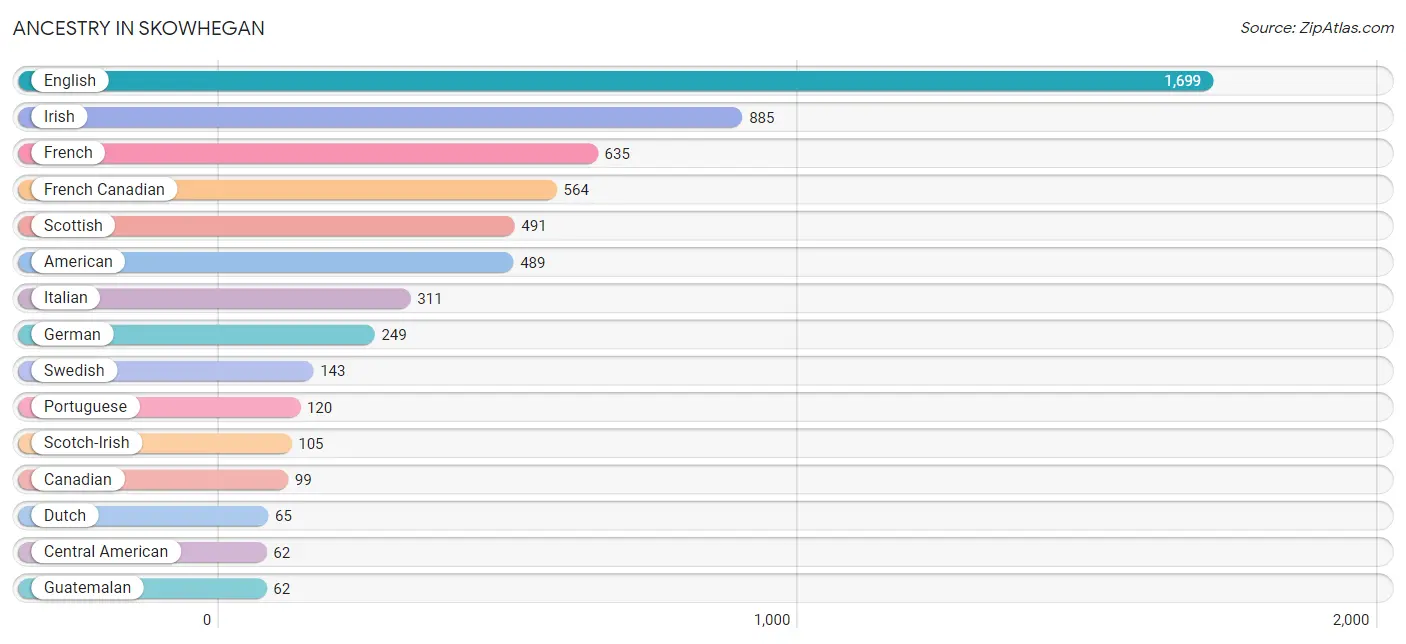
Ancestry in Skowhegan
The most populous ancestries reported in Skowhegan are English (1,699 | 27.1%), Irish (885 | 14.1%), French (635 | 10.1%), French Canadian (564 | 9.0%), and Scottish (491 | 7.8%), together accounting for 68.2% of all Skowhegan residents.
| Ancestry | # Population | % Population |
| American | 489 | 7.8% |
| Arab | 7 | 0.1% |
| British | 54 | 0.9% |
| Burmese | 49 | 0.8% |
| Canadian | 99 | 1.6% |
| Central American | 62 | 1.0% |
| Comanche | 3 | 0.1% |
| Cuban | 20 | 0.3% |
| Danish | 24 | 0.4% |
| Dutch | 65 | 1.0% |
| Eastern European | 17 | 0.3% |
| English | 1,699 | 27.1% |
| European | 14 | 0.2% |
| French | 635 | 10.1% |
| French Canadian | 564 | 9.0% |
| German | 249 | 4.0% |
| Guatemalan | 62 | 1.0% |
| Hungarian | 11 | 0.2% |
| Indian (Asian) | 27 | 0.4% |
| Irish | 885 | 14.1% |
| Italian | 311 | 5.0% |
| Korean | 31 | 0.5% |
| Lithuanian | 10 | 0.2% |
| Mexican | 62 | 1.0% |
| Native Hawaiian | 5 | 0.1% |
| Norwegian | 23 | 0.4% |
| Polish | 58 | 0.9% |
| Portuguese | 120 | 1.9% |
| Puerto Rican | 32 | 0.5% |
| Scandinavian | 40 | 0.6% |
| Scotch-Irish | 105 | 1.7% |
| Scottish | 491 | 7.8% |
| Slavic | 6 | 0.1% |
| Swedish | 143 | 2.3% |
| Syrian | 7 | 0.1% |
| Thai | 17 | 0.3% | View All 36 Rows |
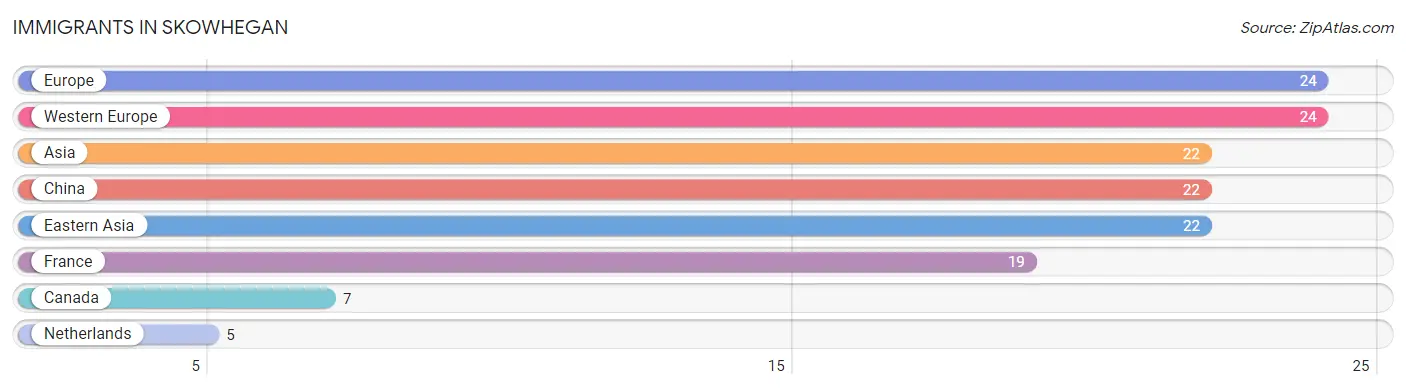
Immigrants in Skowhegan
The most numerous immigrant groups reported in Skowhegan came from Europe (24 | 0.4%), Western Europe (24 | 0.4%), Asia (22 | 0.4%), China (22 | 0.4%), and Eastern Asia (22 | 0.4%), together accounting for 1.8% of all Skowhegan residents.
| Immigration Origin | # Population | % Population |
| Asia | 22 | 0.4% |
| Canada | 7 | 0.1% |
| China | 22 | 0.4% |
| Eastern Asia | 22 | 0.4% |
| Europe | 24 | 0.4% |
| France | 19 | 0.3% |
| Netherlands | 5 | 0.1% |
| Western Europe | 24 | 0.4% | View All 8 Rows |
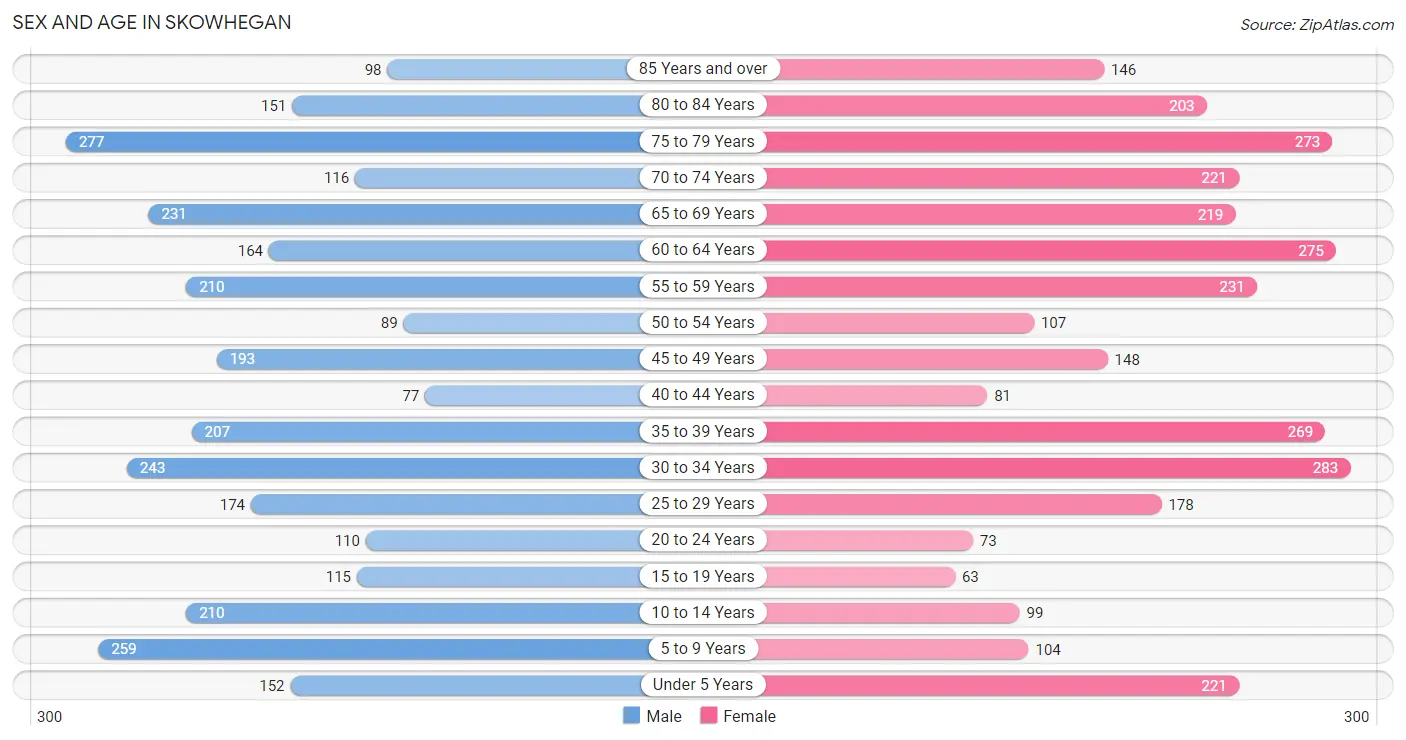
Sex and Age in Skowhegan
Sex and Age in Skowhegan
The most populous age groups in Skowhegan are 75 to 79 Years (277 | 9.0%) for men and 30 to 34 Years (283 | 8.9%) for women.
| Age Bracket | Male | Female |
| Under 5 Years | 152 (4.9%) | 221 (6.9%) |
| 5 to 9 Years | 259 (8.4%) | 104 (3.3%) |
| 10 to 14 Years | 210 (6.8%) | 99 (3.1%) |
| 15 to 19 Years | 115 (3.7%) | 63 (2.0%) |
| 20 to 24 Years | 110 (3.6%) | 73 (2.3%) |
| 25 to 29 Years | 174 (5.7%) | 178 (5.6%) |
| 30 to 34 Years | 243 (7.9%) | 283 (8.9%) |
| 35 to 39 Years | 207 (6.7%) | 269 (8.4%) |
| 40 to 44 Years | 77 (2.5%) | 81 (2.5%) |
| 45 to 49 Years | 193 (6.3%) | 148 (4.6%) |
| 50 to 54 Years | 89 (2.9%) | 107 (3.4%) |
| 55 to 59 Years | 210 (6.8%) | 231 (7.2%) |
| 60 to 64 Years | 164 (5.3%) | 275 (8.6%) |
| 65 to 69 Years | 231 (7.5%) | 219 (6.9%) |
| 70 to 74 Years | 116 (3.8%) | 221 (6.9%) |
| 75 to 79 Years | 277 (9.0%) | 273 (8.6%) |
| 80 to 84 Years | 151 (4.9%) | 203 (6.4%) |
| 85 Years and over | 98 (3.2%) | 146 (4.6%) |
| Total | 3,076 (100.0%) | 3,194 (100.0%) |
Families and Households in Skowhegan
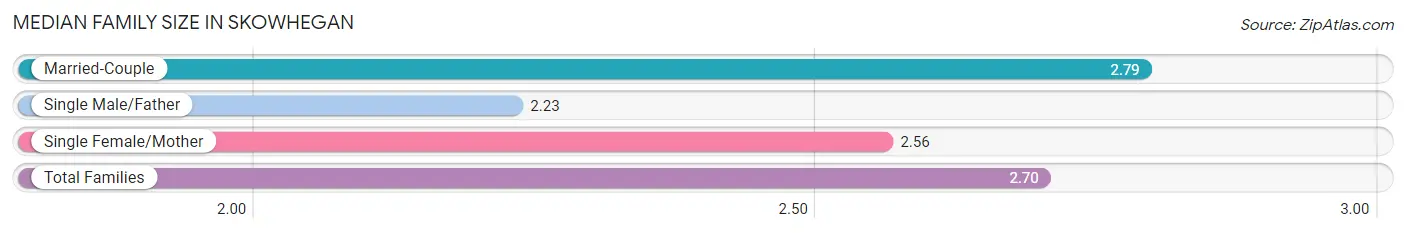
Median Family Size in Skowhegan
The median family size in Skowhegan is 2.70 persons per family, with married-couple families (1,247 | 74.8%) accounting for the largest median family size of 2.79 persons per family. On the other hand, single male/father families (159 | 9.5%) represent the smallest median family size with 2.23 persons per family.
| Family Type | # Families | Family Size |
| Married-Couple | 1,247 (74.8%) | 2.79 |
| Single Male/Father | 159 (9.5%) | 2.23 |
| Single Female/Mother | 261 (15.7%) | 2.56 |
| Total Families | 1,667 (100.0%) | 2.70 |
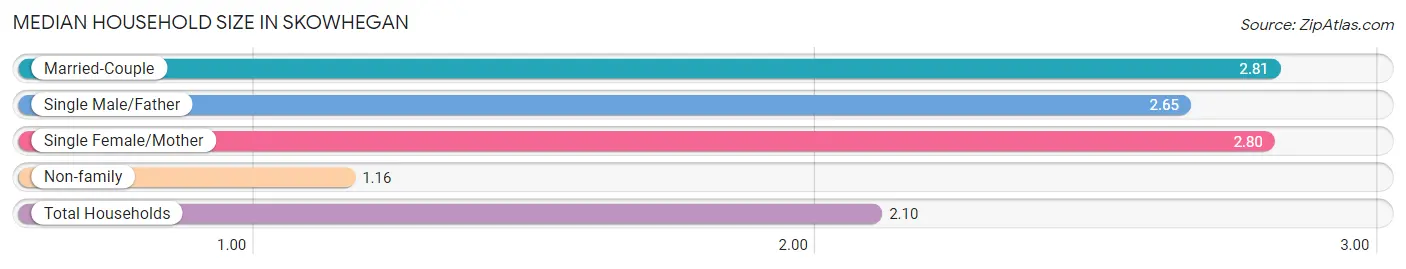
Median Household Size in Skowhegan
The median household size in Skowhegan is 2.10 persons per household, with married-couple households (1,247 | 43.2%) accounting for the largest median household size of 2.81 persons per household. non-family households (1,217 | 42.2%) represent the smallest median household size with 1.16 persons per household.
| Household Type | # Households | Household Size |
| Married-Couple | 1,247 (43.2%) | 2.81 |
| Single Male/Father | 159 (5.5%) | 2.65 |
| Single Female/Mother | 261 (9.0%) | 2.80 |
| Non-family | 1,217 (42.2%) | 1.16 |
| Total Households | 2,884 (100.0%) | 2.10 |
Household Size by Marriage Status in Skowhegan
Out of a total of 2,884 households in Skowhegan, 1,667 (57.8%) are family households, while 1,217 (42.2%) are nonfamily households. The most numerous type of family households are 2-person households, comprising 952, and the most common type of nonfamily households are 1-person households, comprising 1,041.
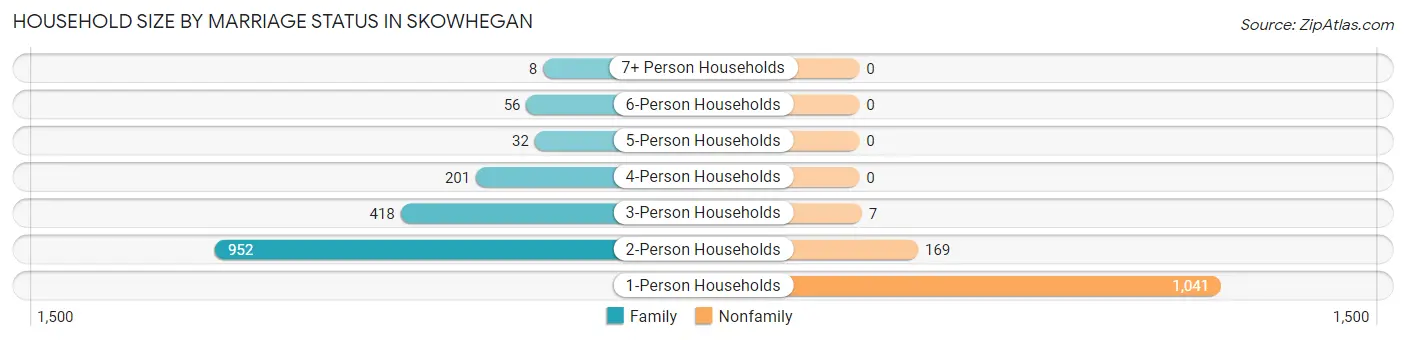
| Household Size | Family Households | Nonfamily Households |
| 1-Person Households | - | 1,041 (36.1%) |
| 2-Person Households | 952 (33.0%) | 169 (5.9%) |
| 3-Person Households | 418 (14.5%) | 7 (0.2%) |
| 4-Person Households | 201 (7.0%) | 0 (0.0%) |
| 5-Person Households | 32 (1.1%) | 0 (0.0%) |
| 6-Person Households | 56 (1.9%) | 0 (0.0%) |
| 7+ Person Households | 8 (0.3%) | 0 (0.0%) |
| Total | 1,667 (57.8%) | 1,217 (42.2%) |
Female Fertility in Skowhegan
Fertility by Age in Skowhegan
Average fertility rate in Skowhegan is 43.0 births per 1,000 women. Women in the age bracket of 20 to 34 years have the highest fertility rate with 77.0 births per 1,000 women. Women in the age bracket of 20 to 34 years acount for 85.4% of all women with births.
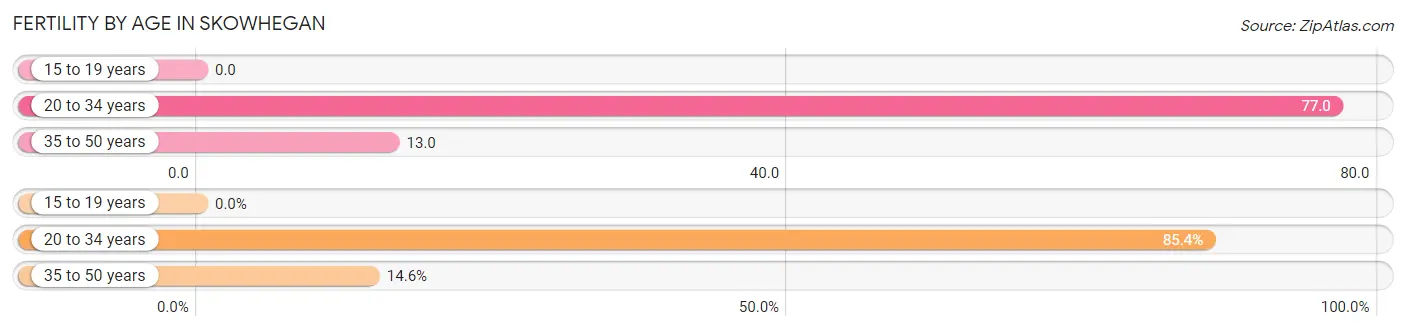
| Age Bracket | Women with Births | Births / 1,000 Women |
| 15 to 19 years | 0 (0.0%) | 0.0 |
| 20 to 34 years | 41 (85.4%) | 77.0 |
| 35 to 50 years | 7 (14.6%) | 13.0 |
| Total | 48 (100.0%) | 43.0 |
Fertility by Age by Marriage Status in Skowhegan
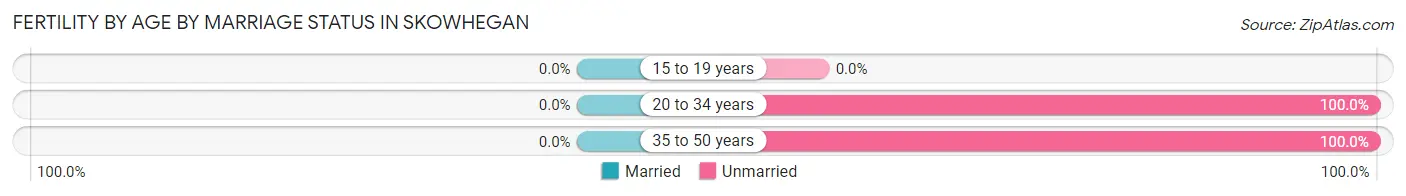
| Age Bracket | Married | Unmarried |
| 15 to 19 years | 0 (0.0%) | 0 (0.0%) |
| 20 to 34 years | 0 (0.0%) | 41 (100.0%) |
| 35 to 50 years | 0 (0.0%) | 7 (100.0%) |
| Total | 0 (0.0%) | 48 (100.0%) |
Fertility by Education in Skowhegan
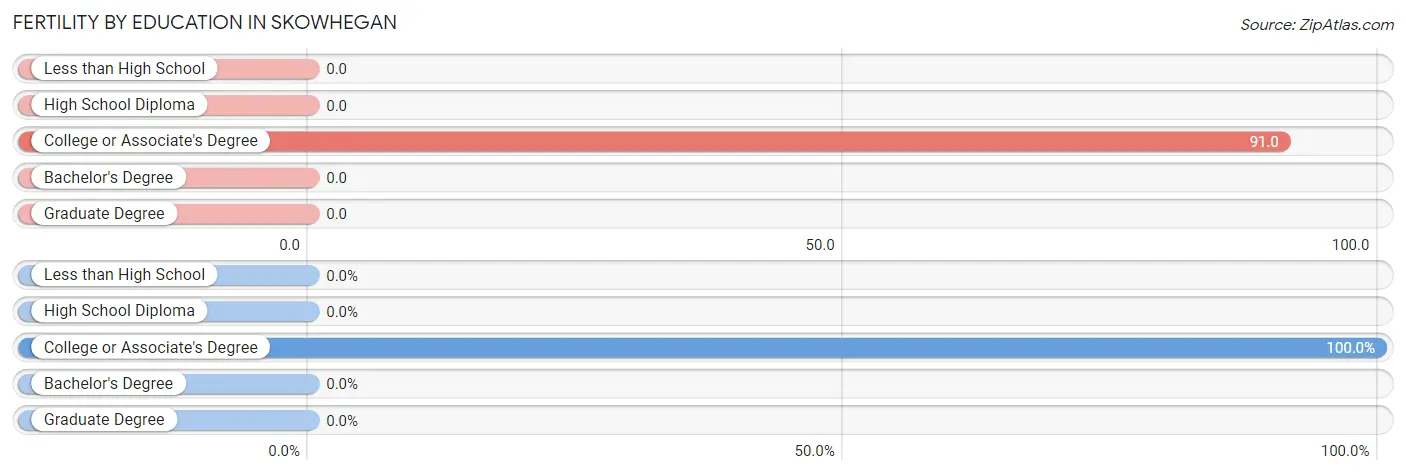
| Educational Attainment | Women with Births | Births / 1,000 Women |
| Less than High School | 0 (0.0%) | 0.0 |
| High School Diploma | 0 (0.0%) | 0.0 |
| College or Associate's Degree | 48 (100.0%) | 91.0 |
| Bachelor's Degree | 0 (0.0%) | 0.0 |
| Graduate Degree | 0 (0.0%) | 0.0 |
| Total | 48 (100.0%) | 43.0 |
Fertility by Education by Marriage Status in Skowhegan
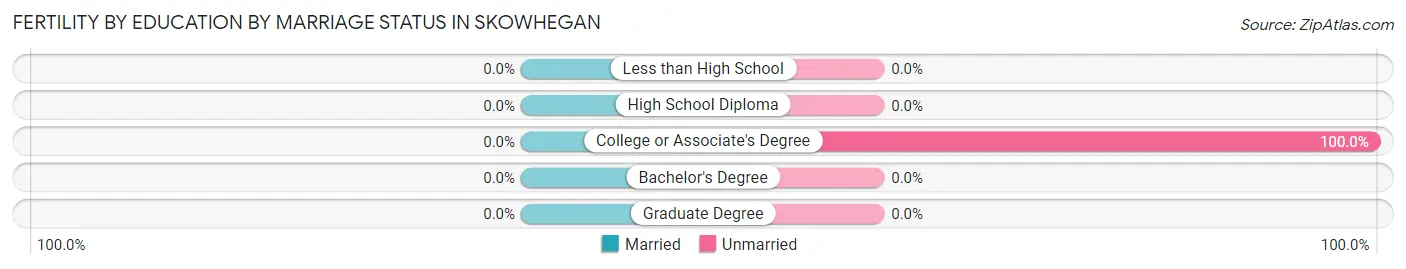
| Educational Attainment | Married | Unmarried |
| Less than High School | 0 (0.0%) | 0 (0.0%) |
| High School Diploma | 0 (0.0%) | 0 (0.0%) |
| College or Associate's Degree | 0 (0.0%) | 48 (100.0%) |
| Bachelor's Degree | 0 (0.0%) | 0 (0.0%) |
| Graduate Degree | 0 (0.0%) | 0 (0.0%) |
| Total | 0 (0.0%) | 48 (100.0%) |
Employment Characteristics in Skowhegan
Employment by Class of Employer in Skowhegan
Among the 2,497 employed individuals in Skowhegan, private company employees (1,506 | 60.3%), self-employed (not incorporated) (283 | 11.3%), and not-for-profit organizations (252 | 10.1%) make up the most common classes of employment.
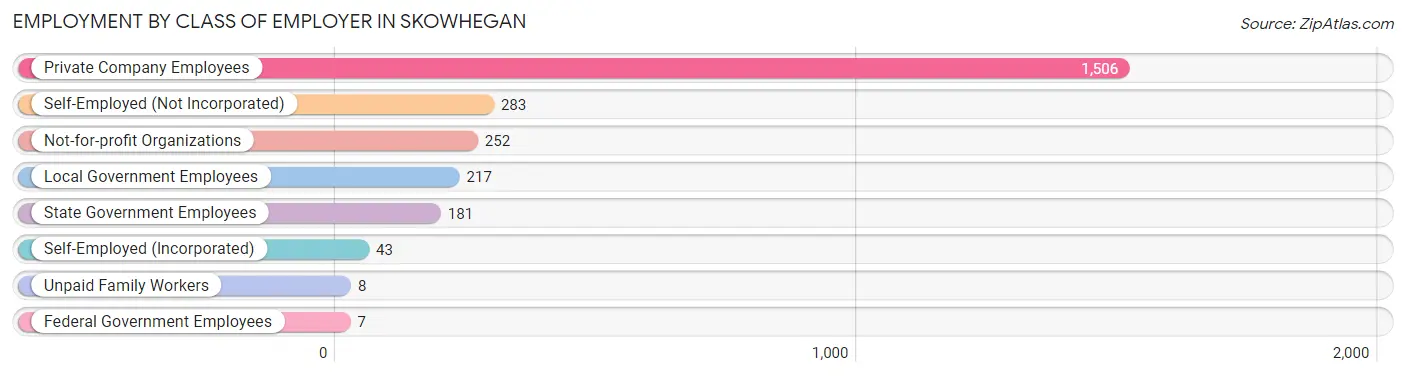
| Employer Class | # Employees | % Employees |
| Private Company Employees | 1,506 | 60.3% |
| Self-Employed (Incorporated) | 43 | 1.7% |
| Self-Employed (Not Incorporated) | 283 | 11.3% |
| Not-for-profit Organizations | 252 | 10.1% |
| Local Government Employees | 217 | 8.7% |
| State Government Employees | 181 | 7.2% |
| Federal Government Employees | 7 | 0.3% |
| Unpaid Family Workers | 8 | 0.3% |
| Total | 2,497 | 100.0% |
Employment Status by Age in Skowhegan
According to the labor force statistics for Skowhegan, out of the total population over 16 years of age (5,206), 51.6% or 2,686 individuals are in the labor force, with 3.4% or 91 of them unemployed. The age group with the highest labor force participation rate is 20 to 24 years, with 91.3% or 167 individuals in the labor force. Within the labor force, the 16 to 19 years age range has the highest percentage of unemployed individuals, with 27.9% or 19 of them being unemployed.
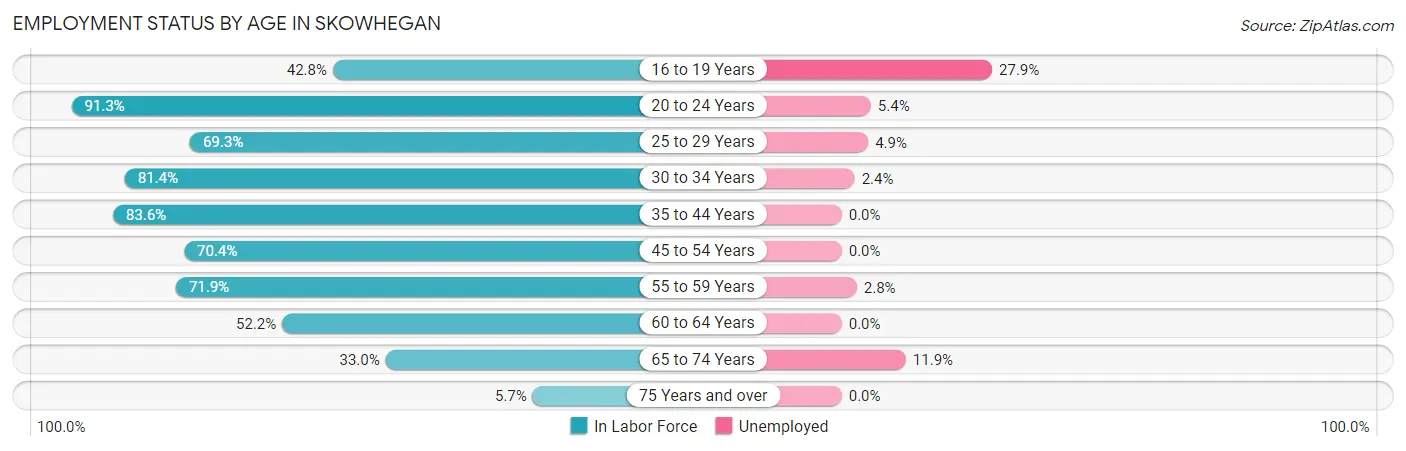
| Age Bracket | In Labor Force | Unemployed |
| 16 to 19 Years | 68 (42.8%) | 19 (27.9%) |
| 20 to 24 Years | 167 (91.3%) | 9 (5.4%) |
| 25 to 29 Years | 244 (69.3%) | 12 (4.9%) |
| 30 to 34 Years | 428 (81.4%) | 10 (2.4%) |
| 35 to 44 Years | 530 (83.6%) | 0 (0.0%) |
| 45 to 54 Years | 378 (70.4%) | 0 (0.0%) |
| 55 to 59 Years | 317 (71.9%) | 9 (2.8%) |
| 60 to 64 Years | 229 (52.2%) | 0 (0.0%) |
| 65 to 74 Years | 260 (33.0%) | 31 (11.9%) |
| 75 Years and over | 65 (5.7%) | 0 (0.0%) |
| Total | 2,686 (51.6%) | 91 (3.4%) |
Employment Status by Educational Attainment in Skowhegan
According to labor force statistics for Skowhegan, 72.6% of individuals (2,126) out of the total population between 25 and 64 years of age (2,929) are in the labor force, with 1.5% or 32 of them being unemployed. The group with the highest labor force participation rate are those with the educational attainment of bachelor's degree or higher, with 86.3% or 527 individuals in the labor force. Within the labor force, individuals with less than high school education have the highest percentage of unemployment, with 16.9% or 10 of them being unemployed.
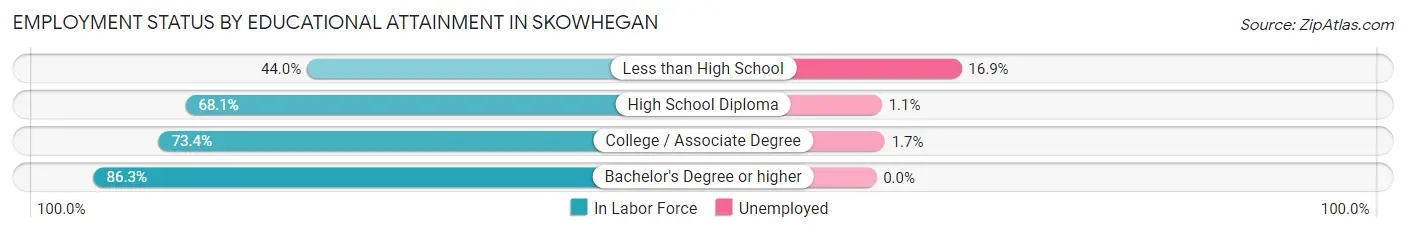
| Educational Attainment | In Labor Force | Unemployed |
| Less than High School | 59 (44.0%) | 23 (16.9%) |
| High School Diploma | 819 (68.1%) | 13 (1.1%) |
| College / Associate Degree | 721 (73.4%) | 17 (1.7%) |
| Bachelor's Degree or higher | 527 (86.3%) | 0 (0.0%) |
| Total | 2,126 (72.6%) | 44 (1.5%) |
Employment Occupations by Sex in Skowhegan
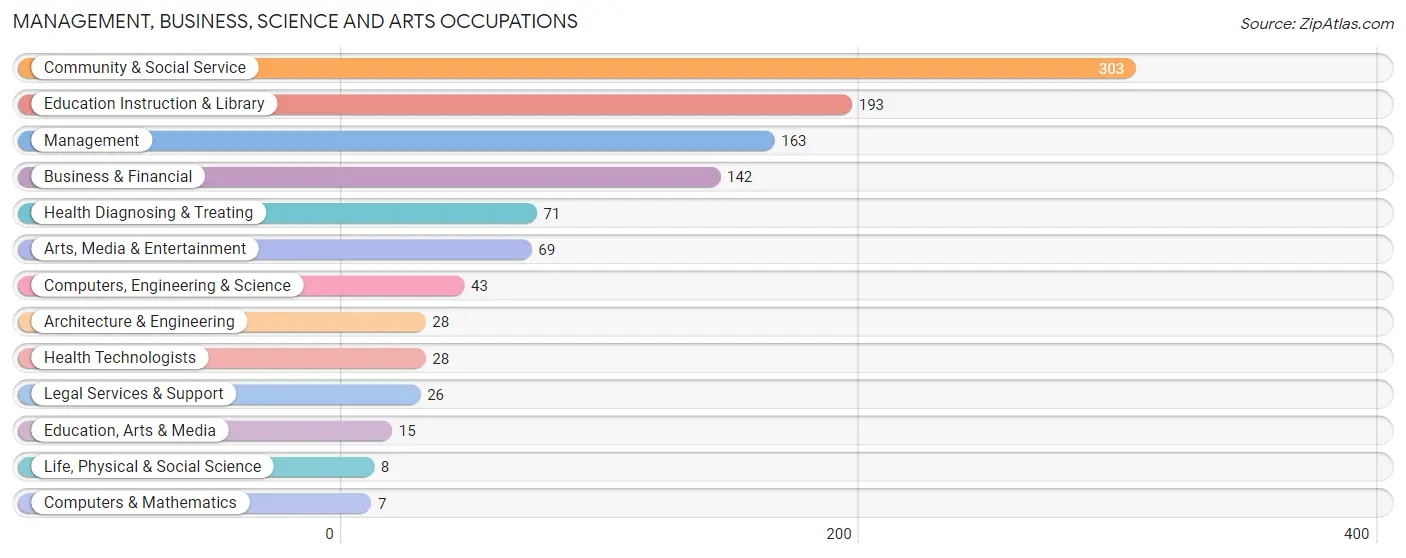
Management, Business, Science and Arts Occupations
The most common Management, Business, Science and Arts occupations in Skowhegan are Community & Social Service (303 | 11.7%), Education Instruction & Library (193 | 7.4%), Management (163 | 6.3%), Business & Financial (142 | 5.5%), and Health Diagnosing & Treating (71 | 2.7%).
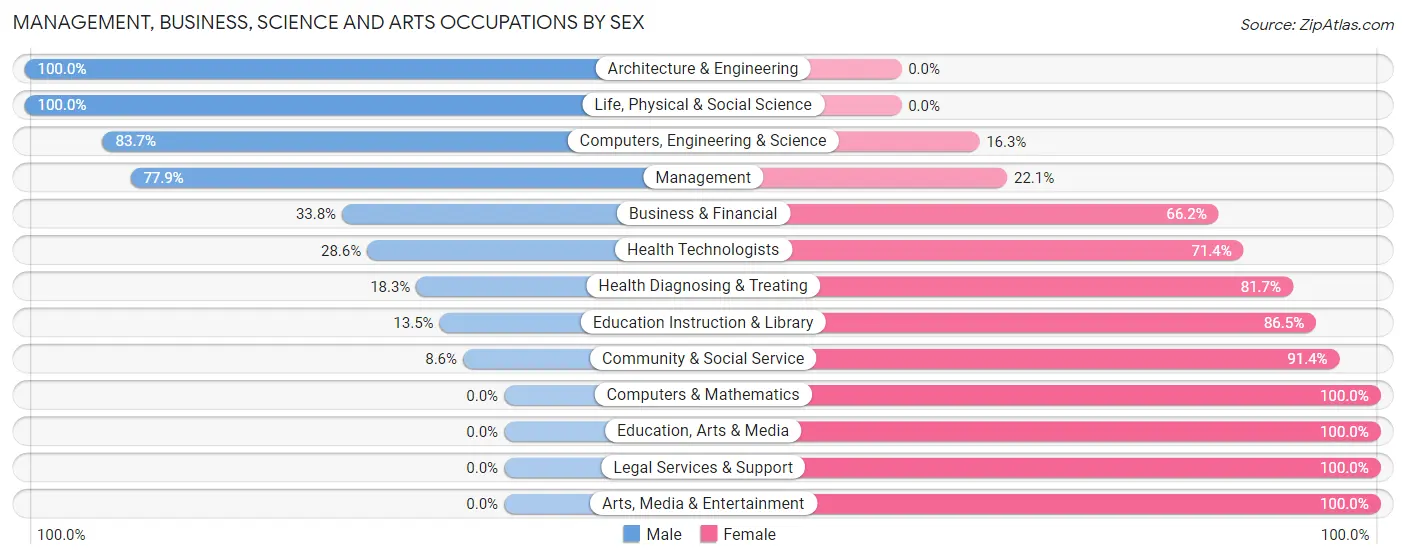
Management, Business, Science and Arts Occupations by Sex
Within the Management, Business, Science and Arts occupations in Skowhegan, the most male-oriented occupations are Architecture & Engineering (100.0%), Life, Physical & Social Science (100.0%), and Computers, Engineering & Science (83.7%), while the most female-oriented occupations are Computers & Mathematics (100.0%), Education, Arts & Media (100.0%), and Legal Services & Support (100.0%).
| Occupation | Male | Female |
| Management | 127 (77.9%) | 36 (22.1%) |
| Business & Financial | 48 (33.8%) | 94 (66.2%) |
| Computers, Engineering & Science | 36 (83.7%) | 7 (16.3%) |
| Computers & Mathematics | 0 (0.0%) | 7 (100.0%) |
| Architecture & Engineering | 28 (100.0%) | 0 (0.0%) |
| Life, Physical & Social Science | 8 (100.0%) | 0 (0.0%) |
| Community & Social Service | 26 (8.6%) | 277 (91.4%) |
| Education, Arts & Media | 0 (0.0%) | 15 (100.0%) |
| Legal Services & Support | 0 (0.0%) | 26 (100.0%) |
| Education Instruction & Library | 26 (13.5%) | 167 (86.5%) |
| Arts, Media & Entertainment | 0 (0.0%) | 69 (100.0%) |
| Health Diagnosing & Treating | 13 (18.3%) | 58 (81.7%) |
| Health Technologists | 8 (28.6%) | 20 (71.4%) |
| Total (Category) | 250 (34.6%) | 472 (65.4%) |
| Total (Overall) | 1,354 (52.3%) | 1,235 (47.7%) |
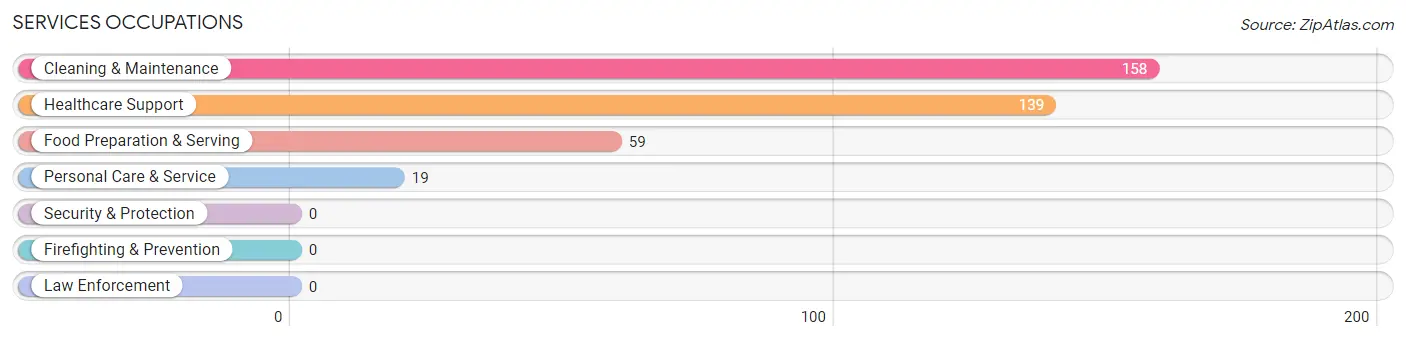
Services Occupations
The most common Services occupations in Skowhegan are Cleaning & Maintenance (158 | 6.1%), Healthcare Support (139 | 5.4%), Food Preparation & Serving (59 | 2.3%), and Personal Care & Service (19 | 0.7%).
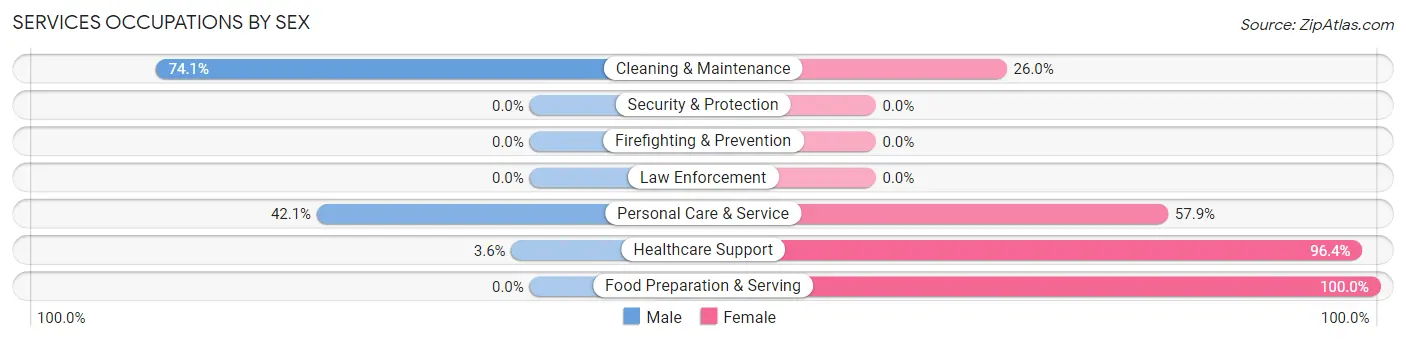
Services Occupations by Sex
Within the Services occupations in Skowhegan, the most male-oriented occupations are Cleaning & Maintenance (74.1%), Personal Care & Service (42.1%), and Healthcare Support (3.6%), while the most female-oriented occupations are Food Preparation & Serving (100.0%), Healthcare Support (96.4%), and Personal Care & Service (57.9%).
| Occupation | Male | Female |
| Healthcare Support | 5 (3.6%) | 134 (96.4%) |
| Security & Protection | 0 (0.0%) | 0 (0.0%) |
| Firefighting & Prevention | 0 (0.0%) | 0 (0.0%) |
| Law Enforcement | 0 (0.0%) | 0 (0.0%) |
| Food Preparation & Serving | 0 (0.0%) | 59 (100.0%) |
| Cleaning & Maintenance | 117 (74.1%) | 41 (26.0%) |
| Personal Care & Service | 8 (42.1%) | 11 (57.9%) |
| Total (Category) | 130 (34.7%) | 245 (65.3%) |
| Total (Overall) | 1,354 (52.3%) | 1,235 (47.7%) |
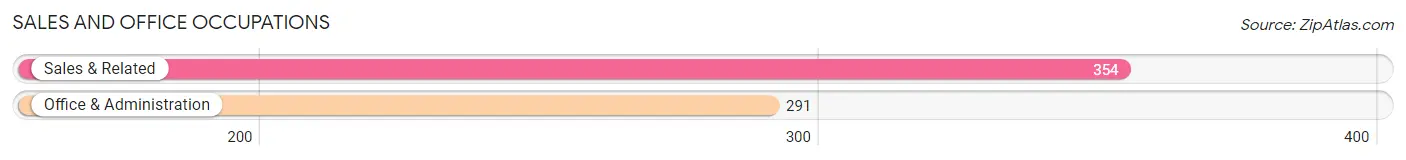
Sales and Office Occupations
The most common Sales and Office occupations in Skowhegan are Sales & Related (354 | 13.7%), and Office & Administration (291 | 11.2%).
Sales and Office Occupations by Sex
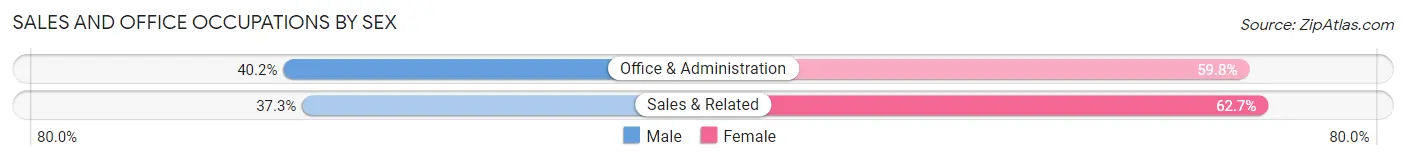
| Occupation | Male | Female |
| Sales & Related | 132 (37.3%) | 222 (62.7%) |
| Office & Administration | 117 (40.2%) | 174 (59.8%) |
| Total (Category) | 249 (38.6%) | 396 (61.4%) |
| Total (Overall) | 1,354 (52.3%) | 1,235 (47.7%) |
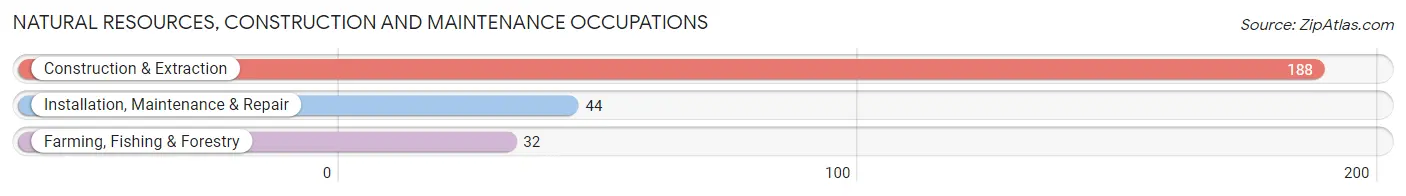
Natural Resources, Construction and Maintenance Occupations
The most common Natural Resources, Construction and Maintenance occupations in Skowhegan are Construction & Extraction (188 | 7.3%), Installation, Maintenance & Repair (44 | 1.7%), and Farming, Fishing & Forestry (32 | 1.2%).
Natural Resources, Construction and Maintenance Occupations by Sex
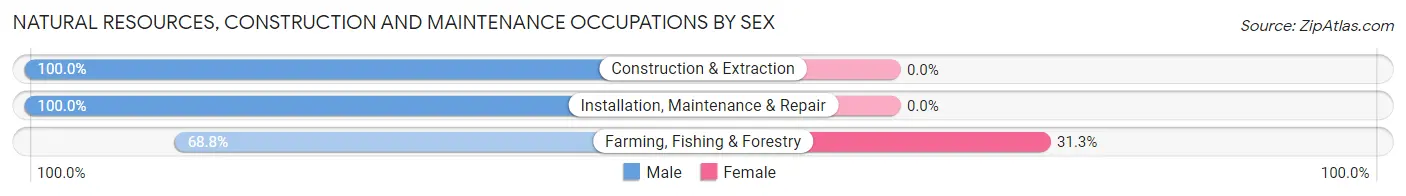
| Occupation | Male | Female |
| Farming, Fishing & Forestry | 22 (68.8%) | 10 (31.2%) |
| Construction & Extraction | 188 (100.0%) | 0 (0.0%) |
| Installation, Maintenance & Repair | 44 (100.0%) | 0 (0.0%) |
| Total (Category) | 254 (96.2%) | 10 (3.8%) |
| Total (Overall) | 1,354 (52.3%) | 1,235 (47.7%) |
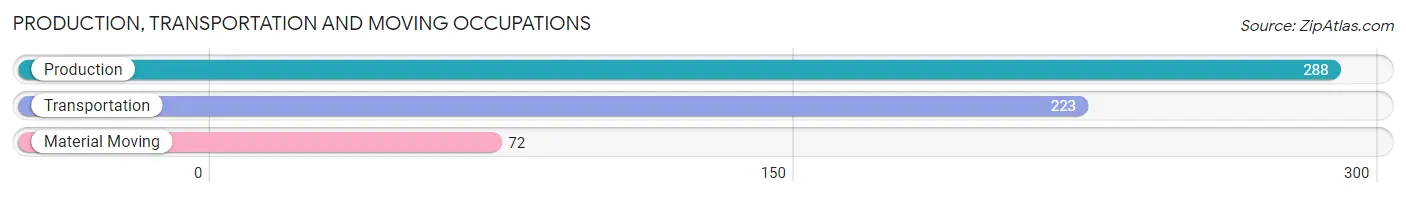
Production, Transportation and Moving Occupations
The most common Production, Transportation and Moving occupations in Skowhegan are Production (288 | 11.1%), Transportation (223 | 8.6%), and Material Moving (72 | 2.8%).
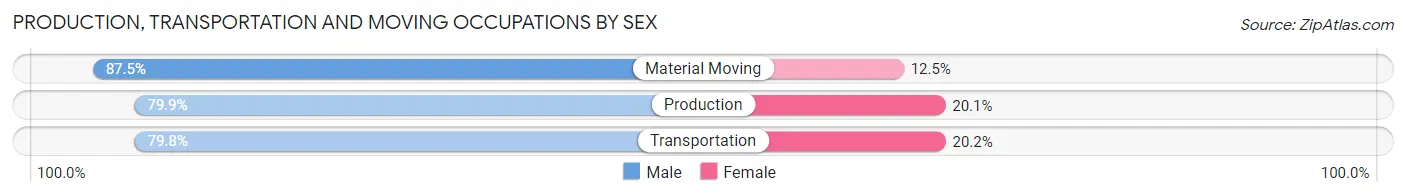
Production, Transportation and Moving Occupations by Sex
| Occupation | Male | Female |
| Production | 230 (79.9%) | 58 (20.1%) |
| Transportation | 178 (79.8%) | 45 (20.2%) |
| Material Moving | 63 (87.5%) | 9 (12.5%) |
| Total (Category) | 471 (80.8%) | 112 (19.2%) |
| Total (Overall) | 1,354 (52.3%) | 1,235 (47.7%) |
Employment Industries by Sex in Skowhegan
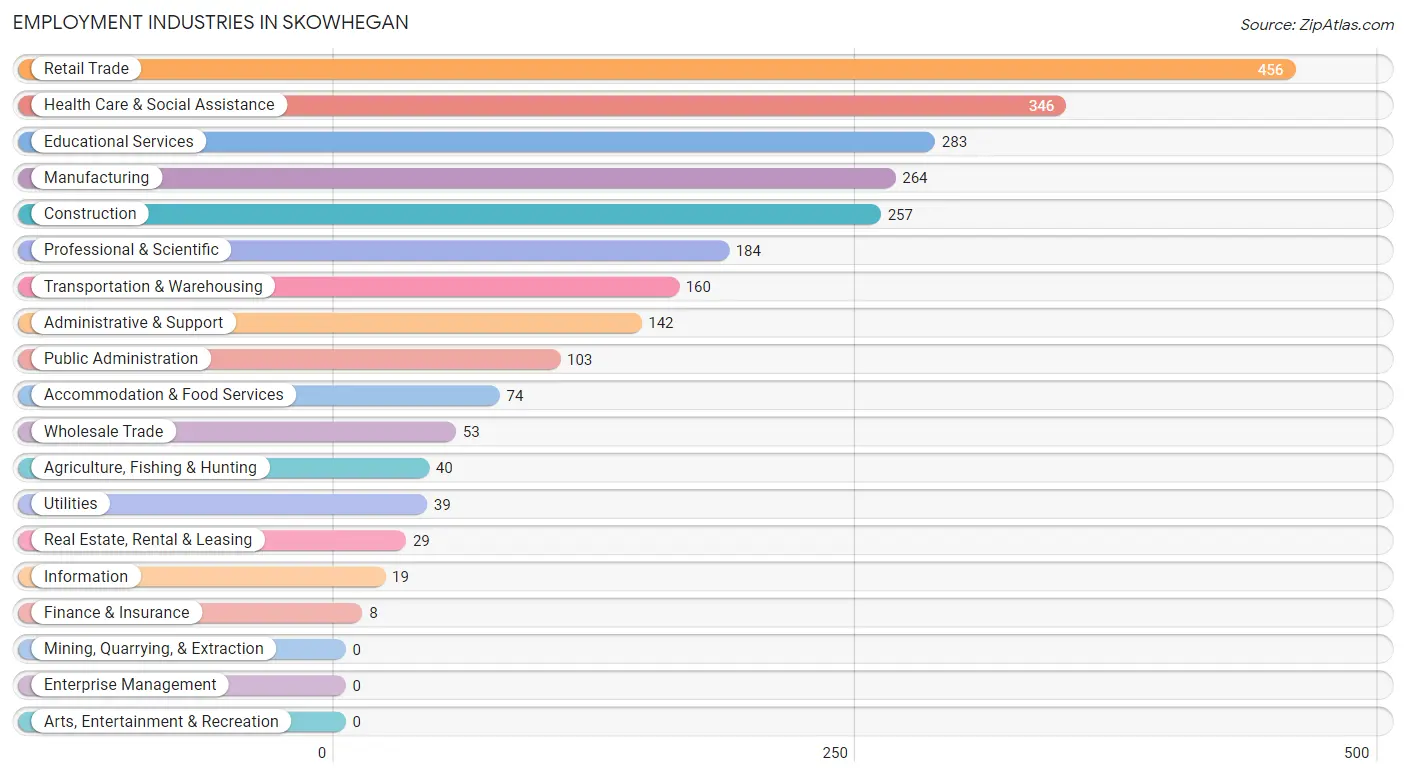
Employment Industries in Skowhegan
The major employment industries in Skowhegan include Retail Trade (456 | 17.6%), Health Care & Social Assistance (346 | 13.4%), Educational Services (283 | 10.9%), Manufacturing (264 | 10.2%), and Construction (257 | 9.9%).
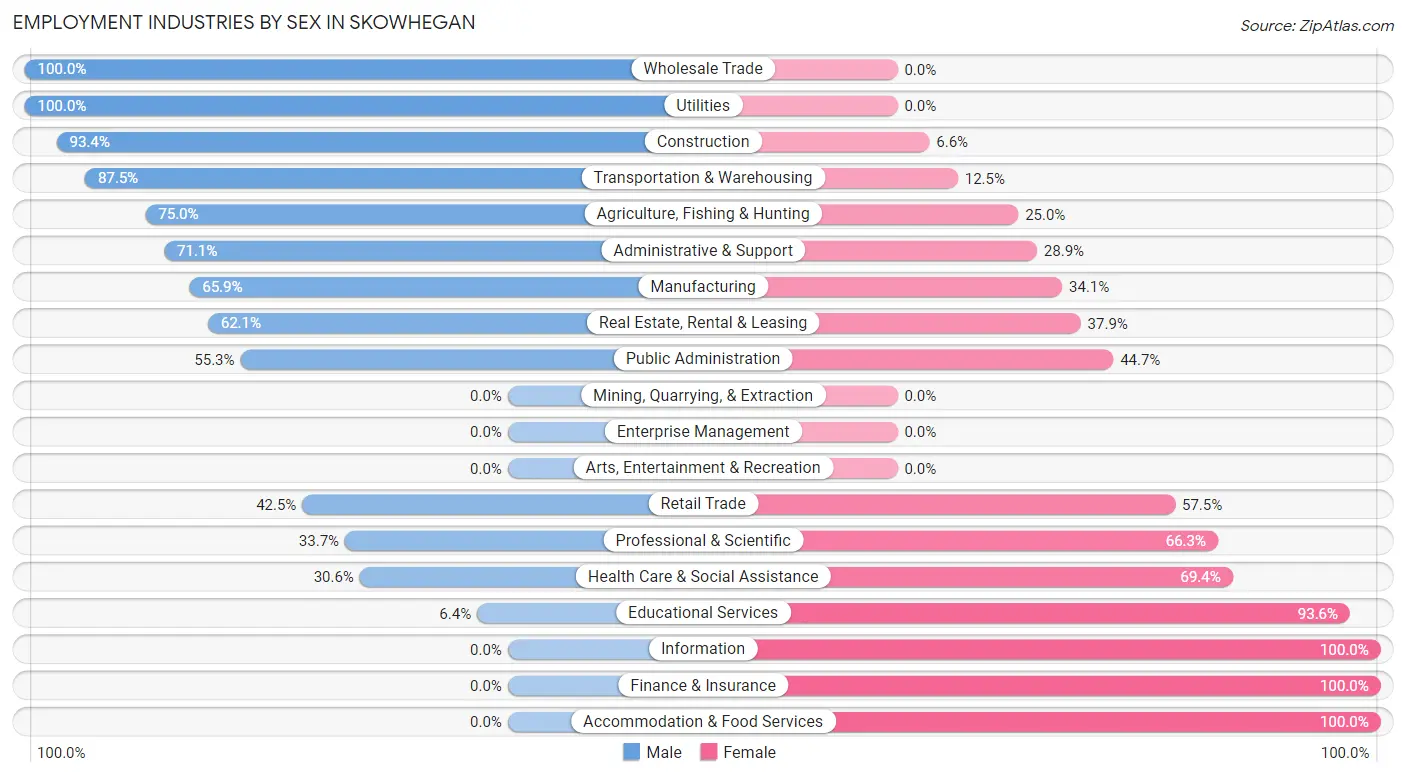
Employment Industries by Sex in Skowhegan
The Skowhegan industries that see more men than women are Wholesale Trade (100.0%), Utilities (100.0%), and Construction (93.4%), whereas the industries that tend to have a higher number of women are Information (100.0%), Finance & Insurance (100.0%), and Accommodation & Food Services (100.0%).
| Industry | Male | Female |
| Agriculture, Fishing & Hunting | 30 (75.0%) | 10 (25.0%) |
| Mining, Quarrying, & Extraction | 0 (0.0%) | 0 (0.0%) |
| Construction | 240 (93.4%) | 17 (6.6%) |
| Manufacturing | 174 (65.9%) | 90 (34.1%) |
| Wholesale Trade | 53 (100.0%) | 0 (0.0%) |
| Retail Trade | 194 (42.5%) | 262 (57.5%) |
| Transportation & Warehousing | 140 (87.5%) | 20 (12.5%) |
| Utilities | 39 (100.0%) | 0 (0.0%) |
| Information | 0 (0.0%) | 19 (100.0%) |
| Finance & Insurance | 0 (0.0%) | 8 (100.0%) |
| Real Estate, Rental & Leasing | 18 (62.1%) | 11 (37.9%) |
| Professional & Scientific | 62 (33.7%) | 122 (66.3%) |
| Enterprise Management | 0 (0.0%) | 0 (0.0%) |
| Administrative & Support | 101 (71.1%) | 41 (28.9%) |
| Educational Services | 18 (6.4%) | 265 (93.6%) |
| Health Care & Social Assistance | 106 (30.6%) | 240 (69.4%) |
| Arts, Entertainment & Recreation | 0 (0.0%) | 0 (0.0%) |
| Accommodation & Food Services | 0 (0.0%) | 74 (100.0%) |
| Public Administration | 57 (55.3%) | 46 (44.7%) |
| Total | 1,354 (52.3%) | 1,235 (47.7%) |
Education in Skowhegan
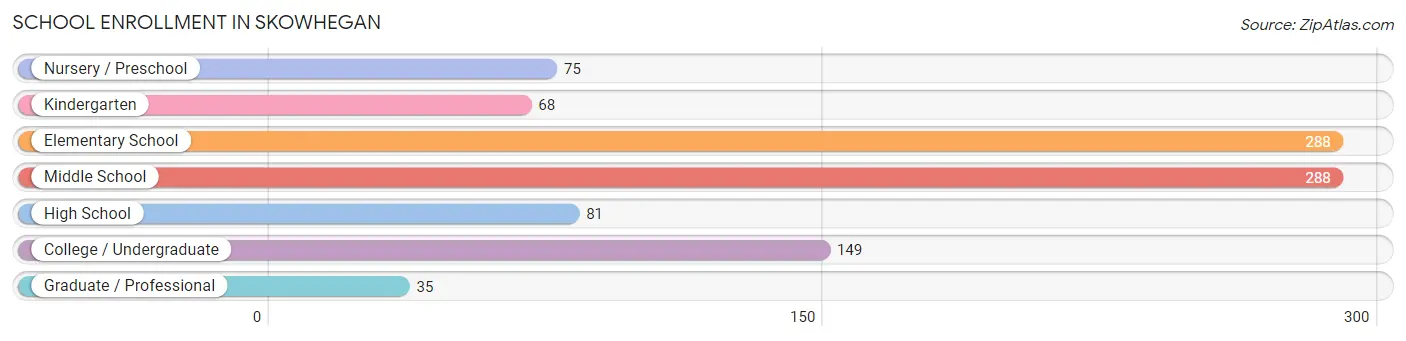
School Enrollment in Skowhegan
The most common levels of schooling among the 984 students in Skowhegan are elementary school (288 | 29.3%), middle school (288 | 29.3%), and college / undergraduate (149 | 15.1%).
| School Level | # Students | % Students |
| Nursery / Preschool | 75 | 7.6% |
| Kindergarten | 68 | 6.9% |
| Elementary School | 288 | 29.3% |
| Middle School | 288 | 29.3% |
| High School | 81 | 8.2% |
| College / Undergraduate | 149 | 15.1% |
| Graduate / Professional | 35 | 3.6% |
| Total | 984 | 100.0% |
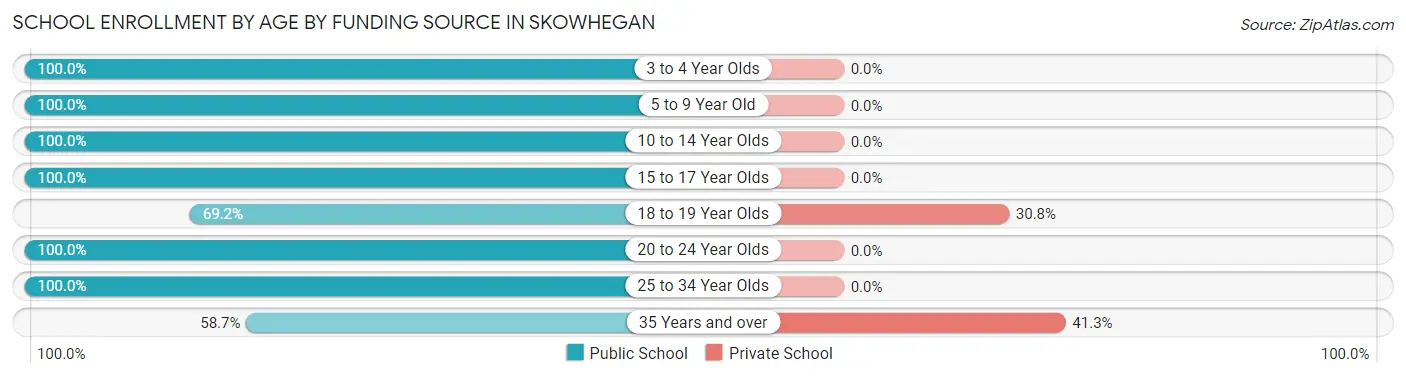
School Enrollment by Age by Funding Source in Skowhegan
Out of a total of 984 students who are enrolled in schools in Skowhegan, 31 (3.2%) attend a private institution, while the remaining 953 (96.8%) are enrolled in public schools. The age group of 35 years and over has the highest likelihood of being enrolled in private schools, with 19 (41.3% in the age bracket) enrolled. Conversely, the age group of 3 to 4 year olds has the lowest likelihood of being enrolled in a private school, with 75 (100.0% in the age bracket) attending a public institution.
| Age Bracket | Public School | Private School |
| 3 to 4 Year Olds | 75 (100.0%) | 0 (0.0%) |
| 5 to 9 Year Old | 335 (100.0%) | 0 (0.0%) |
| 10 to 14 Year Olds | 309 (100.0%) | 0 (0.0%) |
| 15 to 17 Year Olds | 55 (100.0%) | 0 (0.0%) |
| 18 to 19 Year Olds | 27 (69.2%) | 12 (30.8%) |
| 20 to 24 Year Olds | 64 (100.0%) | 0 (0.0%) |
| 25 to 34 Year Olds | 61 (100.0%) | 0 (0.0%) |
| 35 Years and over | 27 (58.7%) | 19 (41.3%) |
| Total | 953 (96.8%) | 31 (3.2%) |
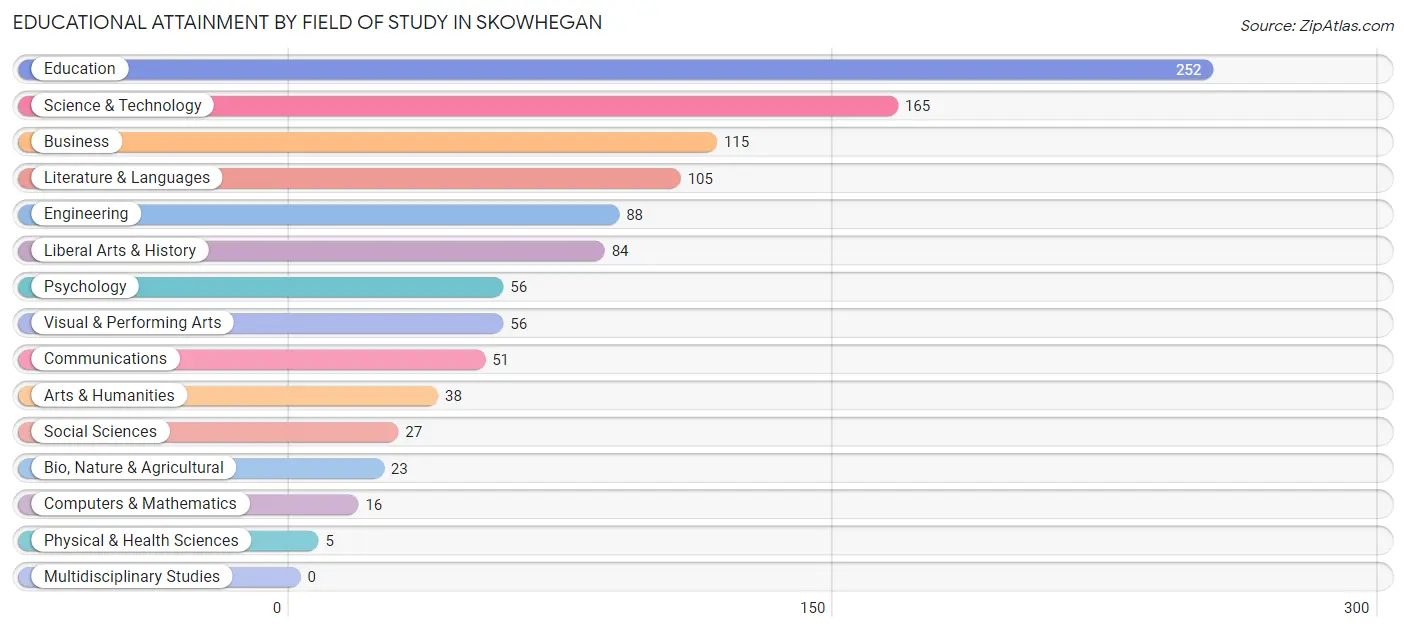
Educational Attainment by Field of Study in Skowhegan
Education (252 | 23.3%), science & technology (165 | 15.3%), business (115 | 10.6%), literature & languages (105 | 9.7%), and engineering (88 | 8.1%) are the most common fields of study among 1,081 individuals in Skowhegan who have obtained a bachelor's degree or higher.
| Field of Study | # Graduates | % Graduates |
| Computers & Mathematics | 16 | 1.5% |
| Bio, Nature & Agricultural | 23 | 2.1% |
| Physical & Health Sciences | 5 | 0.5% |
| Psychology | 56 | 5.2% |
| Social Sciences | 27 | 2.5% |
| Engineering | 88 | 8.1% |
| Multidisciplinary Studies | 0 | 0.0% |
| Science & Technology | 165 | 15.3% |
| Business | 115 | 10.6% |
| Education | 252 | 23.3% |
| Literature & Languages | 105 | 9.7% |
| Liberal Arts & History | 84 | 7.8% |
| Visual & Performing Arts | 56 | 5.2% |
| Communications | 51 | 4.7% |
| Arts & Humanities | 38 | 3.5% |
| Total | 1,081 | 100.0% |
Transportation & Commute in Skowhegan
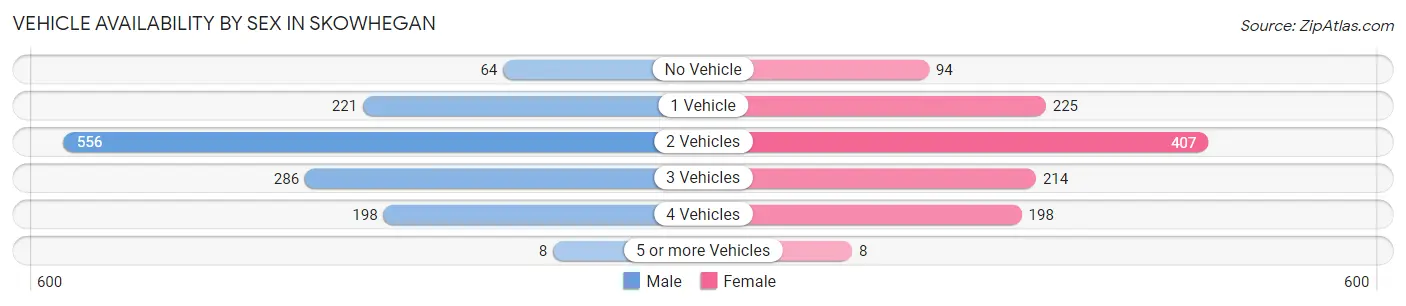
Vehicle Availability by Sex in Skowhegan
The most prevalent vehicle ownership categories in Skowhegan are males with 2 vehicles (556, accounting for 41.7%) and females with 2 vehicles (407, making up 48.5%).
| Vehicles Available | Male | Female |
| No Vehicle | 64 (4.8%) | 94 (8.2%) |
| 1 Vehicle | 221 (16.6%) | 225 (19.6%) |
| 2 Vehicles | 556 (41.7%) | 407 (35.5%) |
| 3 Vehicles | 286 (21.5%) | 214 (18.7%) |
| 4 Vehicles | 198 (14.8%) | 198 (17.3%) |
| 5 or more Vehicles | 8 (0.6%) | 8 (0.7%) |
| Total | 1,333 (100.0%) | 1,146 (100.0%) |
Commute Time in Skowhegan
The most frequently occuring commute durations in Skowhegan are 5 to 9 minutes (675 commuters, 28.9%), 10 to 14 minutes (255 commuters, 10.9%), and 45 to 59 minutes (245 commuters, 10.5%).
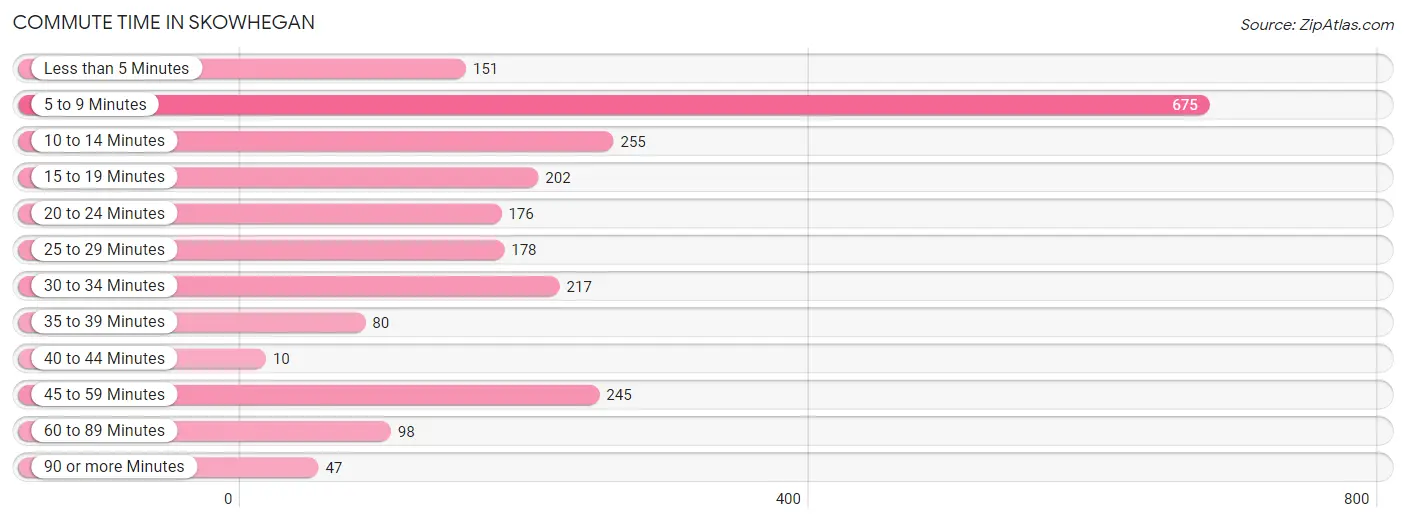
| Commute Time | # Commuters | % Commuters |
| Less than 5 Minutes | 151 | 6.5% |
| 5 to 9 Minutes | 675 | 28.9% |
| 10 to 14 Minutes | 255 | 10.9% |
| 15 to 19 Minutes | 202 | 8.6% |
| 20 to 24 Minutes | 176 | 7.5% |
| 25 to 29 Minutes | 178 | 7.6% |
| 30 to 34 Minutes | 217 | 9.3% |
| 35 to 39 Minutes | 80 | 3.4% |
| 40 to 44 Minutes | 10 | 0.4% |
| 45 to 59 Minutes | 245 | 10.5% |
| 60 to 89 Minutes | 98 | 4.2% |
| 90 or more Minutes | 47 | 2.0% |
Commute Time by Sex in Skowhegan
The most common commute times in Skowhegan are 5 to 9 minutes (300 commuters, 24.3%) for males and 5 to 9 minutes (375 commuters, 34.1%) for females.
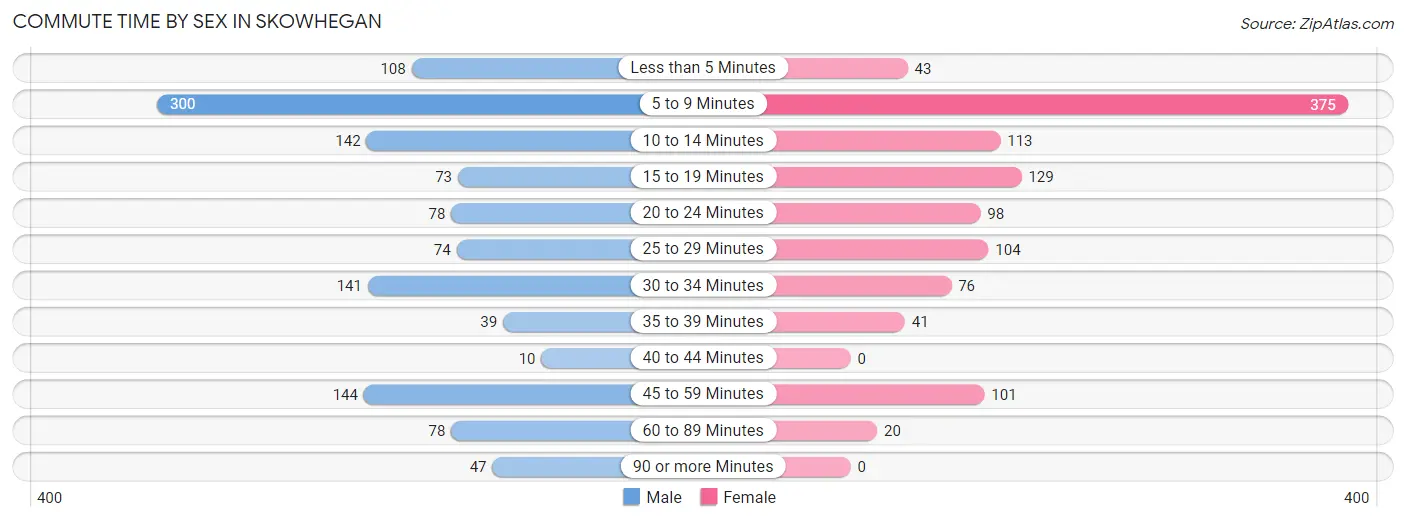
| Commute Time | Male | Female |
| Less than 5 Minutes | 108 (8.7%) | 43 (3.9%) |
| 5 to 9 Minutes | 300 (24.3%) | 375 (34.1%) |
| 10 to 14 Minutes | 142 (11.5%) | 113 (10.3%) |
| 15 to 19 Minutes | 73 (5.9%) | 129 (11.7%) |
| 20 to 24 Minutes | 78 (6.3%) | 98 (8.9%) |
| 25 to 29 Minutes | 74 (6.0%) | 104 (9.5%) |
| 30 to 34 Minutes | 141 (11.4%) | 76 (6.9%) |
| 35 to 39 Minutes | 39 (3.2%) | 41 (3.7%) |
| 40 to 44 Minutes | 10 (0.8%) | 0 (0.0%) |
| 45 to 59 Minutes | 144 (11.7%) | 101 (9.2%) |
| 60 to 89 Minutes | 78 (6.3%) | 20 (1.8%) |
| 90 or more Minutes | 47 (3.8%) | 0 (0.0%) |
Time of Departure to Work by Sex in Skowhegan
The most frequent times of departure to work in Skowhegan are 12:00 AM to 4:59 AM (181, 14.7%) for males and 7:00 AM to 7:29 AM (220, 20.0%) for females.
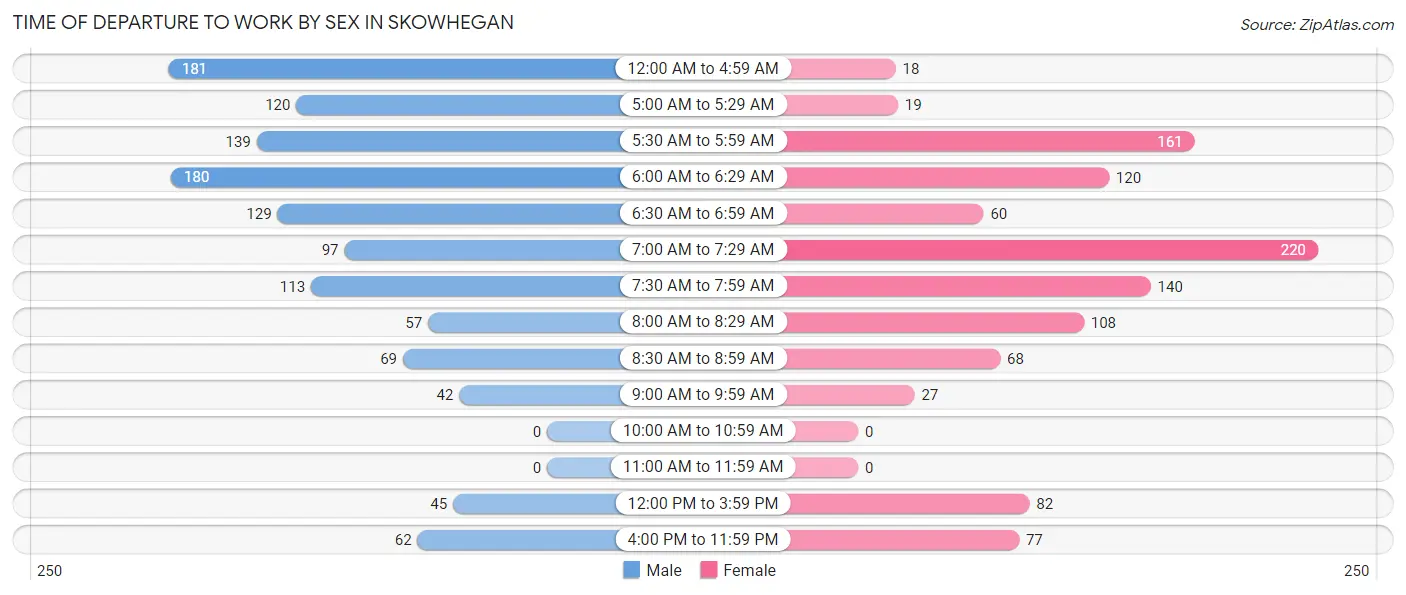
| Time of Departure | Male | Female |
| 12:00 AM to 4:59 AM | 181 (14.7%) | 18 (1.6%) |
| 5:00 AM to 5:29 AM | 120 (9.7%) | 19 (1.7%) |
| 5:30 AM to 5:59 AM | 139 (11.3%) | 161 (14.6%) |
| 6:00 AM to 6:29 AM | 180 (14.6%) | 120 (10.9%) |
| 6:30 AM to 6:59 AM | 129 (10.4%) | 60 (5.4%) |
| 7:00 AM to 7:29 AM | 97 (7.9%) | 220 (20.0%) |
| 7:30 AM to 7:59 AM | 113 (9.2%) | 140 (12.7%) |
| 8:00 AM to 8:29 AM | 57 (4.6%) | 108 (9.8%) |
| 8:30 AM to 8:59 AM | 69 (5.6%) | 68 (6.2%) |
| 9:00 AM to 9:59 AM | 42 (3.4%) | 27 (2.5%) |
| 10:00 AM to 10:59 AM | 0 (0.0%) | 0 (0.0%) |
| 11:00 AM to 11:59 AM | 0 (0.0%) | 0 (0.0%) |
| 12:00 PM to 3:59 PM | 45 (3.6%) | 82 (7.4%) |
| 4:00 PM to 11:59 PM | 62 (5.0%) | 77 (7.0%) |
| Total | 1,234 (100.0%) | 1,100 (100.0%) |
Housing Occupancy in Skowhegan
Occupancy by Ownership in Skowhegan
Of the total 2,884 dwellings in Skowhegan, owner-occupied units account for 1,750 (60.7%), while renter-occupied units make up 1,134 (39.3%).
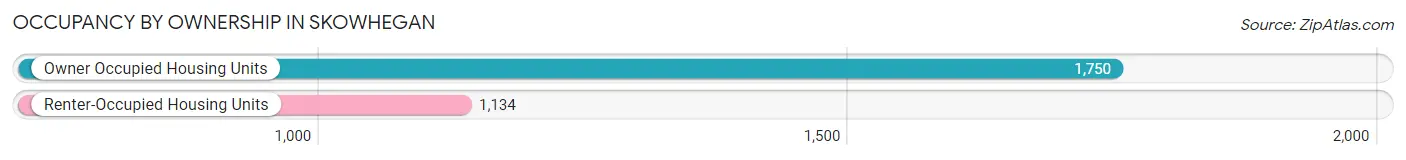
| Occupancy | # Housing Units | % Housing Units |
| Owner Occupied Housing Units | 1,750 | 60.7% |
| Renter-Occupied Housing Units | 1,134 | 39.3% |
| Total Occupied Housing Units | 2,884 | 100.0% |
Occupancy by Household Size in Skowhegan
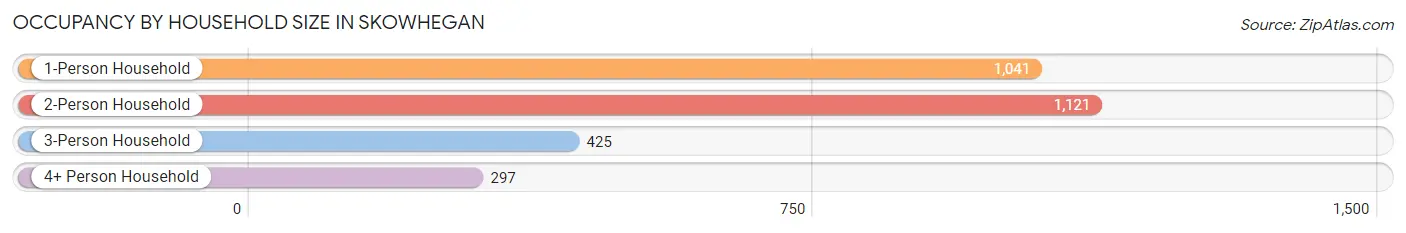
| Household Size | # Housing Units | % Housing Units |
| 1-Person Household | 1,041 | 36.1% |
| 2-Person Household | 1,121 | 38.9% |
| 3-Person Household | 425 | 14.7% |
| 4+ Person Household | 297 | 10.3% |
| Total Housing Units | 2,884 | 100.0% |
Occupancy by Ownership by Household Size in Skowhegan
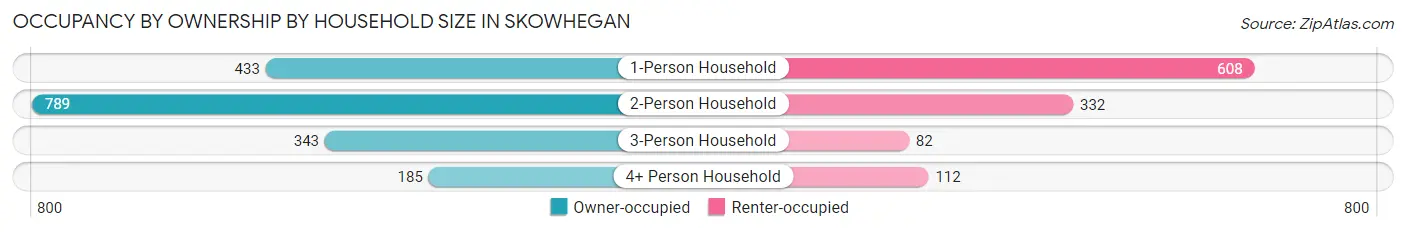
| Household Size | Owner-occupied | Renter-occupied |
| 1-Person Household | 433 (41.6%) | 608 (58.4%) |
| 2-Person Household | 789 (70.4%) | 332 (29.6%) |
| 3-Person Household | 343 (80.7%) | 82 (19.3%) |
| 4+ Person Household | 185 (62.3%) | 112 (37.7%) |
| Total Housing Units | 1,750 (60.7%) | 1,134 (39.3%) |
Occupancy by Educational Attainment in Skowhegan
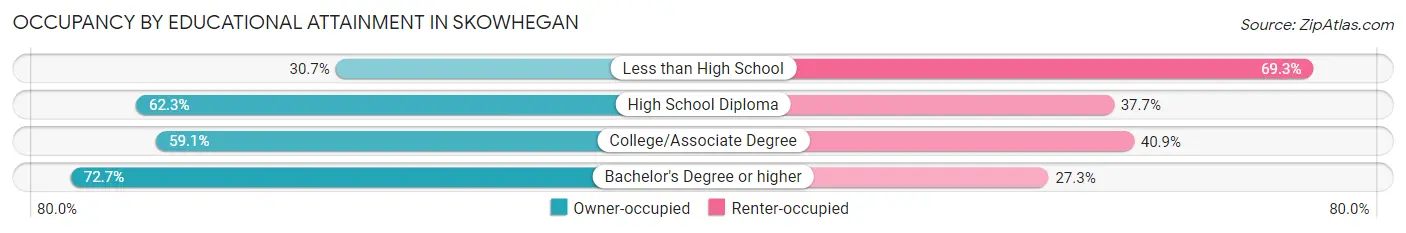
| Household Size | Owner-occupied | Renter-occupied |
| Less than High School | 77 (30.7%) | 174 (69.3%) |
| High School Diploma | 708 (62.3%) | 428 (37.7%) |
| College/Associate Degree | 537 (59.1%) | 371 (40.9%) |
| Bachelor's Degree or higher | 428 (72.7%) | 161 (27.3%) |
Occupancy by Age of Householder in Skowhegan
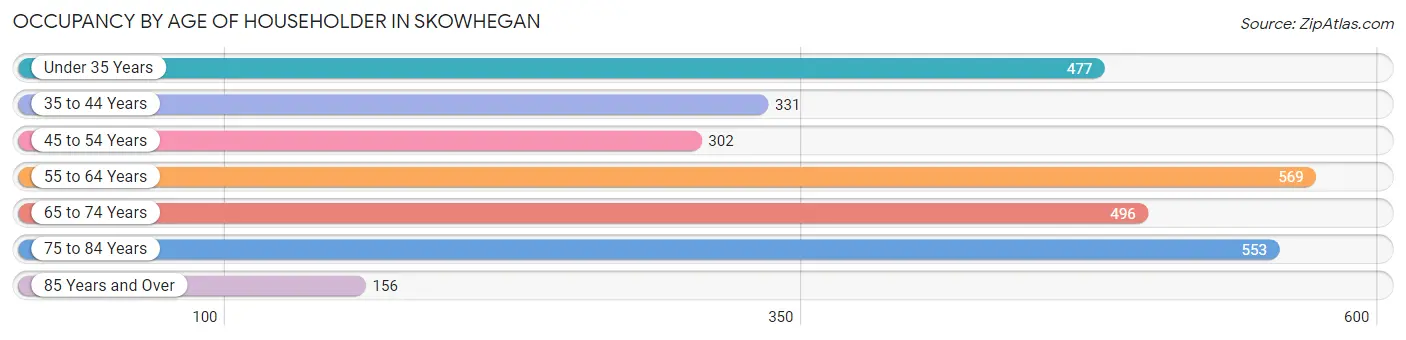
| Age Bracket | # Households | % Households |
| Under 35 Years | 477 | 16.5% |
| 35 to 44 Years | 331 | 11.5% |
| 45 to 54 Years | 302 | 10.5% |
| 55 to 64 Years | 569 | 19.7% |
| 65 to 74 Years | 496 | 17.2% |
| 75 to 84 Years | 553 | 19.2% |
| 85 Years and Over | 156 | 5.4% |
| Total | 2,884 | 100.0% |
Housing Finances in Skowhegan
Median Income by Occupancy in Skowhegan
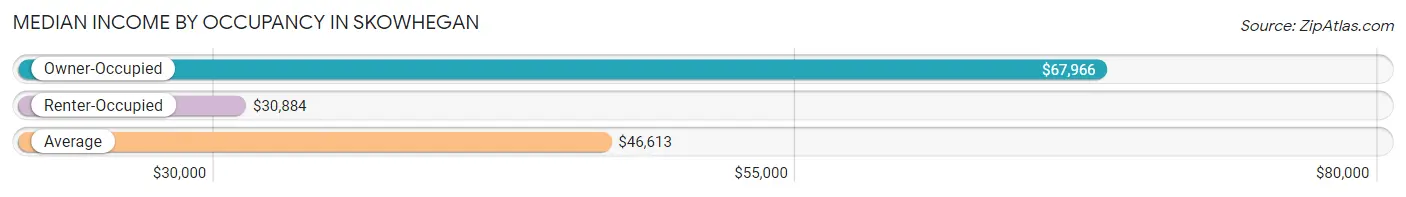
| Occupancy Type | # Households | Median Income |
| Owner-Occupied | 1,750 (60.7%) | $67,966 |
| Renter-Occupied | 1,134 (39.3%) | $30,884 |
| Average | 2,884 (100.0%) | $46,613 |
Occupancy by Householder Income Bracket in Skowhegan
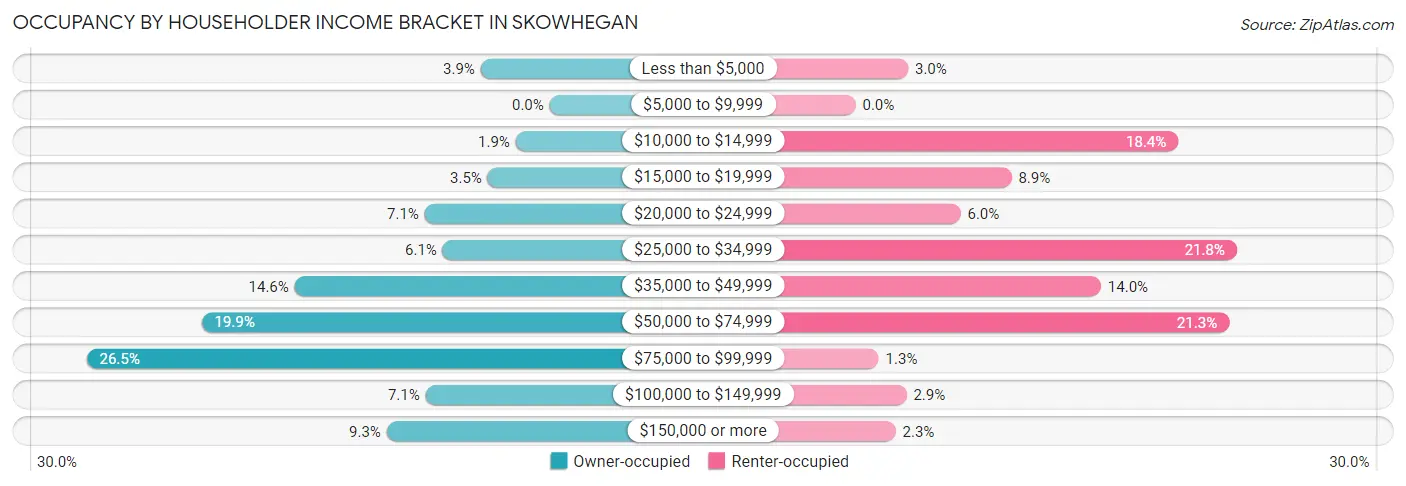
| Income Bracket | Owner-occupied | Renter-occupied |
| Less than $5,000 | 69 (3.9%) | 34 (3.0%) |
| $5,000 to $9,999 | 0 (0.0%) | 0 (0.0%) |
| $10,000 to $14,999 | 34 (1.9%) | 209 (18.4%) |
| $15,000 to $19,999 | 62 (3.5%) | 101 (8.9%) |
| $20,000 to $24,999 | 125 (7.1%) | 68 (6.0%) |
| $25,000 to $34,999 | 107 (6.1%) | 247 (21.8%) |
| $35,000 to $49,999 | 255 (14.6%) | 159 (14.0%) |
| $50,000 to $74,999 | 348 (19.9%) | 242 (21.3%) |
| $75,000 to $99,999 | 463 (26.5%) | 15 (1.3%) |
| $100,000 to $149,999 | 124 (7.1%) | 33 (2.9%) |
| $150,000 or more | 163 (9.3%) | 26 (2.3%) |
| Total | 1,750 (100.0%) | 1,134 (100.0%) |
Monthly Housing Cost Tiers in Skowhegan
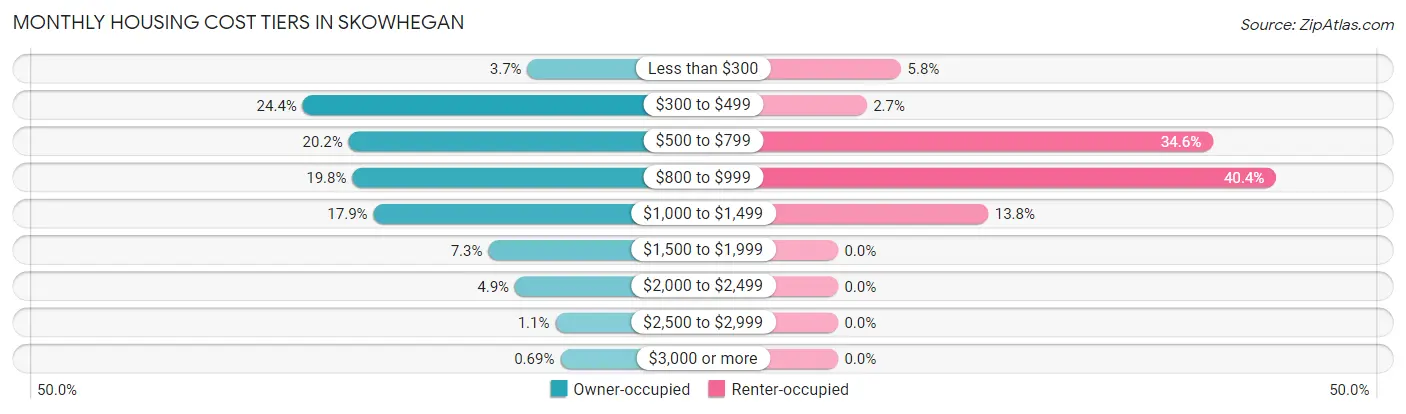
| Monthly Cost | Owner-occupied | Renter-occupied |
| Less than $300 | 65 (3.7%) | 66 (5.8%) |
| $300 to $499 | 427 (24.4%) | 30 (2.6%) |
| $500 to $799 | 353 (20.2%) | 392 (34.6%) |
| $800 to $999 | 347 (19.8%) | 458 (40.4%) |
| $1,000 to $1,499 | 313 (17.9%) | 157 (13.8%) |
| $1,500 to $1,999 | 128 (7.3%) | 0 (0.0%) |
| $2,000 to $2,499 | 85 (4.9%) | 0 (0.0%) |
| $2,500 to $2,999 | 20 (1.1%) | 0 (0.0%) |
| $3,000 or more | 12 (0.7%) | 0 (0.0%) |
| Total | 1,750 (100.0%) | 1,134 (100.0%) |
Physical Housing Characteristics in Skowhegan
Housing Structures in Skowhegan
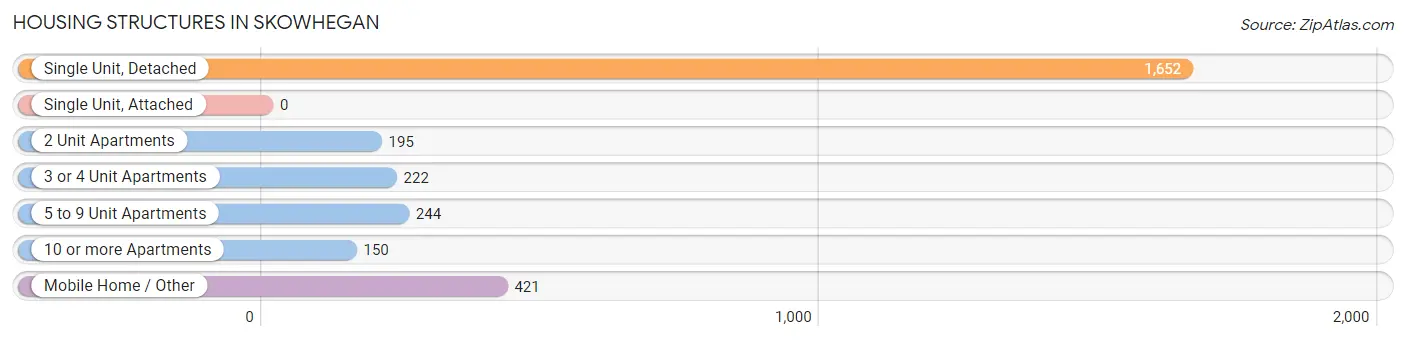
| Structure Type | # Housing Units | % Housing Units |
| Single Unit, Detached | 1,652 | 57.3% |
| Single Unit, Attached | 0 | 0.0% |
| 2 Unit Apartments | 195 | 6.8% |
| 3 or 4 Unit Apartments | 222 | 7.7% |
| 5 to 9 Unit Apartments | 244 | 8.5% |
| 10 or more Apartments | 150 | 5.2% |
| Mobile Home / Other | 421 | 14.6% |
| Total | 2,884 | 100.0% |
Housing Structures by Occupancy in Skowhegan
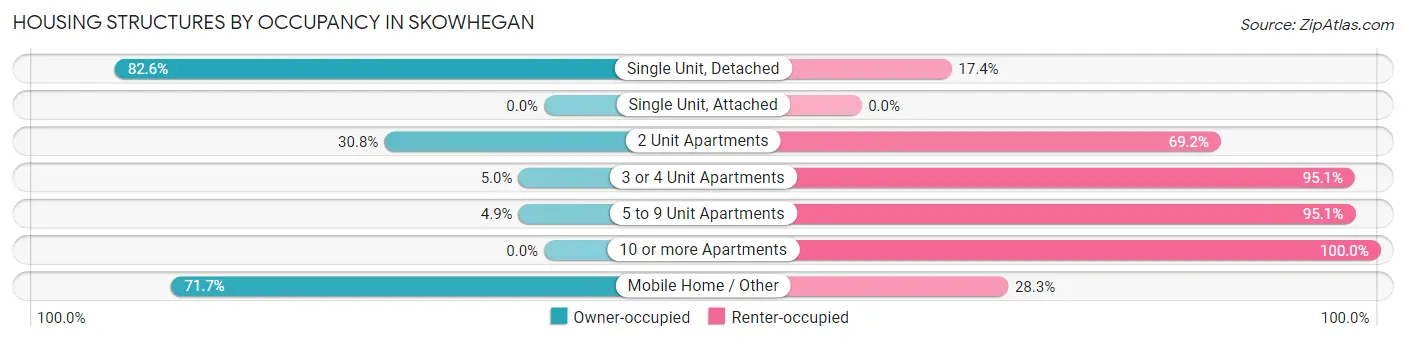
| Structure Type | Owner-occupied | Renter-occupied |
| Single Unit, Detached | 1,365 (82.6%) | 287 (17.4%) |
| Single Unit, Attached | 0 (0.0%) | 0 (0.0%) |
| 2 Unit Apartments | 60 (30.8%) | 135 (69.2%) |
| 3 or 4 Unit Apartments | 11 (5.0%) | 211 (95.1%) |
| 5 to 9 Unit Apartments | 12 (4.9%) | 232 (95.1%) |
| 10 or more Apartments | 0 (0.0%) | 150 (100.0%) |
| Mobile Home / Other | 302 (71.7%) | 119 (28.3%) |
| Total | 1,750 (60.7%) | 1,134 (39.3%) |
Housing Structures by Number of Rooms in Skowhegan
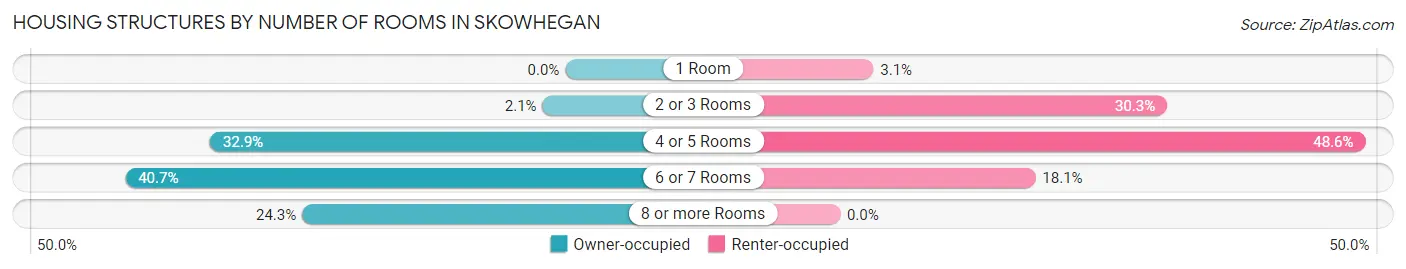
| Number of Rooms | Owner-occupied | Renter-occupied |
| 1 Room | 0 (0.0%) | 35 (3.1%) |
| 2 or 3 Rooms | 37 (2.1%) | 343 (30.2%) |
| 4 or 5 Rooms | 575 (32.9%) | 551 (48.6%) |
| 6 or 7 Rooms | 712 (40.7%) | 205 (18.1%) |
| 8 or more Rooms | 426 (24.3%) | 0 (0.0%) |
| Total | 1,750 (100.0%) | 1,134 (100.0%) |
Housing Structure by Heating Type in Skowhegan
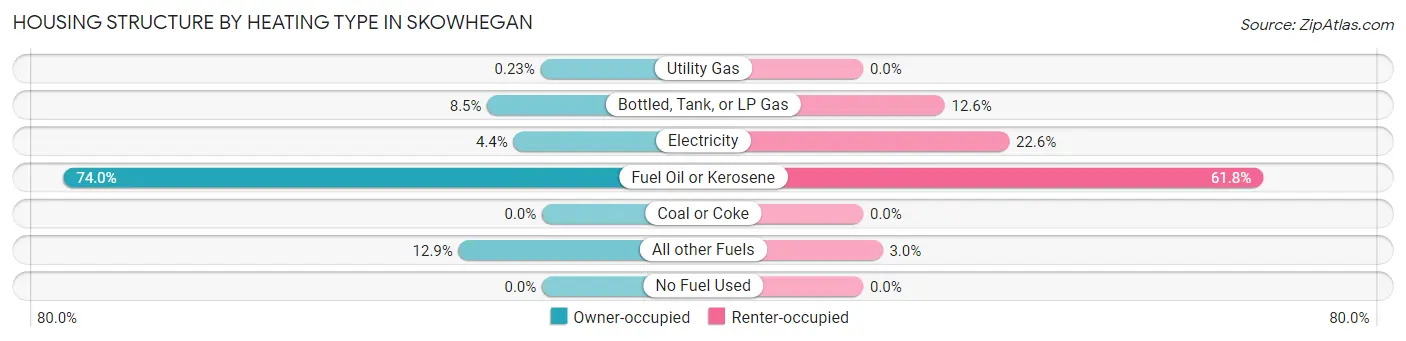
| Heating Type | Owner-occupied | Renter-occupied |
| Utility Gas | 4 (0.2%) | 0 (0.0%) |
| Bottled, Tank, or LP Gas | 148 (8.5%) | 143 (12.6%) |
| Electricity | 77 (4.4%) | 256 (22.6%) |
| Fuel Oil or Kerosene | 1,295 (74.0%) | 701 (61.8%) |
| Coal or Coke | 0 (0.0%) | 0 (0.0%) |
| All other Fuels | 226 (12.9%) | 34 (3.0%) |
| No Fuel Used | 0 (0.0%) | 0 (0.0%) |
| Total | 1,750 (100.0%) | 1,134 (100.0%) |
Household Vehicle Usage in Skowhegan
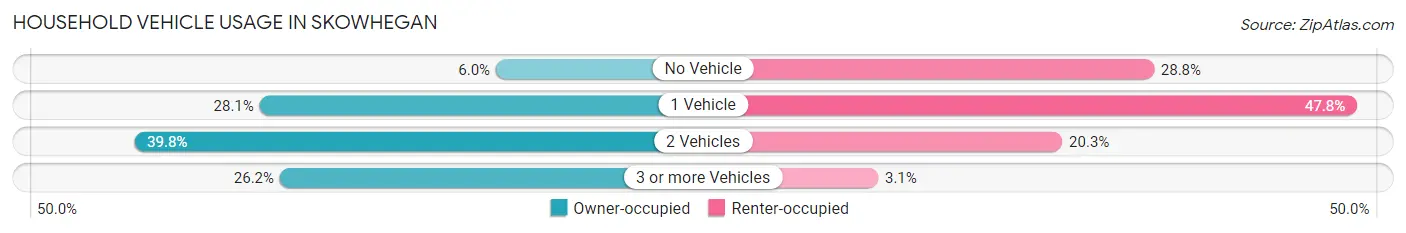
| Vehicles per Household | Owner-occupied | Renter-occupied |
| No Vehicle | 105 (6.0%) | 327 (28.8%) |
| 1 Vehicle | 491 (28.1%) | 542 (47.8%) |
| 2 Vehicles | 696 (39.8%) | 230 (20.3%) |
| 3 or more Vehicles | 458 (26.2%) | 35 (3.1%) |
| Total | 1,750 (100.0%) | 1,134 (100.0%) |
Real Estate & Mortgages in Skowhegan
Real Estate and Mortgage Overview in Skowhegan
| Characteristic | Without Mortgage | With Mortgage |
| Housing Units | 728 | 1,022 |
| Median Property Value | $99,200 | $145,700 |
| Median Household Income | $53,690 | $129 |
| Monthly Housing Costs | $444 | $12 |
| Real Estate Taxes | $1,320 | $83 |
Property Value by Mortgage Status in Skowhegan
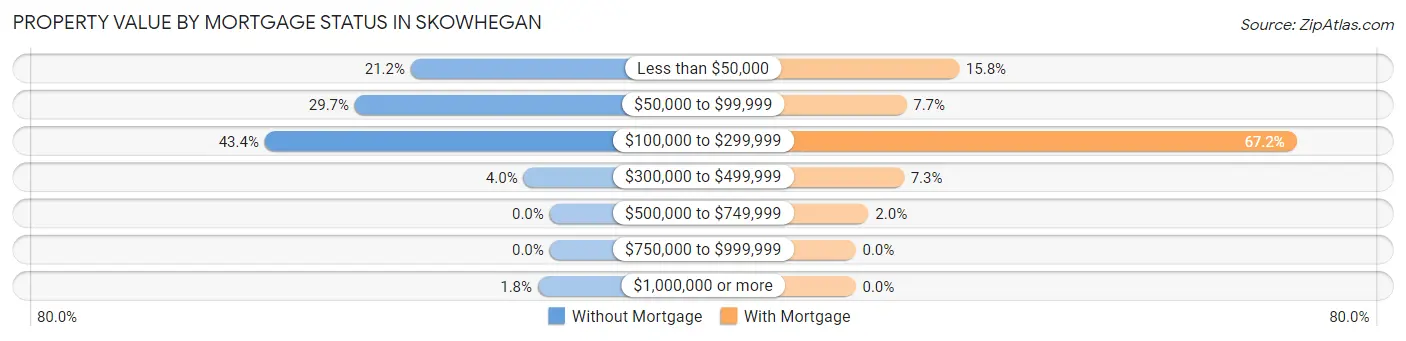
| Property Value | Without Mortgage | With Mortgage |
| Less than $50,000 | 154 (21.1%) | 161 (15.8%) |
| $50,000 to $99,999 | 216 (29.7%) | 79 (7.7%) |
| $100,000 to $299,999 | 316 (43.4%) | 687 (67.2%) |
| $300,000 to $499,999 | 29 (4.0%) | 75 (7.3%) |
| $500,000 to $749,999 | 0 (0.0%) | 20 (2.0%) |
| $750,000 to $999,999 | 0 (0.0%) | 0 (0.0%) |
| $1,000,000 or more | 13 (1.8%) | 0 (0.0%) |
| Total | 728 (100.0%) | 1,022 (100.0%) |
Household Income by Mortgage Status in Skowhegan
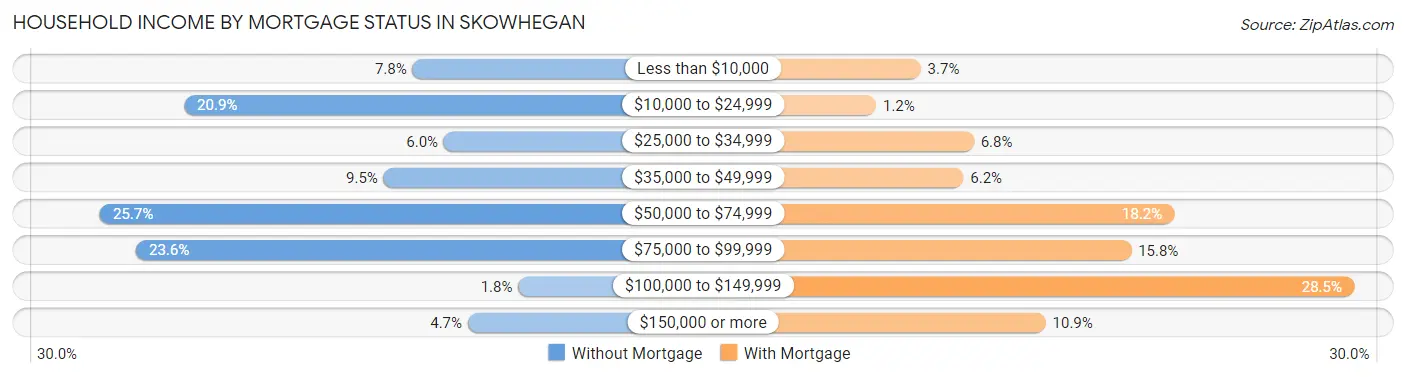
| Household Income | Without Mortgage | With Mortgage |
| Less than $10,000 | 57 (7.8%) | 38 (3.7%) |
| $10,000 to $24,999 | 152 (20.9%) | 12 (1.2%) |
| $25,000 to $34,999 | 44 (6.0%) | 69 (6.8%) |
| $35,000 to $49,999 | 69 (9.5%) | 63 (6.2%) |
| $50,000 to $74,999 | 187 (25.7%) | 186 (18.2%) |
| $75,000 to $99,999 | 172 (23.6%) | 161 (15.8%) |
| $100,000 to $149,999 | 13 (1.8%) | 291 (28.5%) |
| $150,000 or more | 34 (4.7%) | 111 (10.9%) |
| Total | 728 (100.0%) | 1,022 (100.0%) |
Property Value to Household Income Ratio in Skowhegan
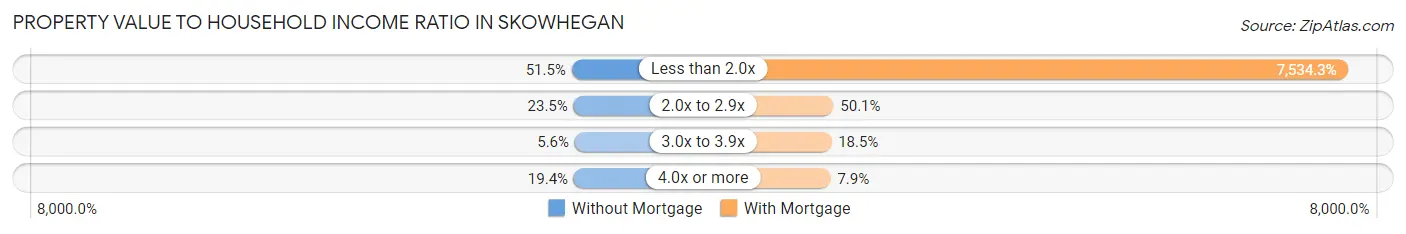
| Value-to-Income Ratio | Without Mortgage | With Mortgage |
| Less than 2.0x | 375 (51.5%) | 77,000 (7,534.3%) |
| 2.0x to 2.9x | 171 (23.5%) | 512 (50.1%) |
| 3.0x to 3.9x | 41 (5.6%) | 189 (18.5%) |
| 4.0x or more | 141 (19.4%) | 81 (7.9%) |
| Total | 728 (100.0%) | 1,022 (100.0%) |
Real Estate Taxes by Mortgage Status in Skowhegan
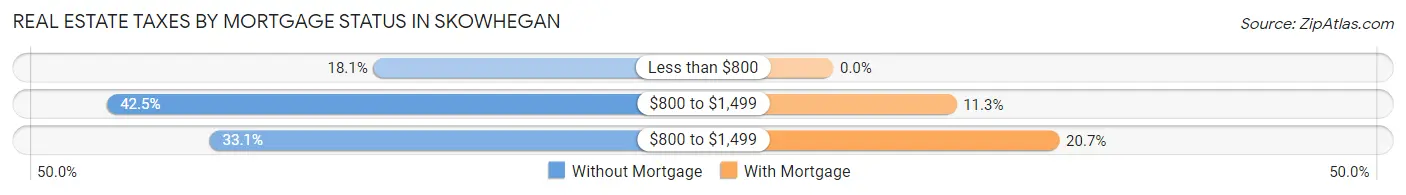
| Property Taxes | Without Mortgage | With Mortgage |
| Less than $800 | 132 (18.1%) | 0 (0.0%) |
| $800 to $1,499 | 309 (42.4%) | 115 (11.3%) |
| $800 to $1,499 | 241 (33.1%) | 211 (20.6%) |
| Total | 728 (100.0%) | 1,022 (100.0%) |
Health & Disability in Skowhegan
Health Insurance Coverage by Age in Skowhegan
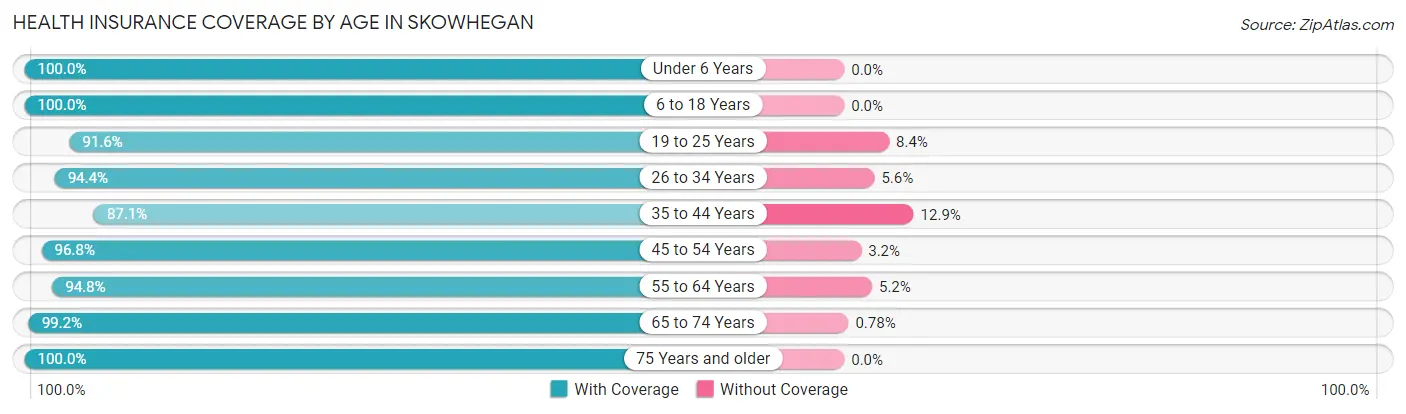
| Age Bracket | With Coverage | Without Coverage |
| Under 6 Years | 456 (100.0%) | 0 (0.0%) |
| 6 to 18 Years | 676 (100.0%) | 0 (0.0%) |
| 19 to 25 Years | 329 (91.6%) | 30 (8.4%) |
| 26 to 34 Years | 722 (94.4%) | 43 (5.6%) |
| 35 to 44 Years | 552 (87.1%) | 82 (12.9%) |
| 45 to 54 Years | 520 (96.8%) | 17 (3.2%) |
| 55 to 64 Years | 826 (94.8%) | 45 (5.2%) |
| 65 to 74 Years | 759 (99.2%) | 6 (0.8%) |
| 75 Years and older | 1,038 (100.0%) | 0 (0.0%) |
| Total | 5,878 (96.3%) | 223 (3.7%) |
Health Insurance Coverage by Citizenship Status in Skowhegan
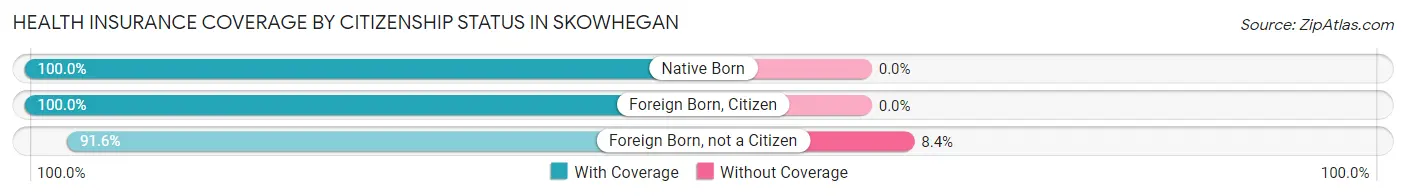
| Citizenship Status | With Coverage | Without Coverage |
| Native Born | 456 (100.0%) | 0 (0.0%) |
| Foreign Born, Citizen | 676 (100.0%) | 0 (0.0%) |
| Foreign Born, not a Citizen | 329 (91.6%) | 30 (8.4%) |
Health Insurance Coverage by Household Income in Skowhegan
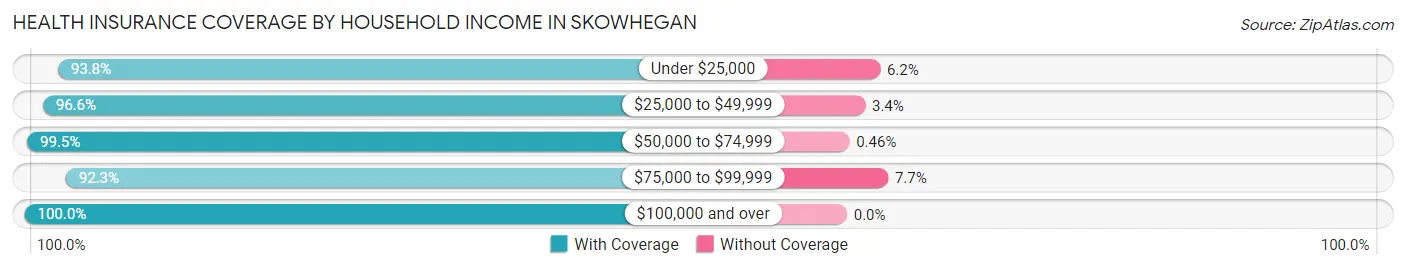
| Household Income | With Coverage | Without Coverage |
| Under $25,000 | 965 (93.8%) | 64 (6.2%) |
| $25,000 to $49,999 | 1,326 (96.6%) | 47 (3.4%) |
| $50,000 to $74,999 | 1,515 (99.5%) | 7 (0.5%) |
| $75,000 to $99,999 | 1,087 (92.3%) | 91 (7.7%) |
| $100,000 and over | 954 (100.0%) | 0 (0.0%) |
Public vs Private Health Insurance Coverage by Age in Skowhegan
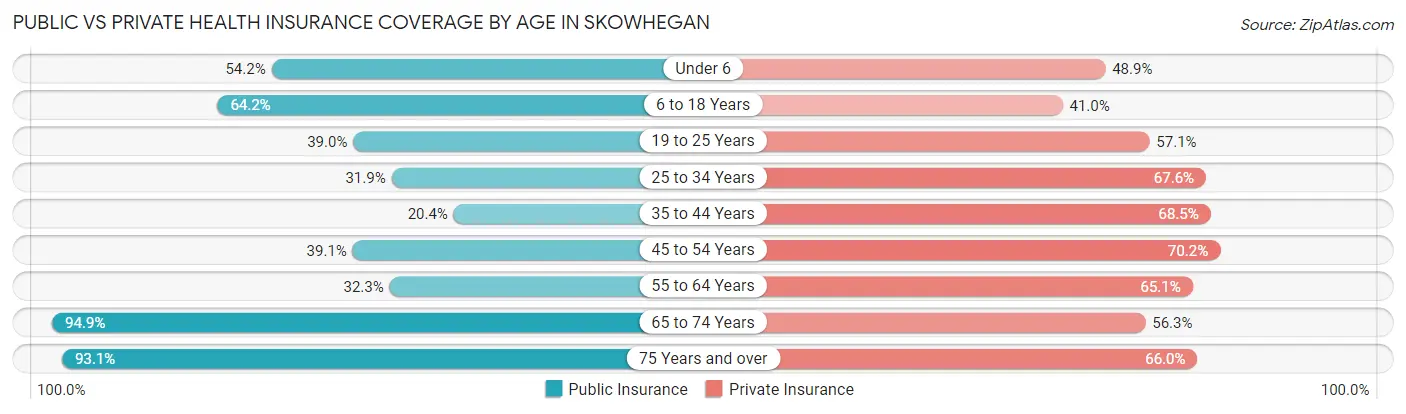
| Age Bracket | Public Insurance | Private Insurance |
| Under 6 | 247 (54.2%) | 223 (48.9%) |
| 6 to 18 Years | 434 (64.2%) | 277 (41.0%) |
| 19 to 25 Years | 140 (39.0%) | 205 (57.1%) |
| 25 to 34 Years | 244 (31.9%) | 517 (67.6%) |
| 35 to 44 Years | 129 (20.3%) | 434 (68.4%) |
| 45 to 54 Years | 210 (39.1%) | 377 (70.2%) |
| 55 to 64 Years | 281 (32.3%) | 567 (65.1%) |
| 65 to 74 Years | 726 (94.9%) | 431 (56.3%) |
| 75 Years and over | 966 (93.1%) | 685 (66.0%) |
| Total | 3,377 (55.3%) | 3,716 (60.9%) |
Disability Status by Sex by Age in Skowhegan
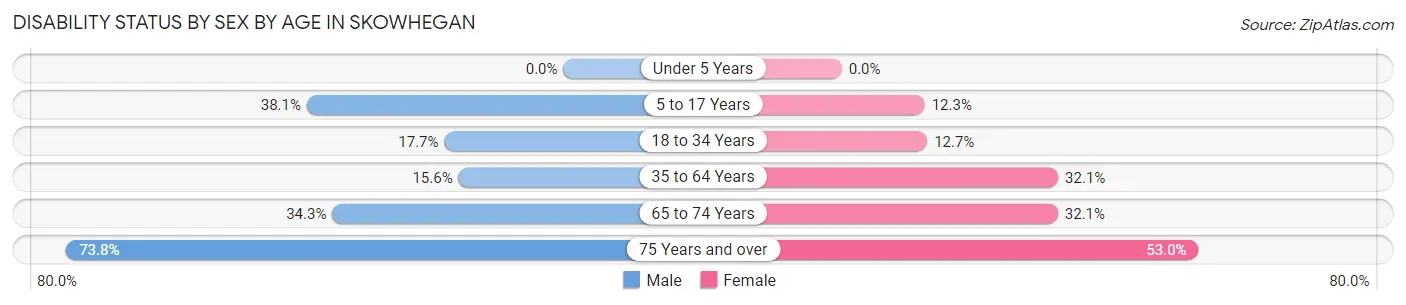
| Age Bracket | Male | Female |
| Under 5 Years | 0 (0.0%) | 0 (0.0%) |
| 5 to 17 Years | 205 (38.1%) | 26 (12.3%) |
| 18 to 34 Years | 100 (17.7%) | 72 (12.7%) |
| 35 to 64 Years | 145 (15.6%) | 357 (32.1%) |
| 65 to 74 Years | 116 (34.3%) | 137 (32.1%) |
| 75 Years and over | 341 (73.8%) | 305 (52.9%) |
Disability Class by Sex by Age in Skowhegan
Disability Class: Hearing Difficulty
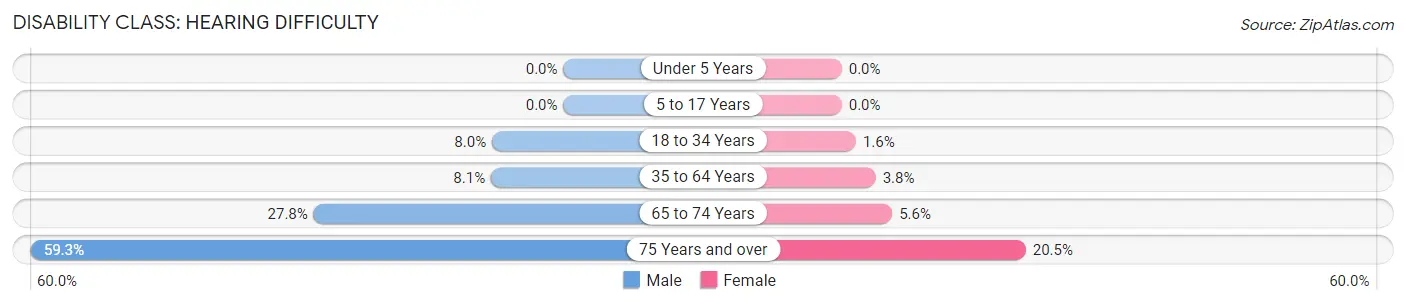
| Age Bracket | Male | Female |
| Under 5 Years | 0 (0.0%) | 0 (0.0%) |
| 5 to 17 Years | 0 (0.0%) | 0 (0.0%) |
| 18 to 34 Years | 45 (8.0%) | 9 (1.6%) |
| 35 to 64 Years | 75 (8.1%) | 42 (3.8%) |
| 65 to 74 Years | 94 (27.8%) | 24 (5.6%) |
| 75 Years and over | 274 (59.3%) | 118 (20.5%) |
Disability Class: Vision Difficulty
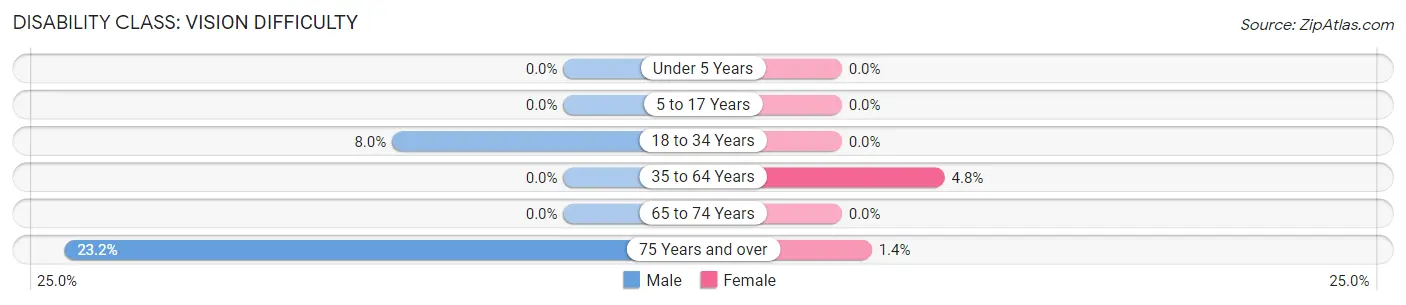
| Age Bracket | Male | Female |
| Under 5 Years | 0 (0.0%) | 0 (0.0%) |
| 5 to 17 Years | 0 (0.0%) | 0 (0.0%) |
| 18 to 34 Years | 45 (8.0%) | 0 (0.0%) |
| 35 to 64 Years | 0 (0.0%) | 53 (4.8%) |
| 65 to 74 Years | 0 (0.0%) | 0 (0.0%) |
| 75 Years and over | 107 (23.2%) | 8 (1.4%) |
Disability Class: Cognitive Difficulty
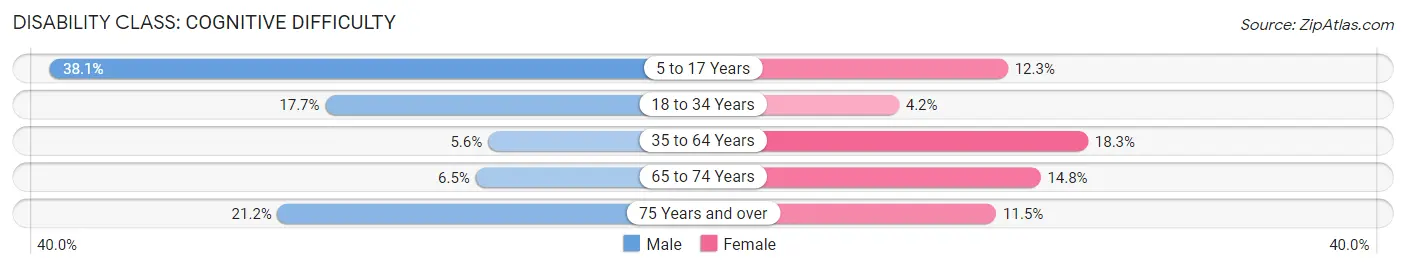
| Age Bracket | Male | Female |
| 5 to 17 Years | 205 (38.1%) | 26 (12.3%) |
| 18 to 34 Years | 100 (17.7%) | 24 (4.2%) |
| 35 to 64 Years | 52 (5.6%) | 203 (18.3%) |
| 65 to 74 Years | 22 (6.5%) | 63 (14.7%) |
| 75 Years and over | 98 (21.2%) | 66 (11.5%) |
Disability Class: Ambulatory Difficulty
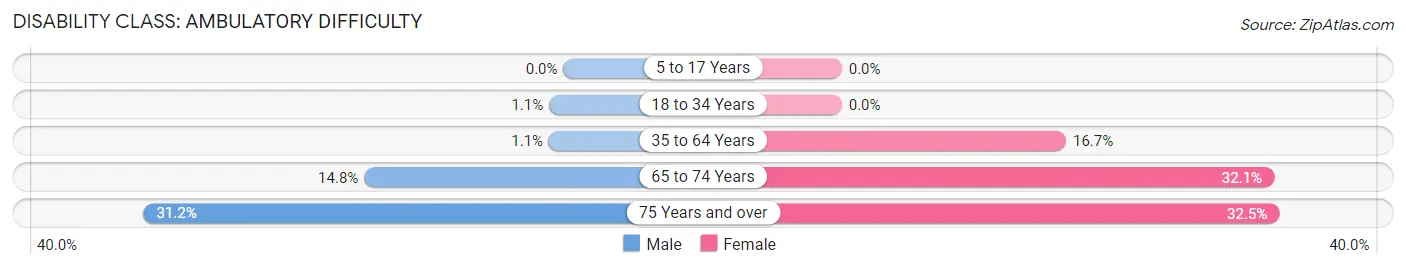
| Age Bracket | Male | Female |
| 5 to 17 Years | 0 (0.0%) | 0 (0.0%) |
| 18 to 34 Years | 6 (1.1%) | 0 (0.0%) |
| 35 to 64 Years | 10 (1.1%) | 185 (16.7%) |
| 65 to 74 Years | 50 (14.8%) | 137 (32.1%) |
| 75 Years and over | 144 (31.2%) | 187 (32.5%) |
Disability Class: Self-Care Difficulty
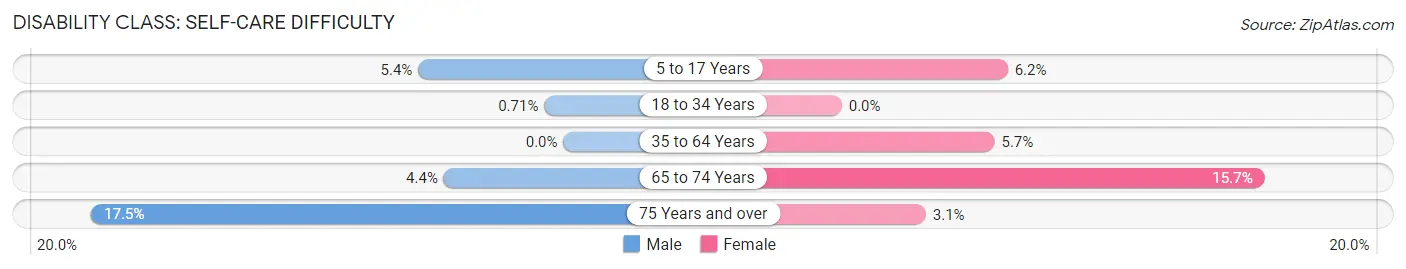
| Age Bracket | Male | Female |
| 5 to 17 Years | 29 (5.4%) | 13 (6.2%) |
| 18 to 34 Years | 4 (0.7%) | 0 (0.0%) |
| 35 to 64 Years | 0 (0.0%) | 63 (5.7%) |
| 65 to 74 Years | 15 (4.4%) | 67 (15.7%) |
| 75 Years and over | 81 (17.5%) | 18 (3.1%) |
Technology Access in Skowhegan
Computing Device Access in Skowhegan
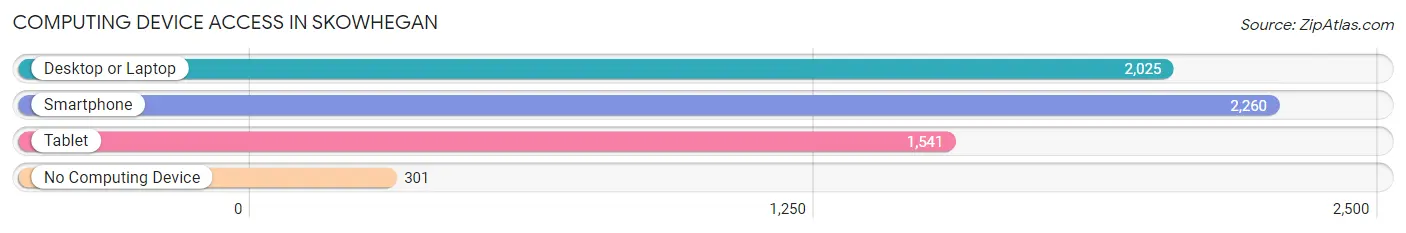
| Device Type | # Households | % Households |
| Desktop or Laptop | 2,025 | 70.2% |
| Smartphone | 2,260 | 78.4% |
| Tablet | 1,541 | 53.4% |
| No Computing Device | 301 | 10.4% |
| Total | 2,884 | 100.0% |
Internet Access in Skowhegan
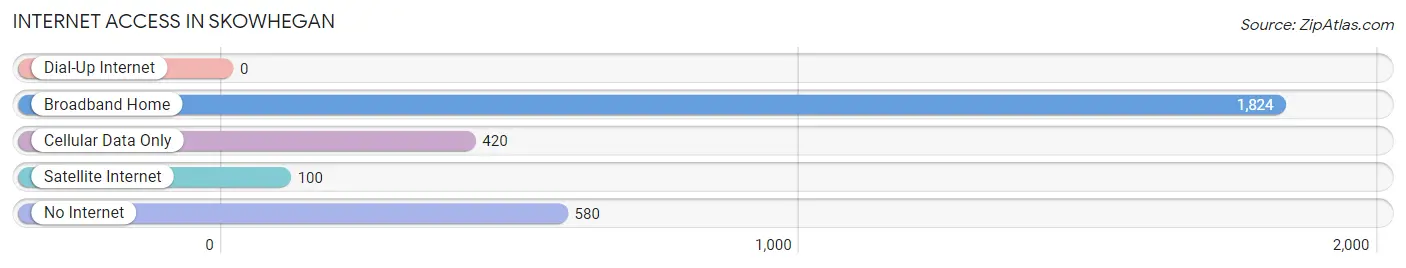
| Internet Type | # Households | % Households |
| Dial-Up Internet | 0 | 0.0% |
| Broadband Home | 1,824 | 63.2% |
| Cellular Data Only | 420 | 14.6% |
| Satellite Internet | 100 | 3.5% |
| No Internet | 580 | 20.1% |
| Total | 2,884 | 100.0% |
Skowhegan Summary
Skowhegan, Maine is a small town located in the central part of the state, in Somerset County. It is situated on the banks of the Kennebec River, and is the county seat of Somerset County. The town has a population of 8,589 as of the 2010 census, and is the largest town in the county.
History
Skowhegan was first settled in 1773 by a group of settlers from Massachusetts. The town was named after the Abenaki word for “watching place”, referring to the Native Americans who used to watch the river for migrating fish. The town was incorporated in 1788, and was the first town in the state to be incorporated.
In the 19th century, Skowhegan was an important center for the lumber industry, and the town was home to several sawmills and gristmills. The town was also home to several factories, including a paper mill, a woolen mill, and a shoe factory.
Geography
Skowhegan is located in the central part of the state, in Somerset County. It is situated on the banks of the Kennebec River, and is the county seat of Somerset County. The town is bordered by Canaan to the north, Norridgewock to the east, Madison to the south, and Anson to the west.
The town has a total area of 24.2 square miles, of which 23.9 square miles is land and 0.3 square miles is water. The town is located in the Kennebec Valley, and is surrounded by rolling hills and forests.
Economy
Skowhegan’s economy is largely based on agriculture and manufacturing. The town is home to several farms, and is a major producer of potatoes, corn, and hay. The town is also home to several factories, including a paper mill, a woolen mill, and a shoe factory.
The town is also home to several businesses, including restaurants, retail stores, and professional services. The town is also home to several medical facilities, including a hospital and several clinics.
Demographics
As of the 2010 census, Skowhegan had a population of 8,589. The racial makeup of the town was 95.3% White, 0.7% African American, 0.7% Native American, 0.7% Asian, 0.2% Pacific Islander, 0.7% from other races, and 1.6% from two or more races. Hispanic or Latino of any race were 1.7% of the population.
The median income for a household in the town was $37,917, and the median income for a family was $45,938. The per capita income for the town was $19,945. About 11.3% of families and 14.2% of the population were below the poverty line, including 19.2% of those under age 18 and 8.2% of those age 65 or over.
Common Questions
What is Per Capita Income in Skowhegan?
Per Capita income in Skowhegan is $28,149.
What is the Median Family Income in Skowhegan?
Median Family Income in Skowhegan is $68,078.
What is the Median Household income in Skowhegan?
Median Household Income in Skowhegan is $46,613.
What is Income or Wage Gap in Skowhegan?
Income or Wage Gap in Skowhegan is 29.2%.
Women in Skowhegan earn 70.8 cents for every dollar earned by a man.
What is Inequality or Gini Index in Skowhegan?
Inequality or Gini Index in Skowhegan is 0.42.
What is the Total Population of Skowhegan?
Total Population of Skowhegan is 6,270.
What is the Total Male Population of Skowhegan?
Total Male Population of Skowhegan is 3,076.
What is the Total Female Population of Skowhegan?
Total Female Population of Skowhegan is 3,194.
What is the Ratio of Males per 100 Females in Skowhegan?
There are 96.31 Males per 100 Females in Skowhegan.
What is the Ratio of Females per 100 Males in Skowhegan?
There are 103.84 Females per 100 Males in Skowhegan.
What is the Median Population Age in Skowhegan?
Median Population Age in Skowhegan is 47.3 Years.
What is the Average Family Size in Skowhegan
Average Family Size in Skowhegan is 2.7 People.
What is the Average Household Size in Skowhegan
Average Household Size in Skowhegan is 2.1 People.
How Large is the Labor Force in Skowhegan?
There are 2,686 People in the Labor Forcein in Skowhegan.
What is the Percentage of People in the Labor Force in Skowhegan?
51.6% of People are in the Labor Force in Skowhegan.
What is the Unemployment Rate in Skowhegan?
Unemployment Rate in Skowhegan is 3.4%.