Mapleton, ME Map & Demographics
Mapleton Map
Mapleton Overview
$31,461
PER CAPITA INCOME
$97,188
AVG FAMILY INCOME
$77,109
AVG HOUSEHOLD INCOME
13.9%
WAGE / INCOME GAP [ % ]
86.1¢/ $1
WAGE / INCOME GAP [ $ ]
0.34
INEQUALITY / GINI INDEX
671
TOTAL POPULATION
341
MALE POPULATION
330
FEMALE POPULATION
103.33
MALES / 100 FEMALES
96.77
FEMALES / 100 MALES
42.3
MEDIAN AGE
2.8
AVG FAMILY SIZE
2.5
AVG HOUSEHOLD SIZE
406
LABOR FORCE [ PEOPLE ]
73.7%
PERCENT IN LABOR FORCE
7.9%
UNEMPLOYMENT RATE
Mapleton Zip Codes
Mapleton Area Codes
Income in Mapleton
Income Overview in Mapleton
Per Capita Income in Mapleton is $31,461, while median incomes of families and households are $97,188 and $77,109 respectively.
| Characteristic | Number | Measure |
| Per Capita Income | 671 | $31,461 |
| Median Family Income | 187 | $97,188 |
| Mean Family Income | 187 | $94,099 |
| Median Household Income | 271 | $77,109 |
| Mean Household Income | 271 | $78,451 |
| Income Deficit | 187 | $0 |
| Wage / Income Gap (%) | 671 | 13.90% |
| Wage / Income Gap ($) | 671 | 86.10¢ per $1 |
| Gini / Inequality Index | 671 | 0.34 |
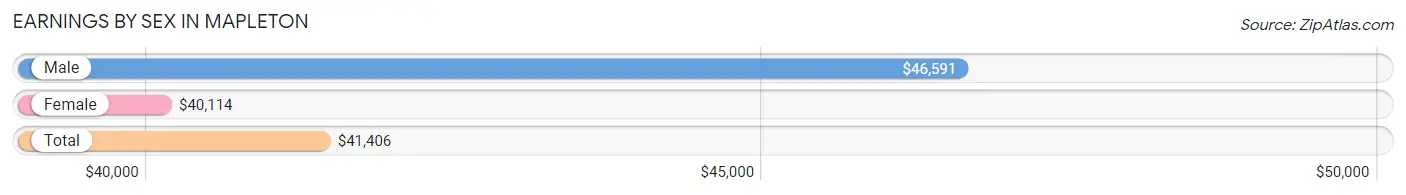
Earnings by Sex in Mapleton
Average Earnings in Mapleton are $41,406, $46,591 for men and $40,114 for women, a difference of 13.9%.
| Sex | Number | Average Earnings |
| Male | 220 (52.3%) | $46,591 |
| Female | 201 (47.7%) | $40,114 |
| Total | 421 (100.0%) | $41,406 |
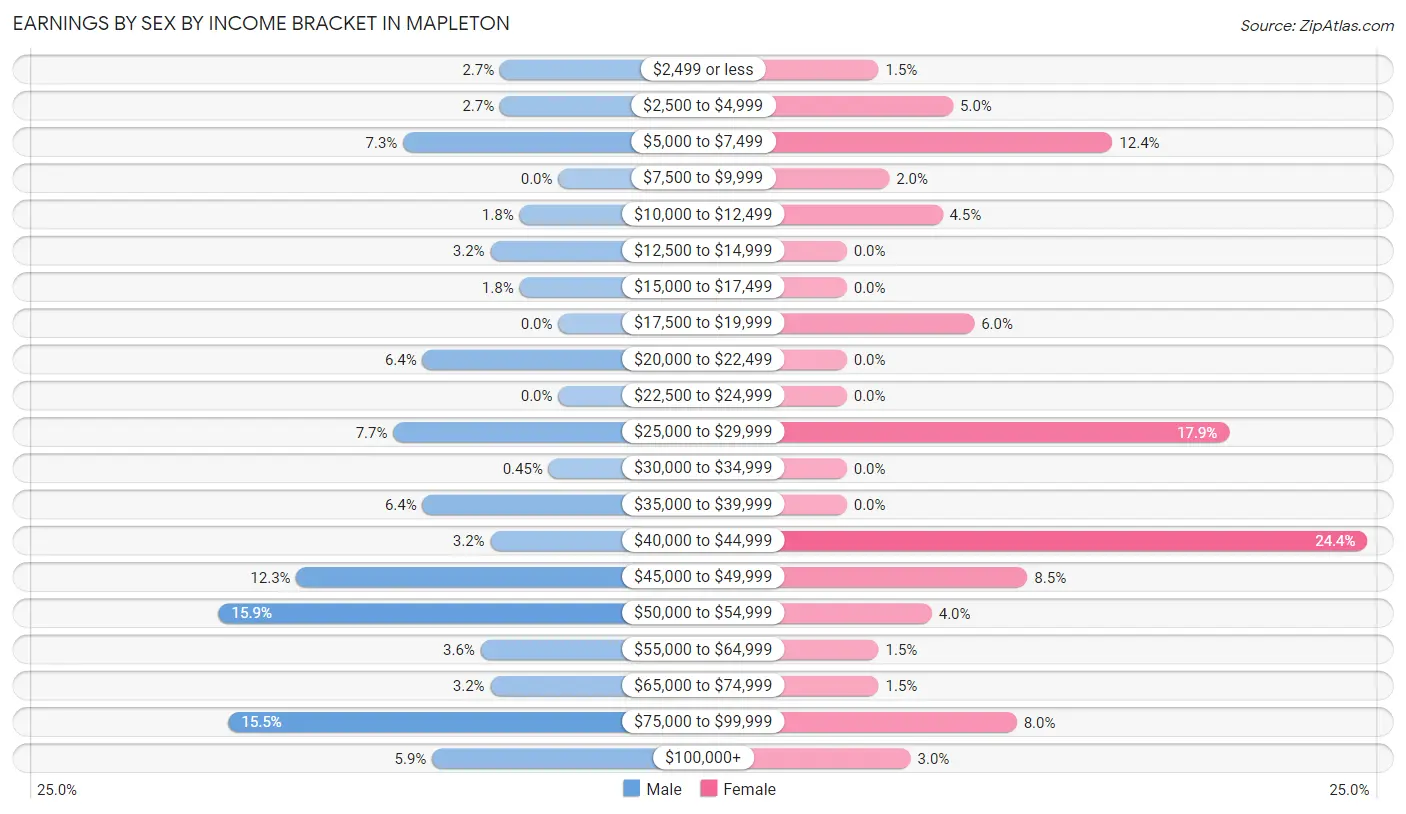
Earnings by Sex by Income Bracket in Mapleton
The most common earnings brackets in Mapleton are $50,000 to $54,999 for men (35 | 15.9%) and $40,000 to $44,999 for women (49 | 24.4%).
| Income | Male | Female |
| $2,499 or less | 6 (2.7%) | 3 (1.5%) |
| $2,500 to $4,999 | 6 (2.7%) | 10 (5.0%) |
| $5,000 to $7,499 | 16 (7.3%) | 25 (12.4%) |
| $7,500 to $9,999 | 0 (0.0%) | 4 (2.0%) |
| $10,000 to $12,499 | 4 (1.8%) | 9 (4.5%) |
| $12,500 to $14,999 | 7 (3.2%) | 0 (0.0%) |
| $15,000 to $17,499 | 4 (1.8%) | 0 (0.0%) |
| $17,500 to $19,999 | 0 (0.0%) | 12 (6.0%) |
| $20,000 to $22,499 | 14 (6.4%) | 0 (0.0%) |
| $22,500 to $24,999 | 0 (0.0%) | 0 (0.0%) |
| $25,000 to $29,999 | 17 (7.7%) | 36 (17.9%) |
| $30,000 to $34,999 | 1 (0.4%) | 0 (0.0%) |
| $35,000 to $39,999 | 14 (6.4%) | 0 (0.0%) |
| $40,000 to $44,999 | 7 (3.2%) | 49 (24.4%) |
| $45,000 to $49,999 | 27 (12.3%) | 17 (8.5%) |
| $50,000 to $54,999 | 35 (15.9%) | 8 (4.0%) |
| $55,000 to $64,999 | 8 (3.6%) | 3 (1.5%) |
| $65,000 to $74,999 | 7 (3.2%) | 3 (1.5%) |
| $75,000 to $99,999 | 34 (15.4%) | 16 (8.0%) |
| $100,000+ | 13 (5.9%) | 6 (3.0%) |
| Total | 220 (100.0%) | 201 (100.0%) |
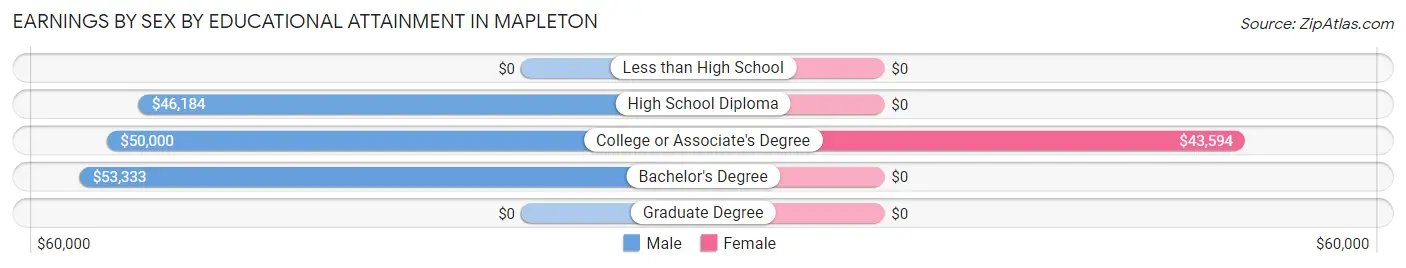
Earnings by Sex by Educational Attainment in Mapleton
Average earnings in Mapleton are $52,542 for men and $42,386 for women, a difference of 19.3%. Men with an educational attainment of bachelor's degree enjoy the highest average annual earnings of $53,333, while those with high school diploma education earn the least with $46,184. Women with an educational attainment of college or associate's degree earn the most with the average annual earnings of $43,594, while those with college or associate's degree education have the smallest earnings of $43,594.
| Educational Attainment | Male Income | Female Income |
| Less than High School | - | - |
| High School Diploma | $46,184 | $0 |
| College or Associate's Degree | $50,000 | $43,594 |
| Bachelor's Degree | $53,333 | $0 |
| Graduate Degree | - | - |
| Total | $52,542 | $42,386 |
Family Income in Mapleton
Family Income Brackets in Mapleton
According to the Mapleton family income data, there are 69 families falling into the $75,000 to $99,999 income range, which is the most common income bracket and makes up 36.9% of all families.
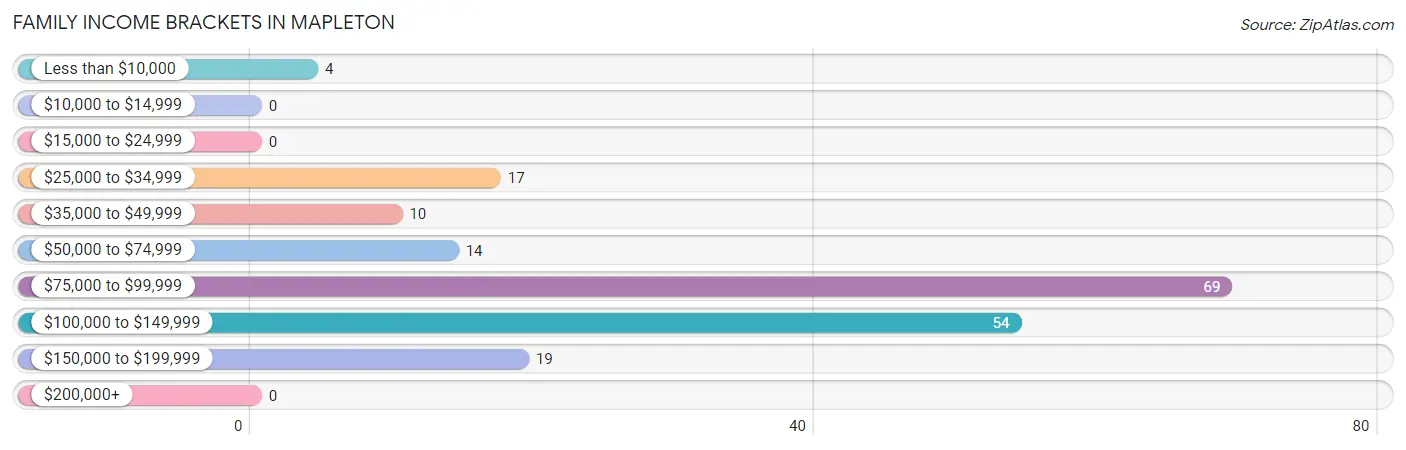
| Income Bracket | # Families | % Families |
| Less than $10,000 | 4 | 2.1% |
| $10,000 to $14,999 | 0 | 0.0% |
| $15,000 to $24,999 | 0 | 0.0% |
| $25,000 to $34,999 | 17 | 9.1% |
| $35,000 to $49,999 | 10 | 5.3% |
| $50,000 to $74,999 | 14 | 7.5% |
| $75,000 to $99,999 | 69 | 36.9% |
| $100,000 to $149,999 | 54 | 28.9% |
| $150,000 to $199,999 | 19 | 10.2% |
| $200,000+ | 0 | 0.0% |
Family Income by Famaliy Size in Mapleton
3-person families (30 | 16.0%) account for the highest median family income in Mapleton with $98,421 per family, while 2-person families (100 | 53.5%) have the highest median income of $38,594 per family member.
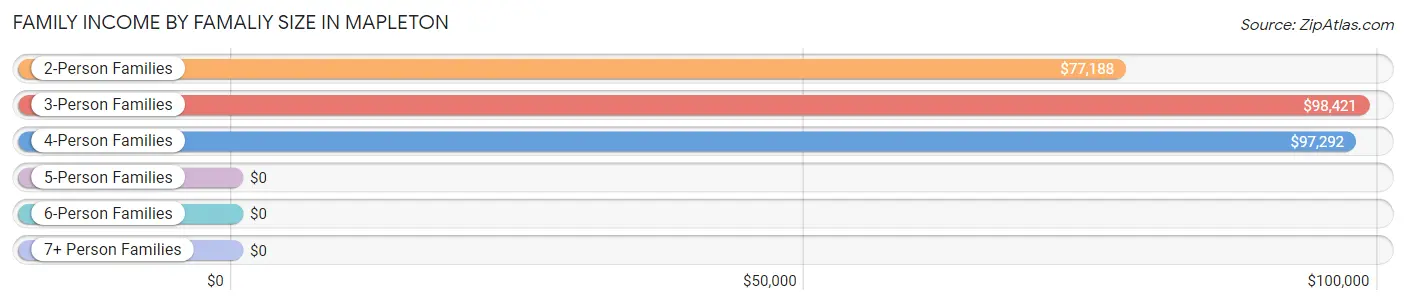
| Income Bracket | # Families | Median Income |
| 2-Person Families | 100 (53.5%) | $77,188 |
| 3-Person Families | 30 (16.0%) | $98,421 |
| 4-Person Families | 46 (24.6%) | $97,292 |
| 5-Person Families | 11 (5.9%) | $0 |
| 6-Person Families | 0 (0.0%) | $0 |
| 7+ Person Families | 0 (0.0%) | $0 |
| Total | 187 (100.0%) | $97,188 |
Family Income by Number of Earners in Mapleton
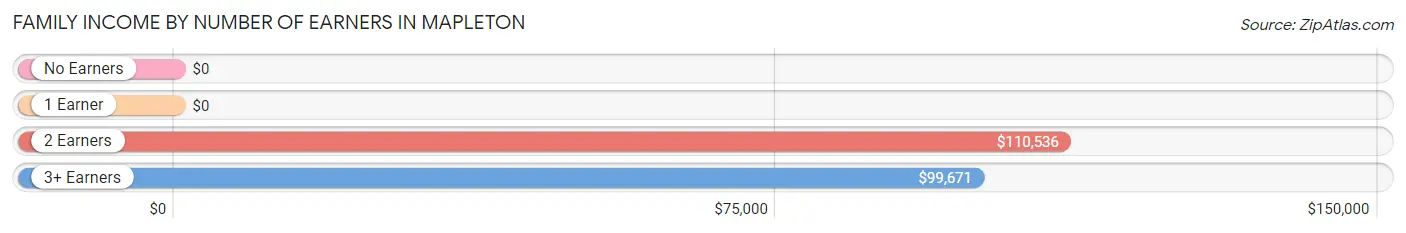
| Number of Earners | # Families | Median Income |
| No Earners | 19 (10.2%) | $0 |
| 1 Earner | 46 (24.6%) | $0 |
| 2 Earners | 79 (42.2%) | $110,536 |
| 3+ Earners | 43 (23.0%) | $99,671 |
| Total | 187 (100.0%) | $97,188 |
Household Income in Mapleton
Household Income Brackets in Mapleton
With 69 households falling in the category, the $75,000 to $99,999 income range is the most frequent in Mapleton, accounting for 25.5% of all households.
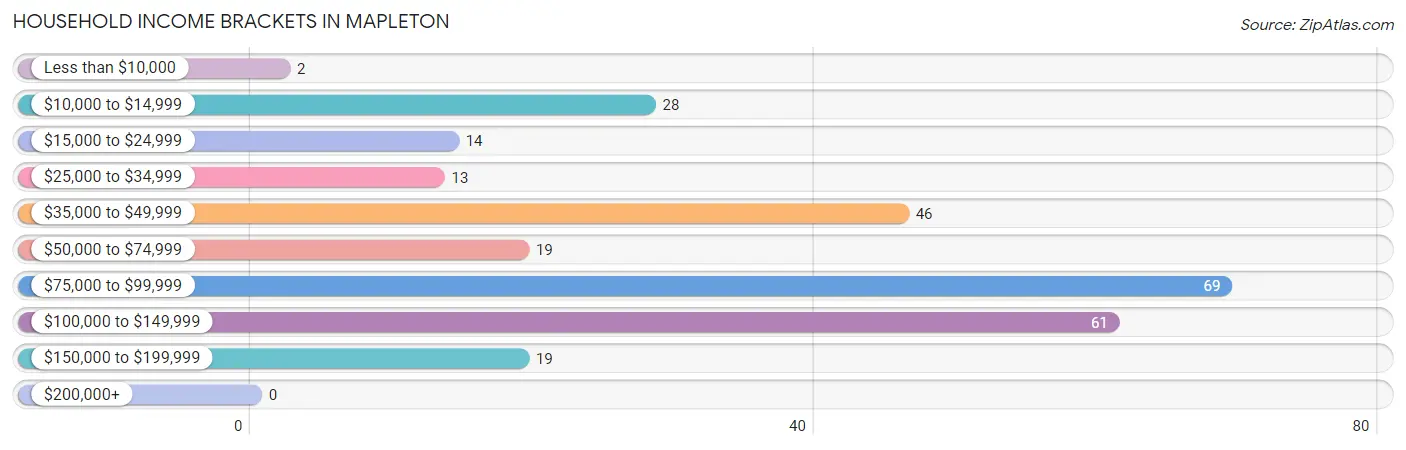
| Income Bracket | # Households | % Households |
| Less than $10,000 | 2 | 0.7% |
| $10,000 to $14,999 | 28 | 10.3% |
| $15,000 to $24,999 | 14 | 5.2% |
| $25,000 to $34,999 | 13 | 4.8% |
| $35,000 to $49,999 | 46 | 17.0% |
| $50,000 to $74,999 | 19 | 7.0% |
| $75,000 to $99,999 | 69 | 25.5% |
| $100,000 to $149,999 | 61 | 22.5% |
| $150,000 to $199,999 | 19 | 7.0% |
| $200,000+ | 0 | 0.0% |
Household Income by Householder Age in Mapleton
The median household income in Mapleton is $77,109, with the highest median household income of $98,882 found in the 45 to 64 years age bracket for the primary householder. A total of 121 households (44.7%) fall into this category. Meanwhile, the 15 to 24 years age bracket for the primary householder has the lowest median household income of $0, with 23 households (8.5%) in this group.
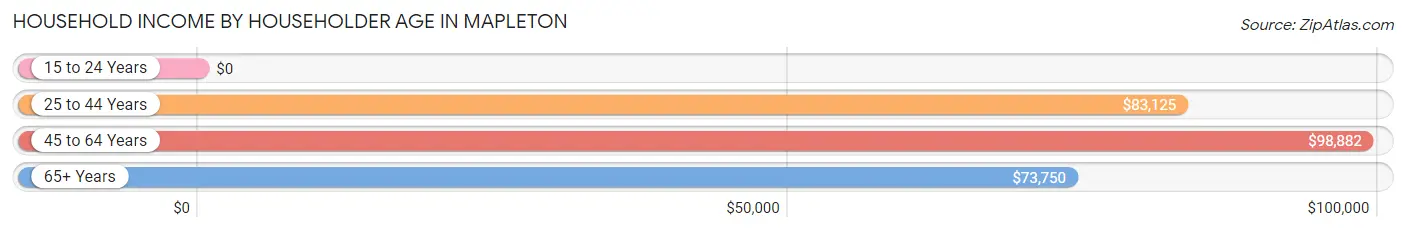
| Income Bracket | # Households | Median Income |
| 15 to 24 Years | 23 (8.5%) | $0 |
| 25 to 44 Years | 57 (21.0%) | $83,125 |
| 45 to 64 Years | 121 (44.7%) | $98,882 |
| 65+ Years | 70 (25.8%) | $73,750 |
| Total | 271 (100.0%) | $77,109 |
Poverty in Mapleton
Income Below Poverty by Sex and Age in Mapleton
With 9.9% poverty level for males and 9.1% for females among the residents of Mapleton, 55 to 64 year old males and 12 to 14 year old females are the most vulnerable to poverty, with 8 males (21.6%) and 3 females (30.0%) in their respective age groups living below the poverty level.
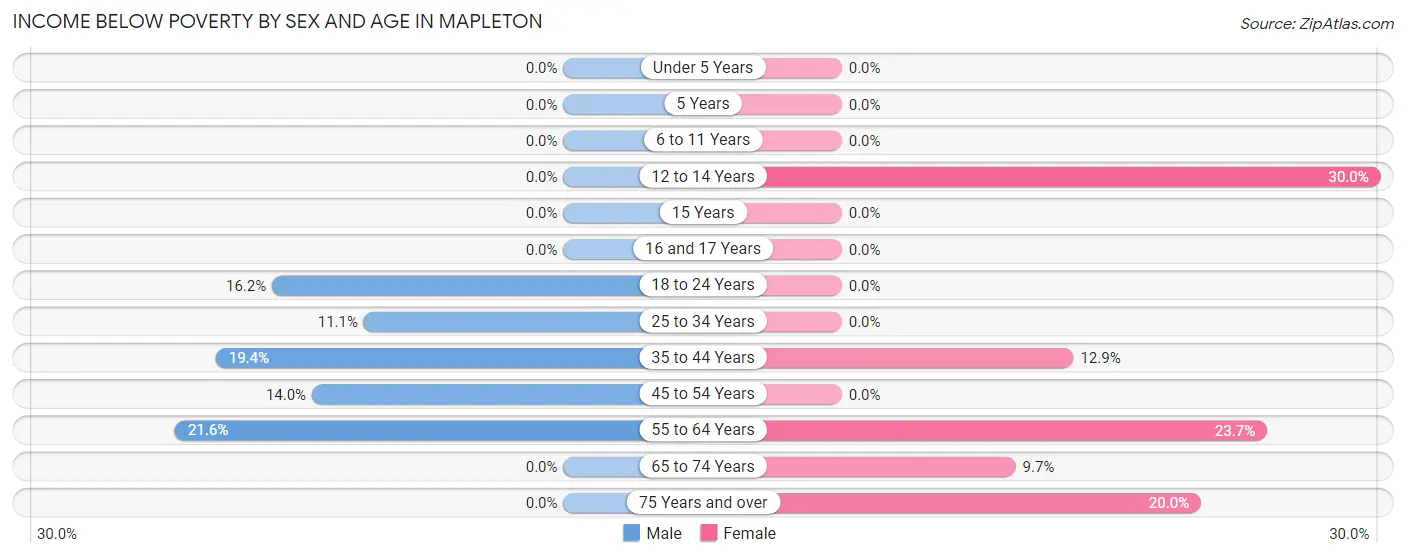
| Age Bracket | Male | Female |
| Under 5 Years | 0 (0.0%) | 0 (0.0%) |
| 5 Years | 0 (0.0%) | 0 (0.0%) |
| 6 to 11 Years | 0 (0.0%) | 0 (0.0%) |
| 12 to 14 Years | 0 (0.0%) | 3 (30.0%) |
| 15 Years | 0 (0.0%) | 0 (0.0%) |
| 16 and 17 Years | 0 (0.0%) | 0 (0.0%) |
| 18 to 24 Years | 6 (16.2%) | 0 (0.0%) |
| 25 to 34 Years | 5 (11.1%) | 0 (0.0%) |
| 35 to 44 Years | 6 (19.4%) | 4 (12.9%) |
| 45 to 54 Years | 7 (14.0%) | 0 (0.0%) |
| 55 to 64 Years | 8 (21.6%) | 18 (23.7%) |
| 65 to 74 Years | 0 (0.0%) | 3 (9.7%) |
| 75 Years and over | 0 (0.0%) | 2 (20.0%) |
| Total | 32 (9.9%) | 30 (9.1%) |
Income Above Poverty by Sex and Age in Mapleton
According to the poverty statistics in Mapleton, males aged under 5 years and females aged under 5 years are the age groups that are most secure financially, with 100.0% of males and 100.0% of females in these age groups living above the poverty line.
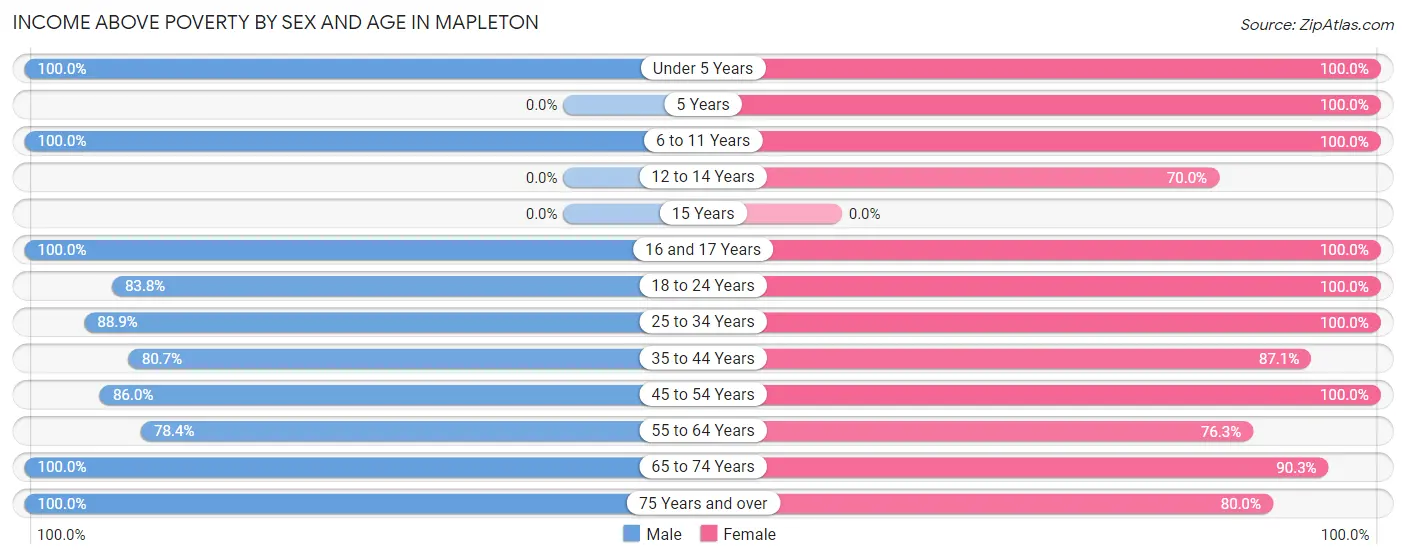
| Age Bracket | Male | Female |
| Under 5 Years | 37 (100.0%) | 25 (100.0%) |
| 5 Years | 0 (0.0%) | 11 (100.0%) |
| 6 to 11 Years | 5 (100.0%) | 16 (100.0%) |
| 12 to 14 Years | 0 (0.0%) | 7 (70.0%) |
| 15 Years | 0 (0.0%) | 0 (0.0%) |
| 16 and 17 Years | 16 (100.0%) | 6 (100.0%) |
| 18 to 24 Years | 31 (83.8%) | 54 (100.0%) |
| 25 to 34 Years | 40 (88.9%) | 17 (100.0%) |
| 35 to 44 Years | 25 (80.6%) | 27 (87.1%) |
| 45 to 54 Years | 43 (86.0%) | 43 (100.0%) |
| 55 to 64 Years | 29 (78.4%) | 58 (76.3%) |
| 65 to 74 Years | 51 (100.0%) | 28 (90.3%) |
| 75 Years and over | 16 (100.0%) | 8 (80.0%) |
| Total | 293 (90.1%) | 300 (90.9%) |
Income Below Poverty Among Married-Couple Families in Mapleton
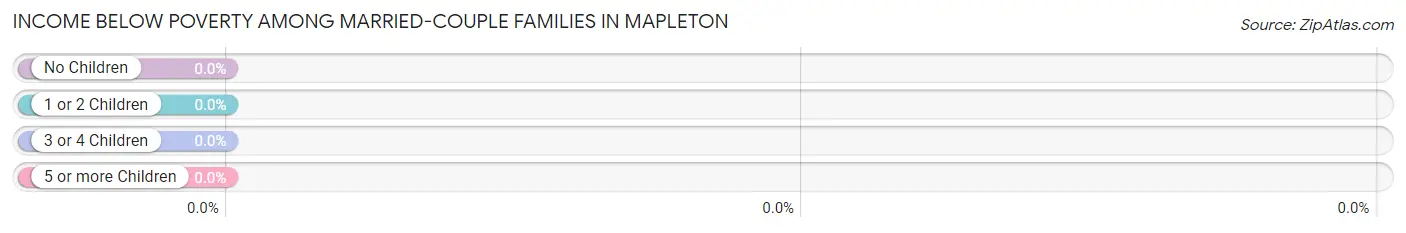
| Children | Above Poverty | Below Poverty |
| No Children | 97 (100.0%) | 0 (0.0%) |
| 1 or 2 Children | 51 (100.0%) | 0 (0.0%) |
| 3 or 4 Children | 11 (100.0%) | 0 (0.0%) |
| 5 or more Children | 0 (0.0%) | 0 (0.0%) |
| Total | 159 (100.0%) | 0 (0.0%) |
Income Below Poverty Among Single-Parent Households in Mapleton
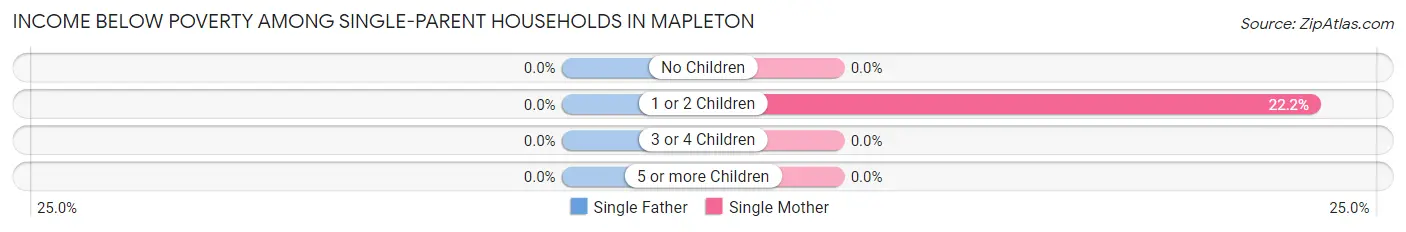
| Children | Single Father | Single Mother |
| No Children | 0 (0.0%) | 0 (0.0%) |
| 1 or 2 Children | 0 (0.0%) | 4 (22.2%) |
| 3 or 4 Children | 0 (0.0%) | 0 (0.0%) |
| 5 or more Children | 0 (0.0%) | 0 (0.0%) |
| Total | 0 (0.0%) | 4 (19.1%) |
Income Below Poverty Among Married-Couple vs Single-Parent Households in Mapleton
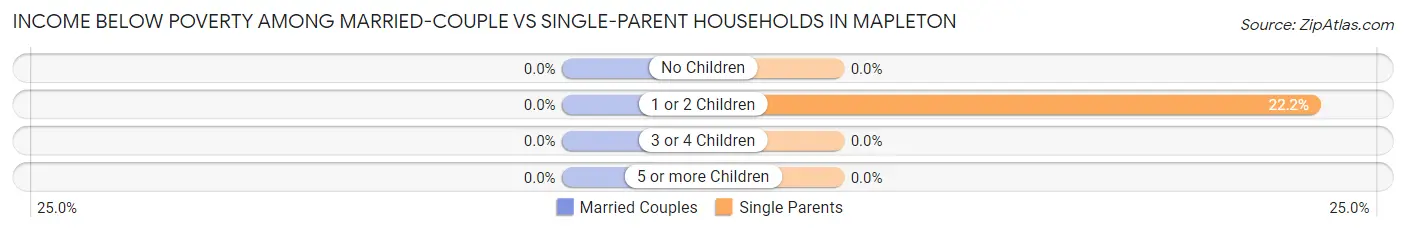
| Children | Married-Couple Families | Single-Parent Households |
| No Children | 0 (0.0%) | 0 (0.0%) |
| 1 or 2 Children | 0 (0.0%) | 4 (22.2%) |
| 3 or 4 Children | 0 (0.0%) | 0 (0.0%) |
| 5 or more Children | 0 (0.0%) | 0 (0.0%) |
| Total | 0 (0.0%) | 4 (14.3%) |
Race in Mapleton
The most populous races in Mapleton are White / Caucasian (664 | 99.0%), Two or more Races (5 | 0.7%), and Black / African American (2 | 0.3%).
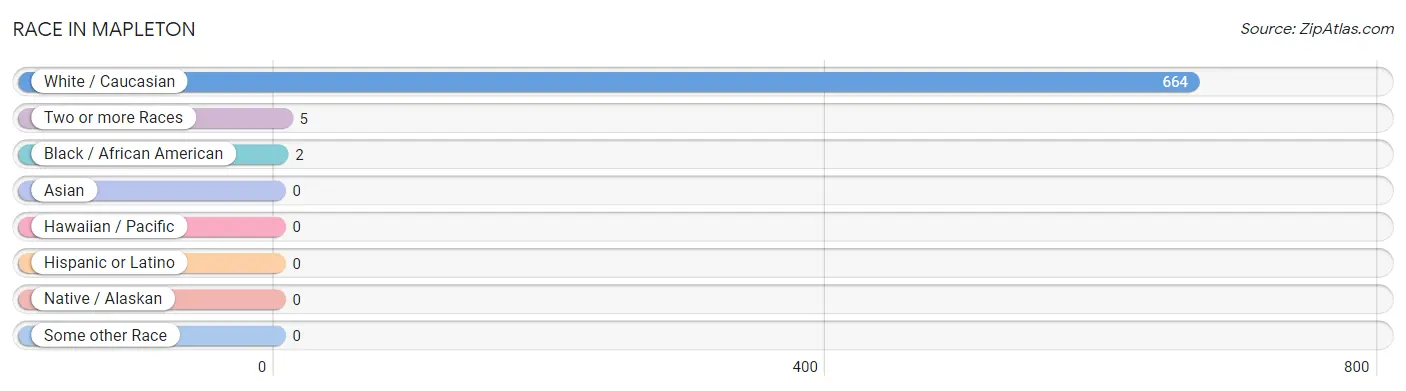
| Race | # Population | % Population |
| Asian | 0 | 0.0% |
| Black / African American | 2 | 0.3% |
| Hawaiian / Pacific | 0 | 0.0% |
| Hispanic or Latino | 0 | 0.0% |
| Native / Alaskan | 0 | 0.0% |
| White / Caucasian | 664 | 99.0% |
| Two or more Races | 5 | 0.7% |
| Some other Race | 0 | 0.0% |
| Total | 671 | 100.0% |
Ancestry in Mapleton
The most populous ancestries reported in Mapleton are English (131 | 19.5%), French Canadian (93 | 13.9%), American (70 | 10.4%), French (51 | 7.6%), and Irish (38 | 5.7%), together accounting for 57.1% of all Mapleton residents.
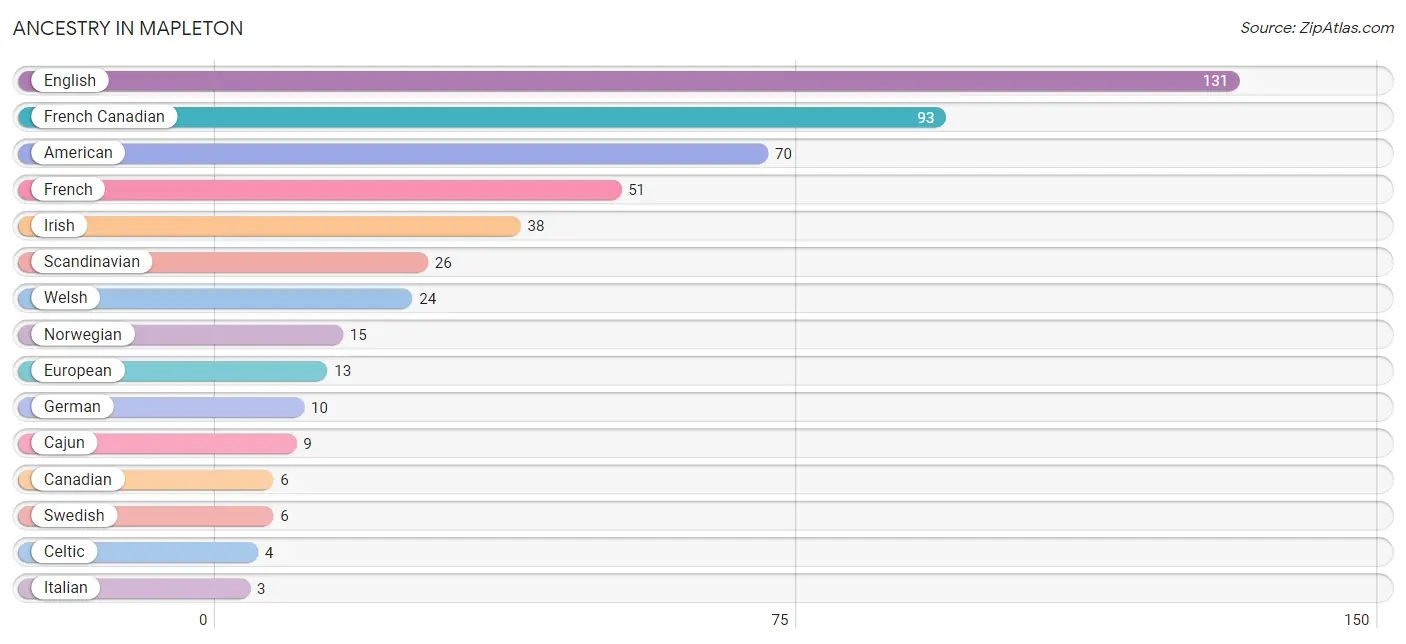
| Ancestry | # Population | % Population |
| American | 70 | 10.4% |
| Cajun | 9 | 1.3% |
| Canadian | 6 | 0.9% |
| Celtic | 4 | 0.6% |
| English | 131 | 19.5% |
| European | 13 | 1.9% |
| French | 51 | 7.6% |
| French Canadian | 93 | 13.9% |
| German | 10 | 1.5% |
| Irish | 38 | 5.7% |
| Italian | 3 | 0.4% |
| Norwegian | 15 | 2.2% |
| Russian | 1 | 0.2% |
| Scandinavian | 26 | 3.9% |
| Subsaharan African | 1 | 0.2% |
| Swedish | 6 | 0.9% |
| Welsh | 24 | 3.6% | View All 17 Rows |
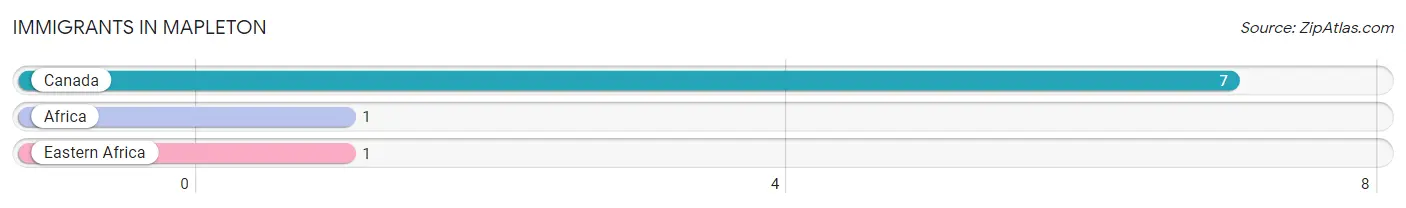
Immigrants in Mapleton
The most numerous immigrant groups reported in Mapleton came from Canada (7 | 1.0%), Africa (1 | 0.2%), and Eastern Africa (1 | 0.2%), together accounting for 1.3% of all Mapleton residents.
| Immigration Origin | # Population | % Population |
| Africa | 1 | 0.2% |
| Canada | 7 | 1.0% |
| Eastern Africa | 1 | 0.2% | View All 3 Rows |
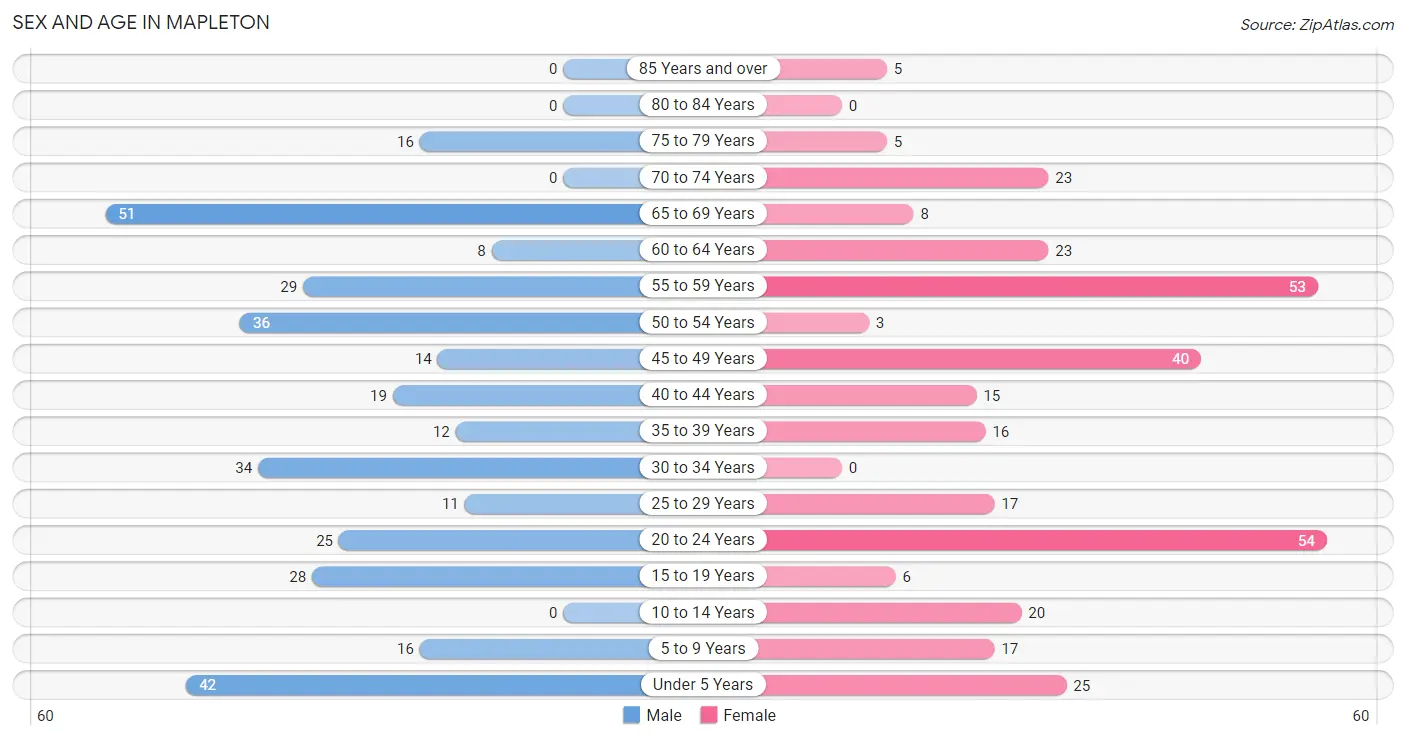
Sex and Age in Mapleton
Sex and Age in Mapleton
The most populous age groups in Mapleton are 65 to 69 Years (51 | 15.0%) for men and 20 to 24 Years (54 | 16.4%) for women.
| Age Bracket | Male | Female |
| Under 5 Years | 42 (12.3%) | 25 (7.6%) |
| 5 to 9 Years | 16 (4.7%) | 17 (5.1%) |
| 10 to 14 Years | 0 (0.0%) | 20 (6.1%) |
| 15 to 19 Years | 28 (8.2%) | 6 (1.8%) |
| 20 to 24 Years | 25 (7.3%) | 54 (16.4%) |
| 25 to 29 Years | 11 (3.2%) | 17 (5.1%) |
| 30 to 34 Years | 34 (10.0%) | 0 (0.0%) |
| 35 to 39 Years | 12 (3.5%) | 16 (4.9%) |
| 40 to 44 Years | 19 (5.6%) | 15 (4.5%) |
| 45 to 49 Years | 14 (4.1%) | 40 (12.1%) |
| 50 to 54 Years | 36 (10.6%) | 3 (0.9%) |
| 55 to 59 Years | 29 (8.5%) | 53 (16.1%) |
| 60 to 64 Years | 8 (2.4%) | 23 (7.0%) |
| 65 to 69 Years | 51 (15.0%) | 8 (2.4%) |
| 70 to 74 Years | 0 (0.0%) | 23 (7.0%) |
| 75 to 79 Years | 16 (4.7%) | 5 (1.5%) |
| 80 to 84 Years | 0 (0.0%) | 0 (0.0%) |
| 85 Years and over | 0 (0.0%) | 5 (1.5%) |
| Total | 341 (100.0%) | 330 (100.0%) |
Families and Households in Mapleton
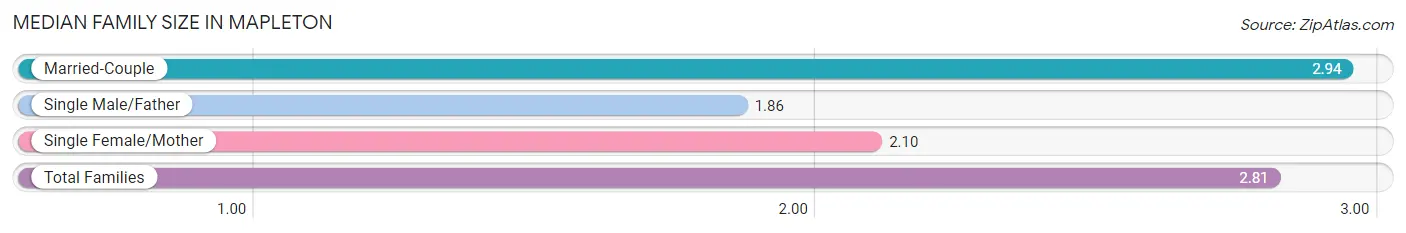
Median Family Size in Mapleton
The median family size in Mapleton is 2.81 persons per family, with married-couple families (159 | 85.0%) accounting for the largest median family size of 2.94 persons per family. On the other hand, single male/father families (7 | 3.7%) represent the smallest median family size with 1.86 persons per family.
| Family Type | # Families | Family Size |
| Married-Couple | 159 (85.0%) | 2.94 |
| Single Male/Father | 7 (3.7%) | 1.86 |
| Single Female/Mother | 21 (11.2%) | 2.10 |
| Total Families | 187 (100.0%) | 2.81 |
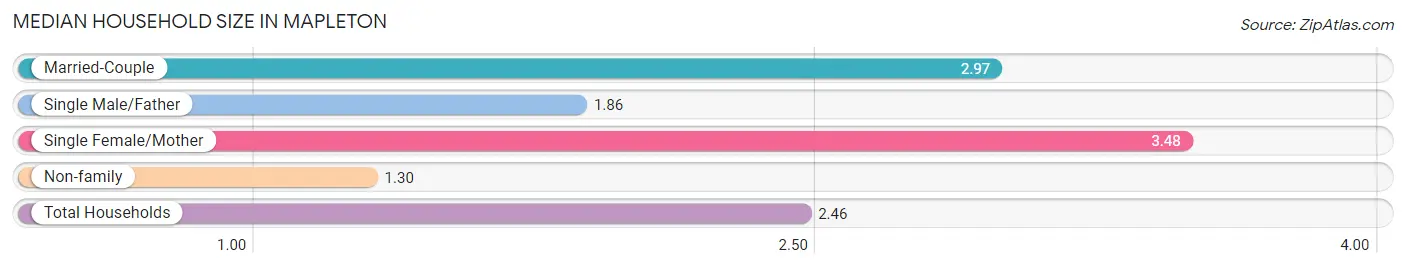
Median Household Size in Mapleton
The median household size in Mapleton is 2.46 persons per household, with single female/mother households (21 | 7.7%) accounting for the largest median household size of 3.48 persons per household. non-family households (84 | 31.0%) represent the smallest median household size with 1.30 persons per household.
| Household Type | # Households | Household Size |
| Married-Couple | 159 (58.7%) | 2.97 |
| Single Male/Father | 7 (2.6%) | 1.86 |
| Single Female/Mother | 21 (7.7%) | 3.48 |
| Non-family | 84 (31.0%) | 1.30 |
| Total Households | 271 (100.0%) | 2.46 |
Household Size by Marriage Status in Mapleton
Out of a total of 271 households in Mapleton, 187 (69.0%) are family households, while 84 (31.0%) are nonfamily households. The most numerous type of family households are 2-person households, comprising 72, and the most common type of nonfamily households are 1-person households, comprising 67.
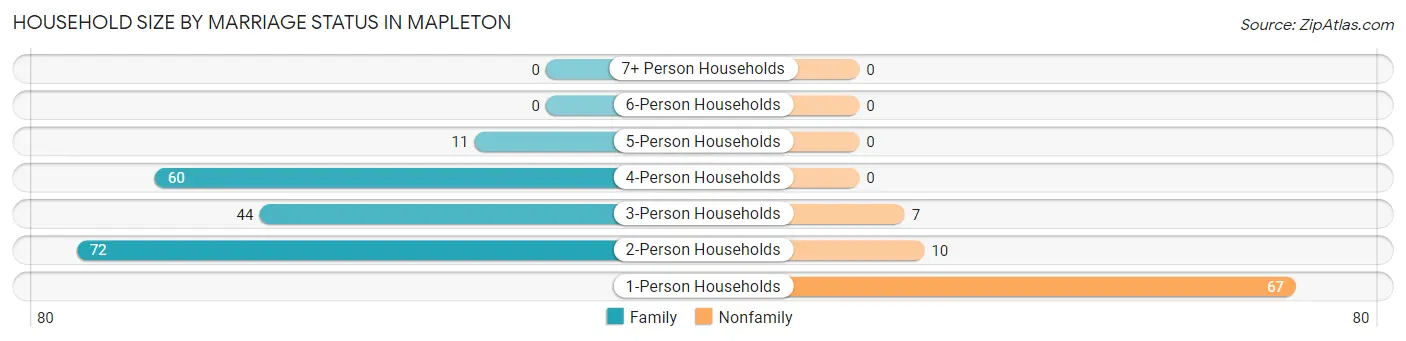
| Household Size | Family Households | Nonfamily Households |
| 1-Person Households | - | 67 (24.7%) |
| 2-Person Households | 72 (26.6%) | 10 (3.7%) |
| 3-Person Households | 44 (16.2%) | 7 (2.6%) |
| 4-Person Households | 60 (22.1%) | 0 (0.0%) |
| 5-Person Households | 11 (4.1%) | 0 (0.0%) |
| 6-Person Households | 0 (0.0%) | 0 (0.0%) |
| 7+ Person Households | 0 (0.0%) | 0 (0.0%) |
| Total | 187 (69.0%) | 84 (31.0%) |
Female Fertility in Mapleton
Fertility by Age in Mapleton
Average fertility rate in Mapleton is 95.0 births per 1,000 women. Women in the age bracket of 35 to 50 years have the highest fertility rate with 127.0 births per 1,000 women. Women in the age bracket of 35 to 50 years acount for 64.3% of all women with births.
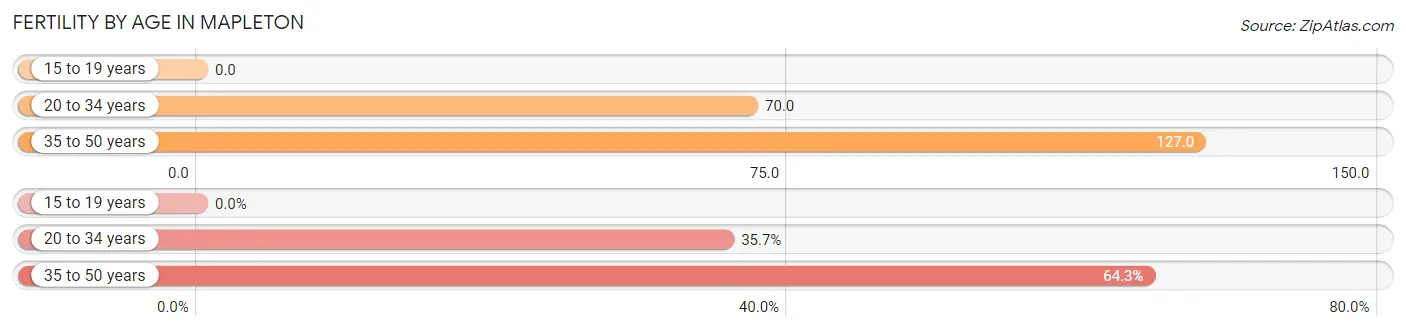
| Age Bracket | Women with Births | Births / 1,000 Women |
| 15 to 19 years | 0 (0.0%) | 0.0 |
| 20 to 34 years | 5 (35.7%) | 70.0 |
| 35 to 50 years | 9 (64.3%) | 127.0 |
| Total | 14 (100.0%) | 95.0 |
Fertility by Age by Marriage Status in Mapleton
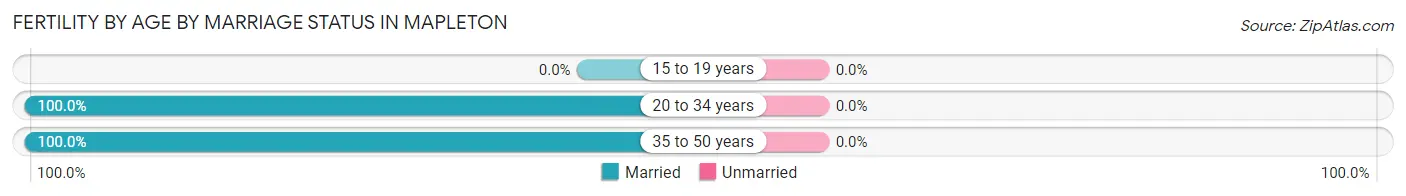
| Age Bracket | Married | Unmarried |
| 15 to 19 years | 0 (0.0%) | 0 (0.0%) |
| 20 to 34 years | 5 (100.0%) | 0 (0.0%) |
| 35 to 50 years | 9 (100.0%) | 0 (0.0%) |
| Total | 14 (100.0%) | 0 (0.0%) |
Fertility by Education in Mapleton
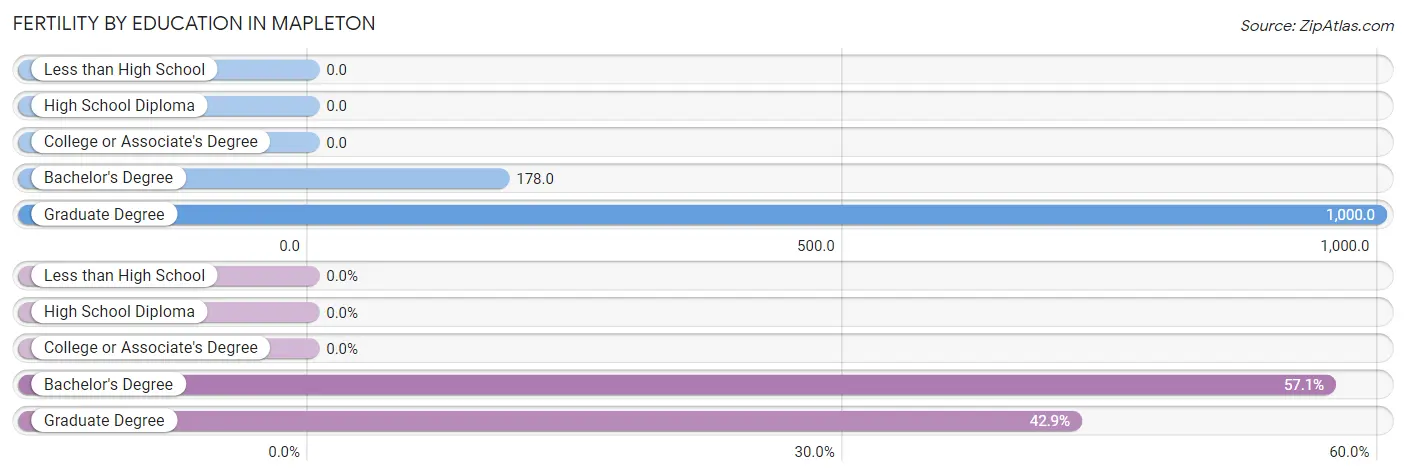
| Educational Attainment | Women with Births | Births / 1,000 Women |
| Less than High School | 0 (0.0%) | 0.0 |
| High School Diploma | 0 (0.0%) | 0.0 |
| College or Associate's Degree | 0 (0.0%) | 0.0 |
| Bachelor's Degree | 8 (57.1%) | 178.0 |
| Graduate Degree | 6 (42.9%) | 1,000.0 |
| Total | 14 (100.0%) | 95.0 |
Fertility by Education by Marriage Status in Mapleton
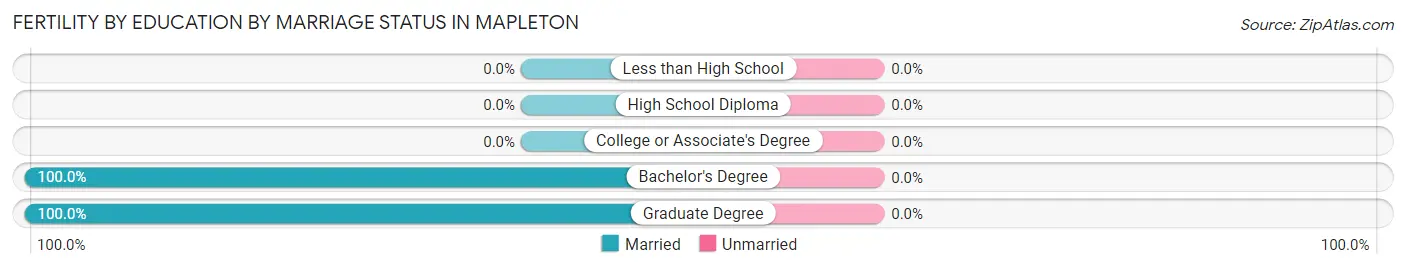
| Educational Attainment | Married | Unmarried |
| Less than High School | 0 (0.0%) | 0 (0.0%) |
| High School Diploma | 0 (0.0%) | 0 (0.0%) |
| College or Associate's Degree | 0 (0.0%) | 0 (0.0%) |
| Bachelor's Degree | 8 (100.0%) | 0 (0.0%) |
| Graduate Degree | 6 (100.0%) | 0 (0.0%) |
| Total | 14 (100.0%) | 0 (0.0%) |
Employment Characteristics in Mapleton
Employment by Class of Employer in Mapleton
Among the 368 employed individuals in Mapleton, private company employees (235 | 63.9%), local government employees (61 | 16.6%), and not-for-profit organizations (43 | 11.7%) make up the most common classes of employment.
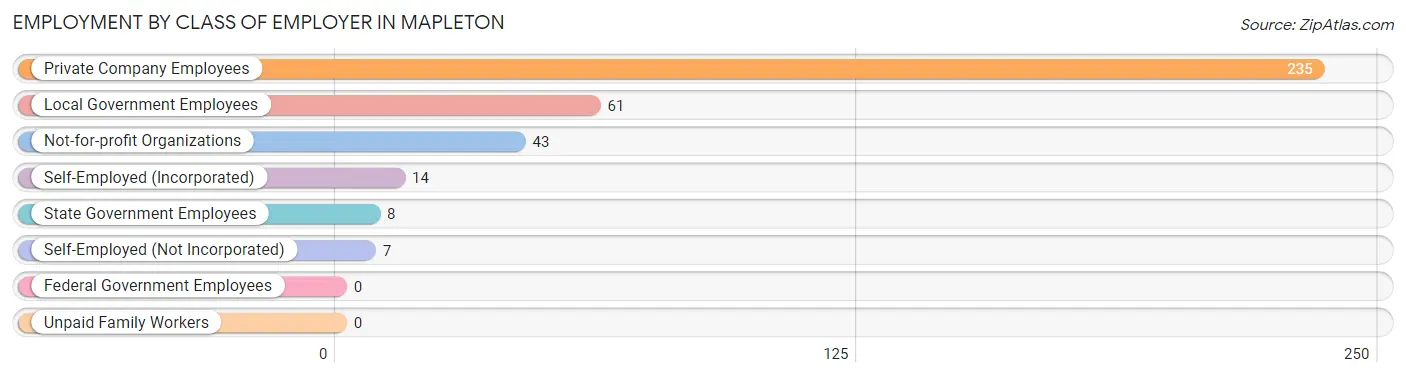
| Employer Class | # Employees | % Employees |
| Private Company Employees | 235 | 63.9% |
| Self-Employed (Incorporated) | 14 | 3.8% |
| Self-Employed (Not Incorporated) | 7 | 1.9% |
| Not-for-profit Organizations | 43 | 11.7% |
| Local Government Employees | 61 | 16.6% |
| State Government Employees | 8 | 2.2% |
| Federal Government Employees | 0 | 0.0% |
| Unpaid Family Workers | 0 | 0.0% |
| Total | 368 | 100.0% |
Employment Status by Age in Mapleton
According to the labor force statistics for Mapleton, out of the total population over 16 years of age (551), 73.7% or 406 individuals are in the labor force, with 7.9% or 32 of them unemployed. The age group with the highest labor force participation rate is 25 to 29 years, with 100.0% or 28 individuals in the labor force. Within the labor force, the 20 to 24 years age range has the highest percentage of unemployed individuals, with 40.8% or 31 of them being unemployed.
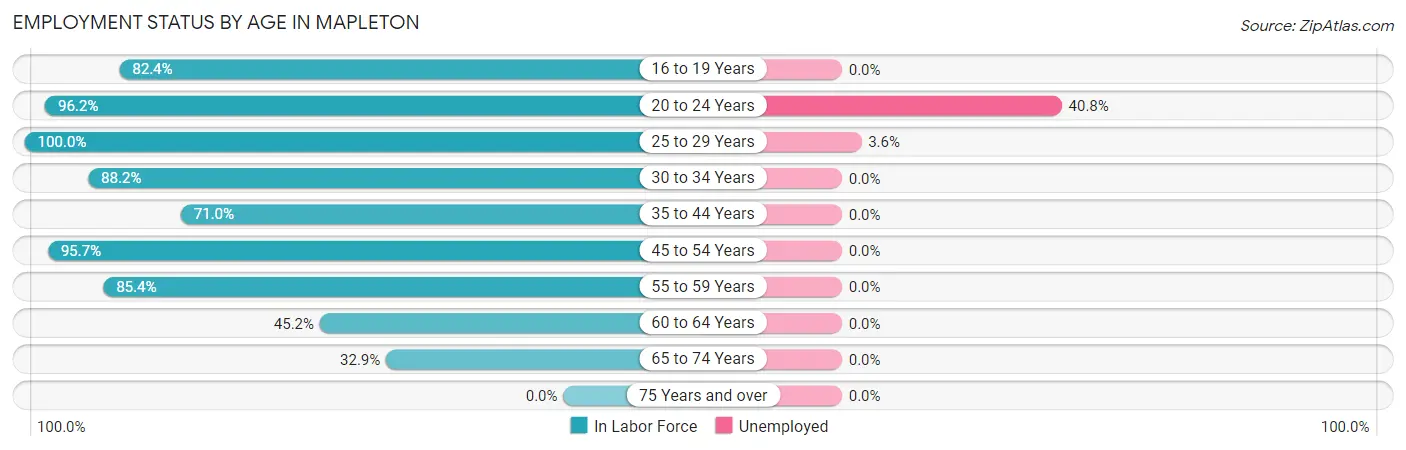
| Age Bracket | In Labor Force | Unemployed |
| 16 to 19 Years | 28 (82.4%) | 0 (0.0%) |
| 20 to 24 Years | 76 (96.2%) | 31 (40.8%) |
| 25 to 29 Years | 28 (100.0%) | 1 (3.6%) |
| 30 to 34 Years | 30 (88.2%) | 0 (0.0%) |
| 35 to 44 Years | 44 (71.0%) | 0 (0.0%) |
| 45 to 54 Years | 89 (95.7%) | 0 (0.0%) |
| 55 to 59 Years | 70 (85.4%) | 0 (0.0%) |
| 60 to 64 Years | 14 (45.2%) | 0 (0.0%) |
| 65 to 74 Years | 27 (32.9%) | 0 (0.0%) |
| 75 Years and over | 0 (0.0%) | 0 (0.0%) |
| Total | 406 (73.7%) | 32 (7.9%) |
Employment Status by Educational Attainment in Mapleton
According to labor force statistics for Mapleton, 83.3% of individuals (275) out of the total population between 25 and 64 years of age (330) are in the labor force, with 0.4% or 1 of them being unemployed. The group with the highest labor force participation rate are those with the educational attainment of bachelor's degree or higher, with 92.5% or 74 individuals in the labor force. Within the labor force, individuals with high school diploma education have the highest percentage of unemployment, with 2.1% or 1 of them being unemployed.
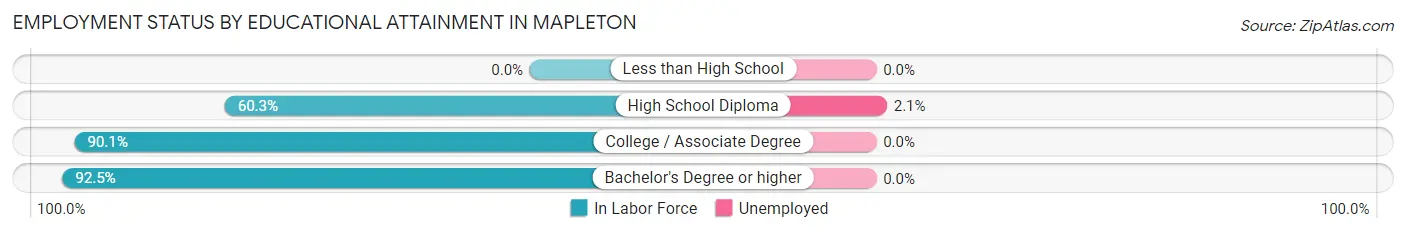
| Educational Attainment | In Labor Force | Unemployed |
| Less than High School | 0 (0.0%) | 0 (0.0%) |
| High School Diploma | 47 (60.3%) | 2 (2.1%) |
| College / Associate Degree | 154 (90.1%) | 0 (0.0%) |
| Bachelor's Degree or higher | 74 (92.5%) | 0 (0.0%) |
| Total | 275 (83.3%) | 1 (0.4%) |
Employment Occupations by Sex in Mapleton
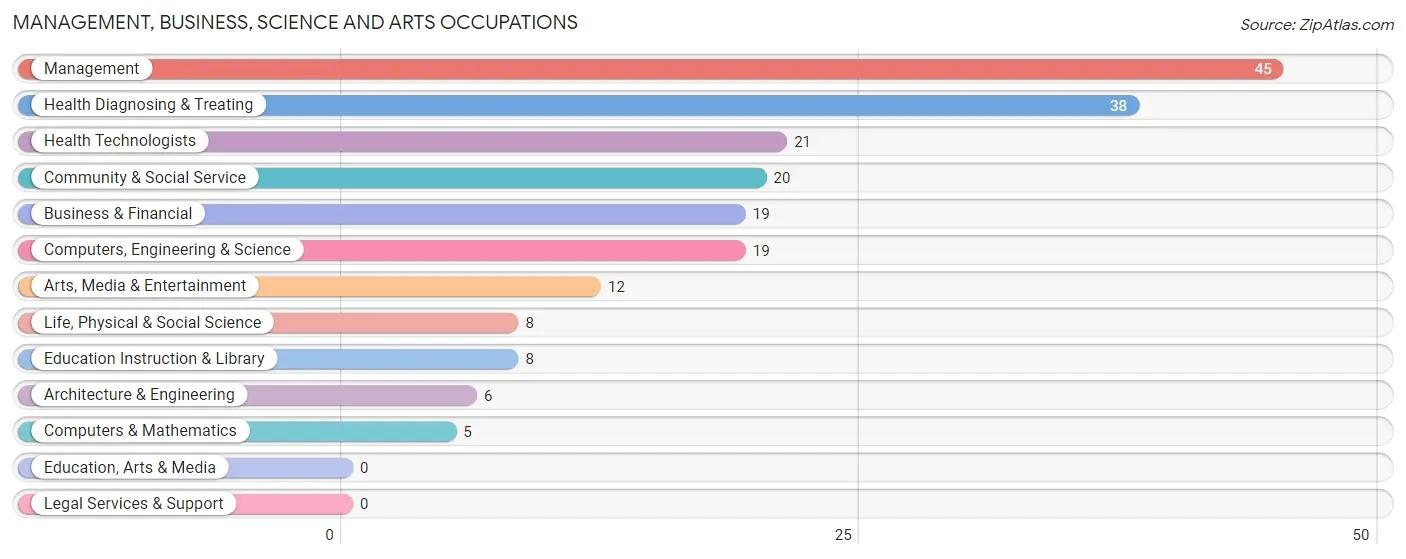
Management, Business, Science and Arts Occupations
The most common Management, Business, Science and Arts occupations in Mapleton are Management (45 | 12.0%), Health Diagnosing & Treating (38 | 10.2%), Health Technologists (21 | 5.6%), Community & Social Service (20 | 5.3%), and Business & Financial (19 | 5.1%).
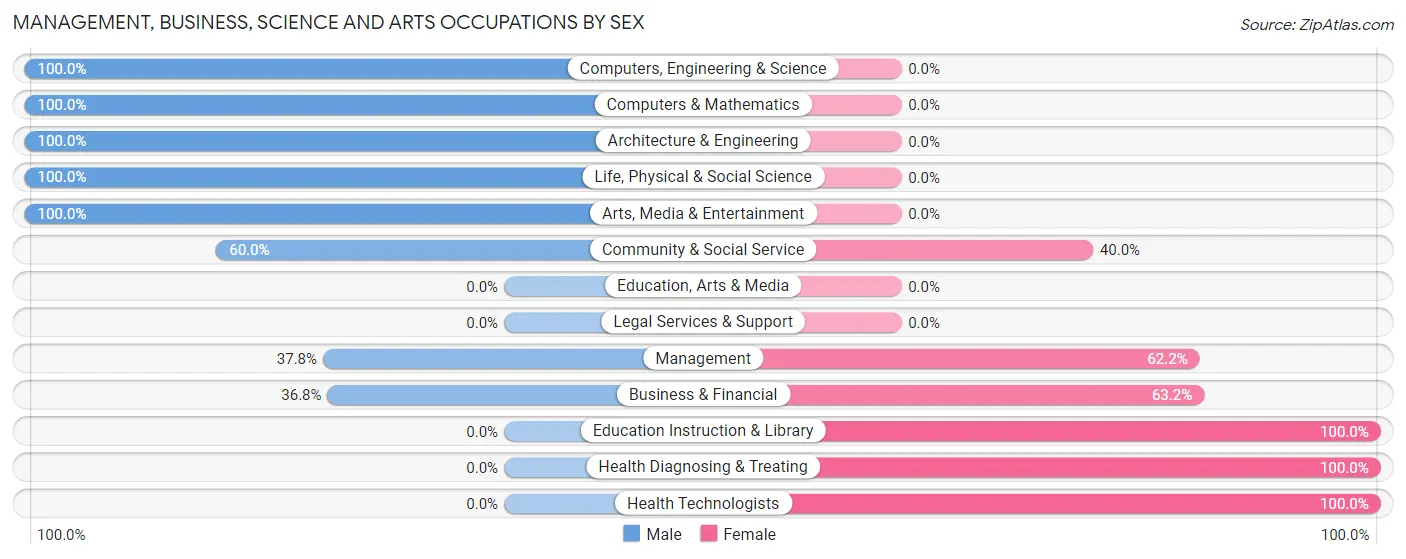
Management, Business, Science and Arts Occupations by Sex
Within the Management, Business, Science and Arts occupations in Mapleton, the most male-oriented occupations are Computers, Engineering & Science (100.0%), Computers & Mathematics (100.0%), and Architecture & Engineering (100.0%), while the most female-oriented occupations are Education Instruction & Library (100.0%), Health Diagnosing & Treating (100.0%), and Health Technologists (100.0%).
| Occupation | Male | Female |
| Management | 17 (37.8%) | 28 (62.2%) |
| Business & Financial | 7 (36.8%) | 12 (63.2%) |
| Computers, Engineering & Science | 19 (100.0%) | 0 (0.0%) |
| Computers & Mathematics | 5 (100.0%) | 0 (0.0%) |
| Architecture & Engineering | 6 (100.0%) | 0 (0.0%) |
| Life, Physical & Social Science | 8 (100.0%) | 0 (0.0%) |
| Community & Social Service | 12 (60.0%) | 8 (40.0%) |
| Education, Arts & Media | 0 (0.0%) | 0 (0.0%) |
| Legal Services & Support | 0 (0.0%) | 0 (0.0%) |
| Education Instruction & Library | 0 (0.0%) | 8 (100.0%) |
| Arts, Media & Entertainment | 12 (100.0%) | 0 (0.0%) |
| Health Diagnosing & Treating | 0 (0.0%) | 38 (100.0%) |
| Health Technologists | 0 (0.0%) | 21 (100.0%) |
| Total (Category) | 55 (39.0%) | 86 (61.0%) |
| Total (Overall) | 210 (56.1%) | 164 (43.9%) |
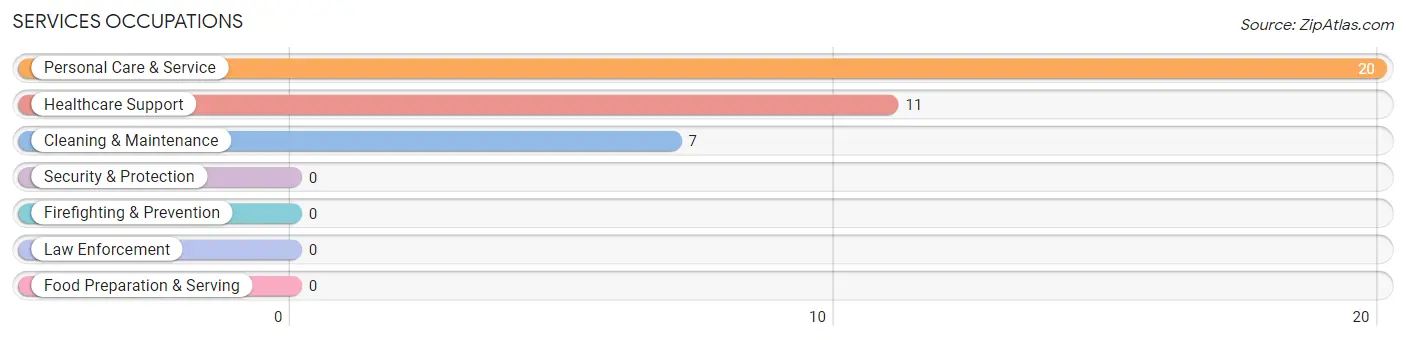
Services Occupations
The most common Services occupations in Mapleton are Personal Care & Service (20 | 5.3%), Healthcare Support (11 | 2.9%), and Cleaning & Maintenance (7 | 1.9%).
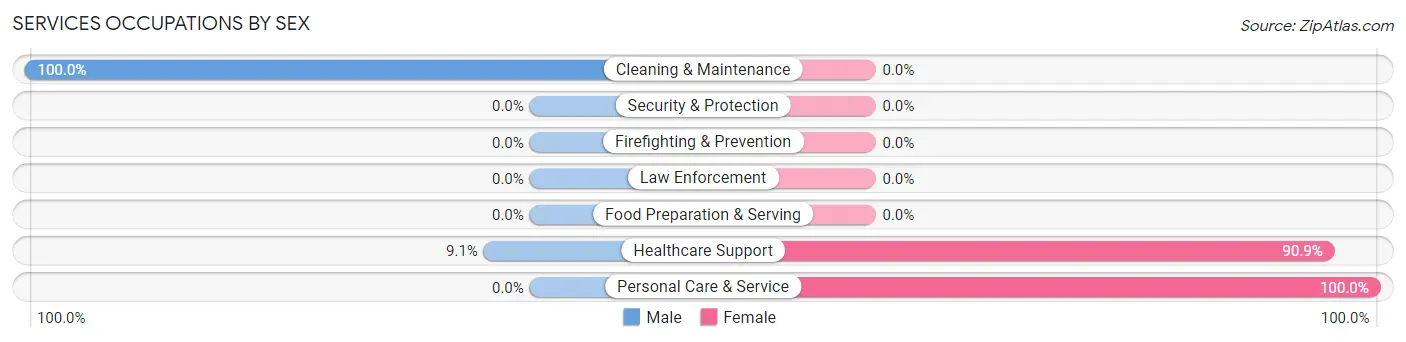
Services Occupations by Sex
Within the Services occupations in Mapleton, the most male-oriented occupations are Cleaning & Maintenance (100.0%), and Healthcare Support (9.1%), while the most female-oriented occupations are Personal Care & Service (100.0%), and Healthcare Support (90.9%).
| Occupation | Male | Female |
| Healthcare Support | 1 (9.1%) | 10 (90.9%) |
| Security & Protection | 0 (0.0%) | 0 (0.0%) |
| Firefighting & Prevention | 0 (0.0%) | 0 (0.0%) |
| Law Enforcement | 0 (0.0%) | 0 (0.0%) |
| Food Preparation & Serving | 0 (0.0%) | 0 (0.0%) |
| Cleaning & Maintenance | 7 (100.0%) | 0 (0.0%) |
| Personal Care & Service | 0 (0.0%) | 20 (100.0%) |
| Total (Category) | 8 (21.0%) | 30 (78.9%) |
| Total (Overall) | 210 (56.1%) | 164 (43.9%) |
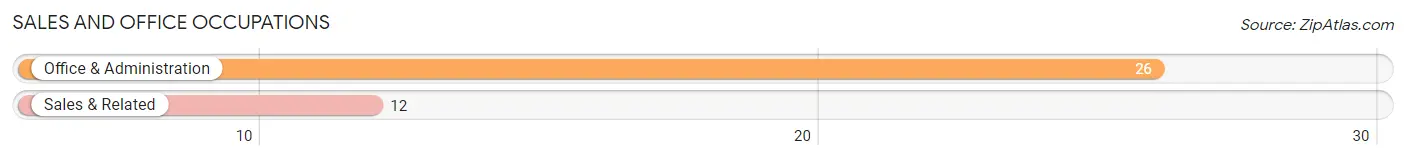
Sales and Office Occupations
The most common Sales and Office occupations in Mapleton are Office & Administration (26 | 7.0%), and Sales & Related (12 | 3.2%).
Sales and Office Occupations by Sex
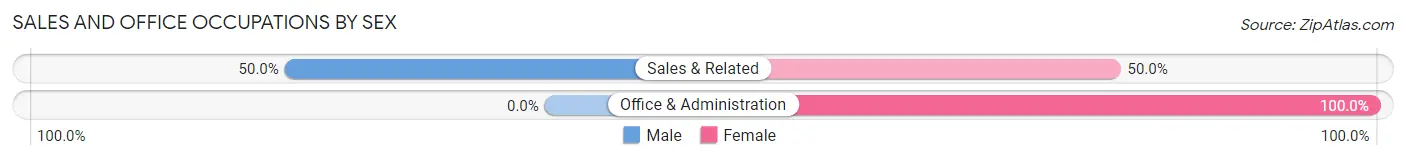
| Occupation | Male | Female |
| Sales & Related | 6 (50.0%) | 6 (50.0%) |
| Office & Administration | 0 (0.0%) | 26 (100.0%) |
| Total (Category) | 6 (15.8%) | 32 (84.2%) |
| Total (Overall) | 210 (56.1%) | 164 (43.9%) |
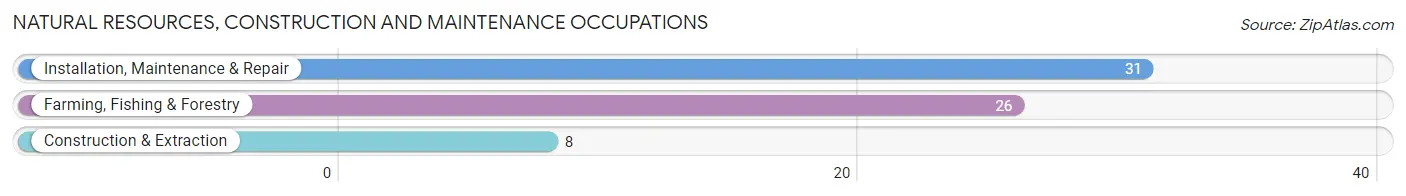
Natural Resources, Construction and Maintenance Occupations
The most common Natural Resources, Construction and Maintenance occupations in Mapleton are Installation, Maintenance & Repair (31 | 8.3%), Farming, Fishing & Forestry (26 | 7.0%), and Construction & Extraction (8 | 2.1%).
Natural Resources, Construction and Maintenance Occupations by Sex
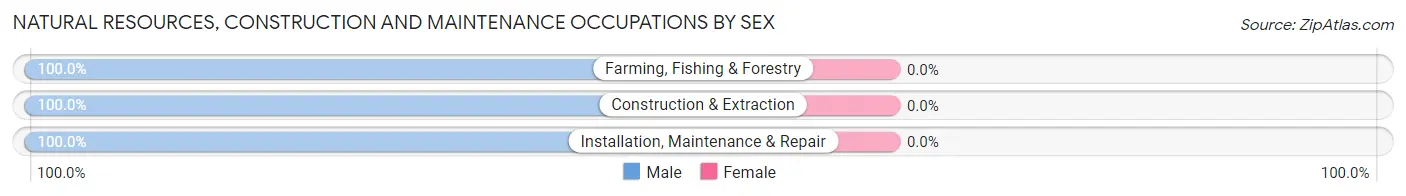
| Occupation | Male | Female |
| Farming, Fishing & Forestry | 26 (100.0%) | 0 (0.0%) |
| Construction & Extraction | 8 (100.0%) | 0 (0.0%) |
| Installation, Maintenance & Repair | 31 (100.0%) | 0 (0.0%) |
| Total (Category) | 65 (100.0%) | 0 (0.0%) |
| Total (Overall) | 210 (56.1%) | 164 (43.9%) |
Production, Transportation and Moving Occupations
The most common Production, Transportation and Moving occupations in Mapleton are Transportation (37 | 9.9%), Material Moving (36 | 9.6%), and Production (19 | 5.1%).
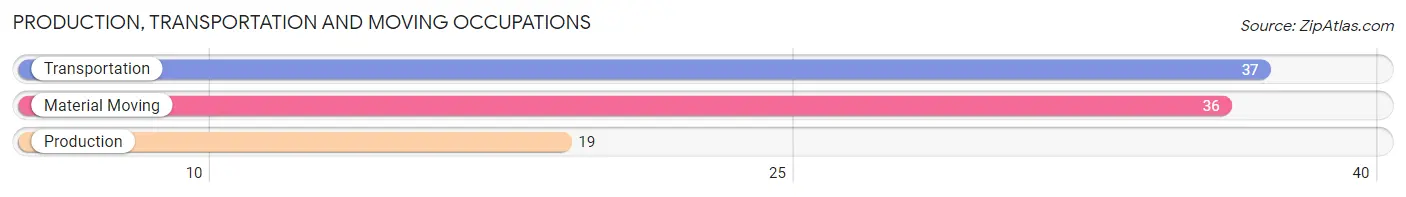
Production, Transportation and Moving Occupations by Sex
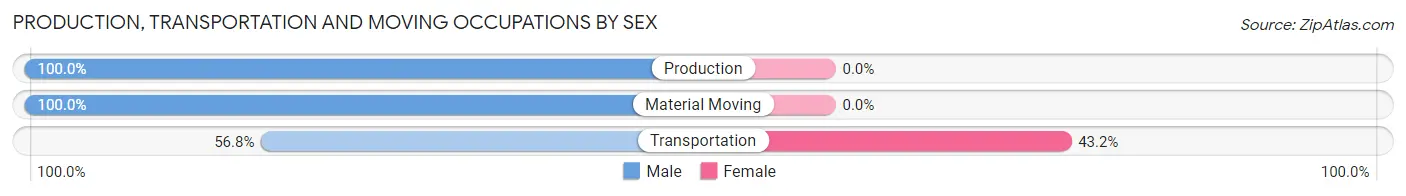
| Occupation | Male | Female |
| Production | 19 (100.0%) | 0 (0.0%) |
| Transportation | 21 (56.8%) | 16 (43.2%) |
| Material Moving | 36 (100.0%) | 0 (0.0%) |
| Total (Category) | 76 (82.6%) | 16 (17.4%) |
| Total (Overall) | 210 (56.1%) | 164 (43.9%) |
Employment Industries by Sex in Mapleton
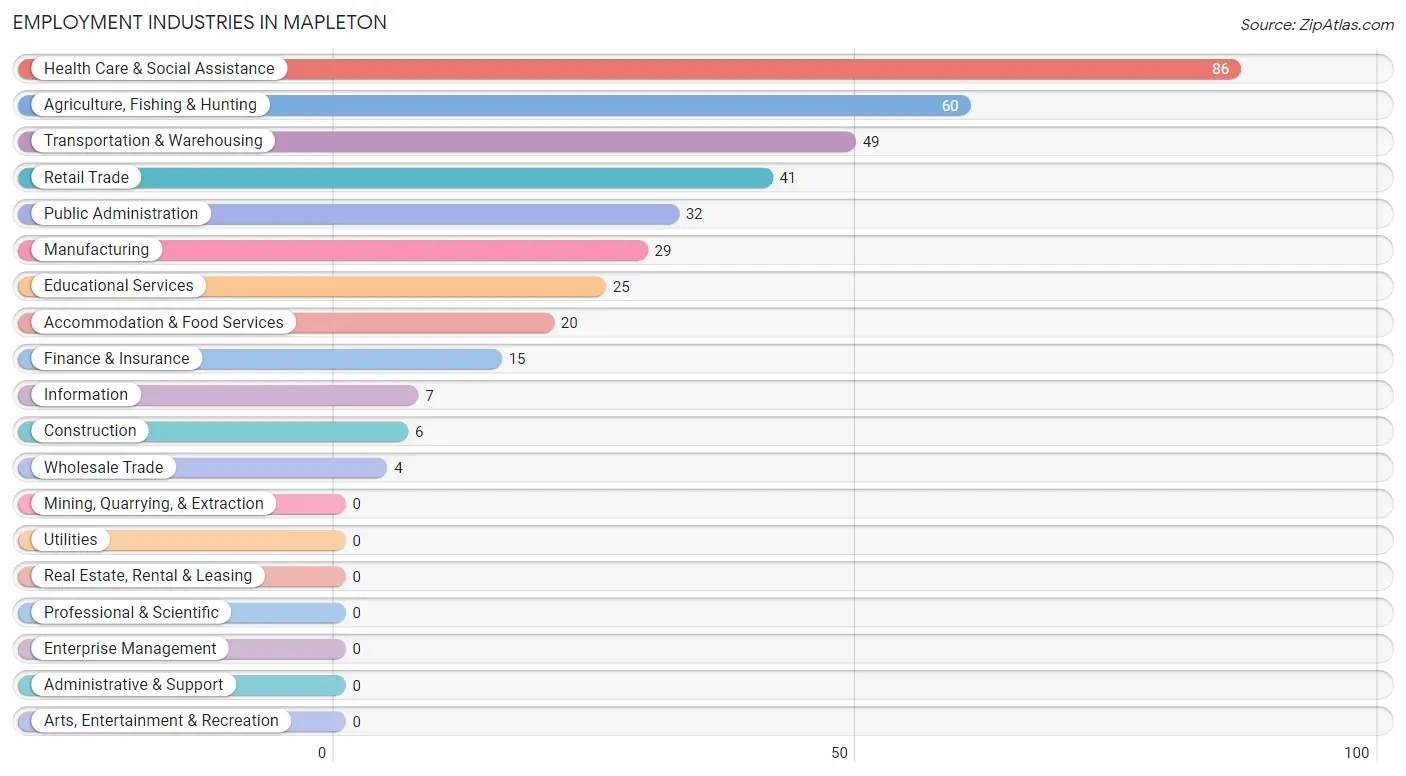
Employment Industries in Mapleton
The major employment industries in Mapleton include Health Care & Social Assistance (86 | 23.0%), Agriculture, Fishing & Hunting (60 | 16.0%), Transportation & Warehousing (49 | 13.1%), Retail Trade (41 | 11.0%), and Public Administration (32 | 8.6%).
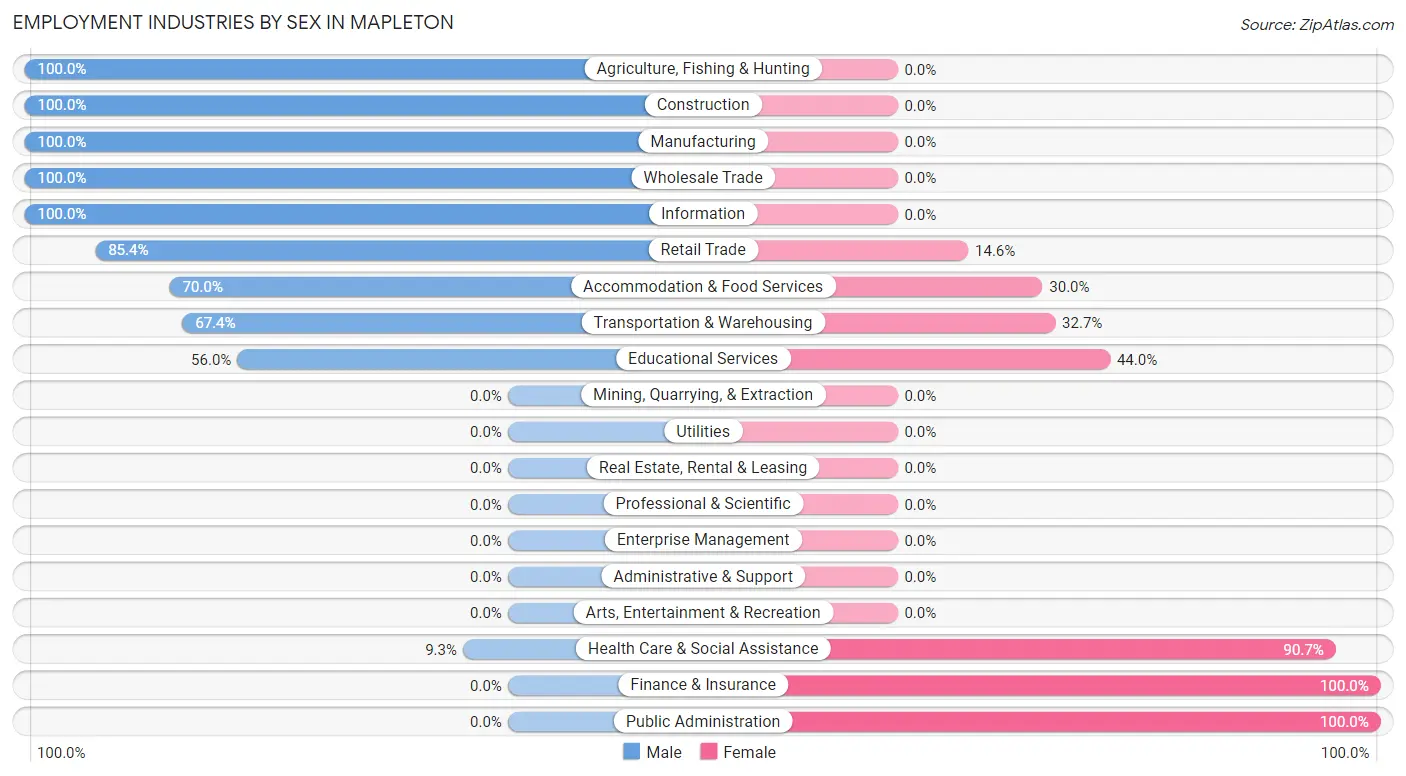
Employment Industries by Sex in Mapleton
The Mapleton industries that see more men than women are Agriculture, Fishing & Hunting (100.0%), Construction (100.0%), and Manufacturing (100.0%), whereas the industries that tend to have a higher number of women are Finance & Insurance (100.0%), Public Administration (100.0%), and Health Care & Social Assistance (90.7%).
| Industry | Male | Female |
| Agriculture, Fishing & Hunting | 60 (100.0%) | 0 (0.0%) |
| Mining, Quarrying, & Extraction | 0 (0.0%) | 0 (0.0%) |
| Construction | 6 (100.0%) | 0 (0.0%) |
| Manufacturing | 29 (100.0%) | 0 (0.0%) |
| Wholesale Trade | 4 (100.0%) | 0 (0.0%) |
| Retail Trade | 35 (85.4%) | 6 (14.6%) |
| Transportation & Warehousing | 33 (67.3%) | 16 (32.7%) |
| Utilities | 0 (0.0%) | 0 (0.0%) |
| Information | 7 (100.0%) | 0 (0.0%) |
| Finance & Insurance | 0 (0.0%) | 15 (100.0%) |
| Real Estate, Rental & Leasing | 0 (0.0%) | 0 (0.0%) |
| Professional & Scientific | 0 (0.0%) | 0 (0.0%) |
| Enterprise Management | 0 (0.0%) | 0 (0.0%) |
| Administrative & Support | 0 (0.0%) | 0 (0.0%) |
| Educational Services | 14 (56.0%) | 11 (44.0%) |
| Health Care & Social Assistance | 8 (9.3%) | 78 (90.7%) |
| Arts, Entertainment & Recreation | 0 (0.0%) | 0 (0.0%) |
| Accommodation & Food Services | 14 (70.0%) | 6 (30.0%) |
| Public Administration | 0 (0.0%) | 32 (100.0%) |
| Total | 210 (56.1%) | 164 (43.9%) |
Education in Mapleton
School Enrollment in Mapleton
The most common levels of schooling among the 112 students in Mapleton are high school (28 | 25.0%), college / undergraduate (27 | 24.1%), and middle school (20 | 17.9%).
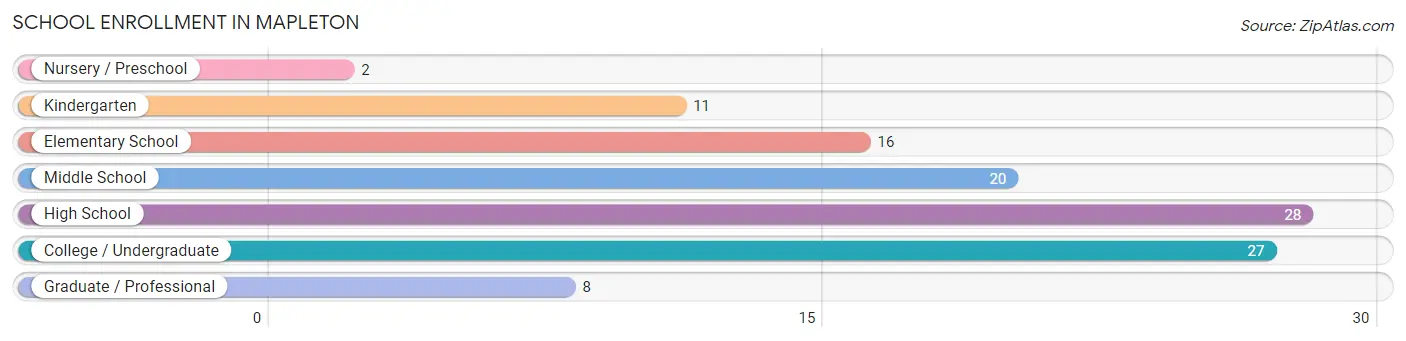
| School Level | # Students | % Students |
| Nursery / Preschool | 2 | 1.8% |
| Kindergarten | 11 | 9.8% |
| Elementary School | 16 | 14.3% |
| Middle School | 20 | 17.9% |
| High School | 28 | 25.0% |
| College / Undergraduate | 27 | 24.1% |
| Graduate / Professional | 8 | 7.1% |
| Total | 112 | 100.0% |
School Enrollment by Age by Funding Source in Mapleton
Out of a total of 112 students who are enrolled in schools in Mapleton, 6 (5.4%) attend a private institution, while the remaining 106 (94.6%) are enrolled in public schools. The age group of 35 years and over has the highest likelihood of being enrolled in private schools, with 3 (100.0% in the age bracket) enrolled. Conversely, the age group of 3 to 4 year olds has the lowest likelihood of being enrolled in a private school, with 2 (100.0% in the age bracket) attending a public institution.
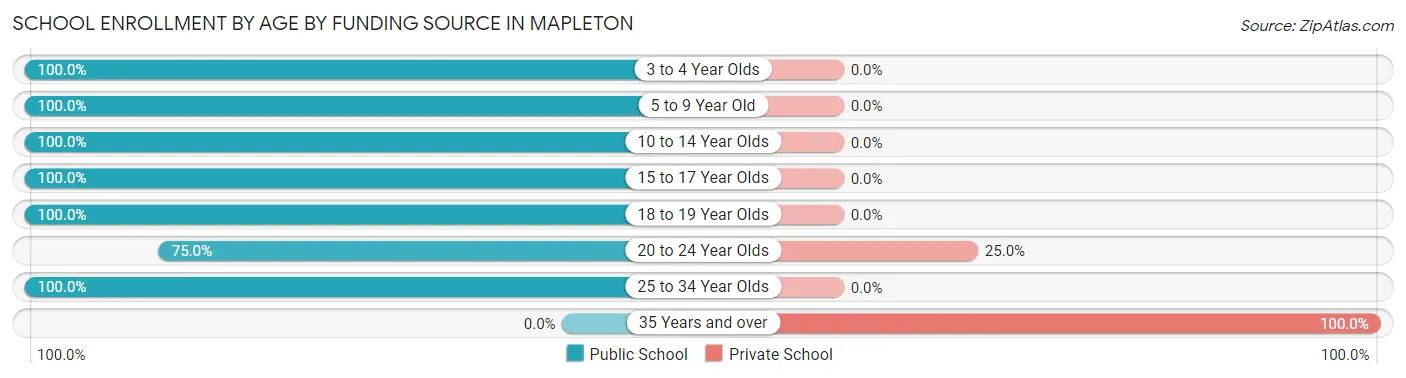
| Age Bracket | Public School | Private School |
| 3 to 4 Year Olds | 2 (100.0%) | 0 (0.0%) |
| 5 to 9 Year Old | 27 (100.0%) | 0 (0.0%) |
| 10 to 14 Year Olds | 20 (100.0%) | 0 (0.0%) |
| 15 to 17 Year Olds | 22 (100.0%) | 0 (0.0%) |
| 18 to 19 Year Olds | 6 (100.0%) | 0 (0.0%) |
| 20 to 24 Year Olds | 9 (75.0%) | 3 (25.0%) |
| 25 to 34 Year Olds | 20 (100.0%) | 0 (0.0%) |
| 35 Years and over | 0 (0.0%) | 3 (100.0%) |
| Total | 106 (94.6%) | 6 (5.4%) |
Educational Attainment by Field of Study in Mapleton
Education (30 | 27.8%), science & technology (27 | 25.0%), computers & mathematics (12 | 11.1%), engineering (12 | 11.1%), and literature & languages (10 | 9.3%) are the most common fields of study among 108 individuals in Mapleton who have obtained a bachelor's degree or higher.
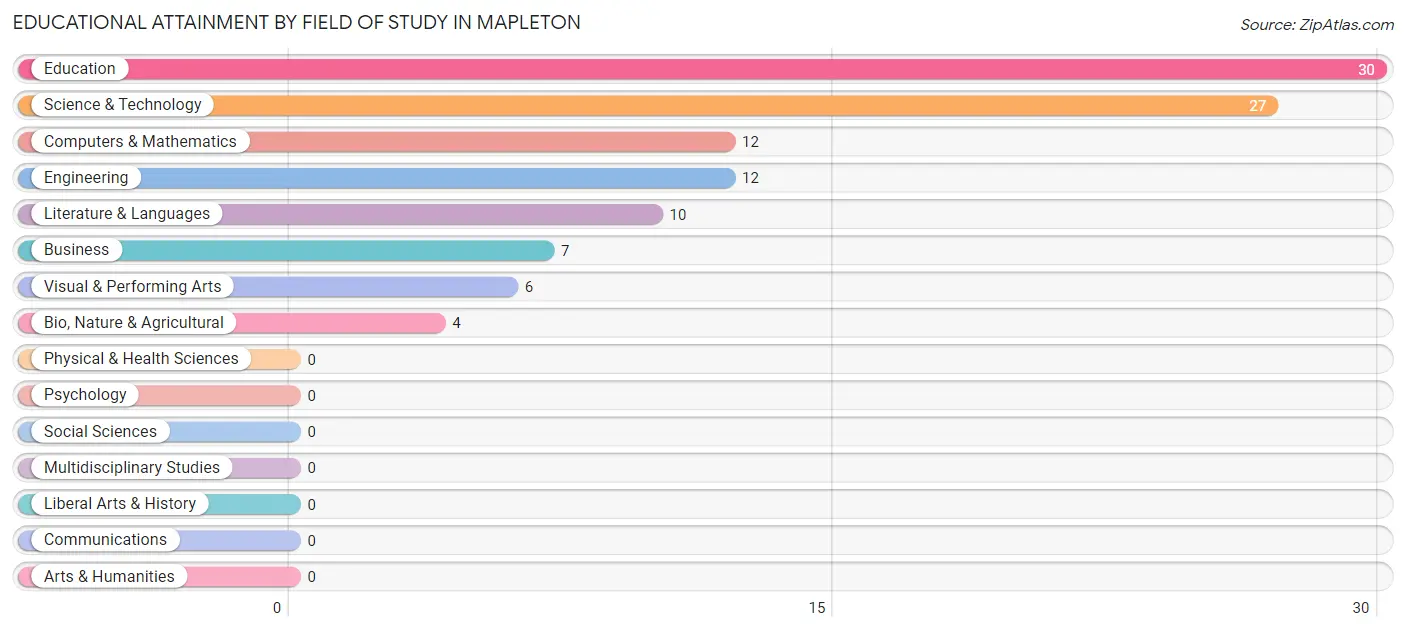
| Field of Study | # Graduates | % Graduates |
| Computers & Mathematics | 12 | 11.1% |
| Bio, Nature & Agricultural | 4 | 3.7% |
| Physical & Health Sciences | 0 | 0.0% |
| Psychology | 0 | 0.0% |
| Social Sciences | 0 | 0.0% |
| Engineering | 12 | 11.1% |
| Multidisciplinary Studies | 0 | 0.0% |
| Science & Technology | 27 | 25.0% |
| Business | 7 | 6.5% |
| Education | 30 | 27.8% |
| Literature & Languages | 10 | 9.3% |
| Liberal Arts & History | 0 | 0.0% |
| Visual & Performing Arts | 6 | 5.6% |
| Communications | 0 | 0.0% |
| Arts & Humanities | 0 | 0.0% |
| Total | 108 | 100.0% |
Transportation & Commute in Mapleton
Vehicle Availability by Sex in Mapleton
The most prevalent vehicle ownership categories in Mapleton are males with 2 vehicles (76, accounting for 37.4%) and females with 2 vehicles (69, making up 46.3%).
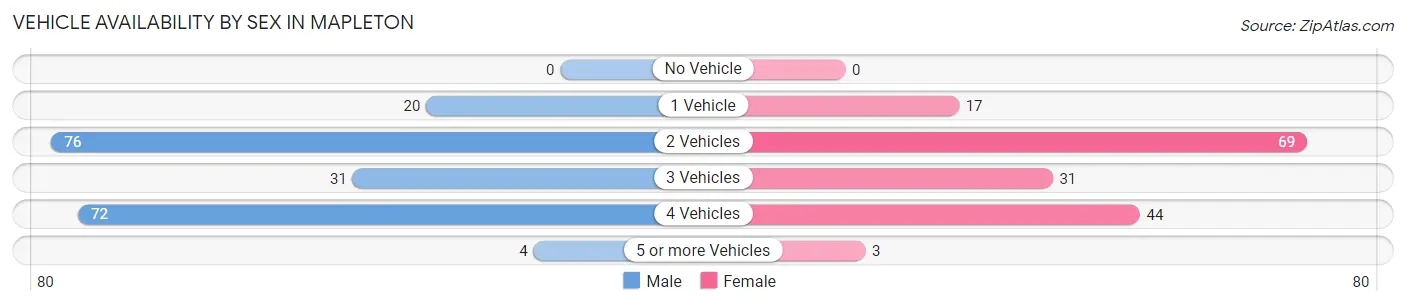
| Vehicles Available | Male | Female |
| No Vehicle | 0 (0.0%) | 0 (0.0%) |
| 1 Vehicle | 20 (9.9%) | 17 (10.4%) |
| 2 Vehicles | 76 (37.4%) | 69 (42.1%) |
| 3 Vehicles | 31 (15.3%) | 31 (18.9%) |
| 4 Vehicles | 72 (35.5%) | 44 (26.8%) |
| 5 or more Vehicles | 4 (2.0%) | 3 (1.8%) |
| Total | 203 (100.0%) | 164 (100.0%) |
Commute Time in Mapleton
The most frequently occuring commute durations in Mapleton are 15 to 19 minutes (100 commuters, 28.4%), 30 to 34 minutes (80 commuters, 22.7%), and 20 to 24 minutes (55 commuters, 15.6%).
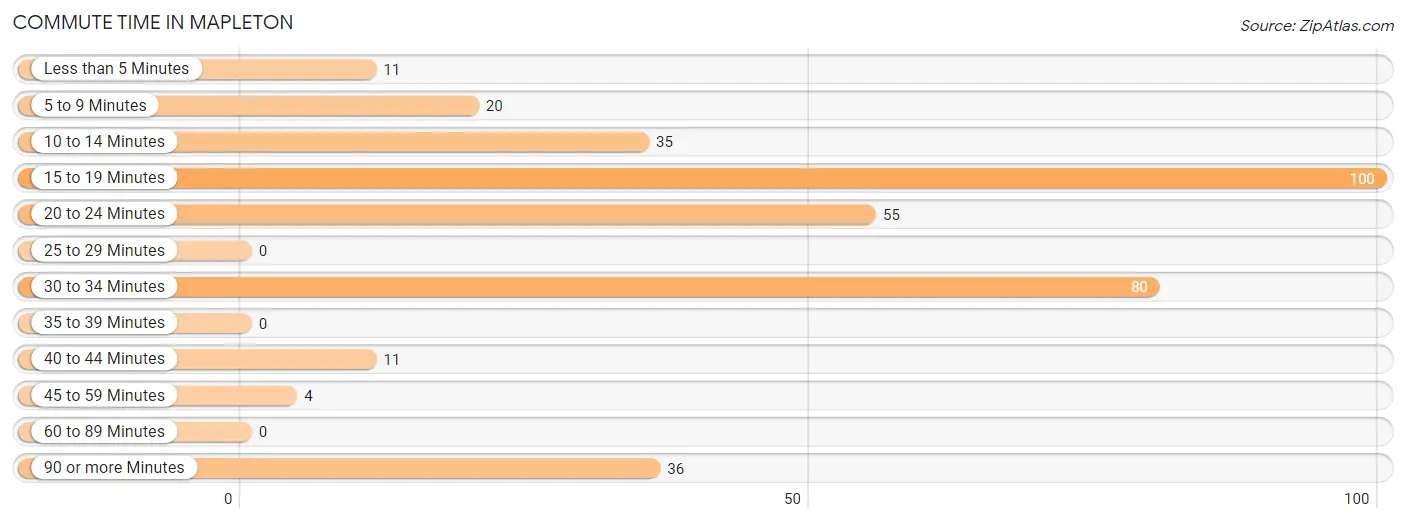
| Commute Time | # Commuters | % Commuters |
| Less than 5 Minutes | 11 | 3.1% |
| 5 to 9 Minutes | 20 | 5.7% |
| 10 to 14 Minutes | 35 | 9.9% |
| 15 to 19 Minutes | 100 | 28.4% |
| 20 to 24 Minutes | 55 | 15.6% |
| 25 to 29 Minutes | 0 | 0.0% |
| 30 to 34 Minutes | 80 | 22.7% |
| 35 to 39 Minutes | 0 | 0.0% |
| 40 to 44 Minutes | 11 | 3.1% |
| 45 to 59 Minutes | 4 | 1.1% |
| 60 to 89 Minutes | 0 | 0.0% |
| 90 or more Minutes | 36 | 10.2% |
Commute Time by Sex in Mapleton
The most common commute times in Mapleton are 30 to 34 minutes (66 commuters, 34.4%) for males and 15 to 19 minutes (53 commuters, 33.1%) for females.
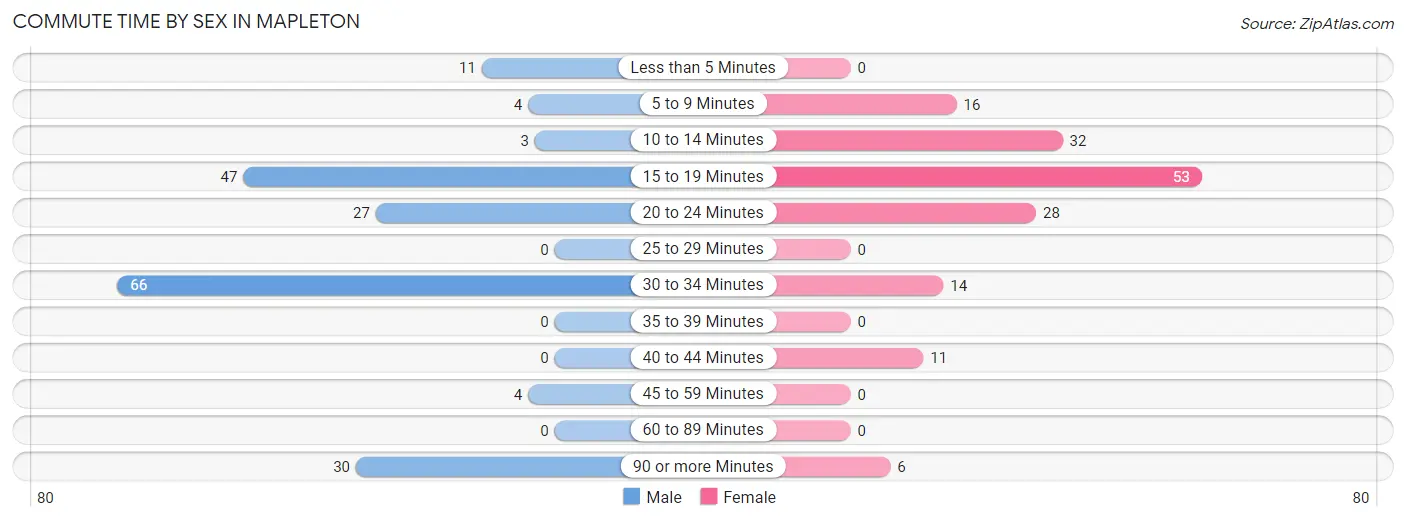
| Commute Time | Male | Female |
| Less than 5 Minutes | 11 (5.7%) | 0 (0.0%) |
| 5 to 9 Minutes | 4 (2.1%) | 16 (10.0%) |
| 10 to 14 Minutes | 3 (1.6%) | 32 (20.0%) |
| 15 to 19 Minutes | 47 (24.5%) | 53 (33.1%) |
| 20 to 24 Minutes | 27 (14.1%) | 28 (17.5%) |
| 25 to 29 Minutes | 0 (0.0%) | 0 (0.0%) |
| 30 to 34 Minutes | 66 (34.4%) | 14 (8.7%) |
| 35 to 39 Minutes | 0 (0.0%) | 0 (0.0%) |
| 40 to 44 Minutes | 0 (0.0%) | 11 (6.9%) |
| 45 to 59 Minutes | 4 (2.1%) | 0 (0.0%) |
| 60 to 89 Minutes | 0 (0.0%) | 0 (0.0%) |
| 90 or more Minutes | 30 (15.6%) | 6 (3.7%) |
Time of Departure to Work by Sex in Mapleton
The most frequent times of departure to work in Mapleton are 7:00 AM to 7:29 AM (55, 28.6%) for males and 7:30 AM to 7:59 AM (76, 47.5%) for females.
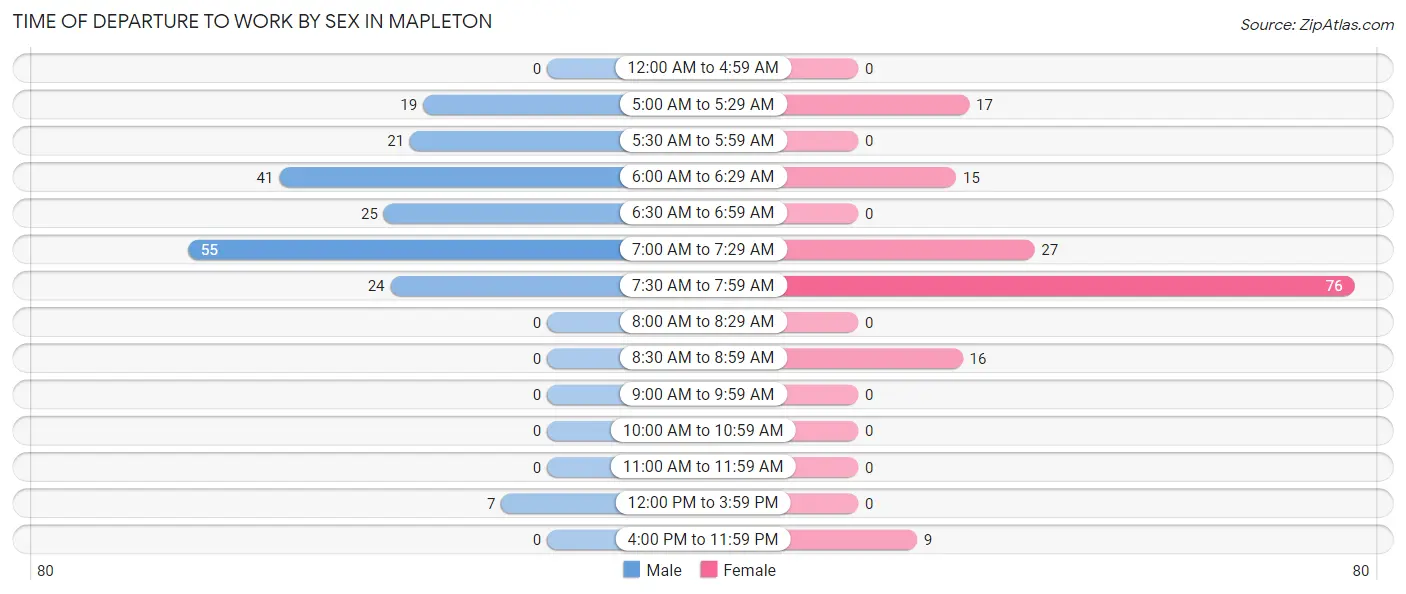
| Time of Departure | Male | Female |
| 12:00 AM to 4:59 AM | 0 (0.0%) | 0 (0.0%) |
| 5:00 AM to 5:29 AM | 19 (9.9%) | 17 (10.6%) |
| 5:30 AM to 5:59 AM | 21 (10.9%) | 0 (0.0%) |
| 6:00 AM to 6:29 AM | 41 (21.3%) | 15 (9.4%) |
| 6:30 AM to 6:59 AM | 25 (13.0%) | 0 (0.0%) |
| 7:00 AM to 7:29 AM | 55 (28.6%) | 27 (16.9%) |
| 7:30 AM to 7:59 AM | 24 (12.5%) | 76 (47.5%) |
| 8:00 AM to 8:29 AM | 0 (0.0%) | 0 (0.0%) |
| 8:30 AM to 8:59 AM | 0 (0.0%) | 16 (10.0%) |
| 9:00 AM to 9:59 AM | 0 (0.0%) | 0 (0.0%) |
| 10:00 AM to 10:59 AM | 0 (0.0%) | 0 (0.0%) |
| 11:00 AM to 11:59 AM | 0 (0.0%) | 0 (0.0%) |
| 12:00 PM to 3:59 PM | 7 (3.6%) | 0 (0.0%) |
| 4:00 PM to 11:59 PM | 0 (0.0%) | 9 (5.6%) |
| Total | 192 (100.0%) | 160 (100.0%) |
Housing Occupancy in Mapleton
Occupancy by Ownership in Mapleton
Of the total 271 dwellings in Mapleton, owner-occupied units account for 221 (81.6%), while renter-occupied units make up 50 (18.4%).
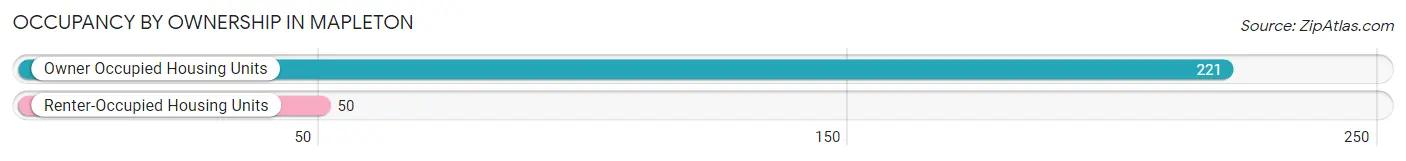
| Occupancy | # Housing Units | % Housing Units |
| Owner Occupied Housing Units | 221 | 81.6% |
| Renter-Occupied Housing Units | 50 | 18.4% |
| Total Occupied Housing Units | 271 | 100.0% |
Occupancy by Household Size in Mapleton
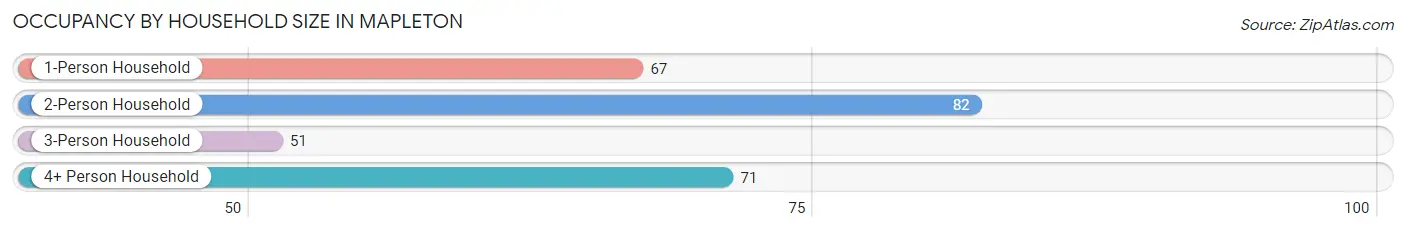
| Household Size | # Housing Units | % Housing Units |
| 1-Person Household | 67 | 24.7% |
| 2-Person Household | 82 | 30.3% |
| 3-Person Household | 51 | 18.8% |
| 4+ Person Household | 71 | 26.2% |
| Total Housing Units | 271 | 100.0% |
Occupancy by Ownership by Household Size in Mapleton
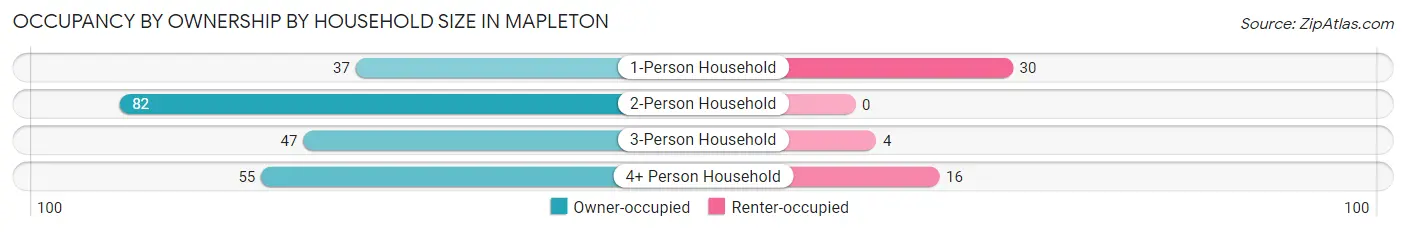
| Household Size | Owner-occupied | Renter-occupied |
| 1-Person Household | 37 (55.2%) | 30 (44.8%) |
| 2-Person Household | 82 (100.0%) | 0 (0.0%) |
| 3-Person Household | 47 (92.2%) | 4 (7.8%) |
| 4+ Person Household | 55 (77.5%) | 16 (22.5%) |
| Total Housing Units | 221 (81.6%) | 50 (18.4%) |
Occupancy by Educational Attainment in Mapleton
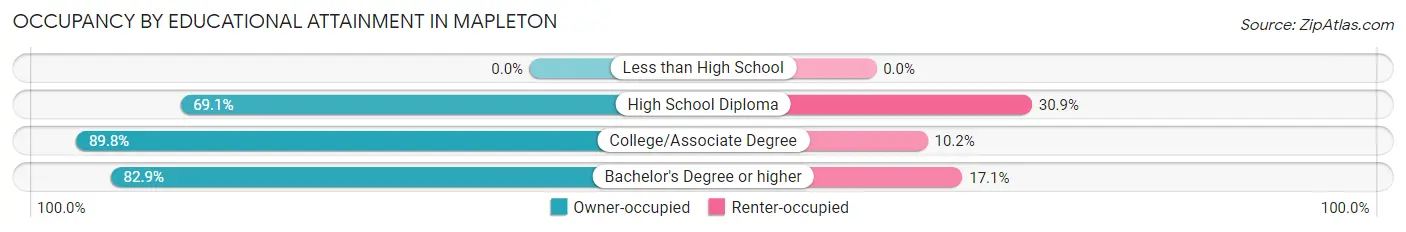
| Household Size | Owner-occupied | Renter-occupied |
| Less than High School | 0 (0.0%) | 0 (0.0%) |
| High School Diploma | 56 (69.1%) | 25 (30.9%) |
| College/Associate Degree | 97 (89.8%) | 11 (10.2%) |
| Bachelor's Degree or higher | 68 (82.9%) | 14 (17.1%) |
Occupancy by Age of Householder in Mapleton
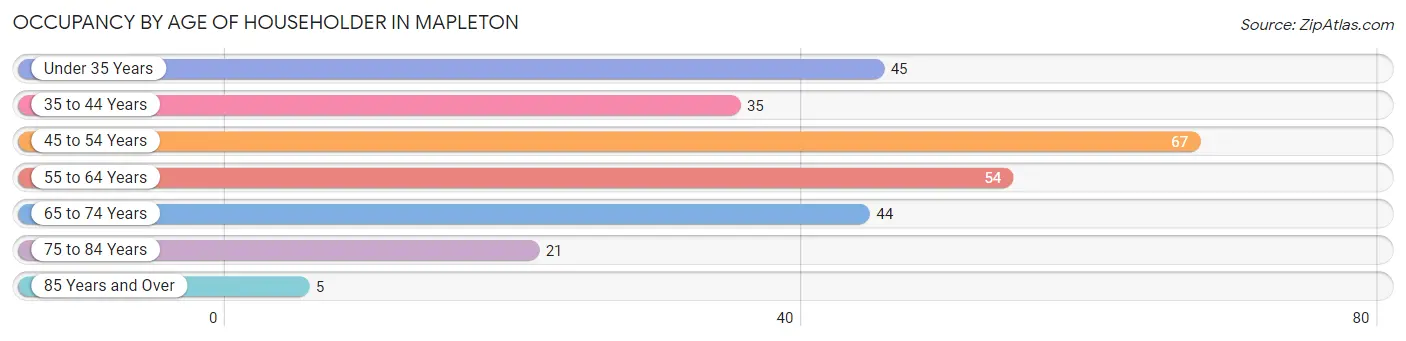
| Age Bracket | # Households | % Households |
| Under 35 Years | 45 | 16.6% |
| 35 to 44 Years | 35 | 12.9% |
| 45 to 54 Years | 67 | 24.7% |
| 55 to 64 Years | 54 | 19.9% |
| 65 to 74 Years | 44 | 16.2% |
| 75 to 84 Years | 21 | 7.7% |
| 85 Years and Over | 5 | 1.8% |
| Total | 271 | 100.0% |
Housing Finances in Mapleton
Median Income by Occupancy in Mapleton
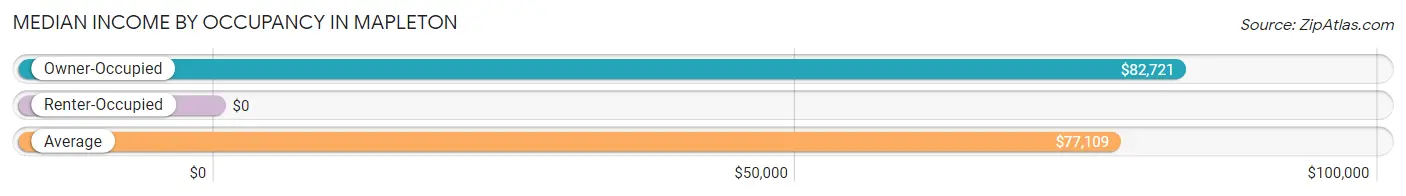
| Occupancy Type | # Households | Median Income |
| Owner-Occupied | 221 (81.6%) | $82,721 |
| Renter-Occupied | 50 (18.4%) | $0 |
| Average | 271 (100.0%) | $77,109 |
Occupancy by Householder Income Bracket in Mapleton
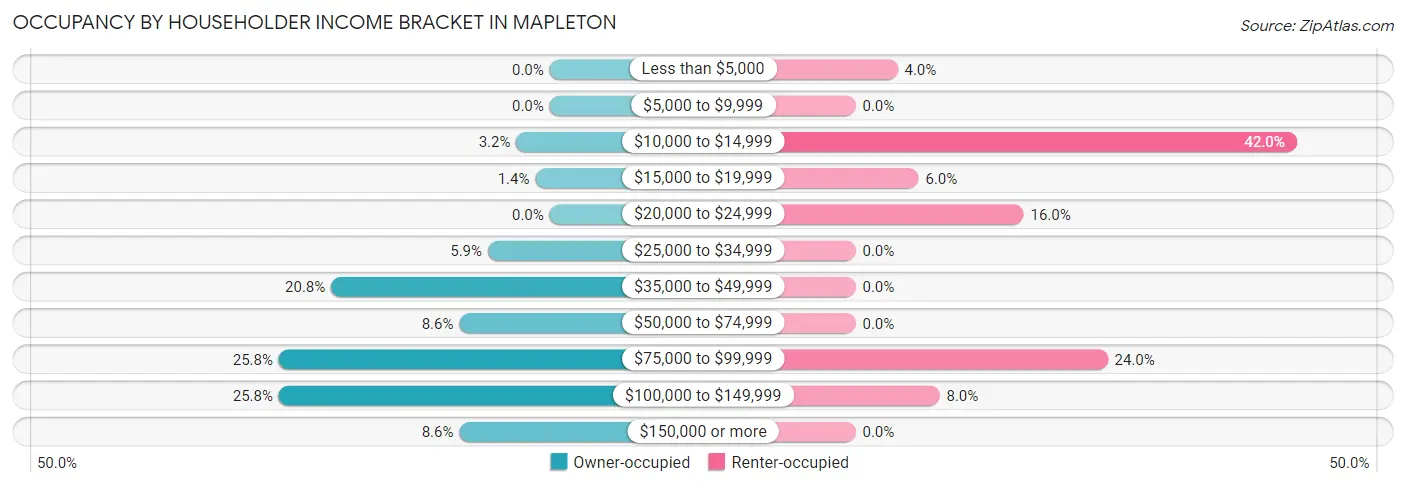
| Income Bracket | Owner-occupied | Renter-occupied |
| Less than $5,000 | 0 (0.0%) | 2 (4.0%) |
| $5,000 to $9,999 | 0 (0.0%) | 0 (0.0%) |
| $10,000 to $14,999 | 7 (3.2%) | 21 (42.0%) |
| $15,000 to $19,999 | 3 (1.4%) | 3 (6.0%) |
| $20,000 to $24,999 | 0 (0.0%) | 8 (16.0%) |
| $25,000 to $34,999 | 13 (5.9%) | 0 (0.0%) |
| $35,000 to $49,999 | 46 (20.8%) | 0 (0.0%) |
| $50,000 to $74,999 | 19 (8.6%) | 0 (0.0%) |
| $75,000 to $99,999 | 57 (25.8%) | 12 (24.0%) |
| $100,000 to $149,999 | 57 (25.8%) | 4 (8.0%) |
| $150,000 or more | 19 (8.6%) | 0 (0.0%) |
| Total | 221 (100.0%) | 50 (100.0%) |
Monthly Housing Cost Tiers in Mapleton

| Monthly Cost | Owner-occupied | Renter-occupied |
| Less than $300 | 3 (1.4%) | 0 (0.0%) |
| $300 to $499 | 21 (9.5%) | 30 (60.0%) |
| $500 to $799 | 70 (31.7%) | 0 (0.0%) |
| $800 to $999 | 16 (7.2%) | 12 (24.0%) |
| $1,000 to $1,499 | 84 (38.0%) | 0 (0.0%) |
| $1,500 to $1,999 | 24 (10.9%) | 0 (0.0%) |
| $2,000 to $2,499 | 3 (1.4%) | 0 (0.0%) |
| $2,500 to $2,999 | 0 (0.0%) | 0 (0.0%) |
| $3,000 or more | 0 (0.0%) | 0 (0.0%) |
| Total | 221 (100.0%) | 50 (100.0%) |
Physical Housing Characteristics in Mapleton
Housing Structures in Mapleton
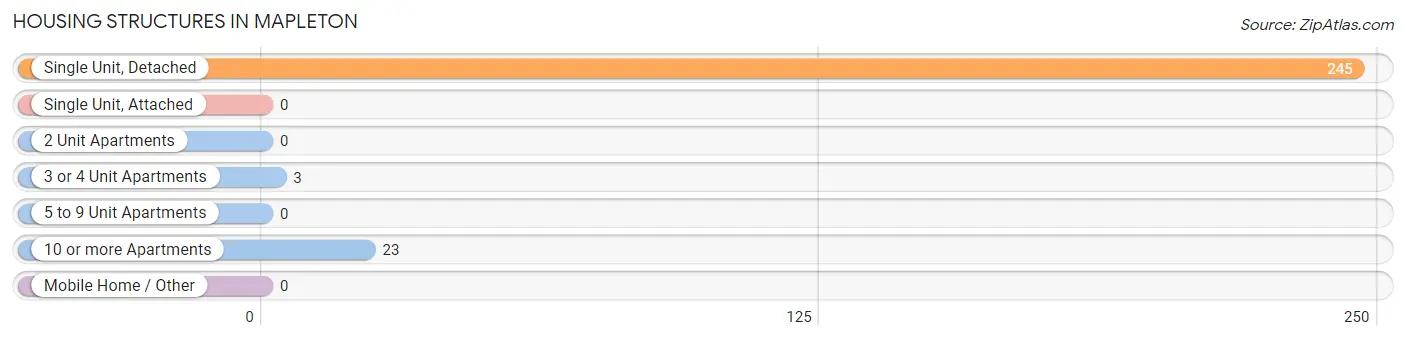
| Structure Type | # Housing Units | % Housing Units |
| Single Unit, Detached | 245 | 90.4% |
| Single Unit, Attached | 0 | 0.0% |
| 2 Unit Apartments | 0 | 0.0% |
| 3 or 4 Unit Apartments | 3 | 1.1% |
| 5 to 9 Unit Apartments | 0 | 0.0% |
| 10 or more Apartments | 23 | 8.5% |
| Mobile Home / Other | 0 | 0.0% |
| Total | 271 | 100.0% |
Housing Structures by Occupancy in Mapleton
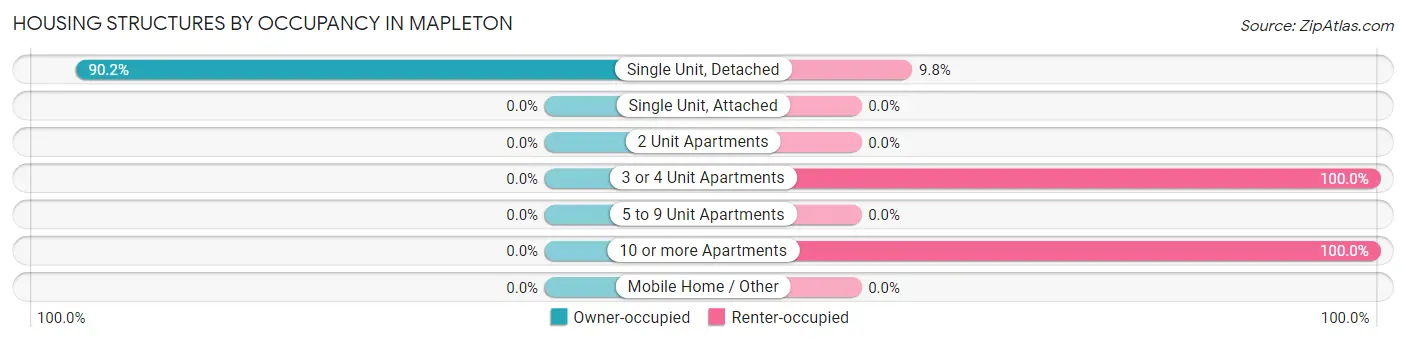
| Structure Type | Owner-occupied | Renter-occupied |
| Single Unit, Detached | 221 (90.2%) | 24 (9.8%) |
| Single Unit, Attached | 0 (0.0%) | 0 (0.0%) |
| 2 Unit Apartments | 0 (0.0%) | 0 (0.0%) |
| 3 or 4 Unit Apartments | 0 (0.0%) | 3 (100.0%) |
| 5 to 9 Unit Apartments | 0 (0.0%) | 0 (0.0%) |
| 10 or more Apartments | 0 (0.0%) | 23 (100.0%) |
| Mobile Home / Other | 0 (0.0%) | 0 (0.0%) |
| Total | 221 (81.6%) | 50 (18.4%) |
Housing Structures by Number of Rooms in Mapleton
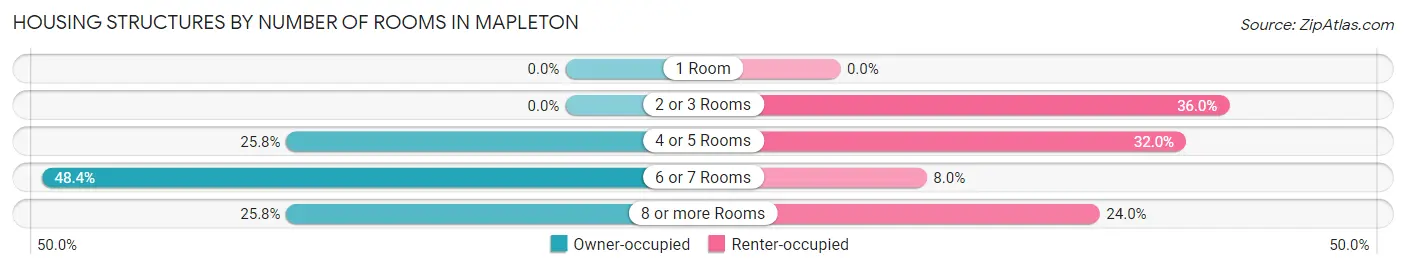
| Number of Rooms | Owner-occupied | Renter-occupied |
| 1 Room | 0 (0.0%) | 0 (0.0%) |
| 2 or 3 Rooms | 0 (0.0%) | 18 (36.0%) |
| 4 or 5 Rooms | 57 (25.8%) | 16 (32.0%) |
| 6 or 7 Rooms | 107 (48.4%) | 4 (8.0%) |
| 8 or more Rooms | 57 (25.8%) | 12 (24.0%) |
| Total | 221 (100.0%) | 50 (100.0%) |
Housing Structure by Heating Type in Mapleton
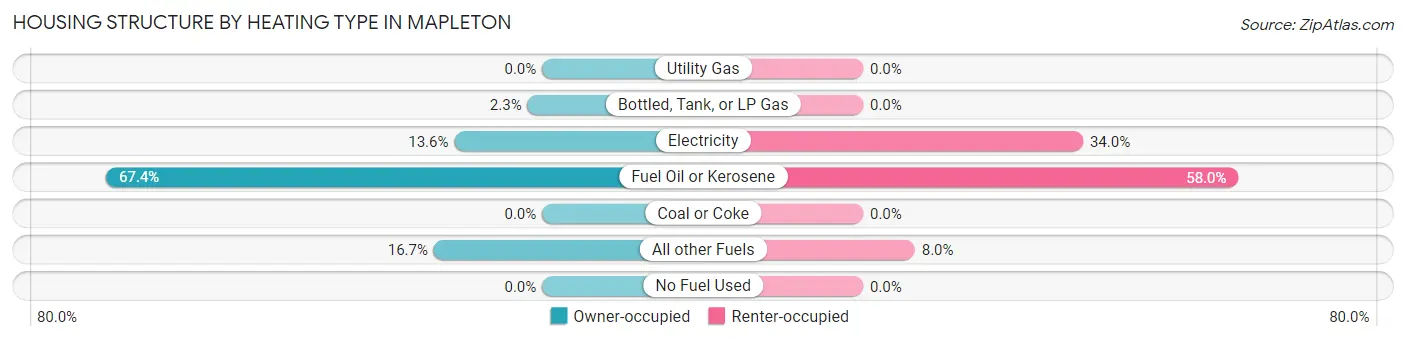
| Heating Type | Owner-occupied | Renter-occupied |
| Utility Gas | 0 (0.0%) | 0 (0.0%) |
| Bottled, Tank, or LP Gas | 5 (2.3%) | 0 (0.0%) |
| Electricity | 30 (13.6%) | 17 (34.0%) |
| Fuel Oil or Kerosene | 149 (67.4%) | 29 (58.0%) |
| Coal or Coke | 0 (0.0%) | 0 (0.0%) |
| All other Fuels | 37 (16.7%) | 4 (8.0%) |
| No Fuel Used | 0 (0.0%) | 0 (0.0%) |
| Total | 221 (100.0%) | 50 (100.0%) |
Household Vehicle Usage in Mapleton
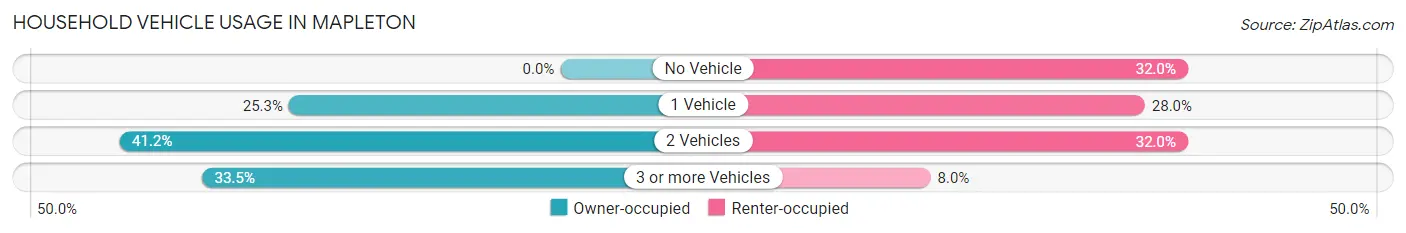
| Vehicles per Household | Owner-occupied | Renter-occupied |
| No Vehicle | 0 (0.0%) | 16 (32.0%) |
| 1 Vehicle | 56 (25.3%) | 14 (28.0%) |
| 2 Vehicles | 91 (41.2%) | 16 (32.0%) |
| 3 or more Vehicles | 74 (33.5%) | 4 (8.0%) |
| Total | 221 (100.0%) | 50 (100.0%) |
Real Estate & Mortgages in Mapleton
Real Estate and Mortgage Overview in Mapleton
| Characteristic | Without Mortgage | With Mortgage |
| Housing Units | 50 | 171 |
| Median Property Value | $213,600 | $119,900 |
| Median Household Income | - | - |
| Monthly Housing Costs | $505 | $0 |
| Real Estate Taxes | $2,273 | $0 |
Property Value by Mortgage Status in Mapleton
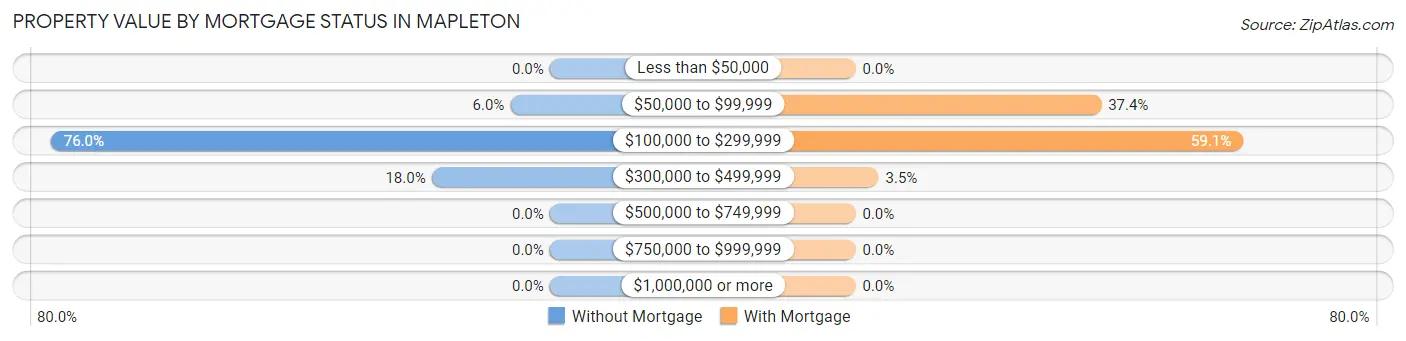
| Property Value | Without Mortgage | With Mortgage |
| Less than $50,000 | 0 (0.0%) | 0 (0.0%) |
| $50,000 to $99,999 | 3 (6.0%) | 64 (37.4%) |
| $100,000 to $299,999 | 38 (76.0%) | 101 (59.1%) |
| $300,000 to $499,999 | 9 (18.0%) | 6 (3.5%) |
| $500,000 to $749,999 | 0 (0.0%) | 0 (0.0%) |
| $750,000 to $999,999 | 0 (0.0%) | 0 (0.0%) |
| $1,000,000 or more | 0 (0.0%) | 0 (0.0%) |
| Total | 50 (100.0%) | 171 (100.0%) |
Household Income by Mortgage Status in Mapleton
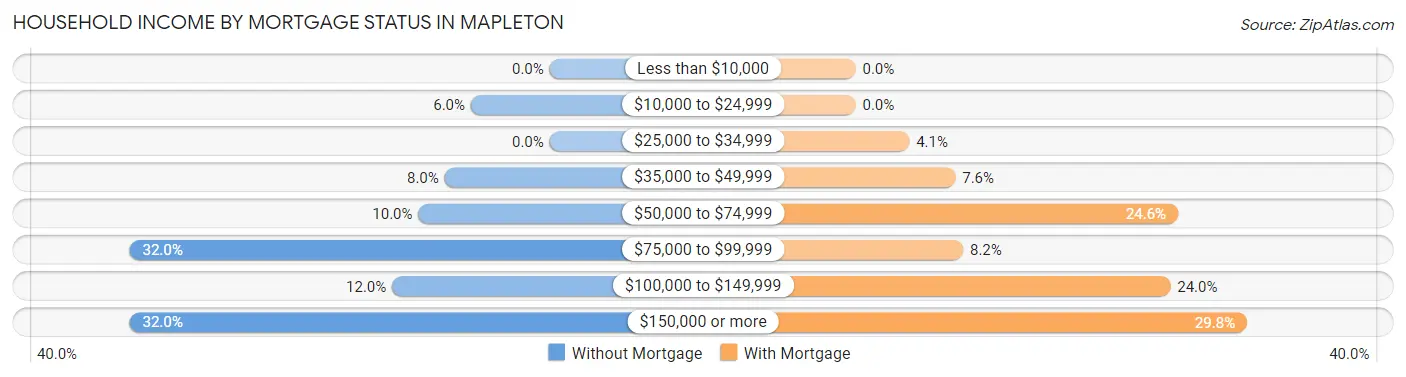
| Household Income | Without Mortgage | With Mortgage |
| Less than $10,000 | 0 (0.0%) | 0 (0.0%) |
| $10,000 to $24,999 | 3 (6.0%) | 0 (0.0%) |
| $25,000 to $34,999 | 0 (0.0%) | 7 (4.1%) |
| $35,000 to $49,999 | 4 (8.0%) | 13 (7.6%) |
| $50,000 to $74,999 | 5 (10.0%) | 42 (24.6%) |
| $75,000 to $99,999 | 16 (32.0%) | 14 (8.2%) |
| $100,000 to $149,999 | 6 (12.0%) | 41 (24.0%) |
| $150,000 or more | 16 (32.0%) | 51 (29.8%) |
| Total | 50 (100.0%) | 171 (100.0%) |
Property Value to Household Income Ratio in Mapleton
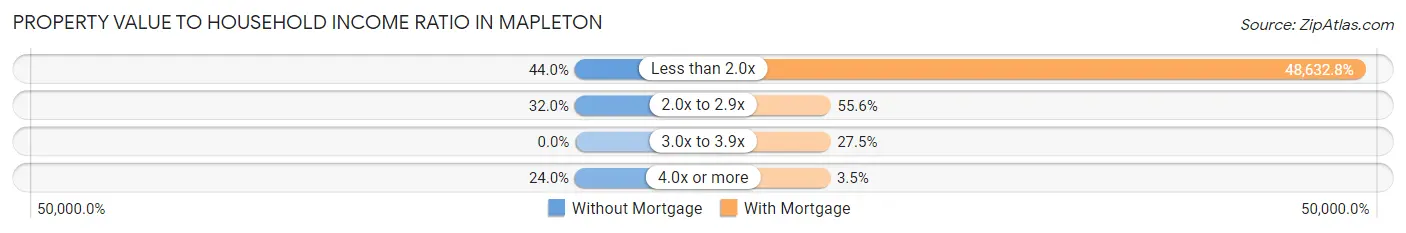
| Value-to-Income Ratio | Without Mortgage | With Mortgage |
| Less than 2.0x | 22 (44.0%) | 83,162 (48,632.7%) |
| 2.0x to 2.9x | 16 (32.0%) | 95 (55.6%) |
| 3.0x to 3.9x | 0 (0.0%) | 47 (27.5%) |
| 4.0x or more | 12 (24.0%) | 6 (3.5%) |
| Total | 50 (100.0%) | 171 (100.0%) |
Real Estate Taxes by Mortgage Status in Mapleton
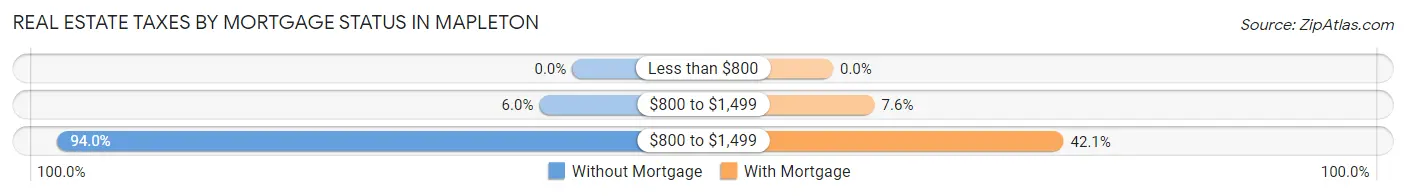
| Property Taxes | Without Mortgage | With Mortgage |
| Less than $800 | 0 (0.0%) | 0 (0.0%) |
| $800 to $1,499 | 3 (6.0%) | 13 (7.6%) |
| $800 to $1,499 | 47 (94.0%) | 72 (42.1%) |
| Total | 50 (100.0%) | 171 (100.0%) |
Health & Disability in Mapleton
Health Insurance Coverage by Age in Mapleton
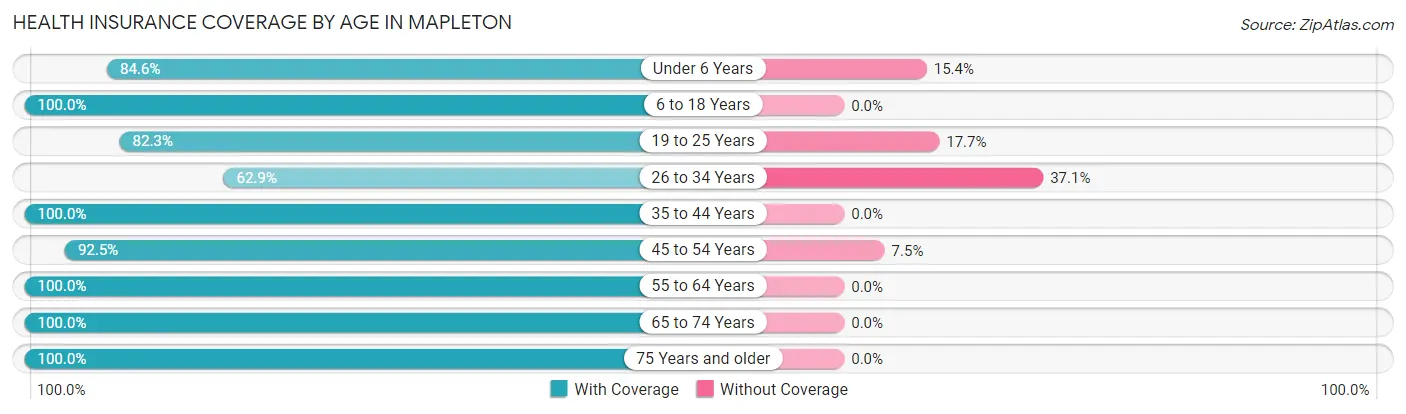
| Age Bracket | With Coverage | Without Coverage |
| Under 6 Years | 66 (84.6%) | 12 (15.4%) |
| 6 to 18 Years | 76 (100.0%) | 0 (0.0%) |
| 19 to 25 Years | 65 (82.3%) | 14 (17.7%) |
| 26 to 34 Years | 39 (62.9%) | 23 (37.1%) |
| 35 to 44 Years | 62 (100.0%) | 0 (0.0%) |
| 45 to 54 Years | 86 (92.5%) | 7 (7.5%) |
| 55 to 64 Years | 113 (100.0%) | 0 (0.0%) |
| 65 to 74 Years | 82 (100.0%) | 0 (0.0%) |
| 75 Years and older | 26 (100.0%) | 0 (0.0%) |
| Total | 615 (91.6%) | 56 (8.4%) |
Health Insurance Coverage by Citizenship Status in Mapleton
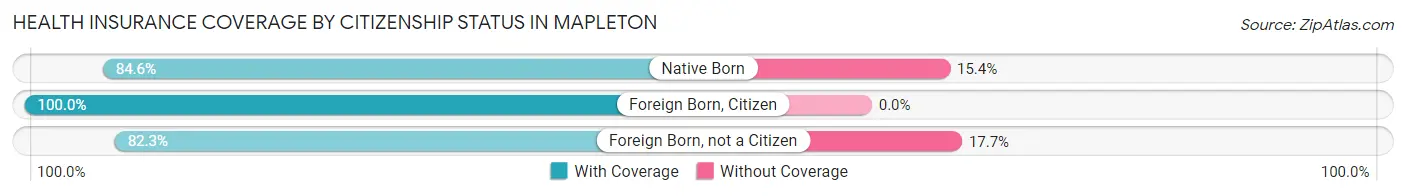
| Citizenship Status | With Coverage | Without Coverage |
| Native Born | 66 (84.6%) | 12 (15.4%) |
| Foreign Born, Citizen | 76 (100.0%) | 0 (0.0%) |
| Foreign Born, not a Citizen | 65 (82.3%) | 14 (17.7%) |
Health Insurance Coverage by Household Income in Mapleton
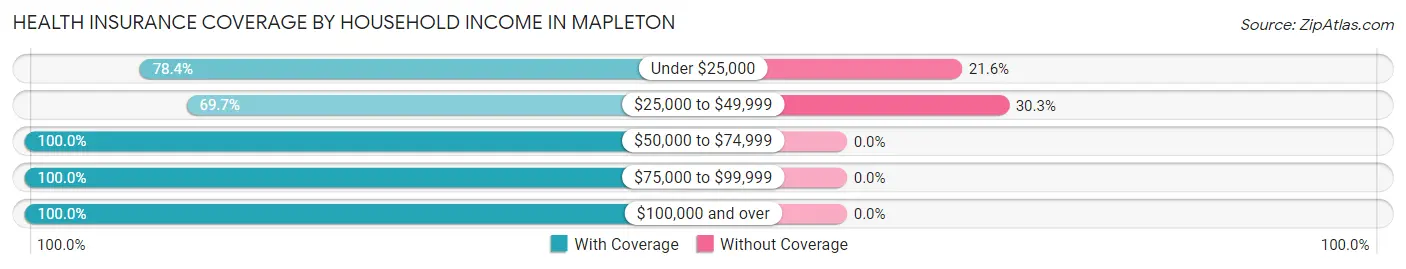
| Household Income | With Coverage | Without Coverage |
| Under $25,000 | 40 (78.4%) | 11 (21.6%) |
| $25,000 to $49,999 | 101 (69.7%) | 44 (30.3%) |
| $50,000 to $74,999 | 32 (100.0%) | 0 (0.0%) |
| $75,000 to $99,999 | 213 (100.0%) | 0 (0.0%) |
| $100,000 and over | 227 (100.0%) | 0 (0.0%) |
Public vs Private Health Insurance Coverage by Age in Mapleton
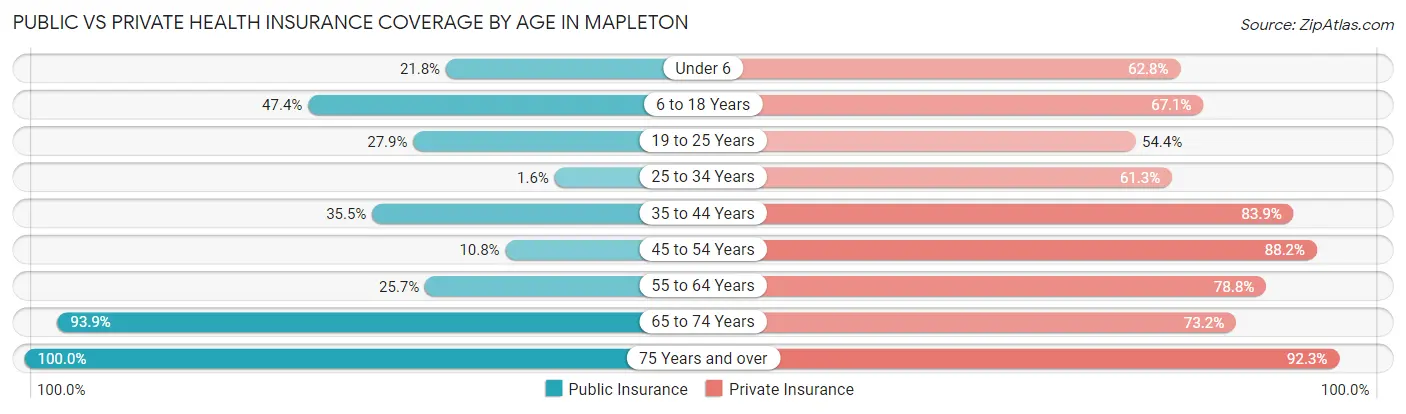
| Age Bracket | Public Insurance | Private Insurance |
| Under 6 | 17 (21.8%) | 49 (62.8%) |
| 6 to 18 Years | 36 (47.4%) | 51 (67.1%) |
| 19 to 25 Years | 22 (27.9%) | 43 (54.4%) |
| 25 to 34 Years | 1 (1.6%) | 38 (61.3%) |
| 35 to 44 Years | 22 (35.5%) | 52 (83.9%) |
| 45 to 54 Years | 10 (10.7%) | 82 (88.2%) |
| 55 to 64 Years | 29 (25.7%) | 89 (78.8%) |
| 65 to 74 Years | 77 (93.9%) | 60 (73.2%) |
| 75 Years and over | 26 (100.0%) | 24 (92.3%) |
| Total | 240 (35.8%) | 488 (72.7%) |
Disability Status by Sex by Age in Mapleton
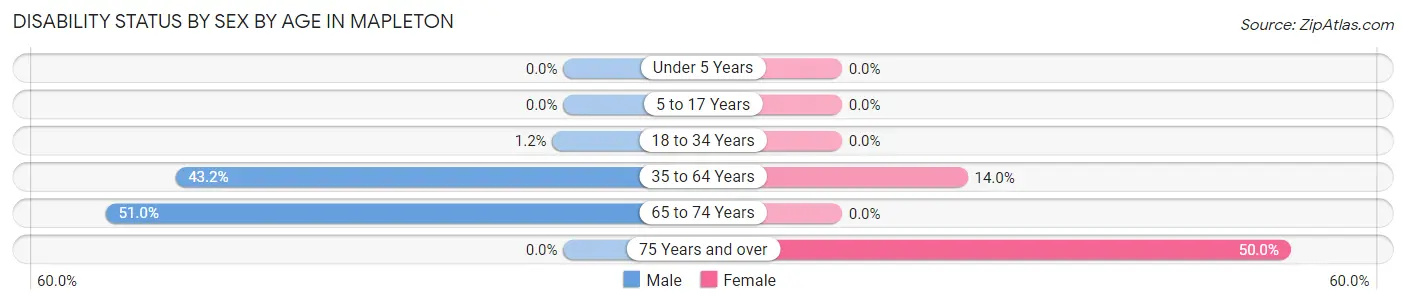
| Age Bracket | Male | Female |
| Under 5 Years | 0 (0.0%) | 0 (0.0%) |
| 5 to 17 Years | 0 (0.0%) | 0 (0.0%) |
| 18 to 34 Years | 1 (1.2%) | 0 (0.0%) |
| 35 to 64 Years | 51 (43.2%) | 21 (14.0%) |
| 65 to 74 Years | 26 (51.0%) | 0 (0.0%) |
| 75 Years and over | 0 (0.0%) | 5 (50.0%) |
Disability Class by Sex by Age in Mapleton
Disability Class: Hearing Difficulty
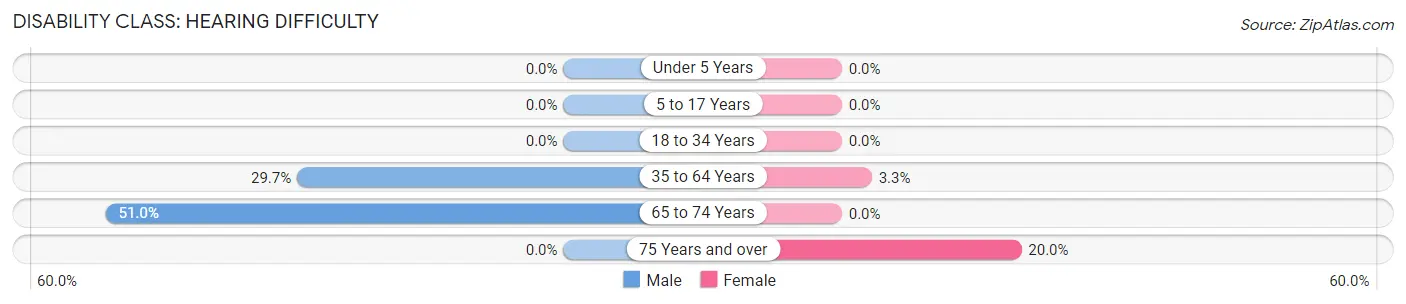
| Age Bracket | Male | Female |
| Under 5 Years | 0 (0.0%) | 0 (0.0%) |
| 5 to 17 Years | 0 (0.0%) | 0 (0.0%) |
| 18 to 34 Years | 0 (0.0%) | 0 (0.0%) |
| 35 to 64 Years | 35 (29.7%) | 5 (3.3%) |
| 65 to 74 Years | 26 (51.0%) | 0 (0.0%) |
| 75 Years and over | 0 (0.0%) | 2 (20.0%) |
Disability Class: Vision Difficulty
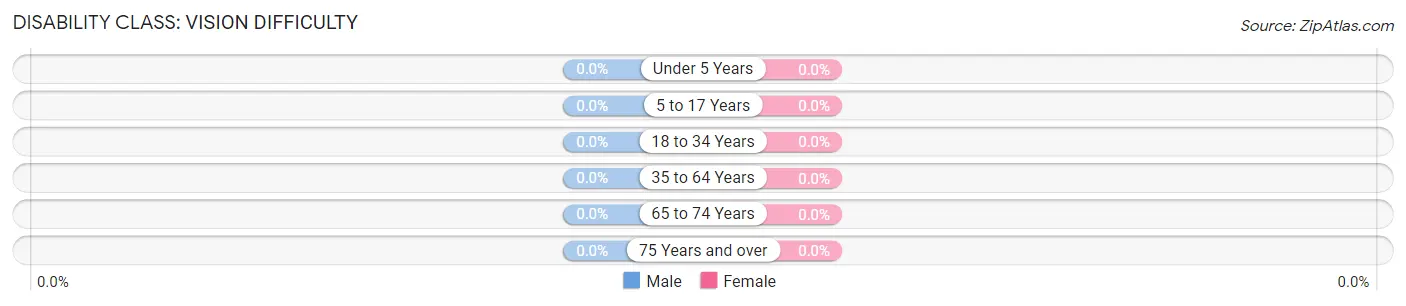
| Age Bracket | Male | Female |
| Under 5 Years | 0 (0.0%) | 0 (0.0%) |
| 5 to 17 Years | 0 (0.0%) | 0 (0.0%) |
| 18 to 34 Years | 0 (0.0%) | 0 (0.0%) |
| 35 to 64 Years | 0 (0.0%) | 0 (0.0%) |
| 65 to 74 Years | 0 (0.0%) | 0 (0.0%) |
| 75 Years and over | 0 (0.0%) | 0 (0.0%) |
Disability Class: Cognitive Difficulty
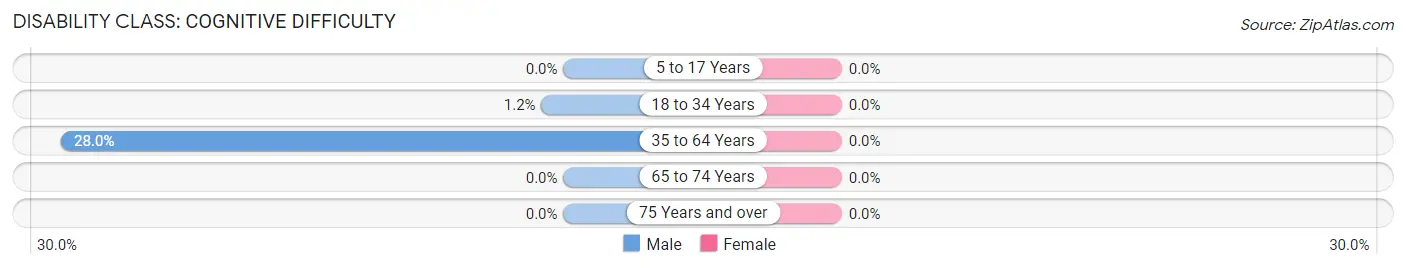
| Age Bracket | Male | Female |
| 5 to 17 Years | 0 (0.0%) | 0 (0.0%) |
| 18 to 34 Years | 1 (1.2%) | 0 (0.0%) |
| 35 to 64 Years | 33 (28.0%) | 0 (0.0%) |
| 65 to 74 Years | 0 (0.0%) | 0 (0.0%) |
| 75 Years and over | 0 (0.0%) | 0 (0.0%) |
Disability Class: Ambulatory Difficulty
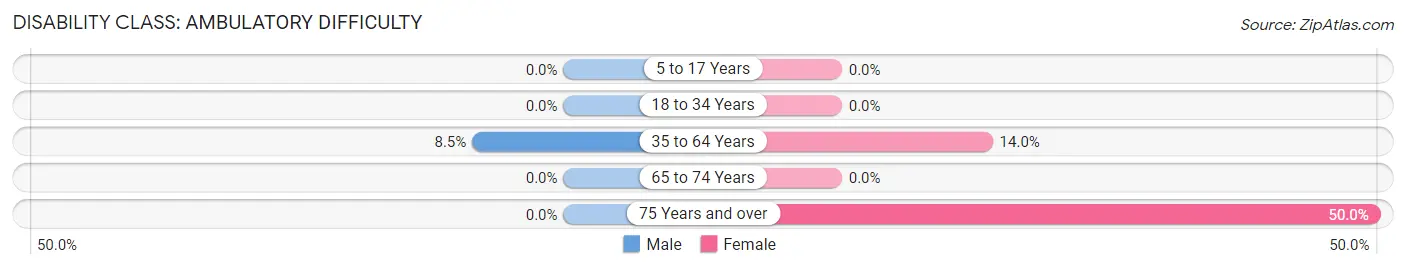
| Age Bracket | Male | Female |
| 5 to 17 Years | 0 (0.0%) | 0 (0.0%) |
| 18 to 34 Years | 0 (0.0%) | 0 (0.0%) |
| 35 to 64 Years | 10 (8.5%) | 21 (14.0%) |
| 65 to 74 Years | 0 (0.0%) | 0 (0.0%) |
| 75 Years and over | 0 (0.0%) | 5 (50.0%) |
Disability Class: Self-Care Difficulty
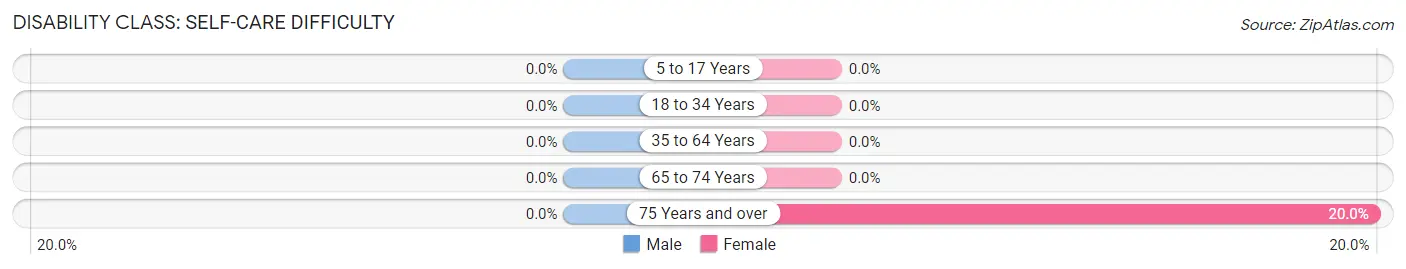
| Age Bracket | Male | Female |
| 5 to 17 Years | 0 (0.0%) | 0 (0.0%) |
| 18 to 34 Years | 0 (0.0%) | 0 (0.0%) |
| 35 to 64 Years | 0 (0.0%) | 0 (0.0%) |
| 65 to 74 Years | 0 (0.0%) | 0 (0.0%) |
| 75 Years and over | 0 (0.0%) | 2 (20.0%) |
Technology Access in Mapleton
Computing Device Access in Mapleton
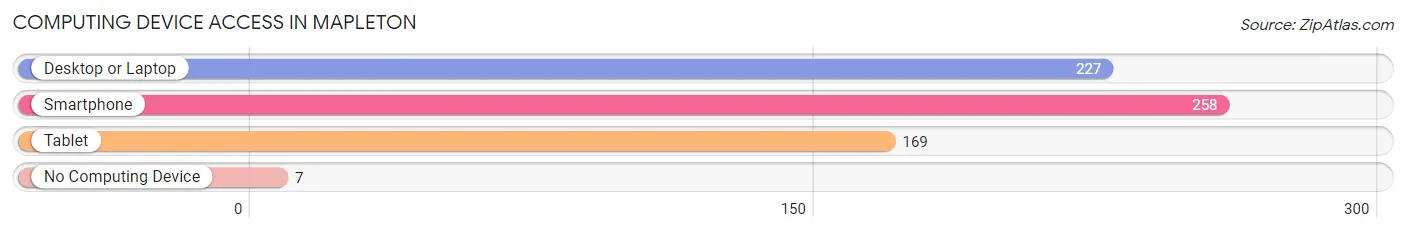
| Device Type | # Households | % Households |
| Desktop or Laptop | 227 | 83.8% |
| Smartphone | 258 | 95.2% |
| Tablet | 169 | 62.4% |
| No Computing Device | 7 | 2.6% |
| Total | 271 | 100.0% |
Internet Access in Mapleton
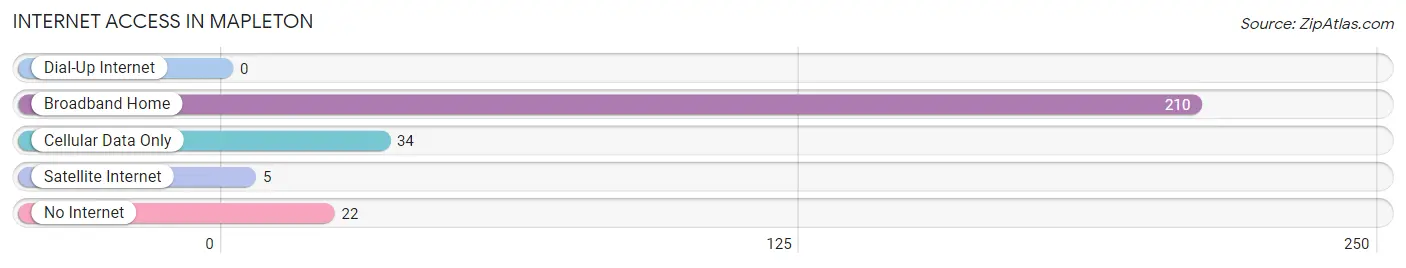
| Internet Type | # Households | % Households |
| Dial-Up Internet | 0 | 0.0% |
| Broadband Home | 210 | 77.5% |
| Cellular Data Only | 34 | 12.6% |
| Satellite Internet | 5 | 1.8% |
| No Internet | 22 | 8.1% |
| Total | 271 | 100.0% |
Mapleton Summary
Mapleton is a town located in Aroostook County, Maine, United States. The population was 1,845 at the 2010 census. It is part of the Presque Isle, Maine Micropolitan Statistical Area.
History
Mapleton was first settled in 1820 by a group of settlers from New Hampshire. The town was incorporated in 1836 and named after the nearby Mapleton Stream. The town was originally a farming community, but in the late 19th century, the lumber industry began to take hold. The town was home to several sawmills and a gristmill.
Geography
Mapleton is located in the northern part of Aroostook County, in the state of Maine. It is bordered by the towns of Presque Isle to the north, Easton to the east, and Bridgewater to the south. The town is situated on the Mapleton Stream, which flows through the town and empties into the Aroostook River. The town is located in a rural area, with the nearest city being Presque Isle, which is about 10 miles away.
The town has a total area of 35.2 square miles, of which 34.9 square miles is land and 0.3 square miles is water. The terrain is mostly flat, with some rolling hills. The highest point in the town is located at an elevation of 1,068 feet.
Economy
The economy of Mapleton is largely based on agriculture and forestry. The town is home to several farms, which produce a variety of crops, including potatoes, hay, and corn. The town is also home to several sawmills and a gristmill.
Demographics
As of the 2010 census, there were 1,845 people, 745 households, and 517 families residing in the town. The population density was 52.7 people per square mile. The racial makeup of the town was 97.2% White, 0.3% African American, 0.2% Native American, 0.4% Asian, 0.1% from other races, and 1.8% from two or more races. Hispanic or Latino of any race were 0.7% of the population.
The median income for a household in the town was $35,000, and the median income for a family was $41,250. Males had a median income of $30,000 versus $21,250 for females. The per capita income for the town was $17,845. About 10.2% of families and 13.2% of the population were below the poverty line, including 16.2% of those under age 18 and 8.2% of those age 65 or over.
Common Questions
What is Per Capita Income in Mapleton?
Per Capita income in Mapleton is $31,461.
What is the Median Family Income in Mapleton?
Median Family Income in Mapleton is $97,188.
What is the Median Household income in Mapleton?
Median Household Income in Mapleton is $77,109.
What is Income or Wage Gap in Mapleton?
Income or Wage Gap in Mapleton is 13.9%.
Women in Mapleton earn 86.1 cents for every dollar earned by a man.
What is Inequality or Gini Index in Mapleton?
Inequality or Gini Index in Mapleton is 0.34.
What is the Total Population of Mapleton?
Total Population of Mapleton is 671.
What is the Total Male Population of Mapleton?
Total Male Population of Mapleton is 341.
What is the Total Female Population of Mapleton?
Total Female Population of Mapleton is 330.
What is the Ratio of Males per 100 Females in Mapleton?
There are 103.33 Males per 100 Females in Mapleton.
What is the Ratio of Females per 100 Males in Mapleton?
There are 96.77 Females per 100 Males in Mapleton.
What is the Median Population Age in Mapleton?
Median Population Age in Mapleton is 42.3 Years.
What is the Average Family Size in Mapleton
Average Family Size in Mapleton is 2.8 People.
What is the Average Household Size in Mapleton
Average Household Size in Mapleton is 2.5 People.
How Large is the Labor Force in Mapleton?
There are 406 People in the Labor Forcein in Mapleton.
What is the Percentage of People in the Labor Force in Mapleton?
73.7% of People are in the Labor Force in Mapleton.
What is the Unemployment Rate in Mapleton?
Unemployment Rate in Mapleton is 7.9%.