Millinocket, ME Map & Demographics
Millinocket Map
Millinocket Overview
$29,872
PER CAPITA INCOME
$59,517
AVG FAMILY INCOME
$45,345
AVG HOUSEHOLD INCOME
0.44
INEQUALITY / GINI INDEX
4,136
TOTAL POPULATION
1,957
MALE POPULATION
2,179
FEMALE POPULATION
89.81
MALES / 100 FEMALES
111.34
FEMALES / 100 MALES
57.5
MEDIAN AGE
2.4
AVG FAMILY SIZE
1.8
AVG HOUSEHOLD SIZE
1,562
LABOR FORCE [ PEOPLE ]
43.8%
PERCENT IN LABOR FORCE
8.9%
UNEMPLOYMENT RATE
Millinocket Zip Codes
Millinocket Area Codes
Income in Millinocket
Income Overview in Millinocket
Per Capita Income in Millinocket is $29,872, while median incomes of families and households are $59,517 and $45,345 respectively.
| Characteristic | Number | Measure |
| Per Capita Income | 4,136 | $29,872 |
| Median Family Income | 1,279 | $59,517 |
| Mean Family Income | 1,279 | $72,528 |
| Median Household Income | 2,247 | $45,345 |
| Mean Household Income | 2,247 | $54,300 |
| Income Deficit | 1,279 | $0 |
| Wage / Income Gap (%) | 4,136 | 0.00% |
| Wage / Income Gap ($) | 4,136 | 100.00¢ per $1 |
| Gini / Inequality Index | 4,136 | 0.44 |
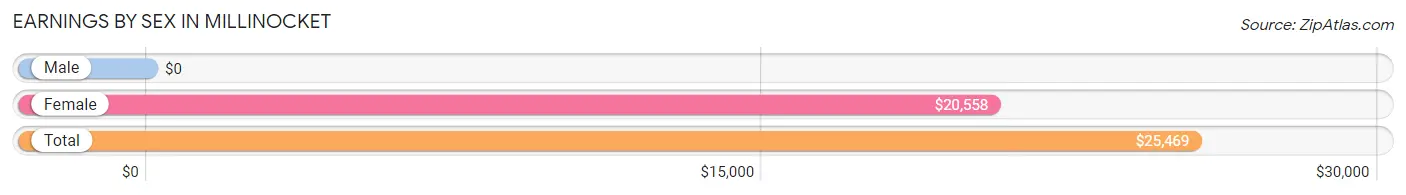
Earnings by Sex in Millinocket
| Sex | Number | Average Earnings |
| Male | 968 (51.0%) | $0 |
| Female | 931 (49.0%) | $20,558 |
| Total | 1,899 (100.0%) | $25,469 |
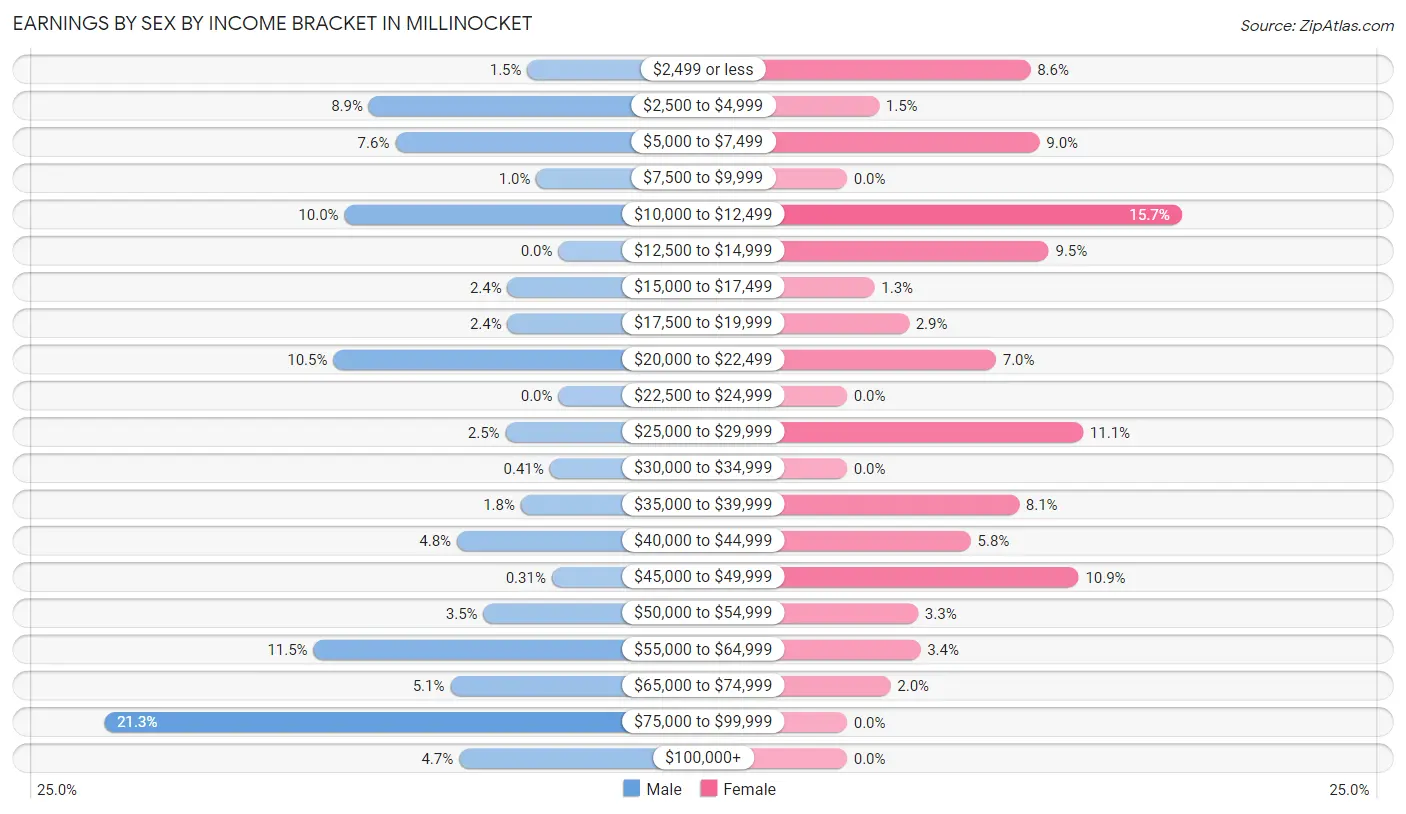
Earnings by Sex by Income Bracket in Millinocket
The most common earnings brackets in Millinocket are $75,000 to $99,999 for men (206 | 21.3%) and $10,000 to $12,499 for women (146 | 15.7%).
| Income | Male | Female |
| $2,499 or less | 14 (1.5%) | 80 (8.6%) |
| $2,500 to $4,999 | 86 (8.9%) | 14 (1.5%) |
| $5,000 to $7,499 | 74 (7.6%) | 84 (9.0%) |
| $7,500 to $9,999 | 10 (1.0%) | 0 (0.0%) |
| $10,000 to $12,499 | 97 (10.0%) | 146 (15.7%) |
| $12,500 to $14,999 | 0 (0.0%) | 88 (9.5%) |
| $15,000 to $17,499 | 23 (2.4%) | 12 (1.3%) |
| $17,500 to $19,999 | 23 (2.4%) | 27 (2.9%) |
| $20,000 to $22,499 | 102 (10.5%) | 65 (7.0%) |
| $22,500 to $24,999 | 0 (0.0%) | 0 (0.0%) |
| $25,000 to $29,999 | 24 (2.5%) | 103 (11.1%) |
| $30,000 to $34,999 | 4 (0.4%) | 0 (0.0%) |
| $35,000 to $39,999 | 17 (1.8%) | 75 (8.1%) |
| $40,000 to $44,999 | 46 (4.8%) | 54 (5.8%) |
| $45,000 to $49,999 | 3 (0.3%) | 101 (10.8%) |
| $50,000 to $54,999 | 34 (3.5%) | 31 (3.3%) |
| $55,000 to $64,999 | 111 (11.5%) | 32 (3.4%) |
| $65,000 to $74,999 | 49 (5.1%) | 19 (2.0%) |
| $75,000 to $99,999 | 206 (21.3%) | 0 (0.0%) |
| $100,000+ | 45 (4.6%) | 0 (0.0%) |
| Total | 968 (100.0%) | 931 (100.0%) |
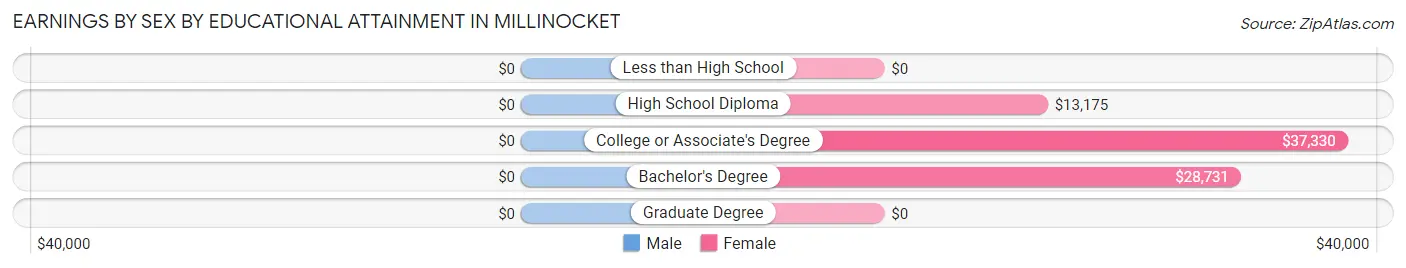
Earnings by Sex by Educational Attainment in Millinocket
| Educational Attainment | Male Income | Female Income |
| Less than High School | - | - |
| High School Diploma | - | - |
| College or Associate's Degree | - | - |
| Bachelor's Degree | - | - |
| Graduate Degree | - | - |
| Total | $44,864 | $20,827 |
Family Income in Millinocket
Family Income Brackets in Millinocket
According to the Millinocket family income data, there are 388 families falling into the $50,000 to $74,999 income range, which is the most common income bracket and makes up 30.3% of all families. Conversely, the $150,000 to $199,999 income bracket is the least frequent group with only 10 families (0.8%) belonging to this category.
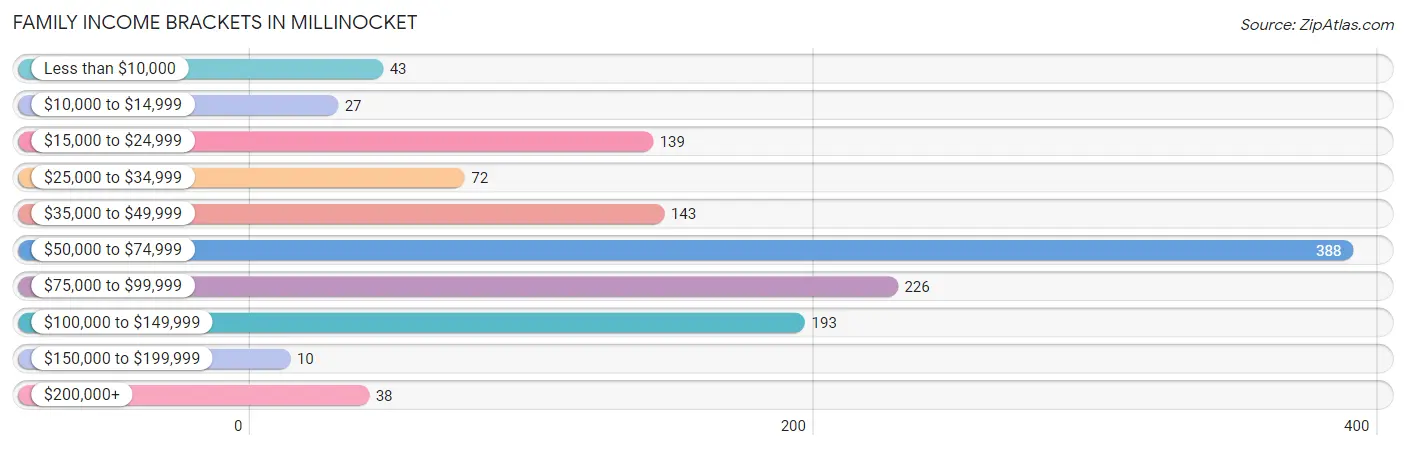
| Income Bracket | # Families | % Families |
| Less than $10,000 | 43 | 3.4% |
| $10,000 to $14,999 | 27 | 2.1% |
| $15,000 to $24,999 | 139 | 10.9% |
| $25,000 to $34,999 | 72 | 5.6% |
| $35,000 to $49,999 | 143 | 11.2% |
| $50,000 to $74,999 | 388 | 30.3% |
| $75,000 to $99,999 | 226 | 17.7% |
| $100,000 to $149,999 | 193 | 15.1% |
| $150,000 to $199,999 | 10 | 0.8% |
| $200,000+ | 38 | 3.0% |
Family Income by Famaliy Size in Millinocket
4-person families (174 | 13.6%) account for the highest median family income in Millinocket with $91,510 per family, while 2-person families (868 | 67.9%) have the highest median income of $29,634 per family member.
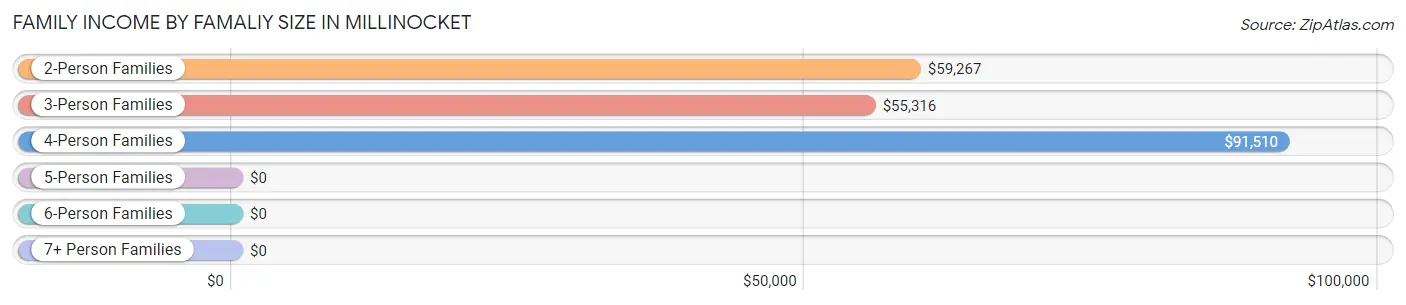
| Income Bracket | # Families | Median Income |
| 2-Person Families | 868 (67.9%) | $59,267 |
| 3-Person Families | 237 (18.5%) | $55,316 |
| 4-Person Families | 174 (13.6%) | $91,510 |
| 5-Person Families | 0 (0.0%) | $0 |
| 6-Person Families | 0 (0.0%) | $0 |
| 7+ Person Families | 0 (0.0%) | $0 |
| Total | 1,279 (100.0%) | $59,517 |
Family Income by Number of Earners in Millinocket
The median family income in Millinocket is $59,517, with families comprising 3+ earners (43) having the highest median family income of $250,001, while families with no earners (319) have the lowest median family income of $50,417, accounting for 3.4% and 24.9% of families, respectively.
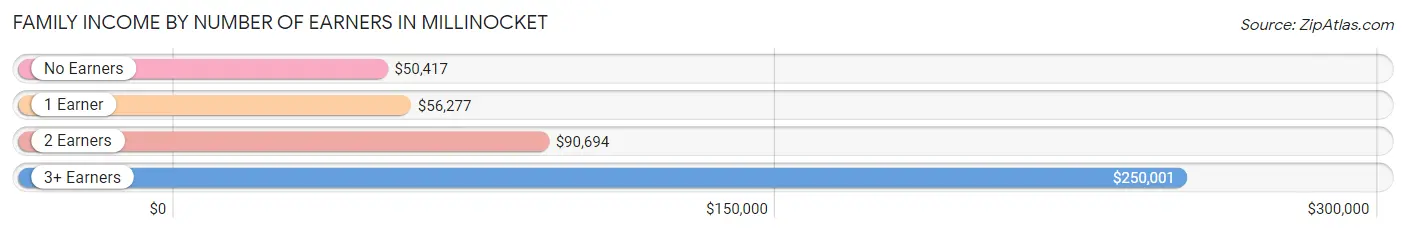
| Number of Earners | # Families | Median Income |
| No Earners | 319 (24.9%) | $50,417 |
| 1 Earner | 453 (35.4%) | $56,277 |
| 2 Earners | 464 (36.3%) | $90,694 |
| 3+ Earners | 43 (3.4%) | $250,001 |
| Total | 1,279 (100.0%) | $59,517 |
Household Income in Millinocket
Household Income Brackets in Millinocket
With 454 households falling in the category, the $50,000 to $74,999 income range is the most frequent in Millinocket, accounting for 20.2% of all households. In contrast, only 27 households (1.2%) fall into the $150,000 to $199,999 income bracket, making it the least populous group.
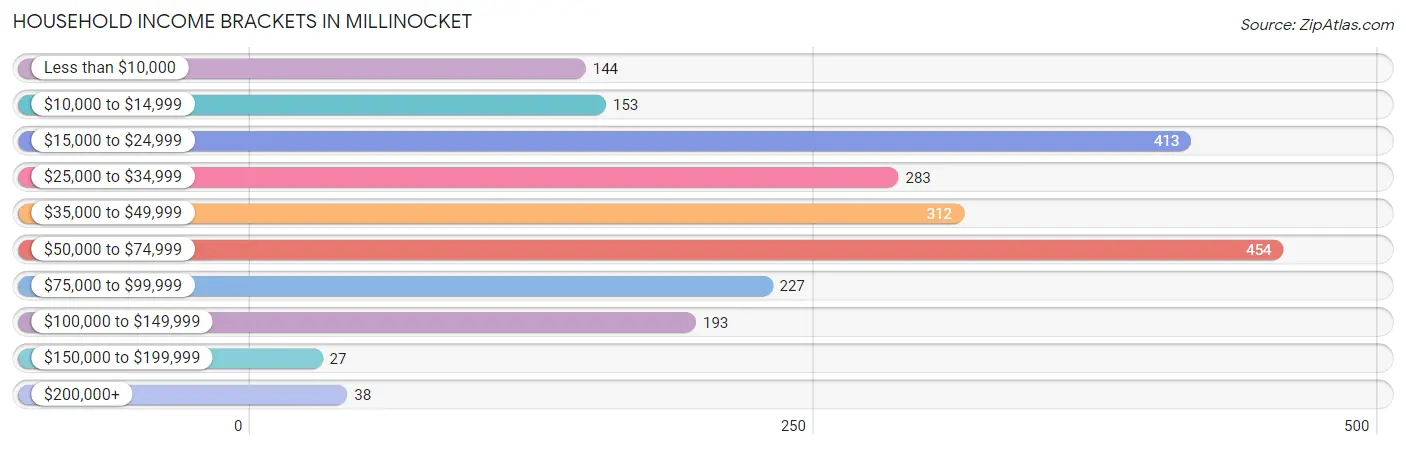
| Income Bracket | # Households | % Households |
| Less than $10,000 | 144 | 6.4% |
| $10,000 to $14,999 | 153 | 6.8% |
| $15,000 to $24,999 | 413 | 18.4% |
| $25,000 to $34,999 | 283 | 12.6% |
| $35,000 to $49,999 | 312 | 13.9% |
| $50,000 to $74,999 | 454 | 20.2% |
| $75,000 to $99,999 | 227 | 10.1% |
| $100,000 to $149,999 | 193 | 8.6% |
| $150,000 to $199,999 | 27 | 1.2% |
| $200,000+ | 38 | 1.7% |
Household Income by Householder Age in Millinocket
The median household income in Millinocket is $45,345, with the highest median household income of $55,673 found in the 25 to 44 years age bracket for the primary householder. A total of 521 households (23.2%) fall into this category. Meanwhile, the 15 to 24 years age bracket for the primary householder has the lowest median household income of $0, with 17 households (0.8%) in this group.
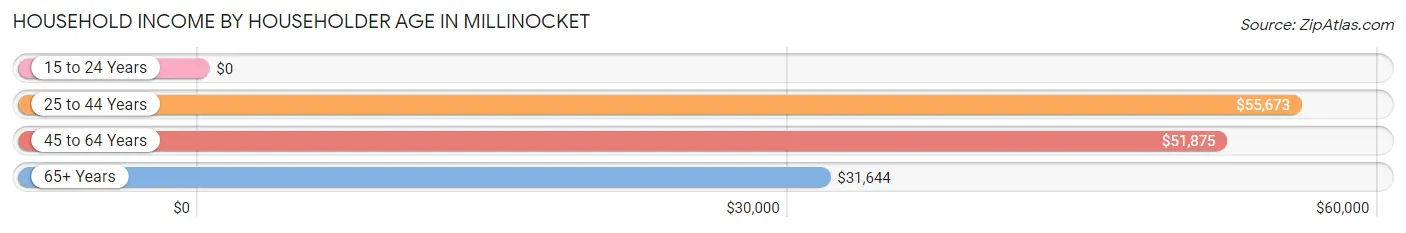
| Income Bracket | # Households | Median Income |
| 15 to 24 Years | 17 (0.8%) | $0 |
| 25 to 44 Years | 521 (23.2%) | $55,673 |
| 45 to 64 Years | 589 (26.2%) | $51,875 |
| 65+ Years | 1,120 (49.8%) | $31,644 |
| Total | 2,247 (100.0%) | $45,345 |
Poverty in Millinocket
Income Below Poverty by Sex and Age in Millinocket
With 10.1% poverty level for males and 21.0% for females among the residents of Millinocket, 18 to 24 year old males and under 5 year old females are the most vulnerable to poverty, with 97 males (60.6%) and 27 females (100.0%) in their respective age groups living below the poverty level.
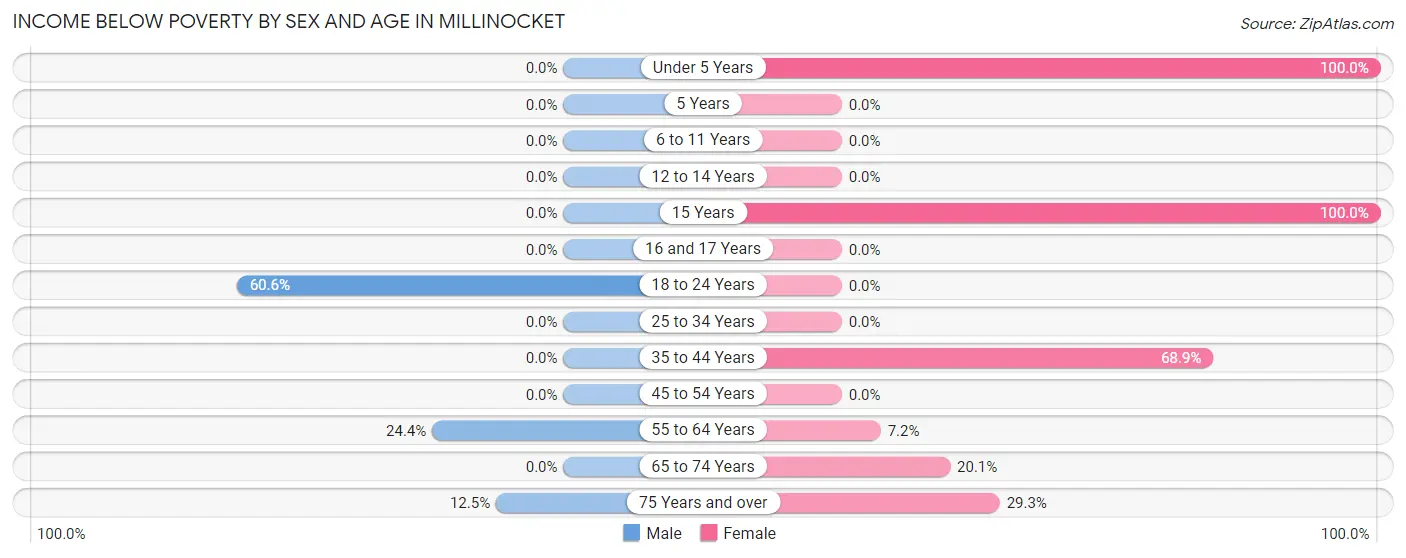
| Age Bracket | Male | Female |
| Under 5 Years | 0 (0.0%) | 27 (100.0%) |
| 5 Years | 0 (0.0%) | 0 (0.0%) |
| 6 to 11 Years | 0 (0.0%) | 0 (0.0%) |
| 12 to 14 Years | 0 (0.0%) | 0 (0.0%) |
| 15 Years | 0 (0.0%) | 73 (100.0%) |
| 16 and 17 Years | 0 (0.0%) | 0 (0.0%) |
| 18 to 24 Years | 97 (60.6%) | 0 (0.0%) |
| 25 to 34 Years | 0 (0.0%) | 0 (0.0%) |
| 35 to 44 Years | 0 (0.0%) | 111 (68.9%) |
| 45 to 54 Years | 0 (0.0%) | 0 (0.0%) |
| 55 to 64 Years | 76 (24.4%) | 20 (7.2%) |
| 65 to 74 Years | 0 (0.0%) | 81 (20.1%) |
| 75 Years and over | 21 (12.5%) | 141 (29.3%) |
| Total | 194 (10.1%) | 453 (21.0%) |
Income Above Poverty by Sex and Age in Millinocket
According to the poverty statistics in Millinocket, males aged under 5 years and females aged 5 years are the age groups that are most secure financially, with 100.0% of males and 100.0% of females in these age groups living above the poverty line.
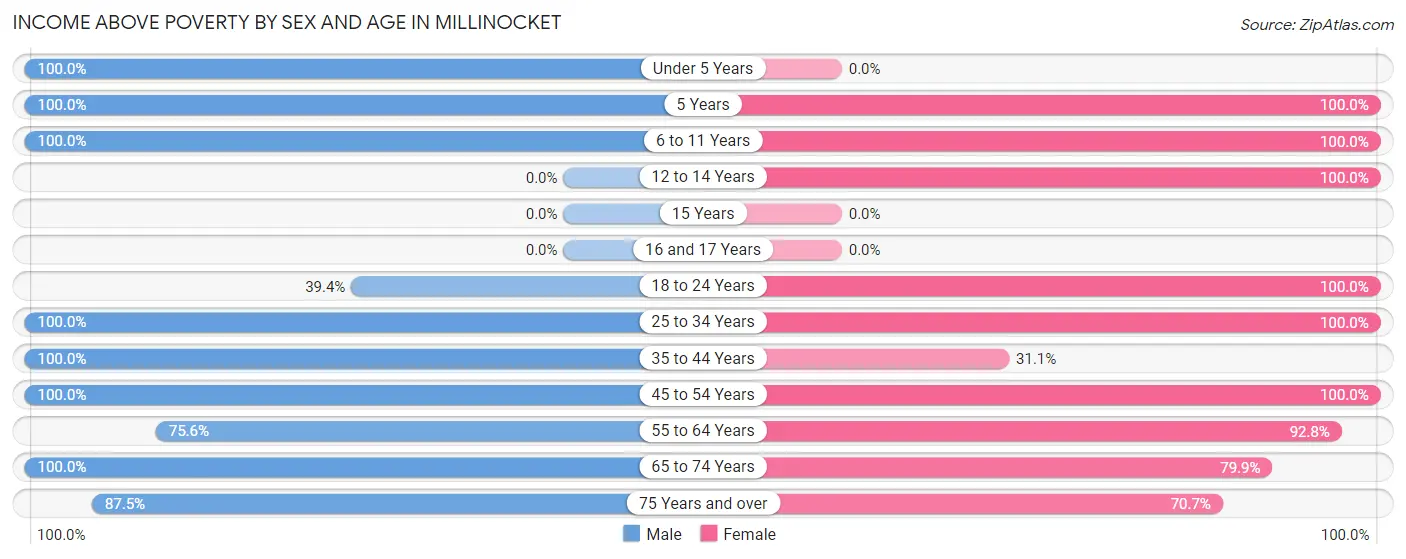
| Age Bracket | Male | Female |
| Under 5 Years | 75 (100.0%) | 0 (0.0%) |
| 5 Years | 21 (100.0%) | 125 (100.0%) |
| 6 to 11 Years | 211 (100.0%) | 16 (100.0%) |
| 12 to 14 Years | 0 (0.0%) | 12 (100.0%) |
| 15 Years | 0 (0.0%) | 0 (0.0%) |
| 16 and 17 Years | 0 (0.0%) | 0 (0.0%) |
| 18 to 24 Years | 63 (39.4%) | 25 (100.0%) |
| 25 to 34 Years | 163 (100.0%) | 258 (100.0%) |
| 35 to 44 Years | 148 (100.0%) | 50 (31.1%) |
| 45 to 54 Years | 203 (100.0%) | 294 (100.0%) |
| 55 to 64 Years | 236 (75.6%) | 257 (92.8%) |
| 65 to 74 Years | 468 (100.0%) | 322 (79.9%) |
| 75 Years and over | 147 (87.5%) | 340 (70.7%) |
| Total | 1,735 (89.9%) | 1,699 (78.9%) |
Income Below Poverty Among Married-Couple Families in Millinocket
The poverty statistics for married-couple families in Millinocket show that 4.3% or 43 of the total 993 families live below the poverty line. Families with no children have the highest poverty rate of 5.2%, comprising of 43 families. On the other hand, families with 1 or 2 children have the lowest poverty rate of 0.0%, which includes 0 families.
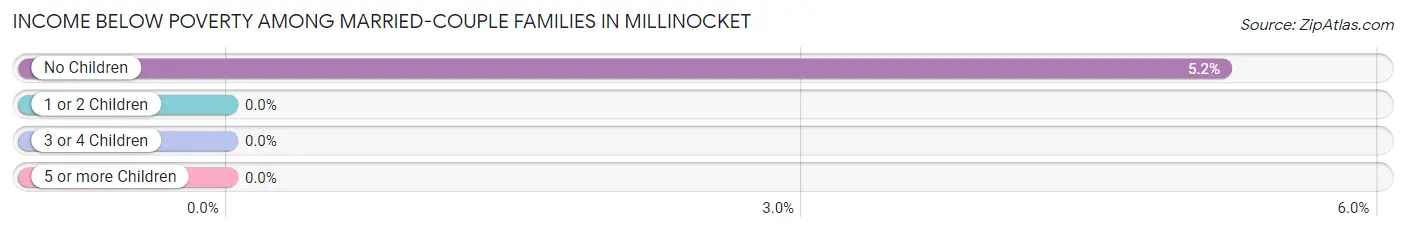
| Children | Above Poverty | Below Poverty |
| No Children | 786 (94.8%) | 43 (5.2%) |
| 1 or 2 Children | 164 (100.0%) | 0 (0.0%) |
| 3 or 4 Children | 0 (0.0%) | 0 (0.0%) |
| 5 or more Children | 0 (0.0%) | 0 (0.0%) |
| Total | 950 (95.7%) | 43 (4.3%) |
Income Below Poverty Among Single-Parent Households in Millinocket
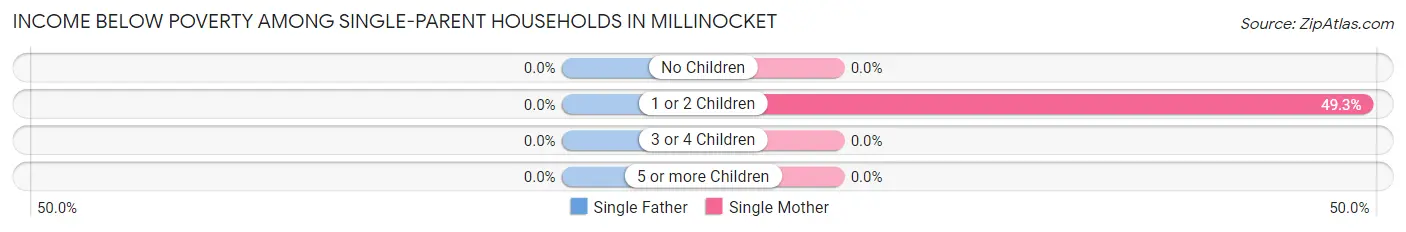
| Children | Single Father | Single Mother |
| No Children | 0 (0.0%) | 0 (0.0%) |
| 1 or 2 Children | 0 (0.0%) | 111 (49.3%) |
| 3 or 4 Children | 0 (0.0%) | 0 (0.0%) |
| 5 or more Children | 0 (0.0%) | 0 (0.0%) |
| Total | 0 (0.0%) | 111 (41.7%) |
Income Below Poverty Among Married-Couple vs Single-Parent Households in Millinocket
The poverty data for Millinocket shows that 43 of the married-couple family households (4.3%) and 111 of the single-parent households (38.8%) are living below the poverty level. Within the married-couple family households, those with no children have the highest poverty rate, with 43 households (5.2%) falling below the poverty line. Among the single-parent households, those with 1 or 2 children have the highest poverty rate, with 111 household (49.3%) living below poverty.
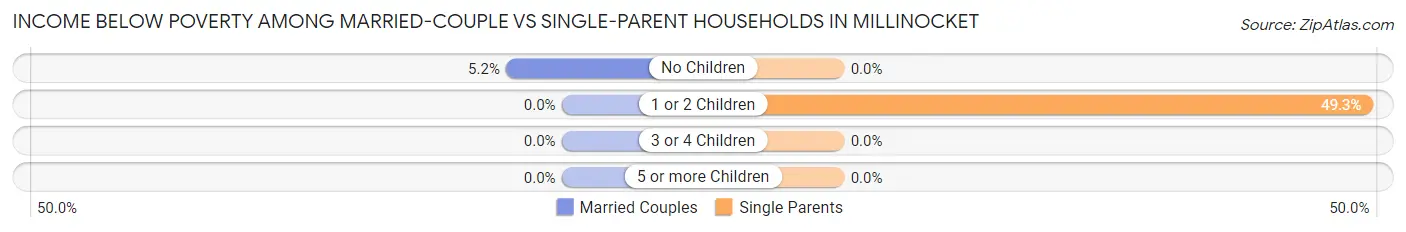
| Children | Married-Couple Families | Single-Parent Households |
| No Children | 43 (5.2%) | 0 (0.0%) |
| 1 or 2 Children | 0 (0.0%) | 111 (49.3%) |
| 3 or 4 Children | 0 (0.0%) | 0 (0.0%) |
| 5 or more Children | 0 (0.0%) | 0 (0.0%) |
| Total | 43 (4.3%) | 111 (38.8%) |
Race in Millinocket
The most populous races in Millinocket are White / Caucasian (4,112 | 99.4%), and Two or more Races (24 | 0.6%).
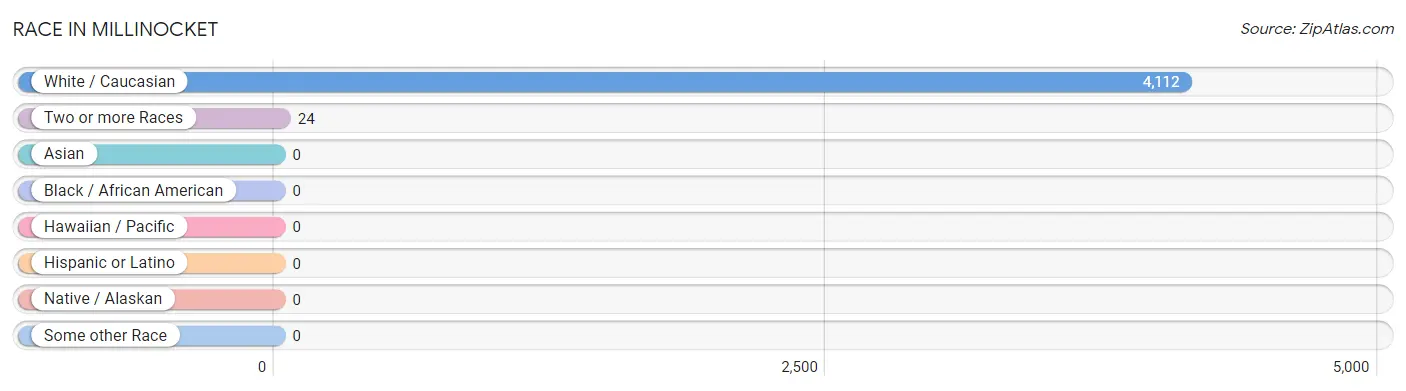
| Race | # Population | % Population |
| Asian | 0 | 0.0% |
| Black / African American | 0 | 0.0% |
| Hawaiian / Pacific | 0 | 0.0% |
| Hispanic or Latino | 0 | 0.0% |
| Native / Alaskan | 0 | 0.0% |
| White / Caucasian | 4,112 | 99.4% |
| Two or more Races | 24 | 0.6% |
| Some other Race | 0 | 0.0% |
| Total | 4,136 | 100.0% |
Ancestry in Millinocket
The most populous ancestries reported in Millinocket are English (807 | 19.5%), Irish (799 | 19.3%), French (637 | 15.4%), Scottish (337 | 8.2%), and Italian (239 | 5.8%), together accounting for 68.2% of all Millinocket residents.
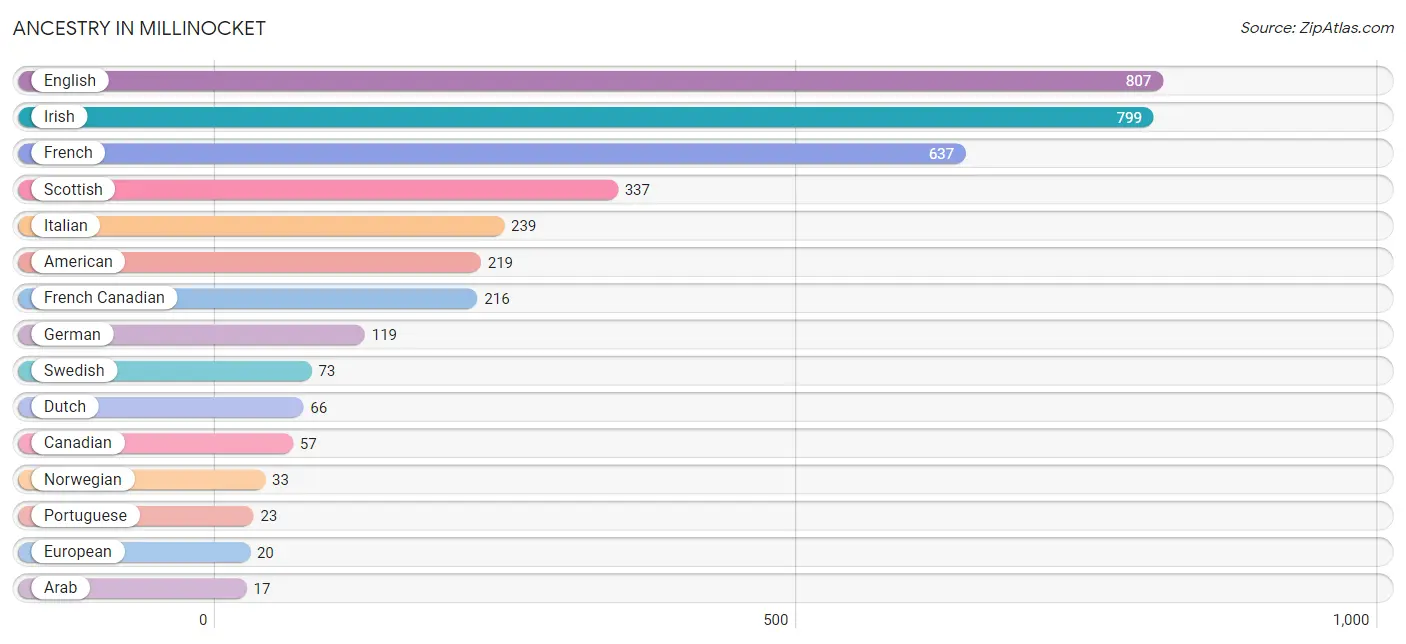
| Ancestry | # Population | % Population |
| American | 219 | 5.3% |
| Arab | 17 | 0.4% |
| British | 16 | 0.4% |
| Canadian | 57 | 1.4% |
| Dutch | 66 | 1.6% |
| English | 807 | 19.5% |
| European | 20 | 0.5% |
| French | 637 | 15.4% |
| French Canadian | 216 | 5.2% |
| German | 119 | 2.9% |
| Irish | 799 | 19.3% |
| Iroquois | 6 | 0.2% |
| Italian | 239 | 5.8% |
| Lebanese | 17 | 0.4% |
| Lithuanian | 15 | 0.4% |
| Norwegian | 33 | 0.8% |
| Polish | 9 | 0.2% |
| Portuguese | 23 | 0.6% |
| Scandinavian | 8 | 0.2% |
| Scotch-Irish | 11 | 0.3% |
| Scottish | 337 | 8.2% |
| Swedish | 73 | 1.8% | View All 22 Rows |
Immigrants in Millinocket
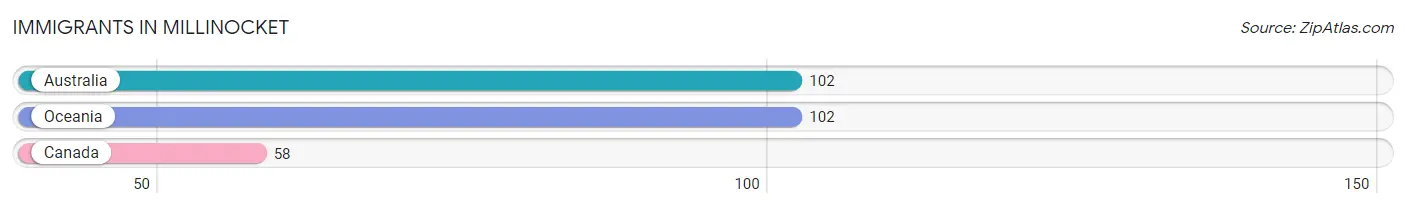
The most numerous immigrant groups reported in Millinocket came from Australia (102 | 2.5%), Oceania (102 | 2.5%), and Canada (58 | 1.4%), together accounting for 6.3% of all Millinocket residents.
| Immigration Origin | # Population | % Population |
| Australia | 102 | 2.5% |
| Canada | 58 | 1.4% |
| Oceania | 102 | 2.5% | View All 3 Rows |
Sex and Age in Millinocket
Sex and Age in Millinocket
The most populous age groups in Millinocket are 70 to 74 Years (271 | 13.9%) for men and 65 to 69 Years (275 | 12.6%) for women.
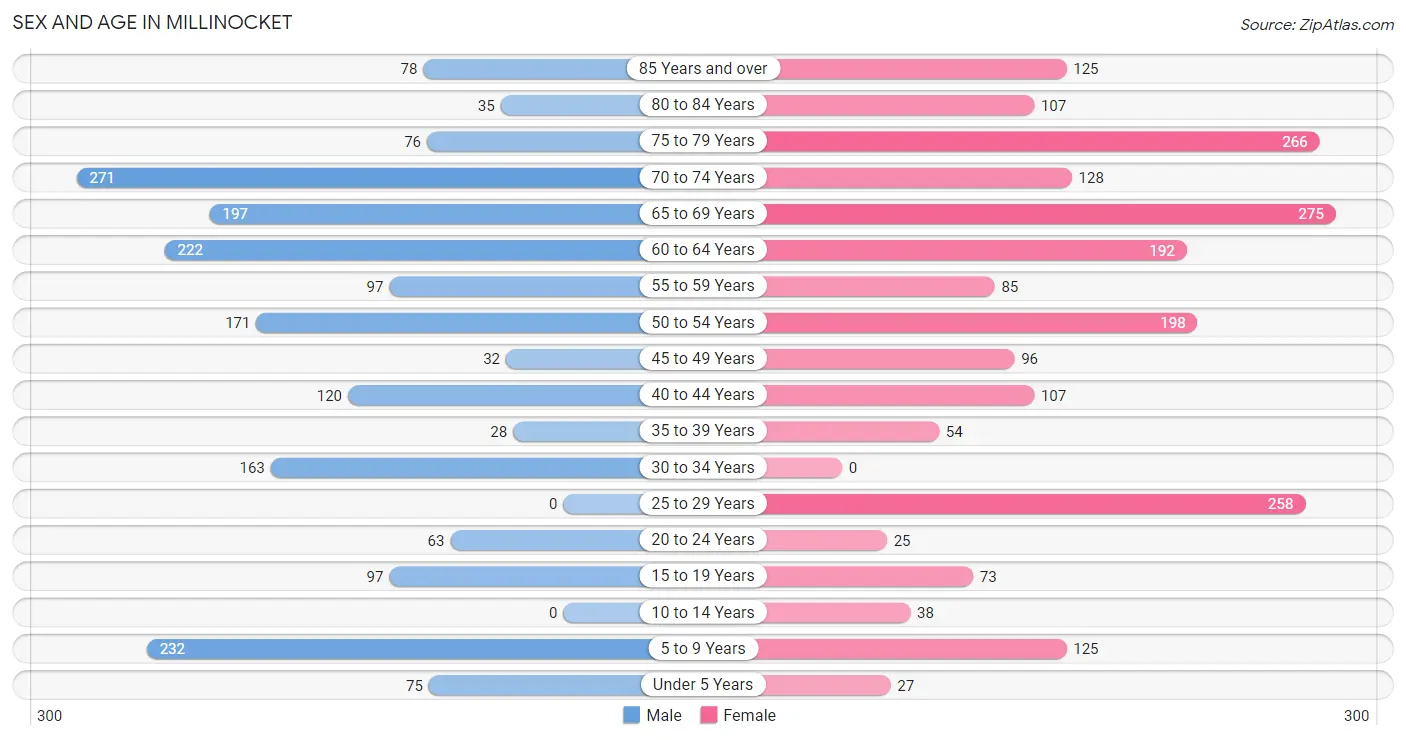
| Age Bracket | Male | Female |
| Under 5 Years | 75 (3.8%) | 27 (1.2%) |
| 5 to 9 Years | 232 (11.8%) | 125 (5.7%) |
| 10 to 14 Years | 0 (0.0%) | 38 (1.7%) |
| 15 to 19 Years | 97 (5.0%) | 73 (3.4%) |
| 20 to 24 Years | 63 (3.2%) | 25 (1.1%) |
| 25 to 29 Years | 0 (0.0%) | 258 (11.8%) |
| 30 to 34 Years | 163 (8.3%) | 0 (0.0%) |
| 35 to 39 Years | 28 (1.4%) | 54 (2.5%) |
| 40 to 44 Years | 120 (6.1%) | 107 (4.9%) |
| 45 to 49 Years | 32 (1.6%) | 96 (4.4%) |
| 50 to 54 Years | 171 (8.7%) | 198 (9.1%) |
| 55 to 59 Years | 97 (5.0%) | 85 (3.9%) |
| 60 to 64 Years | 222 (11.3%) | 192 (8.8%) |
| 65 to 69 Years | 197 (10.1%) | 275 (12.6%) |
| 70 to 74 Years | 271 (13.9%) | 128 (5.9%) |
| 75 to 79 Years | 76 (3.9%) | 266 (12.2%) |
| 80 to 84 Years | 35 (1.8%) | 107 (4.9%) |
| 85 Years and over | 78 (4.0%) | 125 (5.7%) |
| Total | 1,957 (100.0%) | 2,179 (100.0%) |
Families and Households in Millinocket
Median Family Size in Millinocket
The median family size in Millinocket is 2.37 persons per family, with single female/mother families (266 | 20.8%) accounting for the largest median family size of 2.68 persons per family. On the other hand, married-couple families (993 | 77.6%) represent the smallest median family size with 2.29 persons per family.
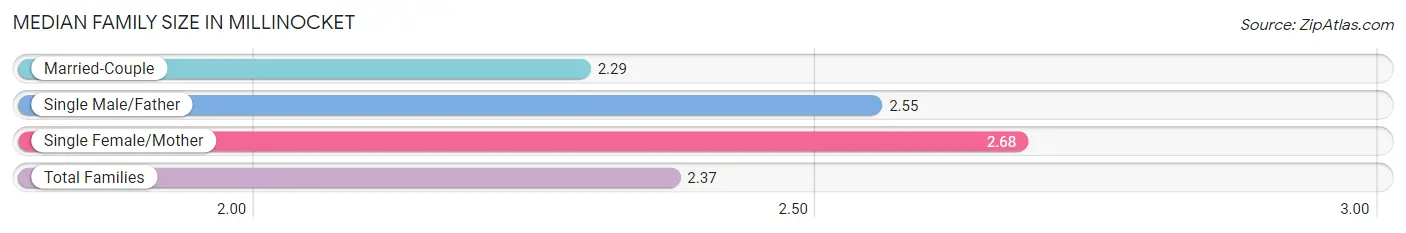
| Family Type | # Families | Family Size |
| Married-Couple | 993 (77.6%) | 2.29 |
| Single Male/Father | 20 (1.6%) | 2.55 |
| Single Female/Mother | 266 (20.8%) | 2.68 |
| Total Families | 1,279 (100.0%) | 2.37 |
Median Household Size in Millinocket
The median household size in Millinocket is 1.82 persons per household, with single female/mother households (266 | 11.8%) accounting for the largest median household size of 2.68 persons per household. non-family households (968 | 43.1%) represent the smallest median household size with 1.08 persons per household.
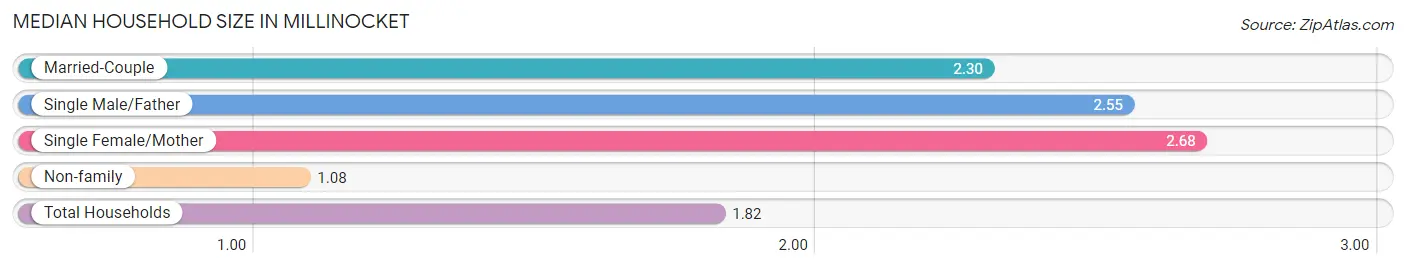
| Household Type | # Households | Household Size |
| Married-Couple | 993 (44.2%) | 2.30 |
| Single Male/Father | 20 (0.9%) | 2.55 |
| Single Female/Mother | 266 (11.8%) | 2.68 |
| Non-family | 968 (43.1%) | 1.08 |
| Total Households | 2,247 (100.0%) | 1.82 |
Household Size by Marriage Status in Millinocket
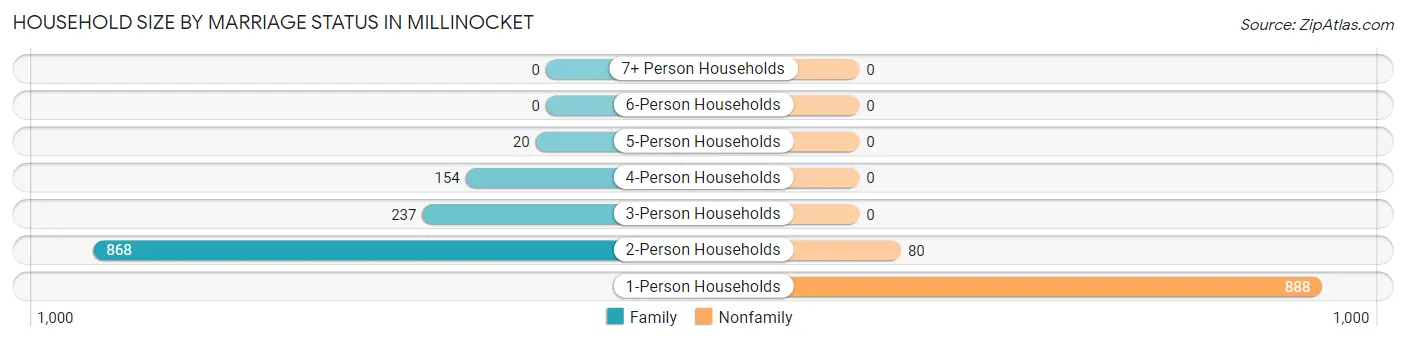
Out of a total of 2,247 households in Millinocket, 1,279 (56.9%) are family households, while 968 (43.1%) are nonfamily households. The most numerous type of family households are 2-person households, comprising 868, and the most common type of nonfamily households are 1-person households, comprising 888.
| Household Size | Family Households | Nonfamily Households |
| 1-Person Households | - | 888 (39.5%) |
| 2-Person Households | 868 (38.6%) | 80 (3.6%) |
| 3-Person Households | 237 (10.5%) | 0 (0.0%) |
| 4-Person Households | 154 (6.9%) | 0 (0.0%) |
| 5-Person Households | 20 (0.9%) | 0 (0.0%) |
| 6-Person Households | 0 (0.0%) | 0 (0.0%) |
| 7+ Person Households | 0 (0.0%) | 0 (0.0%) |
| Total | 1,279 (56.9%) | 968 (43.1%) |
Female Fertility in Millinocket
Fertility by Age in Millinocket
| Age Bracket | Women with Births | Births / 1,000 Women |
| 15 to 19 years | 0 (0.0%) | 0.0 |
| 20 to 34 years | 0 (0.0%) | 0.0 |
| 35 to 50 years | 0 (0.0%) | 0.0 |
| Total | 0 (0.0%) | 0.0 |
Fertility by Age by Marriage Status in Millinocket
| Age Bracket | Married | Unmarried |
| 15 to 19 years | 0 (0.0%) | 0 (0.0%) |
| 20 to 34 years | 0 (0.0%) | 0 (0.0%) |
| 35 to 50 years | 0 (0.0%) | 0 (0.0%) |
| Total | 0 (0.0%) | 0 (0.0%) |
Fertility by Education in Millinocket
| Educational Attainment | Women with Births | Births / 1,000 Women |
| Less than High School | 0 (0.0%) | 0.0 |
| High School Diploma | 0 (0.0%) | 0.0 |
| College or Associate's Degree | 0 (0.0%) | 0.0 |
| Bachelor's Degree | 0 (0.0%) | 0.0 |
| Graduate Degree | 0 (0.0%) | 0.0 |
| Total | 0 (0.0%) | 0.0 |
Fertility by Education by Marriage Status in Millinocket
| Educational Attainment | Married | Unmarried |
| Less than High School | 0 (0.0%) | 0 (0.0%) |
| High School Diploma | 0 (0.0%) | 0 (0.0%) |
| College or Associate's Degree | 0 (0.0%) | 0 (0.0%) |
| Bachelor's Degree | 0 (0.0%) | 0 (0.0%) |
| Graduate Degree | 0 (0.0%) | 0 (0.0%) |
| Total | 0 (0.0%) | 0 (0.0%) |
Employment Characteristics in Millinocket
Employment by Class of Employer in Millinocket
Among the 1,419 employed individuals in Millinocket, private company employees (968 | 68.2%), not-for-profit organizations (157 | 11.1%), and self-employed (incorporated) (98 | 6.9%) make up the most common classes of employment.
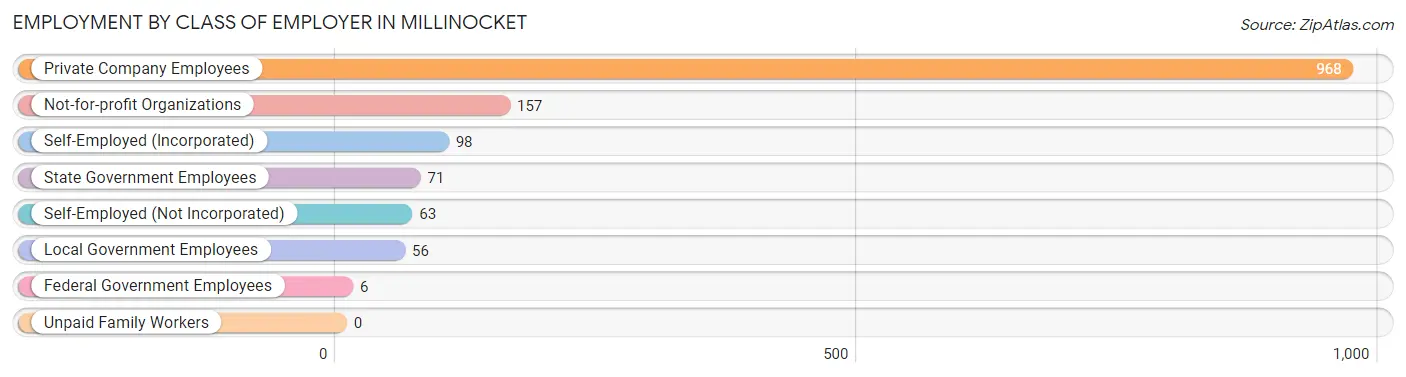
| Employer Class | # Employees | % Employees |
| Private Company Employees | 968 | 68.2% |
| Self-Employed (Incorporated) | 98 | 6.9% |
| Self-Employed (Not Incorporated) | 63 | 4.4% |
| Not-for-profit Organizations | 157 | 11.1% |
| Local Government Employees | 56 | 4.0% |
| State Government Employees | 71 | 5.0% |
| Federal Government Employees | 6 | 0.4% |
| Unpaid Family Workers | 0 | 0.0% |
| Total | 1,419 | 100.0% |
Employment Status by Age in Millinocket
According to the labor force statistics for Millinocket, out of the total population over 16 years of age (3,566), 43.8% or 1,562 individuals are in the labor force, with 8.9% or 139 of them unemployed. The age group with the highest labor force participation rate is 25 to 29 years, with 100.0% or 258 individuals in the labor force. Within the labor force, the 35 to 44 years age range has the highest percentage of unemployed individuals, with 40.6% or 84 of them being unemployed.
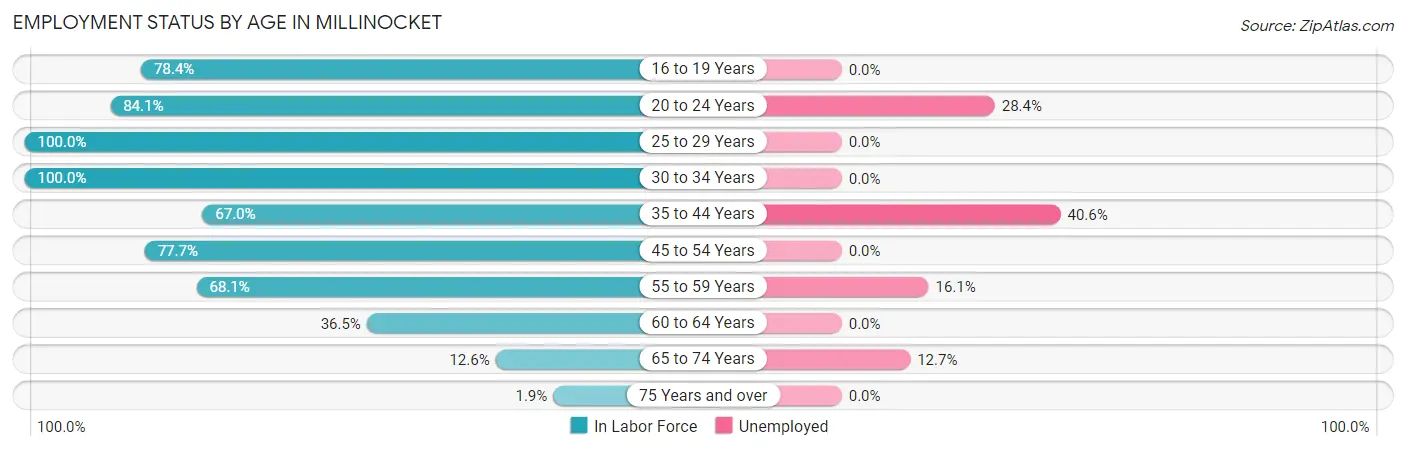
| Age Bracket | In Labor Force | Unemployed |
| 16 to 19 Years | 76 (78.4%) | 0 (0.0%) |
| 20 to 24 Years | 74 (84.1%) | 21 (28.4%) |
| 25 to 29 Years | 258 (100.0%) | 0 (0.0%) |
| 30 to 34 Years | 163 (100.0%) | 0 (0.0%) |
| 35 to 44 Years | 207 (67.0%) | 84 (40.6%) |
| 45 to 54 Years | 386 (77.7%) | 0 (0.0%) |
| 55 to 59 Years | 124 (68.1%) | 20 (16.1%) |
| 60 to 64 Years | 151 (36.5%) | 0 (0.0%) |
| 65 to 74 Years | 110 (12.6%) | 14 (12.7%) |
| 75 Years and over | 13 (1.9%) | 0 (0.0%) |
| Total | 1,562 (43.8%) | 139 (8.9%) |
Employment Status by Educational Attainment in Millinocket
According to labor force statistics for Millinocket, 70.7% of individuals (1,289) out of the total population between 25 and 64 years of age (1,823) are in the labor force, with 8.1% or 104 of them being unemployed. The group with the highest labor force participation rate are those with the educational attainment of less than high school, with 100.0% or 31 individuals in the labor force. Within the labor force, individuals with bachelor's degree or higher education have the highest percentage of unemployment, with 26.3% or 84 of them being unemployed.
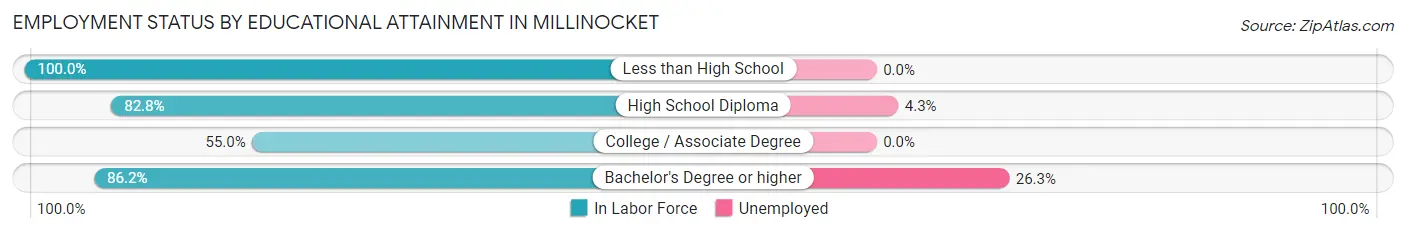
| Educational Attainment | In Labor Force | Unemployed |
| Less than High School | 31 (100.0%) | 0 (0.0%) |
| High School Diploma | 468 (82.8%) | 24 (4.3%) |
| College / Associate Degree | 471 (55.0%) | 0 (0.0%) |
| Bachelor's Degree or higher | 319 (86.2%) | 97 (26.3%) |
| Total | 1,289 (70.7%) | 148 (8.1%) |
Employment Occupations by Sex in Millinocket
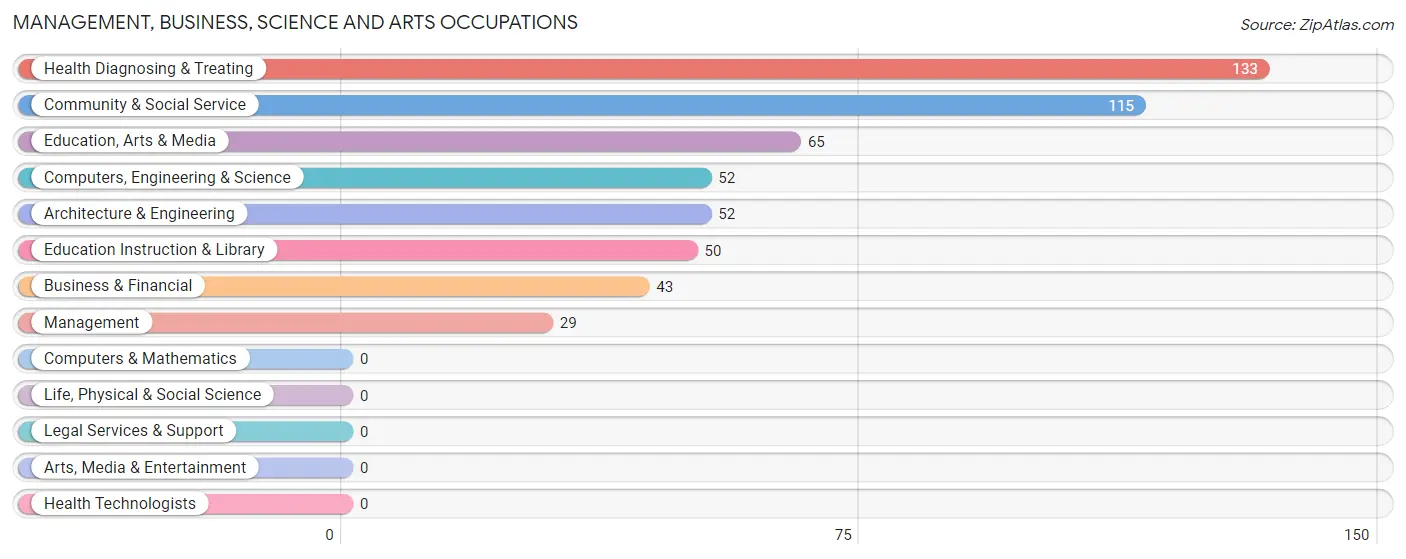
Management, Business, Science and Arts Occupations
The most common Management, Business, Science and Arts occupations in Millinocket are Health Diagnosing & Treating (133 | 9.3%), Community & Social Service (115 | 8.1%), Education, Arts & Media (65 | 4.6%), Computers, Engineering & Science (52 | 3.6%), and Architecture & Engineering (52 | 3.6%).
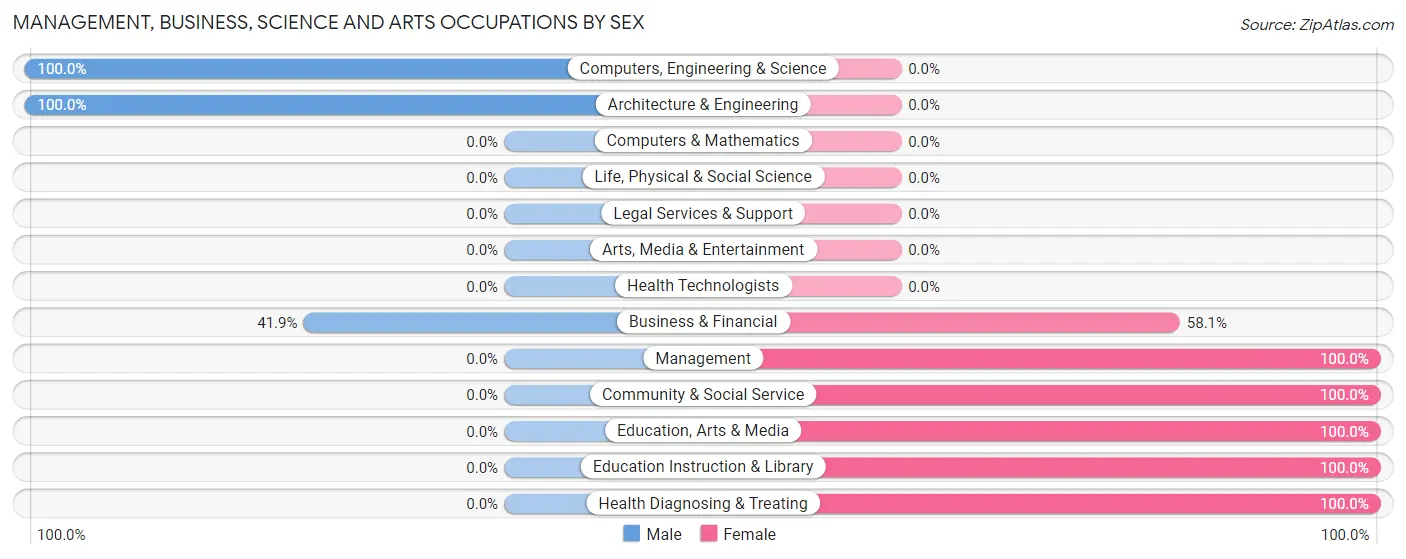
Management, Business, Science and Arts Occupations by Sex
Within the Management, Business, Science and Arts occupations in Millinocket, the most male-oriented occupations are Computers, Engineering & Science (100.0%), Architecture & Engineering (100.0%), and Business & Financial (41.9%), while the most female-oriented occupations are Management (100.0%), Community & Social Service (100.0%), and Education, Arts & Media (100.0%).
| Occupation | Male | Female |
| Management | 0 (0.0%) | 29 (100.0%) |
| Business & Financial | 18 (41.9%) | 25 (58.1%) |
| Computers, Engineering & Science | 52 (100.0%) | 0 (0.0%) |
| Computers & Mathematics | 0 (0.0%) | 0 (0.0%) |
| Architecture & Engineering | 52 (100.0%) | 0 (0.0%) |
| Life, Physical & Social Science | 0 (0.0%) | 0 (0.0%) |
| Community & Social Service | 0 (0.0%) | 115 (100.0%) |
| Education, Arts & Media | 0 (0.0%) | 65 (100.0%) |
| Legal Services & Support | 0 (0.0%) | 0 (0.0%) |
| Education Instruction & Library | 0 (0.0%) | 50 (100.0%) |
| Arts, Media & Entertainment | 0 (0.0%) | 0 (0.0%) |
| Health Diagnosing & Treating | 0 (0.0%) | 133 (100.0%) |
| Health Technologists | 0 (0.0%) | 0 (0.0%) |
| Total (Category) | 70 (18.8%) | 302 (81.2%) |
| Total (Overall) | 681 (47.9%) | 742 (52.1%) |
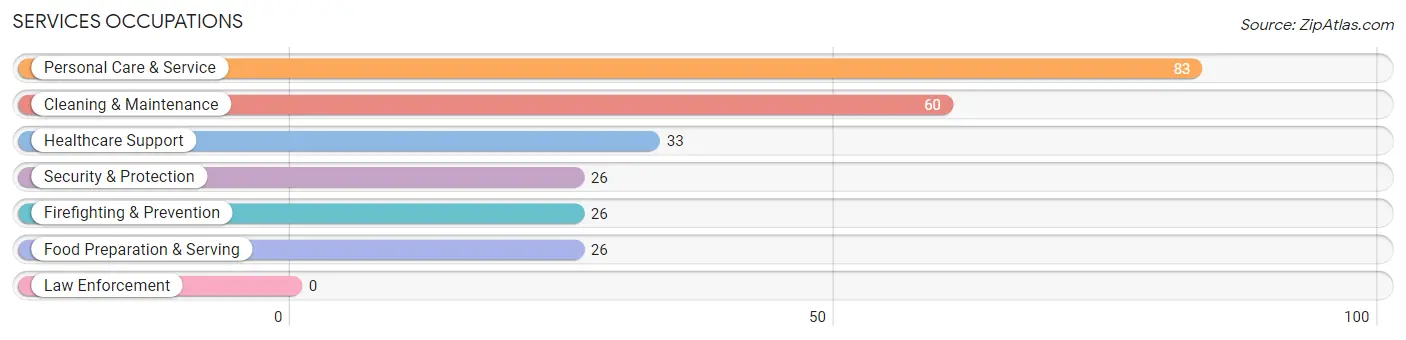
Services Occupations
The most common Services occupations in Millinocket are Personal Care & Service (83 | 5.8%), Cleaning & Maintenance (60 | 4.2%), Healthcare Support (33 | 2.3%), Security & Protection (26 | 1.8%), and Firefighting & Prevention (26 | 1.8%).
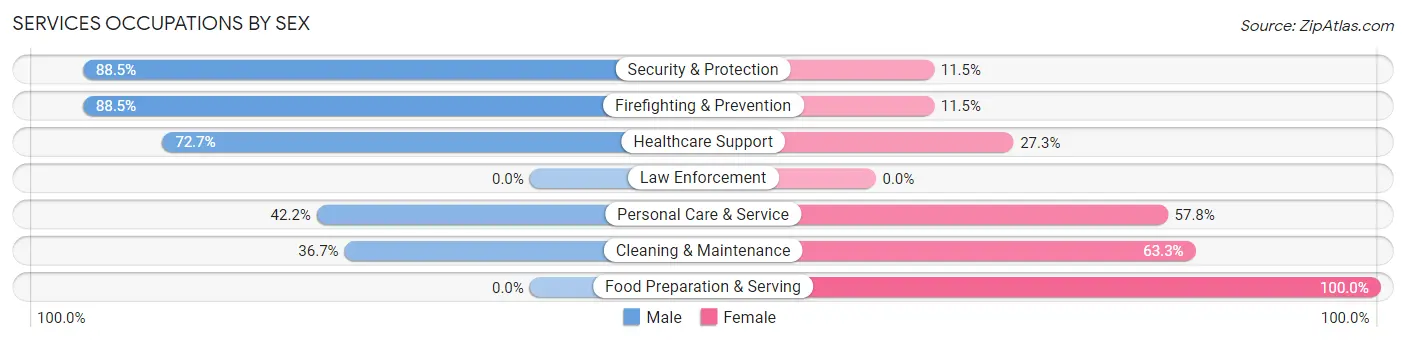
Services Occupations by Sex
Within the Services occupations in Millinocket, the most male-oriented occupations are Security & Protection (88.5%), Firefighting & Prevention (88.5%), and Healthcare Support (72.7%), while the most female-oriented occupations are Food Preparation & Serving (100.0%), Cleaning & Maintenance (63.3%), and Personal Care & Service (57.8%).
| Occupation | Male | Female |
| Healthcare Support | 24 (72.7%) | 9 (27.3%) |
| Security & Protection | 23 (88.5%) | 3 (11.5%) |
| Firefighting & Prevention | 23 (88.5%) | 3 (11.5%) |
| Law Enforcement | 0 (0.0%) | 0 (0.0%) |
| Food Preparation & Serving | 0 (0.0%) | 26 (100.0%) |
| Cleaning & Maintenance | 22 (36.7%) | 38 (63.3%) |
| Personal Care & Service | 35 (42.2%) | 48 (57.8%) |
| Total (Category) | 104 (45.6%) | 124 (54.4%) |
| Total (Overall) | 681 (47.9%) | 742 (52.1%) |
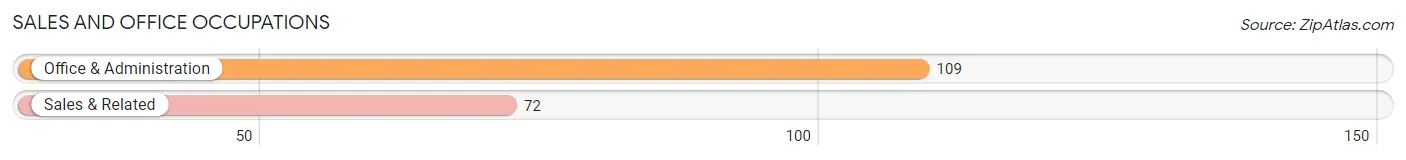
Sales and Office Occupations
The most common Sales and Office occupations in Millinocket are Office & Administration (109 | 7.7%), and Sales & Related (72 | 5.1%).
Sales and Office Occupations by Sex
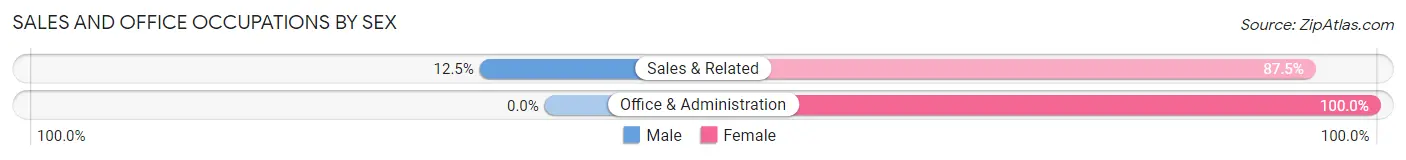
| Occupation | Male | Female |
| Sales & Related | 9 (12.5%) | 63 (87.5%) |
| Office & Administration | 0 (0.0%) | 109 (100.0%) |
| Total (Category) | 9 (5.0%) | 172 (95.0%) |
| Total (Overall) | 681 (47.9%) | 742 (52.1%) |
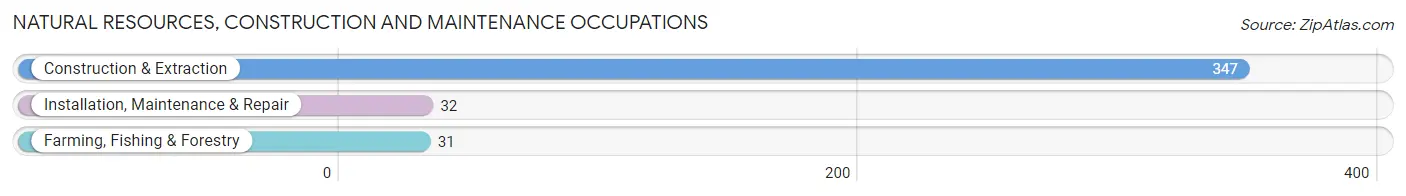
Natural Resources, Construction and Maintenance Occupations
The most common Natural Resources, Construction and Maintenance occupations in Millinocket are Construction & Extraction (347 | 24.4%), Installation, Maintenance & Repair (32 | 2.2%), and Farming, Fishing & Forestry (31 | 2.2%).
Natural Resources, Construction and Maintenance Occupations by Sex
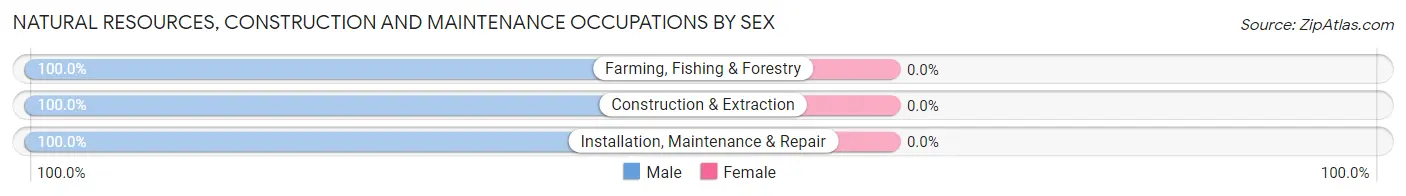
| Occupation | Male | Female |
| Farming, Fishing & Forestry | 31 (100.0%) | 0 (0.0%) |
| Construction & Extraction | 347 (100.0%) | 0 (0.0%) |
| Installation, Maintenance & Repair | 32 (100.0%) | 0 (0.0%) |
| Total (Category) | 410 (100.0%) | 0 (0.0%) |
| Total (Overall) | 681 (47.9%) | 742 (52.1%) |
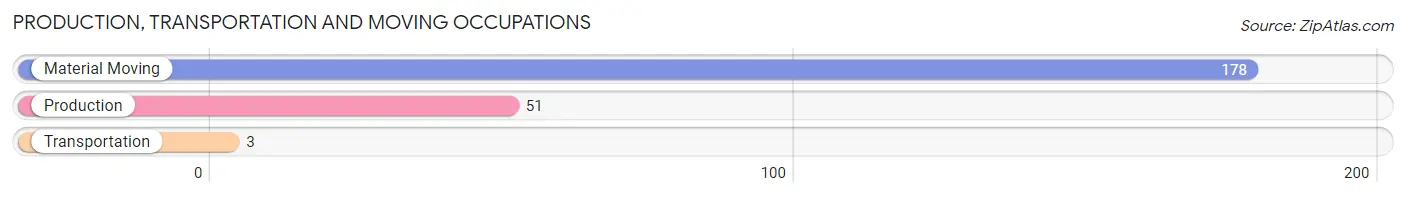
Production, Transportation and Moving Occupations
The most common Production, Transportation and Moving occupations in Millinocket are Material Moving (178 | 12.5%), Production (51 | 3.6%), and Transportation (3 | 0.2%).
Production, Transportation and Moving Occupations by Sex
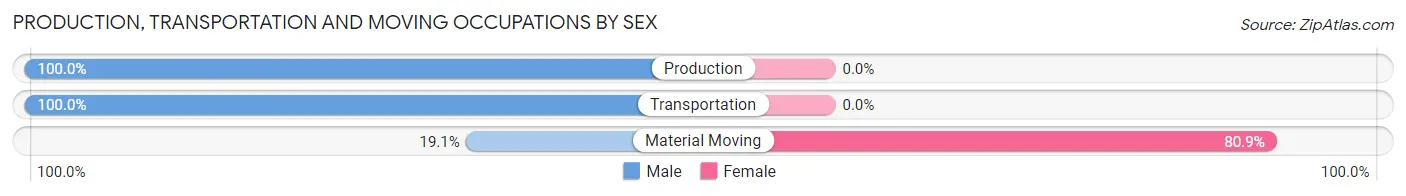
| Occupation | Male | Female |
| Production | 51 (100.0%) | 0 (0.0%) |
| Transportation | 3 (100.0%) | 0 (0.0%) |
| Material Moving | 34 (19.1%) | 144 (80.9%) |
| Total (Category) | 88 (37.9%) | 144 (62.1%) |
| Total (Overall) | 681 (47.9%) | 742 (52.1%) |
Employment Industries by Sex in Millinocket
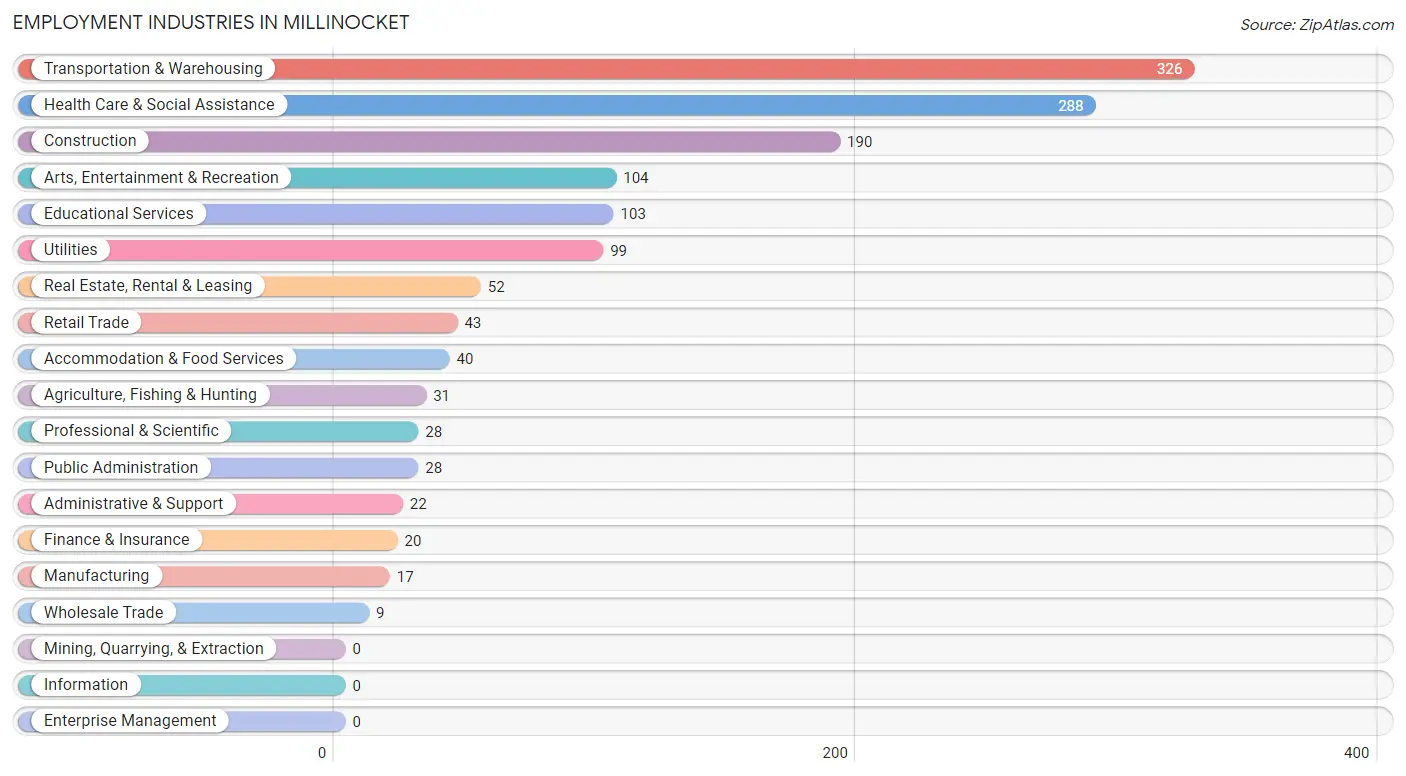
Employment Industries in Millinocket
The major employment industries in Millinocket include Transportation & Warehousing (326 | 22.9%), Health Care & Social Assistance (288 | 20.2%), Construction (190 | 13.4%), Arts, Entertainment & Recreation (104 | 7.3%), and Educational Services (103 | 7.2%).
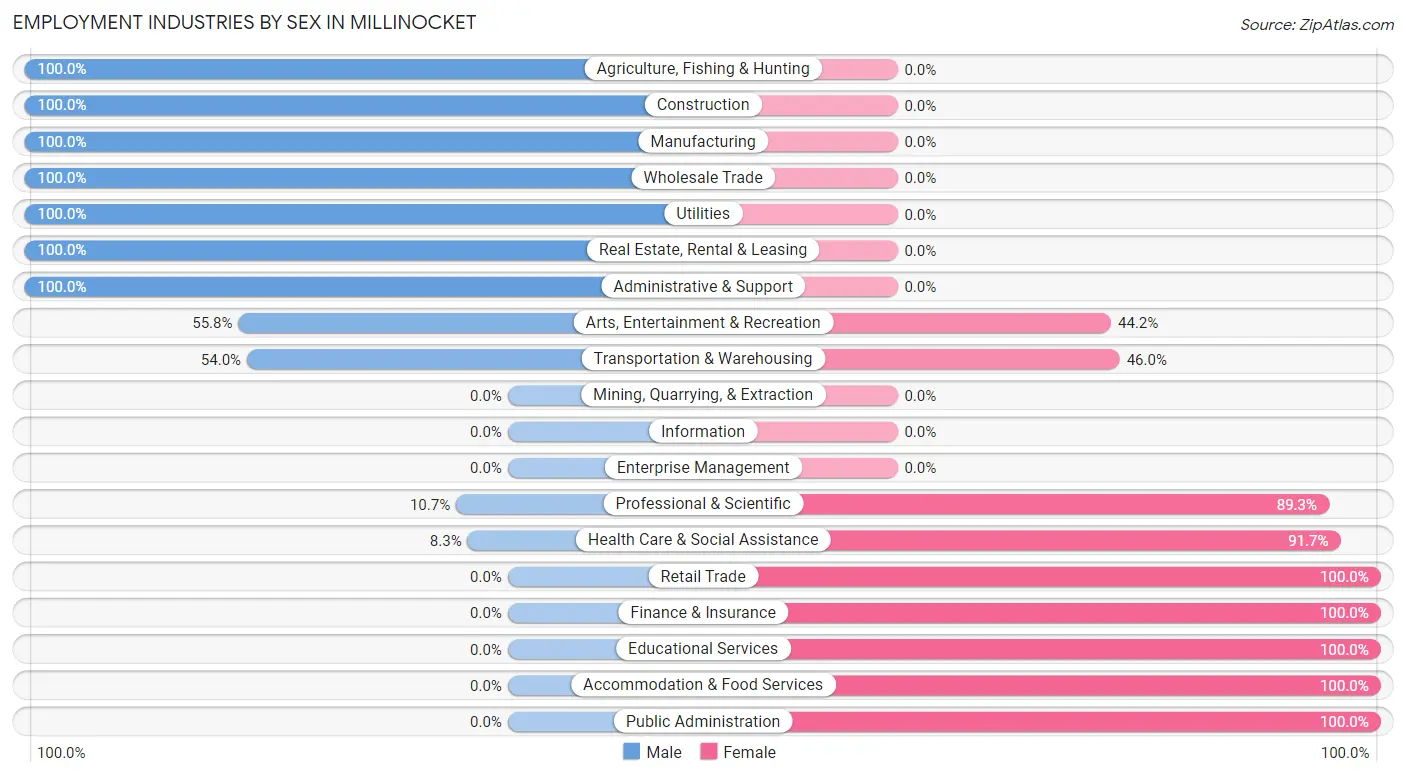
Employment Industries by Sex in Millinocket
The Millinocket industries that see more men than women are Agriculture, Fishing & Hunting (100.0%), Construction (100.0%), and Manufacturing (100.0%), whereas the industries that tend to have a higher number of women are Retail Trade (100.0%), Finance & Insurance (100.0%), and Educational Services (100.0%).
| Industry | Male | Female |
| Agriculture, Fishing & Hunting | 31 (100.0%) | 0 (0.0%) |
| Mining, Quarrying, & Extraction | 0 (0.0%) | 0 (0.0%) |
| Construction | 190 (100.0%) | 0 (0.0%) |
| Manufacturing | 17 (100.0%) | 0 (0.0%) |
| Wholesale Trade | 9 (100.0%) | 0 (0.0%) |
| Retail Trade | 0 (0.0%) | 43 (100.0%) |
| Transportation & Warehousing | 176 (54.0%) | 150 (46.0%) |
| Utilities | 99 (100.0%) | 0 (0.0%) |
| Information | 0 (0.0%) | 0 (0.0%) |
| Finance & Insurance | 0 (0.0%) | 20 (100.0%) |
| Real Estate, Rental & Leasing | 52 (100.0%) | 0 (0.0%) |
| Professional & Scientific | 3 (10.7%) | 25 (89.3%) |
| Enterprise Management | 0 (0.0%) | 0 (0.0%) |
| Administrative & Support | 22 (100.0%) | 0 (0.0%) |
| Educational Services | 0 (0.0%) | 103 (100.0%) |
| Health Care & Social Assistance | 24 (8.3%) | 264 (91.7%) |
| Arts, Entertainment & Recreation | 58 (55.8%) | 46 (44.2%) |
| Accommodation & Food Services | 0 (0.0%) | 40 (100.0%) |
| Public Administration | 0 (0.0%) | 28 (100.0%) |
| Total | 681 (47.9%) | 742 (52.1%) |
Education in Millinocket
School Enrollment in Millinocket
The most common levels of schooling among the 608 students in Millinocket are elementary school (221 | 36.3%), nursery / preschool (125 | 20.6%), and college / undergraduate (94 | 15.5%).
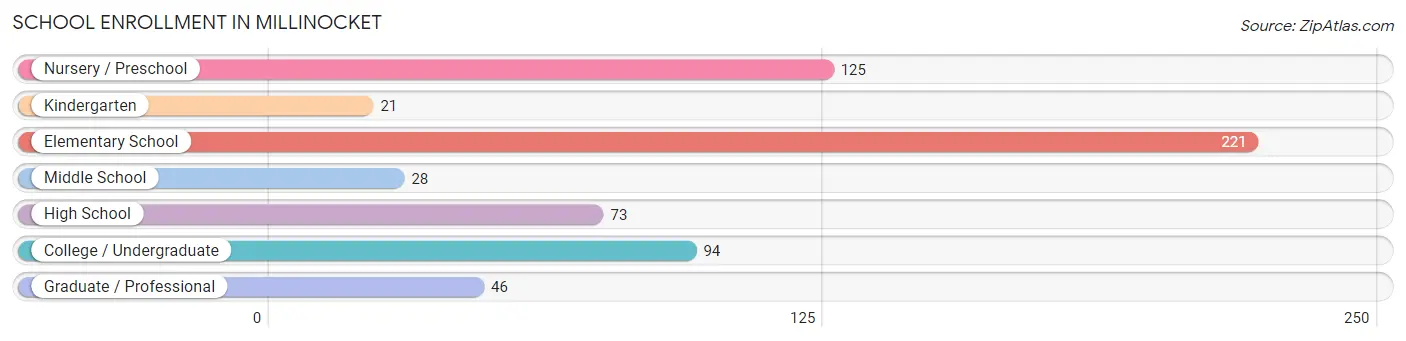
| School Level | # Students | % Students |
| Nursery / Preschool | 125 | 20.6% |
| Kindergarten | 21 | 3.5% |
| Elementary School | 221 | 36.3% |
| Middle School | 28 | 4.6% |
| High School | 73 | 12.0% |
| College / Undergraduate | 94 | 15.5% |
| Graduate / Professional | 46 | 7.6% |
| Total | 608 | 100.0% |
School Enrollment by Age by Funding Source in Millinocket
Out of a total of 608 students who are enrolled in schools in Millinocket, 113 (18.6%) attend a private institution, while the remaining 495 (81.4%) are enrolled in public schools. The age group of 18 to 19 year olds has the highest likelihood of being enrolled in private schools, with 76 (100.0% in the age bracket) enrolled. Conversely, the age group of 5 to 9 year old has the lowest likelihood of being enrolled in a private school, with 357 (100.0% in the age bracket) attending a public institution.
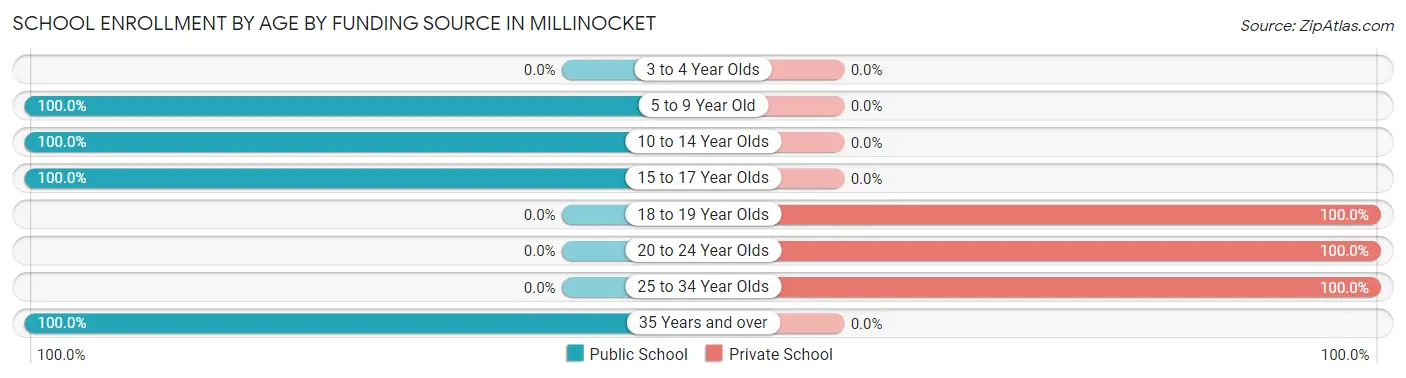
| Age Bracket | Public School | Private School |
| 3 to 4 Year Olds | 0 (0.0%) | 0 (0.0%) |
| 5 to 9 Year Old | 357 (100.0%) | 0 (0.0%) |
| 10 to 14 Year Olds | 38 (100.0%) | 0 (0.0%) |
| 15 to 17 Year Olds | 73 (100.0%) | 0 (0.0%) |
| 18 to 19 Year Olds | 0 (0.0%) | 76 (100.0%) |
| 20 to 24 Year Olds | 0 (0.0%) | 14 (100.0%) |
| 25 to 34 Year Olds | 0 (0.0%) | 23 (100.0%) |
| 35 Years and over | 27 (100.0%) | 0 (0.0%) |
| Total | 495 (81.4%) | 113 (18.6%) |
Educational Attainment by Field of Study in Millinocket
Business (112 | 15.8%), science & technology (107 | 15.0%), education (102 | 14.3%), arts & humanities (88 | 12.4%), and multidisciplinary studies (76 | 10.7%) are the most common fields of study among 711 individuals in Millinocket who have obtained a bachelor's degree or higher.
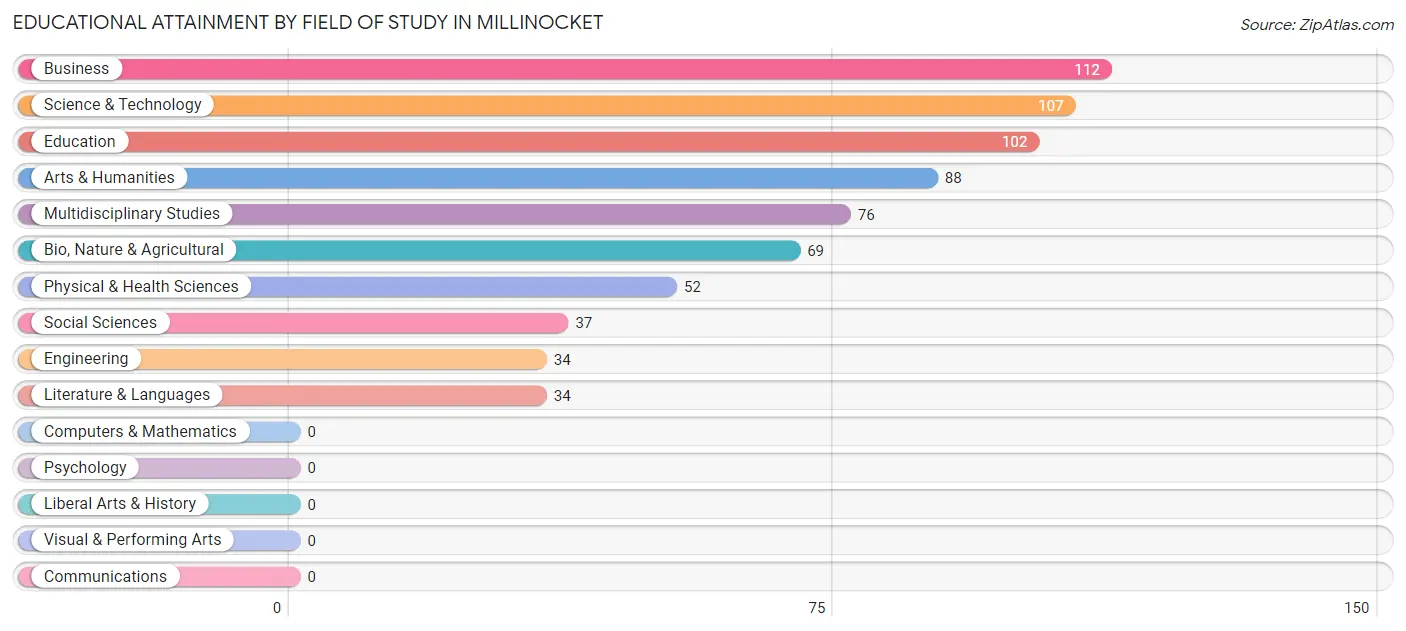
| Field of Study | # Graduates | % Graduates |
| Computers & Mathematics | 0 | 0.0% |
| Bio, Nature & Agricultural | 69 | 9.7% |
| Physical & Health Sciences | 52 | 7.3% |
| Psychology | 0 | 0.0% |
| Social Sciences | 37 | 5.2% |
| Engineering | 34 | 4.8% |
| Multidisciplinary Studies | 76 | 10.7% |
| Science & Technology | 107 | 15.0% |
| Business | 112 | 15.8% |
| Education | 102 | 14.3% |
| Literature & Languages | 34 | 4.8% |
| Liberal Arts & History | 0 | 0.0% |
| Visual & Performing Arts | 0 | 0.0% |
| Communications | 0 | 0.0% |
| Arts & Humanities | 88 | 12.4% |
| Total | 711 | 100.0% |
Transportation & Commute in Millinocket
Vehicle Availability by Sex in Millinocket
The most prevalent vehicle ownership categories in Millinocket are males with 3 vehicles (313, accounting for 46.0%) and females with 3 vehicles (257, making up 42.4%).
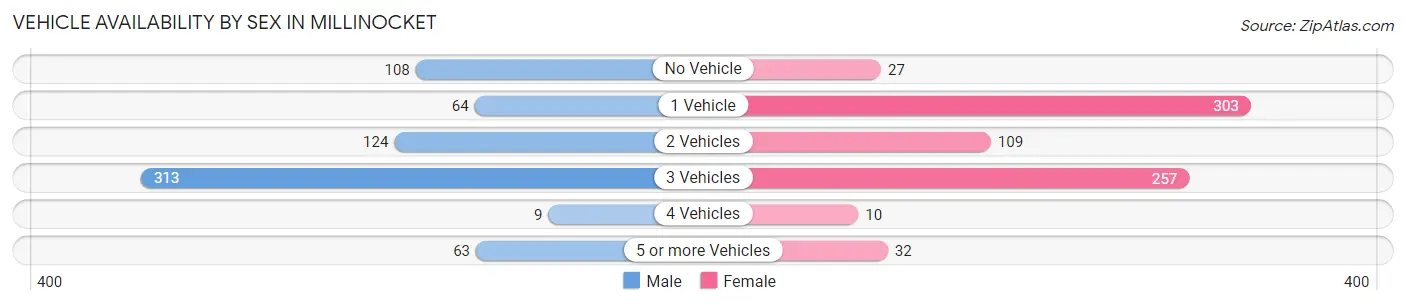
| Vehicles Available | Male | Female |
| No Vehicle | 108 (15.9%) | 27 (3.7%) |
| 1 Vehicle | 64 (9.4%) | 303 (41.1%) |
| 2 Vehicles | 124 (18.2%) | 109 (14.8%) |
| 3 Vehicles | 313 (46.0%) | 257 (34.8%) |
| 4 Vehicles | 9 (1.3%) | 10 (1.4%) |
| 5 or more Vehicles | 63 (9.2%) | 32 (4.3%) |
| Total | 681 (100.0%) | 738 (100.0%) |
Commute Time in Millinocket
The most frequently occuring commute durations in Millinocket are less than 5 minutes (355 commuters, 27.7%), 15 to 19 minutes (271 commuters, 21.2%), and 5 to 9 minutes (207 commuters, 16.2%).
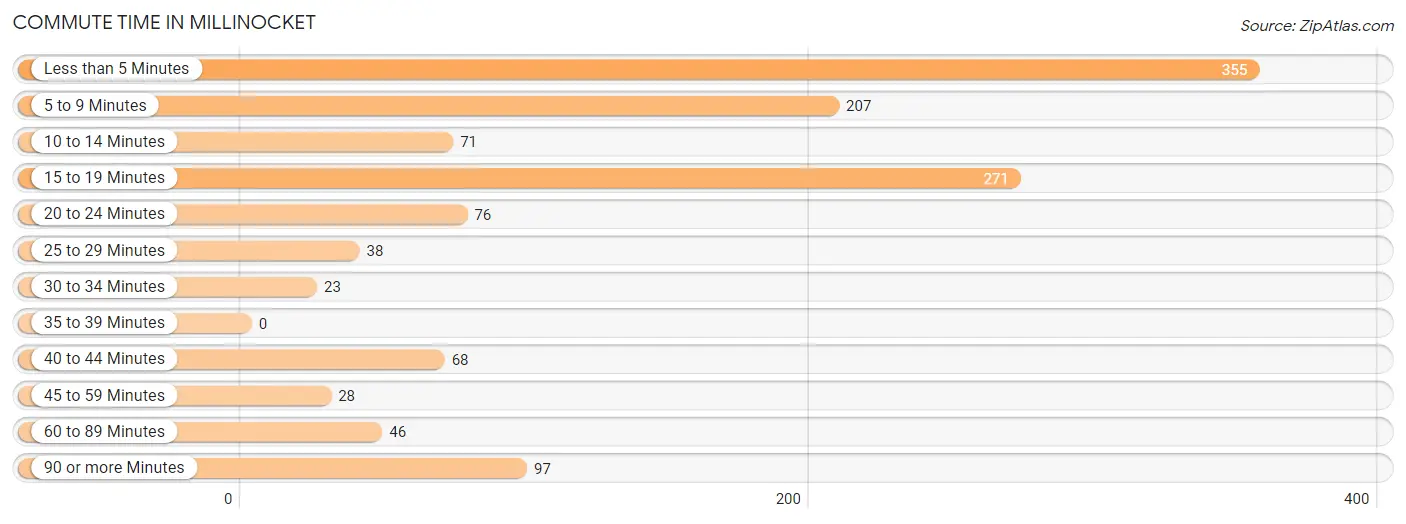
| Commute Time | # Commuters | % Commuters |
| Less than 5 Minutes | 355 | 27.7% |
| 5 to 9 Minutes | 207 | 16.2% |
| 10 to 14 Minutes | 71 | 5.6% |
| 15 to 19 Minutes | 271 | 21.2% |
| 20 to 24 Minutes | 76 | 5.9% |
| 25 to 29 Minutes | 38 | 3.0% |
| 30 to 34 Minutes | 23 | 1.8% |
| 35 to 39 Minutes | 0 | 0.0% |
| 40 to 44 Minutes | 68 | 5.3% |
| 45 to 59 Minutes | 28 | 2.2% |
| 60 to 89 Minutes | 46 | 3.6% |
| 90 or more Minutes | 97 | 7.6% |
Commute Time by Sex in Millinocket
The most common commute times in Millinocket are 15 to 19 minutes (171 commuters, 28.4%) for males and less than 5 minutes (272 commuters, 40.1%) for females.
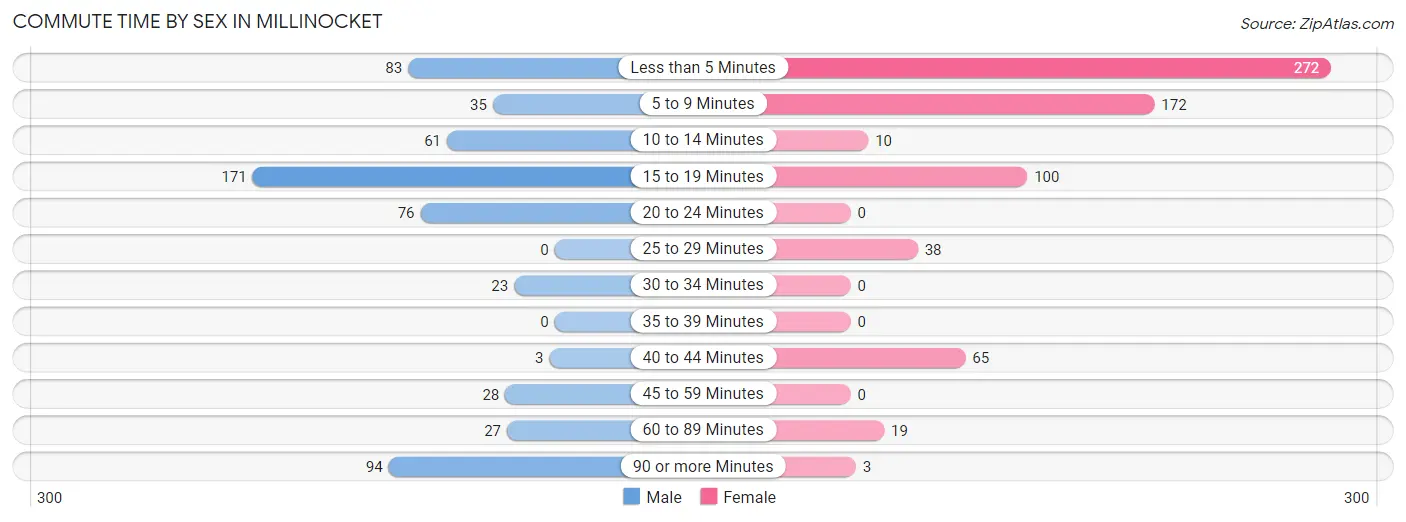
| Commute Time | Male | Female |
| Less than 5 Minutes | 83 (13.8%) | 272 (40.1%) |
| 5 to 9 Minutes | 35 (5.8%) | 172 (25.3%) |
| 10 to 14 Minutes | 61 (10.2%) | 10 (1.5%) |
| 15 to 19 Minutes | 171 (28.4%) | 100 (14.7%) |
| 20 to 24 Minutes | 76 (12.7%) | 0 (0.0%) |
| 25 to 29 Minutes | 0 (0.0%) | 38 (5.6%) |
| 30 to 34 Minutes | 23 (3.8%) | 0 (0.0%) |
| 35 to 39 Minutes | 0 (0.0%) | 0 (0.0%) |
| 40 to 44 Minutes | 3 (0.5%) | 65 (9.6%) |
| 45 to 59 Minutes | 28 (4.7%) | 0 (0.0%) |
| 60 to 89 Minutes | 27 (4.5%) | 19 (2.8%) |
| 90 or more Minutes | 94 (15.6%) | 3 (0.4%) |
Time of Departure to Work by Sex in Millinocket
The most frequent times of departure to work in Millinocket are 7:00 AM to 7:29 AM (197, 32.8%) for males and 8:00 AM to 8:29 AM (153, 22.5%) for females.
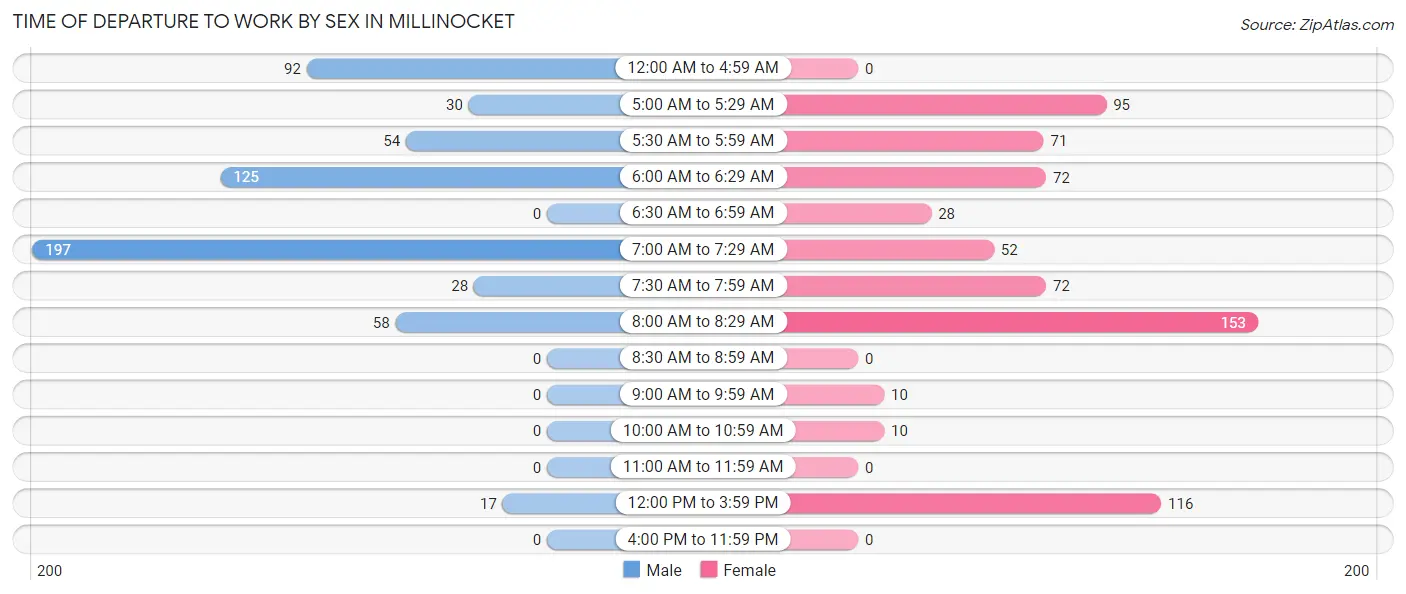
| Time of Departure | Male | Female |
| 12:00 AM to 4:59 AM | 92 (15.3%) | 0 (0.0%) |
| 5:00 AM to 5:29 AM | 30 (5.0%) | 95 (14.0%) |
| 5:30 AM to 5:59 AM | 54 (9.0%) | 71 (10.5%) |
| 6:00 AM to 6:29 AM | 125 (20.8%) | 72 (10.6%) |
| 6:30 AM to 6:59 AM | 0 (0.0%) | 28 (4.1%) |
| 7:00 AM to 7:29 AM | 197 (32.8%) | 52 (7.7%) |
| 7:30 AM to 7:59 AM | 28 (4.7%) | 72 (10.6%) |
| 8:00 AM to 8:29 AM | 58 (9.7%) | 153 (22.5%) |
| 8:30 AM to 8:59 AM | 0 (0.0%) | 0 (0.0%) |
| 9:00 AM to 9:59 AM | 0 (0.0%) | 10 (1.5%) |
| 10:00 AM to 10:59 AM | 0 (0.0%) | 10 (1.5%) |
| 11:00 AM to 11:59 AM | 0 (0.0%) | 0 (0.0%) |
| 12:00 PM to 3:59 PM | 17 (2.8%) | 116 (17.1%) |
| 4:00 PM to 11:59 PM | 0 (0.0%) | 0 (0.0%) |
| Total | 601 (100.0%) | 679 (100.0%) |
Housing Occupancy in Millinocket
Occupancy by Ownership in Millinocket
Of the total 2,247 dwellings in Millinocket, owner-occupied units account for 1,864 (83.0%), while renter-occupied units make up 383 (17.0%).
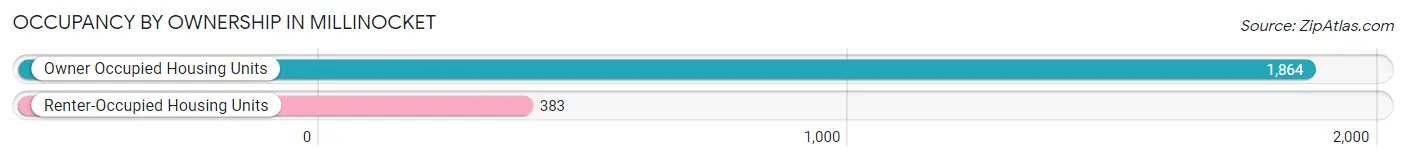
| Occupancy | # Housing Units | % Housing Units |
| Owner Occupied Housing Units | 1,864 | 83.0% |
| Renter-Occupied Housing Units | 383 | 17.0% |
| Total Occupied Housing Units | 2,247 | 100.0% |
Occupancy by Household Size in Millinocket
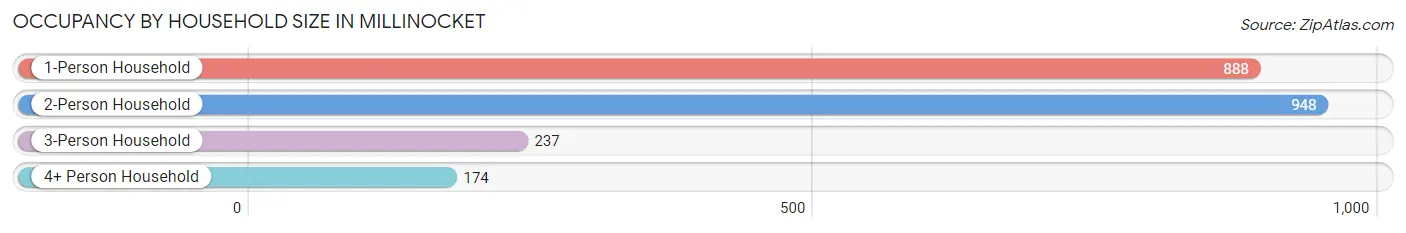
| Household Size | # Housing Units | % Housing Units |
| 1-Person Household | 888 | 39.5% |
| 2-Person Household | 948 | 42.2% |
| 3-Person Household | 237 | 10.5% |
| 4+ Person Household | 174 | 7.7% |
| Total Housing Units | 2,247 | 100.0% |
Occupancy by Ownership by Household Size in Millinocket
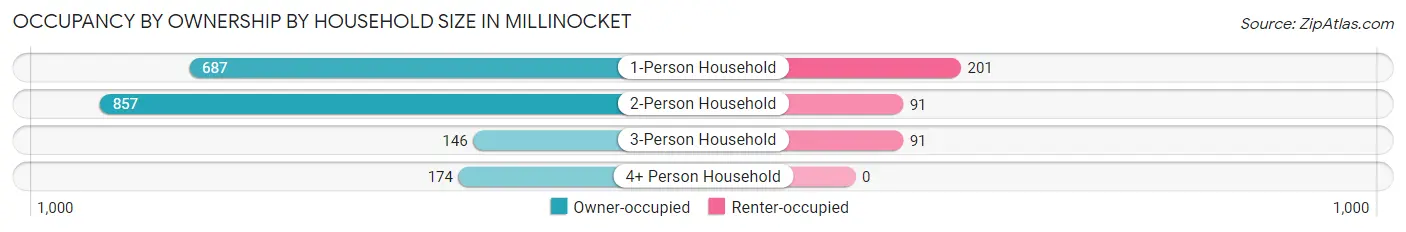
| Household Size | Owner-occupied | Renter-occupied |
| 1-Person Household | 687 (77.4%) | 201 (22.6%) |
| 2-Person Household | 857 (90.4%) | 91 (9.6%) |
| 3-Person Household | 146 (61.6%) | 91 (38.4%) |
| 4+ Person Household | 174 (100.0%) | 0 (0.0%) |
| Total Housing Units | 1,864 (83.0%) | 383 (17.0%) |
Occupancy by Educational Attainment in Millinocket
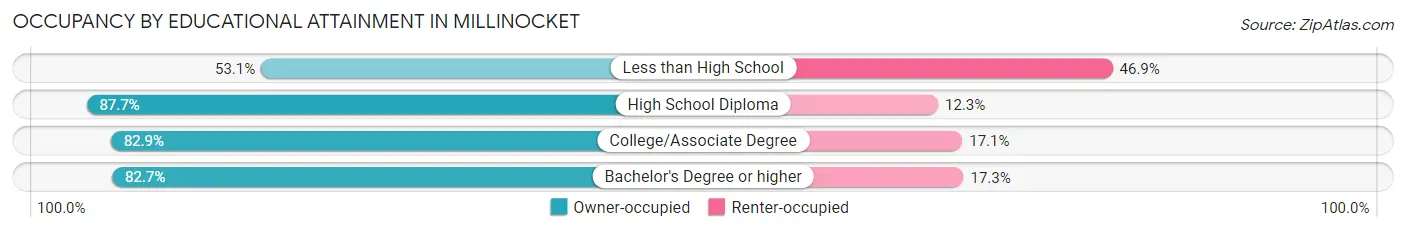
| Household Size | Owner-occupied | Renter-occupied |
| Less than High School | 85 (53.1%) | 75 (46.9%) |
| High School Diploma | 901 (87.7%) | 126 (12.3%) |
| College/Associate Degree | 568 (82.9%) | 117 (17.1%) |
| Bachelor's Degree or higher | 310 (82.7%) | 65 (17.3%) |
Occupancy by Age of Householder in Millinocket
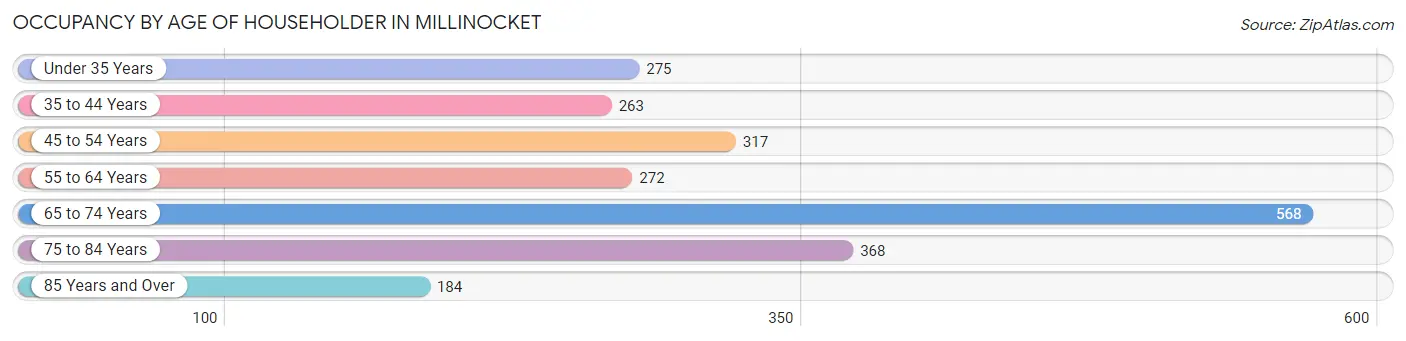
| Age Bracket | # Households | % Households |
| Under 35 Years | 275 | 12.2% |
| 35 to 44 Years | 263 | 11.7% |
| 45 to 54 Years | 317 | 14.1% |
| 55 to 64 Years | 272 | 12.1% |
| 65 to 74 Years | 568 | 25.3% |
| 75 to 84 Years | 368 | 16.4% |
| 85 Years and Over | 184 | 8.2% |
| Total | 2,247 | 100.0% |
Housing Finances in Millinocket
Median Income by Occupancy in Millinocket
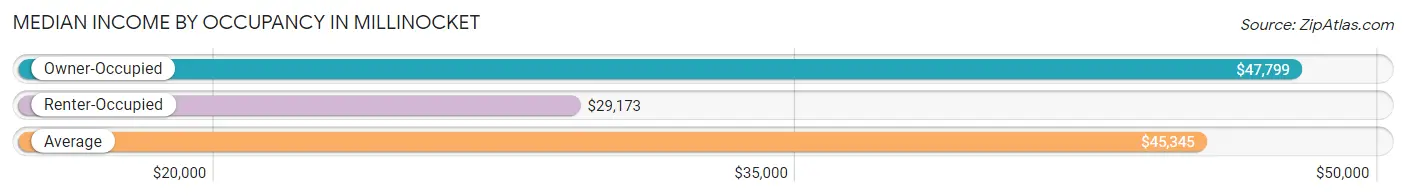
| Occupancy Type | # Households | Median Income |
| Owner-Occupied | 1,864 (83.0%) | $47,799 |
| Renter-Occupied | 383 (17.0%) | $29,173 |
| Average | 2,247 (100.0%) | $45,345 |
Occupancy by Householder Income Bracket in Millinocket
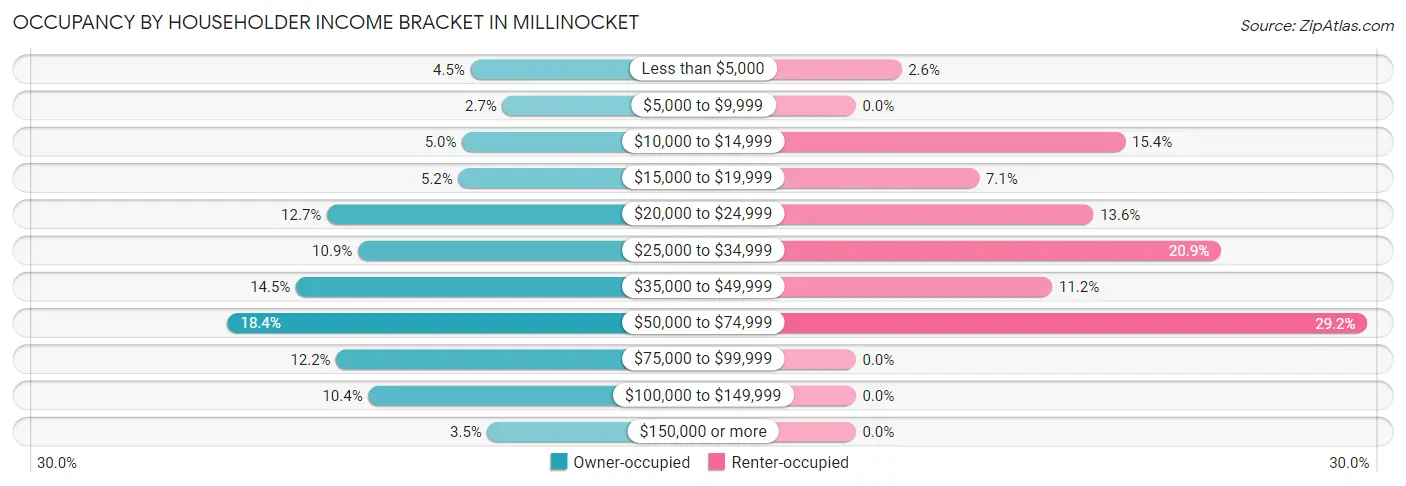
| Income Bracket | Owner-occupied | Renter-occupied |
| Less than $5,000 | 84 (4.5%) | 10 (2.6%) |
| $5,000 to $9,999 | 50 (2.7%) | 0 (0.0%) |
| $10,000 to $14,999 | 93 (5.0%) | 59 (15.4%) |
| $15,000 to $19,999 | 97 (5.2%) | 27 (7.0%) |
| $20,000 to $24,999 | 237 (12.7%) | 52 (13.6%) |
| $25,000 to $34,999 | 204 (10.9%) | 80 (20.9%) |
| $35,000 to $49,999 | 270 (14.5%) | 43 (11.2%) |
| $50,000 to $74,999 | 343 (18.4%) | 112 (29.2%) |
| $75,000 to $99,999 | 227 (12.2%) | 0 (0.0%) |
| $100,000 to $149,999 | 193 (10.3%) | 0 (0.0%) |
| $150,000 or more | 66 (3.5%) | 0 (0.0%) |
| Total | 1,864 (100.0%) | 383 (100.0%) |
Monthly Housing Cost Tiers in Millinocket
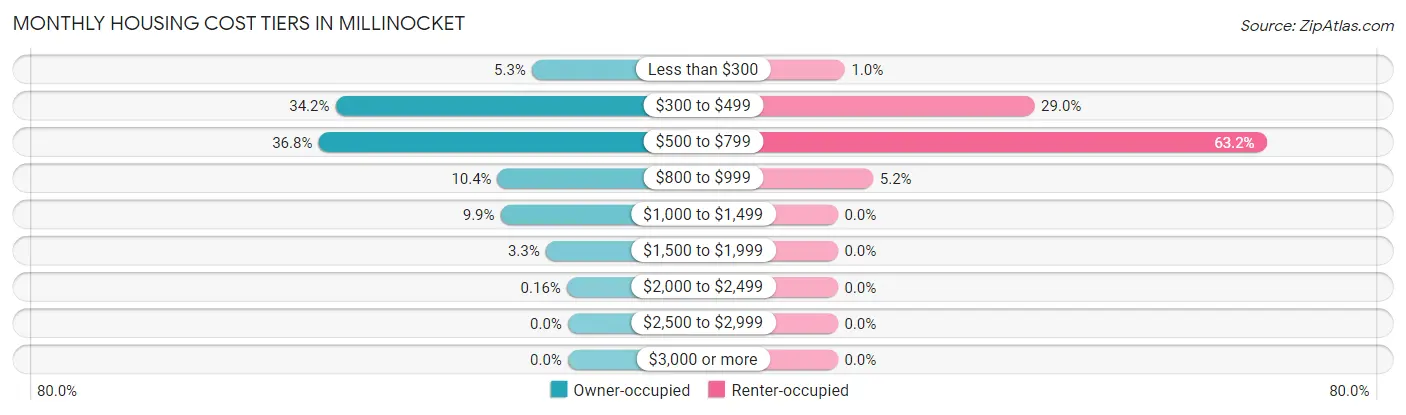
| Monthly Cost | Owner-occupied | Renter-occupied |
| Less than $300 | 99 (5.3%) | 4 (1.0%) |
| $300 to $499 | 638 (34.2%) | 111 (29.0%) |
| $500 to $799 | 685 (36.7%) | 242 (63.2%) |
| $800 to $999 | 193 (10.3%) | 20 (5.2%) |
| $1,000 to $1,499 | 185 (9.9%) | 0 (0.0%) |
| $1,500 to $1,999 | 61 (3.3%) | 0 (0.0%) |
| $2,000 to $2,499 | 3 (0.2%) | 0 (0.0%) |
| $2,500 to $2,999 | 0 (0.0%) | 0 (0.0%) |
| $3,000 or more | 0 (0.0%) | 0 (0.0%) |
| Total | 1,864 (100.0%) | 383 (100.0%) |
Physical Housing Characteristics in Millinocket
Housing Structures in Millinocket
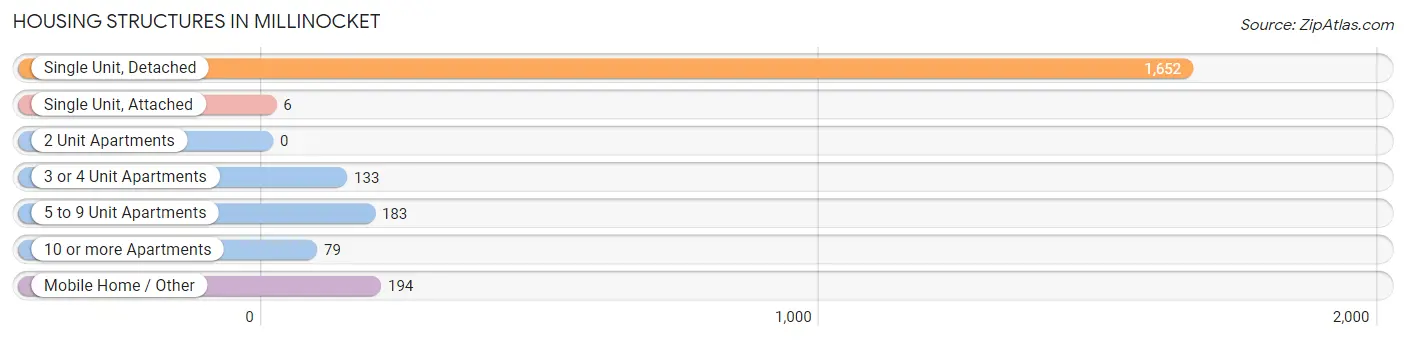
| Structure Type | # Housing Units | % Housing Units |
| Single Unit, Detached | 1,652 | 73.5% |
| Single Unit, Attached | 6 | 0.3% |
| 2 Unit Apartments | 0 | 0.0% |
| 3 or 4 Unit Apartments | 133 | 5.9% |
| 5 to 9 Unit Apartments | 183 | 8.1% |
| 10 or more Apartments | 79 | 3.5% |
| Mobile Home / Other | 194 | 8.6% |
| Total | 2,247 | 100.0% |
Housing Structures by Occupancy in Millinocket
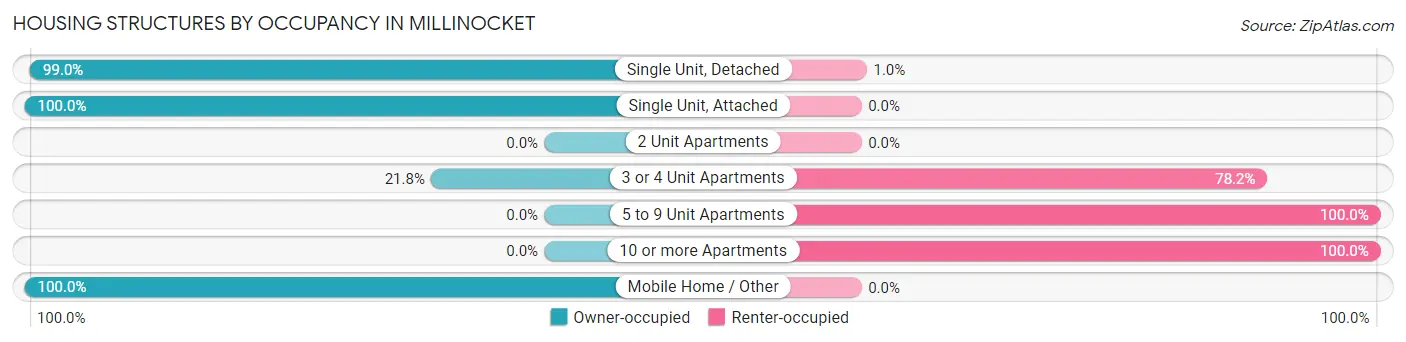
| Structure Type | Owner-occupied | Renter-occupied |
| Single Unit, Detached | 1,635 (99.0%) | 17 (1.0%) |
| Single Unit, Attached | 6 (100.0%) | 0 (0.0%) |
| 2 Unit Apartments | 0 (0.0%) | 0 (0.0%) |
| 3 or 4 Unit Apartments | 29 (21.8%) | 104 (78.2%) |
| 5 to 9 Unit Apartments | 0 (0.0%) | 183 (100.0%) |
| 10 or more Apartments | 0 (0.0%) | 79 (100.0%) |
| Mobile Home / Other | 194 (100.0%) | 0 (0.0%) |
| Total | 1,864 (83.0%) | 383 (17.0%) |
Housing Structures by Number of Rooms in Millinocket
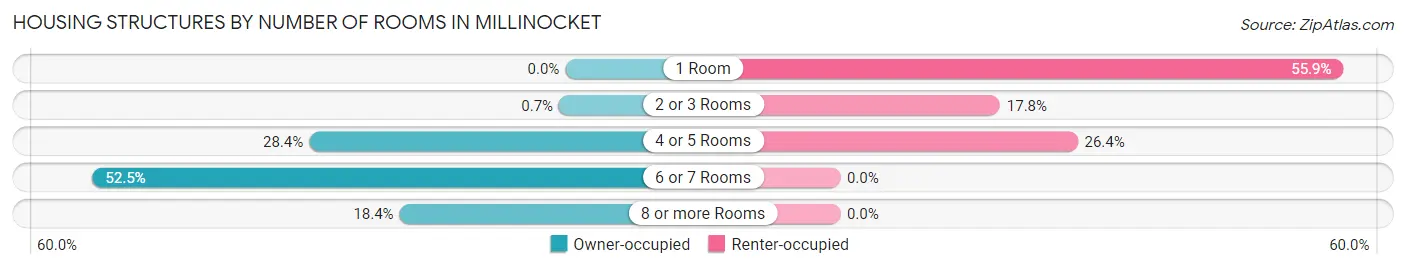
| Number of Rooms | Owner-occupied | Renter-occupied |
| 1 Room | 0 (0.0%) | 214 (55.9%) |
| 2 or 3 Rooms | 13 (0.7%) | 68 (17.7%) |
| 4 or 5 Rooms | 530 (28.4%) | 101 (26.4%) |
| 6 or 7 Rooms | 978 (52.5%) | 0 (0.0%) |
| 8 or more Rooms | 343 (18.4%) | 0 (0.0%) |
| Total | 1,864 (100.0%) | 383 (100.0%) |
Housing Structure by Heating Type in Millinocket
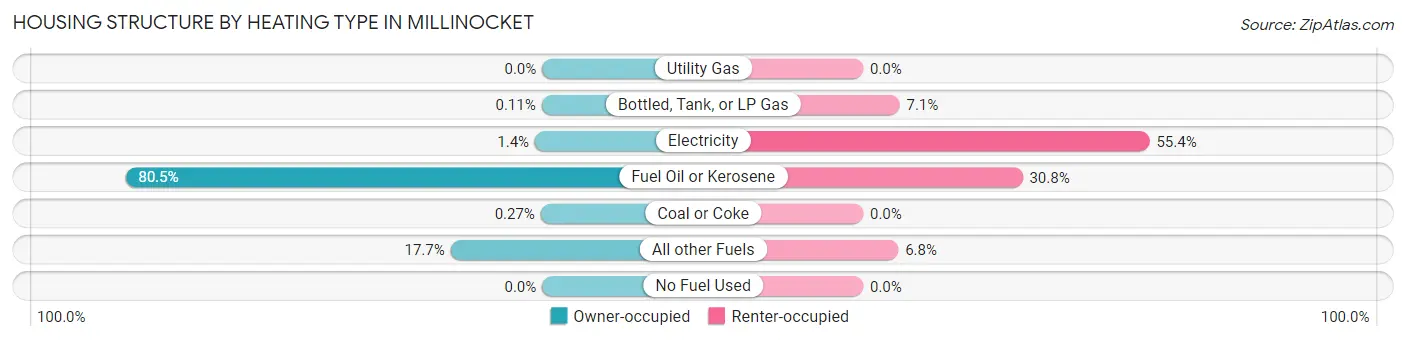
| Heating Type | Owner-occupied | Renter-occupied |
| Utility Gas | 0 (0.0%) | 0 (0.0%) |
| Bottled, Tank, or LP Gas | 2 (0.1%) | 27 (7.0%) |
| Electricity | 26 (1.4%) | 212 (55.3%) |
| Fuel Oil or Kerosene | 1,501 (80.5%) | 118 (30.8%) |
| Coal or Coke | 5 (0.3%) | 0 (0.0%) |
| All other Fuels | 330 (17.7%) | 26 (6.8%) |
| No Fuel Used | 0 (0.0%) | 0 (0.0%) |
| Total | 1,864 (100.0%) | 383 (100.0%) |
Household Vehicle Usage in Millinocket
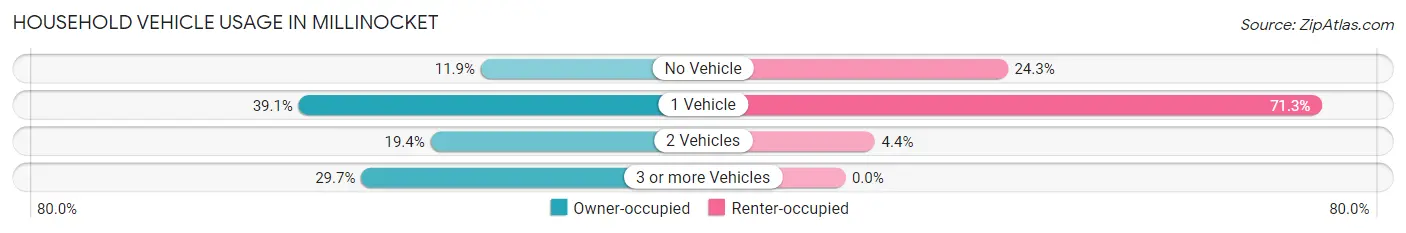
| Vehicles per Household | Owner-occupied | Renter-occupied |
| No Vehicle | 221 (11.9%) | 93 (24.3%) |
| 1 Vehicle | 728 (39.1%) | 273 (71.3%) |
| 2 Vehicles | 361 (19.4%) | 17 (4.4%) |
| 3 or more Vehicles | 554 (29.7%) | 0 (0.0%) |
| Total | 1,864 (100.0%) | 383 (100.0%) |
Real Estate & Mortgages in Millinocket
Real Estate and Mortgage Overview in Millinocket
| Characteristic | Without Mortgage | With Mortgage |
| Housing Units | 1,043 | 821 |
| Median Property Value | $77,900 | $104,600 |
| Median Household Income | $42,577 | $56 |
| Monthly Housing Costs | $409 | $0 |
| Real Estate Taxes | $1,160 | $0 |
Property Value by Mortgage Status in Millinocket
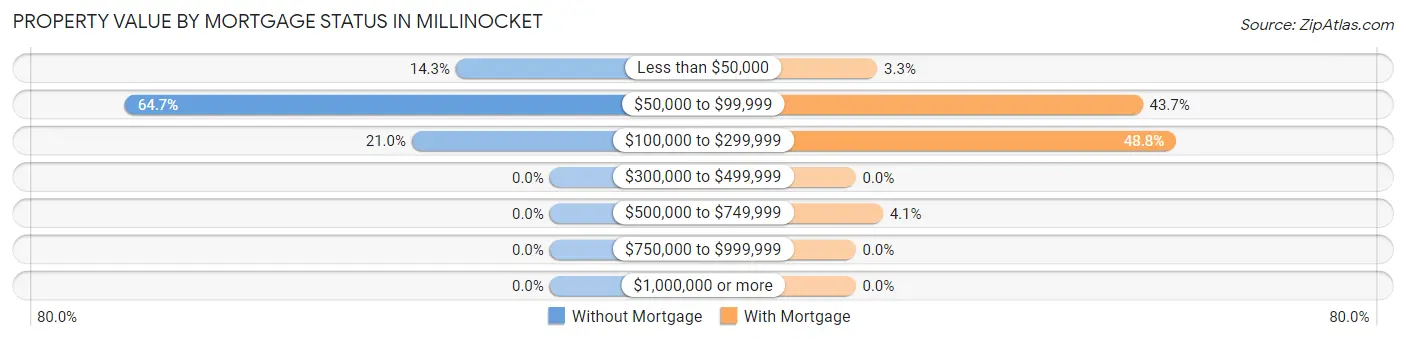
| Property Value | Without Mortgage | With Mortgage |
| Less than $50,000 | 149 (14.3%) | 27 (3.3%) |
| $50,000 to $99,999 | 675 (64.7%) | 359 (43.7%) |
| $100,000 to $299,999 | 219 (21.0%) | 401 (48.8%) |
| $300,000 to $499,999 | 0 (0.0%) | 0 (0.0%) |
| $500,000 to $749,999 | 0 (0.0%) | 34 (4.1%) |
| $750,000 to $999,999 | 0 (0.0%) | 0 (0.0%) |
| $1,000,000 or more | 0 (0.0%) | 0 (0.0%) |
| Total | 1,043 (100.0%) | 821 (100.0%) |
Household Income by Mortgage Status in Millinocket
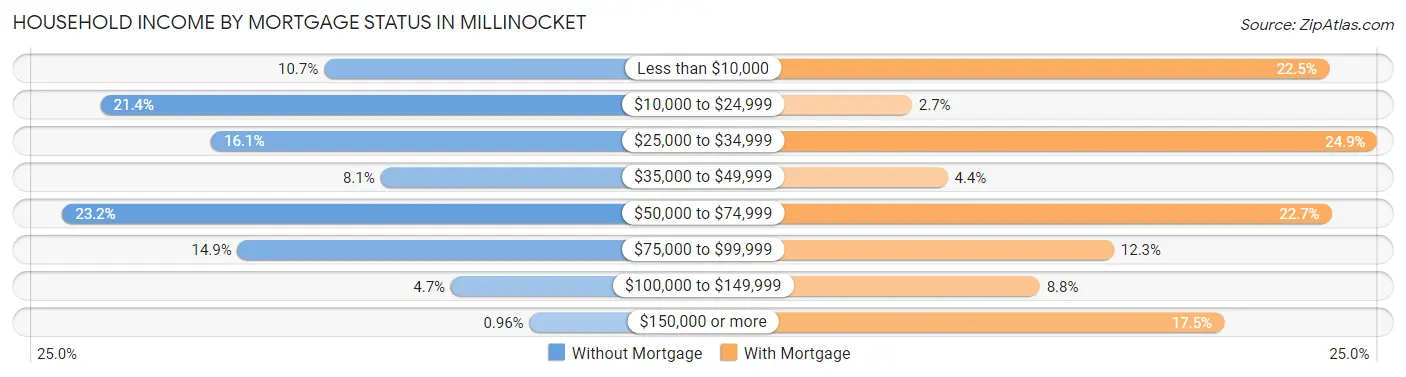
| Household Income | Without Mortgage | With Mortgage |
| Less than $10,000 | 112 (10.7%) | 185 (22.5%) |
| $10,000 to $24,999 | 223 (21.4%) | 22 (2.7%) |
| $25,000 to $34,999 | 168 (16.1%) | 204 (24.8%) |
| $35,000 to $49,999 | 84 (8.1%) | 36 (4.4%) |
| $50,000 to $74,999 | 242 (23.2%) | 186 (22.7%) |
| $75,000 to $99,999 | 155 (14.9%) | 101 (12.3%) |
| $100,000 to $149,999 | 49 (4.7%) | 72 (8.8%) |
| $150,000 or more | 10 (1.0%) | 144 (17.5%) |
| Total | 1,043 (100.0%) | 821 (100.0%) |
Property Value to Household Income Ratio in Millinocket
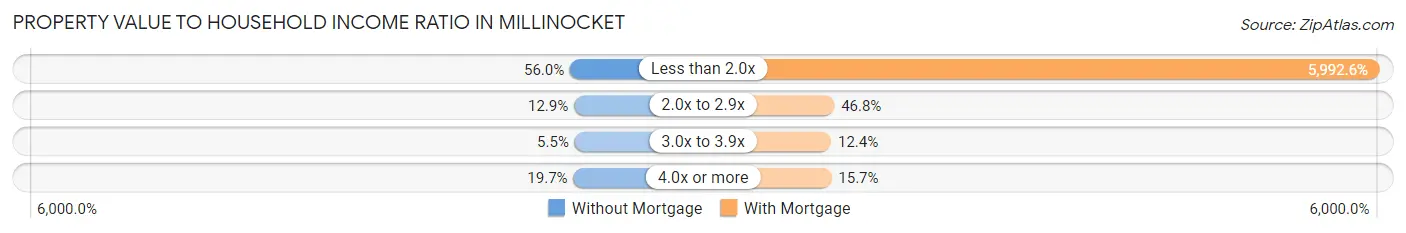
| Value-to-Income Ratio | Without Mortgage | With Mortgage |
| Less than 2.0x | 584 (56.0%) | 49,199 (5,992.6%) |
| 2.0x to 2.9x | 135 (12.9%) | 384 (46.8%) |
| 3.0x to 3.9x | 57 (5.5%) | 102 (12.4%) |
| 4.0x or more | 205 (19.7%) | 129 (15.7%) |
| Total | 1,043 (100.0%) | 821 (100.0%) |
Real Estate Taxes by Mortgage Status in Millinocket
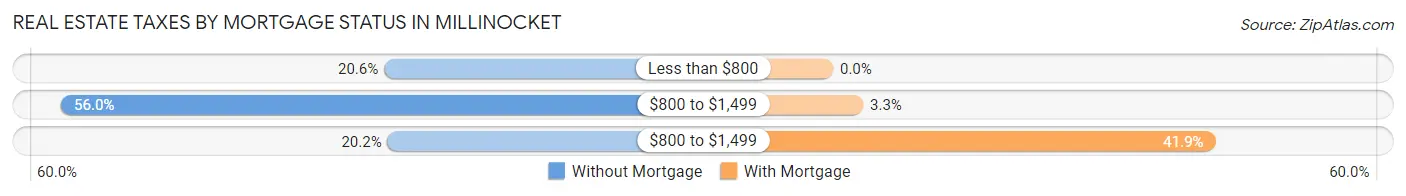
| Property Taxes | Without Mortgage | With Mortgage |
| Less than $800 | 215 (20.6%) | 0 (0.0%) |
| $800 to $1,499 | 584 (56.0%) | 27 (3.3%) |
| $800 to $1,499 | 211 (20.2%) | 344 (41.9%) |
| Total | 1,043 (100.0%) | 821 (100.0%) |
Health & Disability in Millinocket
Health Insurance Coverage by Age in Millinocket
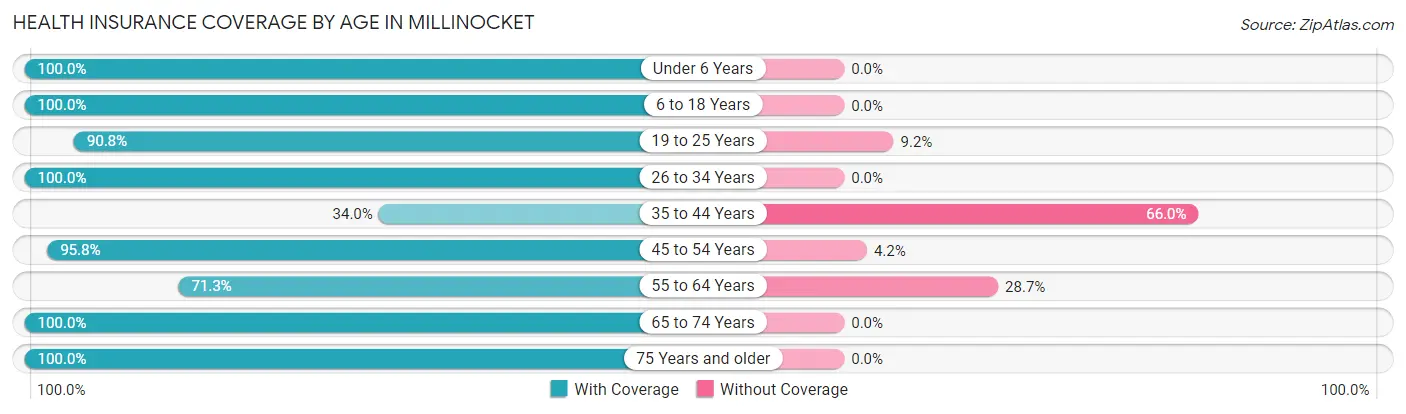
| Age Bracket | With Coverage | Without Coverage |
| Under 6 Years | 248 (100.0%) | 0 (0.0%) |
| 6 to 18 Years | 322 (100.0%) | 0 (0.0%) |
| 19 to 25 Years | 168 (90.8%) | 17 (9.2%) |
| 26 to 34 Years | 421 (100.0%) | 0 (0.0%) |
| 35 to 44 Years | 105 (34.0%) | 204 (66.0%) |
| 45 to 54 Years | 476 (95.8%) | 21 (4.2%) |
| 55 to 64 Years | 420 (71.3%) | 169 (28.7%) |
| 65 to 74 Years | 871 (100.0%) | 0 (0.0%) |
| 75 Years and older | 649 (100.0%) | 0 (0.0%) |
| Total | 3,680 (89.9%) | 411 (10.1%) |
Health Insurance Coverage by Citizenship Status in Millinocket

| Citizenship Status | With Coverage | Without Coverage |
| Native Born | 248 (100.0%) | 0 (0.0%) |
| Foreign Born, Citizen | 322 (100.0%) | 0 (0.0%) |
| Foreign Born, not a Citizen | 168 (90.8%) | 17 (9.2%) |
Health Insurance Coverage by Household Income in Millinocket
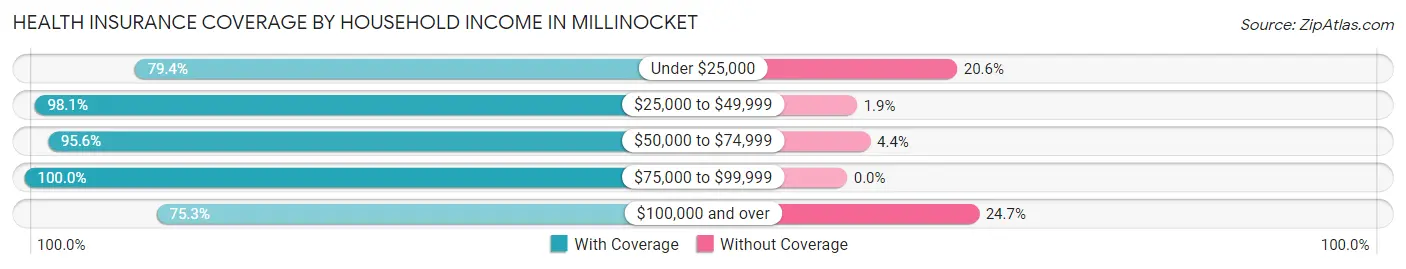
| Household Income | With Coverage | Without Coverage |
| Under $25,000 | 778 (79.4%) | 202 (20.6%) |
| $25,000 to $49,999 | 896 (98.1%) | 17 (1.9%) |
| $50,000 to $74,999 | 855 (95.6%) | 39 (4.4%) |
| $75,000 to $99,999 | 685 (100.0%) | 0 (0.0%) |
| $100,000 and over | 466 (75.3%) | 153 (24.7%) |
Public vs Private Health Insurance Coverage by Age in Millinocket
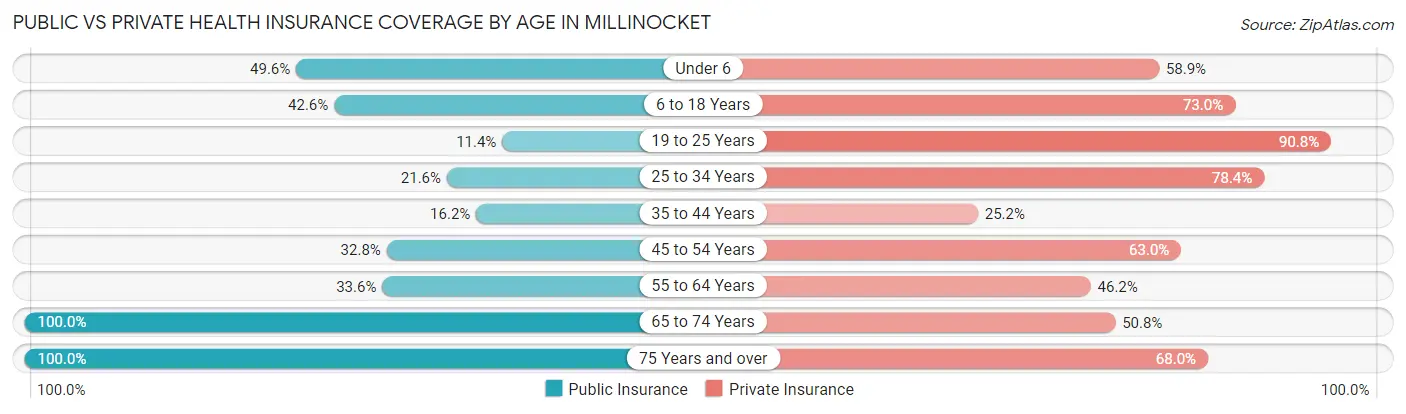
| Age Bracket | Public Insurance | Private Insurance |
| Under 6 | 123 (49.6%) | 146 (58.9%) |
| 6 to 18 Years | 137 (42.5%) | 235 (73.0%) |
| 19 to 25 Years | 21 (11.4%) | 168 (90.8%) |
| 25 to 34 Years | 91 (21.6%) | 330 (78.4%) |
| 35 to 44 Years | 50 (16.2%) | 78 (25.2%) |
| 45 to 54 Years | 163 (32.8%) | 313 (63.0%) |
| 55 to 64 Years | 198 (33.6%) | 272 (46.2%) |
| 65 to 74 Years | 871 (100.0%) | 442 (50.7%) |
| 75 Years and over | 649 (100.0%) | 441 (67.9%) |
| Total | 2,303 (56.3%) | 2,425 (59.3%) |
Disability Status by Sex by Age in Millinocket
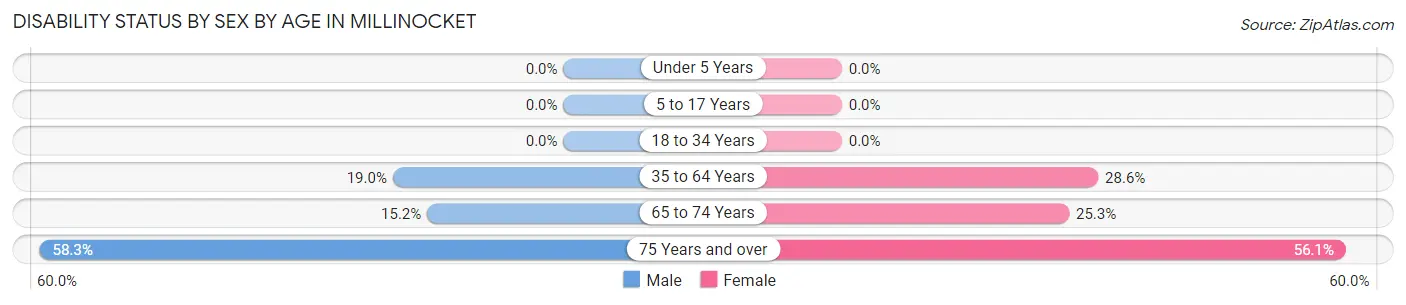
| Age Bracket | Male | Female |
| Under 5 Years | 0 (0.0%) | 0 (0.0%) |
| 5 to 17 Years | 0 (0.0%) | 0 (0.0%) |
| 18 to 34 Years | 0 (0.0%) | 0 (0.0%) |
| 35 to 64 Years | 126 (19.0%) | 209 (28.5%) |
| 65 to 74 Years | 71 (15.2%) | 102 (25.3%) |
| 75 Years and over | 98 (58.3%) | 270 (56.1%) |
Disability Class by Sex by Age in Millinocket
Disability Class: Hearing Difficulty
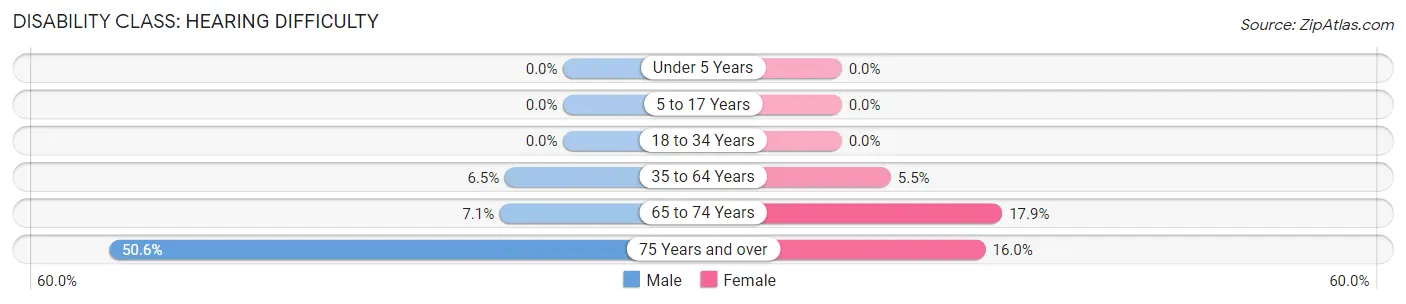
| Age Bracket | Male | Female |
| Under 5 Years | 0 (0.0%) | 0 (0.0%) |
| 5 to 17 Years | 0 (0.0%) | 0 (0.0%) |
| 18 to 34 Years | 0 (0.0%) | 0 (0.0%) |
| 35 to 64 Years | 43 (6.5%) | 40 (5.5%) |
| 65 to 74 Years | 33 (7.0%) | 72 (17.9%) |
| 75 Years and over | 85 (50.6%) | 77 (16.0%) |
Disability Class: Vision Difficulty
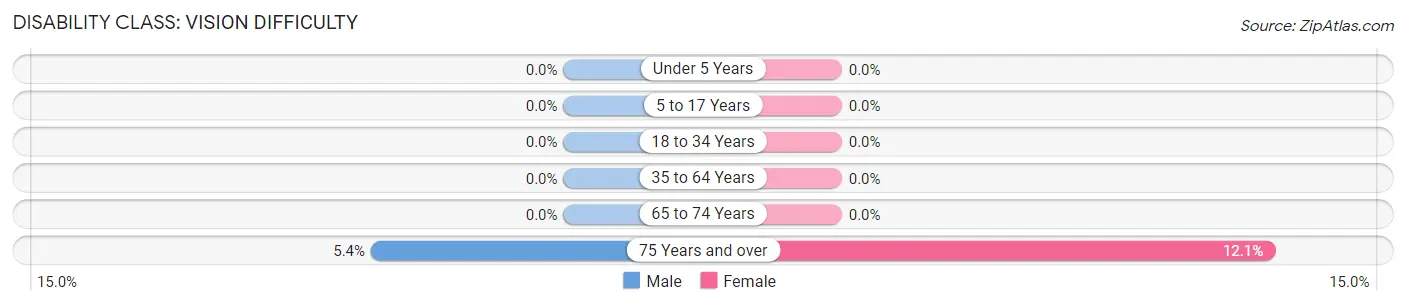
| Age Bracket | Male | Female |
| Under 5 Years | 0 (0.0%) | 0 (0.0%) |
| 5 to 17 Years | 0 (0.0%) | 0 (0.0%) |
| 18 to 34 Years | 0 (0.0%) | 0 (0.0%) |
| 35 to 64 Years | 0 (0.0%) | 0 (0.0%) |
| 65 to 74 Years | 0 (0.0%) | 0 (0.0%) |
| 75 Years and over | 9 (5.4%) | 58 (12.1%) |
Disability Class: Cognitive Difficulty
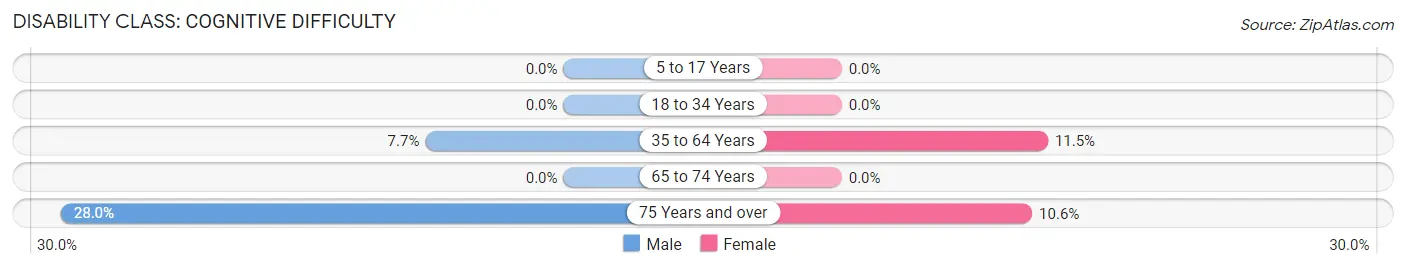
| Age Bracket | Male | Female |
| 5 to 17 Years | 0 (0.0%) | 0 (0.0%) |
| 18 to 34 Years | 0 (0.0%) | 0 (0.0%) |
| 35 to 64 Years | 51 (7.7%) | 84 (11.5%) |
| 65 to 74 Years | 0 (0.0%) | 0 (0.0%) |
| 75 Years and over | 47 (28.0%) | 51 (10.6%) |
Disability Class: Ambulatory Difficulty
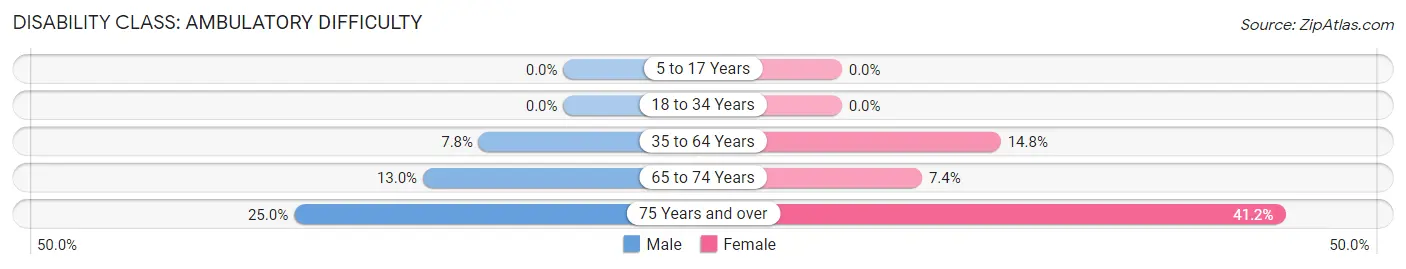
| Age Bracket | Male | Female |
| 5 to 17 Years | 0 (0.0%) | 0 (0.0%) |
| 18 to 34 Years | 0 (0.0%) | 0 (0.0%) |
| 35 to 64 Years | 52 (7.8%) | 108 (14.7%) |
| 65 to 74 Years | 61 (13.0%) | 30 (7.4%) |
| 75 Years and over | 42 (25.0%) | 198 (41.2%) |
Disability Class: Self-Care Difficulty
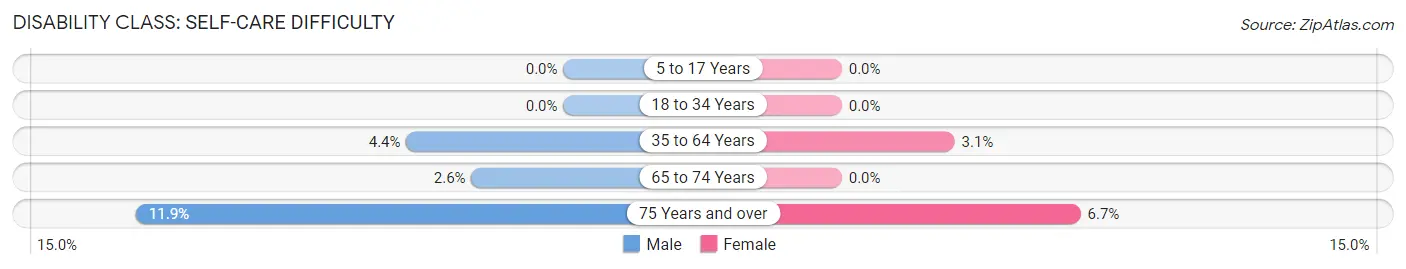
| Age Bracket | Male | Female |
| 5 to 17 Years | 0 (0.0%) | 0 (0.0%) |
| 18 to 34 Years | 0 (0.0%) | 0 (0.0%) |
| 35 to 64 Years | 29 (4.4%) | 23 (3.1%) |
| 65 to 74 Years | 12 (2.6%) | 0 (0.0%) |
| 75 Years and over | 20 (11.9%) | 32 (6.7%) |
Technology Access in Millinocket
Computing Device Access in Millinocket
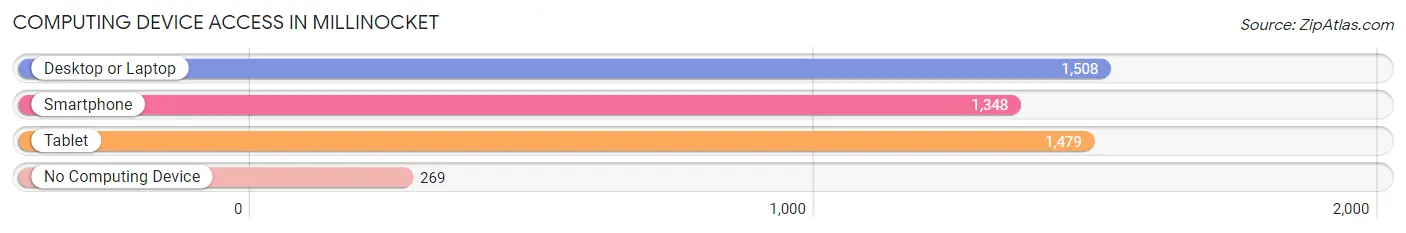
| Device Type | # Households | % Households |
| Desktop or Laptop | 1,508 | 67.1% |
| Smartphone | 1,348 | 60.0% |
| Tablet | 1,479 | 65.8% |
| No Computing Device | 269 | 12.0% |
| Total | 2,247 | 100.0% |
Internet Access in Millinocket
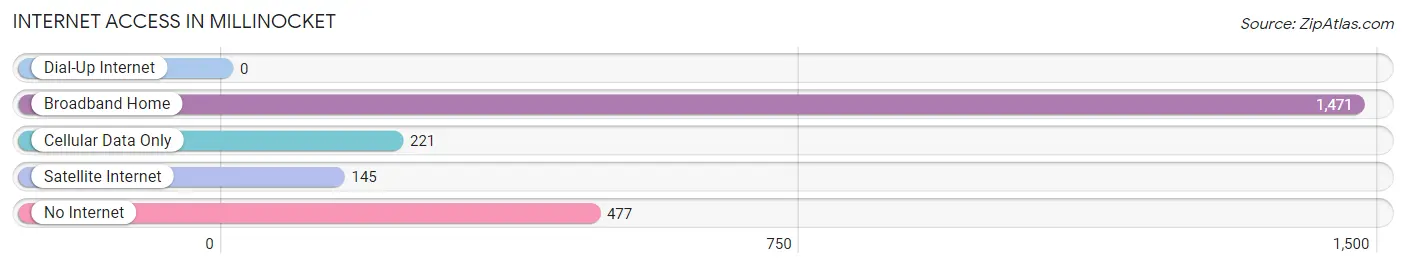
| Internet Type | # Households | % Households |
| Dial-Up Internet | 0 | 0.0% |
| Broadband Home | 1,471 | 65.5% |
| Cellular Data Only | 221 | 9.8% |
| Satellite Internet | 145 | 6.5% |
| No Internet | 477 | 21.2% |
| Total | 2,247 | 100.0% |
Millinocket Summary
Millinocket, Maine is a small town located in the northern part of the state, in Penobscot County. It is situated on the banks of the Penobscot River, and is surrounded by the Katahdin Woods and Waters National Monument. The town has a population of 4,506 people, according to the 2010 census.
History
Millinocket was first settled in 1829 by a group of settlers from New Hampshire. The town was originally called "Millinocket Plantation," and was incorporated in 1859. The name Millinocket is derived from the Abenaki word "Munalokte," which means "place of many islands."
The town was initially a lumbering and milling center, and the first sawmill was built in 1845. The town grew rapidly in the late 19th century, and by the early 20th century, it was home to several large paper mills. The Great Northern Paper Company was the largest employer in the town, and it employed over 2,000 people at its peak.
The paper industry in Millinocket began to decline in the late 20th century, and the Great Northern Paper Company closed in 2008. The town has since been transitioning to a tourism-based economy, and is home to several outdoor recreation businesses.
Geography
Millinocket is located in the northern part of Maine, in Penobscot County. It is situated on the banks of the Penobscot River, and is surrounded by the Katahdin Woods and Waters National Monument. The town is located approximately 40 miles north of Bangor, and is accessible by car via Interstate 95.
The town has a total area of 11.2 square miles, of which 10.9 square miles is land and 0.3 square miles is water. The town is located in a mountainous region, and is home to several lakes and rivers. The highest point in the town is Mount Katahdin, which is the highest peak in Maine.
Economy
Millinocket's economy is largely based on tourism and outdoor recreation. The town is home to several outdoor recreation businesses, including whitewater rafting, fishing, and hiking. The town is also home to several restaurants, hotels, and other businesses that cater to tourists.
The town is also home to several manufacturing businesses, including a paper mill and a wood products plant. The paper mill is owned by the Katahdin Paper Company, and the wood products plant is owned by the Millinocket Wood Products Company.
Demographics
According to the 2010 census, Millinocket has a population of 4,506 people. The town has a median household income of $37,917, and a median family income of $45,938. The town has a poverty rate of 17.3%, and the unemployment rate is 6.2%.
The town is predominantly white, with 92.3% of the population identifying as white. The town also has a small Native American population, with 1.3% of the population identifying as Native American. The town also has a small Hispanic population, with 1.2% of the population identifying as Hispanic or Latino.
Conclusion
Millinocket, Maine is a small town located in the northern part of the state, in Penobscot County. It was first settled in 1829, and was initially a lumbering and milling center. The town has since transitioned to a tourism-based economy, and is home to several outdoor recreation businesses. The town has a population of 4,506 people, and is predominantly white. The town also has a small Native American and Hispanic population. The town has a median household income of $37,917, and a poverty rate of 17.3%.
Common Questions
What is Per Capita Income in Millinocket?
Per Capita income in Millinocket is $29,872.
What is the Median Family Income in Millinocket?
Median Family Income in Millinocket is $59,517.
What is the Median Household income in Millinocket?
Median Household Income in Millinocket is $45,345.
What is Inequality or Gini Index in Millinocket?
Inequality or Gini Index in Millinocket is 0.44.
What is the Total Population of Millinocket?
Total Population of Millinocket is 4,136.
What is the Total Male Population of Millinocket?
Total Male Population of Millinocket is 1,957.
What is the Total Female Population of Millinocket?
Total Female Population of Millinocket is 2,179.
What is the Ratio of Males per 100 Females in Millinocket?
There are 89.81 Males per 100 Females in Millinocket.
What is the Ratio of Females per 100 Males in Millinocket?
There are 111.34 Females per 100 Males in Millinocket.
What is the Median Population Age in Millinocket?
Median Population Age in Millinocket is 57.5 Years.
What is the Average Family Size in Millinocket
Average Family Size in Millinocket is 2.4 People.
What is the Average Household Size in Millinocket
Average Household Size in Millinocket is 1.8 People.
How Large is the Labor Force in Millinocket?
There are 1,562 People in the Labor Forcein in Millinocket.
What is the Percentage of People in the Labor Force in Millinocket?
43.8% of People are in the Labor Force in Millinocket.
What is the Unemployment Rate in Millinocket?
Unemployment Rate in Millinocket is 8.9%.