West Kennebunk, ME Map & Demographics
West Kennebunk Map
West Kennebunk Overview
$38,395
PER CAPITA INCOME
$111,563
AVG FAMILY INCOME
$90,104
AVG HOUSEHOLD INCOME
46.9%
WAGE / INCOME GAP [ % ]
53.1¢/ $1
WAGE / INCOME GAP [ $ ]
0.40
INEQUALITY / GINI INDEX
1,269
TOTAL POPULATION
614
MALE POPULATION
655
FEMALE POPULATION
93.74
MALES / 100 FEMALES
106.68
FEMALES / 100 MALES
33.9
MEDIAN AGE
3.2
AVG FAMILY SIZE
2.7
AVG HOUSEHOLD SIZE
643
LABOR FORCE [ PEOPLE ]
73.8%
PERCENT IN LABOR FORCE
14.3%
UNEMPLOYMENT RATE
West Kennebunk Area Codes
Income in West Kennebunk
Income Overview in West Kennebunk
Per Capita Income in West Kennebunk is $38,395, while median incomes of families and households are $111,563 and $90,104 respectively.
| Characteristic | Number | Measure |
| Per Capita Income | 1,269 | $38,395 |
| Median Family Income | 297 | $111,563 |
| Mean Family Income | 297 | $129,835 |
| Median Household Income | 473 | $90,104 |
| Mean Household Income | 473 | $103,982 |
| Income Deficit | 297 | $0 |
| Wage / Income Gap (%) | 1,269 | 46.87% |
| Wage / Income Gap ($) | 1,269 | 53.13¢ per $1 |
| Gini / Inequality Index | 1,269 | 0.40 |
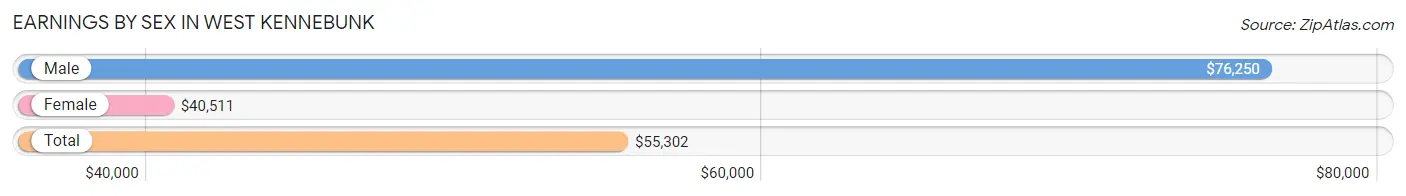
Earnings by Sex in West Kennebunk
Average Earnings in West Kennebunk are $55,302, $76,250 for men and $40,511 for women, a difference of 46.9%.
| Sex | Number | Average Earnings |
| Male | 320 (49.2%) | $76,250 |
| Female | 331 (50.8%) | $40,511 |
| Total | 651 (100.0%) | $55,302 |
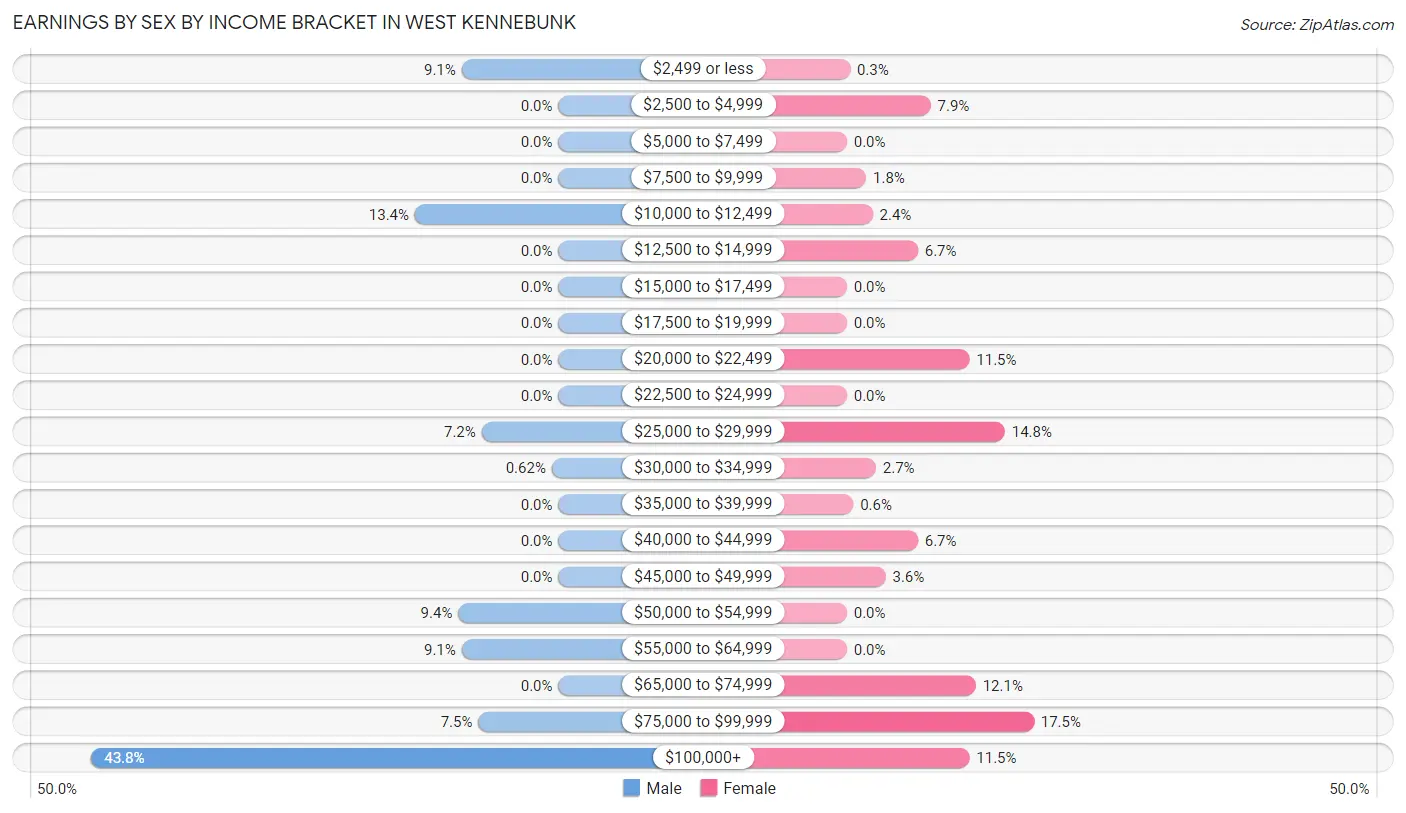
Earnings by Sex by Income Bracket in West Kennebunk
The most common earnings brackets in West Kennebunk are $100,000+ for men (140 | 43.8%) and $75,000 to $99,999 for women (58 | 17.5%).
| Income | Male | Female |
| $2,499 or less | 29 (9.1%) | 1 (0.3%) |
| $2,500 to $4,999 | 0 (0.0%) | 26 (7.9%) |
| $5,000 to $7,499 | 0 (0.0%) | 0 (0.0%) |
| $7,500 to $9,999 | 0 (0.0%) | 6 (1.8%) |
| $10,000 to $12,499 | 43 (13.4%) | 8 (2.4%) |
| $12,500 to $14,999 | 0 (0.0%) | 22 (6.7%) |
| $15,000 to $17,499 | 0 (0.0%) | 0 (0.0%) |
| $17,500 to $19,999 | 0 (0.0%) | 0 (0.0%) |
| $20,000 to $22,499 | 0 (0.0%) | 38 (11.5%) |
| $22,500 to $24,999 | 0 (0.0%) | 0 (0.0%) |
| $25,000 to $29,999 | 23 (7.2%) | 49 (14.8%) |
| $30,000 to $34,999 | 2 (0.6%) | 9 (2.7%) |
| $35,000 to $39,999 | 0 (0.0%) | 2 (0.6%) |
| $40,000 to $44,999 | 0 (0.0%) | 22 (6.7%) |
| $45,000 to $49,999 | 0 (0.0%) | 12 (3.6%) |
| $50,000 to $54,999 | 30 (9.4%) | 0 (0.0%) |
| $55,000 to $64,999 | 29 (9.1%) | 0 (0.0%) |
| $65,000 to $74,999 | 0 (0.0%) | 40 (12.1%) |
| $75,000 to $99,999 | 24 (7.5%) | 58 (17.5%) |
| $100,000+ | 140 (43.8%) | 38 (11.5%) |
| Total | 320 (100.0%) | 331 (100.0%) |
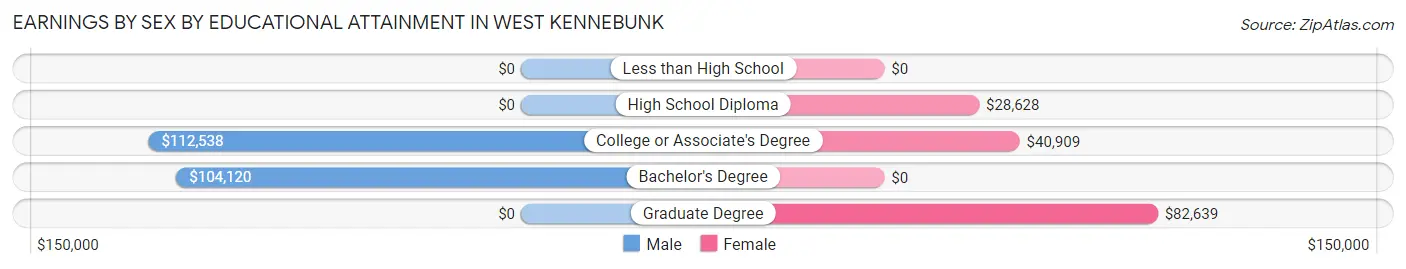
Earnings by Sex by Educational Attainment in West Kennebunk
Average earnings in West Kennebunk are $96,641 for men and $46,771 for women, a difference of 51.6%. Men with an educational attainment of college or associate's degree enjoy the highest average annual earnings of $112,538, while those with bachelor's degree education earn the least with $104,120. Women with an educational attainment of graduate degree earn the most with the average annual earnings of $82,639, while those with high school diploma education have the smallest earnings of $28,628.
| Educational Attainment | Male Income | Female Income |
| Less than High School | - | - |
| High School Diploma | - | - |
| College or Associate's Degree | $112,538 | $40,909 |
| Bachelor's Degree | $104,120 | $0 |
| Graduate Degree | - | - |
| Total | $96,641 | $46,771 |
Family Income in West Kennebunk
Family Income Brackets in West Kennebunk
According to the West Kennebunk family income data, there are 71 families falling into the $200,000+ income range, which is the most common income bracket and makes up 23.9% of all families.
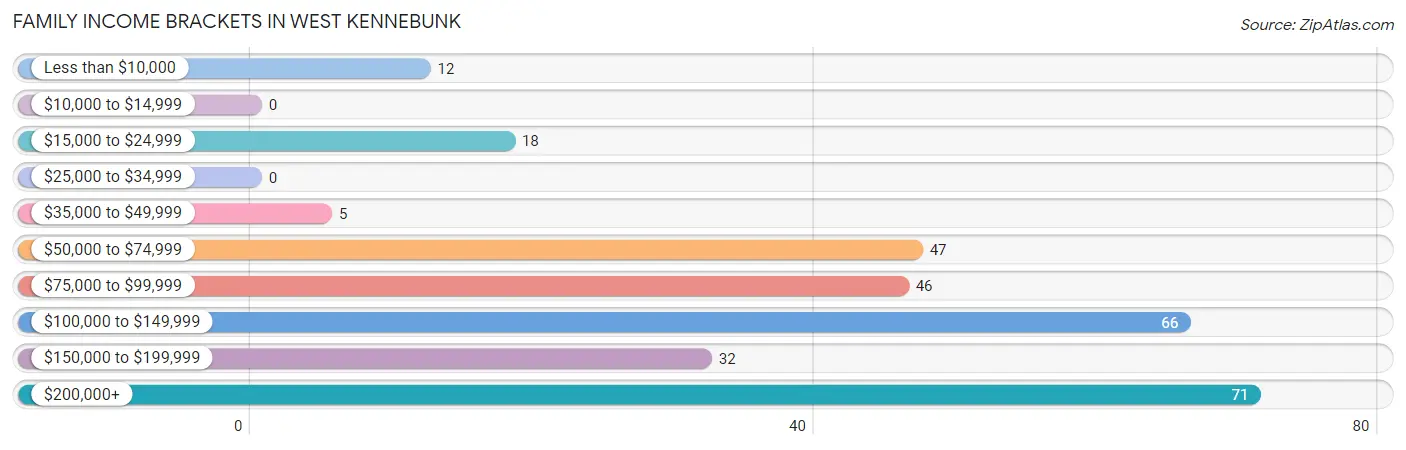
| Income Bracket | # Families | % Families |
| Less than $10,000 | 12 | 4.0% |
| $10,000 to $14,999 | 0 | 0.0% |
| $15,000 to $24,999 | 18 | 6.1% |
| $25,000 to $34,999 | 0 | 0.0% |
| $35,000 to $49,999 | 5 | 1.7% |
| $50,000 to $74,999 | 47 | 15.8% |
| $75,000 to $99,999 | 46 | 15.5% |
| $100,000 to $149,999 | 66 | 22.2% |
| $150,000 to $199,999 | 32 | 10.8% |
| $200,000+ | 71 | 23.9% |
Family Income by Famaliy Size in West Kennebunk
4-person families (71 | 23.9%) account for the highest median family income in West Kennebunk with $216,518 per family, while 4-person families (71 | 23.9%) have the highest median income of $54,130 per family member.
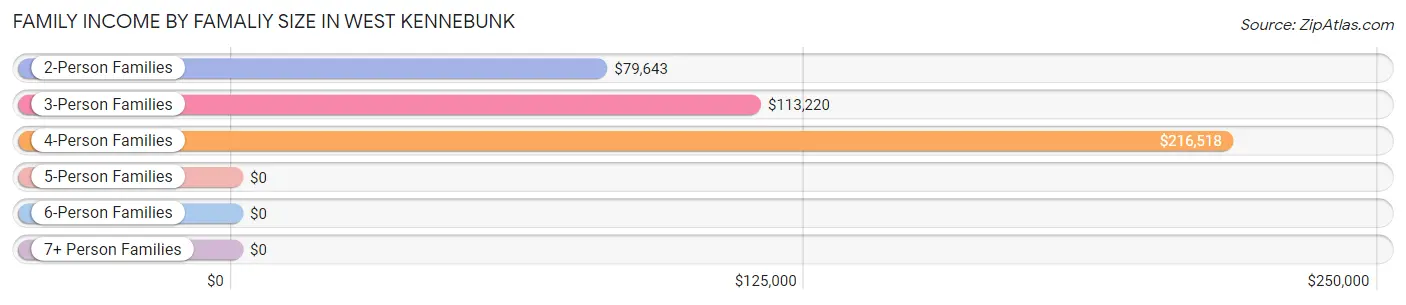
| Income Bracket | # Families | Median Income |
| 2-Person Families | 100 (33.7%) | $79,643 |
| 3-Person Families | 101 (34.0%) | $113,220 |
| 4-Person Families | 71 (23.9%) | $216,518 |
| 5-Person Families | 25 (8.4%) | $0 |
| 6-Person Families | 0 (0.0%) | $0 |
| 7+ Person Families | 0 (0.0%) | $0 |
| Total | 297 (100.0%) | $111,563 |
Family Income by Number of Earners in West Kennebunk
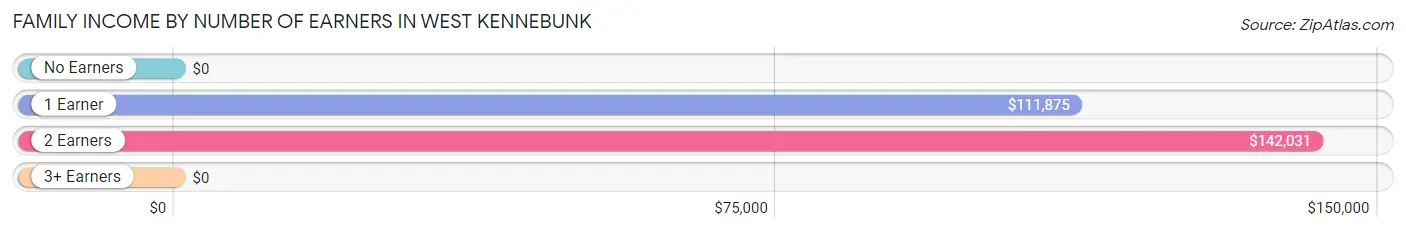
| Number of Earners | # Families | Median Income |
| No Earners | 30 (10.1%) | $0 |
| 1 Earner | 102 (34.3%) | $111,875 |
| 2 Earners | 151 (50.8%) | $142,031 |
| 3+ Earners | 14 (4.7%) | $0 |
| Total | 297 (100.0%) | $111,563 |
Household Income in West Kennebunk
Household Income Brackets in West Kennebunk
With 99 households falling in the category, the $75,000 to $99,999 income range is the most frequent in West Kennebunk, accounting for 20.9% of all households.
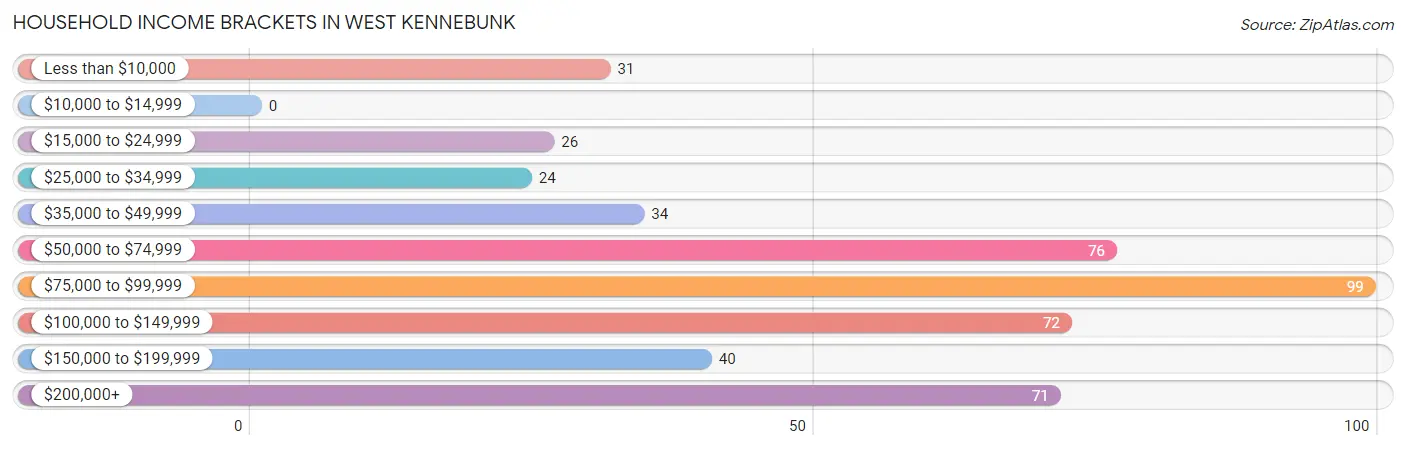
| Income Bracket | # Households | % Households |
| Less than $10,000 | 31 | 6.6% |
| $10,000 to $14,999 | 0 | 0.0% |
| $15,000 to $24,999 | 26 | 5.5% |
| $25,000 to $34,999 | 24 | 5.1% |
| $35,000 to $49,999 | 34 | 7.2% |
| $50,000 to $74,999 | 76 | 16.1% |
| $75,000 to $99,999 | 99 | 20.9% |
| $100,000 to $149,999 | 72 | 15.2% |
| $150,000 to $199,999 | 40 | 8.5% |
| $200,000+ | 71 | 15.0% |
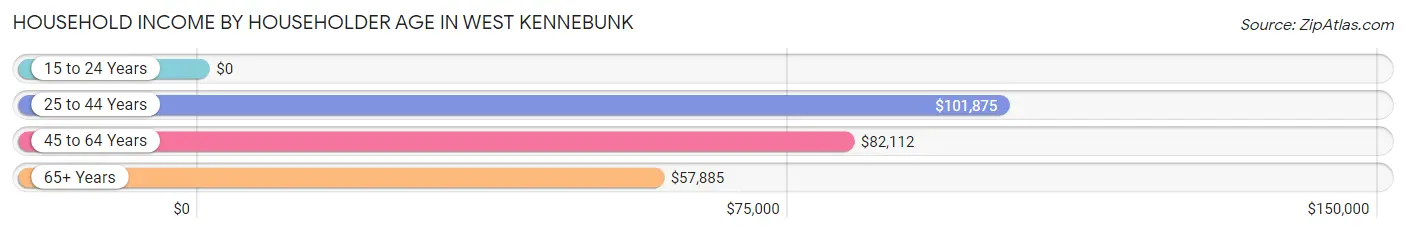
Household Income by Householder Age in West Kennebunk
The median household income in West Kennebunk is $90,104, with the highest median household income of $101,875 found in the 25 to 44 years age bracket for the primary householder. A total of 192 households (40.6%) fall into this category.
| Income Bracket | # Households | Median Income |
| 15 to 24 Years | 0 (0.0%) | $0 |
| 25 to 44 Years | 192 (40.6%) | $101,875 |
| 45 to 64 Years | 235 (49.7%) | $82,112 |
| 65+ Years | 46 (9.7%) | $57,885 |
| Total | 473 (100.0%) | $90,104 |
Poverty in West Kennebunk
Income Below Poverty by Sex and Age in West Kennebunk
With 10.1% poverty level for males and 16.6% for females among the residents of West Kennebunk, 18 to 24 year old males and 55 to 64 year old females are the most vulnerable to poverty, with 17 males (100.0%) and 30 females (43.5%) in their respective age groups living below the poverty level.
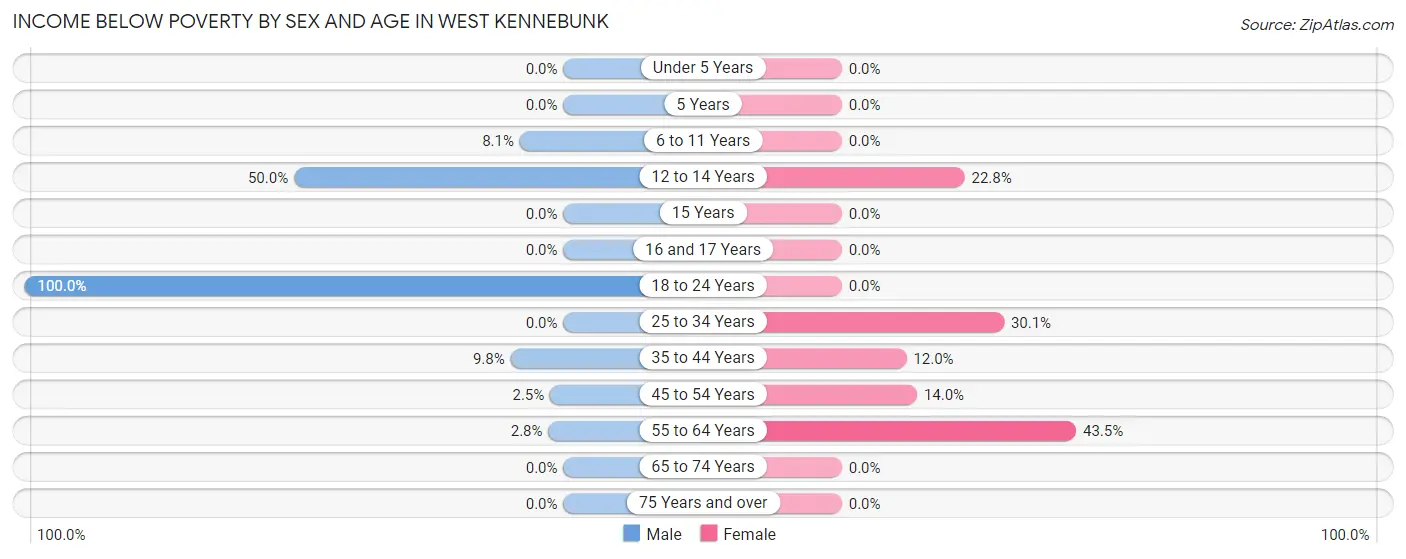
| Age Bracket | Male | Female |
| Under 5 Years | 0 (0.0%) | 0 (0.0%) |
| 5 Years | 0 (0.0%) | 0 (0.0%) |
| 6 to 11 Years | 11 (8.1%) | 0 (0.0%) |
| 12 to 14 Years | 20 (50.0%) | 18 (22.8%) |
| 15 Years | 0 (0.0%) | 0 (0.0%) |
| 16 and 17 Years | 0 (0.0%) | 0 (0.0%) |
| 18 to 24 Years | 17 (100.0%) | 0 (0.0%) |
| 25 to 34 Years | 0 (0.0%) | 31 (30.1%) |
| 35 to 44 Years | 10 (9.8%) | 12 (12.0%) |
| 45 to 54 Years | 3 (2.5%) | 18 (14.0%) |
| 55 to 64 Years | 1 (2.8%) | 30 (43.5%) |
| 65 to 74 Years | 0 (0.0%) | 0 (0.0%) |
| 75 Years and over | 0 (0.0%) | 0 (0.0%) |
| Total | 62 (10.1%) | 109 (16.6%) |
Income Above Poverty by Sex and Age in West Kennebunk
According to the poverty statistics in West Kennebunk, males aged under 5 years and females aged under 5 years are the age groups that are most secure financially, with 100.0% of males and 100.0% of females in these age groups living above the poverty line.
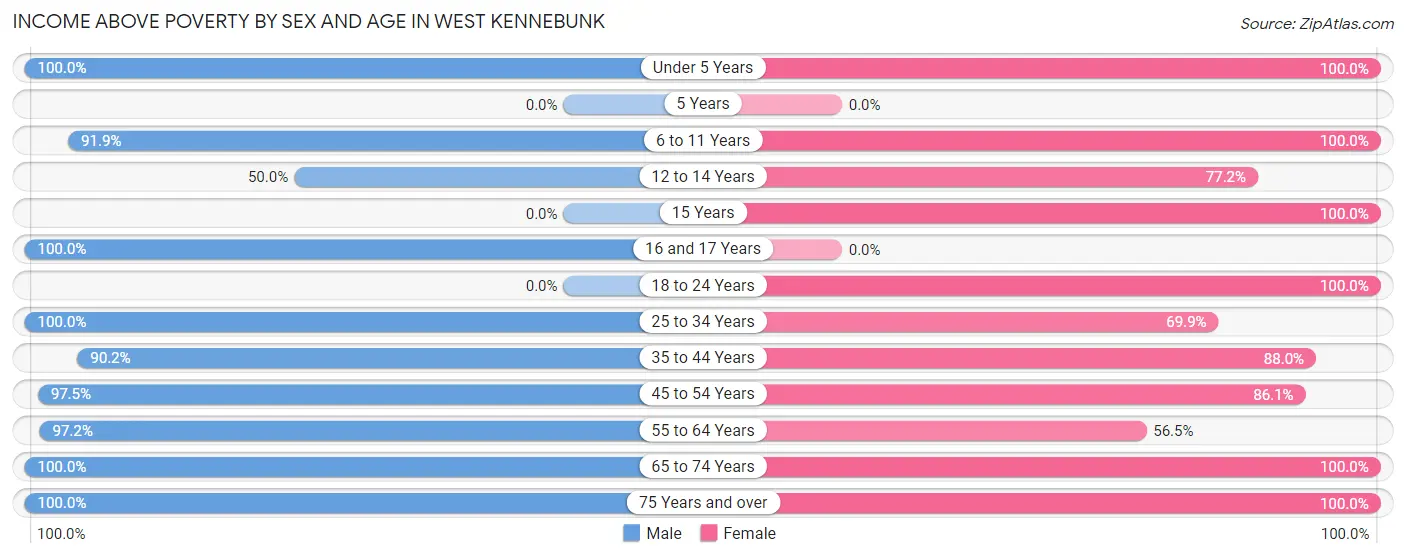
| Age Bracket | Male | Female |
| Under 5 Years | 65 (100.0%) | 38 (100.0%) |
| 5 Years | 0 (0.0%) | 0 (0.0%) |
| 6 to 11 Years | 125 (91.9%) | 31 (100.0%) |
| 12 to 14 Years | 20 (50.0%) | 61 (77.2%) |
| 15 Years | 0 (0.0%) | 9 (100.0%) |
| 16 and 17 Years | 12 (100.0%) | 0 (0.0%) |
| 18 to 24 Years | 0 (0.0%) | 64 (100.0%) |
| 25 to 34 Years | 52 (100.0%) | 72 (69.9%) |
| 35 to 44 Years | 92 (90.2%) | 88 (88.0%) |
| 45 to 54 Years | 119 (97.5%) | 111 (86.1%) |
| 55 to 64 Years | 35 (97.2%) | 39 (56.5%) |
| 65 to 74 Years | 18 (100.0%) | 12 (100.0%) |
| 75 Years and over | 14 (100.0%) | 21 (100.0%) |
| Total | 552 (89.9%) | 546 (83.4%) |
Income Below Poverty Among Married-Couple Families in West Kennebunk
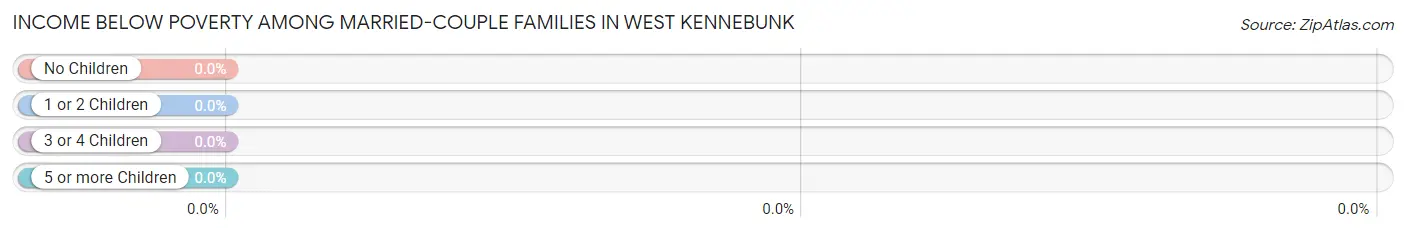
| Children | Above Poverty | Below Poverty |
| No Children | 56 (100.0%) | 0 (0.0%) |
| 1 or 2 Children | 112 (100.0%) | 0 (0.0%) |
| 3 or 4 Children | 25 (100.0%) | 0 (0.0%) |
| 5 or more Children | 0 (0.0%) | 0 (0.0%) |
| Total | 193 (100.0%) | 0 (0.0%) |
Income Below Poverty Among Single-Parent Households in West Kennebunk
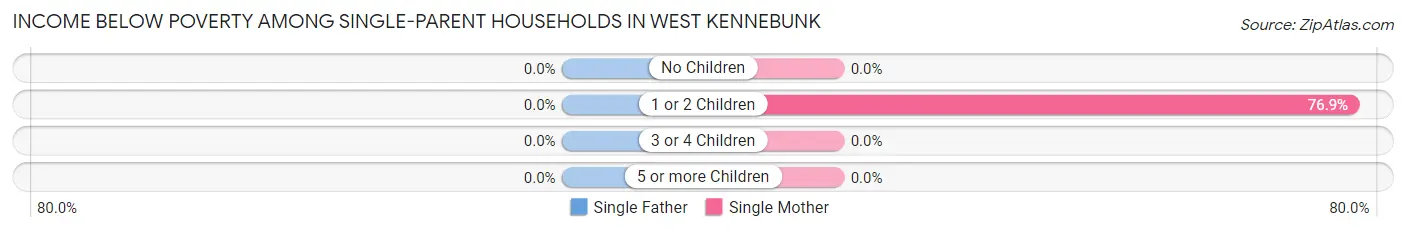
| Children | Single Father | Single Mother |
| No Children | 0 (0.0%) | 0 (0.0%) |
| 1 or 2 Children | 0 (0.0%) | 30 (76.9%) |
| 3 or 4 Children | 0 (0.0%) | 0 (0.0%) |
| 5 or more Children | 0 (0.0%) | 0 (0.0%) |
| Total | 0 (0.0%) | 30 (42.2%) |
Income Below Poverty Among Married-Couple vs Single-Parent Households in West Kennebunk
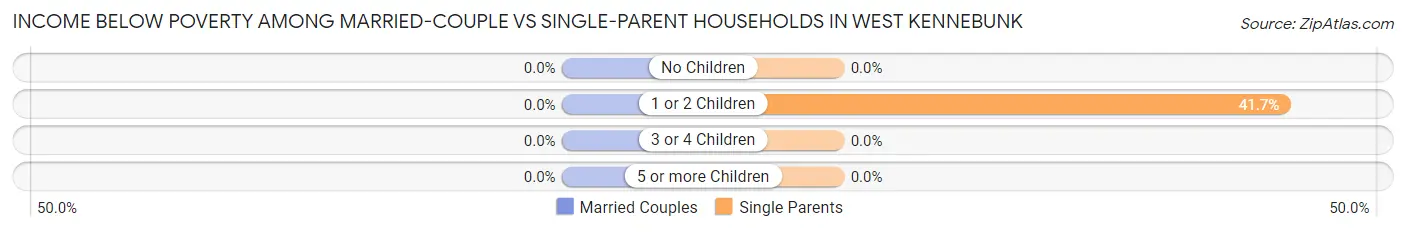
| Children | Married-Couple Families | Single-Parent Households |
| No Children | 0 (0.0%) | 0 (0.0%) |
| 1 or 2 Children | 0 (0.0%) | 30 (41.7%) |
| 3 or 4 Children | 0 (0.0%) | 0 (0.0%) |
| 5 or more Children | 0 (0.0%) | 0 (0.0%) |
| Total | 0 (0.0%) | 30 (28.8%) |
Race in West Kennebunk
The most populous races in West Kennebunk are White / Caucasian (1,179 | 92.9%), Some other Race (45 | 3.5%), and Two or more Races (32 | 2.5%).
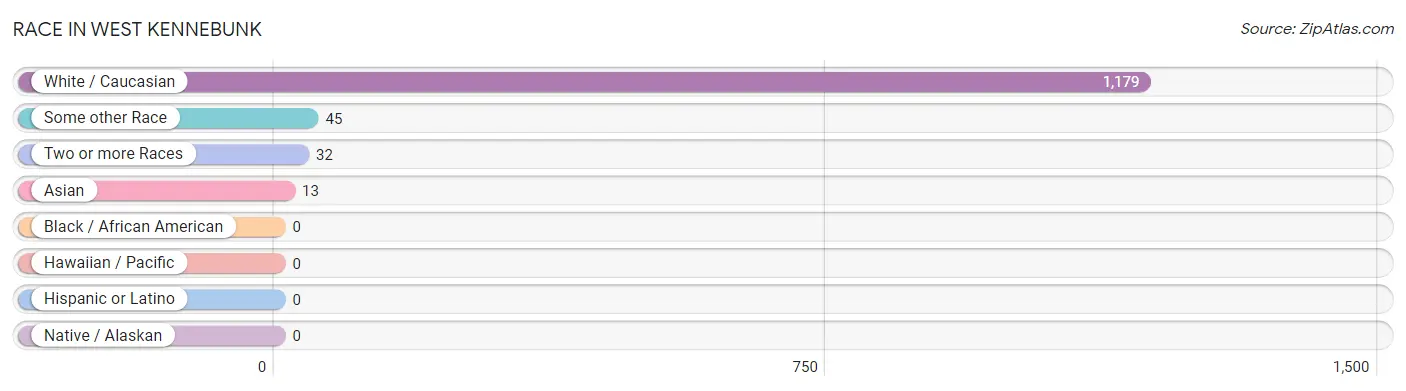
| Race | # Population | % Population |
| Asian | 13 | 1.0% |
| Black / African American | 0 | 0.0% |
| Hawaiian / Pacific | 0 | 0.0% |
| Hispanic or Latino | 0 | 0.0% |
| Native / Alaskan | 0 | 0.0% |
| White / Caucasian | 1,179 | 92.9% |
| Two or more Races | 32 | 2.5% |
| Some other Race | 45 | 3.5% |
| Total | 1,269 | 100.0% |
Ancestry in West Kennebunk
The most populous ancestries reported in West Kennebunk are Irish (262 | 20.6%), English (200 | 15.8%), French (177 | 14.0%), Scottish (123 | 9.7%), and French Canadian (119 | 9.4%), together accounting for 69.4% of all West Kennebunk residents.
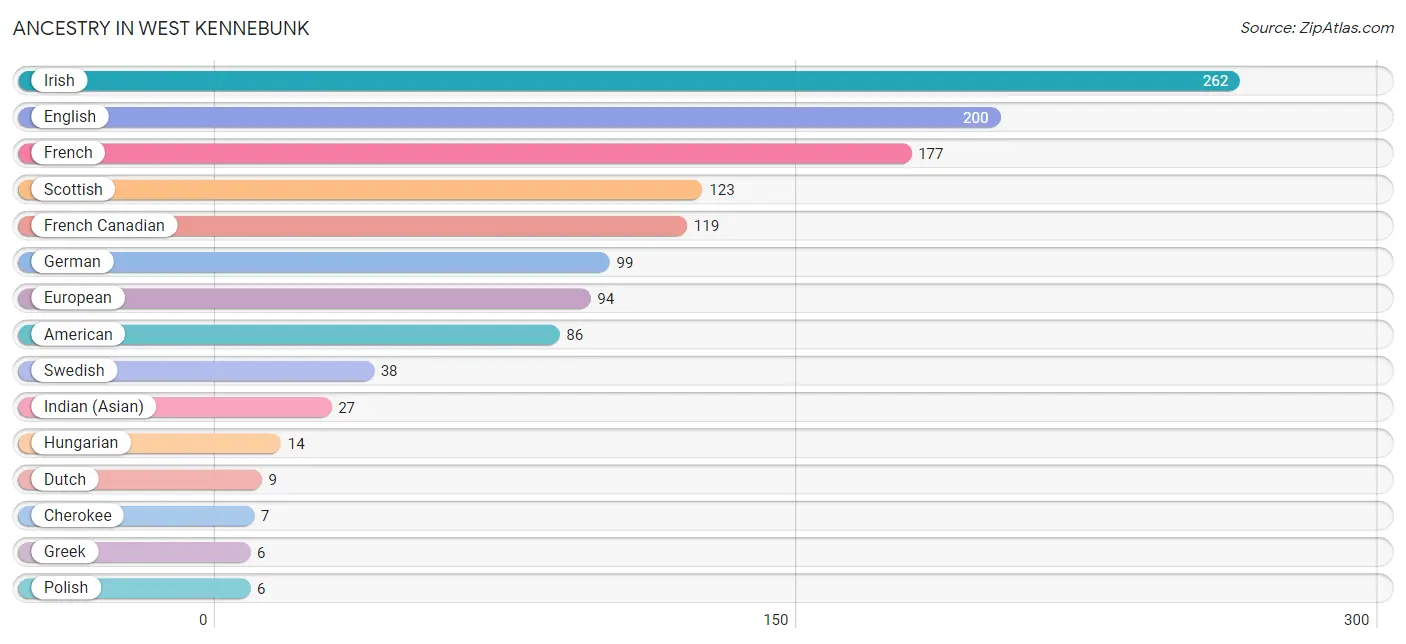
| Ancestry | # Population | % Population |
| American | 86 | 6.8% |
| Cherokee | 7 | 0.5% |
| Dutch | 9 | 0.7% |
| English | 200 | 15.8% |
| European | 94 | 7.4% |
| French | 177 | 14.0% |
| French Canadian | 119 | 9.4% |
| German | 99 | 7.8% |
| Greek | 6 | 0.5% |
| Hungarian | 14 | 1.1% |
| Indian (Asian) | 27 | 2.1% |
| Irish | 262 | 20.6% |
| Polish | 6 | 0.5% |
| Portuguese | 1 | 0.1% |
| Scottish | 123 | 9.7% |
| Swedish | 38 | 3.0% | View All 16 Rows |
Immigrants in West Kennebunk

| Immigration Origin | # Population | % Population | View All 0 Rows |
Sex and Age in West Kennebunk
Sex and Age in West Kennebunk
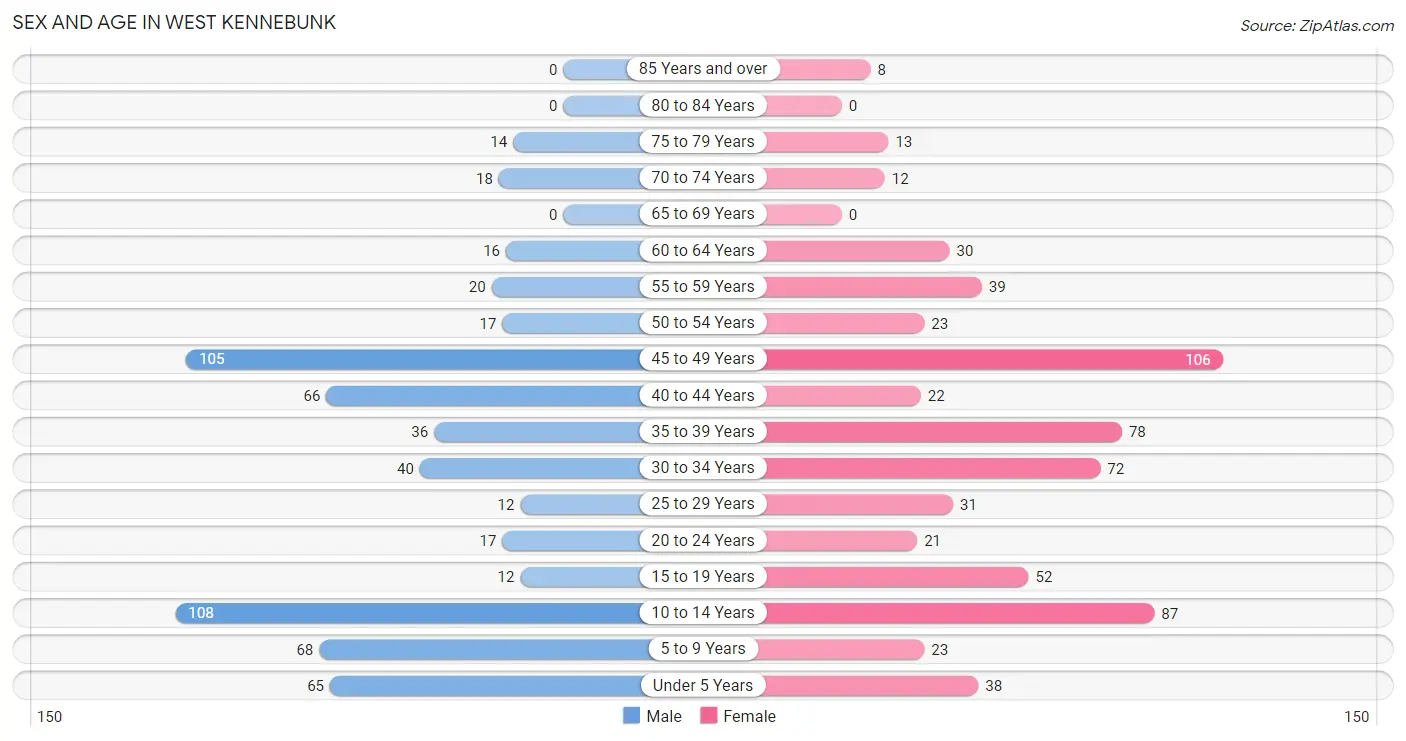
The most populous age groups in West Kennebunk are 10 to 14 Years (108 | 17.6%) for men and 45 to 49 Years (106 | 16.2%) for women.
| Age Bracket | Male | Female |
| Under 5 Years | 65 (10.6%) | 38 (5.8%) |
| 5 to 9 Years | 68 (11.1%) | 23 (3.5%) |
| 10 to 14 Years | 108 (17.6%) | 87 (13.3%) |
| 15 to 19 Years | 12 (1.9%) | 52 (7.9%) |
| 20 to 24 Years | 17 (2.8%) | 21 (3.2%) |
| 25 to 29 Years | 12 (1.9%) | 31 (4.7%) |
| 30 to 34 Years | 40 (6.5%) | 72 (11.0%) |
| 35 to 39 Years | 36 (5.9%) | 78 (11.9%) |
| 40 to 44 Years | 66 (10.7%) | 22 (3.4%) |
| 45 to 49 Years | 105 (17.1%) | 106 (16.2%) |
| 50 to 54 Years | 17 (2.8%) | 23 (3.5%) |
| 55 to 59 Years | 20 (3.3%) | 39 (5.9%) |
| 60 to 64 Years | 16 (2.6%) | 30 (4.6%) |
| 65 to 69 Years | 0 (0.0%) | 0 (0.0%) |
| 70 to 74 Years | 18 (2.9%) | 12 (1.8%) |
| 75 to 79 Years | 14 (2.3%) | 13 (2.0%) |
| 80 to 84 Years | 0 (0.0%) | 0 (0.0%) |
| 85 Years and over | 0 (0.0%) | 8 (1.2%) |
| Total | 614 (100.0%) | 655 (100.0%) |
Families and Households in West Kennebunk
Median Family Size in West Kennebunk
The median family size in West Kennebunk is 3.21 persons per family, with married-couple families (193 | 65.0%) accounting for the largest median family size of 3.53 persons per family. On the other hand, single female/mother families (71 | 23.9%) represent the smallest median family size with 2.46 persons per family.
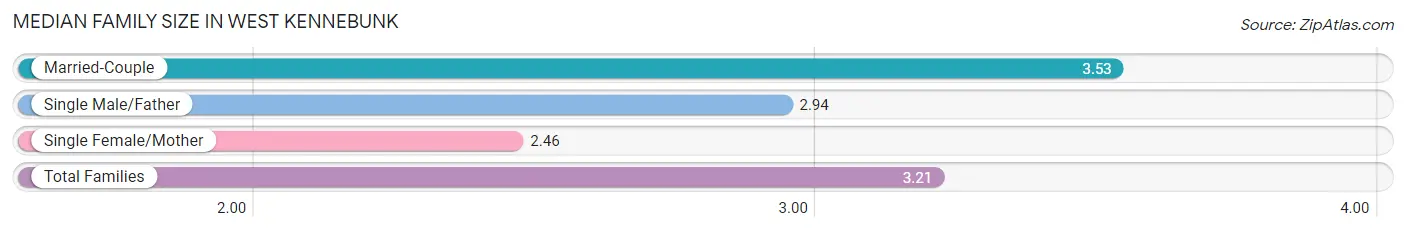
| Family Type | # Families | Family Size |
| Married-Couple | 193 (65.0%) | 3.53 |
| Single Male/Father | 33 (11.1%) | 2.94 |
| Single Female/Mother | 71 (23.9%) | 2.46 |
| Total Families | 297 (100.0%) | 3.21 |
Median Household Size in West Kennebunk
The median household size in West Kennebunk is 2.67 persons per household, with married-couple households (193 | 40.8%) accounting for the largest median household size of 3.58 persons per household. non-family households (176 | 37.2%) represent the smallest median household size with 1.44 persons per household.
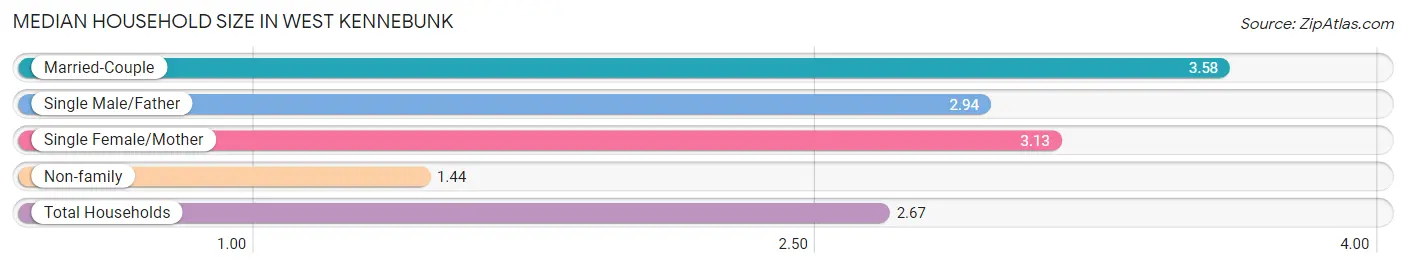
| Household Type | # Households | Household Size |
| Married-Couple | 193 (40.8%) | 3.58 |
| Single Male/Father | 33 (7.0%) | 2.94 |
| Single Female/Mother | 71 (15.0%) | 3.13 |
| Non-family | 176 (37.2%) | 1.44 |
| Total Households | 473 (100.0%) | 2.67 |
Household Size by Marriage Status in West Kennebunk
Out of a total of 473 households in West Kennebunk, 297 (62.8%) are family households, while 176 (37.2%) are nonfamily households. The most numerous type of family households are 3-person households, comprising 133, and the most common type of nonfamily households are 1-person households, comprising 119.
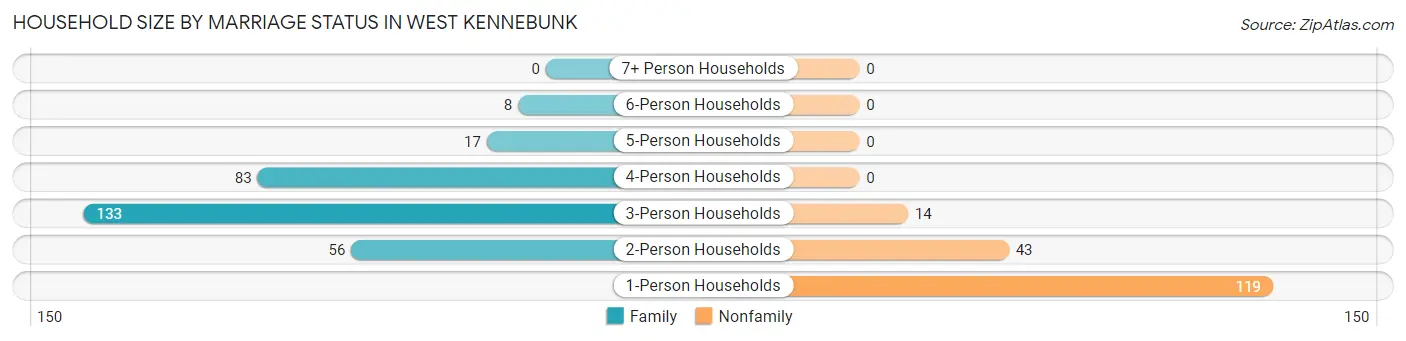
| Household Size | Family Households | Nonfamily Households |
| 1-Person Households | - | 119 (25.2%) |
| 2-Person Households | 56 (11.8%) | 43 (9.1%) |
| 3-Person Households | 133 (28.1%) | 14 (3.0%) |
| 4-Person Households | 83 (17.5%) | 0 (0.0%) |
| 5-Person Households | 17 (3.6%) | 0 (0.0%) |
| 6-Person Households | 8 (1.7%) | 0 (0.0%) |
| 7+ Person Households | 0 (0.0%) | 0 (0.0%) |
| Total | 297 (62.8%) | 176 (37.2%) |
Female Fertility in West Kennebunk
Fertility by Age in West Kennebunk
| Age Bracket | Women with Births | Births / 1,000 Women |
| 15 to 19 years | 0 (0.0%) | 0.0 |
| 20 to 34 years | 0 (0.0%) | 0.0 |
| 35 to 50 years | 0 (0.0%) | 0.0 |
| Total | 0 (0.0%) | 0.0 |
Fertility by Age by Marriage Status in West Kennebunk
| Age Bracket | Married | Unmarried |
| 15 to 19 years | 0 (0.0%) | 0 (0.0%) |
| 20 to 34 years | 0 (0.0%) | 0 (0.0%) |
| 35 to 50 years | 0 (0.0%) | 0 (0.0%) |
| Total | 0 (0.0%) | 0 (0.0%) |
Fertility by Education in West Kennebunk
| Educational Attainment | Women with Births | Births / 1,000 Women |
| Less than High School | 0 (0.0%) | 0.0 |
| High School Diploma | 0 (0.0%) | 0.0 |
| College or Associate's Degree | 0 (0.0%) | 0.0 |
| Bachelor's Degree | 0 (0.0%) | 0.0 |
| Graduate Degree | 0 (0.0%) | 0.0 |
| Total | 0 (0.0%) | 0.0 |
Fertility by Education by Marriage Status in West Kennebunk
| Educational Attainment | Married | Unmarried |
| Less than High School | 0 (0.0%) | 0 (0.0%) |
| High School Diploma | 0 (0.0%) | 0 (0.0%) |
| College or Associate's Degree | 0 (0.0%) | 0 (0.0%) |
| Bachelor's Degree | 0 (0.0%) | 0 (0.0%) |
| Graduate Degree | 0 (0.0%) | 0 (0.0%) |
| Total | 0 (0.0%) | 0 (0.0%) |
Employment Characteristics in West Kennebunk
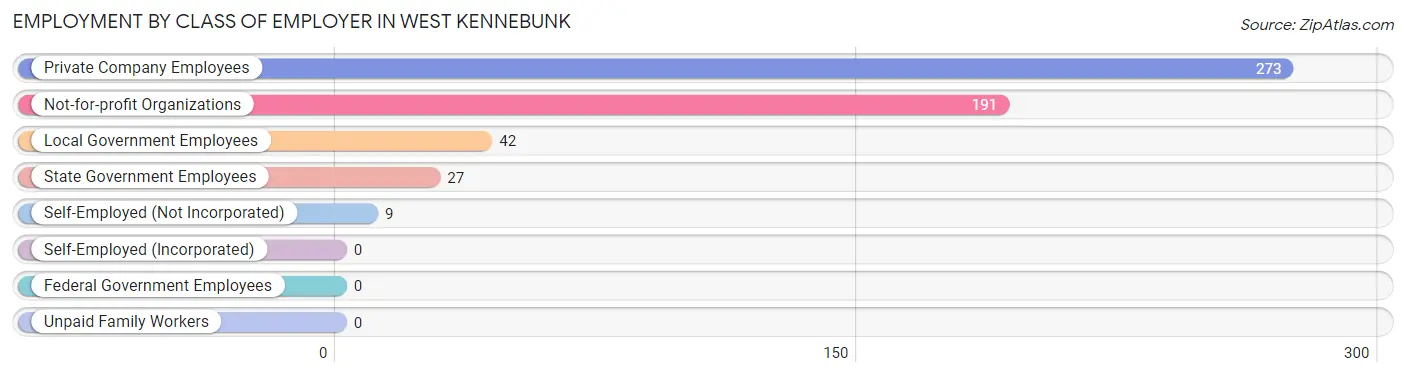
Employment by Class of Employer in West Kennebunk
Among the 542 employed individuals in West Kennebunk, private company employees (273 | 50.4%), not-for-profit organizations (191 | 35.2%), and local government employees (42 | 7.7%) make up the most common classes of employment.
| Employer Class | # Employees | % Employees |
| Private Company Employees | 273 | 50.4% |
| Self-Employed (Incorporated) | 0 | 0.0% |
| Self-Employed (Not Incorporated) | 9 | 1.7% |
| Not-for-profit Organizations | 191 | 35.2% |
| Local Government Employees | 42 | 7.7% |
| State Government Employees | 27 | 5.0% |
| Federal Government Employees | 0 | 0.0% |
| Unpaid Family Workers | 0 | 0.0% |
| Total | 542 | 100.0% |
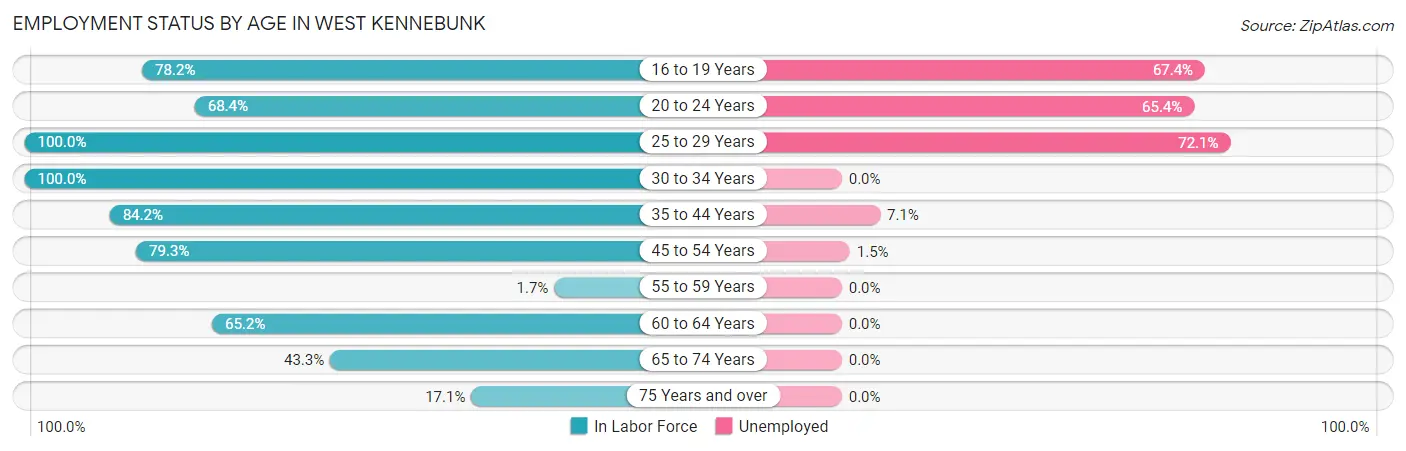
Employment Status by Age in West Kennebunk
According to the labor force statistics for West Kennebunk, out of the total population over 16 years of age (871), 73.8% or 643 individuals are in the labor force, with 14.3% or 92 of them unemployed. The age group with the highest labor force participation rate is 25 to 29 years, with 100.0% or 43 individuals in the labor force. Within the labor force, the 25 to 29 years age range has the highest percentage of unemployed individuals, with 72.1% or 31 of them being unemployed.
| Age Bracket | In Labor Force | Unemployed |
| 16 to 19 Years | 43 (78.2%) | 29 (67.4%) |
| 20 to 24 Years | 26 (68.4%) | 17 (65.4%) |
| 25 to 29 Years | 43 (100.0%) | 31 (72.1%) |
| 30 to 34 Years | 112 (100.0%) | 0 (0.0%) |
| 35 to 44 Years | 170 (84.2%) | 12 (7.1%) |
| 45 to 54 Years | 199 (79.3%) | 3 (1.5%) |
| 55 to 59 Years | 1 (1.7%) | 0 (0.0%) |
| 60 to 64 Years | 30 (65.2%) | 0 (0.0%) |
| 65 to 74 Years | 13 (43.3%) | 0 (0.0%) |
| 75 Years and over | 6 (17.1%) | 0 (0.0%) |
| Total | 643 (73.8%) | 92 (14.3%) |
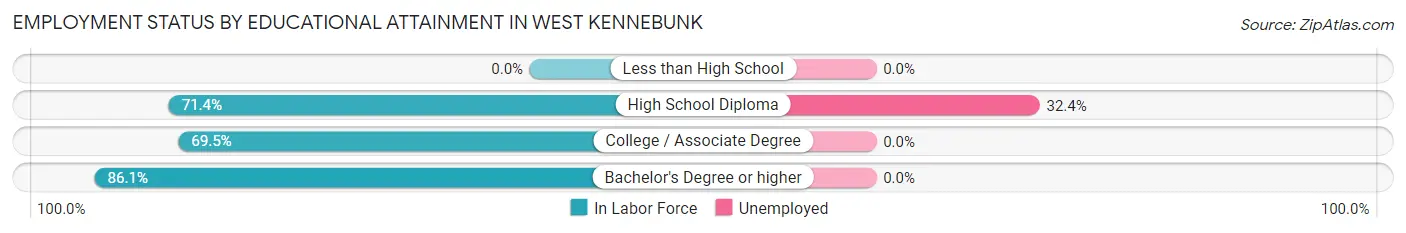
Employment Status by Educational Attainment in West Kennebunk
According to labor force statistics for West Kennebunk, 77.8% of individuals (555) out of the total population between 25 and 64 years of age (713) are in the labor force, with 8.3% or 46 of them being unemployed. The group with the highest labor force participation rate are those with the educational attainment of bachelor's degree or higher, with 86.1% or 290 individuals in the labor force. Within the labor force, individuals with high school diploma education have the highest percentage of unemployment, with 32.4% or 46 of them being unemployed.
| Educational Attainment | In Labor Force | Unemployed |
| Less than High School | 0 (0.0%) | 0 (0.0%) |
| High School Diploma | 142 (71.4%) | 64 (32.4%) |
| College / Associate Degree | 123 (69.5%) | 0 (0.0%) |
| Bachelor's Degree or higher | 290 (86.1%) | 0 (0.0%) |
| Total | 555 (77.8%) | 59 (8.3%) |
Employment Occupations by Sex in West Kennebunk
Management, Business, Science and Arts Occupations
The most common Management, Business, Science and Arts occupations in West Kennebunk are Management (128 | 23.2%), Health Diagnosing & Treating (66 | 12.0%), Community & Social Service (39 | 7.1%), Business & Financial (38 | 6.9%), and Health Technologists (37 | 6.7%).
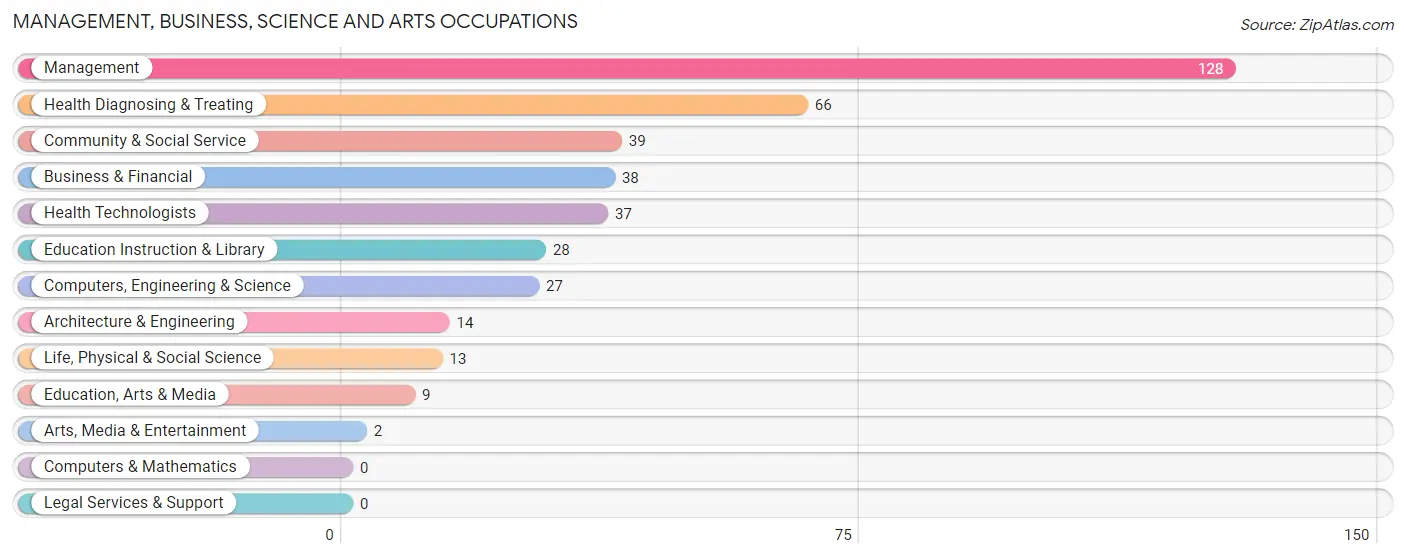
Management, Business, Science and Arts Occupations by Sex
Within the Management, Business, Science and Arts occupations in West Kennebunk, the most male-oriented occupations are Computers, Engineering & Science (100.0%), Architecture & Engineering (100.0%), and Life, Physical & Social Science (100.0%), while the most female-oriented occupations are Education, Arts & Media (100.0%), Education Instruction & Library (100.0%), and Health Technologists (100.0%).
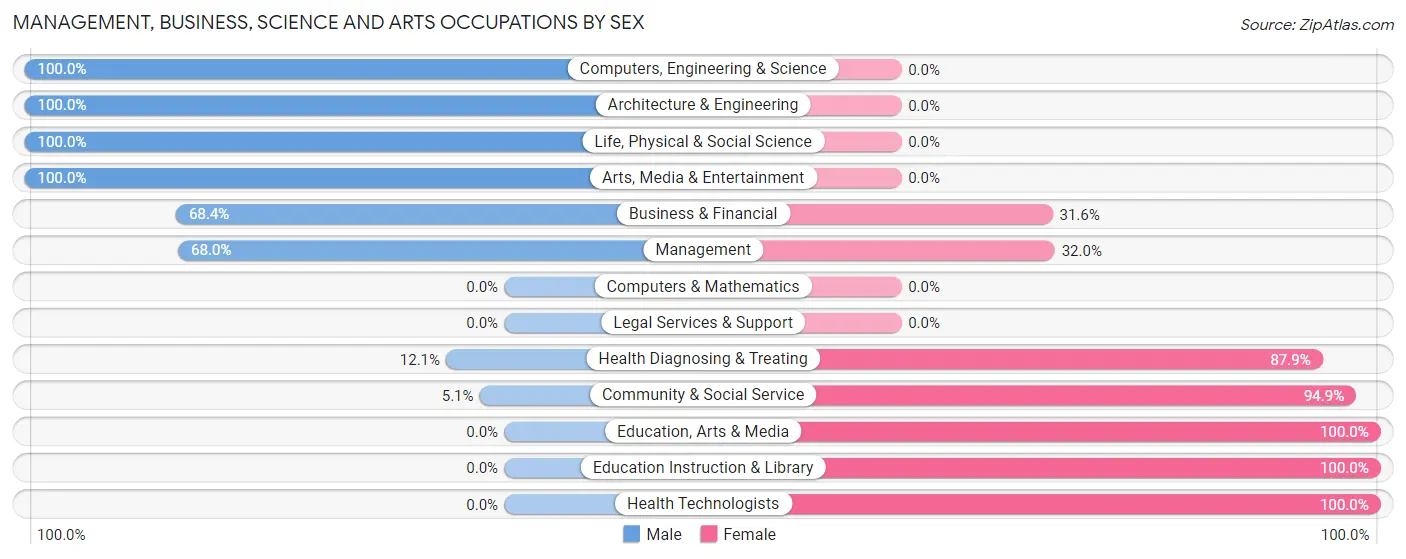
| Occupation | Male | Female |
| Management | 87 (68.0%) | 41 (32.0%) |
| Business & Financial | 26 (68.4%) | 12 (31.6%) |
| Computers, Engineering & Science | 27 (100.0%) | 0 (0.0%) |
| Computers & Mathematics | 0 (0.0%) | 0 (0.0%) |
| Architecture & Engineering | 14 (100.0%) | 0 (0.0%) |
| Life, Physical & Social Science | 13 (100.0%) | 0 (0.0%) |
| Community & Social Service | 2 (5.1%) | 37 (94.9%) |
| Education, Arts & Media | 0 (0.0%) | 9 (100.0%) |
| Legal Services & Support | 0 (0.0%) | 0 (0.0%) |
| Education Instruction & Library | 0 (0.0%) | 28 (100.0%) |
| Arts, Media & Entertainment | 2 (100.0%) | 0 (0.0%) |
| Health Diagnosing & Treating | 8 (12.1%) | 58 (87.9%) |
| Health Technologists | 0 (0.0%) | 37 (100.0%) |
| Total (Category) | 150 (50.3%) | 148 (49.7%) |
| Total (Overall) | 291 (52.8%) | 260 (47.2%) |
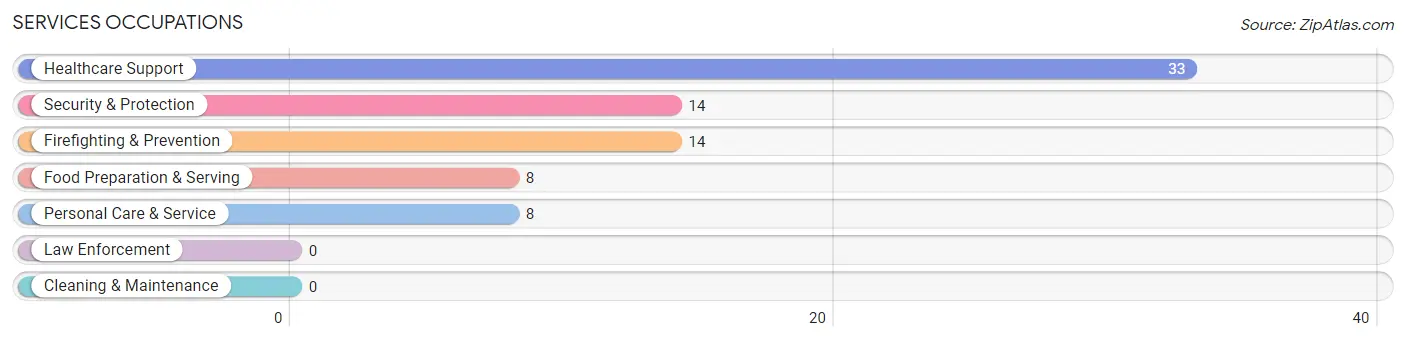
Services Occupations
The most common Services occupations in West Kennebunk are Healthcare Support (33 | 6.0%), Security & Protection (14 | 2.5%), Firefighting & Prevention (14 | 2.5%), Food Preparation & Serving (8 | 1.5%), and Personal Care & Service (8 | 1.5%).
Services Occupations by Sex
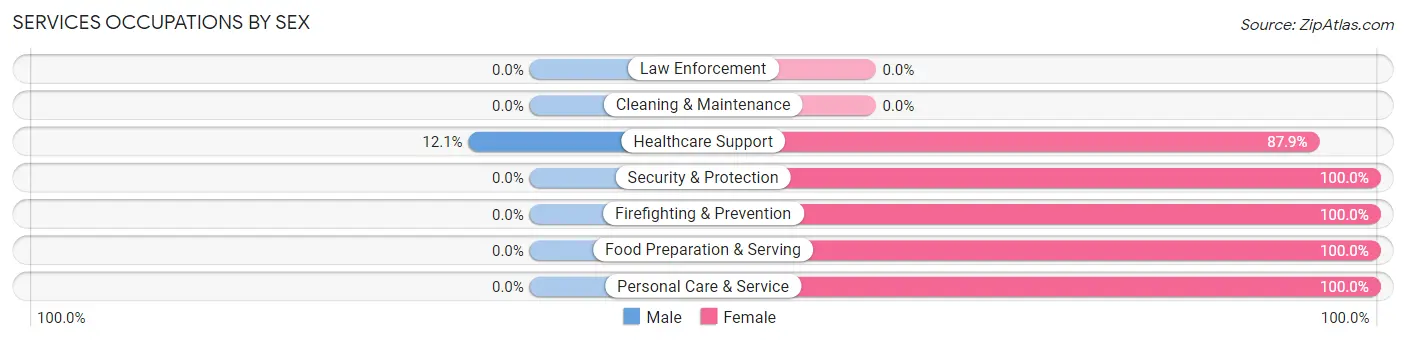
| Occupation | Male | Female |
| Healthcare Support | 4 (12.1%) | 29 (87.9%) |
| Security & Protection | 0 (0.0%) | 14 (100.0%) |
| Firefighting & Prevention | 0 (0.0%) | 14 (100.0%) |
| Law Enforcement | 0 (0.0%) | 0 (0.0%) |
| Food Preparation & Serving | 0 (0.0%) | 8 (100.0%) |
| Cleaning & Maintenance | 0 (0.0%) | 0 (0.0%) |
| Personal Care & Service | 0 (0.0%) | 8 (100.0%) |
| Total (Category) | 4 (6.4%) | 59 (93.6%) |
| Total (Overall) | 291 (52.8%) | 260 (47.2%) |
Sales and Office Occupations
The most common Sales and Office occupations in West Kennebunk are Sales & Related (120 | 21.8%), and Office & Administration (30 | 5.4%).
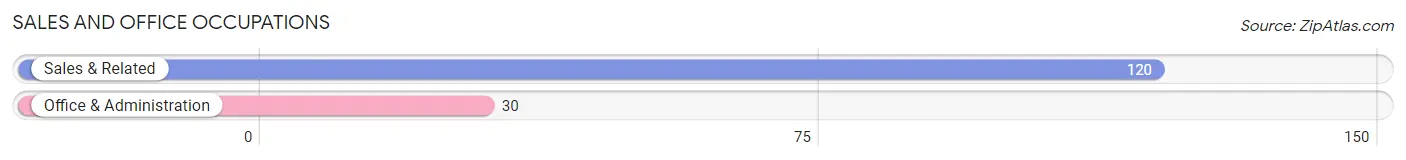
Sales and Office Occupations by Sex
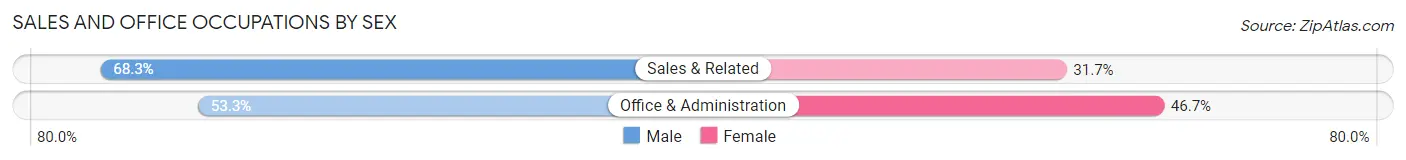
| Occupation | Male | Female |
| Sales & Related | 82 (68.3%) | 38 (31.7%) |
| Office & Administration | 16 (53.3%) | 14 (46.7%) |
| Total (Category) | 98 (65.3%) | 52 (34.7%) |
| Total (Overall) | 291 (52.8%) | 260 (47.2%) |
Natural Resources, Construction and Maintenance Occupations
The most common Natural Resources, Construction and Maintenance occupations in West Kennebunk are , and Construction & Extraction (20 | 3.6%).
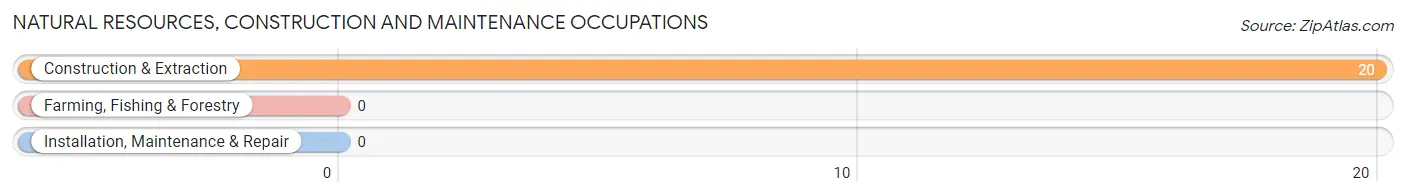
Natural Resources, Construction and Maintenance Occupations by Sex
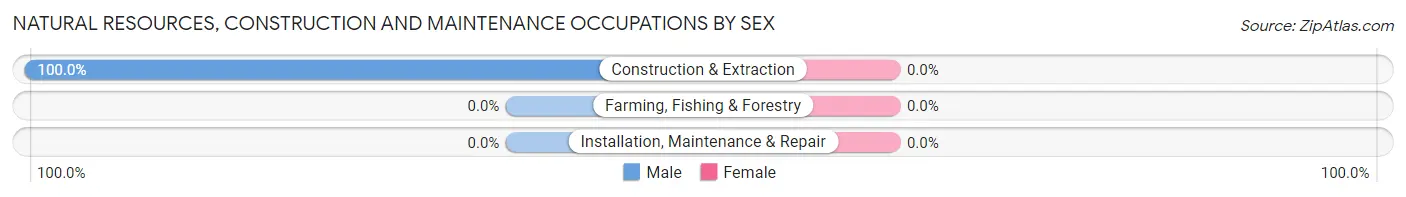
| Occupation | Male | Female |
| Farming, Fishing & Forestry | 0 (0.0%) | 0 (0.0%) |
| Construction & Extraction | 20 (100.0%) | 0 (0.0%) |
| Installation, Maintenance & Repair | 0 (0.0%) | 0 (0.0%) |
| Total (Category) | 20 (100.0%) | 0 (0.0%) |
| Total (Overall) | 291 (52.8%) | 260 (47.2%) |
Production, Transportation and Moving Occupations
The most common Production, Transportation and Moving occupations in West Kennebunk are Transportation (13 | 2.4%), Material Moving (6 | 1.1%), and Production (1 | 0.2%).
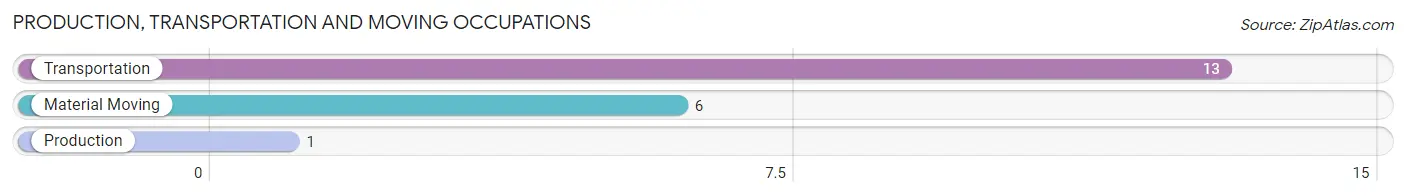
Production, Transportation and Moving Occupations by Sex
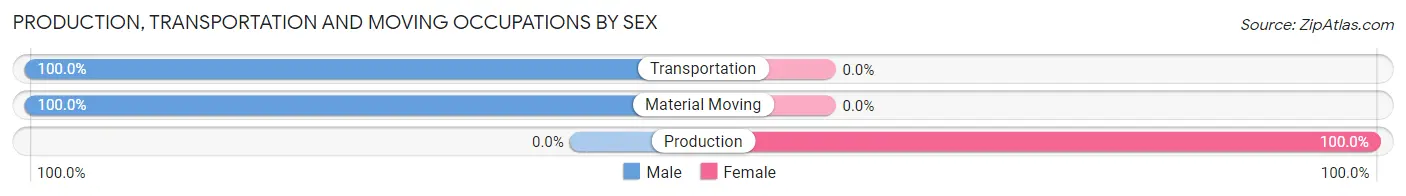
| Occupation | Male | Female |
| Production | 0 (0.0%) | 1 (100.0%) |
| Transportation | 13 (100.0%) | 0 (0.0%) |
| Material Moving | 6 (100.0%) | 0 (0.0%) |
| Total (Category) | 19 (95.0%) | 1 (5.0%) |
| Total (Overall) | 291 (52.8%) | 260 (47.2%) |
Employment Industries by Sex in West Kennebunk
Employment Industries in West Kennebunk
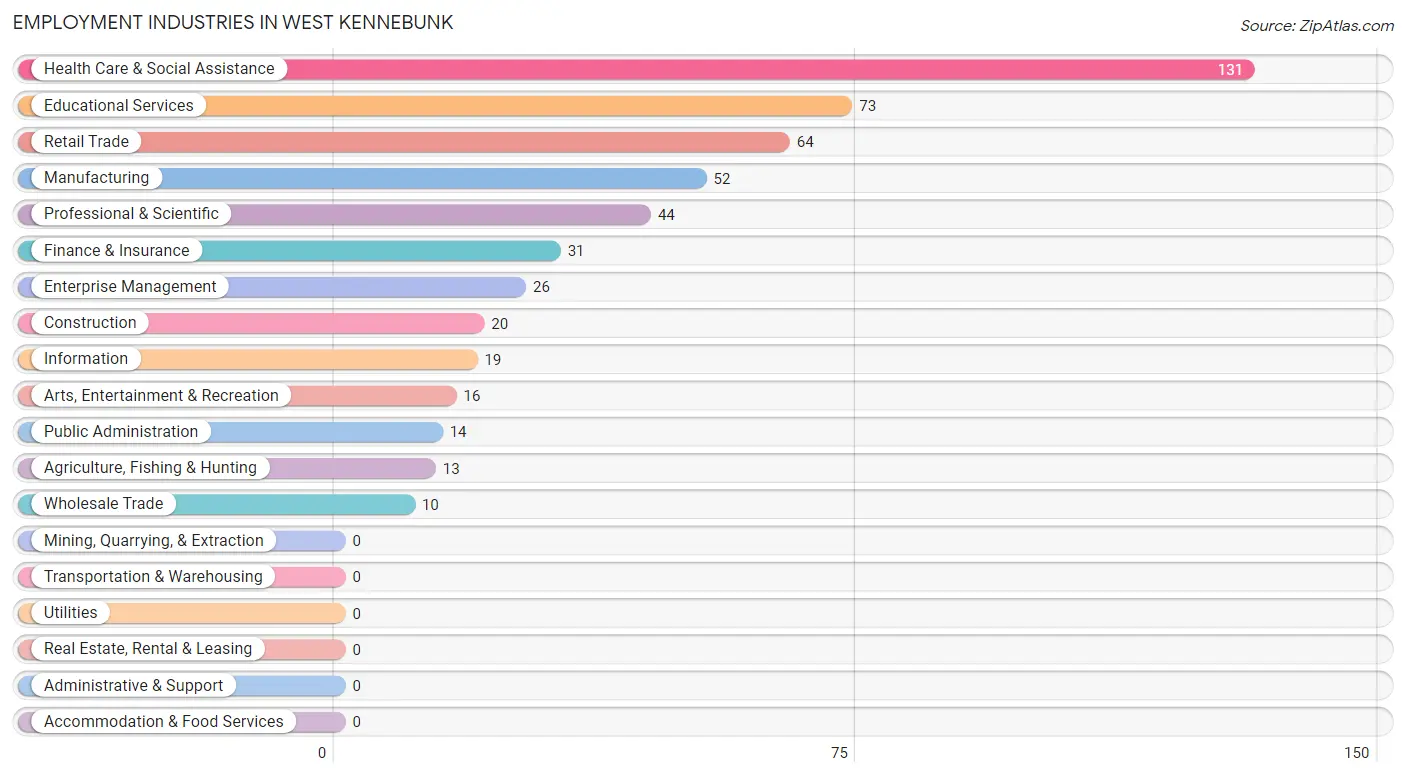
The major employment industries in West Kennebunk include Health Care & Social Assistance (131 | 23.8%), Educational Services (73 | 13.3%), Retail Trade (64 | 11.6%), Manufacturing (52 | 9.4%), and Professional & Scientific (44 | 8.0%).
Employment Industries by Sex in West Kennebunk
The West Kennebunk industries that see more men than women are Agriculture, Fishing & Hunting (100.0%), Construction (100.0%), and Manufacturing (100.0%), whereas the industries that tend to have a higher number of women are Enterprise Management (100.0%), Educational Services (100.0%), and Public Administration (100.0%).
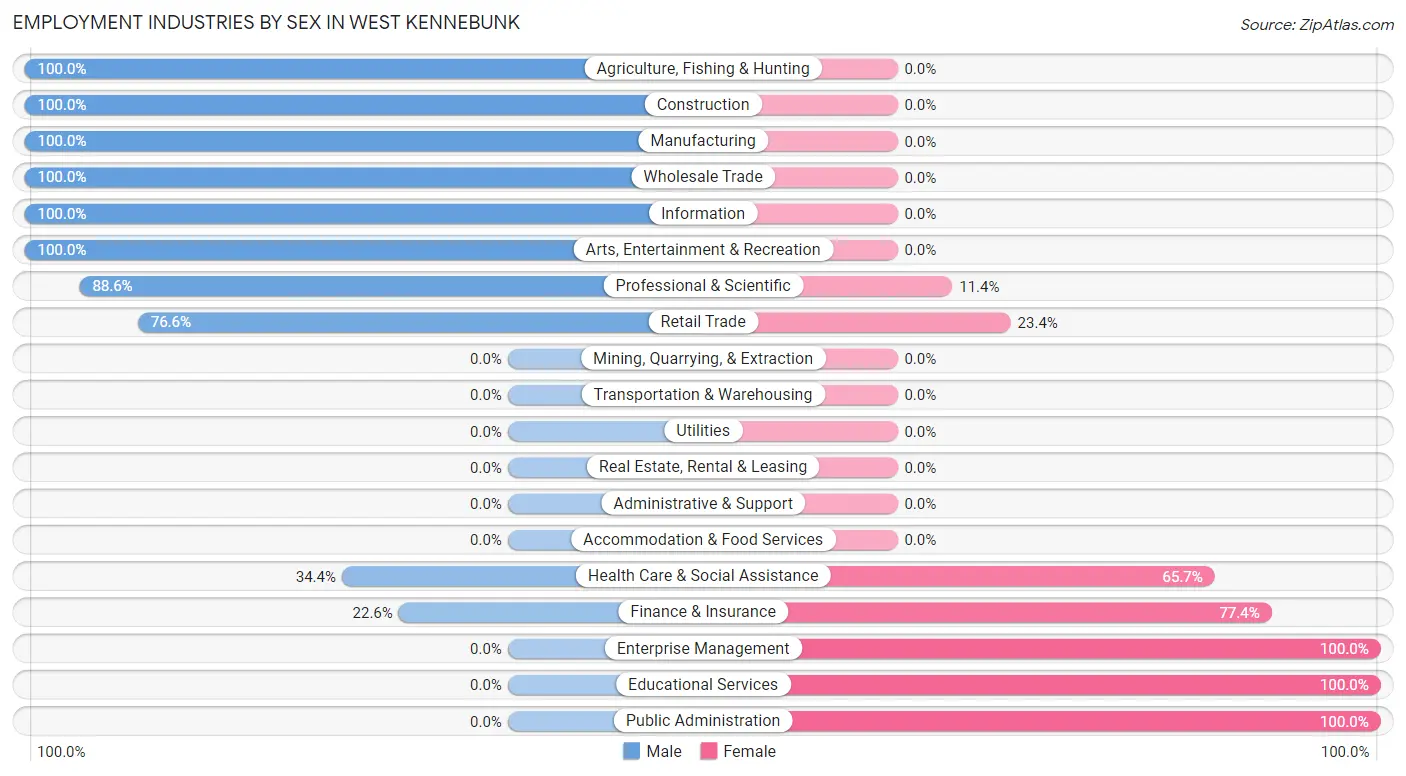
| Industry | Male | Female |
| Agriculture, Fishing & Hunting | 13 (100.0%) | 0 (0.0%) |
| Mining, Quarrying, & Extraction | 0 (0.0%) | 0 (0.0%) |
| Construction | 20 (100.0%) | 0 (0.0%) |
| Manufacturing | 52 (100.0%) | 0 (0.0%) |
| Wholesale Trade | 10 (100.0%) | 0 (0.0%) |
| Retail Trade | 49 (76.6%) | 15 (23.4%) |
| Transportation & Warehousing | 0 (0.0%) | 0 (0.0%) |
| Utilities | 0 (0.0%) | 0 (0.0%) |
| Information | 19 (100.0%) | 0 (0.0%) |
| Finance & Insurance | 7 (22.6%) | 24 (77.4%) |
| Real Estate, Rental & Leasing | 0 (0.0%) | 0 (0.0%) |
| Professional & Scientific | 39 (88.6%) | 5 (11.4%) |
| Enterprise Management | 0 (0.0%) | 26 (100.0%) |
| Administrative & Support | 0 (0.0%) | 0 (0.0%) |
| Educational Services | 0 (0.0%) | 73 (100.0%) |
| Health Care & Social Assistance | 45 (34.4%) | 86 (65.6%) |
| Arts, Entertainment & Recreation | 16 (100.0%) | 0 (0.0%) |
| Accommodation & Food Services | 0 (0.0%) | 0 (0.0%) |
| Public Administration | 0 (0.0%) | 14 (100.0%) |
| Total | 291 (52.8%) | 260 (47.2%) |
Education in West Kennebunk
School Enrollment in West Kennebunk
The most common levels of schooling among the 390 students in West Kennebunk are elementary school (159 | 40.8%), middle school (107 | 27.4%), and high school (55 | 14.1%).
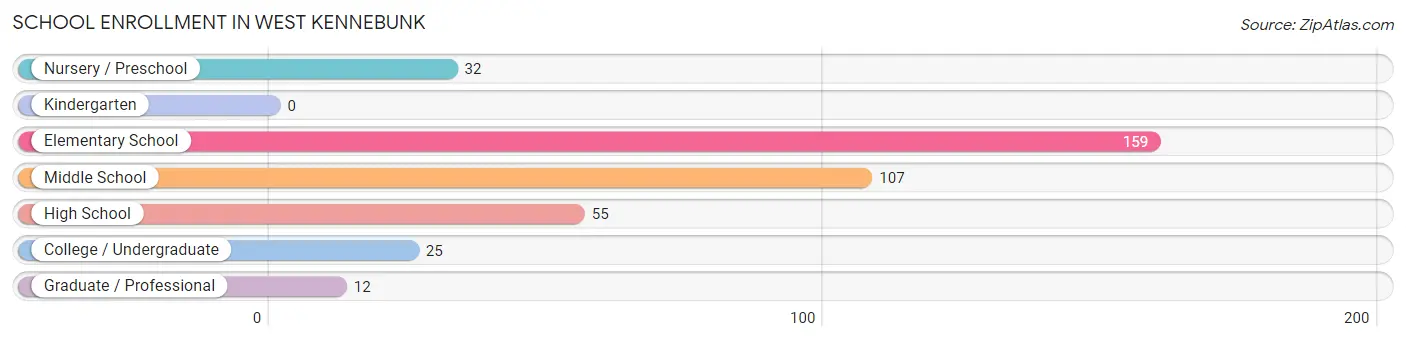
| School Level | # Students | % Students |
| Nursery / Preschool | 32 | 8.2% |
| Kindergarten | 0 | 0.0% |
| Elementary School | 159 | 40.8% |
| Middle School | 107 | 27.4% |
| High School | 55 | 14.1% |
| College / Undergraduate | 25 | 6.4% |
| Graduate / Professional | 12 | 3.1% |
| Total | 390 | 100.0% |
School Enrollment by Age by Funding Source in West Kennebunk
Out of a total of 390 students who are enrolled in schools in West Kennebunk, 66 (16.9%) attend a private institution, while the remaining 324 (83.1%) are enrolled in public schools. The age group of 20 to 24 year olds has the highest likelihood of being enrolled in private schools, with 12 (41.4% in the age bracket) enrolled. Conversely, the age group of 3 to 4 year olds has the lowest likelihood of being enrolled in a private school, with 32 (100.0% in the age bracket) attending a public institution.
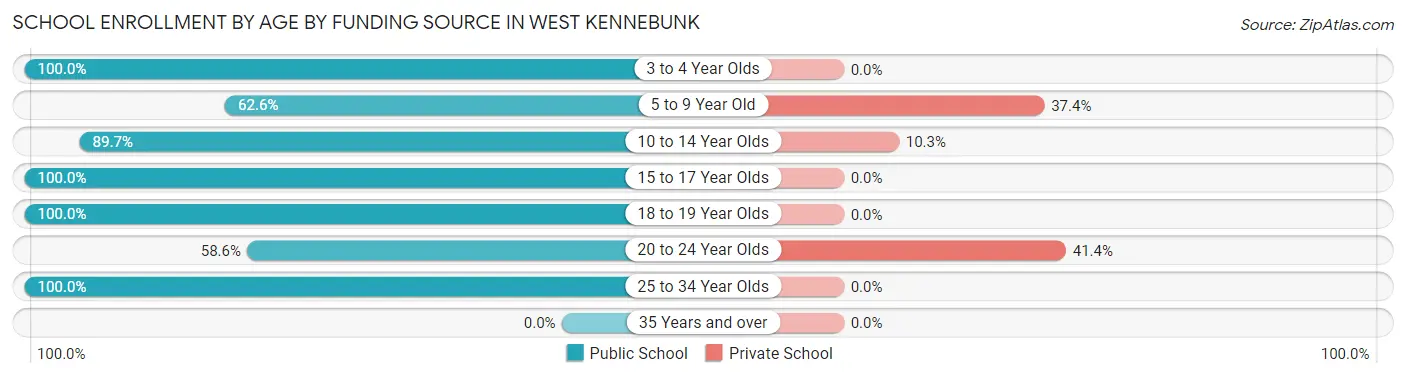
| Age Bracket | Public School | Private School |
| 3 to 4 Year Olds | 32 (100.0%) | 0 (0.0%) |
| 5 to 9 Year Old | 57 (62.6%) | 34 (37.4%) |
| 10 to 14 Year Olds | 175 (89.7%) | 20 (10.3%) |
| 15 to 17 Year Olds | 21 (100.0%) | 0 (0.0%) |
| 18 to 19 Year Olds | 14 (100.0%) | 0 (0.0%) |
| 20 to 24 Year Olds | 17 (58.6%) | 12 (41.4%) |
| 25 to 34 Year Olds | 8 (100.0%) | 0 (0.0%) |
| 35 Years and over | 0 (0.0%) | 0 (0.0%) |
| Total | 324 (83.1%) | 66 (16.9%) |
Educational Attainment by Field of Study in West Kennebunk
Business (89 | 21.7%), communications (63 | 15.4%), liberal arts & history (53 | 12.9%), education (48 | 11.7%), and social sciences (41 | 10.0%) are the most common fields of study among 410 individuals in West Kennebunk who have obtained a bachelor's degree or higher.
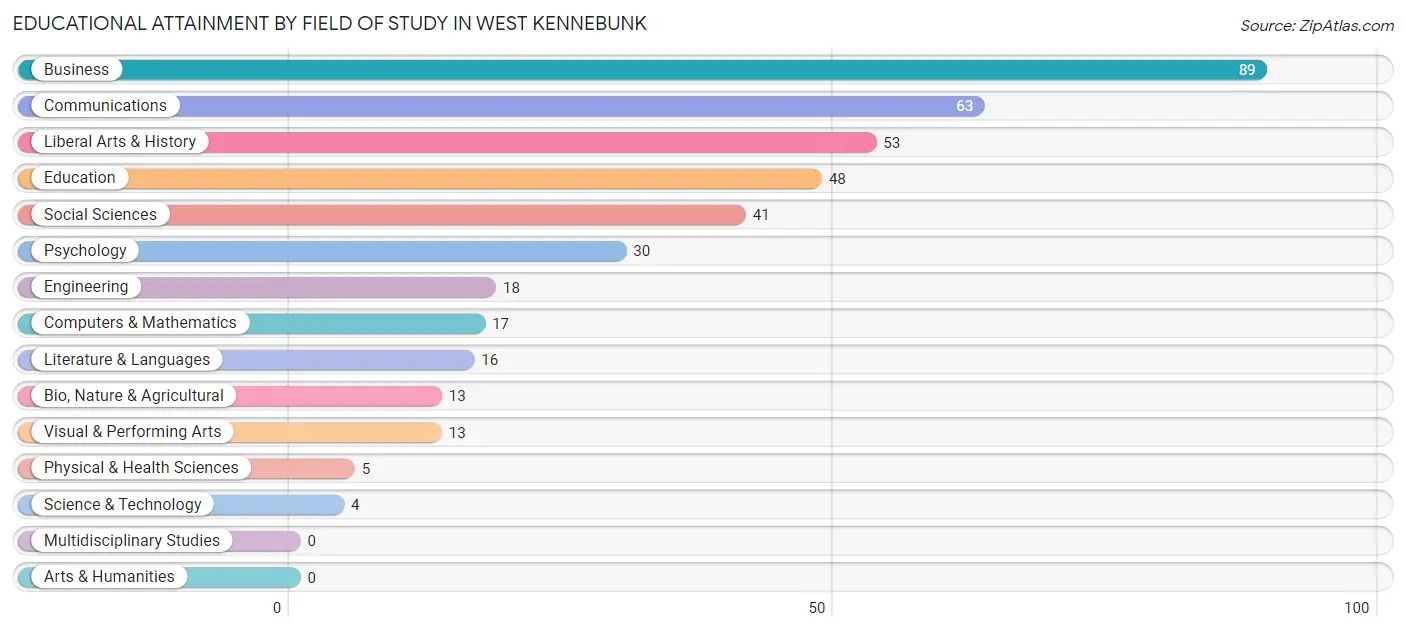
| Field of Study | # Graduates | % Graduates |
| Computers & Mathematics | 17 | 4.2% |
| Bio, Nature & Agricultural | 13 | 3.2% |
| Physical & Health Sciences | 5 | 1.2% |
| Psychology | 30 | 7.3% |
| Social Sciences | 41 | 10.0% |
| Engineering | 18 | 4.4% |
| Multidisciplinary Studies | 0 | 0.0% |
| Science & Technology | 4 | 1.0% |
| Business | 89 | 21.7% |
| Education | 48 | 11.7% |
| Literature & Languages | 16 | 3.9% |
| Liberal Arts & History | 53 | 12.9% |
| Visual & Performing Arts | 13 | 3.2% |
| Communications | 63 | 15.4% |
| Arts & Humanities | 0 | 0.0% |
| Total | 410 | 100.0% |
Transportation & Commute in West Kennebunk
Vehicle Availability by Sex in West Kennebunk
The most prevalent vehicle ownership categories in West Kennebunk are males with 2 vehicles (141, accounting for 48.4%) and females with 2 vehicles (139, making up 56.4%).
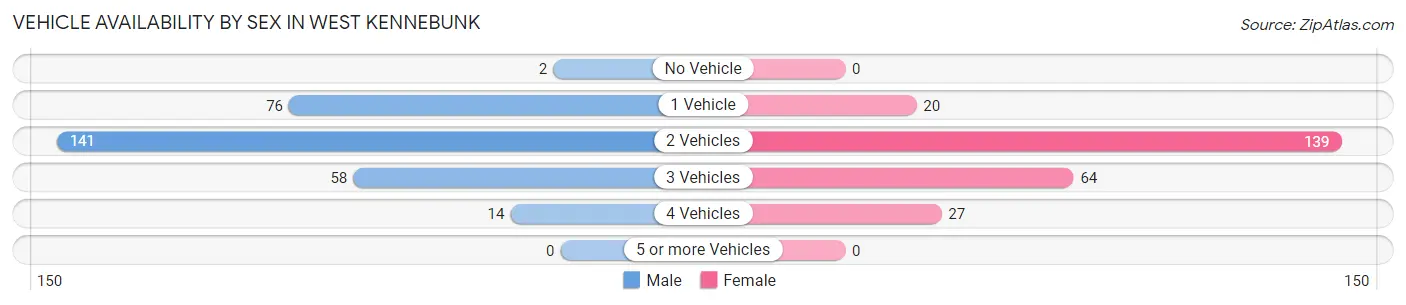
| Vehicles Available | Male | Female |
| No Vehicle | 2 (0.7%) | 0 (0.0%) |
| 1 Vehicle | 76 (26.1%) | 20 (8.0%) |
| 2 Vehicles | 141 (48.4%) | 139 (55.6%) |
| 3 Vehicles | 58 (19.9%) | 64 (25.6%) |
| 4 Vehicles | 14 (4.8%) | 27 (10.8%) |
| 5 or more Vehicles | 0 (0.0%) | 0 (0.0%) |
| Total | 291 (100.0%) | 250 (100.0%) |
Commute Time in West Kennebunk
The most frequently occuring commute durations in West Kennebunk are 30 to 34 minutes (114 commuters, 23.7%), 10 to 14 minutes (101 commuters, 21.0%), and 5 to 9 minutes (84 commuters, 17.5%).
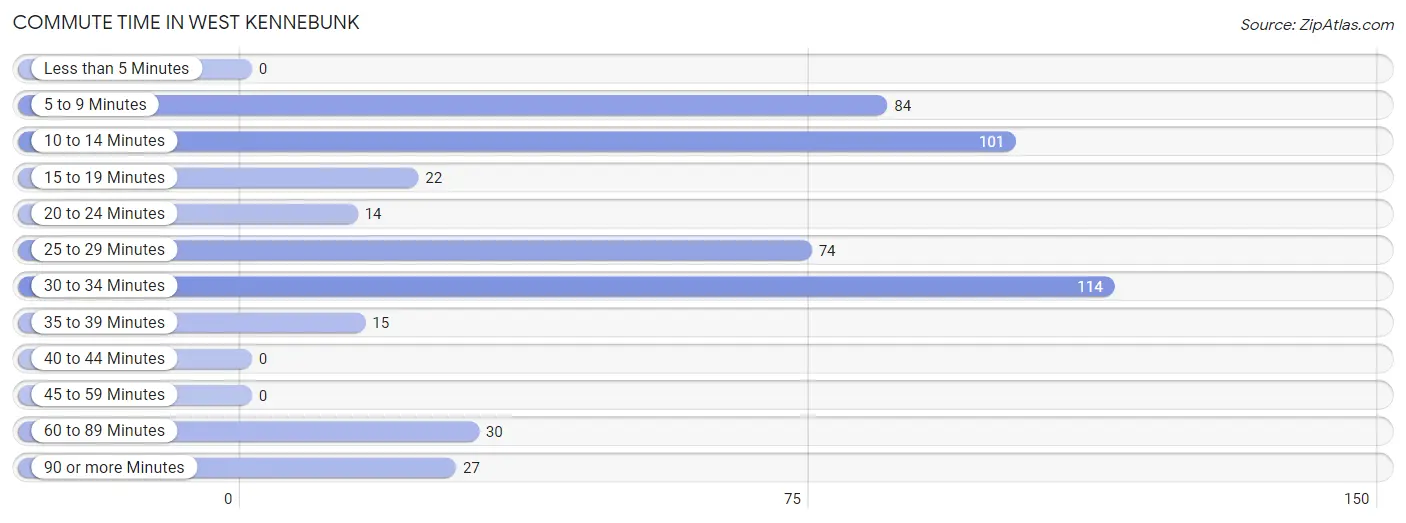
| Commute Time | # Commuters | % Commuters |
| Less than 5 Minutes | 0 | 0.0% |
| 5 to 9 Minutes | 84 | 17.5% |
| 10 to 14 Minutes | 101 | 21.0% |
| 15 to 19 Minutes | 22 | 4.6% |
| 20 to 24 Minutes | 14 | 2.9% |
| 25 to 29 Minutes | 74 | 15.4% |
| 30 to 34 Minutes | 114 | 23.7% |
| 35 to 39 Minutes | 15 | 3.1% |
| 40 to 44 Minutes | 0 | 0.0% |
| 45 to 59 Minutes | 0 | 0.0% |
| 60 to 89 Minutes | 30 | 6.2% |
| 90 or more Minutes | 27 | 5.6% |
Commute Time by Sex in West Kennebunk
The most common commute times in West Kennebunk are 10 to 14 minutes (78 commuters, 29.8%) for males and 5 to 9 minutes (77 commuters, 35.2%) for females.
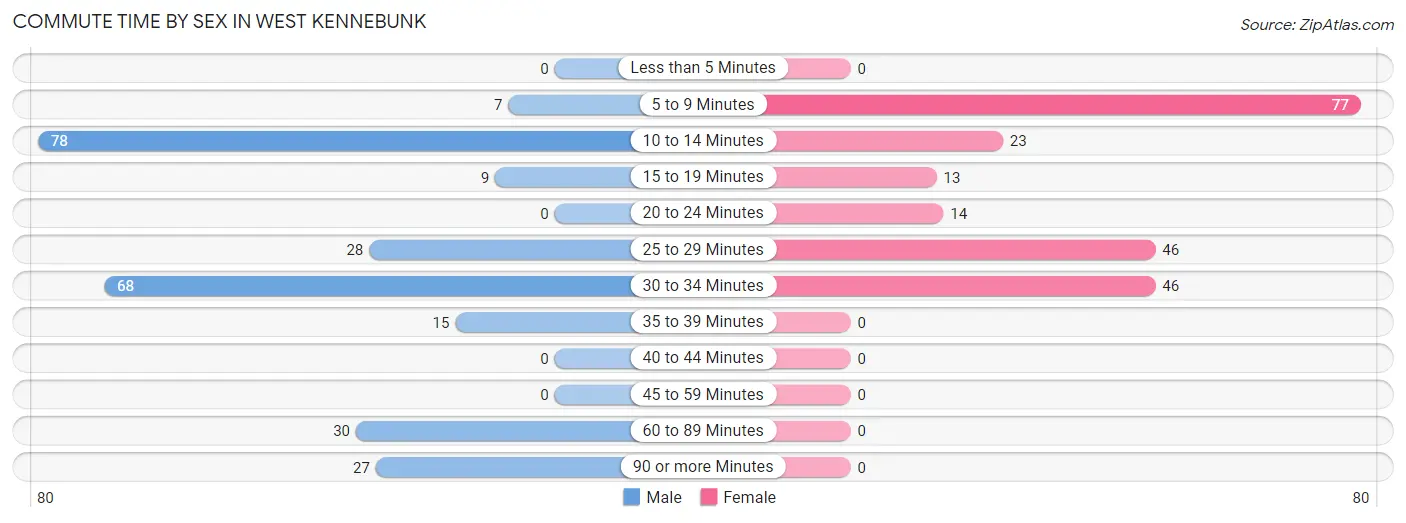
| Commute Time | Male | Female |
| Less than 5 Minutes | 0 (0.0%) | 0 (0.0%) |
| 5 to 9 Minutes | 7 (2.7%) | 77 (35.2%) |
| 10 to 14 Minutes | 78 (29.8%) | 23 (10.5%) |
| 15 to 19 Minutes | 9 (3.4%) | 13 (5.9%) |
| 20 to 24 Minutes | 0 (0.0%) | 14 (6.4%) |
| 25 to 29 Minutes | 28 (10.7%) | 46 (21.0%) |
| 30 to 34 Minutes | 68 (26.0%) | 46 (21.0%) |
| 35 to 39 Minutes | 15 (5.7%) | 0 (0.0%) |
| 40 to 44 Minutes | 0 (0.0%) | 0 (0.0%) |
| 45 to 59 Minutes | 0 (0.0%) | 0 (0.0%) |
| 60 to 89 Minutes | 30 (11.5%) | 0 (0.0%) |
| 90 or more Minutes | 27 (10.3%) | 0 (0.0%) |
Time of Departure to Work by Sex in West Kennebunk
The most frequent times of departure to work in West Kennebunk are 6:00 AM to 6:29 AM (70, 26.7%) for males and 5:30 AM to 5:59 AM (54, 24.7%) for females.
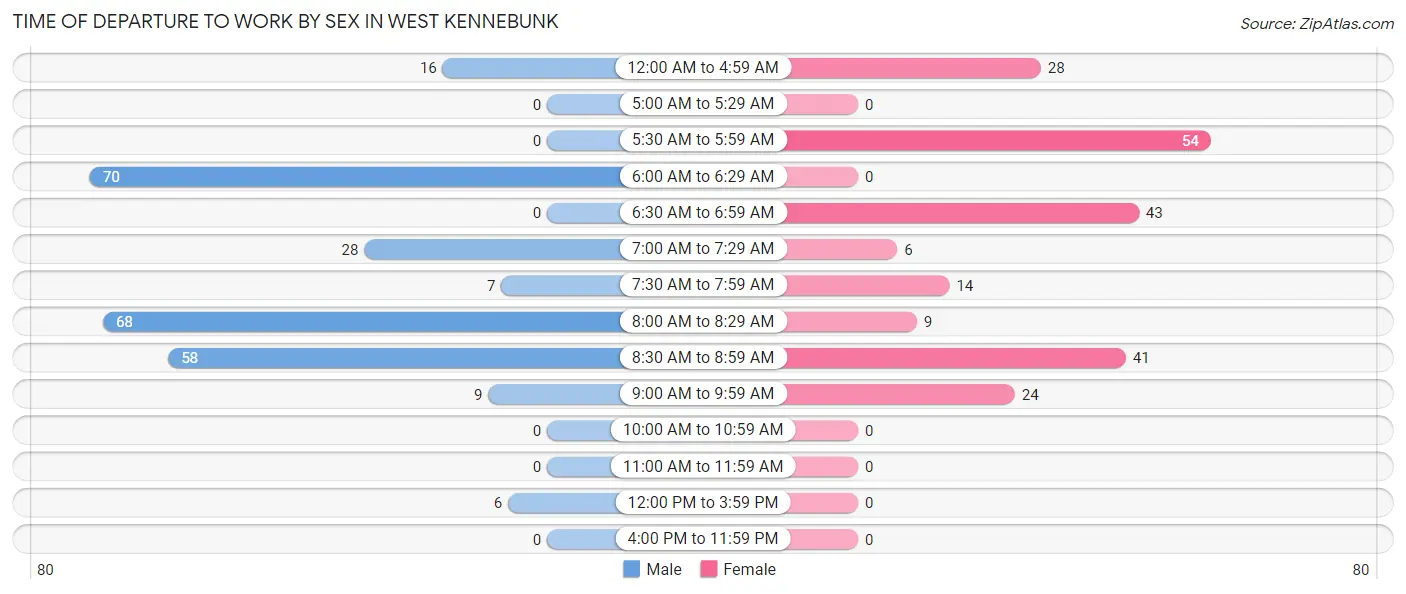
| Time of Departure | Male | Female |
| 12:00 AM to 4:59 AM | 16 (6.1%) | 28 (12.8%) |
| 5:00 AM to 5:29 AM | 0 (0.0%) | 0 (0.0%) |
| 5:30 AM to 5:59 AM | 0 (0.0%) | 54 (24.7%) |
| 6:00 AM to 6:29 AM | 70 (26.7%) | 0 (0.0%) |
| 6:30 AM to 6:59 AM | 0 (0.0%) | 43 (19.6%) |
| 7:00 AM to 7:29 AM | 28 (10.7%) | 6 (2.7%) |
| 7:30 AM to 7:59 AM | 7 (2.7%) | 14 (6.4%) |
| 8:00 AM to 8:29 AM | 68 (26.0%) | 9 (4.1%) |
| 8:30 AM to 8:59 AM | 58 (22.1%) | 41 (18.7%) |
| 9:00 AM to 9:59 AM | 9 (3.4%) | 24 (11.0%) |
| 10:00 AM to 10:59 AM | 0 (0.0%) | 0 (0.0%) |
| 11:00 AM to 11:59 AM | 0 (0.0%) | 0 (0.0%) |
| 12:00 PM to 3:59 PM | 6 (2.3%) | 0 (0.0%) |
| 4:00 PM to 11:59 PM | 0 (0.0%) | 0 (0.0%) |
| Total | 262 (100.0%) | 219 (100.0%) |
Housing Occupancy in West Kennebunk
Occupancy by Ownership in West Kennebunk
Of the total 473 dwellings in West Kennebunk, owner-occupied units account for 272 (57.5%), while renter-occupied units make up 201 (42.5%).
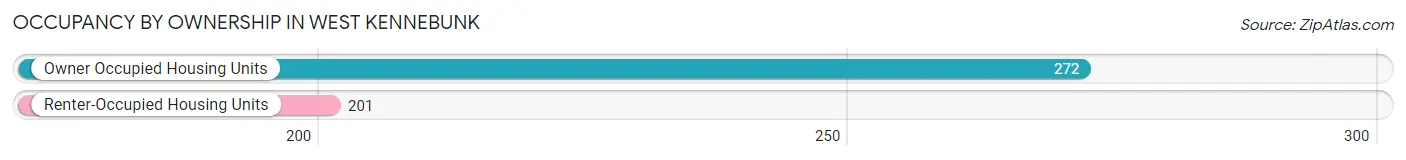
| Occupancy | # Housing Units | % Housing Units |
| Owner Occupied Housing Units | 272 | 57.5% |
| Renter-Occupied Housing Units | 201 | 42.5% |
| Total Occupied Housing Units | 473 | 100.0% |
Occupancy by Household Size in West Kennebunk
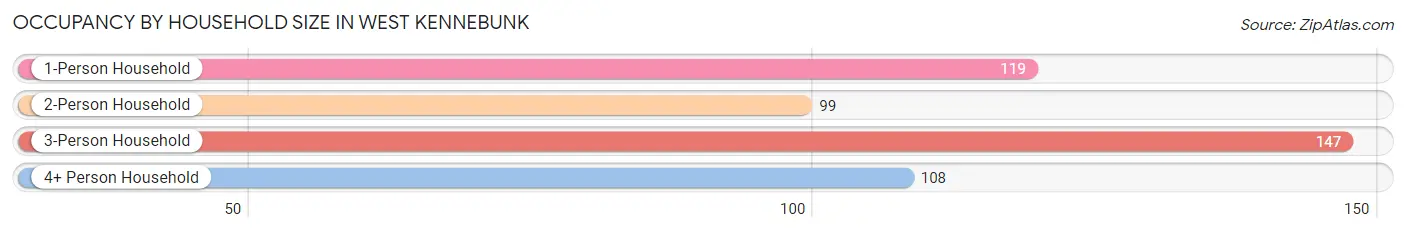
| Household Size | # Housing Units | % Housing Units |
| 1-Person Household | 119 | 25.2% |
| 2-Person Household | 99 | 20.9% |
| 3-Person Household | 147 | 31.1% |
| 4+ Person Household | 108 | 22.8% |
| Total Housing Units | 473 | 100.0% |
Occupancy by Ownership by Household Size in West Kennebunk
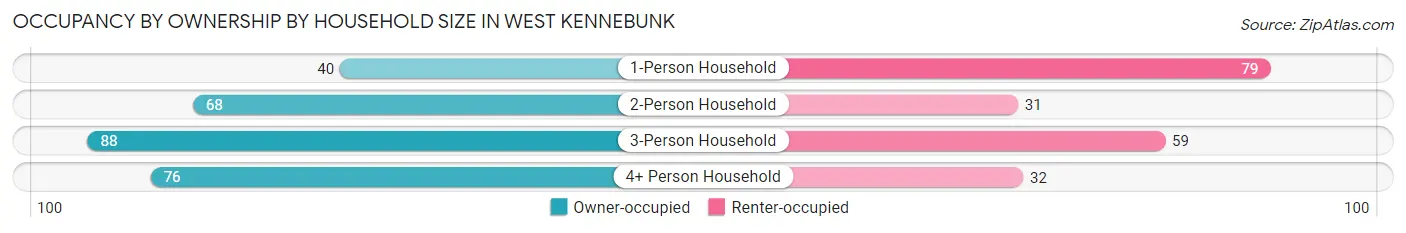
| Household Size | Owner-occupied | Renter-occupied |
| 1-Person Household | 40 (33.6%) | 79 (66.4%) |
| 2-Person Household | 68 (68.7%) | 31 (31.3%) |
| 3-Person Household | 88 (59.9%) | 59 (40.1%) |
| 4+ Person Household | 76 (70.4%) | 32 (29.6%) |
| Total Housing Units | 272 (57.5%) | 201 (42.5%) |
Occupancy by Educational Attainment in West Kennebunk
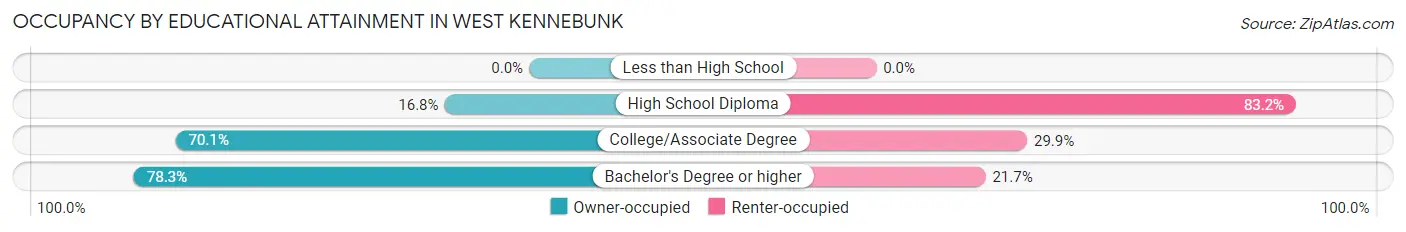
| Household Size | Owner-occupied | Renter-occupied |
| Less than High School | 0 (0.0%) | 0 (0.0%) |
| High School Diploma | 24 (16.8%) | 119 (83.2%) |
| College/Associate Degree | 89 (70.1%) | 38 (29.9%) |
| Bachelor's Degree or higher | 159 (78.3%) | 44 (21.7%) |
Occupancy by Age of Householder in West Kennebunk
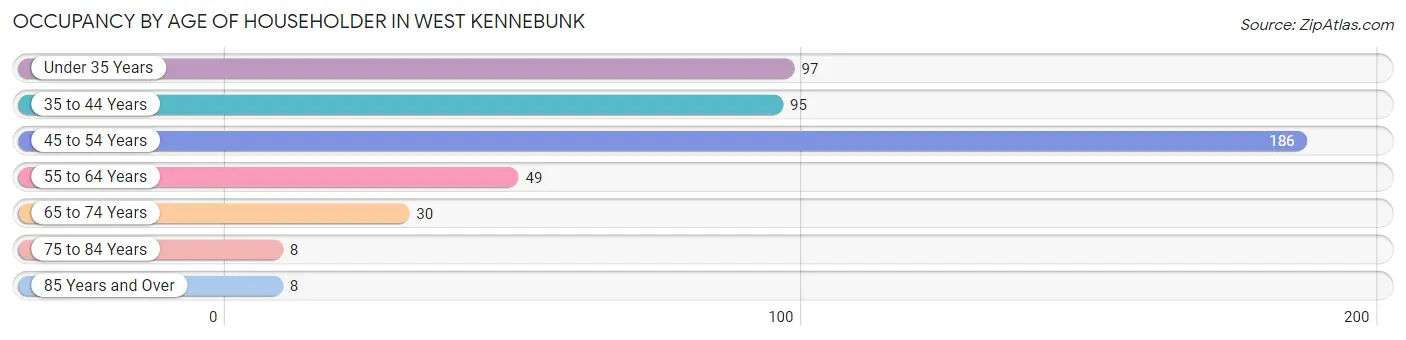
| Age Bracket | # Households | % Households |
| Under 35 Years | 97 | 20.5% |
| 35 to 44 Years | 95 | 20.1% |
| 45 to 54 Years | 186 | 39.3% |
| 55 to 64 Years | 49 | 10.4% |
| 65 to 74 Years | 30 | 6.3% |
| 75 to 84 Years | 8 | 1.7% |
| 85 Years and Over | 8 | 1.7% |
| Total | 473 | 100.0% |
Housing Finances in West Kennebunk
Median Income by Occupancy in West Kennebunk
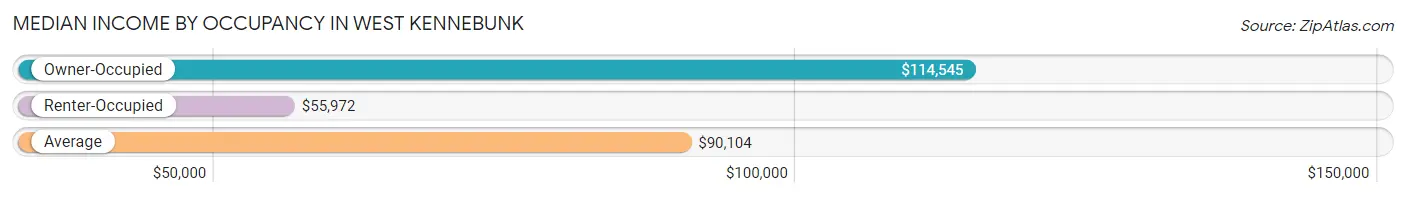
| Occupancy Type | # Households | Median Income |
| Owner-Occupied | 272 (57.5%) | $114,545 |
| Renter-Occupied | 201 (42.5%) | $55,972 |
| Average | 473 (100.0%) | $90,104 |
Occupancy by Householder Income Bracket in West Kennebunk
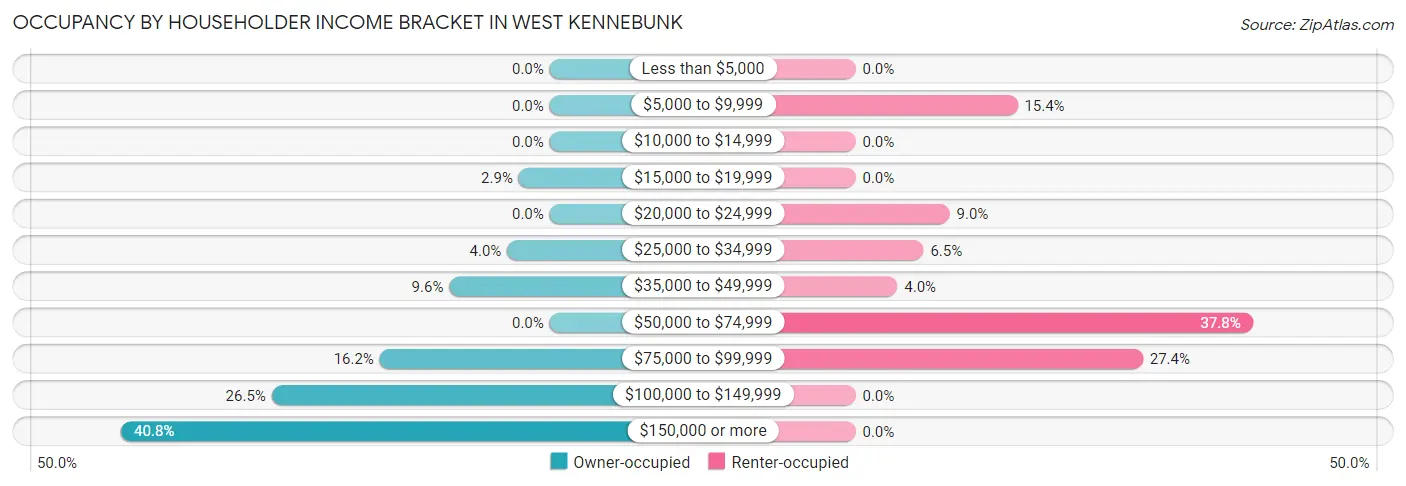
| Income Bracket | Owner-occupied | Renter-occupied |
| Less than $5,000 | 0 (0.0%) | 0 (0.0%) |
| $5,000 to $9,999 | 0 (0.0%) | 31 (15.4%) |
| $10,000 to $14,999 | 0 (0.0%) | 0 (0.0%) |
| $15,000 to $19,999 | 8 (2.9%) | 0 (0.0%) |
| $20,000 to $24,999 | 0 (0.0%) | 18 (9.0%) |
| $25,000 to $34,999 | 11 (4.0%) | 13 (6.5%) |
| $35,000 to $49,999 | 26 (9.6%) | 8 (4.0%) |
| $50,000 to $74,999 | 0 (0.0%) | 76 (37.8%) |
| $75,000 to $99,999 | 44 (16.2%) | 55 (27.4%) |
| $100,000 to $149,999 | 72 (26.5%) | 0 (0.0%) |
| $150,000 or more | 111 (40.8%) | 0 (0.0%) |
| Total | 272 (100.0%) | 201 (100.0%) |
Monthly Housing Cost Tiers in West Kennebunk
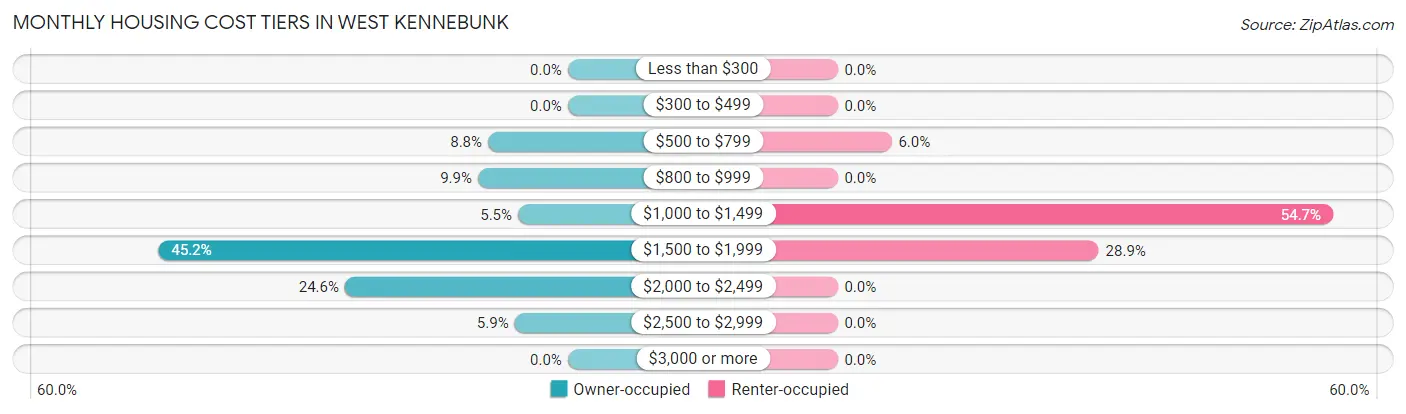
| Monthly Cost | Owner-occupied | Renter-occupied |
| Less than $300 | 0 (0.0%) | 0 (0.0%) |
| $300 to $499 | 0 (0.0%) | 0 (0.0%) |
| $500 to $799 | 24 (8.8%) | 12 (6.0%) |
| $800 to $999 | 27 (9.9%) | 0 (0.0%) |
| $1,000 to $1,499 | 15 (5.5%) | 110 (54.7%) |
| $1,500 to $1,999 | 123 (45.2%) | 58 (28.9%) |
| $2,000 to $2,499 | 67 (24.6%) | 0 (0.0%) |
| $2,500 to $2,999 | 16 (5.9%) | 0 (0.0%) |
| $3,000 or more | 0 (0.0%) | 0 (0.0%) |
| Total | 272 (100.0%) | 201 (100.0%) |
Physical Housing Characteristics in West Kennebunk
Housing Structures in West Kennebunk
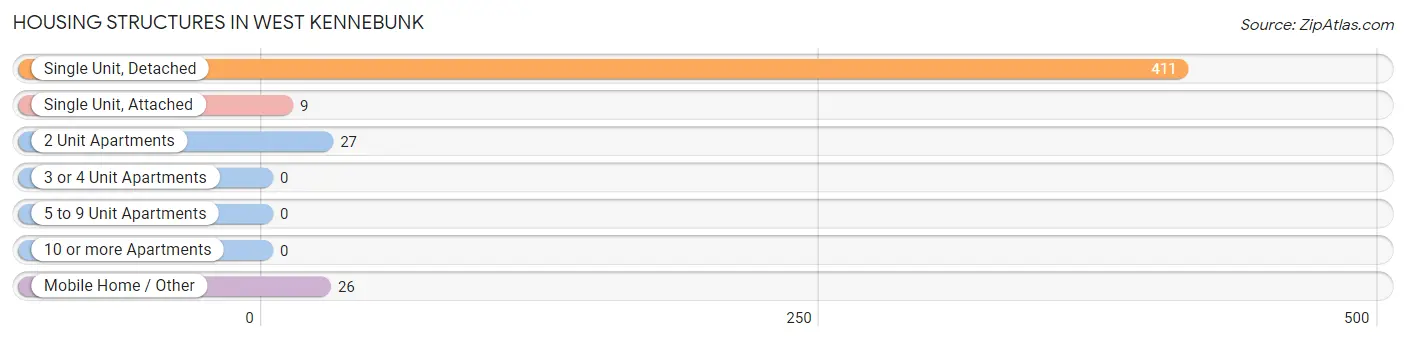
| Structure Type | # Housing Units | % Housing Units |
| Single Unit, Detached | 411 | 86.9% |
| Single Unit, Attached | 9 | 1.9% |
| 2 Unit Apartments | 27 | 5.7% |
| 3 or 4 Unit Apartments | 0 | 0.0% |
| 5 to 9 Unit Apartments | 0 | 0.0% |
| 10 or more Apartments | 0 | 0.0% |
| Mobile Home / Other | 26 | 5.5% |
| Total | 473 | 100.0% |
Housing Structures by Occupancy in West Kennebunk
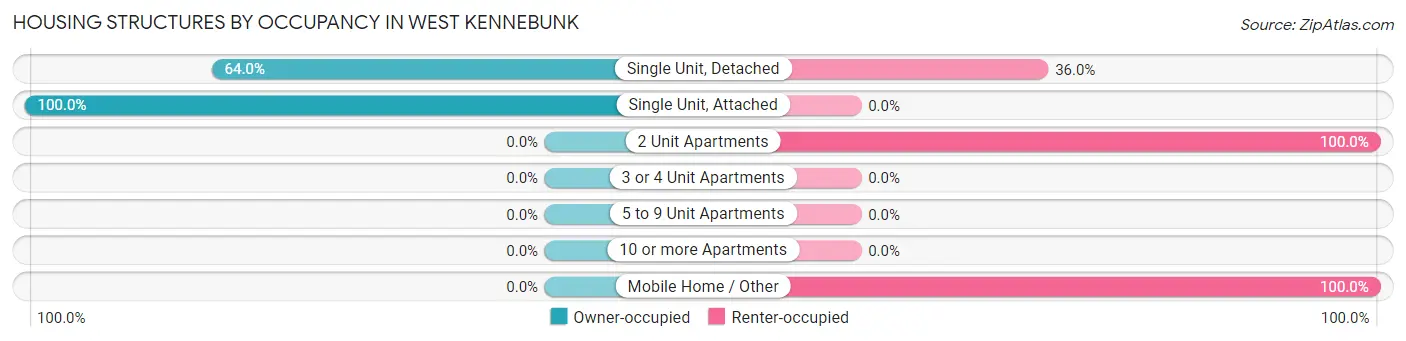
| Structure Type | Owner-occupied | Renter-occupied |
| Single Unit, Detached | 263 (64.0%) | 148 (36.0%) |
| Single Unit, Attached | 9 (100.0%) | 0 (0.0%) |
| 2 Unit Apartments | 0 (0.0%) | 27 (100.0%) |
| 3 or 4 Unit Apartments | 0 (0.0%) | 0 (0.0%) |
| 5 to 9 Unit Apartments | 0 (0.0%) | 0 (0.0%) |
| 10 or more Apartments | 0 (0.0%) | 0 (0.0%) |
| Mobile Home / Other | 0 (0.0%) | 26 (100.0%) |
| Total | 272 (57.5%) | 201 (42.5%) |
Housing Structures by Number of Rooms in West Kennebunk
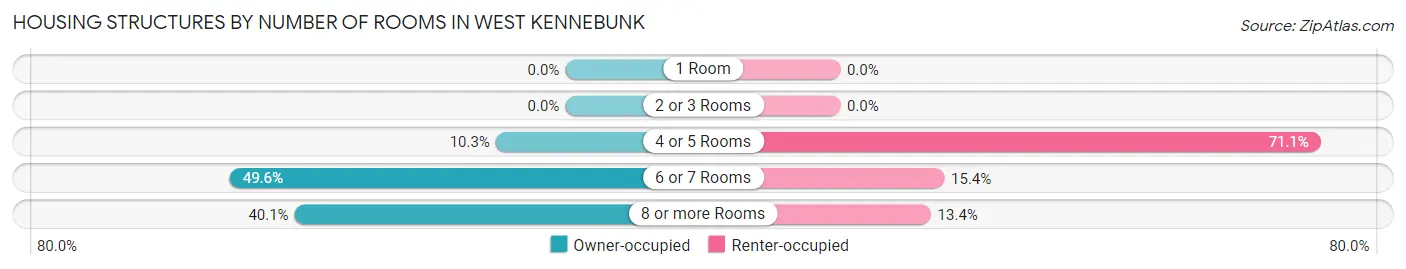
| Number of Rooms | Owner-occupied | Renter-occupied |
| 1 Room | 0 (0.0%) | 0 (0.0%) |
| 2 or 3 Rooms | 0 (0.0%) | 0 (0.0%) |
| 4 or 5 Rooms | 28 (10.3%) | 143 (71.1%) |
| 6 or 7 Rooms | 135 (49.6%) | 31 (15.4%) |
| 8 or more Rooms | 109 (40.1%) | 27 (13.4%) |
| Total | 272 (100.0%) | 201 (100.0%) |
Housing Structure by Heating Type in West Kennebunk
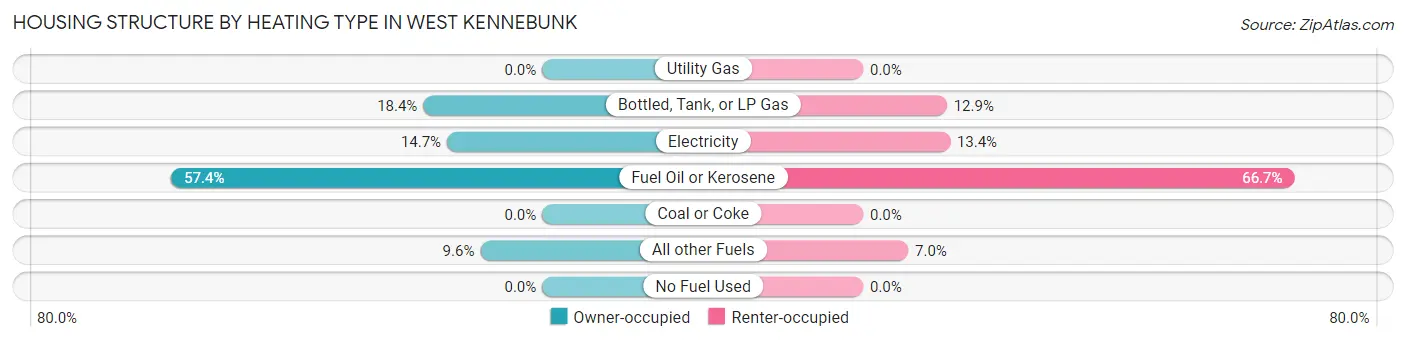
| Heating Type | Owner-occupied | Renter-occupied |
| Utility Gas | 0 (0.0%) | 0 (0.0%) |
| Bottled, Tank, or LP Gas | 50 (18.4%) | 26 (12.9%) |
| Electricity | 40 (14.7%) | 27 (13.4%) |
| Fuel Oil or Kerosene | 156 (57.4%) | 134 (66.7%) |
| Coal or Coke | 0 (0.0%) | 0 (0.0%) |
| All other Fuels | 26 (9.6%) | 14 (7.0%) |
| No Fuel Used | 0 (0.0%) | 0 (0.0%) |
| Total | 272 (100.0%) | 201 (100.0%) |
Household Vehicle Usage in West Kennebunk
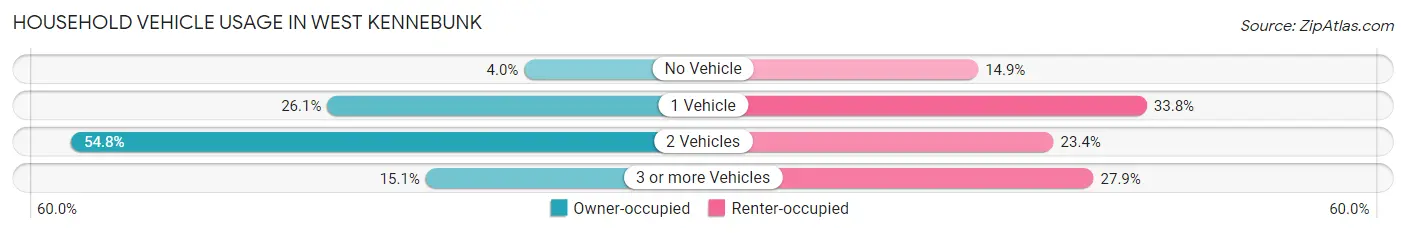
| Vehicles per Household | Owner-occupied | Renter-occupied |
| No Vehicle | 11 (4.0%) | 30 (14.9%) |
| 1 Vehicle | 71 (26.1%) | 68 (33.8%) |
| 2 Vehicles | 149 (54.8%) | 47 (23.4%) |
| 3 or more Vehicles | 41 (15.1%) | 56 (27.9%) |
| Total | 272 (100.0%) | 201 (100.0%) |
Real Estate & Mortgages in West Kennebunk
Real Estate and Mortgage Overview in West Kennebunk
| Characteristic | Without Mortgage | With Mortgage |
| Housing Units | 51 | 221 |
| Median Property Value | $582,200 | $420,900 |
| Median Household Income | $250,001 | $84 |
| Monthly Housing Costs | $806 | $0 |
| Real Estate Taxes | $4,056 | $0 |
Property Value by Mortgage Status in West Kennebunk
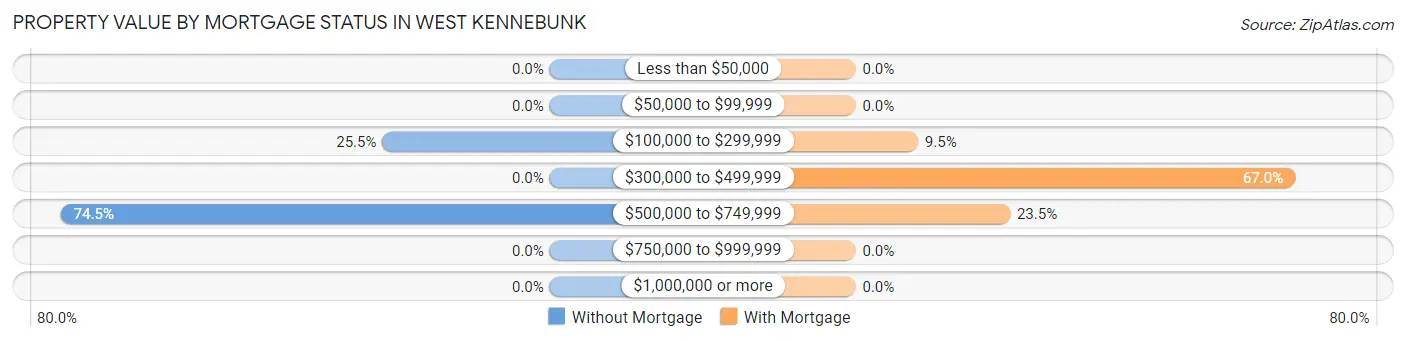
| Property Value | Without Mortgage | With Mortgage |
| Less than $50,000 | 0 (0.0%) | 0 (0.0%) |
| $50,000 to $99,999 | 0 (0.0%) | 0 (0.0%) |
| $100,000 to $299,999 | 13 (25.5%) | 21 (9.5%) |
| $300,000 to $499,999 | 0 (0.0%) | 148 (67.0%) |
| $500,000 to $749,999 | 38 (74.5%) | 52 (23.5%) |
| $750,000 to $999,999 | 0 (0.0%) | 0 (0.0%) |
| $1,000,000 or more | 0 (0.0%) | 0 (0.0%) |
| Total | 51 (100.0%) | 221 (100.0%) |
Household Income by Mortgage Status in West Kennebunk
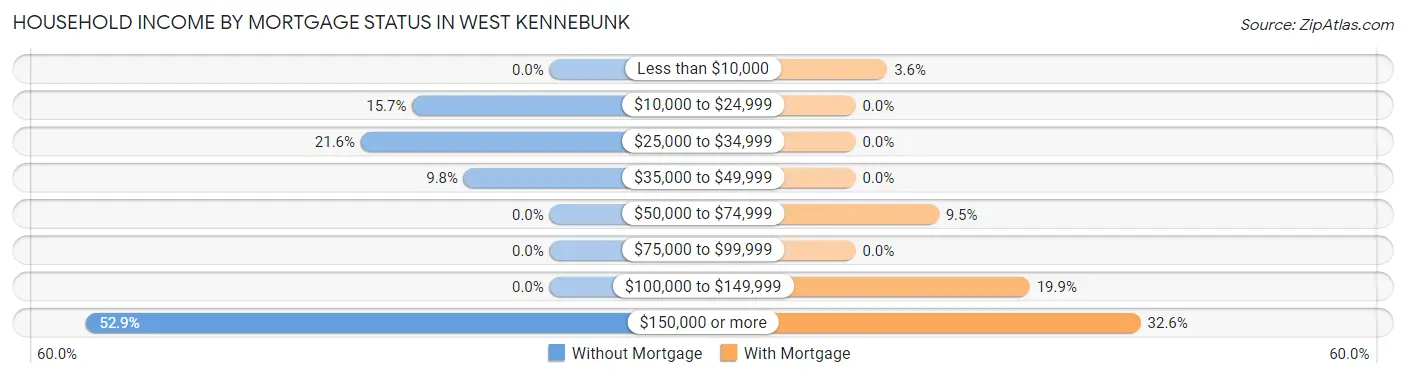
| Household Income | Without Mortgage | With Mortgage |
| Less than $10,000 | 0 (0.0%) | 8 (3.6%) |
| $10,000 to $24,999 | 8 (15.7%) | 0 (0.0%) |
| $25,000 to $34,999 | 11 (21.6%) | 0 (0.0%) |
| $35,000 to $49,999 | 5 (9.8%) | 0 (0.0%) |
| $50,000 to $74,999 | 0 (0.0%) | 21 (9.5%) |
| $75,000 to $99,999 | 0 (0.0%) | 0 (0.0%) |
| $100,000 to $149,999 | 0 (0.0%) | 44 (19.9%) |
| $150,000 or more | 27 (52.9%) | 72 (32.6%) |
| Total | 51 (100.0%) | 221 (100.0%) |
Property Value to Household Income Ratio in West Kennebunk
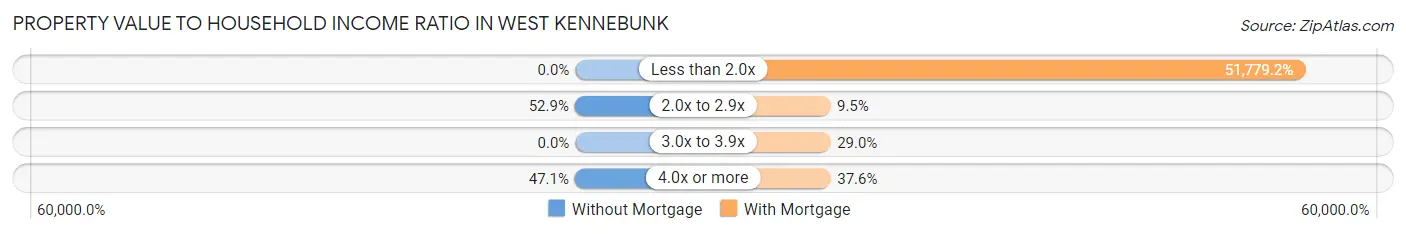
| Value-to-Income Ratio | Without Mortgage | With Mortgage |
| Less than 2.0x | 0 (0.0%) | 114,432 (51,779.2%) |
| 2.0x to 2.9x | 27 (52.9%) | 21 (9.5%) |
| 3.0x to 3.9x | 0 (0.0%) | 64 (29.0%) |
| 4.0x or more | 24 (47.1%) | 83 (37.6%) |
| Total | 51 (100.0%) | 221 (100.0%) |
Real Estate Taxes by Mortgage Status in West Kennebunk
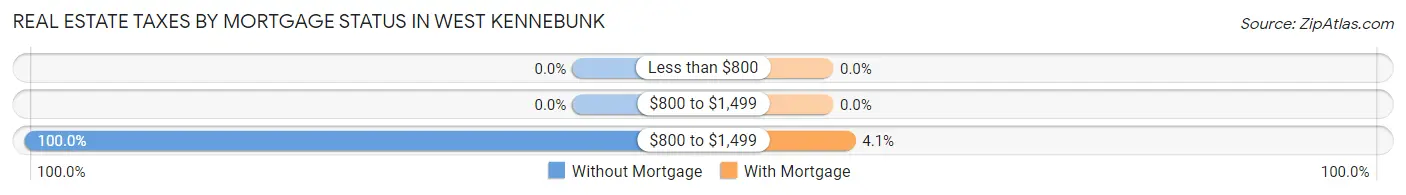
| Property Taxes | Without Mortgage | With Mortgage |
| Less than $800 | 0 (0.0%) | 0 (0.0%) |
| $800 to $1,499 | 0 (0.0%) | 0 (0.0%) |
| $800 to $1,499 | 51 (100.0%) | 9 (4.1%) |
| Total | 51 (100.0%) | 221 (100.0%) |
Health & Disability in West Kennebunk
Health Insurance Coverage by Age in West Kennebunk
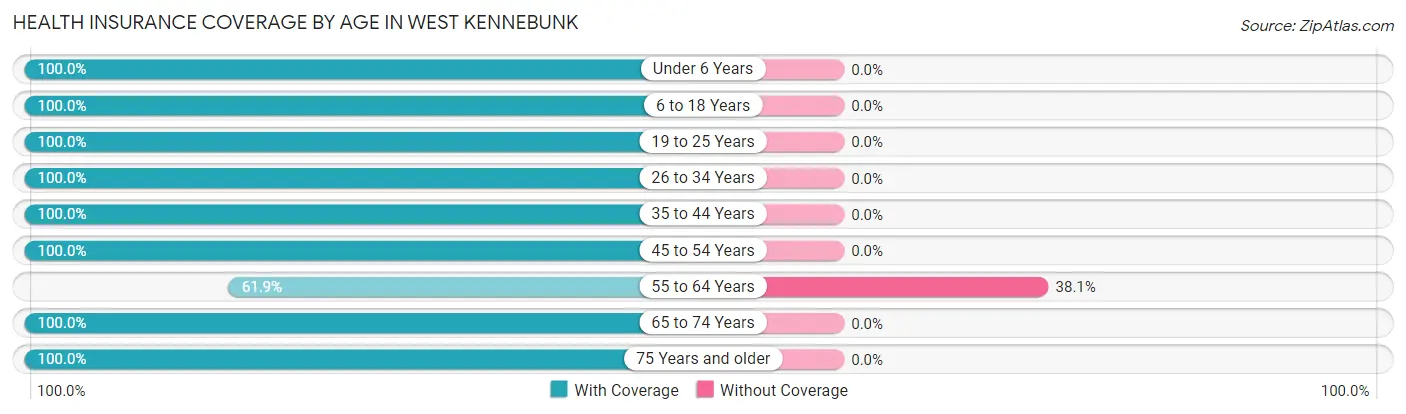
| Age Bracket | With Coverage | Without Coverage |
| Under 6 Years | 103 (100.0%) | 0 (0.0%) |
| 6 to 18 Years | 350 (100.0%) | 0 (0.0%) |
| 19 to 25 Years | 50 (100.0%) | 0 (0.0%) |
| 26 to 34 Years | 143 (100.0%) | 0 (0.0%) |
| 35 to 44 Years | 202 (100.0%) | 0 (0.0%) |
| 45 to 54 Years | 251 (100.0%) | 0 (0.0%) |
| 55 to 64 Years | 65 (61.9%) | 40 (38.1%) |
| 65 to 74 Years | 30 (100.0%) | 0 (0.0%) |
| 75 Years and older | 35 (100.0%) | 0 (0.0%) |
| Total | 1,229 (96.9%) | 40 (3.2%) |
Health Insurance Coverage by Citizenship Status in West Kennebunk
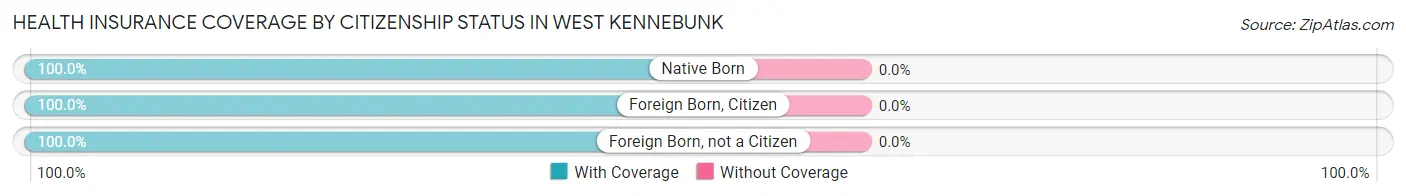
| Citizenship Status | With Coverage | Without Coverage |
| Native Born | 103 (100.0%) | 0 (0.0%) |
| Foreign Born, Citizen | 350 (100.0%) | 0 (0.0%) |
| Foreign Born, not a Citizen | 50 (100.0%) | 0 (0.0%) |
Health Insurance Coverage by Household Income in West Kennebunk
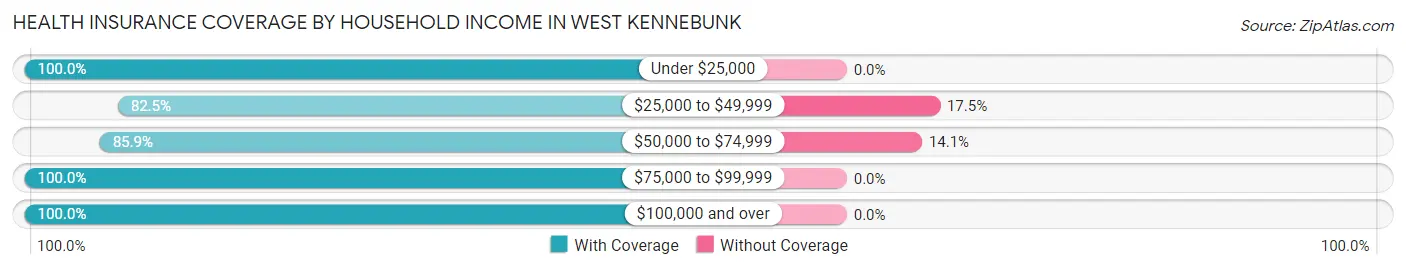
| Household Income | With Coverage | Without Coverage |
| Under $25,000 | 95 (100.0%) | 0 (0.0%) |
| $25,000 to $49,999 | 52 (82.5%) | 11 (17.5%) |
| $50,000 to $74,999 | 177 (85.9%) | 29 (14.1%) |
| $75,000 to $99,999 | 230 (100.0%) | 0 (0.0%) |
| $100,000 and over | 669 (100.0%) | 0 (0.0%) |
Public vs Private Health Insurance Coverage by Age in West Kennebunk
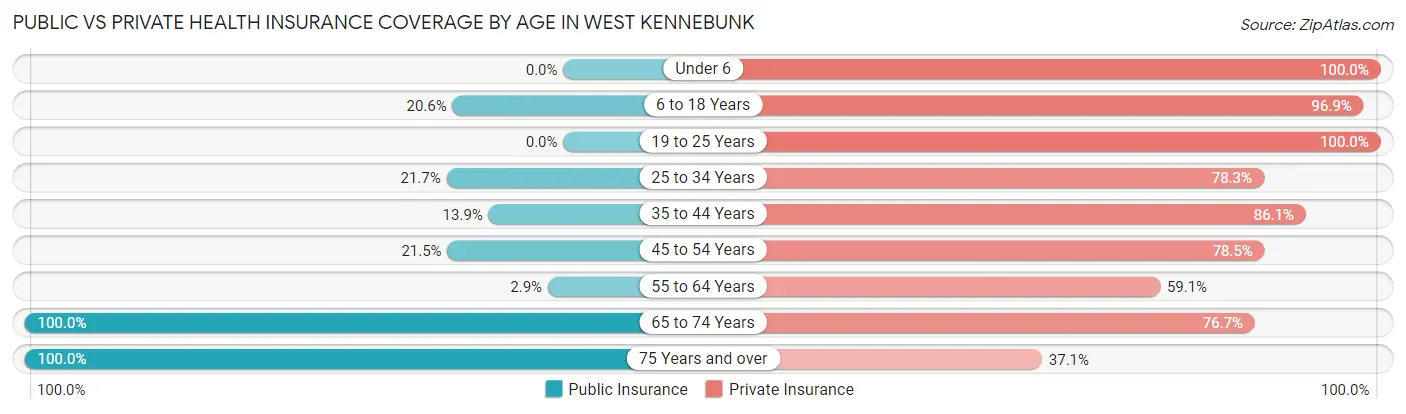
| Age Bracket | Public Insurance | Private Insurance |
| Under 6 | 0 (0.0%) | 103 (100.0%) |
| 6 to 18 Years | 72 (20.6%) | 339 (96.9%) |
| 19 to 25 Years | 0 (0.0%) | 50 (100.0%) |
| 25 to 34 Years | 31 (21.7%) | 112 (78.3%) |
| 35 to 44 Years | 28 (13.9%) | 174 (86.1%) |
| 45 to 54 Years | 54 (21.5%) | 197 (78.5%) |
| 55 to 64 Years | 3 (2.9%) | 62 (59.1%) |
| 65 to 74 Years | 30 (100.0%) | 23 (76.7%) |
| 75 Years and over | 35 (100.0%) | 13 (37.1%) |
| Total | 253 (19.9%) | 1,073 (84.6%) |
Disability Status by Sex by Age in West Kennebunk
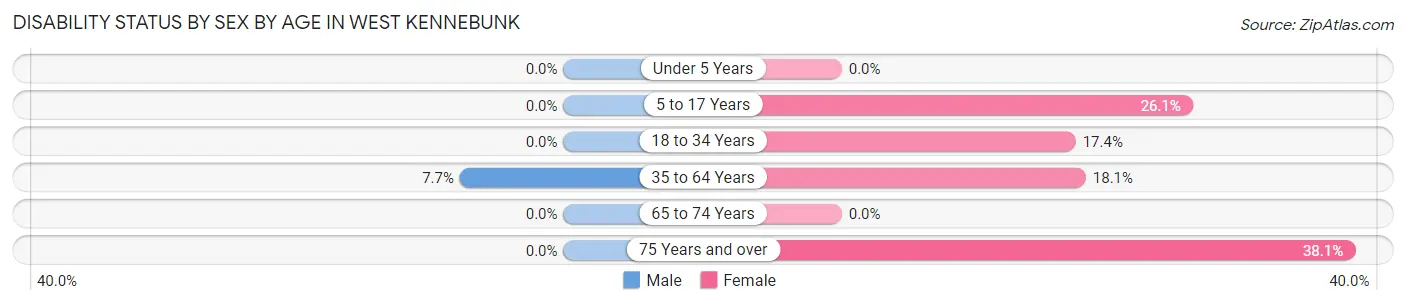
| Age Bracket | Male | Female |
| Under 5 Years | 0 (0.0%) | 0 (0.0%) |
| 5 to 17 Years | 0 (0.0%) | 31 (26.1%) |
| 18 to 34 Years | 0 (0.0%) | 29 (17.4%) |
| 35 to 64 Years | 20 (7.7%) | 54 (18.1%) |
| 65 to 74 Years | 0 (0.0%) | 0 (0.0%) |
| 75 Years and over | 0 (0.0%) | 8 (38.1%) |
Disability Class by Sex by Age in West Kennebunk
Disability Class: Hearing Difficulty
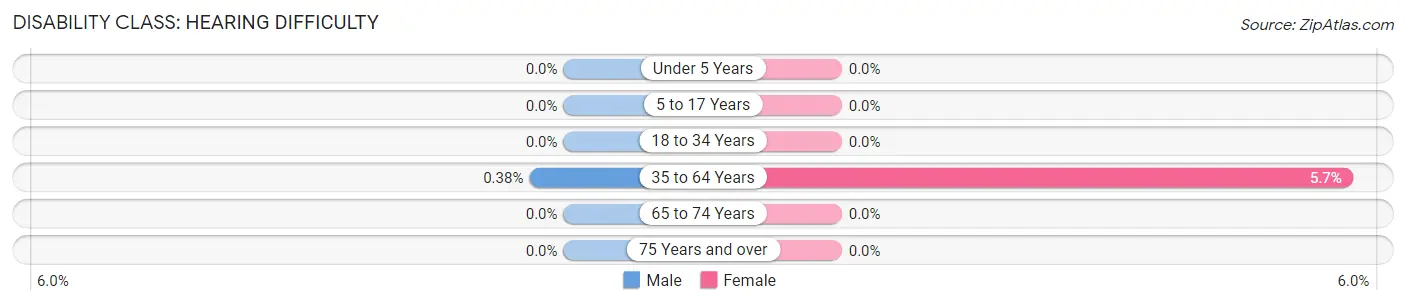
| Age Bracket | Male | Female |
| Under 5 Years | 0 (0.0%) | 0 (0.0%) |
| 5 to 17 Years | 0 (0.0%) | 0 (0.0%) |
| 18 to 34 Years | 0 (0.0%) | 0 (0.0%) |
| 35 to 64 Years | 1 (0.4%) | 17 (5.7%) |
| 65 to 74 Years | 0 (0.0%) | 0 (0.0%) |
| 75 Years and over | 0 (0.0%) | 0 (0.0%) |
Disability Class: Vision Difficulty
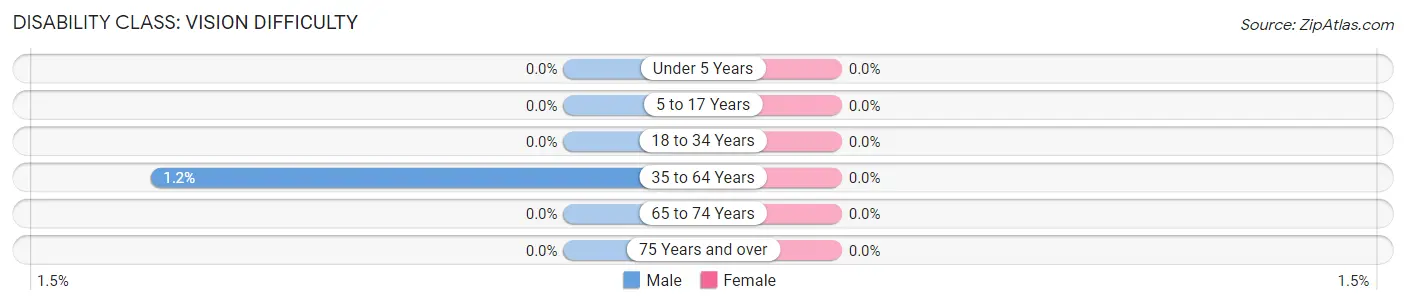
| Age Bracket | Male | Female |
| Under 5 Years | 0 (0.0%) | 0 (0.0%) |
| 5 to 17 Years | 0 (0.0%) | 0 (0.0%) |
| 18 to 34 Years | 0 (0.0%) | 0 (0.0%) |
| 35 to 64 Years | 3 (1.1%) | 0 (0.0%) |
| 65 to 74 Years | 0 (0.0%) | 0 (0.0%) |
| 75 Years and over | 0 (0.0%) | 0 (0.0%) |
Disability Class: Cognitive Difficulty
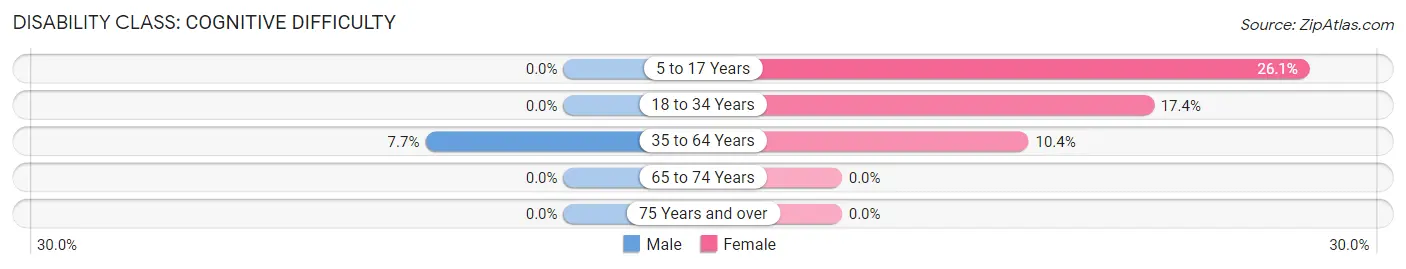
| Age Bracket | Male | Female |
| 5 to 17 Years | 0 (0.0%) | 31 (26.1%) |
| 18 to 34 Years | 0 (0.0%) | 29 (17.4%) |
| 35 to 64 Years | 20 (7.7%) | 31 (10.4%) |
| 65 to 74 Years | 0 (0.0%) | 0 (0.0%) |
| 75 Years and over | 0 (0.0%) | 0 (0.0%) |
Disability Class: Ambulatory Difficulty
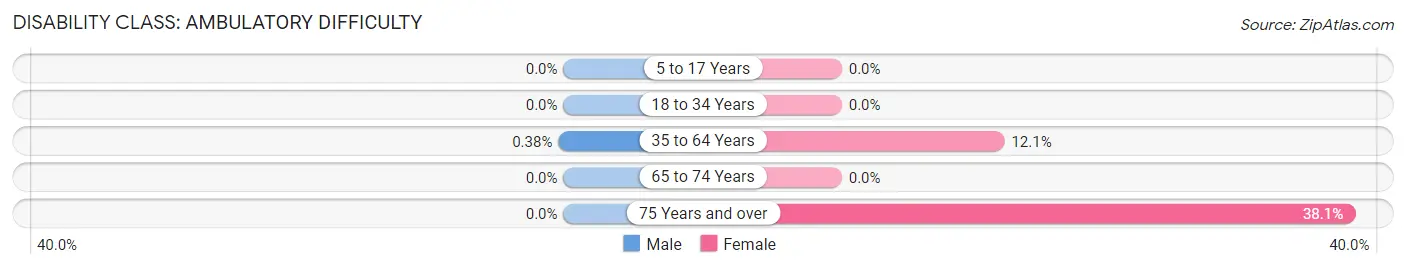
| Age Bracket | Male | Female |
| 5 to 17 Years | 0 (0.0%) | 0 (0.0%) |
| 18 to 34 Years | 0 (0.0%) | 0 (0.0%) |
| 35 to 64 Years | 1 (0.4%) | 36 (12.1%) |
| 65 to 74 Years | 0 (0.0%) | 0 (0.0%) |
| 75 Years and over | 0 (0.0%) | 8 (38.1%) |
Disability Class: Self-Care Difficulty
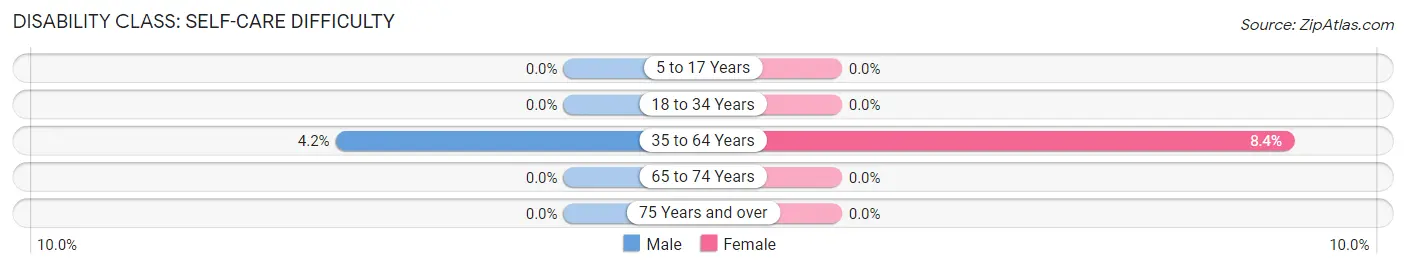
| Age Bracket | Male | Female |
| 5 to 17 Years | 0 (0.0%) | 0 (0.0%) |
| 18 to 34 Years | 0 (0.0%) | 0 (0.0%) |
| 35 to 64 Years | 11 (4.2%) | 25 (8.4%) |
| 65 to 74 Years | 0 (0.0%) | 0 (0.0%) |
| 75 Years and over | 0 (0.0%) | 0 (0.0%) |
Technology Access in West Kennebunk
Computing Device Access in West Kennebunk
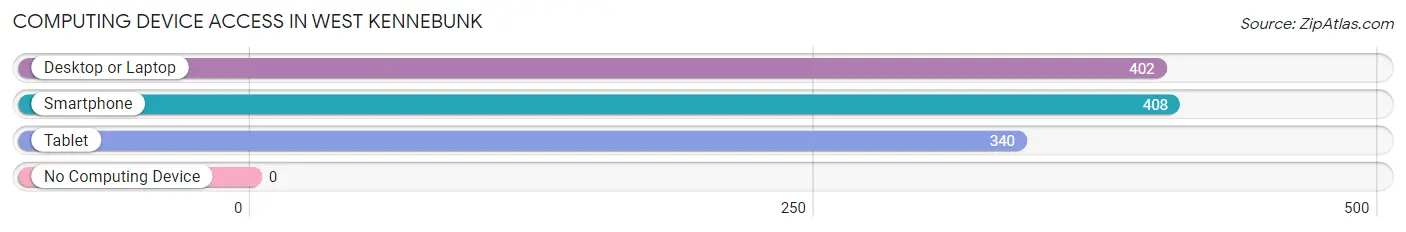
| Device Type | # Households | % Households |
| Desktop or Laptop | 402 | 85.0% |
| Smartphone | 408 | 86.3% |
| Tablet | 340 | 71.9% |
| No Computing Device | 0 | 0.0% |
| Total | 473 | 100.0% |
Internet Access in West Kennebunk
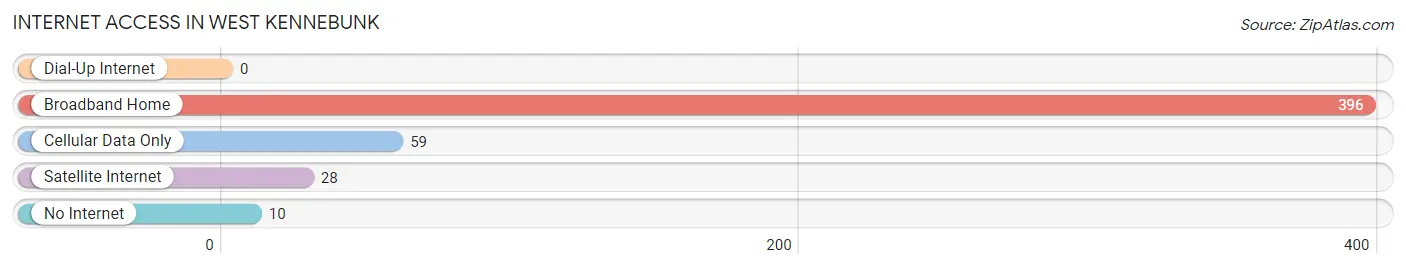
| Internet Type | # Households | % Households |
| Dial-Up Internet | 0 | 0.0% |
| Broadband Home | 396 | 83.7% |
| Cellular Data Only | 59 | 12.5% |
| Satellite Internet | 28 | 5.9% |
| No Internet | 10 | 2.1% |
| Total | 473 | 100.0% |
West Kennebunk Summary
Kennebunk is a town located in York County, Maine, United States. The population was 4,844 at the 2010 census. Kennebunk is part of the Portland–South Portland–Biddeford, Maine metropolitan statistical area.
History
The area now known as Kennebunk was first settled in 1621 by the English. The town was incorporated in 1663 as Cape Porpus, which was later changed to Arundel. In 1820, the town was renamed Kennebunk, after the Kennebunk River.
The town was a major shipbuilding center in the 19th century, and was home to several shipyards. The town was also a major center for the manufacture of ice, which was harvested from the Kennebunk River and shipped around the world.
Geography
Kennebunk is located at 43°22′N 70°32′W (43.37, -70.53). According to the United States Census Bureau, the town has a total area of 24.2 square miles (62.7 km2), of which, 22.7 square miles (58.8 km2) of it is land and 1.5 square miles (3.9 km2) of it (6.17%) is water.
Kennebunk is bordered by the towns of Arundel to the north, Wells to the east, Biddeford to the south, and Kennebunkport to the west.
Economy
Kennebunk is a popular tourist destination, and the town's economy is largely based on tourism. The town is home to several popular beaches, including Gooch's Beach, Middle Beach, and Mother's Beach. The town is also home to several popular restaurants, shops, and galleries.
The town is also home to several businesses, including a number of technology companies, as well as a number of manufacturing companies.
Demographics
As of the census of 2010, there were 4,844 people, 2,093 households, and 1,323 families residing in the town. The population density was 213.3 people per square mile (82.3/km2). There were 2,521 housing units at an average density of 110.9 per square mile (42.8/km2). The racial makeup of the town was 97.2% White, 0.7% African American, 0.2% Native American, 0.7% Asian, 0.1% Pacific Islander, 0.3% from other races, and 0.9% from two or more races. Hispanic or Latino of any race were 1.2% of the population.
There were 2,093 households, out of which 28.2% had children under the age of 18 living with them, 51.2% were married couples living together, 9.3% had a female householder with no husband present, and 36.2% were non-families. 30.2% of all households were made up of individuals, and 13.2% had someone living alone who was 65 years of age or older. The average household size was 2.30 and the average family size was 2.86.
In the town, the population was spread out, with 22.7% under the age of 18, 6.2% from 18 to 24, 25.2% from 25 to 44, 28.3% from 45 to 64, and 17.6% who were 65 years of age or older. The median age was 42 years. For every 100 females, there were 91.2 males. For every 100 females age 18 and over, there were 88.2 males.
The median income for a household in the town was $50,917, and the median income for a family was $62,917. Males had a median income of $45,000 versus $31,250 for females. The per capita income for the town was $27,917. About 4.2% of families and 6.2% of the population were below the poverty line, including 8.2% of those under age 18 and 4.2% of those age 65 or over.
Common Questions
What is Per Capita Income in West Kennebunk?
Per Capita income in West Kennebunk is $38,395.
What is the Median Family Income in West Kennebunk?
Median Family Income in West Kennebunk is $111,563.
What is the Median Household income in West Kennebunk?
Median Household Income in West Kennebunk is $90,104.
What is Income or Wage Gap in West Kennebunk?
Income or Wage Gap in West Kennebunk is 46.9%.
Women in West Kennebunk earn 53.1 cents for every dollar earned by a man.
What is Inequality or Gini Index in West Kennebunk?
Inequality or Gini Index in West Kennebunk is 0.40.
What is the Total Population of West Kennebunk?
Total Population of West Kennebunk is 1,269.
What is the Total Male Population of West Kennebunk?
Total Male Population of West Kennebunk is 614.
What is the Total Female Population of West Kennebunk?
Total Female Population of West Kennebunk is 655.
What is the Ratio of Males per 100 Females in West Kennebunk?
There are 93.74 Males per 100 Females in West Kennebunk.
What is the Ratio of Females per 100 Males in West Kennebunk?
There are 106.68 Females per 100 Males in West Kennebunk.
What is the Median Population Age in West Kennebunk?
Median Population Age in West Kennebunk is 33.9 Years.
What is the Average Family Size in West Kennebunk
Average Family Size in West Kennebunk is 3.2 People.
What is the Average Household Size in West Kennebunk
Average Household Size in West Kennebunk is 2.7 People.
How Large is the Labor Force in West Kennebunk?
There are 643 People in the Labor Forcein in West Kennebunk.
What is the Percentage of People in the Labor Force in West Kennebunk?
73.8% of People are in the Labor Force in West Kennebunk.
What is the Unemployment Rate in West Kennebunk?
Unemployment Rate in West Kennebunk is 14.3%.