Rumford, ME Map & Demographics
Rumford Map
Rumford Overview
$25,958
PER CAPITA INCOME
$59,341
AVG FAMILY INCOME
$35,818
AVG HOUSEHOLD INCOME
39.0%
WAGE / INCOME GAP [ % ]
61.0¢/ $1
WAGE / INCOME GAP [ $ ]
0.48
INEQUALITY / GINI INDEX
3,922
TOTAL POPULATION
2,023
MALE POPULATION
1,899
FEMALE POPULATION
106.53
MALES / 100 FEMALES
93.87
FEMALES / 100 MALES
53.2
MEDIAN AGE
3.1
AVG FAMILY SIZE
2.1
AVG HOUSEHOLD SIZE
1,623
LABOR FORCE [ PEOPLE ]
45.6%
PERCENT IN LABOR FORCE
6.7%
UNEMPLOYMENT RATE
Rumford Zip Codes
Rumford Area Codes
Income in Rumford
Income Overview in Rumford
Per Capita Income in Rumford is $25,958, while median incomes of families and households are $59,341 and $35,818 respectively.
| Characteristic | Number | Measure |
| Per Capita Income | 3,922 | $25,958 |
| Median Family Income | 819 | $59,341 |
| Mean Family Income | 819 | $79,551 |
| Median Household Income | 1,820 | $35,818 |
| Mean Household Income | 1,820 | $53,027 |
| Income Deficit | 819 | $0 |
| Wage / Income Gap (%) | 3,922 | 38.99% |
| Wage / Income Gap ($) | 3,922 | 61.01¢ per $1 |
| Gini / Inequality Index | 3,922 | 0.48 |
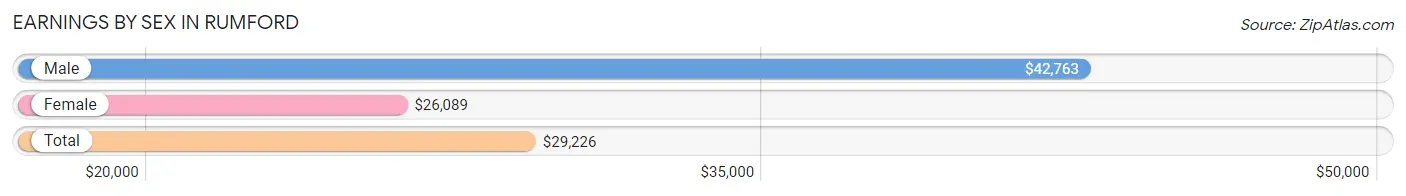
Earnings by Sex in Rumford
Average Earnings in Rumford are $29,226, $42,763 for men and $26,089 for women, a difference of 39.0%.
| Sex | Number | Average Earnings |
| Male | 802 (46.7%) | $42,763 |
| Female | 915 (53.3%) | $26,089 |
| Total | 1,717 (100.0%) | $29,226 |
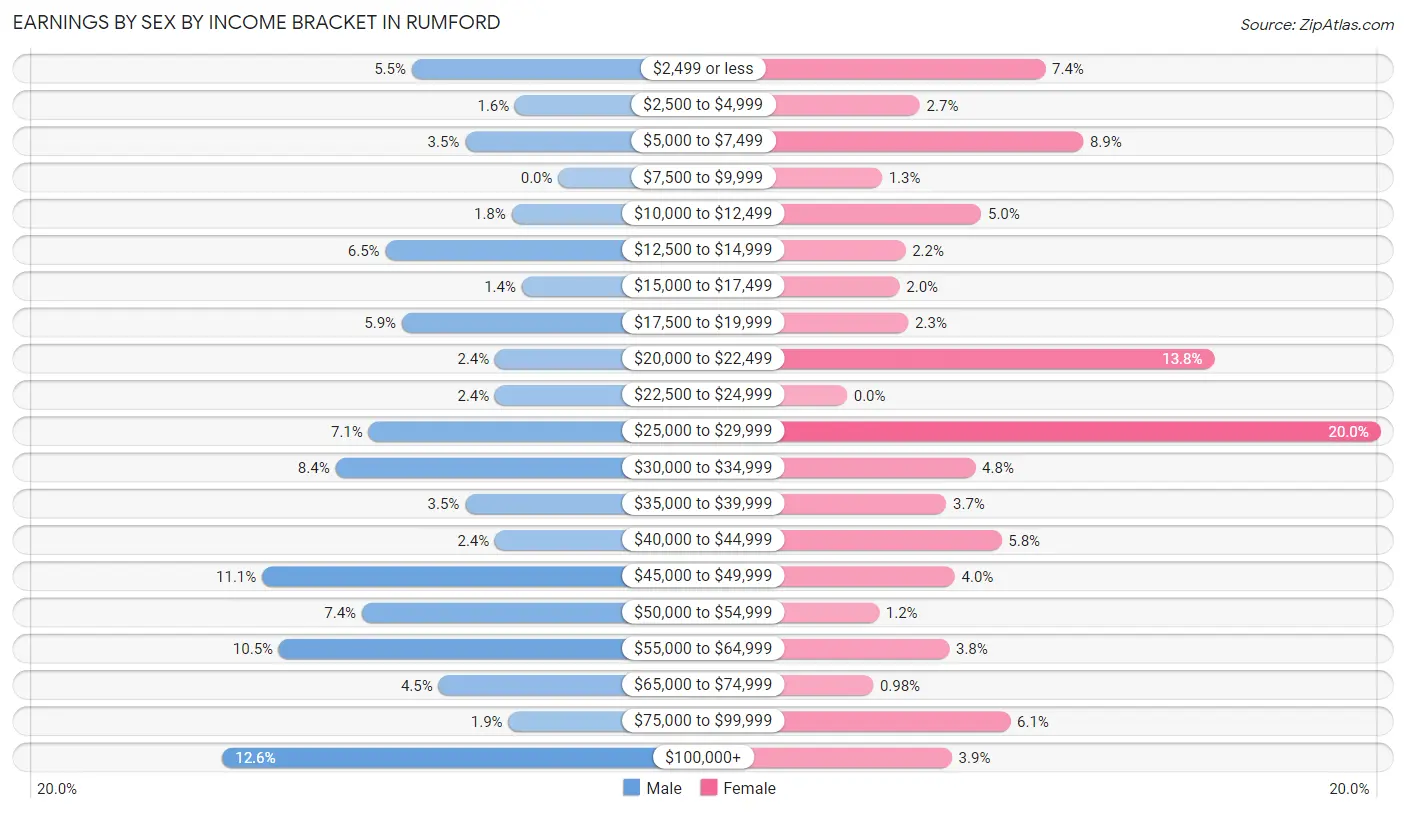
Earnings by Sex by Income Bracket in Rumford
The most common earnings brackets in Rumford are $100,000+ for men (101 | 12.6%) and $25,000 to $29,999 for women (183 | 20.0%).
| Income | Male | Female |
| $2,499 or less | 44 (5.5%) | 68 (7.4%) |
| $2,500 to $4,999 | 13 (1.6%) | 25 (2.7%) |
| $5,000 to $7,499 | 28 (3.5%) | 81 (8.8%) |
| $7,500 to $9,999 | 0 (0.0%) | 12 (1.3%) |
| $10,000 to $12,499 | 14 (1.8%) | 46 (5.0%) |
| $12,500 to $14,999 | 52 (6.5%) | 20 (2.2%) |
| $15,000 to $17,499 | 11 (1.4%) | 18 (2.0%) |
| $17,500 to $19,999 | 47 (5.9%) | 21 (2.3%) |
| $20,000 to $22,499 | 19 (2.4%) | 126 (13.8%) |
| $22,500 to $24,999 | 19 (2.4%) | 0 (0.0%) |
| $25,000 to $29,999 | 57 (7.1%) | 183 (20.0%) |
| $30,000 to $34,999 | 67 (8.4%) | 44 (4.8%) |
| $35,000 to $39,999 | 28 (3.5%) | 34 (3.7%) |
| $40,000 to $44,999 | 19 (2.4%) | 53 (5.8%) |
| $45,000 to $49,999 | 89 (11.1%) | 37 (4.0%) |
| $50,000 to $54,999 | 59 (7.4%) | 11 (1.2%) |
| $55,000 to $64,999 | 84 (10.5%) | 35 (3.8%) |
| $65,000 to $74,999 | 36 (4.5%) | 9 (1.0%) |
| $75,000 to $99,999 | 15 (1.9%) | 56 (6.1%) |
| $100,000+ | 101 (12.6%) | 36 (3.9%) |
| Total | 802 (100.0%) | 915 (100.0%) |
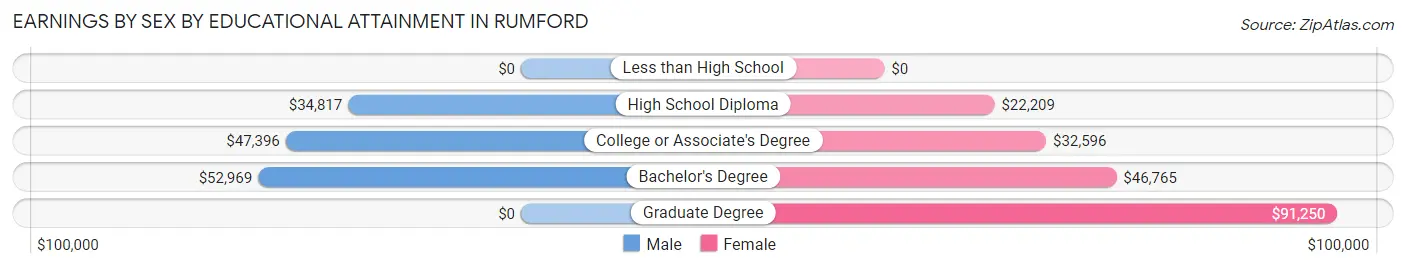
Earnings by Sex by Educational Attainment in Rumford
Average earnings in Rumford are $46,011 for men and $28,292 for women, a difference of 38.5%. Men with an educational attainment of bachelor's degree enjoy the highest average annual earnings of $52,969, while those with high school diploma education earn the least with $34,817. Women with an educational attainment of graduate degree earn the most with the average annual earnings of $91,250, while those with high school diploma education have the smallest earnings of $22,209.
| Educational Attainment | Male Income | Female Income |
| Less than High School | - | - |
| High School Diploma | $34,817 | $22,209 |
| College or Associate's Degree | $47,396 | $32,596 |
| Bachelor's Degree | $52,969 | $46,765 |
| Graduate Degree | - | - |
| Total | $46,011 | $28,292 |
Family Income in Rumford
Family Income Brackets in Rumford
According to the Rumford family income data, there are 254 families falling into the $50,000 to $74,999 income range, which is the most common income bracket and makes up 31.0% of all families. Conversely, the less than $10,000 income bracket is the least frequent group with only 12 families (1.5%) belonging to this category.
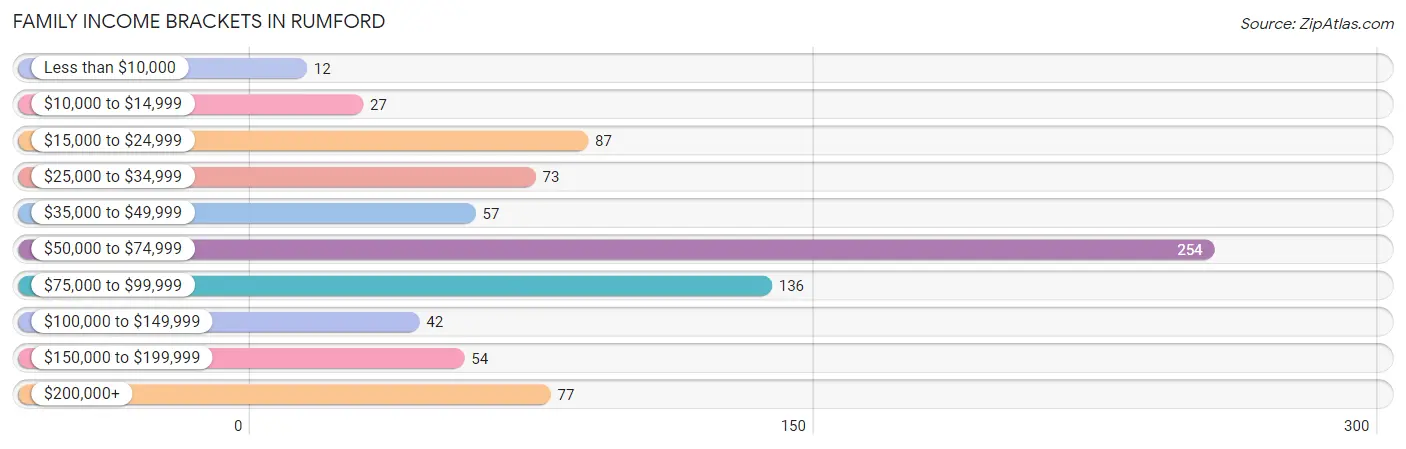
| Income Bracket | # Families | % Families |
| Less than $10,000 | 12 | 1.5% |
| $10,000 to $14,999 | 27 | 3.3% |
| $15,000 to $24,999 | 87 | 10.6% |
| $25,000 to $34,999 | 73 | 8.9% |
| $35,000 to $49,999 | 57 | 7.0% |
| $50,000 to $74,999 | 254 | 31.0% |
| $75,000 to $99,999 | 136 | 16.6% |
| $100,000 to $149,999 | 42 | 5.1% |
| $150,000 to $199,999 | 54 | 6.6% |
| $200,000+ | 77 | 9.4% |
Family Income by Famaliy Size in Rumford
5-person families (45 | 5.5%) account for the highest median family income in Rumford with $169,297 per family, while 5-person families (45 | 5.5%) have the highest median income of $33,859 per family member.
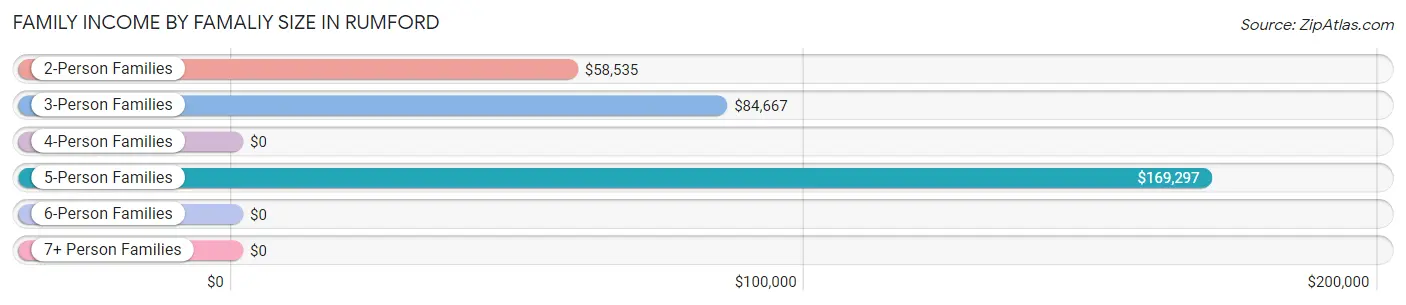
| Income Bracket | # Families | Median Income |
| 2-Person Families | 521 (63.6%) | $58,535 |
| 3-Person Families | 126 (15.4%) | $84,667 |
| 4-Person Families | 127 (15.5%) | $0 |
| 5-Person Families | 45 (5.5%) | $169,297 |
| 6-Person Families | 0 (0.0%) | $0 |
| 7+ Person Families | 0 (0.0%) | $0 |
| Total | 819 (100.0%) | $59,341 |
Family Income by Number of Earners in Rumford
The median family income in Rumford is $59,341, with families comprising 3+ earners (85) having the highest median family income of $140,375, while families with no earners (169) have the lowest median family income of $55,231, accounting for 10.4% and 20.6% of families, respectively.
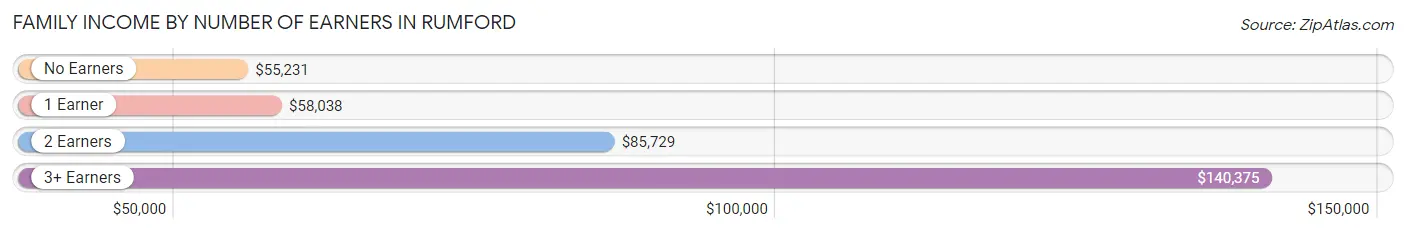
| Number of Earners | # Families | Median Income |
| No Earners | 169 (20.6%) | $55,231 |
| 1 Earner | 370 (45.2%) | $58,038 |
| 2 Earners | 195 (23.8%) | $85,729 |
| 3+ Earners | 85 (10.4%) | $140,375 |
| Total | 819 (100.0%) | $59,341 |
Household Income in Rumford
Household Income Brackets in Rumford
With 289 households falling in the category, the $50,000 to $74,999 income range is the most frequent in Rumford, accounting for 15.9% of all households. In contrast, only 55 households (3.0%) fall into the $150,000 to $199,999 income bracket, making it the least populous group.
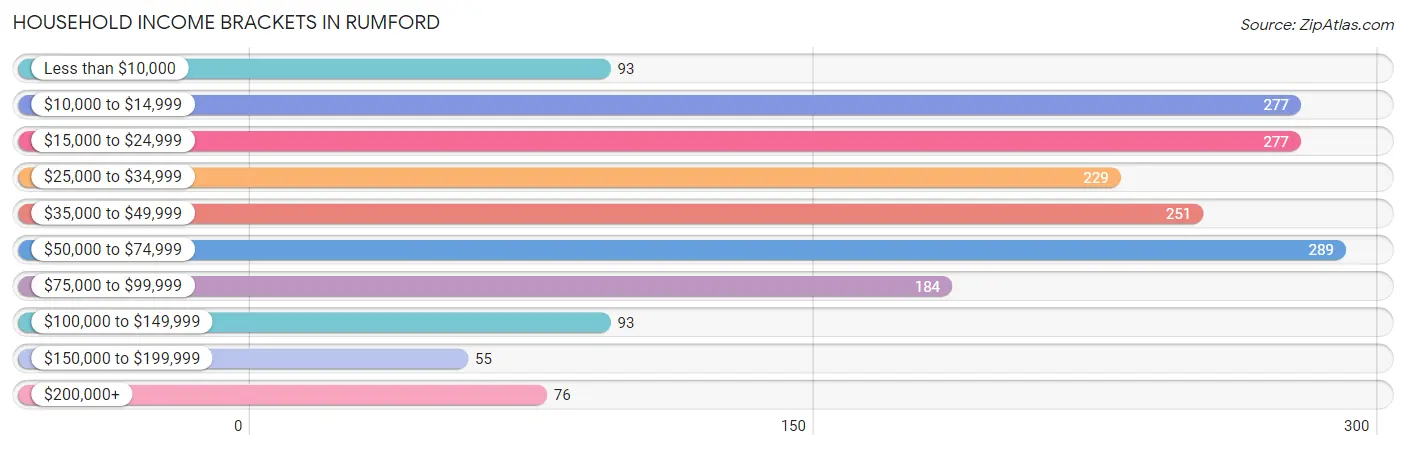
| Income Bracket | # Households | % Households |
| Less than $10,000 | 93 | 5.1% |
| $10,000 to $14,999 | 277 | 15.2% |
| $15,000 to $24,999 | 277 | 15.2% |
| $25,000 to $34,999 | 229 | 12.6% |
| $35,000 to $49,999 | 251 | 13.8% |
| $50,000 to $74,999 | 289 | 15.9% |
| $75,000 to $99,999 | 184 | 10.1% |
| $100,000 to $149,999 | 93 | 5.1% |
| $150,000 to $199,999 | 55 | 3.0% |
| $200,000+ | 76 | 4.2% |
Household Income by Householder Age in Rumford
The median household income in Rumford is $35,818, with the highest median household income of $43,289 found in the 25 to 44 years age bracket for the primary householder. A total of 246 households (13.5%) fall into this category. Meanwhile, the 15 to 24 years age bracket for the primary householder has the lowest median household income of $0, with 24 households (1.3%) in this group.
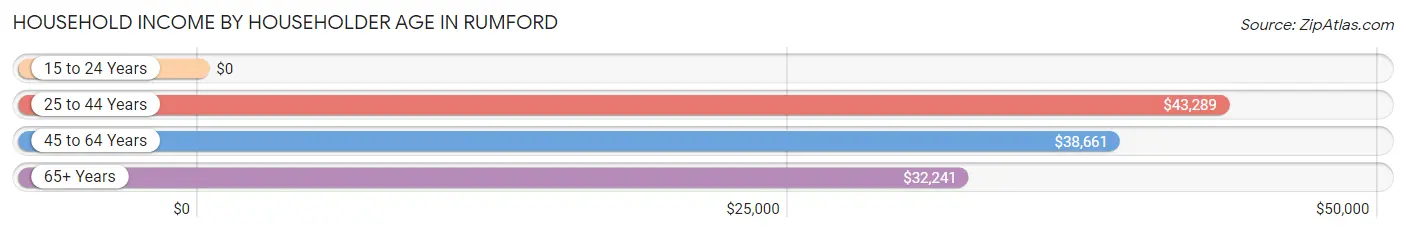
| Income Bracket | # Households | Median Income |
| 15 to 24 Years | 24 (1.3%) | $0 |
| 25 to 44 Years | 246 (13.5%) | $43,289 |
| 45 to 64 Years | 780 (42.9%) | $38,661 |
| 65+ Years | 770 (42.3%) | $32,241 |
| Total | 1,820 (100.0%) | $35,818 |
Poverty in Rumford
Income Below Poverty by Sex and Age in Rumford
With 22.8% poverty level for males and 24.8% for females among the residents of Rumford, 16 and 17 year old males and under 5 year old females are the most vulnerable to poverty, with 49 males (69.0%) and 19 females (100.0%) in their respective age groups living below the poverty level.
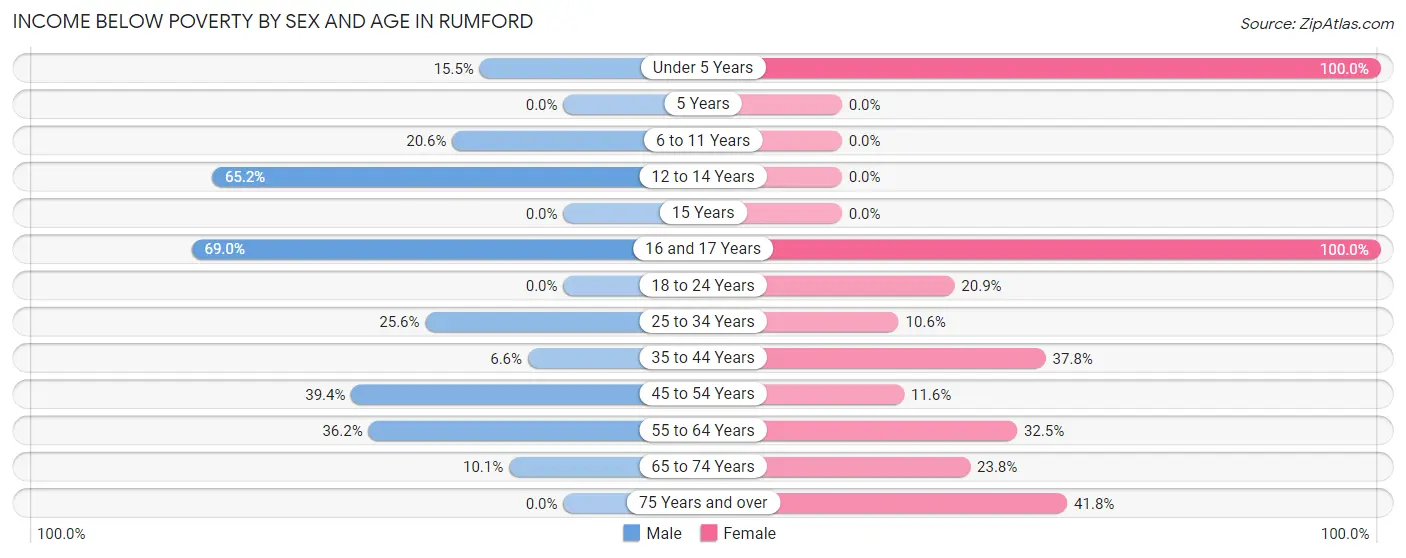
| Age Bracket | Male | Female |
| Under 5 Years | 16 (15.5%) | 19 (100.0%) |
| 5 Years | 0 (0.0%) | 0 (0.0%) |
| 6 to 11 Years | 20 (20.6%) | 0 (0.0%) |
| 12 to 14 Years | 45 (65.2%) | 0 (0.0%) |
| 15 Years | 0 (0.0%) | 0 (0.0%) |
| 16 and 17 Years | 49 (69.0%) | 13 (100.0%) |
| 18 to 24 Years | 0 (0.0%) | 42 (20.9%) |
| 25 to 34 Years | 21 (25.6%) | 21 (10.5%) |
| 35 to 44 Years | 16 (6.6%) | 28 (37.8%) |
| 45 to 54 Years | 111 (39.4%) | 44 (11.6%) |
| 55 to 64 Years | 136 (36.2%) | 133 (32.5%) |
| 65 to 74 Years | 36 (10.1%) | 81 (23.8%) |
| 75 Years and over | 0 (0.0%) | 87 (41.8%) |
| Total | 450 (22.8%) | 468 (24.8%) |
Income Above Poverty by Sex and Age in Rumford
According to the poverty statistics in Rumford, males aged 5 years and females aged 5 years are the age groups that are most secure financially, with 100.0% of males and 100.0% of females in these age groups living above the poverty line.
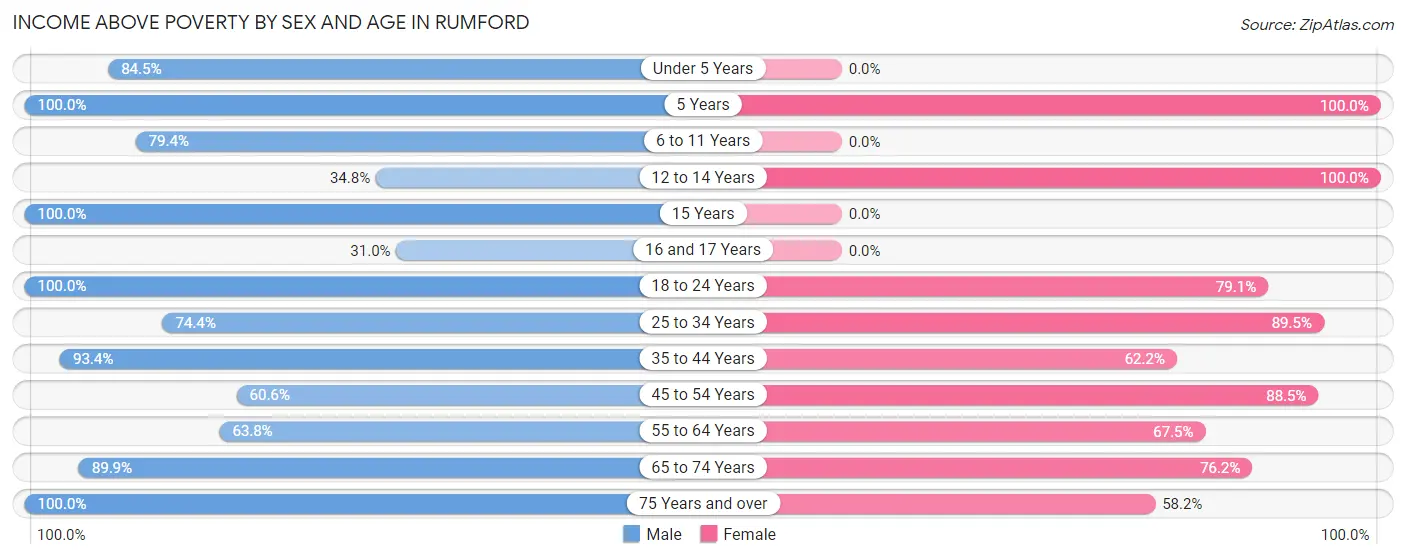
| Age Bracket | Male | Female |
| Under 5 Years | 87 (84.5%) | 0 (0.0%) |
| 5 Years | 12 (100.0%) | 28 (100.0%) |
| 6 to 11 Years | 77 (79.4%) | 0 (0.0%) |
| 12 to 14 Years | 24 (34.8%) | 11 (100.0%) |
| 15 Years | 23 (100.0%) | 0 (0.0%) |
| 16 and 17 Years | 22 (31.0%) | 0 (0.0%) |
| 18 to 24 Years | 135 (100.0%) | 159 (79.1%) |
| 25 to 34 Years | 61 (74.4%) | 178 (89.4%) |
| 35 to 44 Years | 227 (93.4%) | 46 (62.2%) |
| 45 to 54 Years | 171 (60.6%) | 337 (88.4%) |
| 55 to 64 Years | 240 (63.8%) | 276 (67.5%) |
| 65 to 74 Years | 321 (89.9%) | 259 (76.2%) |
| 75 Years and over | 124 (100.0%) | 121 (58.2%) |
| Total | 1,524 (77.2%) | 1,415 (75.1%) |
Income Below Poverty Among Married-Couple Families in Rumford
The poverty statistics for married-couple families in Rumford show that 3.1% or 18 of the total 580 families live below the poverty line. Families with no children have the highest poverty rate of 3.8%, comprising of 18 families. On the other hand, families with 1 or 2 children have the lowest poverty rate of 0.0%, which includes 0 families.
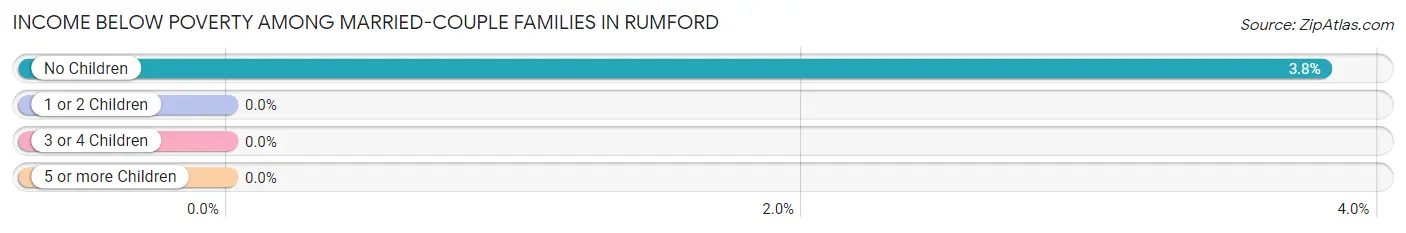
| Children | Above Poverty | Below Poverty |
| No Children | 454 (96.2%) | 18 (3.8%) |
| 1 or 2 Children | 97 (100.0%) | 0 (0.0%) |
| 3 or 4 Children | 11 (100.0%) | 0 (0.0%) |
| 5 or more Children | 0 (0.0%) | 0 (0.0%) |
| Total | 562 (96.9%) | 18 (3.1%) |
Income Below Poverty Among Single-Parent Households in Rumford
According to the poverty data in Rumford, 13.5% or 13 single-father households and 61.5% or 88 single-mother households are living below the poverty line. Among single-father households, those with 1 or 2 children have the highest poverty rate, with 13 households (21.7%) experiencing poverty. Likewise, among single-mother households, those with 3 or 4 children have the highest poverty rate, with 33 households (100.0%) falling below the poverty line.
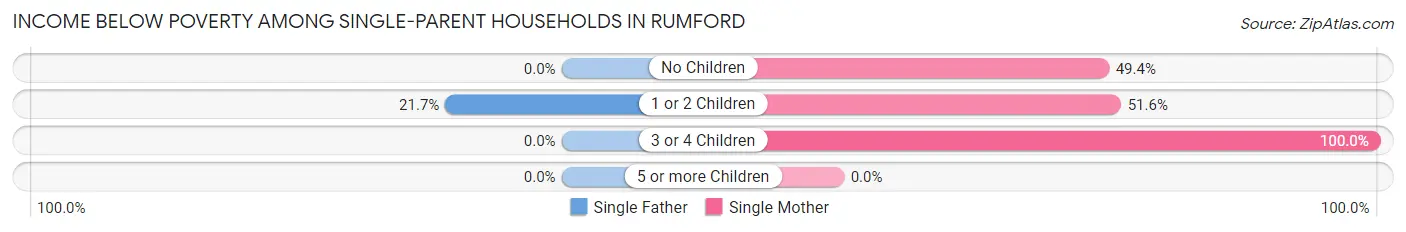
| Children | Single Father | Single Mother |
| No Children | 0 (0.0%) | 39 (49.4%) |
| 1 or 2 Children | 13 (21.7%) | 16 (51.6%) |
| 3 or 4 Children | 0 (0.0%) | 33 (100.0%) |
| 5 or more Children | 0 (0.0%) | 0 (0.0%) |
| Total | 13 (13.5%) | 88 (61.5%) |
Income Below Poverty Among Married-Couple vs Single-Parent Households in Rumford
The poverty data for Rumford shows that 18 of the married-couple family households (3.1%) and 101 of the single-parent households (42.3%) are living below the poverty level. Within the married-couple family households, those with no children have the highest poverty rate, with 18 households (3.8%) falling below the poverty line. Among the single-parent households, those with 3 or 4 children have the highest poverty rate, with 33 household (100.0%) living below poverty.
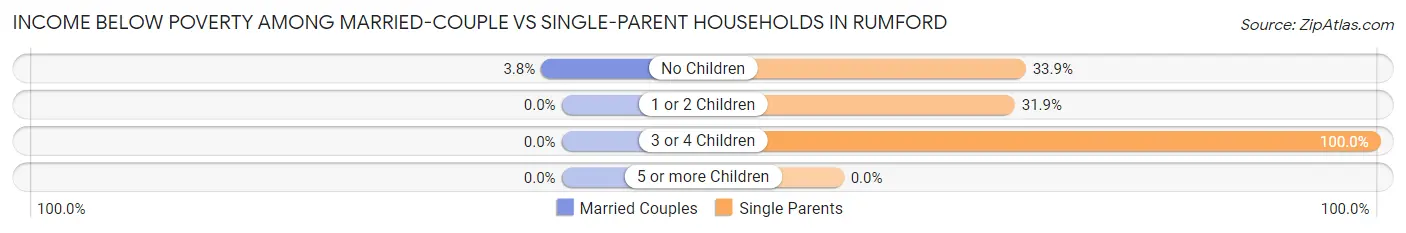
| Children | Married-Couple Families | Single-Parent Households |
| No Children | 18 (3.8%) | 39 (33.9%) |
| 1 or 2 Children | 0 (0.0%) | 29 (31.9%) |
| 3 or 4 Children | 0 (0.0%) | 33 (100.0%) |
| 5 or more Children | 0 (0.0%) | 0 (0.0%) |
| Total | 18 (3.1%) | 101 (42.3%) |
Race in Rumford
The most populous races in Rumford are White / Caucasian (3,678 | 93.8%), Two or more Races (183 | 4.7%), and Hispanic or Latino (28 | 0.7%).
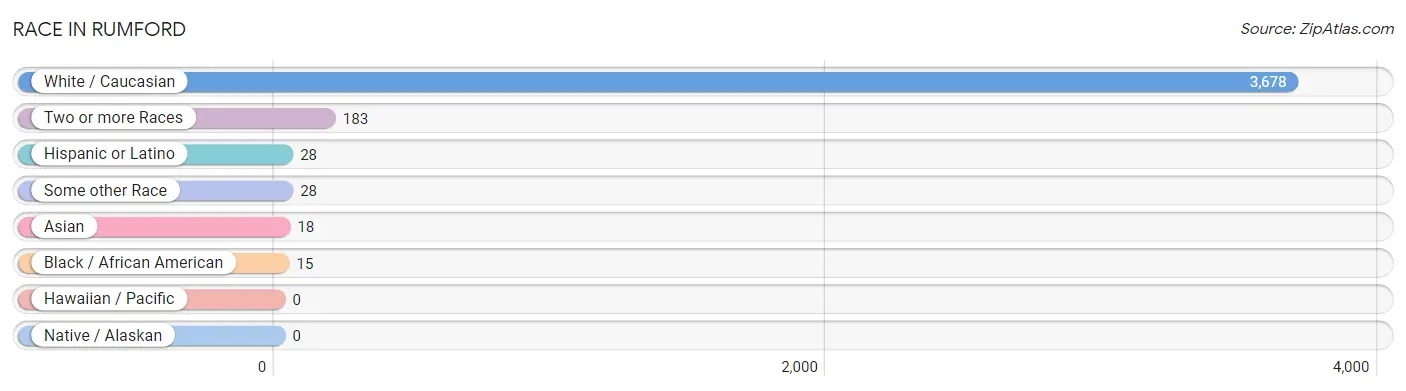
| Race | # Population | % Population |
| Asian | 18 | 0.5% |
| Black / African American | 15 | 0.4% |
| Hawaiian / Pacific | 0 | 0.0% |
| Hispanic or Latino | 28 | 0.7% |
| Native / Alaskan | 0 | 0.0% |
| White / Caucasian | 3,678 | 93.8% |
| Two or more Races | 183 | 4.7% |
| Some other Race | 28 | 0.7% |
| Total | 3,922 | 100.0% |
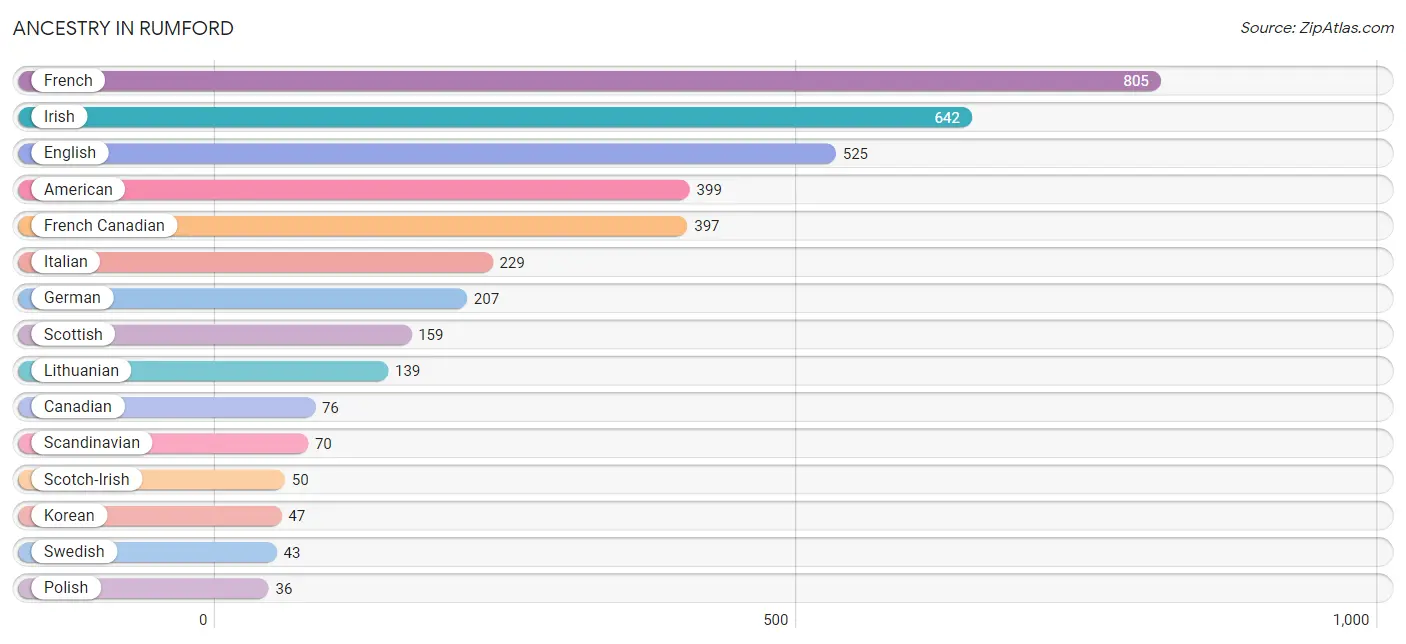
Ancestry in Rumford
The most populous ancestries reported in Rumford are French (805 | 20.5%), Irish (642 | 16.4%), English (525 | 13.4%), American (399 | 10.2%), and French Canadian (397 | 10.1%), together accounting for 70.6% of all Rumford residents.
| Ancestry | # Population | % Population |
| American | 399 | 10.2% |
| Canadian | 76 | 1.9% |
| Dutch | 9 | 0.2% |
| English | 525 | 13.4% |
| Finnish | 9 | 0.2% |
| French | 805 | 20.5% |
| French Canadian | 397 | 10.1% |
| German | 207 | 5.3% |
| Indian (Asian) | 25 | 0.6% |
| Irish | 642 | 16.4% |
| Italian | 229 | 5.8% |
| Korean | 47 | 1.2% |
| Lithuanian | 139 | 3.5% |
| Norwegian | 25 | 0.6% |
| Polish | 36 | 0.9% |
| Puerto Rican | 28 | 0.7% |
| Russian | 25 | 0.6% |
| Scandinavian | 70 | 1.8% |
| Scotch-Irish | 50 | 1.3% |
| Scottish | 159 | 4.1% |
| Slovak | 10 | 0.3% |
| Sri Lankan | 25 | 0.6% |
| Swedish | 43 | 1.1% |
| Thai | 1 | 0.0% |
| Welsh | 10 | 0.3% | View All 25 Rows |
Immigrants in Rumford
The most numerous immigrant groups reported in Rumford came from Canada (20 | 0.5%), Asia (17 | 0.4%), Philippines (17 | 0.4%), and South Eastern Asia (17 | 0.4%), together accounting for 1.8% of all Rumford residents.
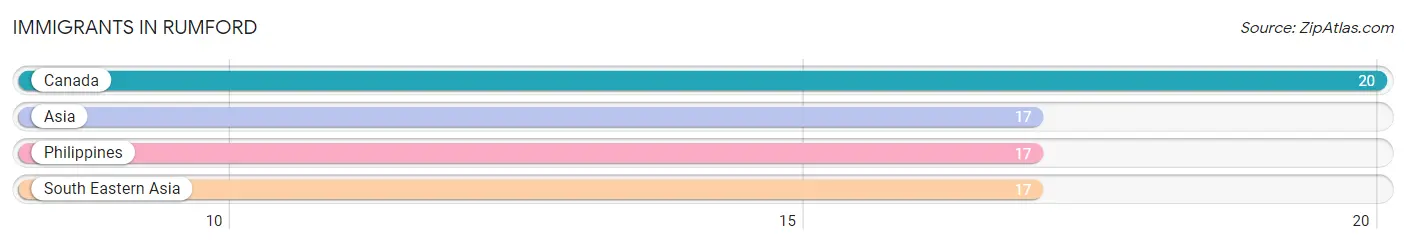
| Immigration Origin | # Population | % Population |
| Asia | 17 | 0.4% |
| Canada | 20 | 0.5% |
| Philippines | 17 | 0.4% |
| South Eastern Asia | 17 | 0.4% | View All 4 Rows |
Sex and Age in Rumford
Sex and Age in Rumford
The most populous age groups in Rumford are 60 to 64 Years (258 | 12.8%) for men and 70 to 74 Years (240 | 12.6%) for women.
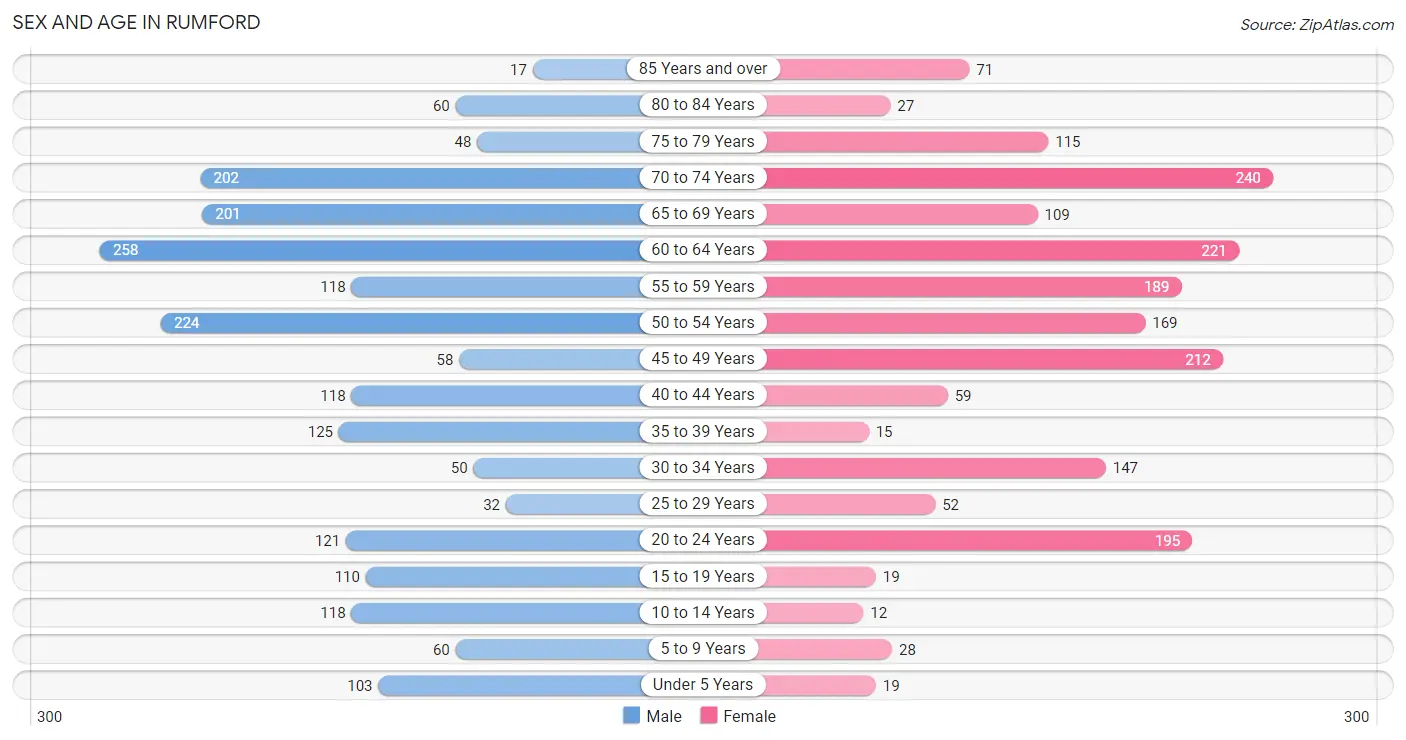
| Age Bracket | Male | Female |
| Under 5 Years | 103 (5.1%) | 19 (1.0%) |
| 5 to 9 Years | 60 (3.0%) | 28 (1.5%) |
| 10 to 14 Years | 118 (5.8%) | 12 (0.6%) |
| 15 to 19 Years | 110 (5.4%) | 19 (1.0%) |
| 20 to 24 Years | 121 (6.0%) | 195 (10.3%) |
| 25 to 29 Years | 32 (1.6%) | 52 (2.7%) |
| 30 to 34 Years | 50 (2.5%) | 147 (7.7%) |
| 35 to 39 Years | 125 (6.2%) | 15 (0.8%) |
| 40 to 44 Years | 118 (5.8%) | 59 (3.1%) |
| 45 to 49 Years | 58 (2.9%) | 212 (11.2%) |
| 50 to 54 Years | 224 (11.1%) | 169 (8.9%) |
| 55 to 59 Years | 118 (5.8%) | 189 (10.0%) |
| 60 to 64 Years | 258 (12.8%) | 221 (11.6%) |
| 65 to 69 Years | 201 (9.9%) | 109 (5.7%) |
| 70 to 74 Years | 202 (10.0%) | 240 (12.6%) |
| 75 to 79 Years | 48 (2.4%) | 115 (6.1%) |
| 80 to 84 Years | 60 (3.0%) | 27 (1.4%) |
| 85 Years and over | 17 (0.8%) | 71 (3.7%) |
| Total | 2,023 (100.0%) | 1,899 (100.0%) |
Families and Households in Rumford
Median Family Size in Rumford
The median family size in Rumford is 3.13 persons per family, with single male/father families (96 | 11.7%) accounting for the largest median family size of 4.31 persons per family. On the other hand, married-couple families (580 | 70.8%) represent the smallest median family size with 2.82 persons per family.
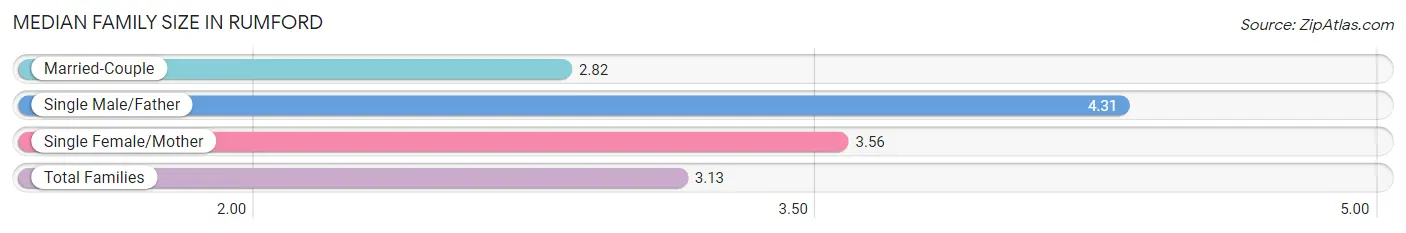
| Family Type | # Families | Family Size |
| Married-Couple | 580 (70.8%) | 2.82 |
| Single Male/Father | 96 (11.7%) | 4.31 |
| Single Female/Mother | 143 (17.5%) | 3.56 |
| Total Families | 819 (100.0%) | 3.13 |
Median Household Size in Rumford
The median household size in Rumford is 2.10 persons per household, with single male/father households (96 | 5.3%) accounting for the largest median household size of 5.04 persons per household. non-family households (1,001 | 55.0%) represent the smallest median household size with 1.17 persons per household.
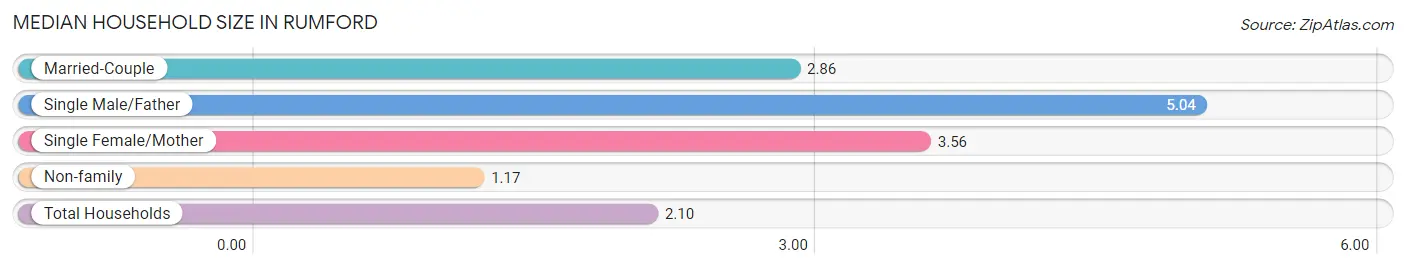
| Household Type | # Households | Household Size |
| Married-Couple | 580 (31.9%) | 2.86 |
| Single Male/Father | 96 (5.3%) | 5.04 |
| Single Female/Mother | 143 (7.9%) | 3.56 |
| Non-family | 1,001 (55.0%) | 1.17 |
| Total Households | 1,820 (100.0%) | 2.10 |
Household Size by Marriage Status in Rumford
Out of a total of 1,820 households in Rumford, 819 (45.0%) are family households, while 1,001 (55.0%) are nonfamily households. The most numerous type of family households are 2-person households, comprising 488, and the most common type of nonfamily households are 1-person households, comprising 906.
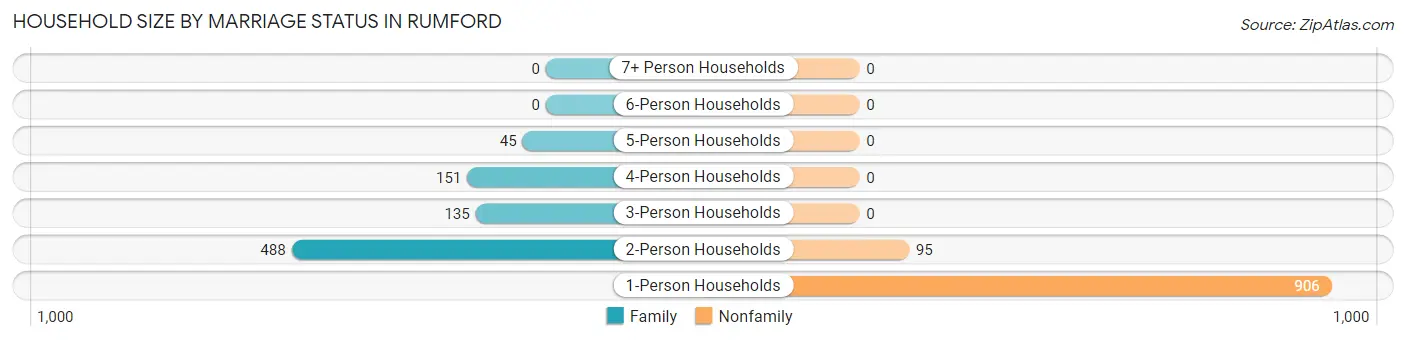
| Household Size | Family Households | Nonfamily Households |
| 1-Person Households | - | 906 (49.8%) |
| 2-Person Households | 488 (26.8%) | 95 (5.2%) |
| 3-Person Households | 135 (7.4%) | 0 (0.0%) |
| 4-Person Households | 151 (8.3%) | 0 (0.0%) |
| 5-Person Households | 45 (2.5%) | 0 (0.0%) |
| 6-Person Households | 0 (0.0%) | 0 (0.0%) |
| 7+ Person Households | 0 (0.0%) | 0 (0.0%) |
| Total | 819 (45.0%) | 1,001 (55.0%) |
Female Fertility in Rumford
Fertility by Age in Rumford
Average fertility rate in Rumford is 63.0 births per 1,000 women. Women in the age bracket of 20 to 34 years have the highest fertility rate with 86.0 births per 1,000 women. Women in the age bracket of 20 to 34 years acount for 75.6% of all women with births.
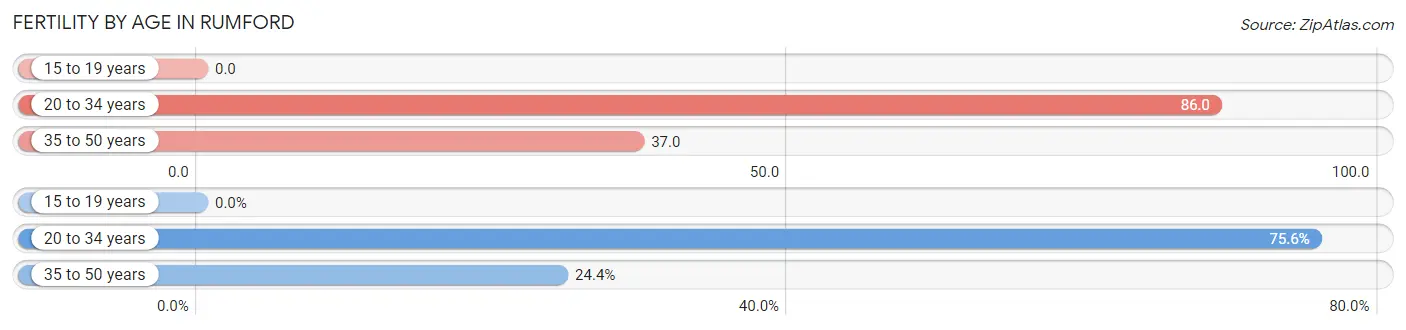
| Age Bracket | Women with Births | Births / 1,000 Women |
| 15 to 19 years | 0 (0.0%) | 0.0 |
| 20 to 34 years | 34 (75.6%) | 86.0 |
| 35 to 50 years | 11 (24.4%) | 37.0 |
| Total | 45 (100.0%) | 63.0 |
Fertility by Age by Marriage Status in Rumford
75.6% of women with births (45) in Rumford are married. The highest percentage of unmarried women with births falls into 35 to 50 years age bracket with 100.0% of them unmarried at the time of birth, while the lowest percentage of unmarried women with births belong to 20 to 34 years age bracket with 0.0% of them unmarried.
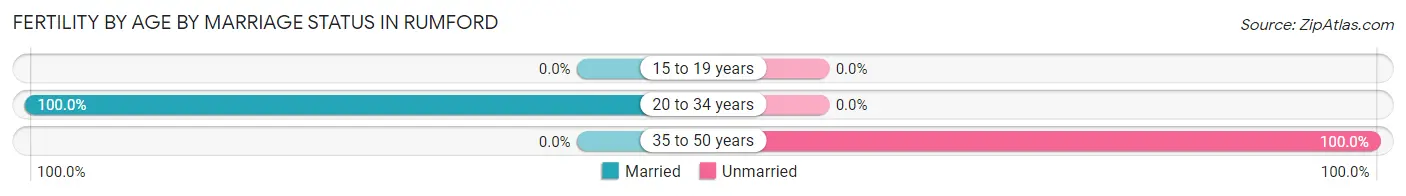
| Age Bracket | Married | Unmarried |
| 15 to 19 years | 0 (0.0%) | 0 (0.0%) |
| 20 to 34 years | 34 (100.0%) | 0 (0.0%) |
| 35 to 50 years | 0 (0.0%) | 11 (100.0%) |
| Total | 34 (75.6%) | 11 (24.4%) |
Fertility by Education in Rumford
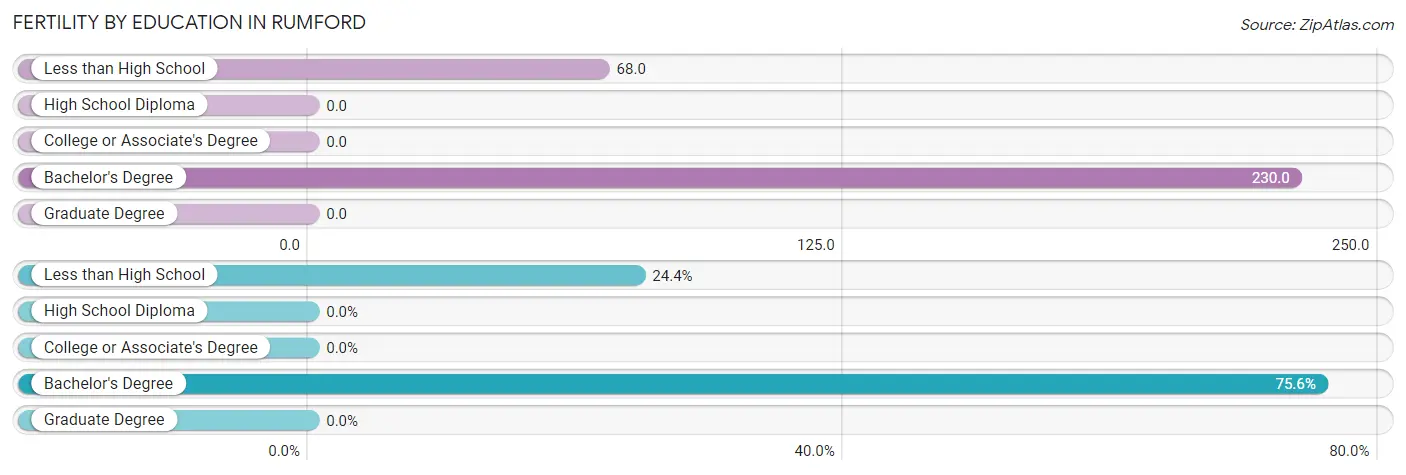
| Educational Attainment | Women with Births | Births / 1,000 Women |
| Less than High School | 11 (24.4%) | 68.0 |
| High School Diploma | 0 (0.0%) | 0.0 |
| College or Associate's Degree | 0 (0.0%) | 0.0 |
| Bachelor's Degree | 34 (75.6%) | 230.0 |
| Graduate Degree | 0 (0.0%) | 0.0 |
| Total | 45 (100.0%) | 63.0 |
Fertility by Education by Marriage Status in Rumford
24.4% of women with births in Rumford are unmarried. Women with the educational attainment of bachelor's degree are most likely to be married with 100.0% of them married at childbirth, while women with the educational attainment of less than high school are least likely to be married with 100.0% of them unmarried at childbirth.
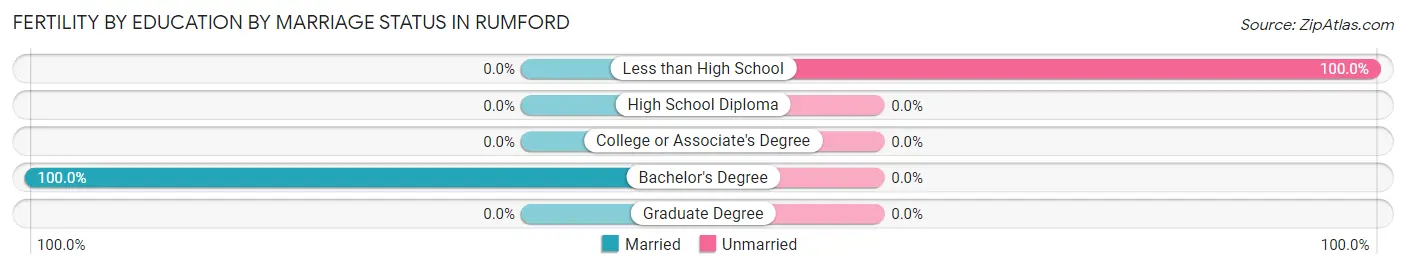
| Educational Attainment | Married | Unmarried |
| Less than High School | 0 (0.0%) | 11 (100.0%) |
| High School Diploma | 0 (0.0%) | 0 (0.0%) |
| College or Associate's Degree | 0 (0.0%) | 0 (0.0%) |
| Bachelor's Degree | 34 (100.0%) | 0 (0.0%) |
| Graduate Degree | 0 (0.0%) | 0 (0.0%) |
| Total | 34 (75.6%) | 11 (24.4%) |
Employment Characteristics in Rumford
Employment by Class of Employer in Rumford
Among the 1,516 employed individuals in Rumford, private company employees (887 | 58.5%), local government employees (179 | 11.8%), and self-employed (not incorporated) (133 | 8.8%) make up the most common classes of employment.
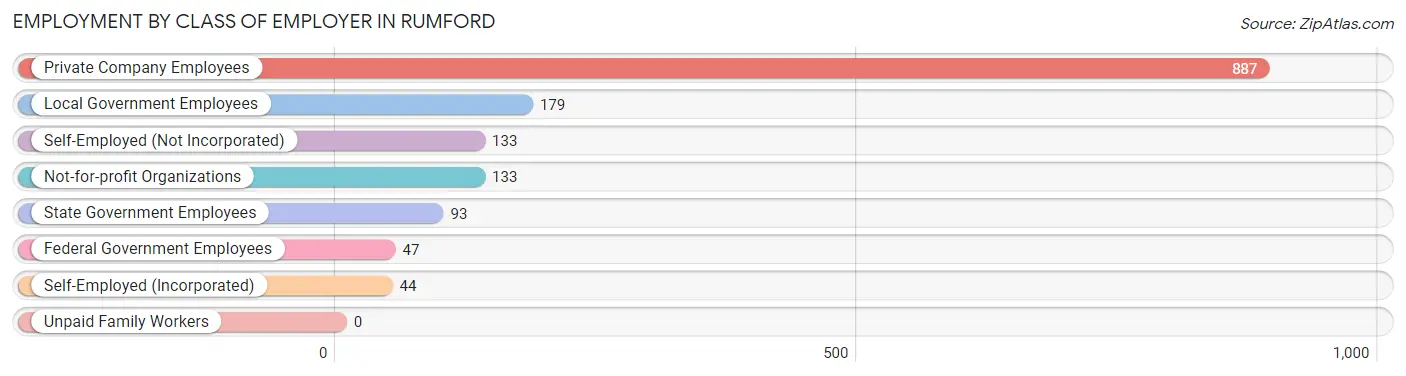
| Employer Class | # Employees | % Employees |
| Private Company Employees | 887 | 58.5% |
| Self-Employed (Incorporated) | 44 | 2.9% |
| Self-Employed (Not Incorporated) | 133 | 8.8% |
| Not-for-profit Organizations | 133 | 8.8% |
| Local Government Employees | 179 | 11.8% |
| State Government Employees | 93 | 6.1% |
| Federal Government Employees | 47 | 3.1% |
| Unpaid Family Workers | 0 | 0.0% |
| Total | 1,516 | 100.0% |
Employment Status by Age in Rumford
According to the labor force statistics for Rumford, out of the total population over 16 years of age (3,559), 45.6% or 1,623 individuals are in the labor force, with 6.7% or 109 of them unemployed. The age group with the highest labor force participation rate is 25 to 29 years, with 98.8% or 83 individuals in the labor force. Within the labor force, the 16 to 19 years age range has the highest percentage of unemployed individuals, with 30.0% or 6 of them being unemployed.
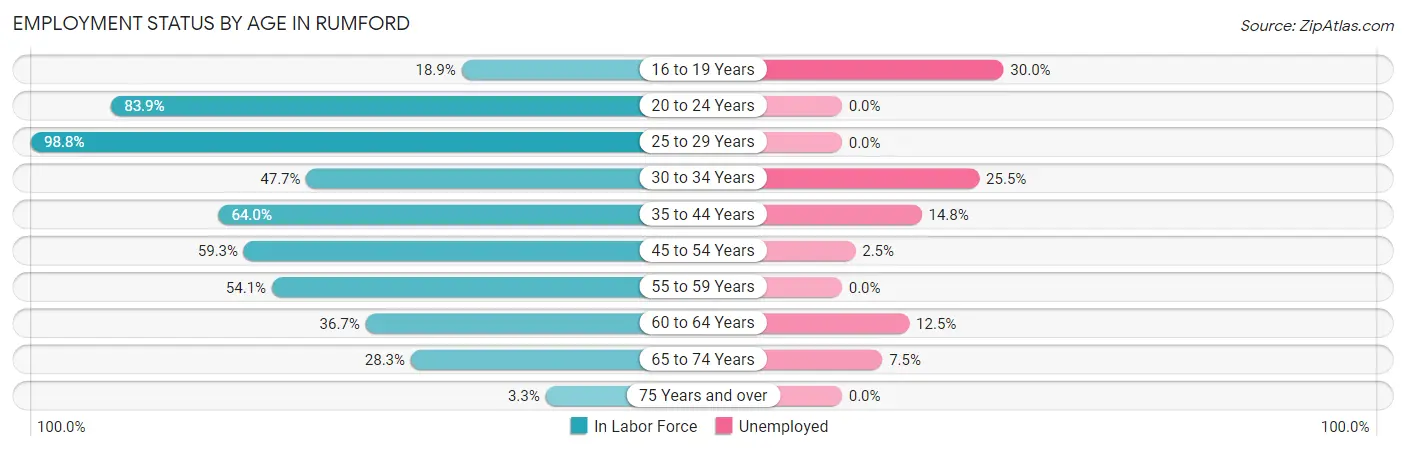
| Age Bracket | In Labor Force | Unemployed |
| 16 to 19 Years | 20 (18.9%) | 6 (30.0%) |
| 20 to 24 Years | 265 (83.9%) | 0 (0.0%) |
| 25 to 29 Years | 83 (98.8%) | 0 (0.0%) |
| 30 to 34 Years | 94 (47.7%) | 24 (25.5%) |
| 35 to 44 Years | 203 (64.0%) | 30 (14.8%) |
| 45 to 54 Years | 393 (59.3%) | 10 (2.5%) |
| 55 to 59 Years | 166 (54.1%) | 0 (0.0%) |
| 60 to 64 Years | 176 (36.7%) | 22 (12.5%) |
| 65 to 74 Years | 213 (28.3%) | 16 (7.5%) |
| 75 Years and over | 11 (3.3%) | 0 (0.0%) |
| Total | 1,623 (45.6%) | 109 (6.7%) |
Employment Status by Educational Attainment in Rumford
According to labor force statistics for Rumford, 54.5% of individuals (1,116) out of the total population between 25 and 64 years of age (2,047) are in the labor force, with 7.7% or 86 of them being unemployed. The group with the highest labor force participation rate are those with the educational attainment of bachelor's degree or higher, with 71.8% or 221 individuals in the labor force. Within the labor force, individuals with college / associate degree education have the highest percentage of unemployment, with 10.9% or 41 of them being unemployed.
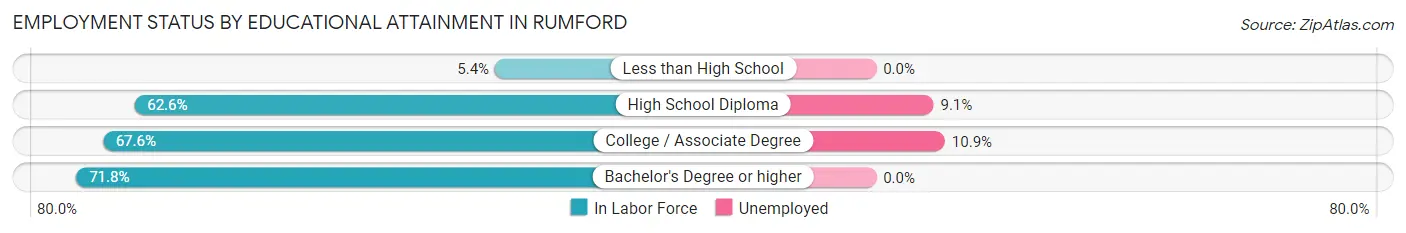
| Educational Attainment | In Labor Force | Unemployed |
| Less than High School | 21 (5.4%) | 0 (0.0%) |
| High School Diploma | 497 (62.6%) | 72 (9.1%) |
| College / Associate Degree | 376 (67.6%) | 61 (10.9%) |
| Bachelor's Degree or higher | 221 (71.8%) | 0 (0.0%) |
| Total | 1,116 (54.5%) | 158 (7.7%) |
Employment Occupations by Sex in Rumford
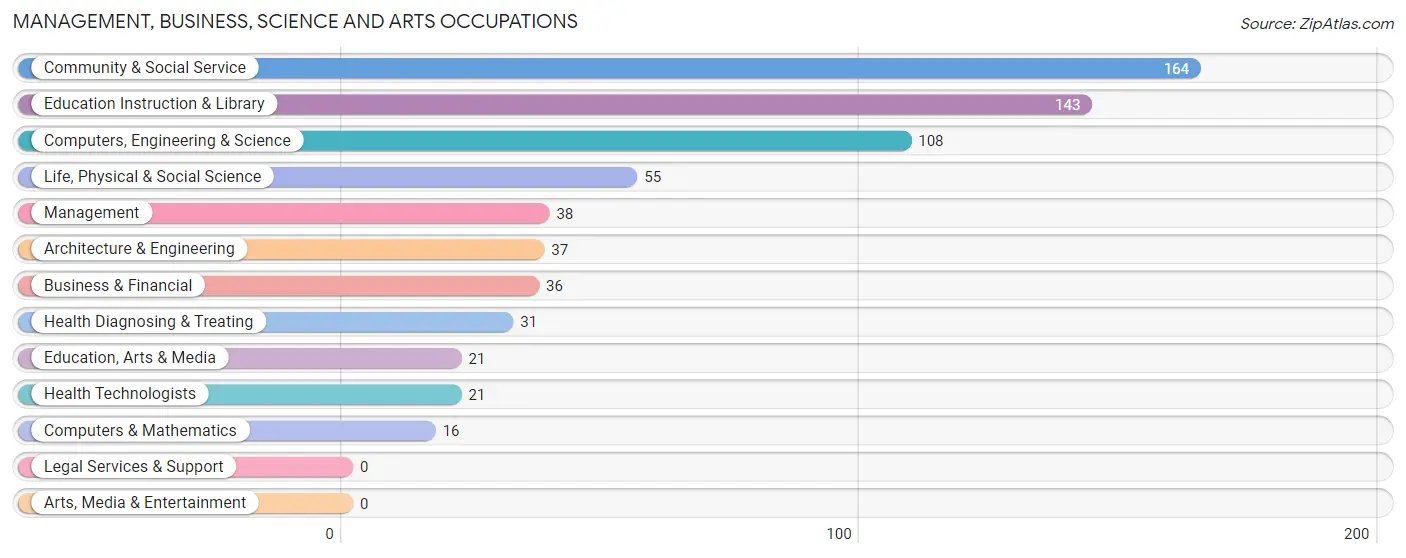
Management, Business, Science and Arts Occupations
The most common Management, Business, Science and Arts occupations in Rumford are Community & Social Service (164 | 10.9%), Education Instruction & Library (143 | 9.5%), Computers, Engineering & Science (108 | 7.2%), Life, Physical & Social Science (55 | 3.6%), and Management (38 | 2.5%).
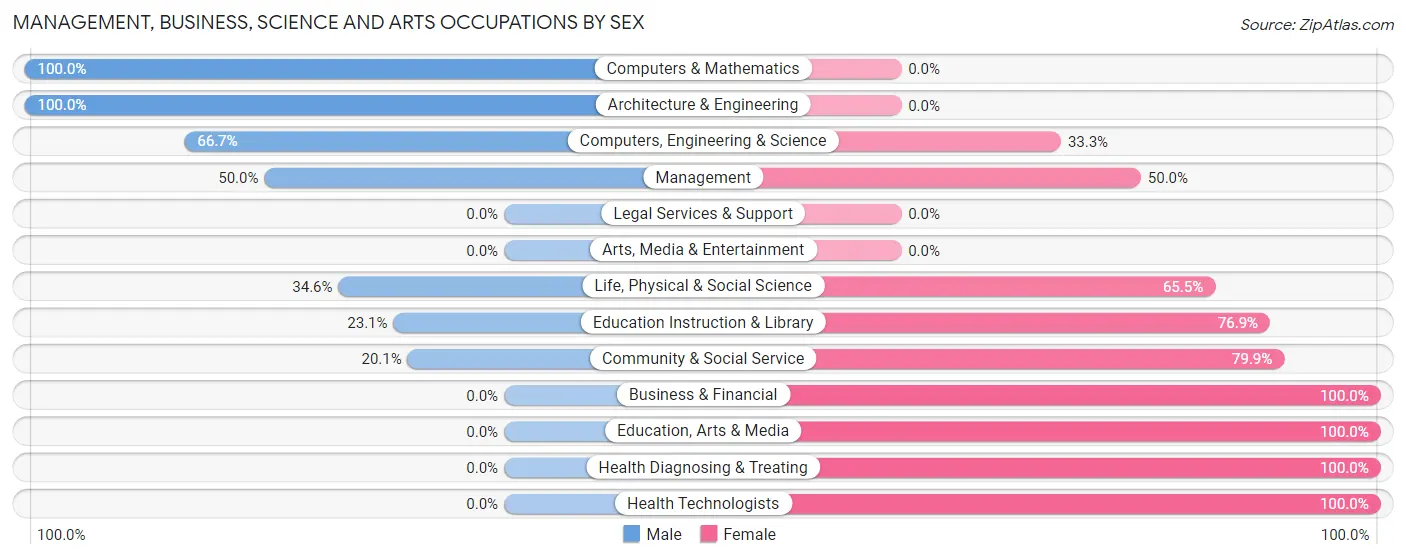
Management, Business, Science and Arts Occupations by Sex
Within the Management, Business, Science and Arts occupations in Rumford, the most male-oriented occupations are Computers & Mathematics (100.0%), Architecture & Engineering (100.0%), and Computers, Engineering & Science (66.7%), while the most female-oriented occupations are Business & Financial (100.0%), Education, Arts & Media (100.0%), and Health Diagnosing & Treating (100.0%).
| Occupation | Male | Female |
| Management | 19 (50.0%) | 19 (50.0%) |
| Business & Financial | 0 (0.0%) | 36 (100.0%) |
| Computers, Engineering & Science | 72 (66.7%) | 36 (33.3%) |
| Computers & Mathematics | 16 (100.0%) | 0 (0.0%) |
| Architecture & Engineering | 37 (100.0%) | 0 (0.0%) |
| Life, Physical & Social Science | 19 (34.5%) | 36 (65.4%) |
| Community & Social Service | 33 (20.1%) | 131 (79.9%) |
| Education, Arts & Media | 0 (0.0%) | 21 (100.0%) |
| Legal Services & Support | 0 (0.0%) | 0 (0.0%) |
| Education Instruction & Library | 33 (23.1%) | 110 (76.9%) |
| Arts, Media & Entertainment | 0 (0.0%) | 0 (0.0%) |
| Health Diagnosing & Treating | 0 (0.0%) | 31 (100.0%) |
| Health Technologists | 0 (0.0%) | 21 (100.0%) |
| Total (Category) | 124 (32.9%) | 253 (67.1%) |
| Total (Overall) | 708 (47.0%) | 797 (53.0%) |
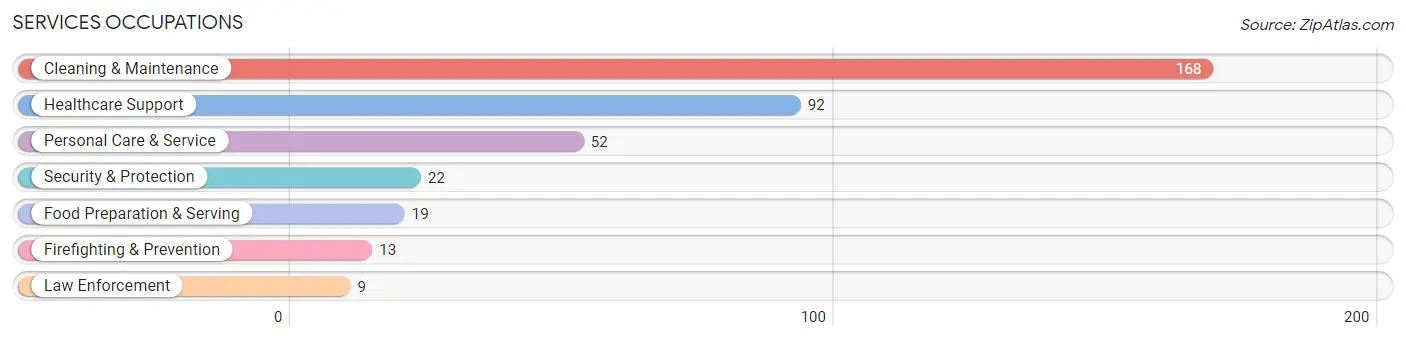
Services Occupations
The most common Services occupations in Rumford are Cleaning & Maintenance (168 | 11.2%), Healthcare Support (92 | 6.1%), Personal Care & Service (52 | 3.5%), Security & Protection (22 | 1.5%), and Food Preparation & Serving (19 | 1.3%).
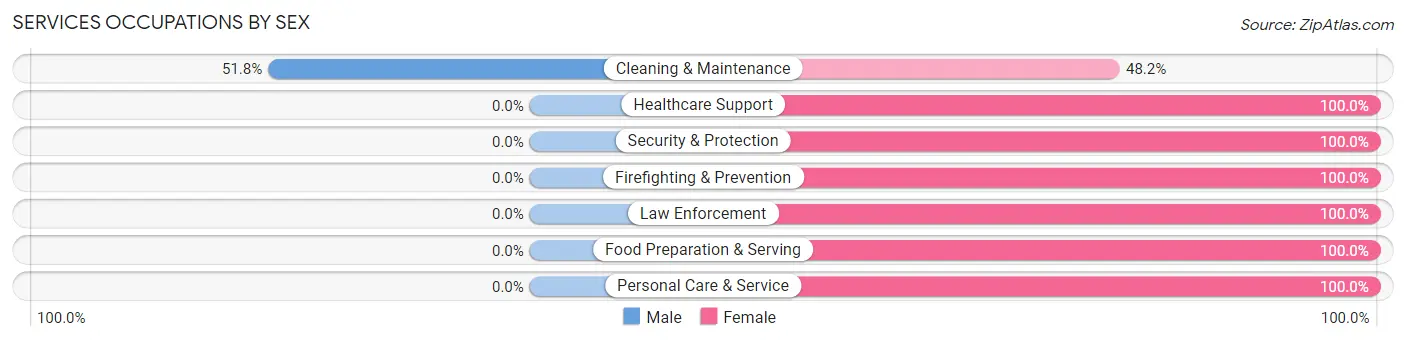
Services Occupations by Sex
| Occupation | Male | Female |
| Healthcare Support | 0 (0.0%) | 92 (100.0%) |
| Security & Protection | 0 (0.0%) | 22 (100.0%) |
| Firefighting & Prevention | 0 (0.0%) | 13 (100.0%) |
| Law Enforcement | 0 (0.0%) | 9 (100.0%) |
| Food Preparation & Serving | 0 (0.0%) | 19 (100.0%) |
| Cleaning & Maintenance | 87 (51.8%) | 81 (48.2%) |
| Personal Care & Service | 0 (0.0%) | 52 (100.0%) |
| Total (Category) | 87 (24.6%) | 266 (75.3%) |
| Total (Overall) | 708 (47.0%) | 797 (53.0%) |
Sales and Office Occupations
The most common Sales and Office occupations in Rumford are Sales & Related (174 | 11.6%), and Office & Administration (118 | 7.8%).
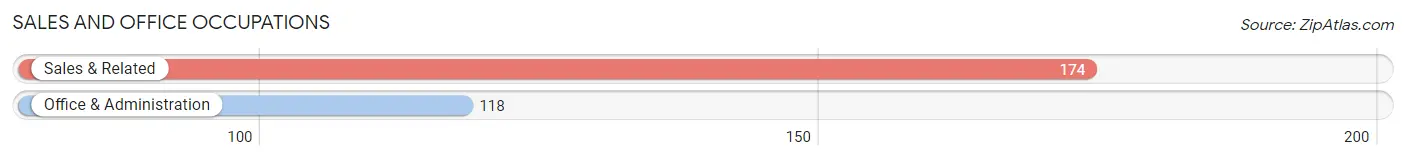
Sales and Office Occupations by Sex

| Occupation | Male | Female |
| Sales & Related | 25 (14.4%) | 149 (85.6%) |
| Office & Administration | 43 (36.4%) | 75 (63.6%) |
| Total (Category) | 68 (23.3%) | 224 (76.7%) |
| Total (Overall) | 708 (47.0%) | 797 (53.0%) |
Natural Resources, Construction and Maintenance Occupations
The most common Natural Resources, Construction and Maintenance occupations in Rumford are Construction & Extraction (108 | 7.2%), and Installation, Maintenance & Repair (35 | 2.3%).
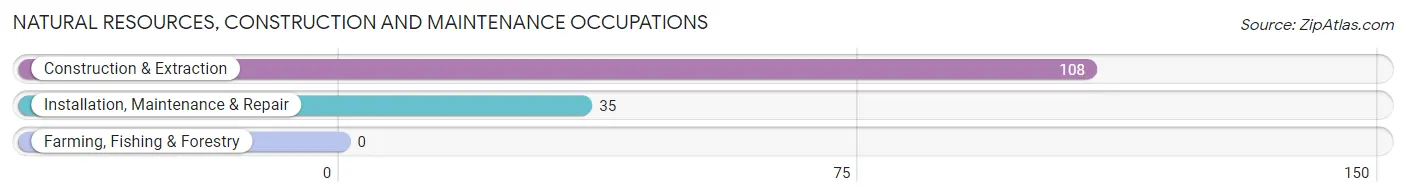
Natural Resources, Construction and Maintenance Occupations by Sex

| Occupation | Male | Female |
| Farming, Fishing & Forestry | 0 (0.0%) | 0 (0.0%) |
| Construction & Extraction | 108 (100.0%) | 0 (0.0%) |
| Installation, Maintenance & Repair | 35 (100.0%) | 0 (0.0%) |
| Total (Category) | 143 (100.0%) | 0 (0.0%) |
| Total (Overall) | 708 (47.0%) | 797 (53.0%) |
Production, Transportation and Moving Occupations
The most common Production, Transportation and Moving occupations in Rumford are Transportation (182 | 12.1%), Production (110 | 7.3%), and Material Moving (48 | 3.2%).
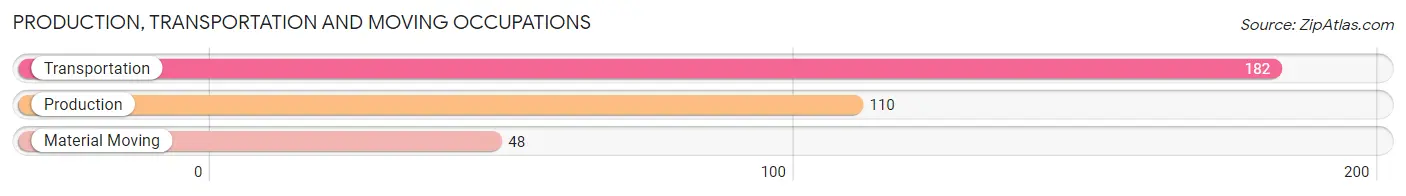
Production, Transportation and Moving Occupations by Sex
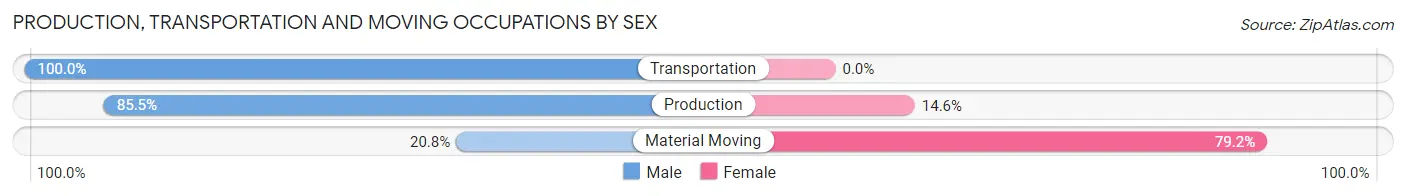
| Occupation | Male | Female |
| Production | 94 (85.5%) | 16 (14.5%) |
| Transportation | 182 (100.0%) | 0 (0.0%) |
| Material Moving | 10 (20.8%) | 38 (79.2%) |
| Total (Category) | 286 (84.1%) | 54 (15.9%) |
| Total (Overall) | 708 (47.0%) | 797 (53.0%) |
Employment Industries by Sex in Rumford
Employment Industries in Rumford
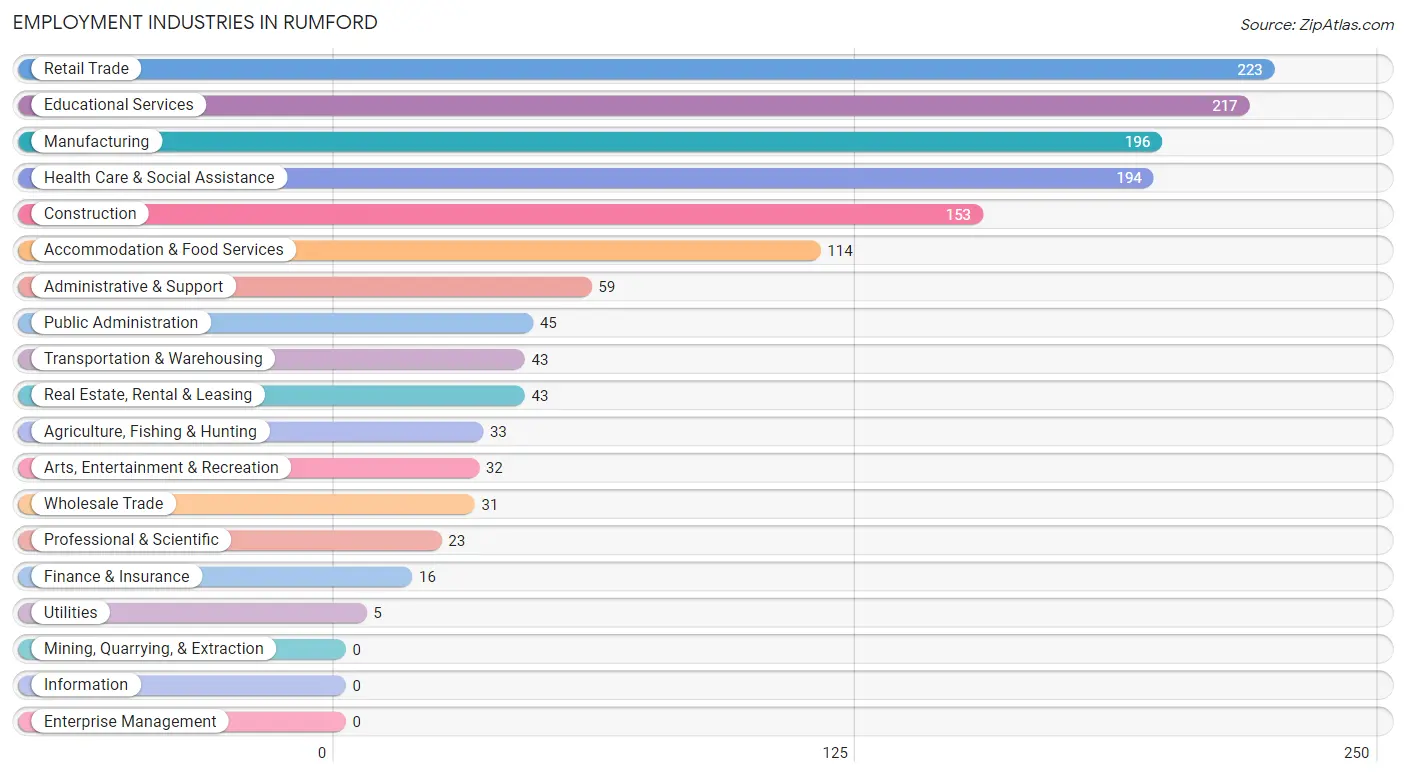
The major employment industries in Rumford include Retail Trade (223 | 14.8%), Educational Services (217 | 14.4%), Manufacturing (196 | 13.0%), Health Care & Social Assistance (194 | 12.9%), and Construction (153 | 10.2%).
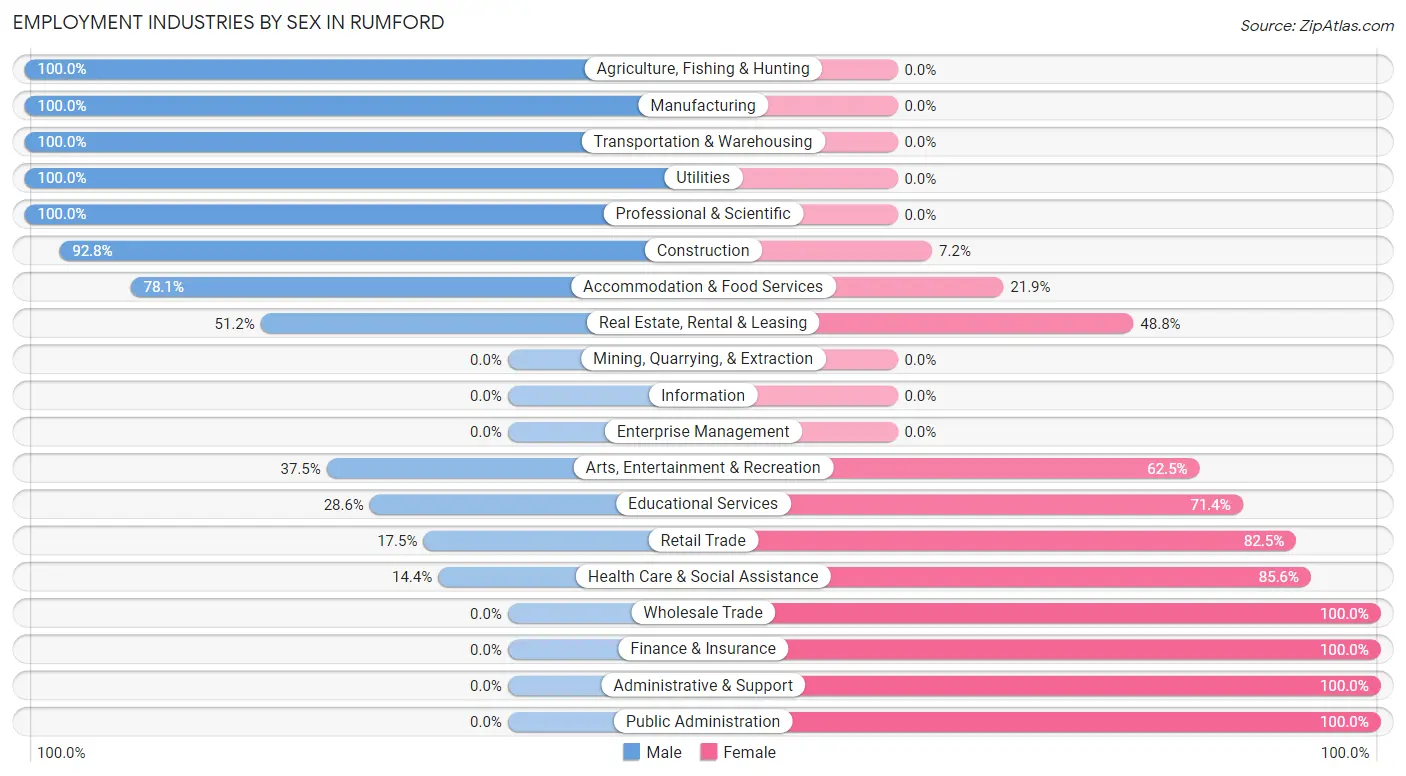
Employment Industries by Sex in Rumford
The Rumford industries that see more men than women are Agriculture, Fishing & Hunting (100.0%), Manufacturing (100.0%), and Transportation & Warehousing (100.0%), whereas the industries that tend to have a higher number of women are Wholesale Trade (100.0%), Finance & Insurance (100.0%), and Administrative & Support (100.0%).
| Industry | Male | Female |
| Agriculture, Fishing & Hunting | 33 (100.0%) | 0 (0.0%) |
| Mining, Quarrying, & Extraction | 0 (0.0%) | 0 (0.0%) |
| Construction | 142 (92.8%) | 11 (7.2%) |
| Manufacturing | 196 (100.0%) | 0 (0.0%) |
| Wholesale Trade | 0 (0.0%) | 31 (100.0%) |
| Retail Trade | 39 (17.5%) | 184 (82.5%) |
| Transportation & Warehousing | 43 (100.0%) | 0 (0.0%) |
| Utilities | 5 (100.0%) | 0 (0.0%) |
| Information | 0 (0.0%) | 0 (0.0%) |
| Finance & Insurance | 0 (0.0%) | 16 (100.0%) |
| Real Estate, Rental & Leasing | 22 (51.2%) | 21 (48.8%) |
| Professional & Scientific | 23 (100.0%) | 0 (0.0%) |
| Enterprise Management | 0 (0.0%) | 0 (0.0%) |
| Administrative & Support | 0 (0.0%) | 59 (100.0%) |
| Educational Services | 62 (28.6%) | 155 (71.4%) |
| Health Care & Social Assistance | 28 (14.4%) | 166 (85.6%) |
| Arts, Entertainment & Recreation | 12 (37.5%) | 20 (62.5%) |
| Accommodation & Food Services | 89 (78.1%) | 25 (21.9%) |
| Public Administration | 0 (0.0%) | 45 (100.0%) |
| Total | 708 (47.0%) | 797 (53.0%) |
Education in Rumford
School Enrollment in Rumford
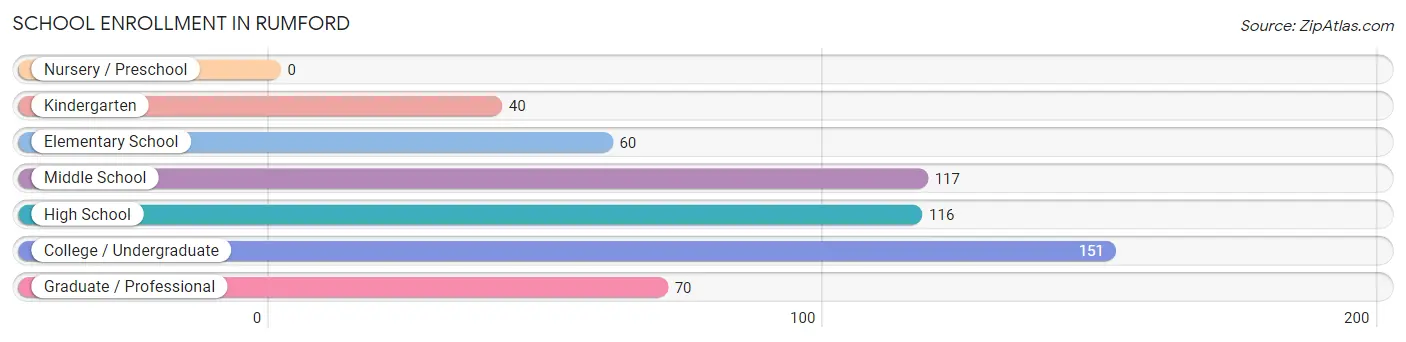
The most common levels of schooling among the 554 students in Rumford are college / undergraduate (151 | 27.3%), middle school (117 | 21.1%), and high school (116 | 20.9%).
| School Level | # Students | % Students |
| Nursery / Preschool | 0 | 0.0% |
| Kindergarten | 40 | 7.2% |
| Elementary School | 60 | 10.8% |
| Middle School | 117 | 21.1% |
| High School | 116 | 20.9% |
| College / Undergraduate | 151 | 27.3% |
| Graduate / Professional | 70 | 12.6% |
| Total | 554 | 100.0% |
School Enrollment by Age by Funding Source in Rumford
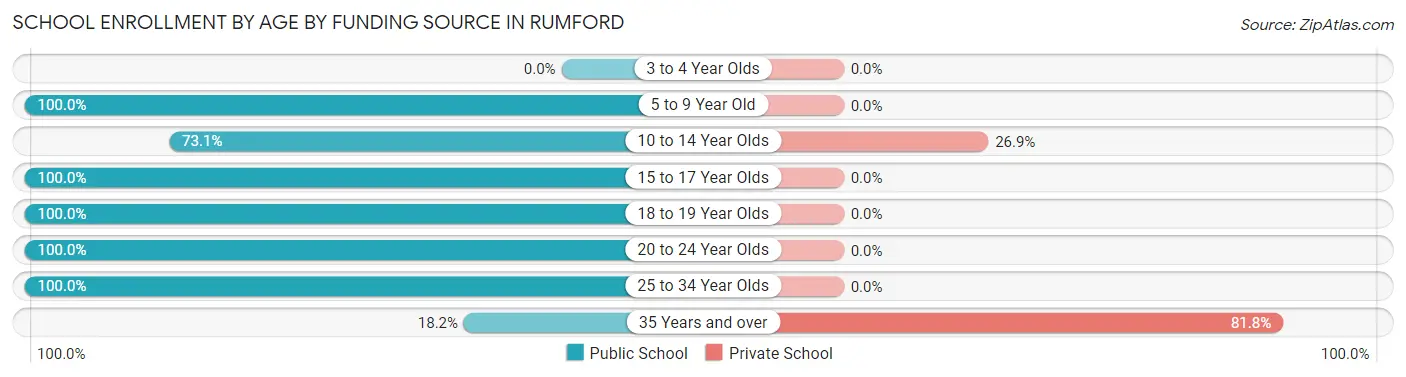
Out of a total of 554 students who are enrolled in schools in Rumford, 71 (12.8%) attend a private institution, while the remaining 483 (87.2%) are enrolled in public schools. The age group of 35 years and over has the highest likelihood of being enrolled in private schools, with 36 (81.8% in the age bracket) enrolled. Conversely, the age group of 5 to 9 year old has the lowest likelihood of being enrolled in a private school, with 88 (100.0% in the age bracket) attending a public institution.
| Age Bracket | Public School | Private School |
| 3 to 4 Year Olds | 0 (0.0%) | 0 (0.0%) |
| 5 to 9 Year Old | 88 (100.0%) | 0 (0.0%) |
| 10 to 14 Year Olds | 95 (73.1%) | 35 (26.9%) |
| 15 to 17 Year Olds | 108 (100.0%) | 0 (0.0%) |
| 18 to 19 Year Olds | 7 (100.0%) | 0 (0.0%) |
| 20 to 24 Year Olds | 128 (100.0%) | 0 (0.0%) |
| 25 to 34 Year Olds | 49 (100.0%) | 0 (0.0%) |
| 35 Years and over | 8 (18.2%) | 36 (81.8%) |
| Total | 483 (87.2%) | 71 (12.8%) |
Educational Attainment by Field of Study in Rumford
Education (108 | 20.5%), science & technology (90 | 17.1%), business (78 | 14.8%), physical & health sciences (72 | 13.7%), and liberal arts & history (63 | 12.0%) are the most common fields of study among 526 individuals in Rumford who have obtained a bachelor's degree or higher.
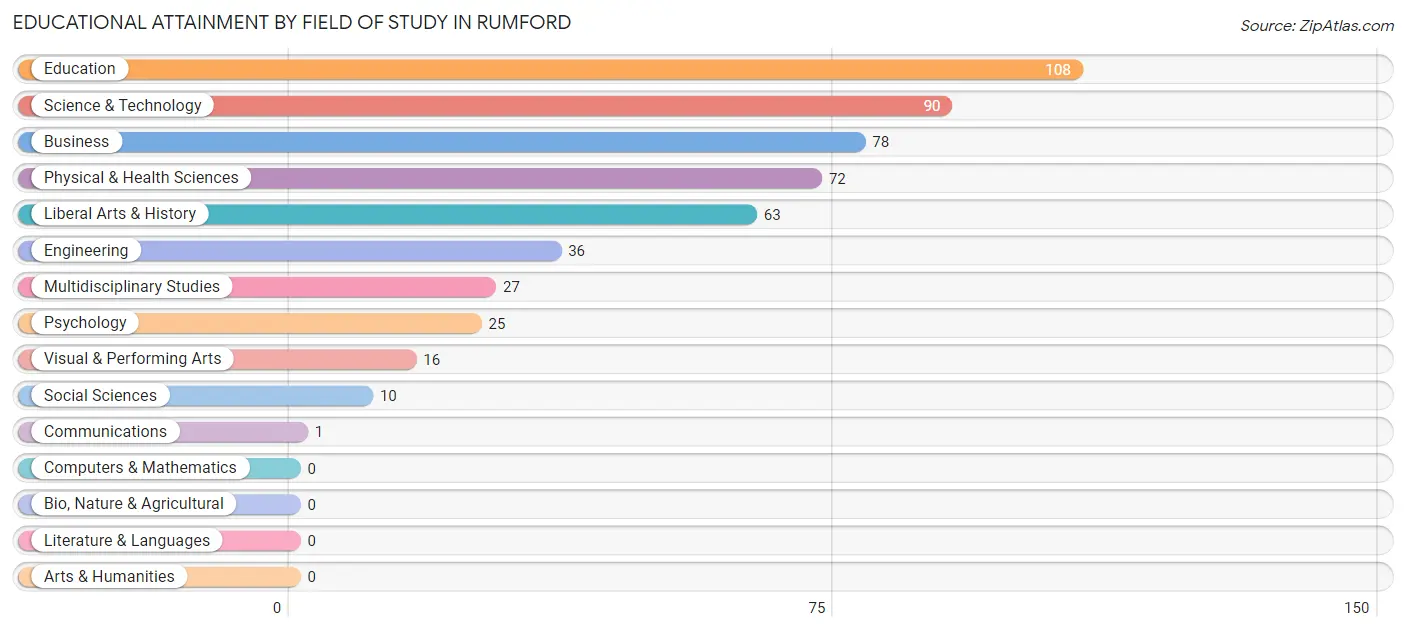
| Field of Study | # Graduates | % Graduates |
| Computers & Mathematics | 0 | 0.0% |
| Bio, Nature & Agricultural | 0 | 0.0% |
| Physical & Health Sciences | 72 | 13.7% |
| Psychology | 25 | 4.8% |
| Social Sciences | 10 | 1.9% |
| Engineering | 36 | 6.8% |
| Multidisciplinary Studies | 27 | 5.1% |
| Science & Technology | 90 | 17.1% |
| Business | 78 | 14.8% |
| Education | 108 | 20.5% |
| Literature & Languages | 0 | 0.0% |
| Liberal Arts & History | 63 | 12.0% |
| Visual & Performing Arts | 16 | 3.0% |
| Communications | 1 | 0.2% |
| Arts & Humanities | 0 | 0.0% |
| Total | 526 | 100.0% |
Transportation & Commute in Rumford
Vehicle Availability by Sex in Rumford
The most prevalent vehicle ownership categories in Rumford are males with 2 vehicles (283, accounting for 40.1%) and females with 2 vehicles (275, making up 35.5%).
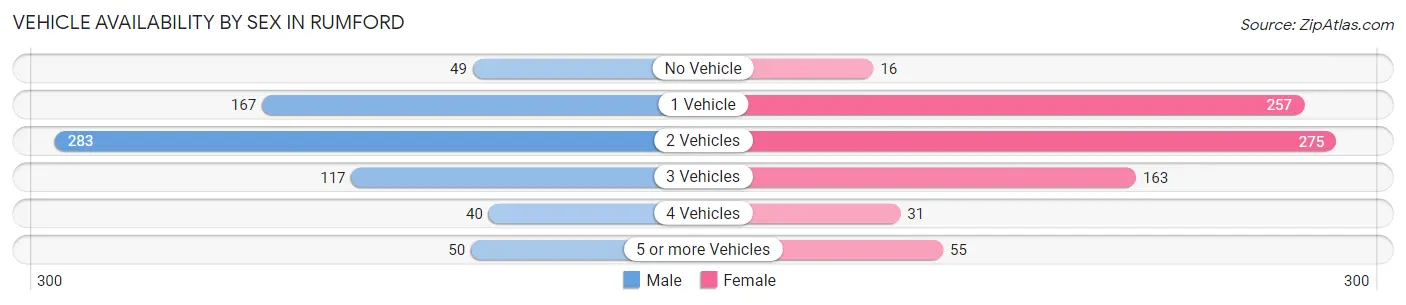
| Vehicles Available | Male | Female |
| No Vehicle | 49 (6.9%) | 16 (2.0%) |
| 1 Vehicle | 167 (23.6%) | 257 (32.3%) |
| 2 Vehicles | 283 (40.1%) | 275 (34.5%) |
| 3 Vehicles | 117 (16.6%) | 163 (20.4%) |
| 4 Vehicles | 40 (5.7%) | 31 (3.9%) |
| 5 or more Vehicles | 50 (7.1%) | 55 (6.9%) |
| Total | 706 (100.0%) | 797 (100.0%) |
Commute Time in Rumford
The most frequently occuring commute durations in Rumford are 10 to 14 minutes (254 commuters, 16.9%), 5 to 9 minutes (241 commuters, 16.0%), and 45 to 59 minutes (175 commuters, 11.6%).

| Commute Time | # Commuters | % Commuters |
| Less than 5 Minutes | 112 | 7.4% |
| 5 to 9 Minutes | 241 | 16.0% |
| 10 to 14 Minutes | 254 | 16.9% |
| 15 to 19 Minutes | 173 | 11.5% |
| 20 to 24 Minutes | 104 | 6.9% |
| 25 to 29 Minutes | 101 | 6.7% |
| 30 to 34 Minutes | 82 | 5.4% |
| 35 to 39 Minutes | 42 | 2.8% |
| 40 to 44 Minutes | 33 | 2.2% |
| 45 to 59 Minutes | 175 | 11.6% |
| 60 to 89 Minutes | 102 | 6.8% |
| 90 or more Minutes | 85 | 5.7% |
Commute Time by Sex in Rumford
The most common commute times in Rumford are 10 to 14 minutes (127 commuters, 17.7%) for males and 5 to 9 minutes (151 commuters, 19.2%) for females.
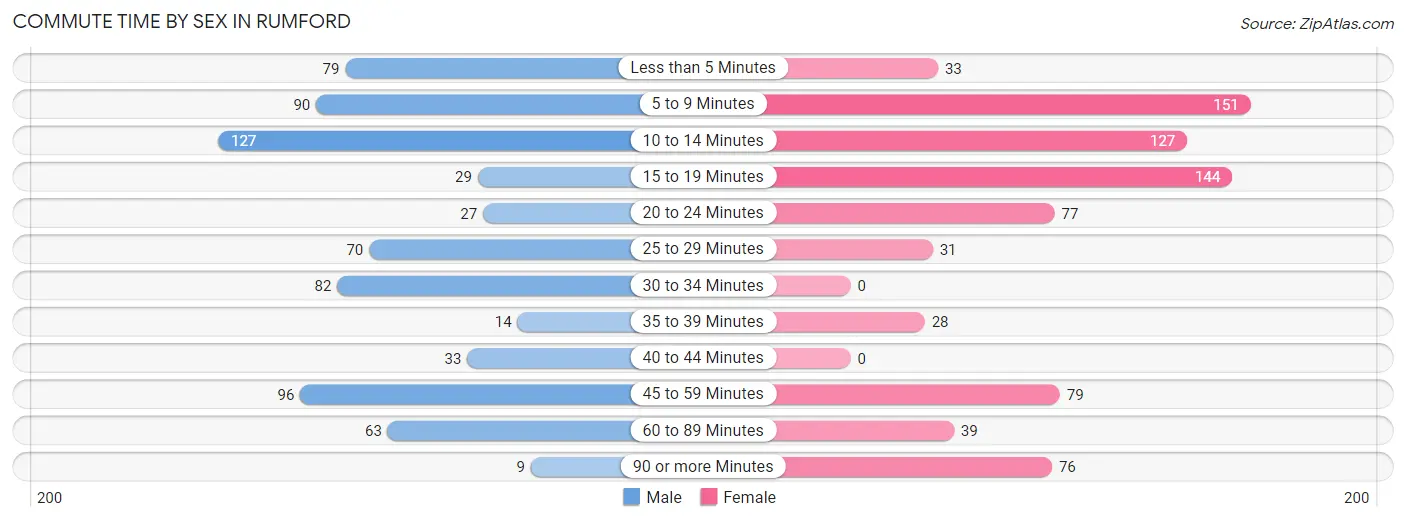
| Commute Time | Male | Female |
| Less than 5 Minutes | 79 (11.0%) | 33 (4.2%) |
| 5 to 9 Minutes | 90 (12.5%) | 151 (19.2%) |
| 10 to 14 Minutes | 127 (17.7%) | 127 (16.2%) |
| 15 to 19 Minutes | 29 (4.0%) | 144 (18.3%) |
| 20 to 24 Minutes | 27 (3.8%) | 77 (9.8%) |
| 25 to 29 Minutes | 70 (9.7%) | 31 (4.0%) |
| 30 to 34 Minutes | 82 (11.4%) | 0 (0.0%) |
| 35 to 39 Minutes | 14 (1.9%) | 28 (3.6%) |
| 40 to 44 Minutes | 33 (4.6%) | 0 (0.0%) |
| 45 to 59 Minutes | 96 (13.4%) | 79 (10.1%) |
| 60 to 89 Minutes | 63 (8.8%) | 39 (5.0%) |
| 90 or more Minutes | 9 (1.3%) | 76 (9.7%) |
Time of Departure to Work by Sex in Rumford
The most frequent times of departure to work in Rumford are 6:00 AM to 6:29 AM (189, 26.3%) for males and 6:30 AM to 6:59 AM (128, 16.3%) for females.
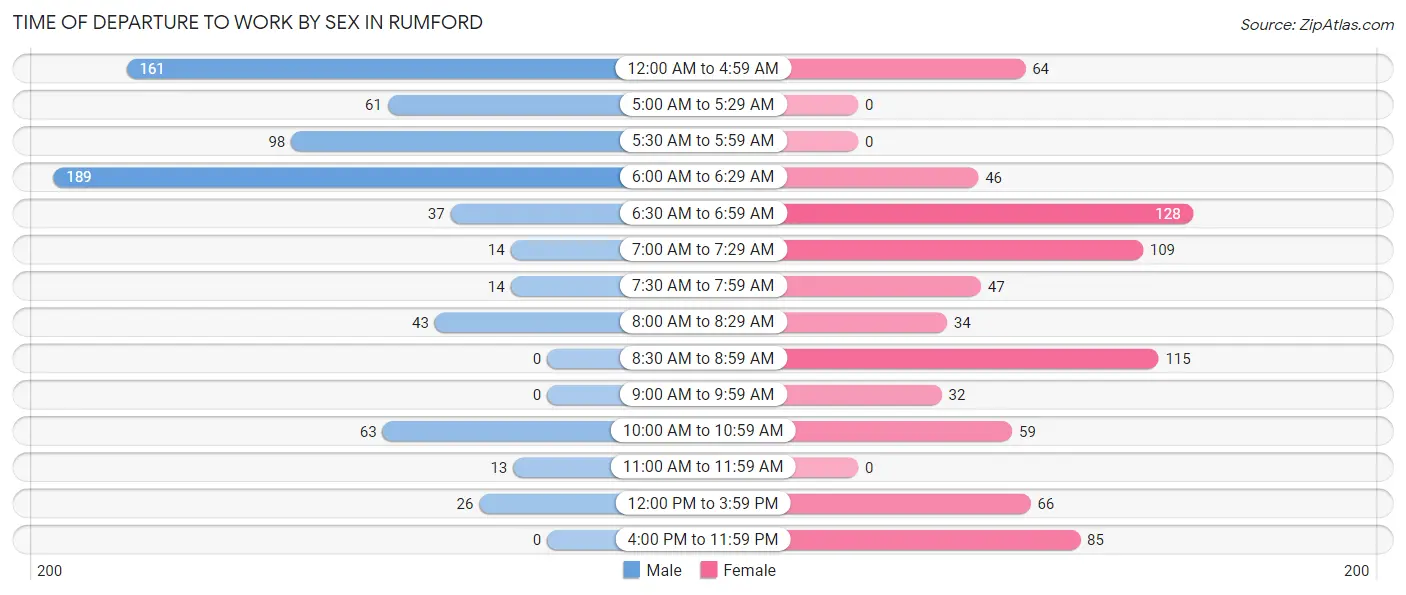
| Time of Departure | Male | Female |
| 12:00 AM to 4:59 AM | 161 (22.4%) | 64 (8.2%) |
| 5:00 AM to 5:29 AM | 61 (8.5%) | 0 (0.0%) |
| 5:30 AM to 5:59 AM | 98 (13.6%) | 0 (0.0%) |
| 6:00 AM to 6:29 AM | 189 (26.3%) | 46 (5.9%) |
| 6:30 AM to 6:59 AM | 37 (5.1%) | 128 (16.3%) |
| 7:00 AM to 7:29 AM | 14 (1.9%) | 109 (13.9%) |
| 7:30 AM to 7:59 AM | 14 (1.9%) | 47 (6.0%) |
| 8:00 AM to 8:29 AM | 43 (6.0%) | 34 (4.3%) |
| 8:30 AM to 8:59 AM | 0 (0.0%) | 115 (14.6%) |
| 9:00 AM to 9:59 AM | 0 (0.0%) | 32 (4.1%) |
| 10:00 AM to 10:59 AM | 63 (8.8%) | 59 (7.5%) |
| 11:00 AM to 11:59 AM | 13 (1.8%) | 0 (0.0%) |
| 12:00 PM to 3:59 PM | 26 (3.6%) | 66 (8.4%) |
| 4:00 PM to 11:59 PM | 0 (0.0%) | 85 (10.8%) |
| Total | 719 (100.0%) | 785 (100.0%) |
Housing Occupancy in Rumford
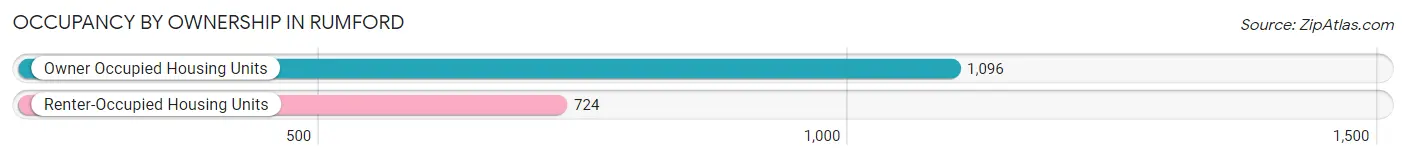
Occupancy by Ownership in Rumford
Of the total 1,820 dwellings in Rumford, owner-occupied units account for 1,096 (60.2%), while renter-occupied units make up 724 (39.8%).
| Occupancy | # Housing Units | % Housing Units |
| Owner Occupied Housing Units | 1,096 | 60.2% |
| Renter-Occupied Housing Units | 724 | 39.8% |
| Total Occupied Housing Units | 1,820 | 100.0% |
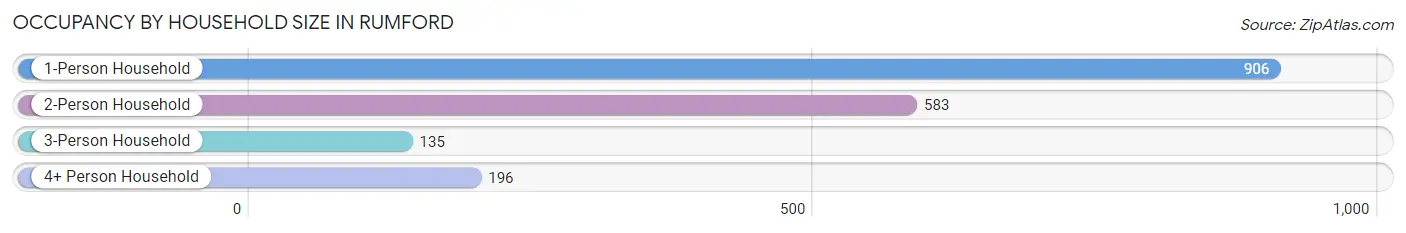
Occupancy by Household Size in Rumford
| Household Size | # Housing Units | % Housing Units |
| 1-Person Household | 906 | 49.8% |
| 2-Person Household | 583 | 32.0% |
| 3-Person Household | 135 | 7.4% |
| 4+ Person Household | 196 | 10.8% |
| Total Housing Units | 1,820 | 100.0% |
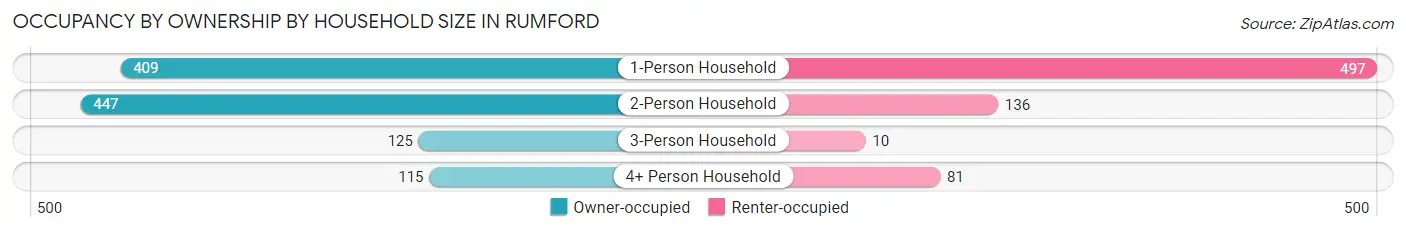
Occupancy by Ownership by Household Size in Rumford
| Household Size | Owner-occupied | Renter-occupied |
| 1-Person Household | 409 (45.1%) | 497 (54.9%) |
| 2-Person Household | 447 (76.7%) | 136 (23.3%) |
| 3-Person Household | 125 (92.6%) | 10 (7.4%) |
| 4+ Person Household | 115 (58.7%) | 81 (41.3%) |
| Total Housing Units | 1,096 (60.2%) | 724 (39.8%) |
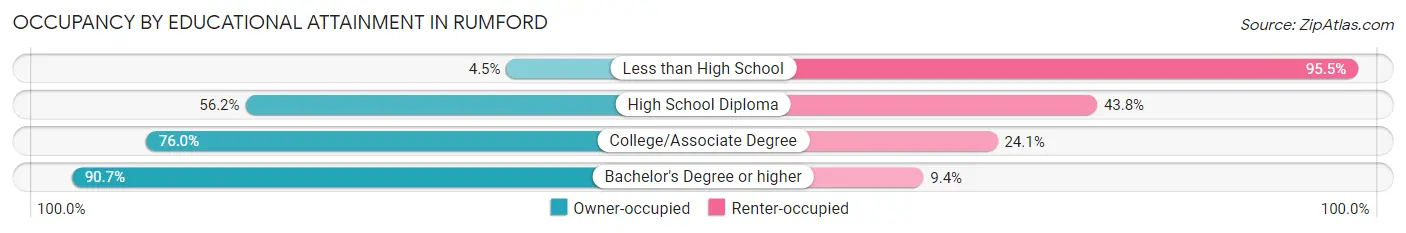
Occupancy by Educational Attainment in Rumford
| Household Size | Owner-occupied | Renter-occupied |
| Less than High School | 10 (4.5%) | 213 (95.5%) |
| High School Diploma | 465 (56.2%) | 362 (43.8%) |
| College/Associate Degree | 398 (75.9%) | 126 (24.0%) |
| Bachelor's Degree or higher | 223 (90.6%) | 23 (9.3%) |
Occupancy by Age of Householder in Rumford
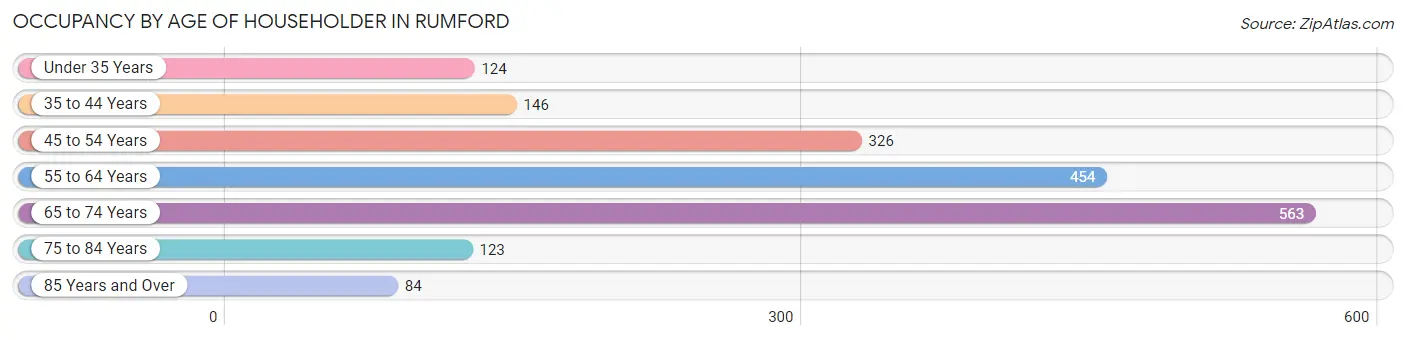
| Age Bracket | # Households | % Households |
| Under 35 Years | 124 | 6.8% |
| 35 to 44 Years | 146 | 8.0% |
| 45 to 54 Years | 326 | 17.9% |
| 55 to 64 Years | 454 | 24.9% |
| 65 to 74 Years | 563 | 30.9% |
| 75 to 84 Years | 123 | 6.8% |
| 85 Years and Over | 84 | 4.6% |
| Total | 1,820 | 100.0% |
Housing Finances in Rumford
Median Income by Occupancy in Rumford
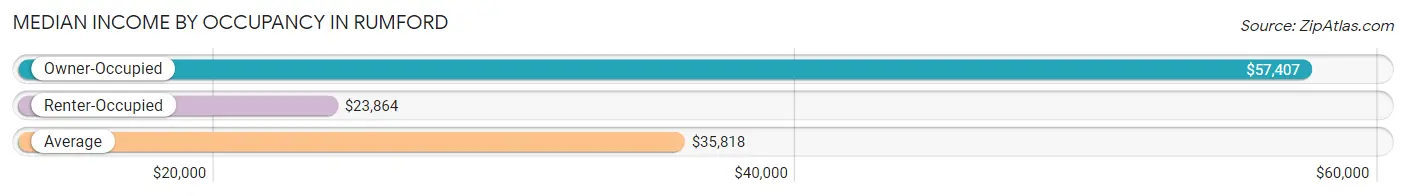
| Occupancy Type | # Households | Median Income |
| Owner-Occupied | 1,096 (60.2%) | $57,407 |
| Renter-Occupied | 724 (39.8%) | $23,864 |
| Average | 1,820 (100.0%) | $35,818 |
Occupancy by Householder Income Bracket in Rumford
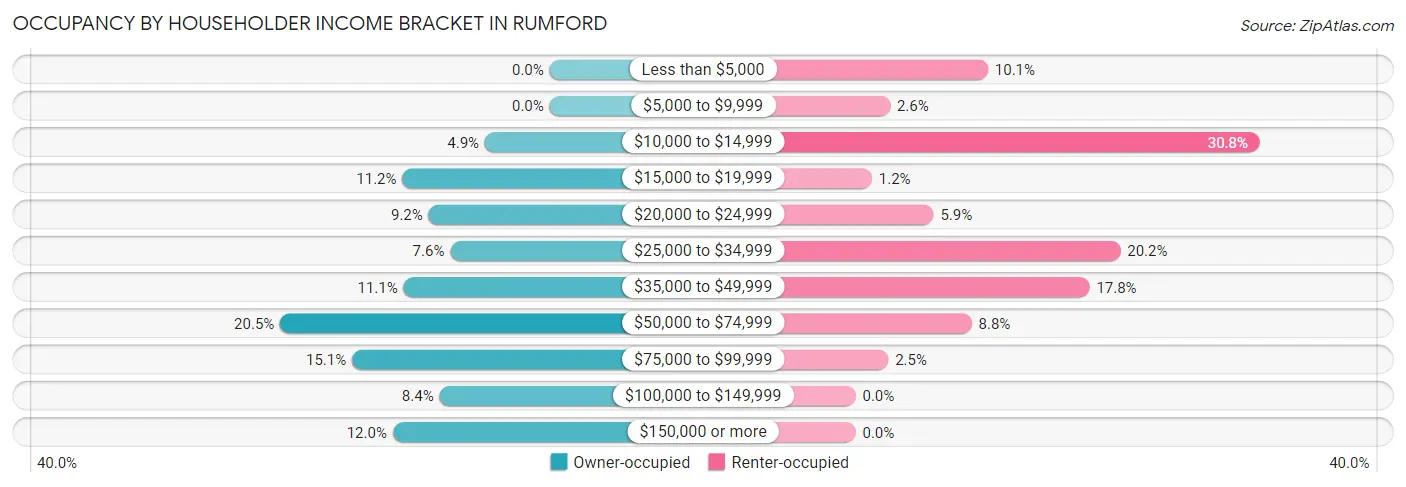
| Income Bracket | Owner-occupied | Renter-occupied |
| Less than $5,000 | 0 (0.0%) | 73 (10.1%) |
| $5,000 to $9,999 | 0 (0.0%) | 19 (2.6%) |
| $10,000 to $14,999 | 54 (4.9%) | 223 (30.8%) |
| $15,000 to $19,999 | 123 (11.2%) | 9 (1.2%) |
| $20,000 to $24,999 | 101 (9.2%) | 43 (5.9%) |
| $25,000 to $34,999 | 83 (7.6%) | 146 (20.2%) |
| $35,000 to $49,999 | 122 (11.1%) | 129 (17.8%) |
| $50,000 to $74,999 | 225 (20.5%) | 64 (8.8%) |
| $75,000 to $99,999 | 165 (15.0%) | 18 (2.5%) |
| $100,000 to $149,999 | 92 (8.4%) | 0 (0.0%) |
| $150,000 or more | 131 (11.9%) | 0 (0.0%) |
| Total | 1,096 (100.0%) | 724 (100.0%) |
Monthly Housing Cost Tiers in Rumford
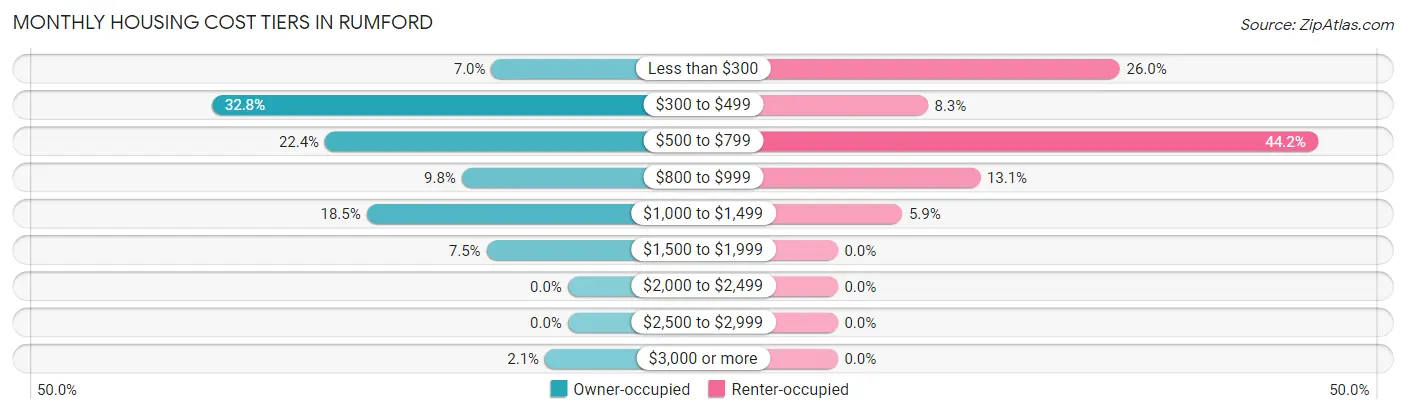
| Monthly Cost | Owner-occupied | Renter-occupied |
| Less than $300 | 77 (7.0%) | 188 (26.0%) |
| $300 to $499 | 359 (32.8%) | 60 (8.3%) |
| $500 to $799 | 245 (22.4%) | 320 (44.2%) |
| $800 to $999 | 107 (9.8%) | 95 (13.1%) |
| $1,000 to $1,499 | 203 (18.5%) | 43 (5.9%) |
| $1,500 to $1,999 | 82 (7.5%) | 0 (0.0%) |
| $2,000 to $2,499 | 0 (0.0%) | 0 (0.0%) |
| $2,500 to $2,999 | 0 (0.0%) | 0 (0.0%) |
| $3,000 or more | 23 (2.1%) | 0 (0.0%) |
| Total | 1,096 (100.0%) | 724 (100.0%) |
Physical Housing Characteristics in Rumford
Housing Structures in Rumford
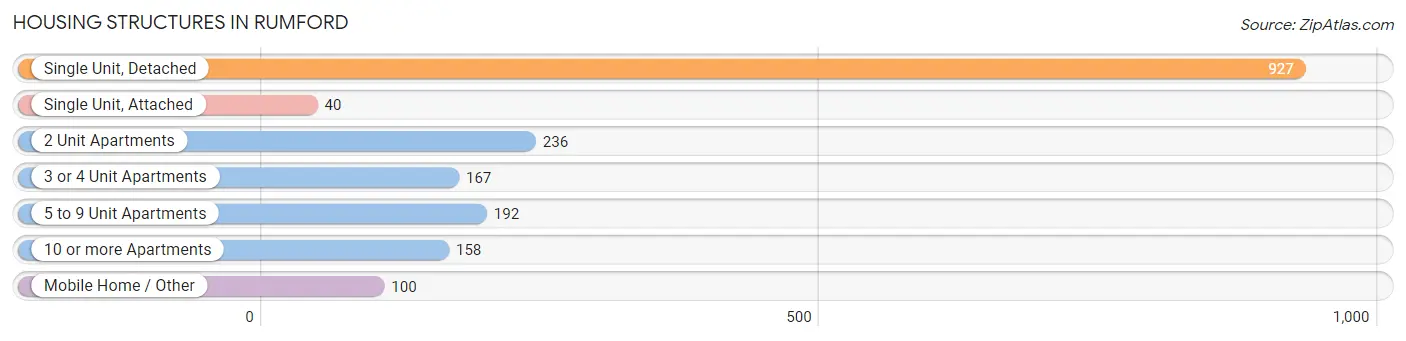
| Structure Type | # Housing Units | % Housing Units |
| Single Unit, Detached | 927 | 50.9% |
| Single Unit, Attached | 40 | 2.2% |
| 2 Unit Apartments | 236 | 13.0% |
| 3 or 4 Unit Apartments | 167 | 9.2% |
| 5 to 9 Unit Apartments | 192 | 10.5% |
| 10 or more Apartments | 158 | 8.7% |
| Mobile Home / Other | 100 | 5.5% |
| Total | 1,820 | 100.0% |
Housing Structures by Occupancy in Rumford
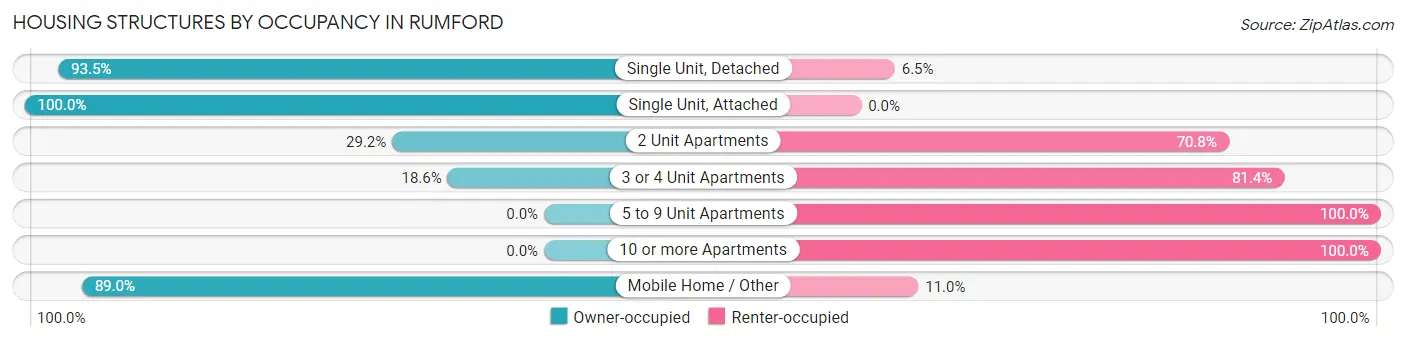
| Structure Type | Owner-occupied | Renter-occupied |
| Single Unit, Detached | 867 (93.5%) | 60 (6.5%) |
| Single Unit, Attached | 40 (100.0%) | 0 (0.0%) |
| 2 Unit Apartments | 69 (29.2%) | 167 (70.8%) |
| 3 or 4 Unit Apartments | 31 (18.6%) | 136 (81.4%) |
| 5 to 9 Unit Apartments | 0 (0.0%) | 192 (100.0%) |
| 10 or more Apartments | 0 (0.0%) | 158 (100.0%) |
| Mobile Home / Other | 89 (89.0%) | 11 (11.0%) |
| Total | 1,096 (60.2%) | 724 (39.8%) |
Housing Structures by Number of Rooms in Rumford
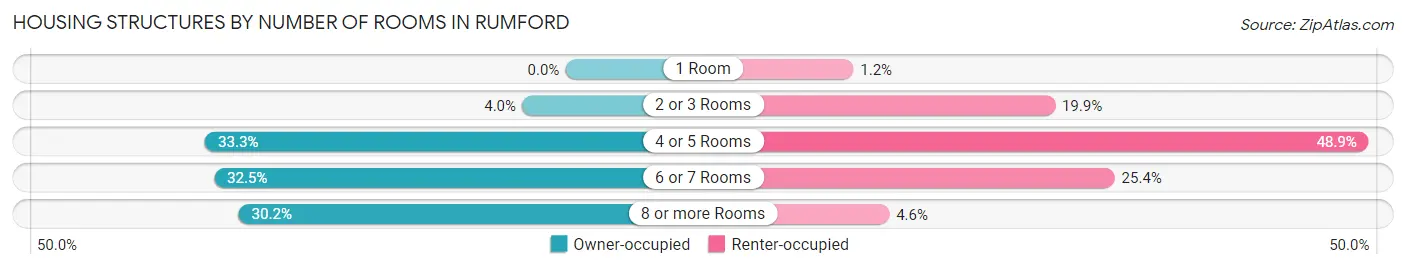
| Number of Rooms | Owner-occupied | Renter-occupied |
| 1 Room | 0 (0.0%) | 9 (1.2%) |
| 2 or 3 Rooms | 44 (4.0%) | 144 (19.9%) |
| 4 or 5 Rooms | 365 (33.3%) | 354 (48.9%) |
| 6 or 7 Rooms | 356 (32.5%) | 184 (25.4%) |
| 8 or more Rooms | 331 (30.2%) | 33 (4.6%) |
| Total | 1,096 (100.0%) | 724 (100.0%) |
Housing Structure by Heating Type in Rumford
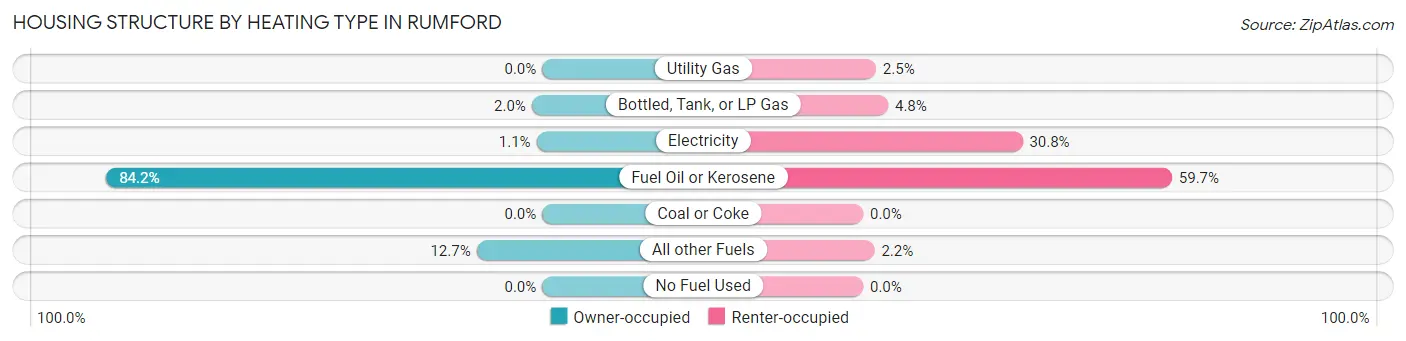
| Heating Type | Owner-occupied | Renter-occupied |
| Utility Gas | 0 (0.0%) | 18 (2.5%) |
| Bottled, Tank, or LP Gas | 22 (2.0%) | 35 (4.8%) |
| Electricity | 12 (1.1%) | 223 (30.8%) |
| Fuel Oil or Kerosene | 923 (84.2%) | 432 (59.7%) |
| Coal or Coke | 0 (0.0%) | 0 (0.0%) |
| All other Fuels | 139 (12.7%) | 16 (2.2%) |
| No Fuel Used | 0 (0.0%) | 0 (0.0%) |
| Total | 1,096 (100.0%) | 724 (100.0%) |
Household Vehicle Usage in Rumford
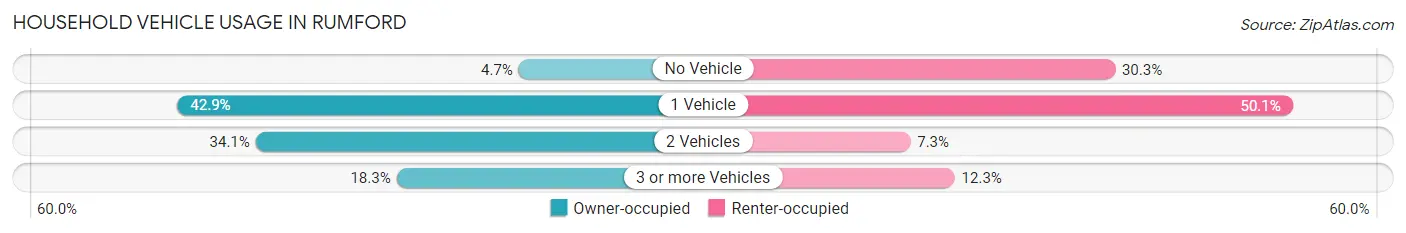
| Vehicles per Household | Owner-occupied | Renter-occupied |
| No Vehicle | 51 (4.6%) | 219 (30.2%) |
| 1 Vehicle | 470 (42.9%) | 363 (50.1%) |
| 2 Vehicles | 374 (34.1%) | 53 (7.3%) |
| 3 or more Vehicles | 201 (18.3%) | 89 (12.3%) |
| Total | 1,096 (100.0%) | 724 (100.0%) |
Real Estate & Mortgages in Rumford
Real Estate and Mortgage Overview in Rumford
| Characteristic | Without Mortgage | With Mortgage |
| Housing Units | 614 | 482 |
| Median Property Value | $104,400 | $118,400 |
| Median Household Income | $57,407 | $54 |
| Monthly Housing Costs | $452 | $12 |
| Real Estate Taxes | $1,626 | $12 |
Property Value by Mortgage Status in Rumford
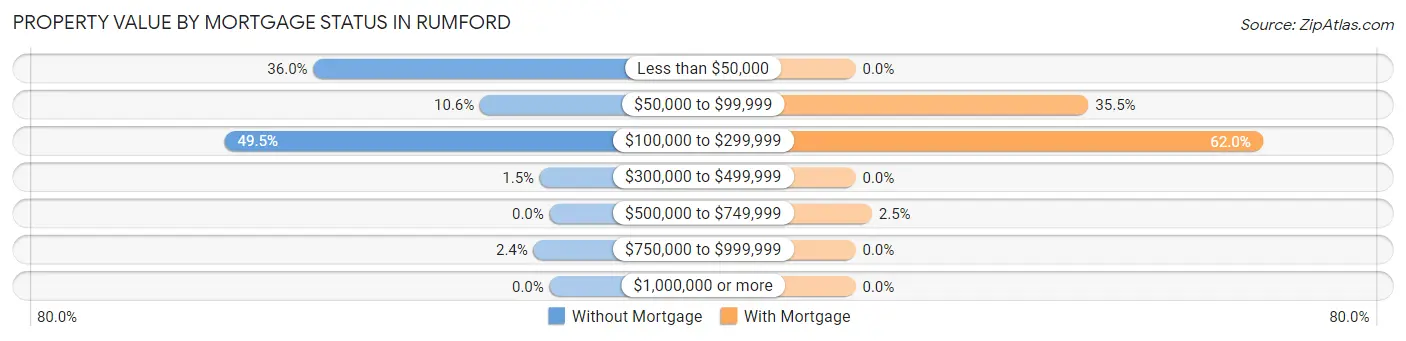
| Property Value | Without Mortgage | With Mortgage |
| Less than $50,000 | 221 (36.0%) | 0 (0.0%) |
| $50,000 to $99,999 | 65 (10.6%) | 171 (35.5%) |
| $100,000 to $299,999 | 304 (49.5%) | 299 (62.0%) |
| $300,000 to $499,999 | 9 (1.5%) | 0 (0.0%) |
| $500,000 to $749,999 | 0 (0.0%) | 12 (2.5%) |
| $750,000 to $999,999 | 15 (2.4%) | 0 (0.0%) |
| $1,000,000 or more | 0 (0.0%) | 0 (0.0%) |
| Total | 614 (100.0%) | 482 (100.0%) |
Household Income by Mortgage Status in Rumford
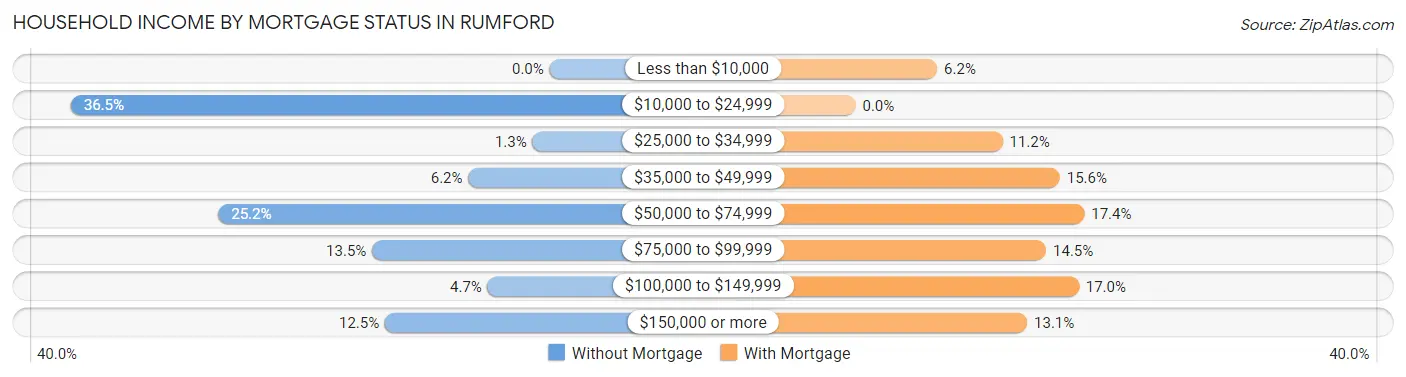
| Household Income | Without Mortgage | With Mortgage |
| Less than $10,000 | 0 (0.0%) | 30 (6.2%) |
| $10,000 to $24,999 | 224 (36.5%) | 0 (0.0%) |
| $25,000 to $34,999 | 8 (1.3%) | 54 (11.2%) |
| $35,000 to $49,999 | 38 (6.2%) | 75 (15.6%) |
| $50,000 to $74,999 | 155 (25.2%) | 84 (17.4%) |
| $75,000 to $99,999 | 83 (13.5%) | 70 (14.5%) |
| $100,000 to $149,999 | 29 (4.7%) | 82 (17.0%) |
| $150,000 or more | 77 (12.5%) | 63 (13.1%) |
| Total | 614 (100.0%) | 482 (100.0%) |
Property Value to Household Income Ratio in Rumford
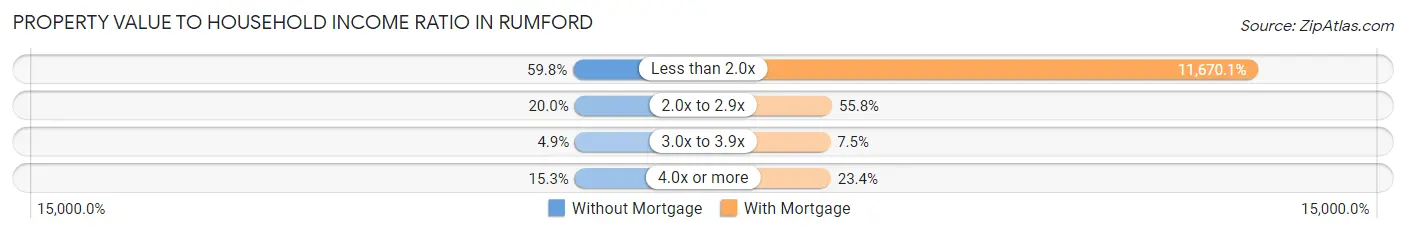
| Value-to-Income Ratio | Without Mortgage | With Mortgage |
| Less than 2.0x | 367 (59.8%) | 56,250 (11,670.1%) |
| 2.0x to 2.9x | 123 (20.0%) | 269 (55.8%) |
| 3.0x to 3.9x | 30 (4.9%) | 36 (7.5%) |
| 4.0x or more | 94 (15.3%) | 113 (23.4%) |
| Total | 614 (100.0%) | 482 (100.0%) |
Real Estate Taxes by Mortgage Status in Rumford
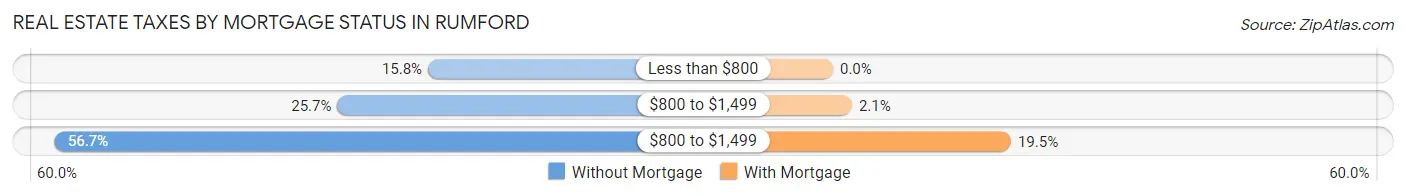
| Property Taxes | Without Mortgage | With Mortgage |
| Less than $800 | 97 (15.8%) | 0 (0.0%) |
| $800 to $1,499 | 158 (25.7%) | 10 (2.1%) |
| $800 to $1,499 | 348 (56.7%) | 94 (19.5%) |
| Total | 614 (100.0%) | 482 (100.0%) |
Health & Disability in Rumford
Health Insurance Coverage by Age in Rumford
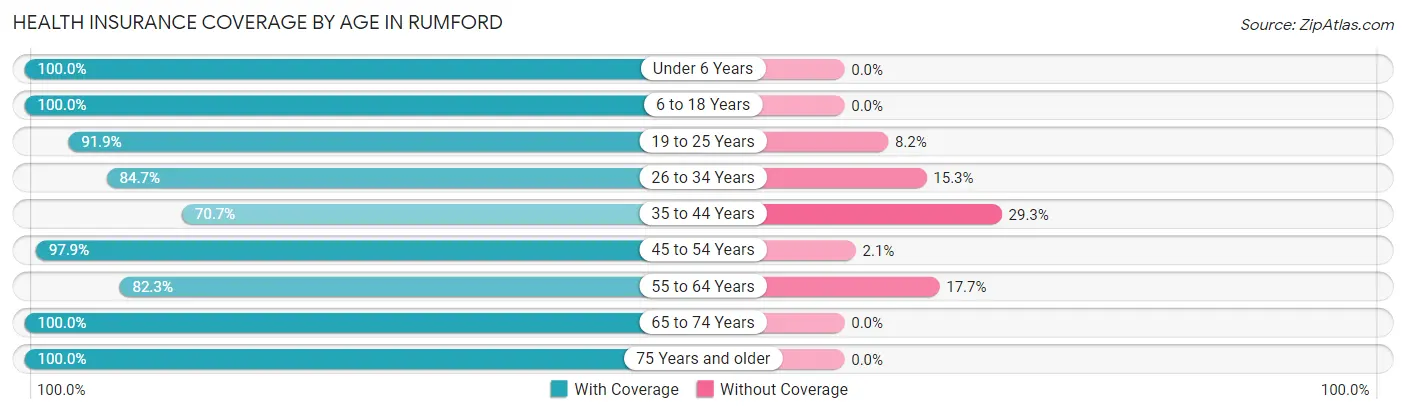
| Age Bracket | With Coverage | Without Coverage |
| Under 6 Years | 162 (100.0%) | 0 (0.0%) |
| 6 to 18 Years | 290 (100.0%) | 0 (0.0%) |
| 19 to 25 Years | 293 (91.8%) | 26 (8.2%) |
| 26 to 34 Years | 238 (84.7%) | 43 (15.3%) |
| 35 to 44 Years | 224 (70.7%) | 93 (29.3%) |
| 45 to 54 Years | 649 (97.9%) | 14 (2.1%) |
| 55 to 64 Years | 646 (82.3%) | 139 (17.7%) |
| 65 to 74 Years | 697 (100.0%) | 0 (0.0%) |
| 75 Years and older | 332 (100.0%) | 0 (0.0%) |
| Total | 3,531 (91.8%) | 315 (8.2%) |
Health Insurance Coverage by Citizenship Status in Rumford
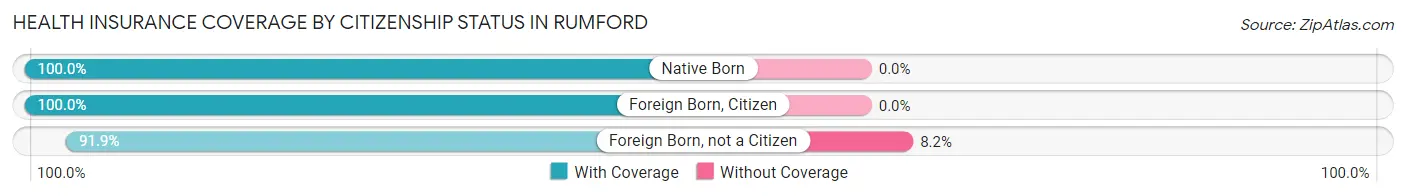
| Citizenship Status | With Coverage | Without Coverage |
| Native Born | 162 (100.0%) | 0 (0.0%) |
| Foreign Born, Citizen | 290 (100.0%) | 0 (0.0%) |
| Foreign Born, not a Citizen | 293 (91.8%) | 26 (8.2%) |
Health Insurance Coverage by Household Income in Rumford
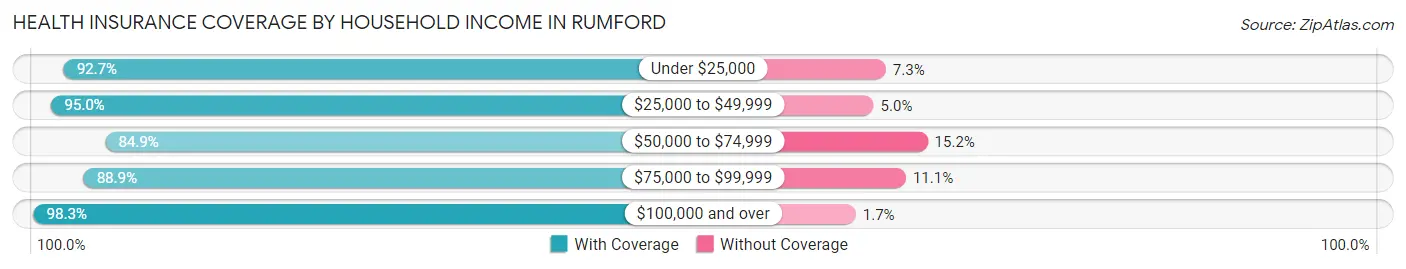
| Household Income | With Coverage | Without Coverage |
| Under $25,000 | 897 (92.7%) | 71 (7.3%) |
| $25,000 to $49,999 | 717 (95.0%) | 38 (5.0%) |
| $50,000 to $74,999 | 728 (84.9%) | 130 (15.1%) |
| $75,000 to $99,999 | 521 (88.9%) | 65 (11.1%) |
| $100,000 and over | 637 (98.3%) | 11 (1.7%) |
Public vs Private Health Insurance Coverage by Age in Rumford
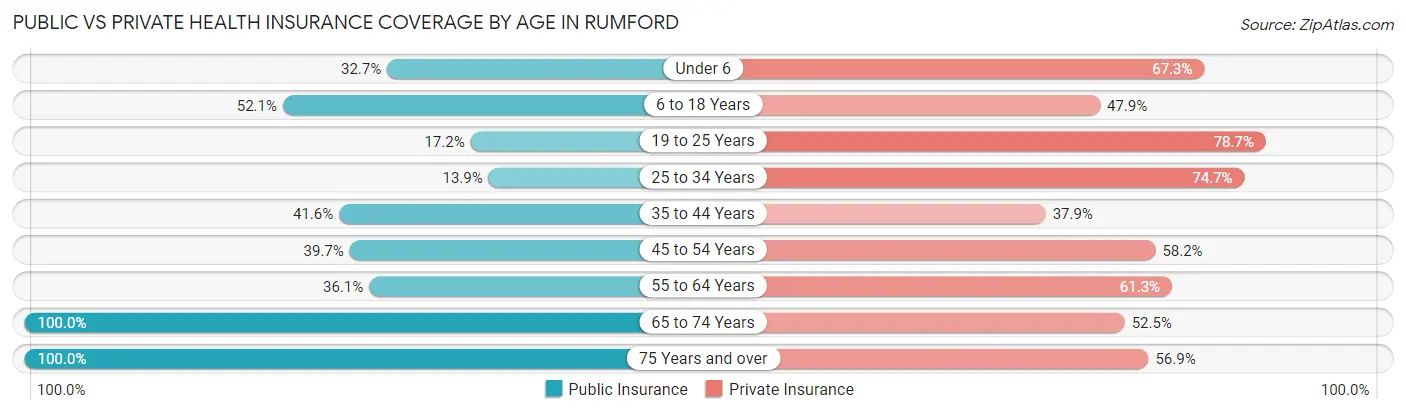
| Age Bracket | Public Insurance | Private Insurance |
| Under 6 | 53 (32.7%) | 109 (67.3%) |
| 6 to 18 Years | 151 (52.1%) | 139 (47.9%) |
| 19 to 25 Years | 55 (17.2%) | 251 (78.7%) |
| 25 to 34 Years | 39 (13.9%) | 210 (74.7%) |
| 35 to 44 Years | 132 (41.6%) | 120 (37.9%) |
| 45 to 54 Years | 263 (39.7%) | 386 (58.2%) |
| 55 to 64 Years | 283 (36.0%) | 481 (61.3%) |
| 65 to 74 Years | 697 (100.0%) | 366 (52.5%) |
| 75 Years and over | 332 (100.0%) | 189 (56.9%) |
| Total | 2,005 (52.1%) | 2,251 (58.5%) |
Disability Status by Sex by Age in Rumford
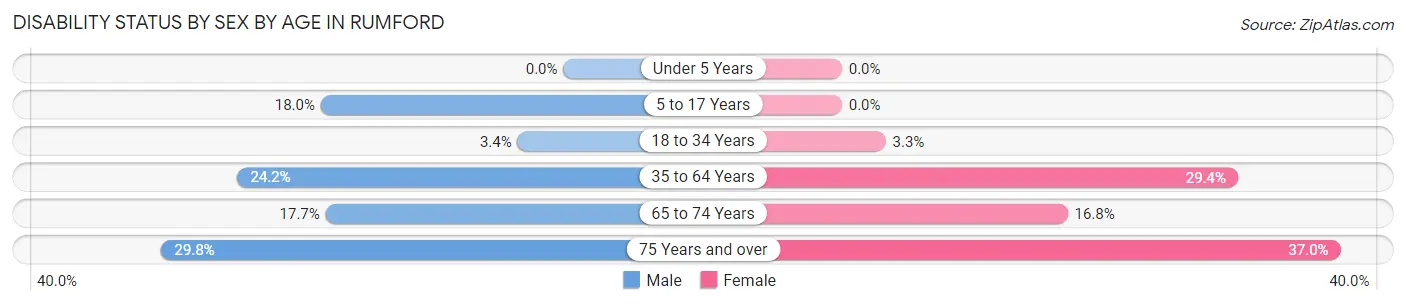
| Age Bracket | Male | Female |
| Under 5 Years | 0 (0.0%) | 0 (0.0%) |
| 5 to 17 Years | 49 (18.0%) | 0 (0.0%) |
| 18 to 34 Years | 7 (3.4%) | 13 (3.3%) |
| 35 to 64 Years | 218 (24.2%) | 254 (29.4%) |
| 65 to 74 Years | 63 (17.6%) | 57 (16.8%) |
| 75 Years and over | 37 (29.8%) | 77 (37.0%) |
Disability Class by Sex by Age in Rumford
Disability Class: Hearing Difficulty
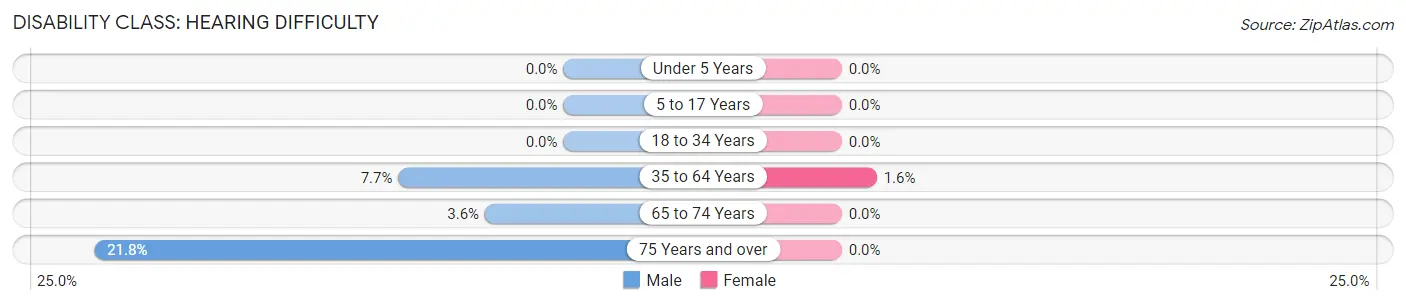
| Age Bracket | Male | Female |
| Under 5 Years | 0 (0.0%) | 0 (0.0%) |
| 5 to 17 Years | 0 (0.0%) | 0 (0.0%) |
| 18 to 34 Years | 0 (0.0%) | 0 (0.0%) |
| 35 to 64 Years | 69 (7.7%) | 14 (1.6%) |
| 65 to 74 Years | 13 (3.6%) | 0 (0.0%) |
| 75 Years and over | 27 (21.8%) | 0 (0.0%) |
Disability Class: Vision Difficulty
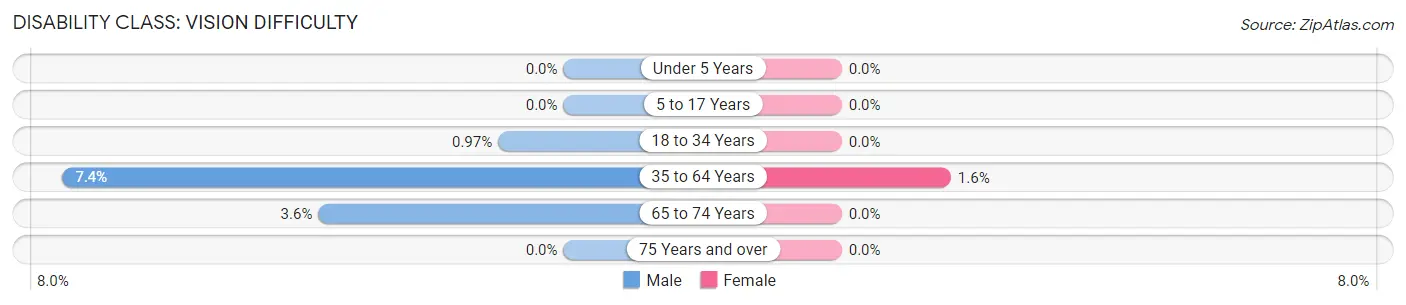
| Age Bracket | Male | Female |
| Under 5 Years | 0 (0.0%) | 0 (0.0%) |
| 5 to 17 Years | 0 (0.0%) | 0 (0.0%) |
| 18 to 34 Years | 2 (1.0%) | 0 (0.0%) |
| 35 to 64 Years | 67 (7.4%) | 14 (1.6%) |
| 65 to 74 Years | 13 (3.6%) | 0 (0.0%) |
| 75 Years and over | 0 (0.0%) | 0 (0.0%) |
Disability Class: Cognitive Difficulty
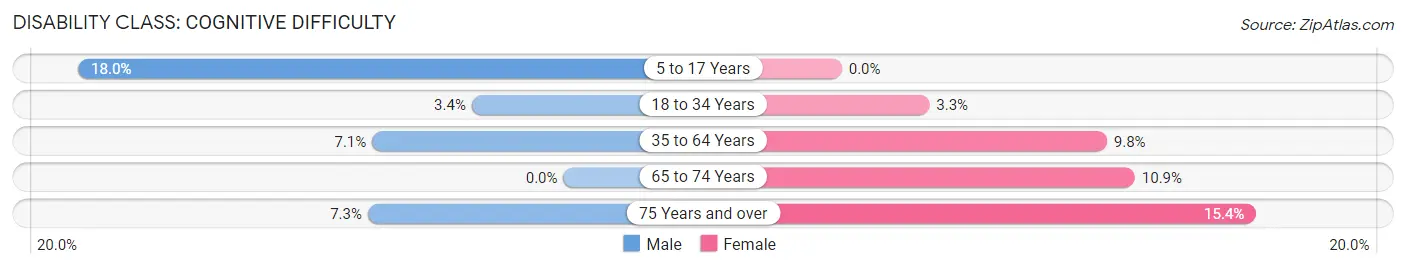
| Age Bracket | Male | Female |
| 5 to 17 Years | 49 (18.0%) | 0 (0.0%) |
| 18 to 34 Years | 7 (3.4%) | 13 (3.3%) |
| 35 to 64 Years | 64 (7.1%) | 85 (9.8%) |
| 65 to 74 Years | 0 (0.0%) | 37 (10.9%) |
| 75 Years and over | 9 (7.3%) | 32 (15.4%) |
Disability Class: Ambulatory Difficulty
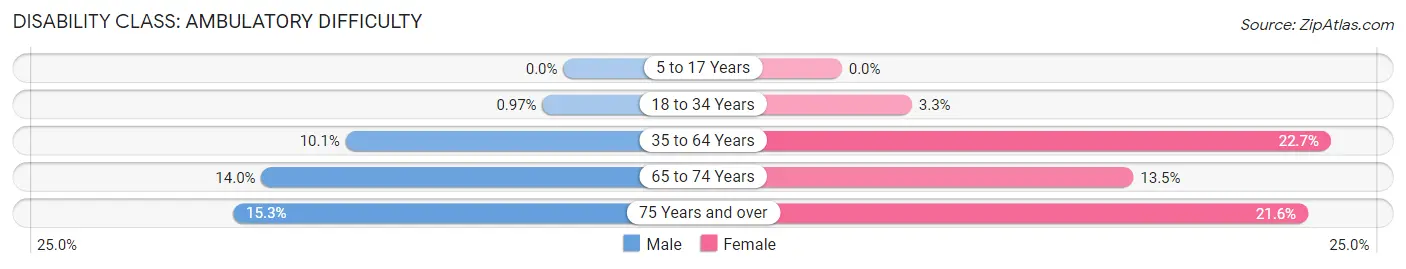
| Age Bracket | Male | Female |
| 5 to 17 Years | 0 (0.0%) | 0 (0.0%) |
| 18 to 34 Years | 2 (1.0%) | 13 (3.3%) |
| 35 to 64 Years | 91 (10.1%) | 196 (22.7%) |
| 65 to 74 Years | 50 (14.0%) | 46 (13.5%) |
| 75 Years and over | 19 (15.3%) | 45 (21.6%) |
Disability Class: Self-Care Difficulty
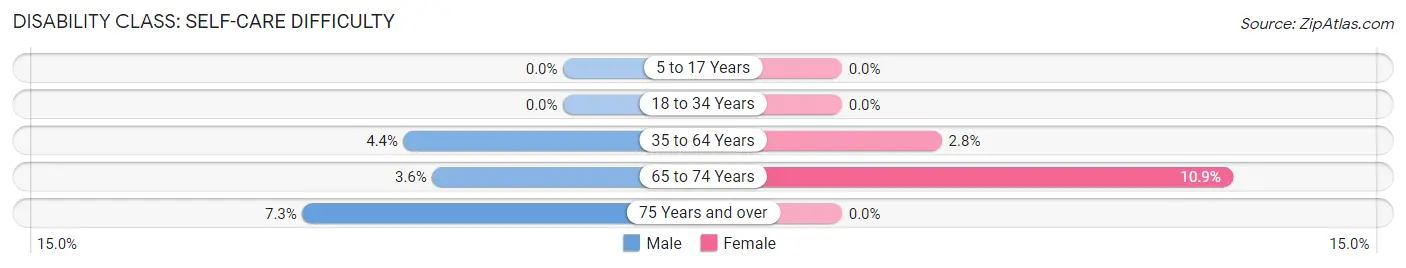
| Age Bracket | Male | Female |
| 5 to 17 Years | 0 (0.0%) | 0 (0.0%) |
| 18 to 34 Years | 0 (0.0%) | 0 (0.0%) |
| 35 to 64 Years | 40 (4.4%) | 24 (2.8%) |
| 65 to 74 Years | 13 (3.6%) | 37 (10.9%) |
| 75 Years and over | 9 (7.3%) | 0 (0.0%) |
Technology Access in Rumford
Computing Device Access in Rumford
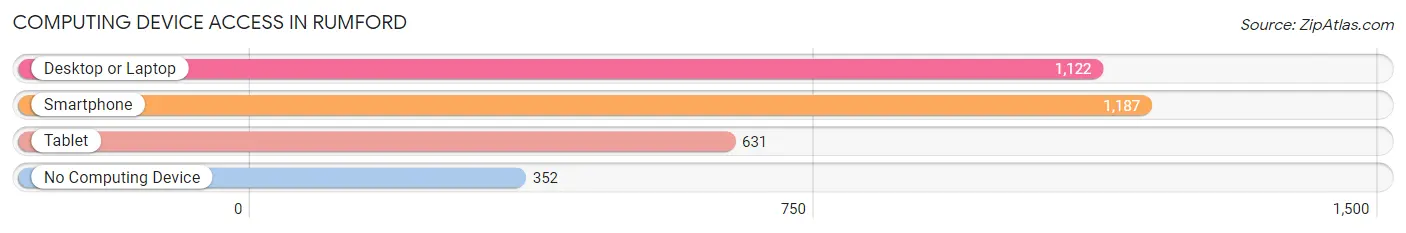
| Device Type | # Households | % Households |
| Desktop or Laptop | 1,122 | 61.7% |
| Smartphone | 1,187 | 65.2% |
| Tablet | 631 | 34.7% |
| No Computing Device | 352 | 19.3% |
| Total | 1,820 | 100.0% |
Internet Access in Rumford
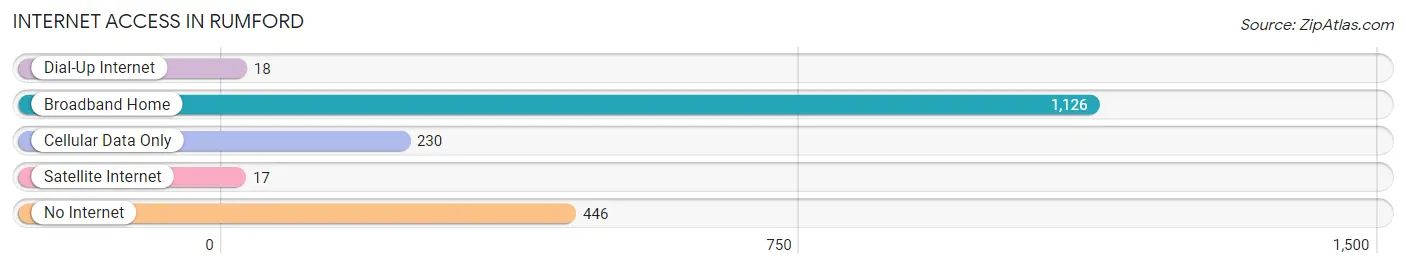
| Internet Type | # Households | % Households |
| Dial-Up Internet | 18 | 1.0% |
| Broadband Home | 1,126 | 61.9% |
| Cellular Data Only | 230 | 12.6% |
| Satellite Internet | 17 | 0.9% |
| No Internet | 446 | 24.5% |
| Total | 1,820 | 100.0% |
Rumford Summary
History
The town of Rumford, Maine is located in Oxford County and is situated on the Androscoggin River. It was first settled in 1779 by a group of settlers from Rumford, Rhode Island. The town was incorporated in 1796 and was named after Sir Benjamin Thompson, Count Rumford, a British scientist and statesman.
The town of Rumford was an important industrial center in the 19th century. It was home to several paper mills, including the Oxford Paper Company, which was founded in 1854. The paper mill was the largest employer in the town and provided jobs for many of the town’s residents. The town also had several other industries, including a woolen mill, a grist mill, a sawmill, and a tannery.
In the late 19th century, the town of Rumford was a popular tourist destination. It was home to several resorts, including the Rumford House, which was built in 1876. The resort was a popular destination for wealthy tourists from Boston and New York.
The town of Rumford was also home to several notable people, including the poet Henry Wadsworth Longfellow, who was born in the town in 1807. The town was also the birthplace of the inventor of the telephone, Alexander Graham Bell, who was born in 1847.
Geography
The town of Rumford is located in the western part of Oxford County, in the state of Maine. It is situated on the Androscoggin River, which is a tributary of the Kennebec River. The town is bordered by the towns of Mexico, Peru, and Dixfield to the north, and by the towns of Bethel and Newry to the south.
The town of Rumford has a total area of 24.2 square miles, of which 23.7 square miles is land and 0.5 square miles is water. The town is located in a hilly region of the state, with elevations ranging from 500 to 1,000 feet above sea level. The highest point in the town is the summit of Rumford Hill, which has an elevation of 1,000 feet.
The town of Rumford has a humid continental climate, with cold winters and warm summers. The average annual temperature is 41 degrees Fahrenheit, and the average annual precipitation is 40 inches.
Economy
The economy of the town of Rumford is largely based on the paper industry. The Oxford Paper Company is the largest employer in the town, and it produces paper products for the printing and publishing industries. The company also produces specialty papers for the medical and pharmaceutical industries.
The town of Rumford also has several other industries, including a sawmill, a grist mill, and a tannery. The town is also home to several retail stores, restaurants, and other businesses.
Demographics
As of the 2010 census, the town of Rumford had a population of 6,818 people. The racial makeup of the town was 97.3% White, 0.7% African American, 0.3% Native American, 0.3% Asian, 0.1% Pacific Islander, 0.2% from other races, and 1.2% from two or more races. Hispanic or Latino of any race were 1.2% of the population.
The median household income in the town was $37,917, and the median family income was $45,938. The per capita income in the town was $20,845. About 16.2% of the population was below the poverty line.
Common Questions
What is Per Capita Income in Rumford?
Per Capita income in Rumford is $25,958.
What is the Median Family Income in Rumford?
Median Family Income in Rumford is $59,341.
What is the Median Household income in Rumford?
Median Household Income in Rumford is $35,818.
What is Income or Wage Gap in Rumford?
Income or Wage Gap in Rumford is 39.0%.
Women in Rumford earn 61.0 cents for every dollar earned by a man.
What is Inequality or Gini Index in Rumford?
Inequality or Gini Index in Rumford is 0.48.
What is the Total Population of Rumford?
Total Population of Rumford is 3,922.
What is the Total Male Population of Rumford?
Total Male Population of Rumford is 2,023.
What is the Total Female Population of Rumford?
Total Female Population of Rumford is 1,899.
What is the Ratio of Males per 100 Females in Rumford?
There are 106.53 Males per 100 Females in Rumford.
What is the Ratio of Females per 100 Males in Rumford?
There are 93.87 Females per 100 Males in Rumford.
What is the Median Population Age in Rumford?
Median Population Age in Rumford is 53.2 Years.
What is the Average Family Size in Rumford
Average Family Size in Rumford is 3.1 People.
What is the Average Household Size in Rumford
Average Household Size in Rumford is 2.1 People.
How Large is the Labor Force in Rumford?
There are 1,623 People in the Labor Forcein in Rumford.
What is the Percentage of People in the Labor Force in Rumford?
45.6% of People are in the Labor Force in Rumford.
What is the Unemployment Rate in Rumford?
Unemployment Rate in Rumford is 6.7%.