Greenville, ME Map & Demographics
Greenville Map
Greenville Overview
$32,207
PER CAPITA INCOME
$59,239
AVG FAMILY INCOME
$53,068
AVG HOUSEHOLD INCOME
3.3%
WAGE / INCOME GAP [ % ]
96.7¢/ $1
WAGE / INCOME GAP [ $ ]
0.41
INEQUALITY / GINI INDEX
972
TOTAL POPULATION
535
MALE POPULATION
437
FEMALE POPULATION
122.43
MALES / 100 FEMALES
81.68
FEMALES / 100 MALES
59.9
MEDIAN AGE
2.8
AVG FAMILY SIZE
2.2
AVG HOUSEHOLD SIZE
589
LABOR FORCE [ PEOPLE ]
68.9%
PERCENT IN LABOR FORCE
4.8%
UNEMPLOYMENT RATE
Greenville Zip Codes
Greenville Area Codes
Income in Greenville
Income Overview in Greenville
Per Capita Income in Greenville is $32,207, while median incomes of families and households are $59,239 and $53,068 respectively.
| Characteristic | Number | Measure |
| Per Capita Income | 972 | $32,207 |
| Median Family Income | 248 | $59,239 |
| Mean Family Income | 248 | $84,444 |
| Median Household Income | 427 | $53,068 |
| Mean Household Income | 427 | $67,142 |
| Income Deficit | 248 | $0 |
| Wage / Income Gap (%) | 972 | 3.33% |
| Wage / Income Gap ($) | 972 | 96.67¢ per $1 |
| Gini / Inequality Index | 972 | 0.41 |
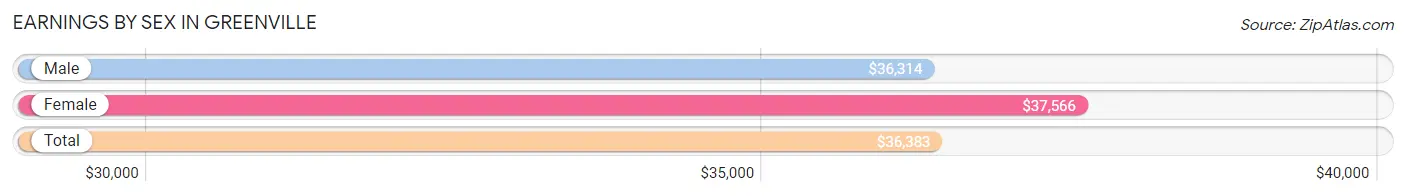
Earnings by Sex in Greenville
Average Earnings in Greenville are $36,383, $36,314 for men and $37,566 for women, a difference of 3.3%.
| Sex | Number | Average Earnings |
| Male | 347 (58.6%) | $36,314 |
| Female | 245 (41.4%) | $37,566 |
| Total | 592 (100.0%) | $36,383 |
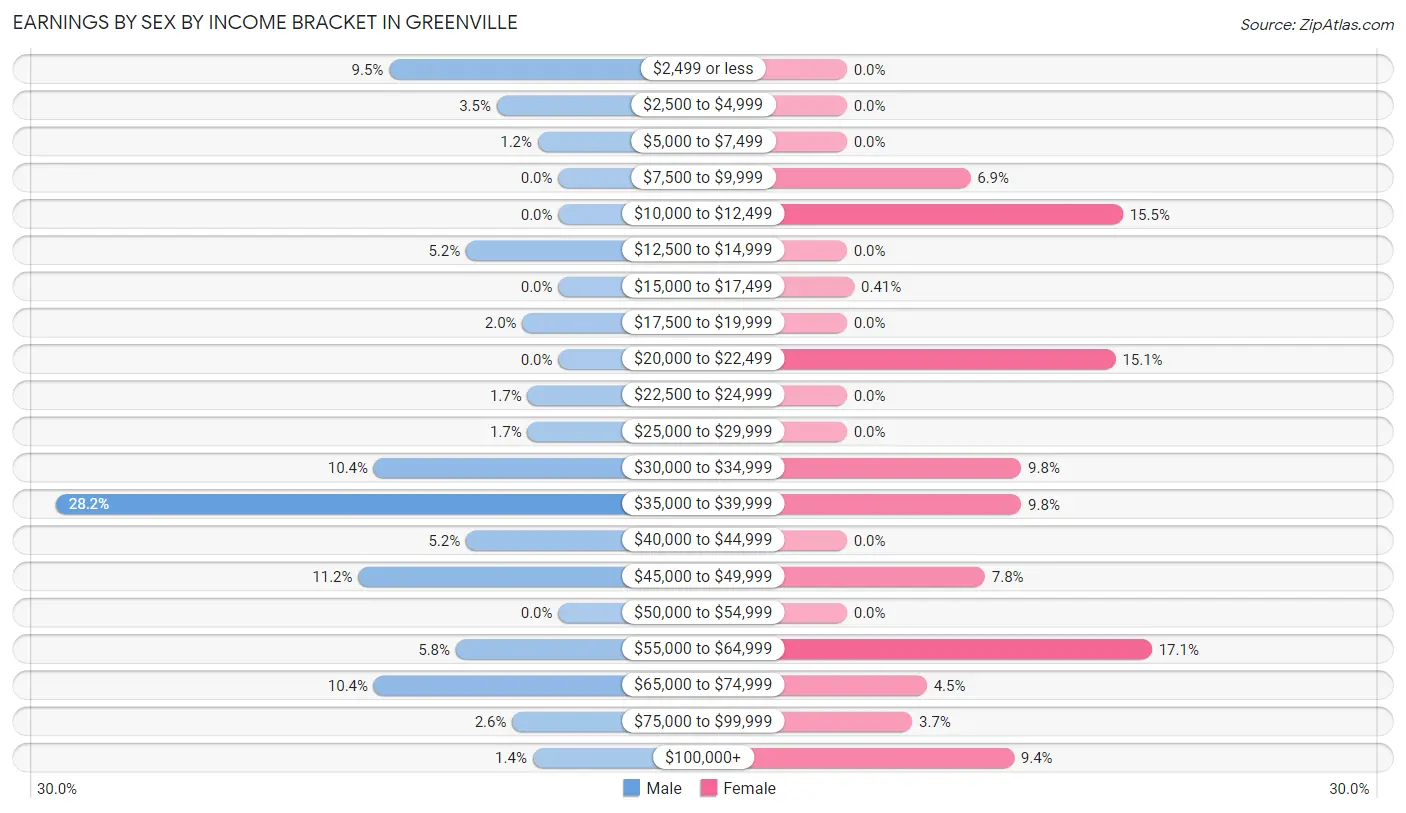
Earnings by Sex by Income Bracket in Greenville
The most common earnings brackets in Greenville are $35,000 to $39,999 for men (98 | 28.2%) and $55,000 to $64,999 for women (42 | 17.1%).
| Income | Male | Female |
| $2,499 or less | 33 (9.5%) | 0 (0.0%) |
| $2,500 to $4,999 | 12 (3.5%) | 0 (0.0%) |
| $5,000 to $7,499 | 4 (1.1%) | 0 (0.0%) |
| $7,500 to $9,999 | 0 (0.0%) | 17 (6.9%) |
| $10,000 to $12,499 | 0 (0.0%) | 38 (15.5%) |
| $12,500 to $14,999 | 18 (5.2%) | 0 (0.0%) |
| $15,000 to $17,499 | 0 (0.0%) | 1 (0.4%) |
| $17,500 to $19,999 | 7 (2.0%) | 0 (0.0%) |
| $20,000 to $22,499 | 0 (0.0%) | 37 (15.1%) |
| $22,500 to $24,999 | 6 (1.7%) | 0 (0.0%) |
| $25,000 to $29,999 | 6 (1.7%) | 0 (0.0%) |
| $30,000 to $34,999 | 36 (10.4%) | 24 (9.8%) |
| $35,000 to $39,999 | 98 (28.2%) | 24 (9.8%) |
| $40,000 to $44,999 | 18 (5.2%) | 0 (0.0%) |
| $45,000 to $49,999 | 39 (11.2%) | 19 (7.8%) |
| $50,000 to $54,999 | 0 (0.0%) | 0 (0.0%) |
| $55,000 to $64,999 | 20 (5.8%) | 42 (17.1%) |
| $65,000 to $74,999 | 36 (10.4%) | 11 (4.5%) |
| $75,000 to $99,999 | 9 (2.6%) | 9 (3.7%) |
| $100,000+ | 5 (1.4%) | 23 (9.4%) |
| Total | 347 (100.0%) | 245 (100.0%) |
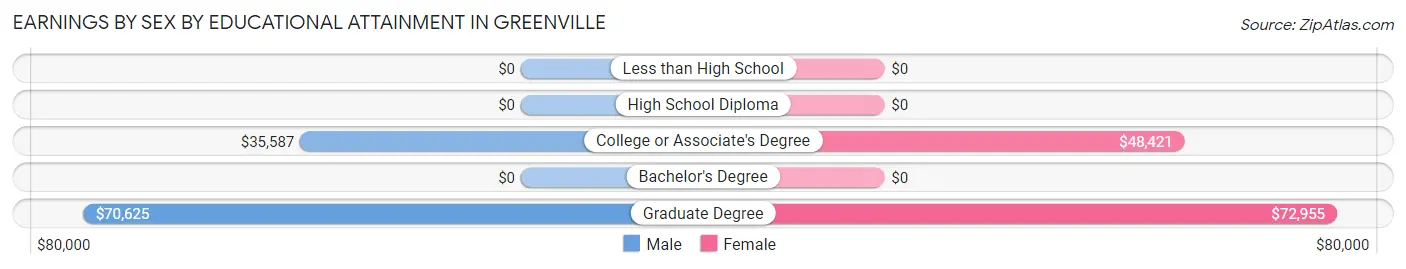
Earnings by Sex by Educational Attainment in Greenville
Average earnings in Greenville are $36,467 for men and $37,250 for women, a difference of 2.1%. Men with an educational attainment of graduate degree enjoy the highest average annual earnings of $70,625, while those with college or associate's degree education earn the least with $35,587. Women with an educational attainment of graduate degree earn the most with the average annual earnings of $72,955, while those with college or associate's degree education have the smallest earnings of $48,421.
| Educational Attainment | Male Income | Female Income |
| Less than High School | - | - |
| High School Diploma | - | - |
| College or Associate's Degree | $35,587 | $48,421 |
| Bachelor's Degree | - | - |
| Graduate Degree | $70,625 | $72,955 |
| Total | $36,467 | $37,250 |
Family Income in Greenville
Family Income Brackets in Greenville
According to the Greenville family income data, there are 73 families falling into the $50,000 to $74,999 income range, which is the most common income bracket and makes up 29.4% of all families.
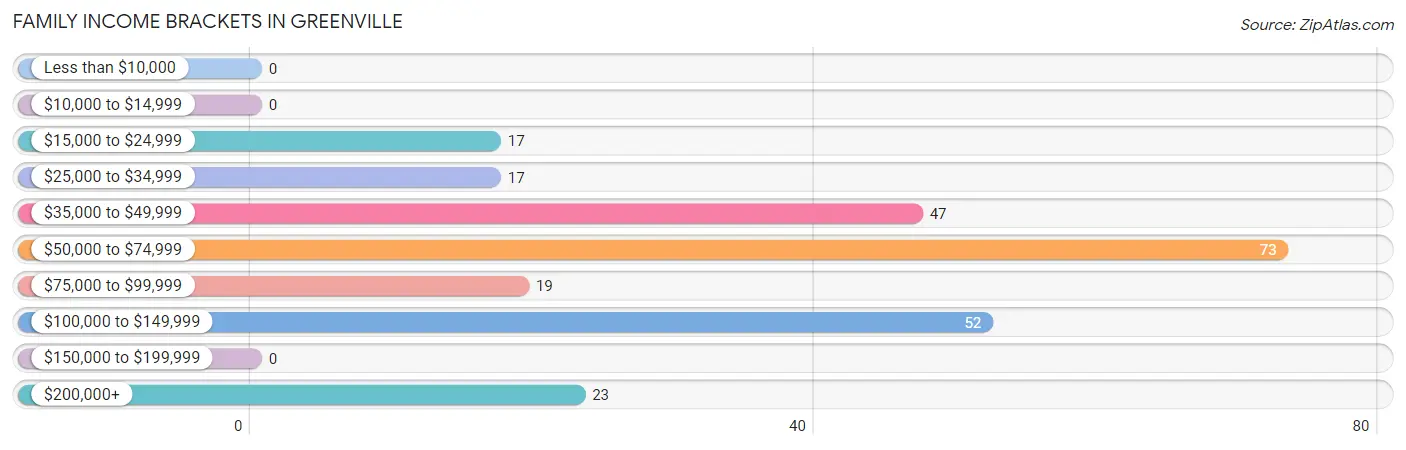
| Income Bracket | # Families | % Families |
| Less than $10,000 | 0 | 0.0% |
| $10,000 to $14,999 | 0 | 0.0% |
| $15,000 to $24,999 | 17 | 6.9% |
| $25,000 to $34,999 | 17 | 6.9% |
| $35,000 to $49,999 | 47 | 19.0% |
| $50,000 to $74,999 | 73 | 29.4% |
| $75,000 to $99,999 | 19 | 7.7% |
| $100,000 to $149,999 | 52 | 21.0% |
| $150,000 to $199,999 | 0 | 0.0% |
| $200,000+ | 23 | 9.3% |
Family Income by Famaliy Size in Greenville
2-person families (170 | 68.5%) account for the highest median family income in Greenville with $59,022 per family, while 2-person families (170 | 68.5%) have the highest median income of $29,511 per family member.
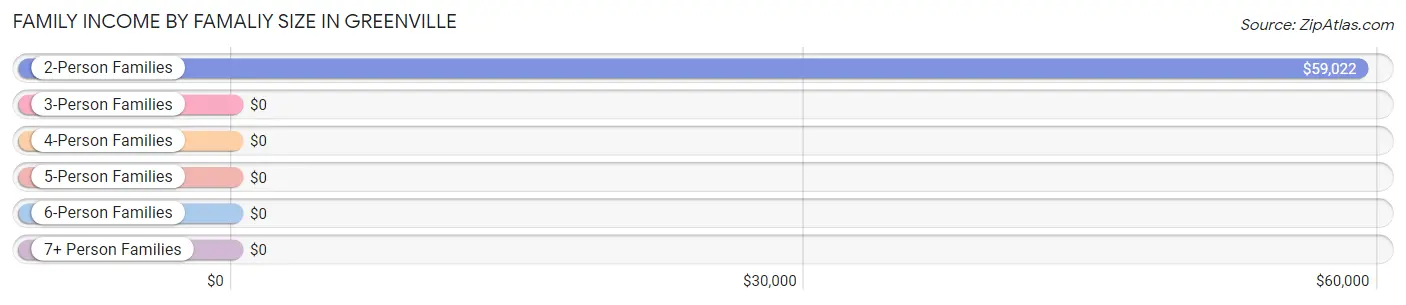
| Income Bracket | # Families | Median Income |
| 2-Person Families | 170 (68.5%) | $59,022 |
| 3-Person Families | 28 (11.3%) | $0 |
| 4-Person Families | 26 (10.5%) | $0 |
| 5-Person Families | 0 (0.0%) | $0 |
| 6-Person Families | 0 (0.0%) | $0 |
| 7+ Person Families | 24 (9.7%) | $0 |
| Total | 248 (100.0%) | $59,239 |
Family Income by Number of Earners in Greenville
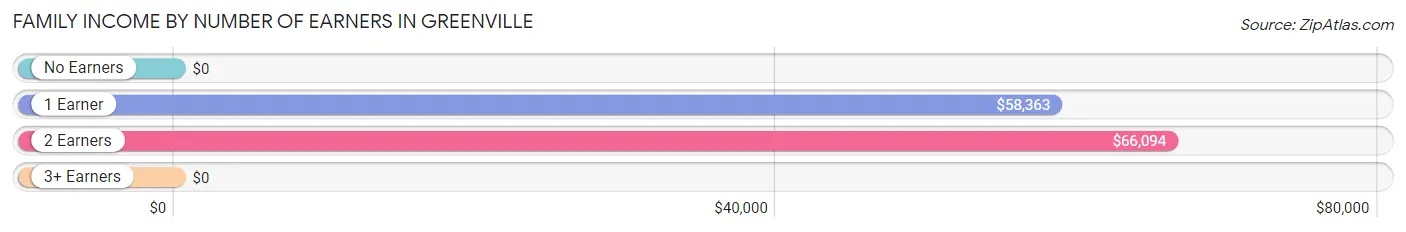
| Number of Earners | # Families | Median Income |
| No Earners | 27 (10.9%) | $0 |
| 1 Earner | 73 (29.4%) | $58,363 |
| 2 Earners | 122 (49.2%) | $66,094 |
| 3+ Earners | 26 (10.5%) | $0 |
| Total | 248 (100.0%) | $59,239 |
Household Income in Greenville
Household Income Brackets in Greenville
With 99 households falling in the category, the $50,000 to $74,999 income range is the most frequent in Greenville, accounting for 23.2% of all households.
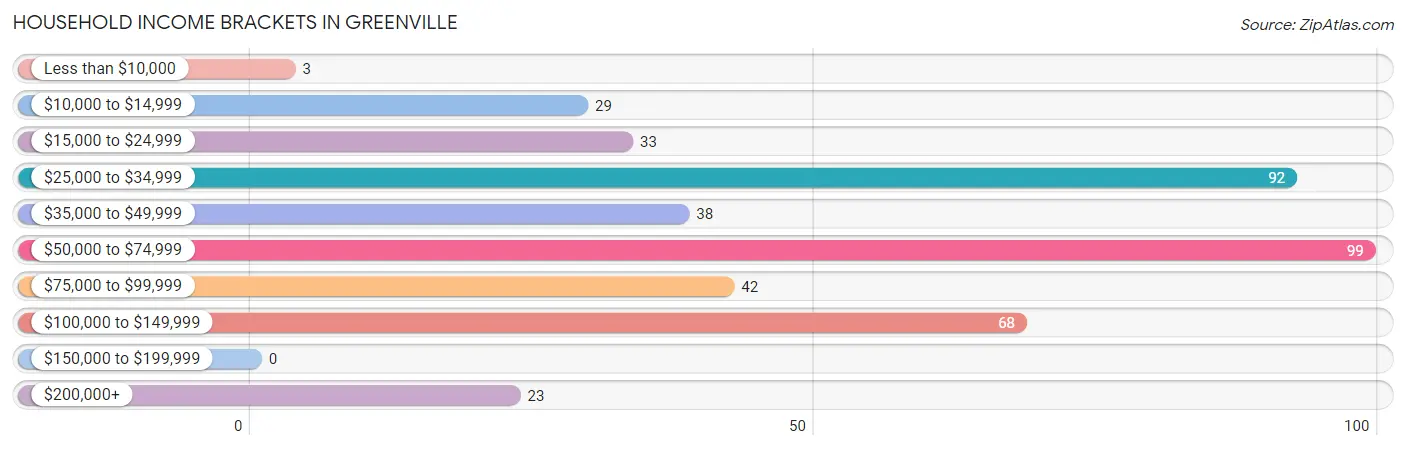
| Income Bracket | # Households | % Households |
| Less than $10,000 | 3 | 0.7% |
| $10,000 to $14,999 | 29 | 6.8% |
| $15,000 to $24,999 | 33 | 7.7% |
| $25,000 to $34,999 | 92 | 21.5% |
| $35,000 to $49,999 | 38 | 8.9% |
| $50,000 to $74,999 | 99 | 23.2% |
| $75,000 to $99,999 | 42 | 9.8% |
| $100,000 to $149,999 | 68 | 15.9% |
| $150,000 to $199,999 | 0 | 0.0% |
| $200,000+ | 23 | 5.4% |
Household Income by Householder Age in Greenville
The median household income in Greenville is $53,068, with the highest median household income of $52,188 found in the 65+ years age bracket for the primary householder. A total of 180 households (42.1%) fall into this category. Meanwhile, the 15 to 24 years age bracket for the primary householder has the lowest median household income of $0, with 8 households (1.9%) in this group.
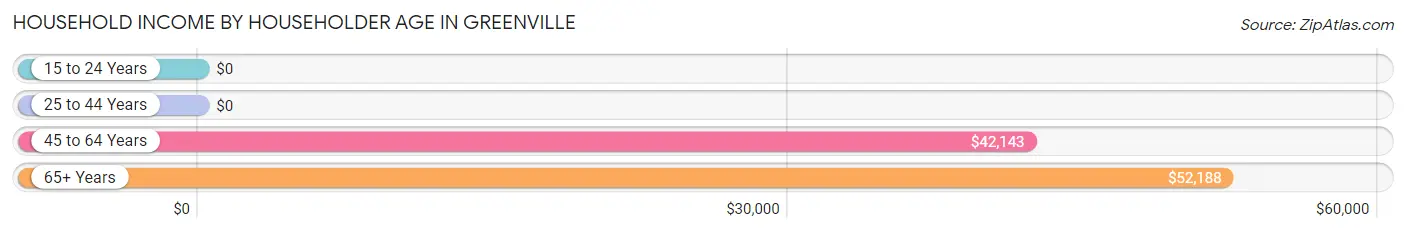
| Income Bracket | # Households | Median Income |
| 15 to 24 Years | 8 (1.9%) | $0 |
| 25 to 44 Years | 63 (14.7%) | $0 |
| 45 to 64 Years | 176 (41.2%) | $42,143 |
| 65+ Years | 180 (42.1%) | $52,188 |
| Total | 427 (100.0%) | $53,068 |
Poverty in Greenville
Income Below Poverty by Sex and Age in Greenville
With 3.6% poverty level for males and 6.0% for females among the residents of Greenville, 65 to 74 year old males and 18 to 24 year old females are the most vulnerable to poverty, with 19 males (23.2%) and 6 females (30.0%) in their respective age groups living below the poverty level.
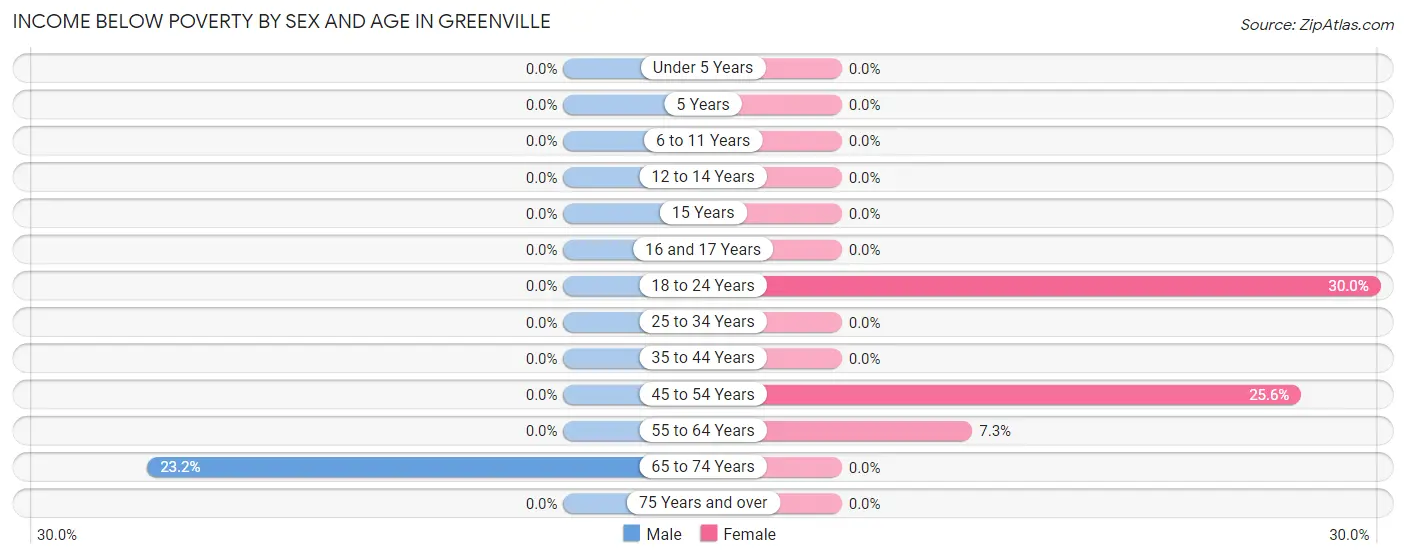
| Age Bracket | Male | Female |
| Under 5 Years | 0 (0.0%) | 0 (0.0%) |
| 5 Years | 0 (0.0%) | 0 (0.0%) |
| 6 to 11 Years | 0 (0.0%) | 0 (0.0%) |
| 12 to 14 Years | 0 (0.0%) | 0 (0.0%) |
| 15 Years | 0 (0.0%) | 0 (0.0%) |
| 16 and 17 Years | 0 (0.0%) | 0 (0.0%) |
| 18 to 24 Years | 0 (0.0%) | 6 (30.0%) |
| 25 to 34 Years | 0 (0.0%) | 0 (0.0%) |
| 35 to 44 Years | 0 (0.0%) | 0 (0.0%) |
| 45 to 54 Years | 0 (0.0%) | 11 (25.6%) |
| 55 to 64 Years | 0 (0.0%) | 8 (7.3%) |
| 65 to 74 Years | 19 (23.2%) | 0 (0.0%) |
| 75 Years and over | 0 (0.0%) | 0 (0.0%) |
| Total | 19 (3.6%) | 25 (6.0%) |
Income Above Poverty by Sex and Age in Greenville
According to the poverty statistics in Greenville, males aged 6 to 11 years and females aged 5 years are the age groups that are most secure financially, with 100.0% of males and 100.0% of females in these age groups living above the poverty line.
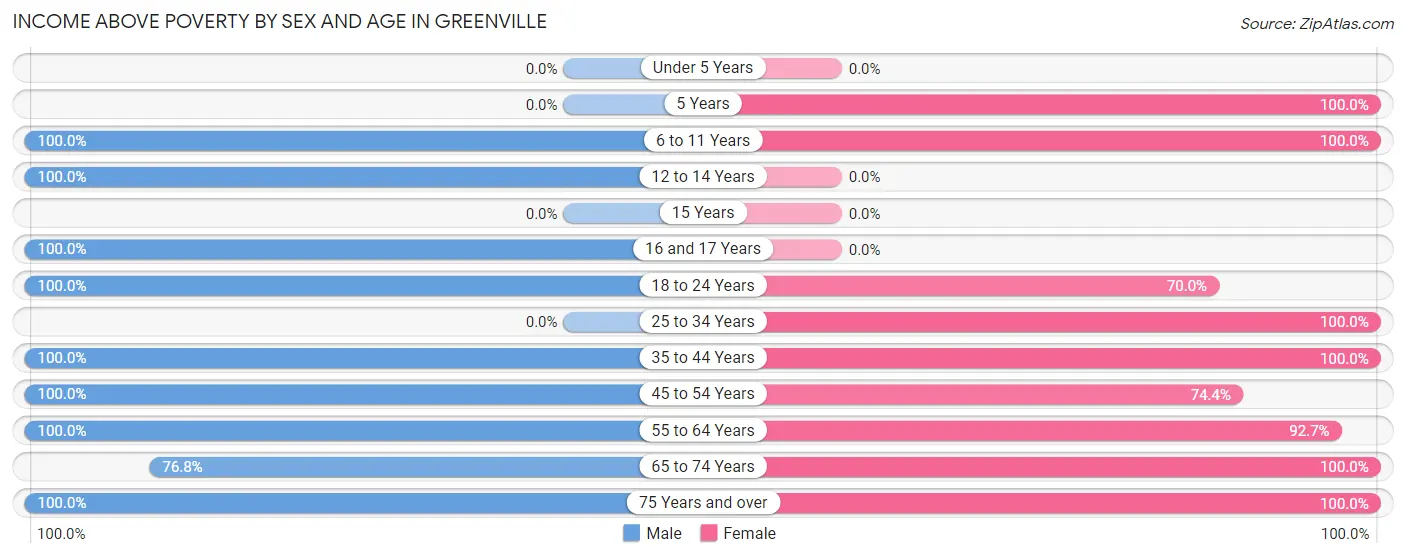
| Age Bracket | Male | Female |
| Under 5 Years | 0 (0.0%) | 0 (0.0%) |
| 5 Years | 0 (0.0%) | 33 (100.0%) |
| 6 to 11 Years | 16 (100.0%) | 32 (100.0%) |
| 12 to 14 Years | 36 (100.0%) | 0 (0.0%) |
| 15 Years | 0 (0.0%) | 0 (0.0%) |
| 16 and 17 Years | 20 (100.0%) | 0 (0.0%) |
| 18 to 24 Years | 12 (100.0%) | 14 (70.0%) |
| 25 to 34 Years | 0 (0.0%) | 42 (100.0%) |
| 35 to 44 Years | 42 (100.0%) | 41 (100.0%) |
| 45 to 54 Years | 50 (100.0%) | 32 (74.4%) |
| 55 to 64 Years | 230 (100.0%) | 102 (92.7%) |
| 65 to 74 Years | 63 (76.8%) | 38 (100.0%) |
| 75 Years and over | 37 (100.0%) | 60 (100.0%) |
| Total | 506 (96.4%) | 394 (94.0%) |
Income Below Poverty Among Married-Couple Families in Greenville
The poverty statistics for married-couple families in Greenville show that 3.1% or 5 of the total 162 families live below the poverty line. Families with no children have the highest poverty rate of 4.9%, comprising of 5 families. On the other hand, families with 1 or 2 children have the lowest poverty rate of 0.0%, which includes 0 families.
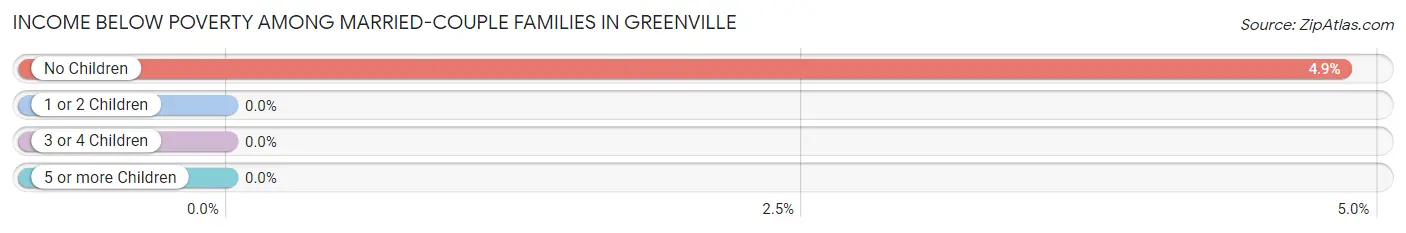
| Children | Above Poverty | Below Poverty |
| No Children | 98 (95.2%) | 5 (4.9%) |
| 1 or 2 Children | 35 (100.0%) | 0 (0.0%) |
| 3 or 4 Children | 0 (0.0%) | 0 (0.0%) |
| 5 or more Children | 24 (100.0%) | 0 (0.0%) |
| Total | 157 (96.9%) | 5 (3.1%) |
Income Below Poverty Among Single-Parent Households in Greenville
| Children | Single Father | Single Mother |
| No Children | 0 (0.0%) | 0 (0.0%) |
| 1 or 2 Children | 0 (0.0%) | 0 (0.0%) |
| 3 or 4 Children | 0 (0.0%) | 0 (0.0%) |
| 5 or more Children | 0 (0.0%) | 0 (0.0%) |
| Total | 0 (0.0%) | 0 (0.0%) |
Income Below Poverty Among Married-Couple vs Single-Parent Households in Greenville
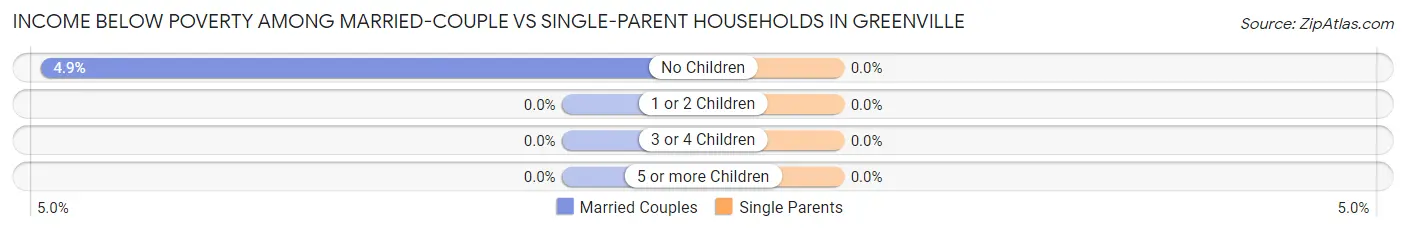
| Children | Married-Couple Families | Single-Parent Households |
| No Children | 5 (4.9%) | 0 (0.0%) |
| 1 or 2 Children | 0 (0.0%) | 0 (0.0%) |
| 3 or 4 Children | 0 (0.0%) | 0 (0.0%) |
| 5 or more Children | 0 (0.0%) | 0 (0.0%) |
| Total | 5 (3.1%) | 0 (0.0%) |
Race in Greenville
The most populous races in Greenville are White / Caucasian (941 | 96.8%), Two or more Races (29 | 3.0%), and Black / African American (2 | 0.2%).
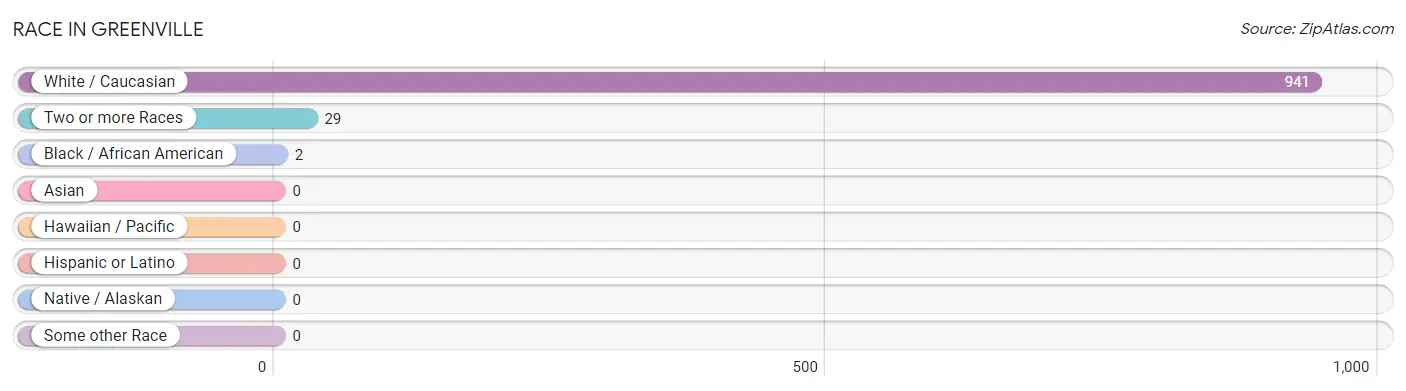
| Race | # Population | % Population |
| Asian | 0 | 0.0% |
| Black / African American | 2 | 0.2% |
| Hawaiian / Pacific | 0 | 0.0% |
| Hispanic or Latino | 0 | 0.0% |
| Native / Alaskan | 0 | 0.0% |
| White / Caucasian | 941 | 96.8% |
| Two or more Races | 29 | 3.0% |
| Some other Race | 0 | 0.0% |
| Total | 972 | 100.0% |
Ancestry in Greenville
The most populous ancestries reported in Greenville are Irish (204 | 21.0%), English (143 | 14.7%), American (95 | 9.8%), French (90 | 9.3%), and French Canadian (62 | 6.4%), together accounting for 61.1% of all Greenville residents.
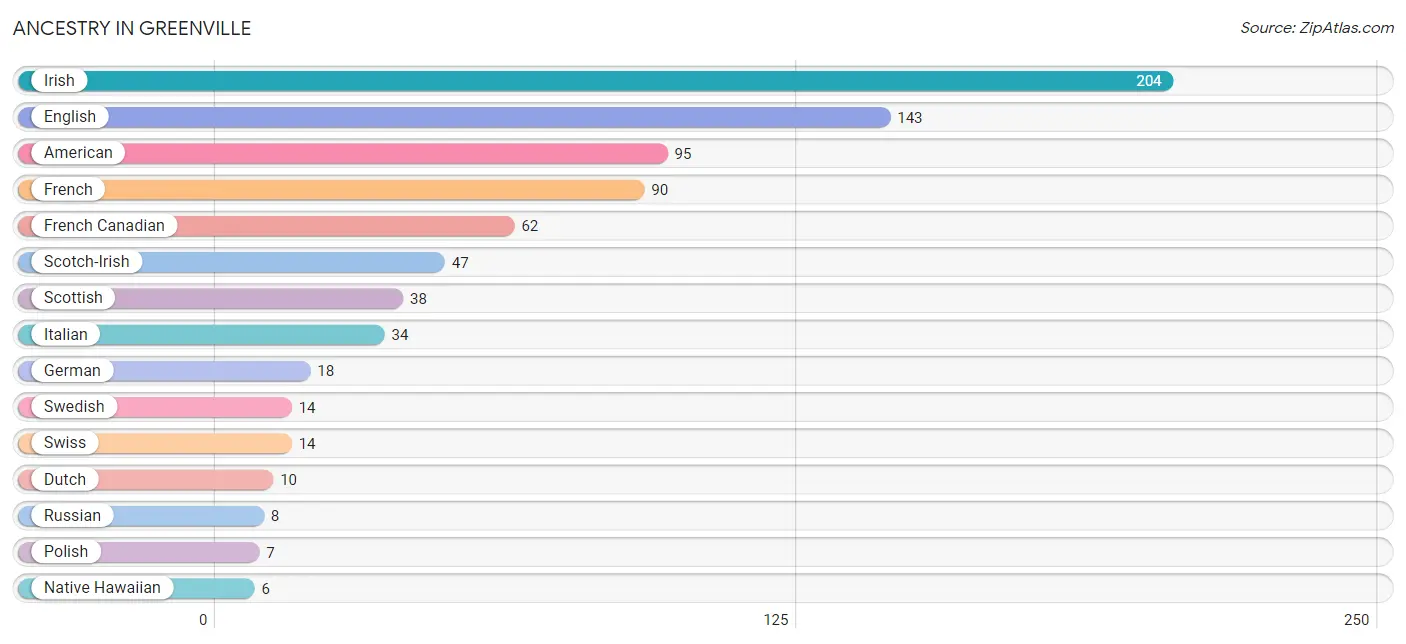
| Ancestry | # Population | % Population |
| American | 95 | 9.8% |
| British | 5 | 0.5% |
| Dutch | 10 | 1.0% |
| English | 143 | 14.7% |
| European | 1 | 0.1% |
| French | 90 | 9.3% |
| French Canadian | 62 | 6.4% |
| German | 18 | 1.8% |
| Indian (Asian) | 1 | 0.1% |
| Irish | 204 | 21.0% |
| Italian | 34 | 3.5% |
| Native Hawaiian | 6 | 0.6% |
| Polish | 7 | 0.7% |
| Russian | 8 | 0.8% |
| Scotch-Irish | 47 | 4.8% |
| Scottish | 38 | 3.9% |
| Swedish | 14 | 1.4% |
| Swiss | 14 | 1.4% | View All 18 Rows |
Immigrants in Greenville

| Immigration Origin | # Population | % Population | View All 0 Rows |
Sex and Age in Greenville
Sex and Age in Greenville
The most populous age groups in Greenville are 60 to 64 Years (199 | 37.2%) for men and 55 to 59 Years (67 | 15.3%) for women.
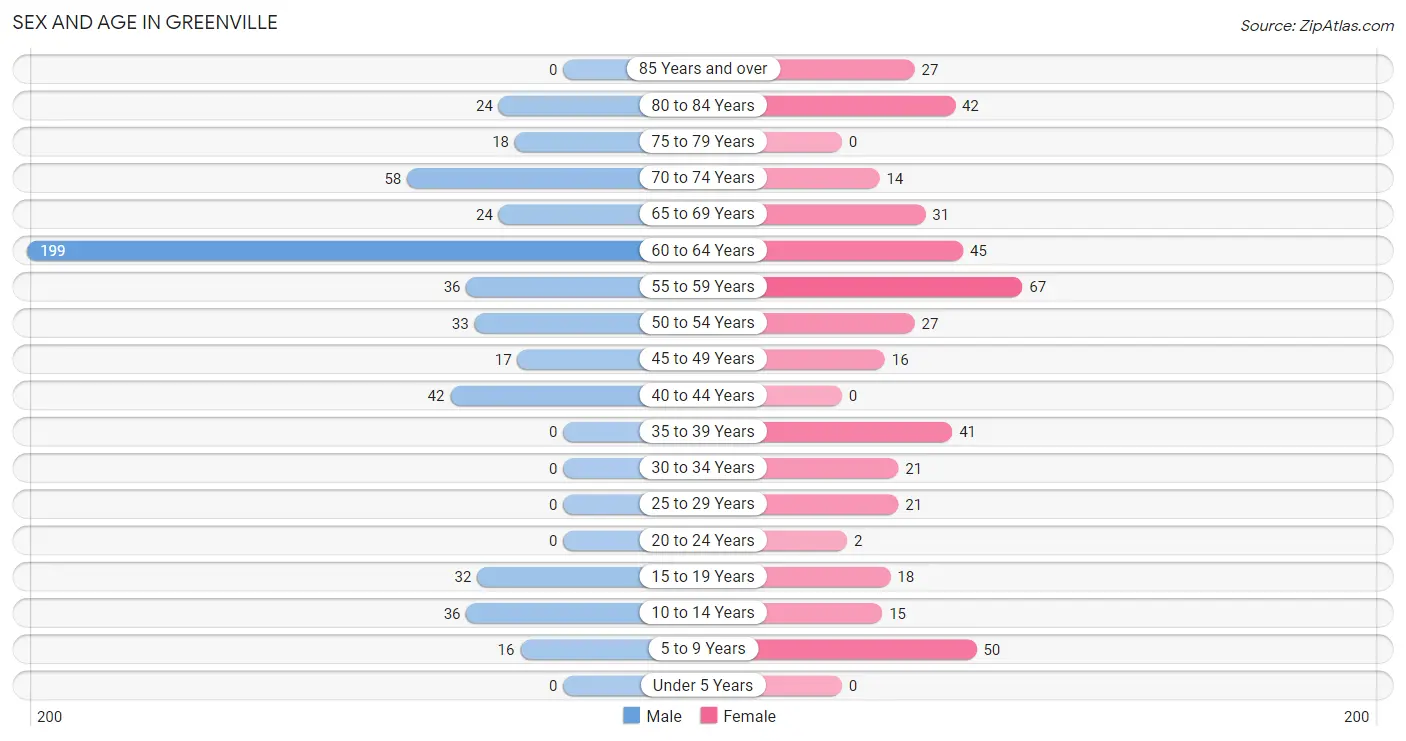
| Age Bracket | Male | Female |
| Under 5 Years | 0 (0.0%) | 0 (0.0%) |
| 5 to 9 Years | 16 (3.0%) | 50 (11.4%) |
| 10 to 14 Years | 36 (6.7%) | 15 (3.4%) |
| 15 to 19 Years | 32 (6.0%) | 18 (4.1%) |
| 20 to 24 Years | 0 (0.0%) | 2 (0.5%) |
| 25 to 29 Years | 0 (0.0%) | 21 (4.8%) |
| 30 to 34 Years | 0 (0.0%) | 21 (4.8%) |
| 35 to 39 Years | 0 (0.0%) | 41 (9.4%) |
| 40 to 44 Years | 42 (7.9%) | 0 (0.0%) |
| 45 to 49 Years | 17 (3.2%) | 16 (3.7%) |
| 50 to 54 Years | 33 (6.2%) | 27 (6.2%) |
| 55 to 59 Years | 36 (6.7%) | 67 (15.3%) |
| 60 to 64 Years | 199 (37.2%) | 45 (10.3%) |
| 65 to 69 Years | 24 (4.5%) | 31 (7.1%) |
| 70 to 74 Years | 58 (10.8%) | 14 (3.2%) |
| 75 to 79 Years | 18 (3.4%) | 0 (0.0%) |
| 80 to 84 Years | 24 (4.5%) | 42 (9.6%) |
| 85 Years and over | 0 (0.0%) | 27 (6.2%) |
| Total | 535 (100.0%) | 437 (100.0%) |
Families and Households in Greenville
Median Family Size in Greenville
The median family size in Greenville is 2.81 persons per family, with married-couple families (162 | 65.3%) accounting for the largest median family size of 2.93 persons per family. On the other hand, single male/father families (22 | 8.9%) represent the smallest median family size with 1.77 persons per family.
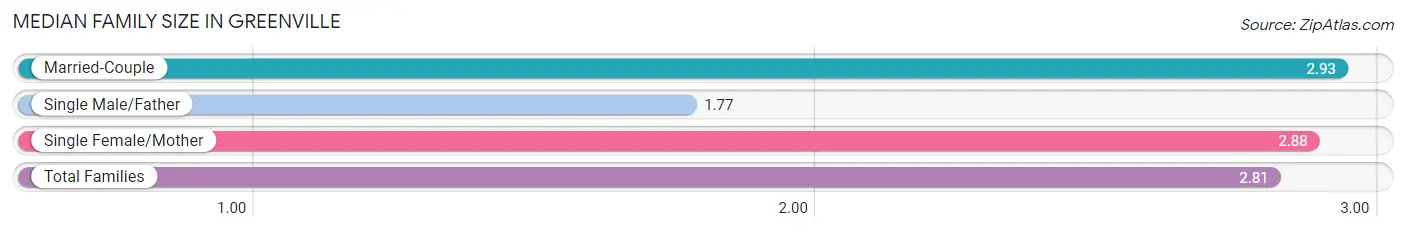
| Family Type | # Families | Family Size |
| Married-Couple | 162 (65.3%) | 2.93 |
| Single Male/Father | 22 (8.9%) | 1.77 |
| Single Female/Mother | 64 (25.8%) | 2.88 |
| Total Families | 248 (100.0%) | 2.81 |
Median Household Size in Greenville
The median household size in Greenville is 2.20 persons per household, with married-couple households (162 | 37.9%) accounting for the largest median household size of 2.93 persons per household. non-family households (179 | 41.9%) represent the smallest median household size with 1.29 persons per household.
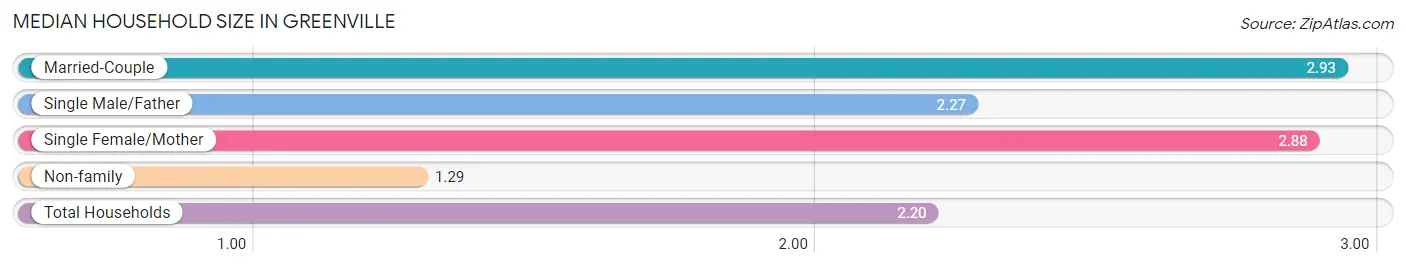
| Household Type | # Households | Household Size |
| Married-Couple | 162 (37.9%) | 2.93 |
| Single Male/Father | 22 (5.1%) | 2.27 |
| Single Female/Mother | 64 (15.0%) | 2.88 |
| Non-family | 179 (41.9%) | 1.29 |
| Total Households | 427 (100.0%) | 2.20 |
Household Size by Marriage Status in Greenville
Out of a total of 427 households in Greenville, 248 (58.1%) are family households, while 179 (41.9%) are nonfamily households. The most numerous type of family households are 2-person households, comprising 154, and the most common type of nonfamily households are 1-person households, comprising 150.
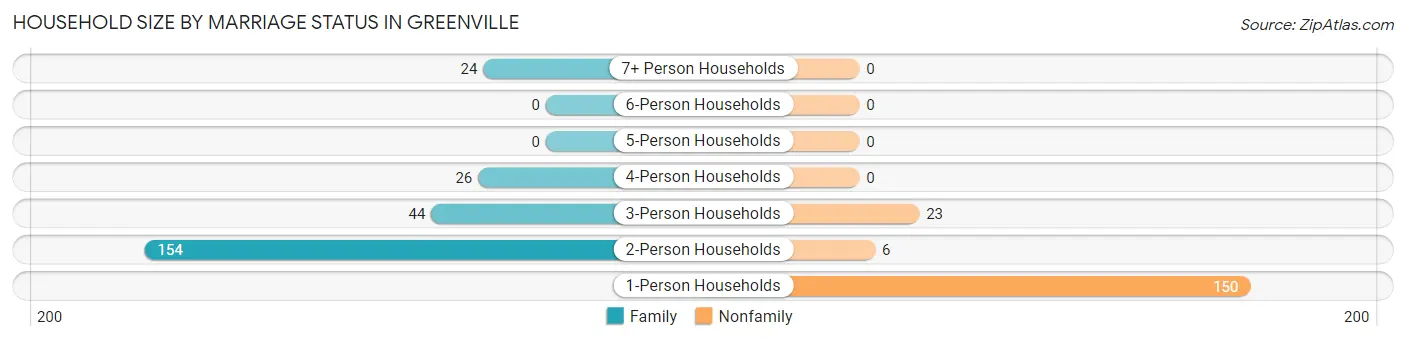
| Household Size | Family Households | Nonfamily Households |
| 1-Person Households | - | 150 (35.1%) |
| 2-Person Households | 154 (36.1%) | 6 (1.4%) |
| 3-Person Households | 44 (10.3%) | 23 (5.4%) |
| 4-Person Households | 26 (6.1%) | 0 (0.0%) |
| 5-Person Households | 0 (0.0%) | 0 (0.0%) |
| 6-Person Households | 0 (0.0%) | 0 (0.0%) |
| 7+ Person Households | 24 (5.6%) | 0 (0.0%) |
| Total | 248 (58.1%) | 179 (41.9%) |
Female Fertility in Greenville
Fertility by Age in Greenville
| Age Bracket | Women with Births | Births / 1,000 Women |
| 15 to 19 years | 0 (0.0%) | 0.0 |
| 20 to 34 years | 0 (0.0%) | 0.0 |
| 35 to 50 years | 0 (0.0%) | 0.0 |
| Total | 0 (0.0%) | 0.0 |
Fertility by Age by Marriage Status in Greenville
| Age Bracket | Married | Unmarried |
| 15 to 19 years | 0 (0.0%) | 0 (0.0%) |
| 20 to 34 years | 0 (0.0%) | 0 (0.0%) |
| 35 to 50 years | 0 (0.0%) | 0 (0.0%) |
| Total | 0 (0.0%) | 0 (0.0%) |
Fertility by Education in Greenville
| Educational Attainment | Women with Births | Births / 1,000 Women |
| Less than High School | 0 (0.0%) | 0.0 |
| High School Diploma | 0 (0.0%) | 0.0 |
| College or Associate's Degree | 0 (0.0%) | 0.0 |
| Bachelor's Degree | 0 (0.0%) | 0.0 |
| Graduate Degree | 0 (0.0%) | 0.0 |
| Total | 0 (0.0%) | 0.0 |
Fertility by Education by Marriage Status in Greenville
| Educational Attainment | Married | Unmarried |
| Less than High School | 0 (0.0%) | 0 (0.0%) |
| High School Diploma | 0 (0.0%) | 0 (0.0%) |
| College or Associate's Degree | 0 (0.0%) | 0 (0.0%) |
| Bachelor's Degree | 0 (0.0%) | 0 (0.0%) |
| Graduate Degree | 0 (0.0%) | 0 (0.0%) |
| Total | 0 (0.0%) | 0 (0.0%) |
Employment Characteristics in Greenville
Employment by Class of Employer in Greenville
Among the 561 employed individuals in Greenville, private company employees (346 | 61.7%), self-employed (not incorporated) (138 | 24.6%), and not-for-profit organizations (60 | 10.7%) make up the most common classes of employment.
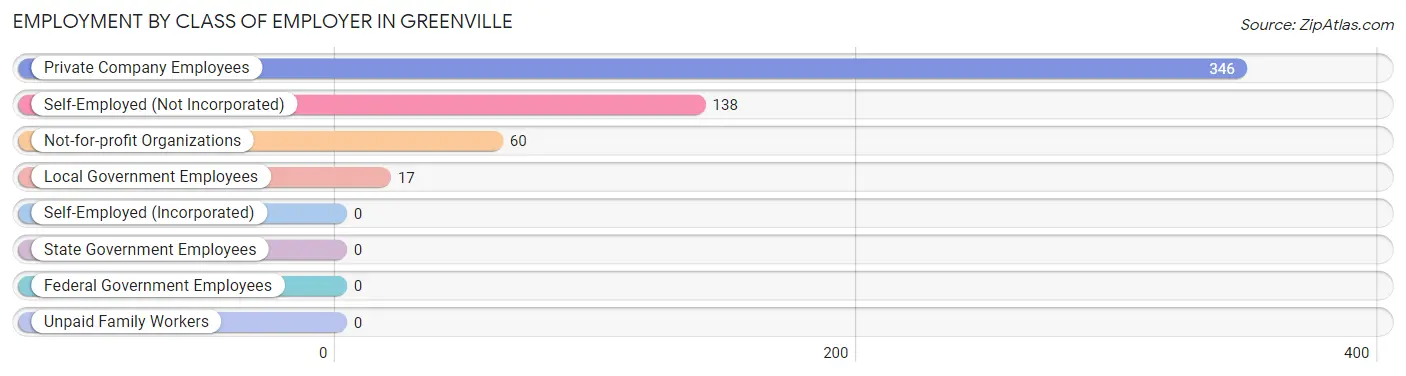
| Employer Class | # Employees | % Employees |
| Private Company Employees | 346 | 61.7% |
| Self-Employed (Incorporated) | 0 | 0.0% |
| Self-Employed (Not Incorporated) | 138 | 24.6% |
| Not-for-profit Organizations | 60 | 10.7% |
| Local Government Employees | 17 | 3.0% |
| State Government Employees | 0 | 0.0% |
| Federal Government Employees | 0 | 0.0% |
| Unpaid Family Workers | 0 | 0.0% |
| Total | 561 | 100.0% |
Employment Status by Age in Greenville
According to the labor force statistics for Greenville, out of the total population over 16 years of age (855), 68.9% or 589 individuals are in the labor force, with 4.8% or 28 of them unemployed. The age group with the highest labor force participation rate is 25 to 29 years, with 100.0% or 21 individuals in the labor force. Within the labor force, the 45 to 54 years age range has the highest percentage of unemployed individuals, with 20.7% or 17 of them being unemployed.
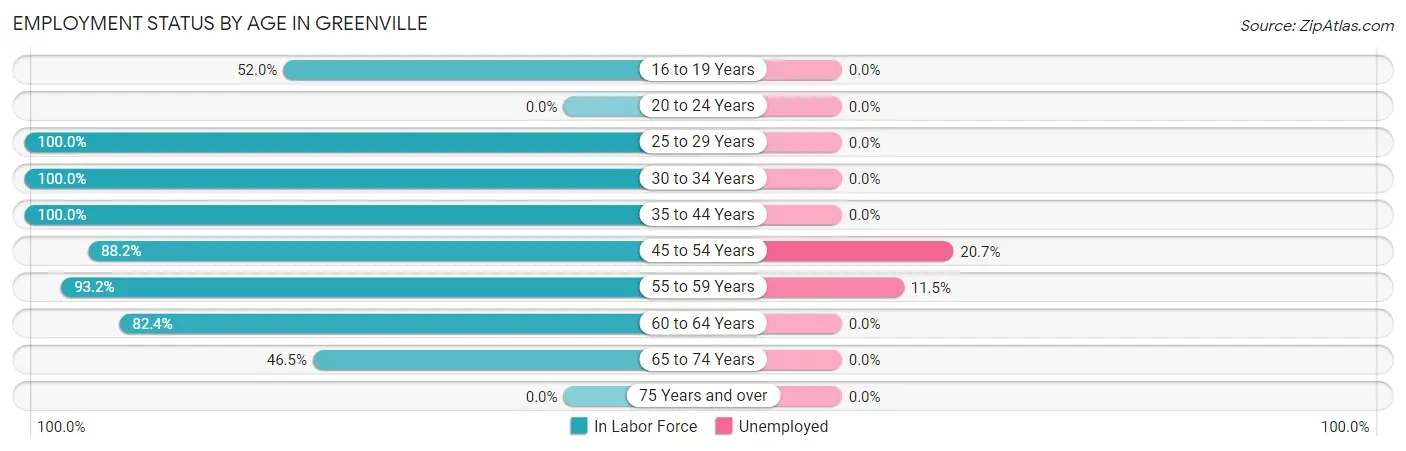
| Age Bracket | In Labor Force | Unemployed |
| 16 to 19 Years | 26 (52.0%) | 0 (0.0%) |
| 20 to 24 Years | 0 (0.0%) | 0 (0.0%) |
| 25 to 29 Years | 21 (100.0%) | 0 (0.0%) |
| 30 to 34 Years | 21 (100.0%) | 0 (0.0%) |
| 35 to 44 Years | 83 (100.0%) | 0 (0.0%) |
| 45 to 54 Years | 82 (88.2%) | 17 (20.7%) |
| 55 to 59 Years | 96 (93.2%) | 11 (11.5%) |
| 60 to 64 Years | 201 (82.4%) | 0 (0.0%) |
| 65 to 74 Years | 59 (46.5%) | 0 (0.0%) |
| 75 Years and over | 0 (0.0%) | 0 (0.0%) |
| Total | 589 (68.9%) | 28 (4.8%) |
Employment Status by Educational Attainment in Greenville
According to labor force statistics for Greenville, 89.2% of individuals (504) out of the total population between 25 and 64 years of age (565) are in the labor force, with 5.6% or 28 of them being unemployed. The group with the highest labor force participation rate are those with the educational attainment of college / associate degree, with 93.4% or 282 individuals in the labor force. Within the labor force, individuals with high school diploma education have the highest percentage of unemployment, with 13.4% or 11 of them being unemployed.
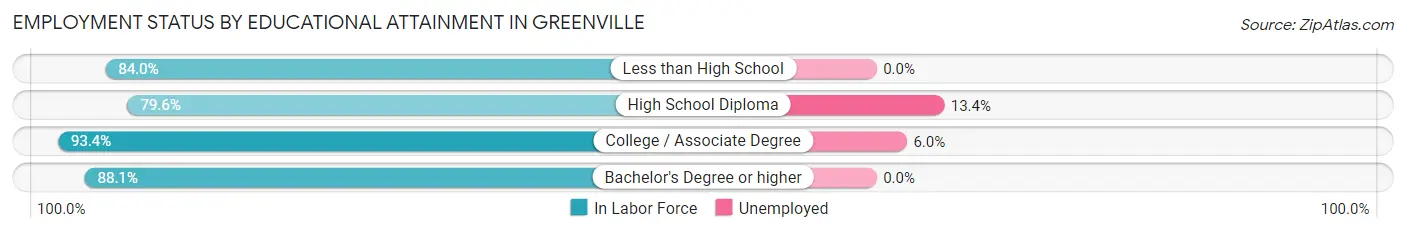
| Educational Attainment | In Labor Force | Unemployed |
| Less than High School | 21 (84.0%) | 0 (0.0%) |
| High School Diploma | 82 (79.6%) | 14 (13.4%) |
| College / Associate Degree | 282 (93.4%) | 18 (6.0%) |
| Bachelor's Degree or higher | 119 (88.1%) | 0 (0.0%) |
| Total | 504 (89.2%) | 32 (5.6%) |
Employment Occupations by Sex in Greenville
Management, Business, Science and Arts Occupations
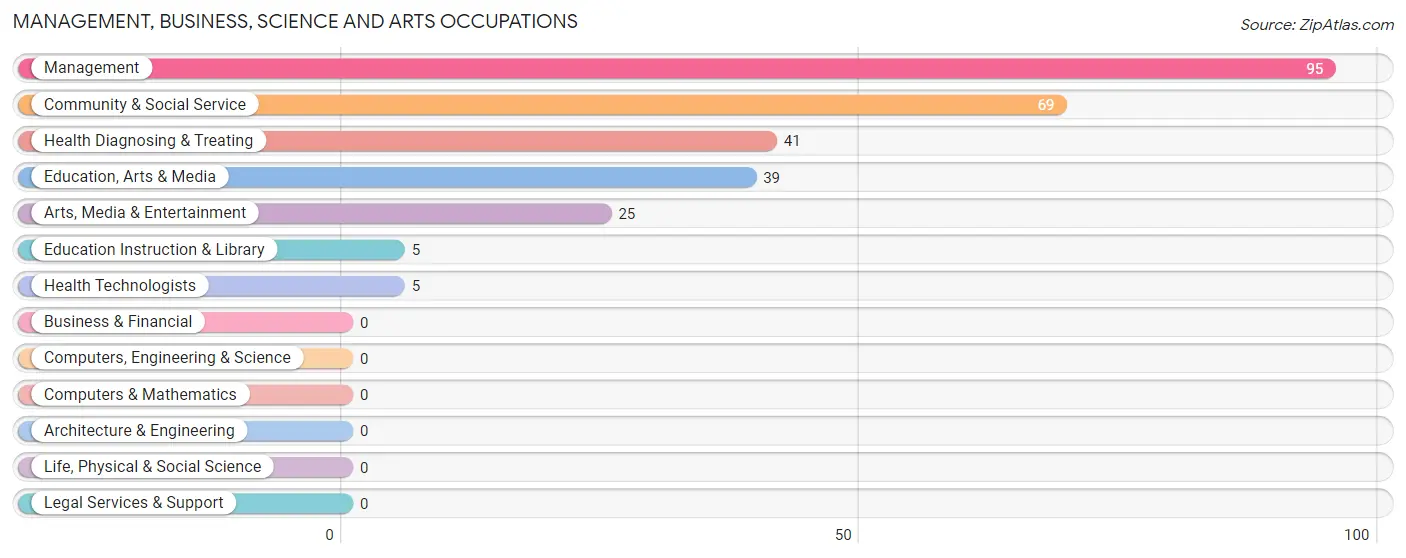
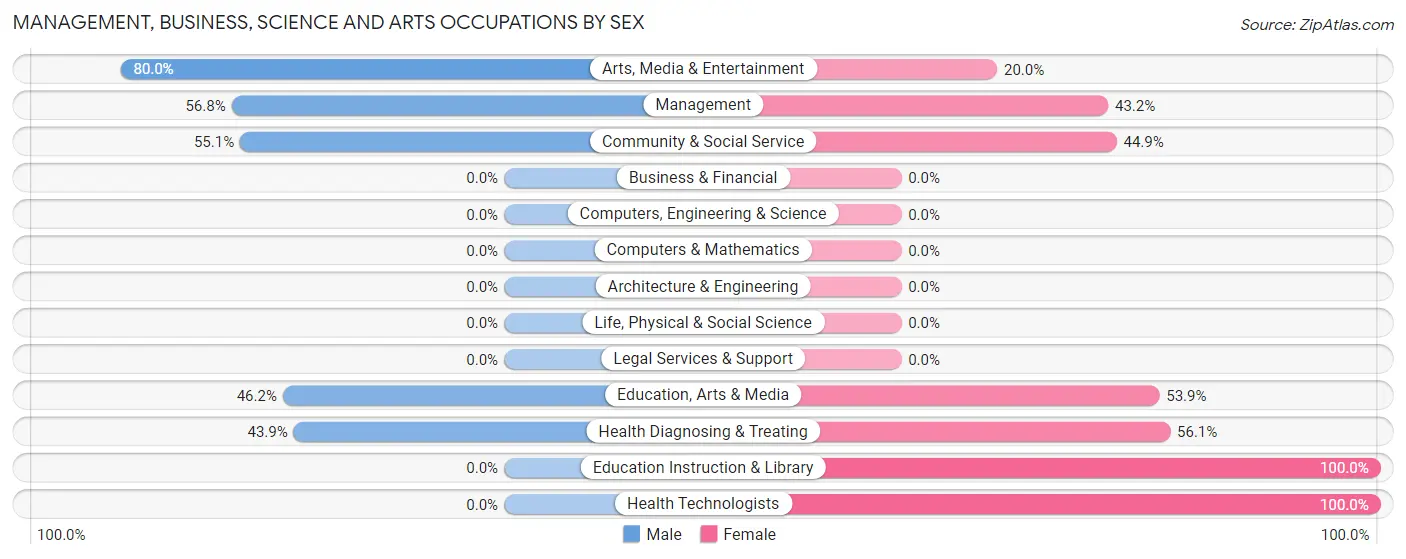
The most common Management, Business, Science and Arts occupations in Greenville are Management (95 | 16.9%), Community & Social Service (69 | 12.3%), Health Diagnosing & Treating (41 | 7.3%), Education, Arts & Media (39 | 7.0%), and Arts, Media & Entertainment (25 | 4.5%).
Management, Business, Science and Arts Occupations by Sex
Within the Management, Business, Science and Arts occupations in Greenville, the most male-oriented occupations are Arts, Media & Entertainment (80.0%), Management (56.8%), and Community & Social Service (55.1%), while the most female-oriented occupations are Education Instruction & Library (100.0%), Health Technologists (100.0%), and Health Diagnosing & Treating (56.1%).
| Occupation | Male | Female |
| Management | 54 (56.8%) | 41 (43.2%) |
| Business & Financial | 0 (0.0%) | 0 (0.0%) |
| Computers, Engineering & Science | 0 (0.0%) | 0 (0.0%) |
| Computers & Mathematics | 0 (0.0%) | 0 (0.0%) |
| Architecture & Engineering | 0 (0.0%) | 0 (0.0%) |
| Life, Physical & Social Science | 0 (0.0%) | 0 (0.0%) |
| Community & Social Service | 38 (55.1%) | 31 (44.9%) |
| Education, Arts & Media | 18 (46.2%) | 21 (53.8%) |
| Legal Services & Support | 0 (0.0%) | 0 (0.0%) |
| Education Instruction & Library | 0 (0.0%) | 5 (100.0%) |
| Arts, Media & Entertainment | 20 (80.0%) | 5 (20.0%) |
| Health Diagnosing & Treating | 18 (43.9%) | 23 (56.1%) |
| Health Technologists | 0 (0.0%) | 5 (100.0%) |
| Total (Category) | 110 (53.7%) | 95 (46.3%) |
| Total (Overall) | 343 (61.1%) | 218 (38.9%) |
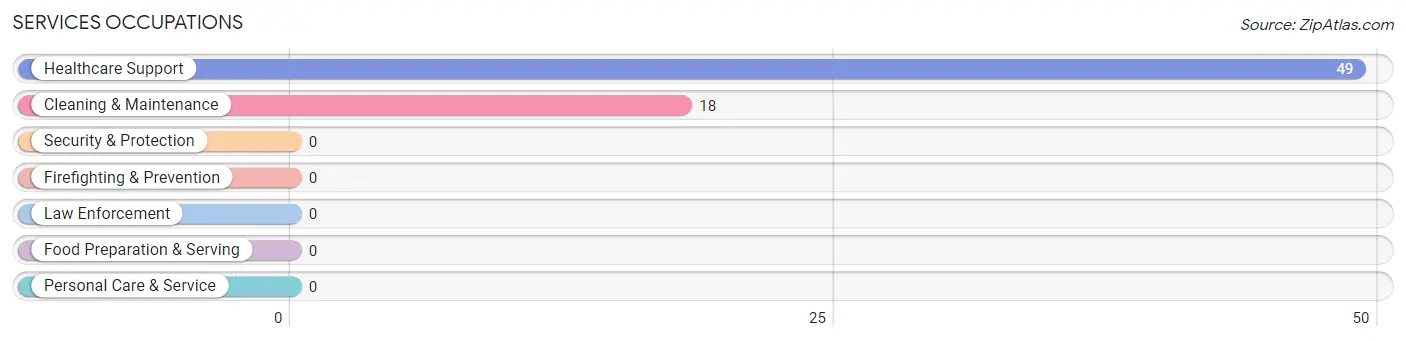
Services Occupations
The most common Services occupations in Greenville are Healthcare Support (49 | 8.7%), and Cleaning & Maintenance (18 | 3.2%).
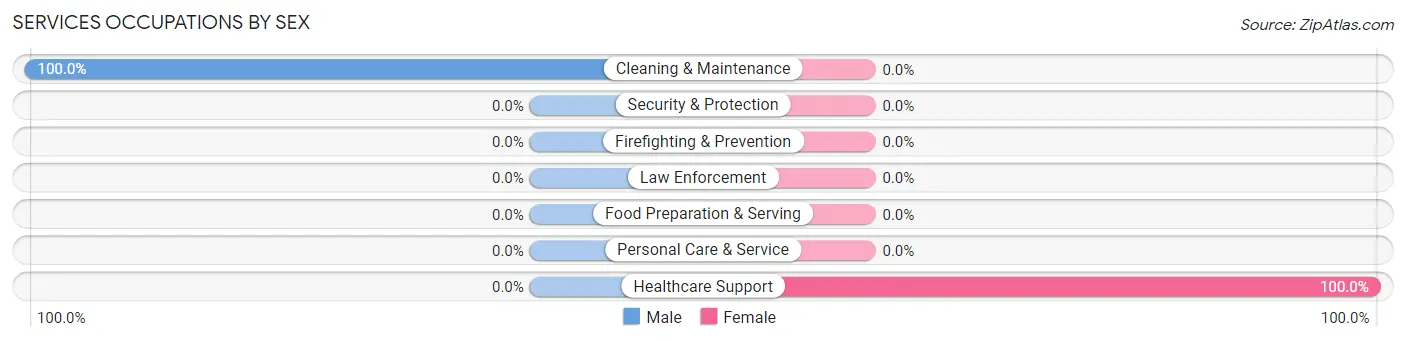
Services Occupations by Sex
| Occupation | Male | Female |
| Healthcare Support | 0 (0.0%) | 49 (100.0%) |
| Security & Protection | 0 (0.0%) | 0 (0.0%) |
| Firefighting & Prevention | 0 (0.0%) | 0 (0.0%) |
| Law Enforcement | 0 (0.0%) | 0 (0.0%) |
| Food Preparation & Serving | 0 (0.0%) | 0 (0.0%) |
| Cleaning & Maintenance | 18 (100.0%) | 0 (0.0%) |
| Personal Care & Service | 0 (0.0%) | 0 (0.0%) |
| Total (Category) | 18 (26.9%) | 49 (73.1%) |
| Total (Overall) | 343 (61.1%) | 218 (38.9%) |
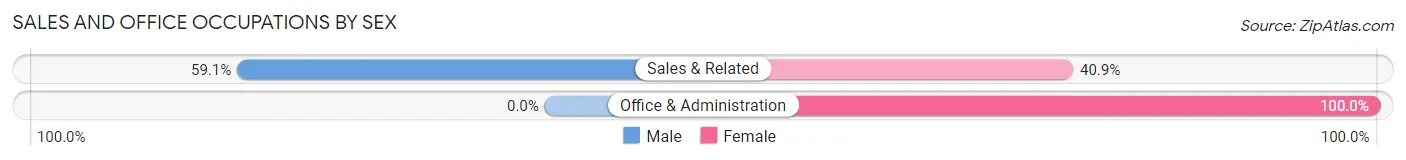
Sales and Office Occupations
The most common Sales and Office occupations in Greenville are Sales & Related (93 | 16.6%), and Office & Administration (20 | 3.6%).

Sales and Office Occupations by Sex
| Occupation | Male | Female |
| Sales & Related | 55 (59.1%) | 38 (40.9%) |
| Office & Administration | 0 (0.0%) | 20 (100.0%) |
| Total (Category) | 55 (48.7%) | 58 (51.3%) |
| Total (Overall) | 343 (61.1%) | 218 (38.9%) |
Natural Resources, Construction and Maintenance Occupations
The most common Natural Resources, Construction and Maintenance occupations in Greenville are , and Construction & Extraction (23 | 4.1%).

Natural Resources, Construction and Maintenance Occupations by Sex

| Occupation | Male | Female |
| Farming, Fishing & Forestry | 0 (0.0%) | 0 (0.0%) |
| Construction & Extraction | 23 (100.0%) | 0 (0.0%) |
| Installation, Maintenance & Repair | 0 (0.0%) | 0 (0.0%) |
| Total (Category) | 23 (100.0%) | 0 (0.0%) |
| Total (Overall) | 343 (61.1%) | 218 (38.9%) |
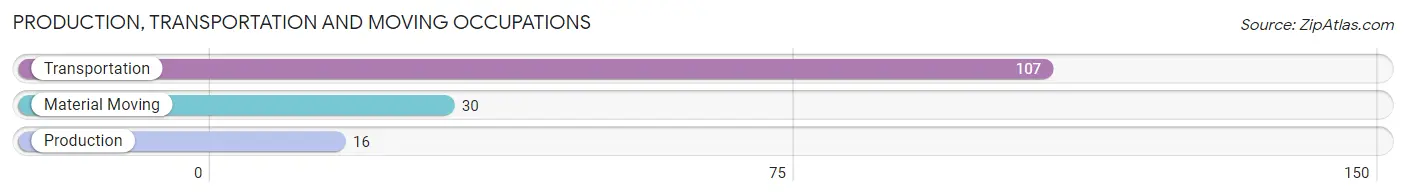
Production, Transportation and Moving Occupations
The most common Production, Transportation and Moving occupations in Greenville are Transportation (107 | 19.1%), Material Moving (30 | 5.3%), and Production (16 | 2.9%).
Production, Transportation and Moving Occupations by Sex
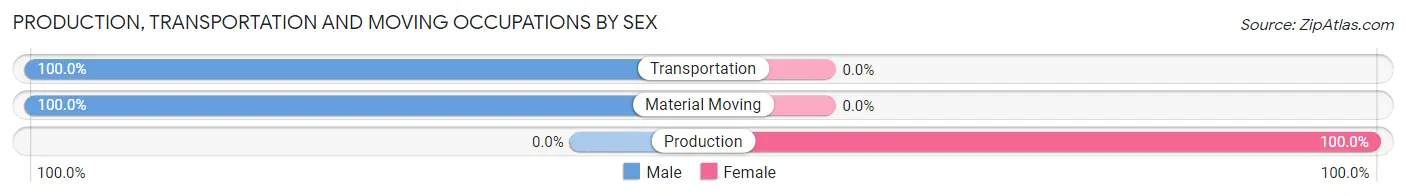
| Occupation | Male | Female |
| Production | 0 (0.0%) | 16 (100.0%) |
| Transportation | 107 (100.0%) | 0 (0.0%) |
| Material Moving | 30 (100.0%) | 0 (0.0%) |
| Total (Category) | 137 (89.5%) | 16 (10.5%) |
| Total (Overall) | 343 (61.1%) | 218 (38.9%) |
Employment Industries by Sex in Greenville
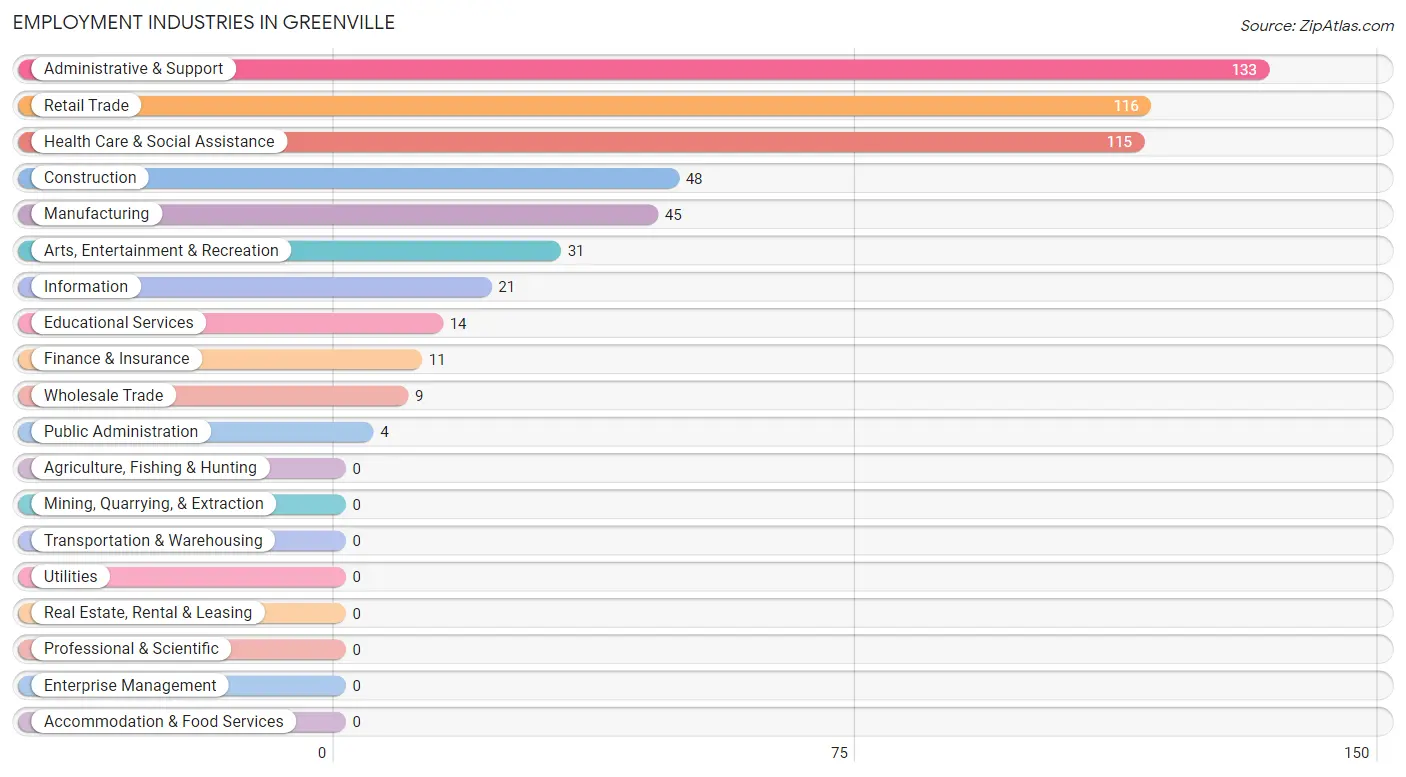
Employment Industries in Greenville
The major employment industries in Greenville include Administrative & Support (133 | 23.7%), Retail Trade (116 | 20.7%), Health Care & Social Assistance (115 | 20.5%), Construction (48 | 8.6%), and Manufacturing (45 | 8.0%).
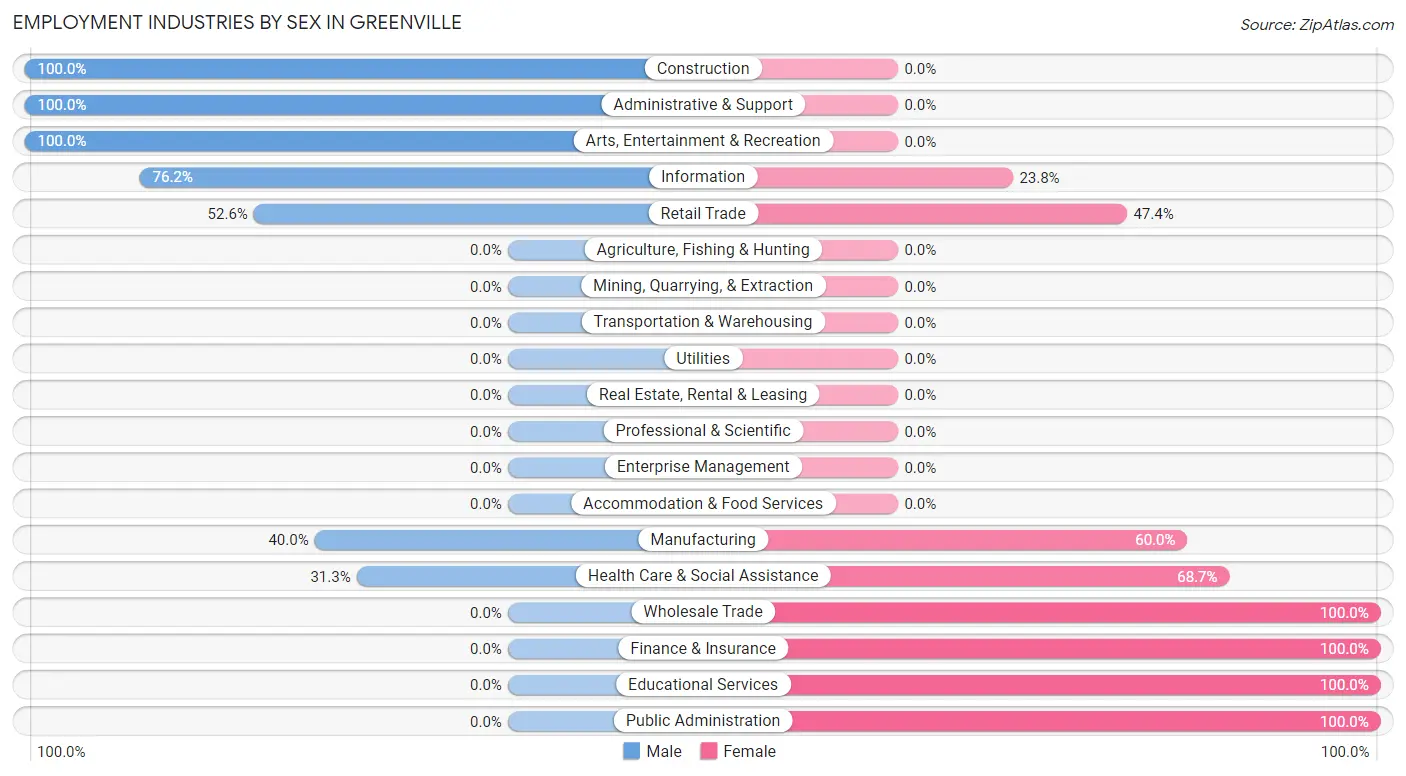
Employment Industries by Sex in Greenville
The Greenville industries that see more men than women are Construction (100.0%), Administrative & Support (100.0%), and Arts, Entertainment & Recreation (100.0%), whereas the industries that tend to have a higher number of women are Wholesale Trade (100.0%), Finance & Insurance (100.0%), and Educational Services (100.0%).
| Industry | Male | Female |
| Agriculture, Fishing & Hunting | 0 (0.0%) | 0 (0.0%) |
| Mining, Quarrying, & Extraction | 0 (0.0%) | 0 (0.0%) |
| Construction | 48 (100.0%) | 0 (0.0%) |
| Manufacturing | 18 (40.0%) | 27 (60.0%) |
| Wholesale Trade | 0 (0.0%) | 9 (100.0%) |
| Retail Trade | 61 (52.6%) | 55 (47.4%) |
| Transportation & Warehousing | 0 (0.0%) | 0 (0.0%) |
| Utilities | 0 (0.0%) | 0 (0.0%) |
| Information | 16 (76.2%) | 5 (23.8%) |
| Finance & Insurance | 0 (0.0%) | 11 (100.0%) |
| Real Estate, Rental & Leasing | 0 (0.0%) | 0 (0.0%) |
| Professional & Scientific | 0 (0.0%) | 0 (0.0%) |
| Enterprise Management | 0 (0.0%) | 0 (0.0%) |
| Administrative & Support | 133 (100.0%) | 0 (0.0%) |
| Educational Services | 0 (0.0%) | 14 (100.0%) |
| Health Care & Social Assistance | 36 (31.3%) | 79 (68.7%) |
| Arts, Entertainment & Recreation | 31 (100.0%) | 0 (0.0%) |
| Accommodation & Food Services | 0 (0.0%) | 0 (0.0%) |
| Public Administration | 0 (0.0%) | 4 (100.0%) |
| Total | 343 (61.1%) | 218 (38.9%) |
Education in Greenville
School Enrollment in Greenville
The most common levels of schooling among the 163 students in Greenville are middle school (51 | 31.3%), high school (46 | 28.2%), and kindergarten (33 | 20.3%).
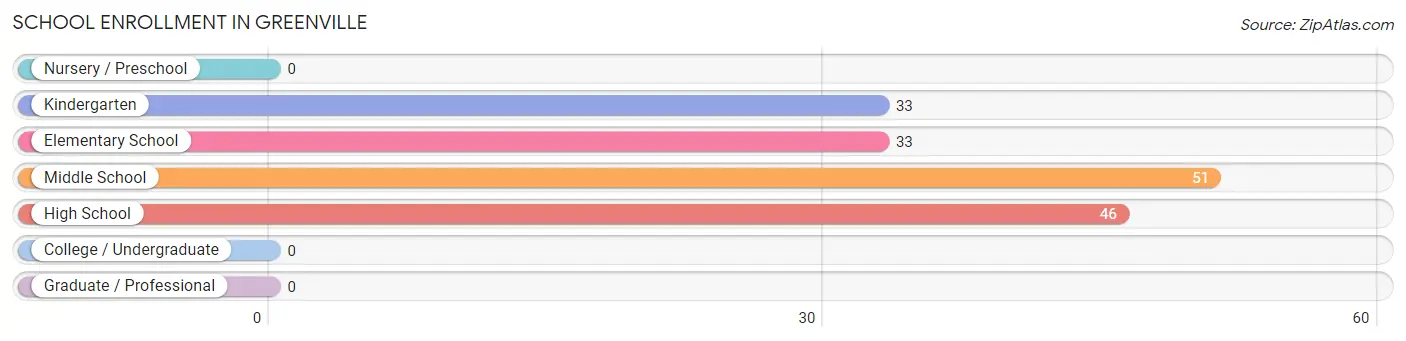
| School Level | # Students | % Students |
| Nursery / Preschool | 0 | 0.0% |
| Kindergarten | 33 | 20.3% |
| Elementary School | 33 | 20.3% |
| Middle School | 51 | 31.3% |
| High School | 46 | 28.2% |
| College / Undergraduate | 0 | 0.0% |
| Graduate / Professional | 0 | 0.0% |
| Total | 163 | 100.0% |
School Enrollment by Age by Funding Source in Greenville
Out of a total of 163 students who are enrolled in schools in Greenville, 17 (10.4%) attend a private institution, while the remaining 146 (89.6%) are enrolled in public schools. The age group of 5 to 9 year old has the highest likelihood of being enrolled in private schools, with 17 (25.8% in the age bracket) enrolled. Conversely, the age group of 10 to 14 year olds has the lowest likelihood of being enrolled in a private school, with 51 (100.0% in the age bracket) attending a public institution.
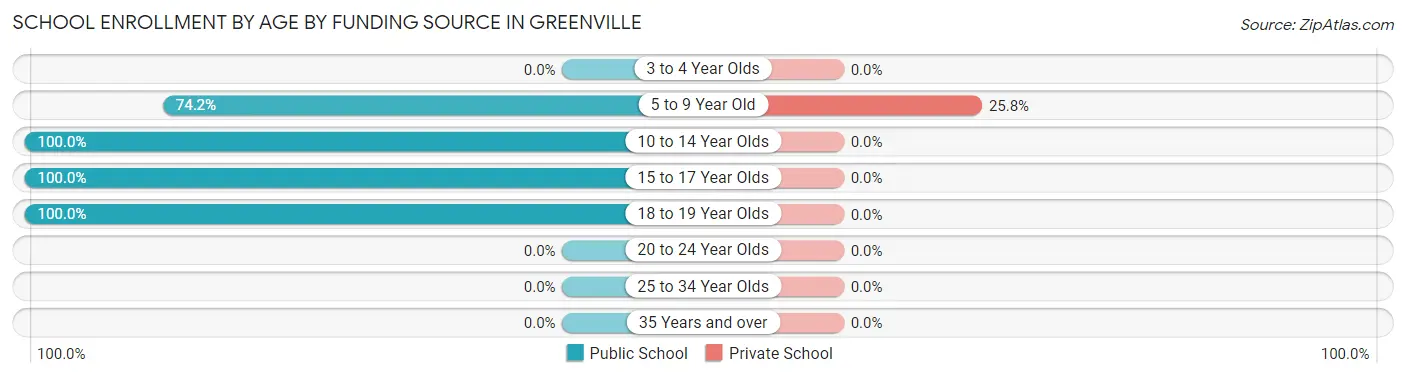
| Age Bracket | Public School | Private School |
| 3 to 4 Year Olds | 0 (0.0%) | 0 (0.0%) |
| 5 to 9 Year Old | 49 (74.2%) | 17 (25.8%) |
| 10 to 14 Year Olds | 51 (100.0%) | 0 (0.0%) |
| 15 to 17 Year Olds | 20 (100.0%) | 0 (0.0%) |
| 18 to 19 Year Olds | 26 (100.0%) | 0 (0.0%) |
| 20 to 24 Year Olds | 0 (0.0%) | 0 (0.0%) |
| 25 to 34 Year Olds | 0 (0.0%) | 0 (0.0%) |
| 35 Years and over | 0 (0.0%) | 0 (0.0%) |
| Total | 146 (89.6%) | 17 (10.4%) |
Educational Attainment by Field of Study in Greenville
Education (61 | 30.5%), business (44 | 22.0%), arts & humanities (21 | 10.5%), bio, nature & agricultural (16 | 8.0%), and social sciences (16 | 8.0%) are the most common fields of study among 200 individuals in Greenville who have obtained a bachelor's degree or higher.
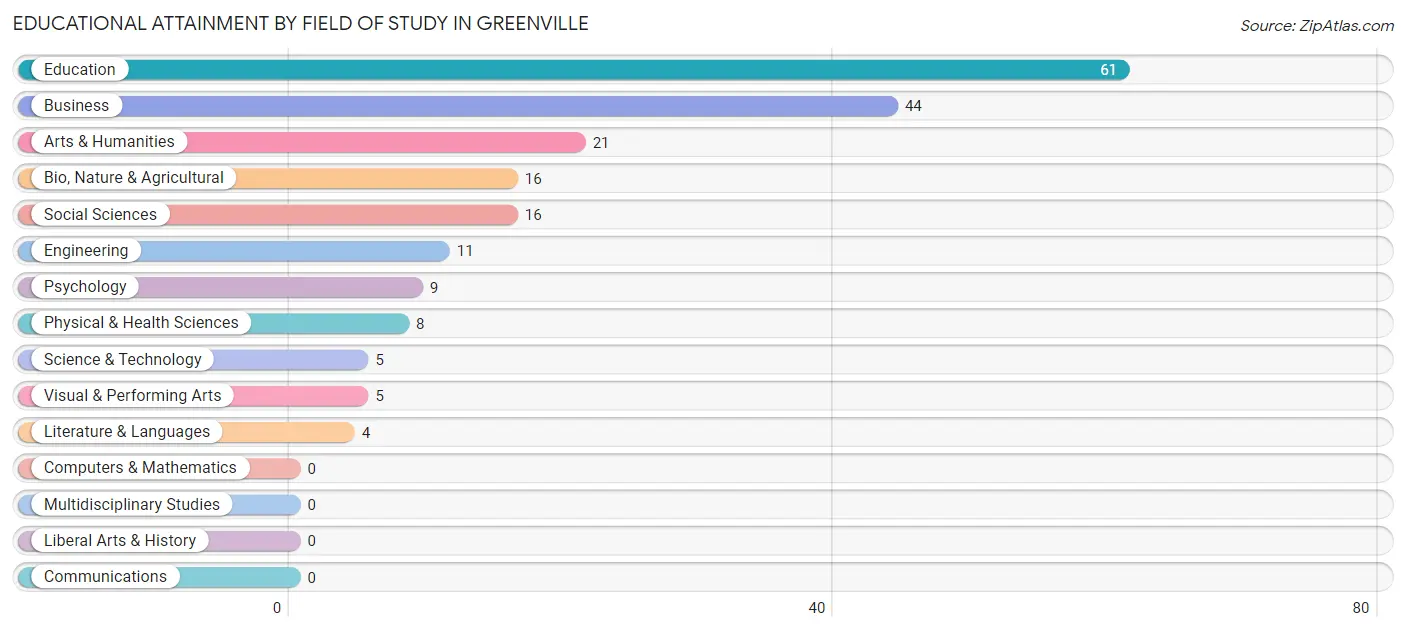
| Field of Study | # Graduates | % Graduates |
| Computers & Mathematics | 0 | 0.0% |
| Bio, Nature & Agricultural | 16 | 8.0% |
| Physical & Health Sciences | 8 | 4.0% |
| Psychology | 9 | 4.5% |
| Social Sciences | 16 | 8.0% |
| Engineering | 11 | 5.5% |
| Multidisciplinary Studies | 0 | 0.0% |
| Science & Technology | 5 | 2.5% |
| Business | 44 | 22.0% |
| Education | 61 | 30.5% |
| Literature & Languages | 4 | 2.0% |
| Liberal Arts & History | 0 | 0.0% |
| Visual & Performing Arts | 5 | 2.5% |
| Communications | 0 | 0.0% |
| Arts & Humanities | 21 | 10.5% |
| Total | 200 | 100.0% |
Transportation & Commute in Greenville
Vehicle Availability by Sex in Greenville
The most prevalent vehicle ownership categories in Greenville are males with 2 vehicles (239, accounting for 69.7%) and females with 2 vehicles (105, making up 110.1%).
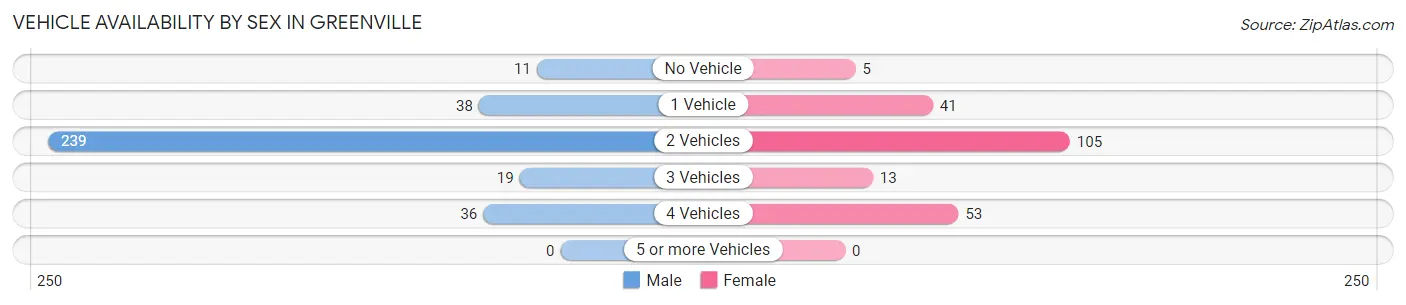
| Vehicles Available | Male | Female |
| No Vehicle | 11 (3.2%) | 5 (2.3%) |
| 1 Vehicle | 38 (11.1%) | 41 (18.9%) |
| 2 Vehicles | 239 (69.7%) | 105 (48.4%) |
| 3 Vehicles | 19 (5.5%) | 13 (6.0%) |
| 4 Vehicles | 36 (10.5%) | 53 (24.4%) |
| 5 or more Vehicles | 0 (0.0%) | 0 (0.0%) |
| Total | 343 (100.0%) | 217 (100.0%) |
Commute Time in Greenville
The most frequently occuring commute durations in Greenville are 10 to 14 minutes (121 commuters, 21.7%), less than 5 minutes (109 commuters, 19.6%), and 5 to 9 minutes (91 commuters, 16.3%).
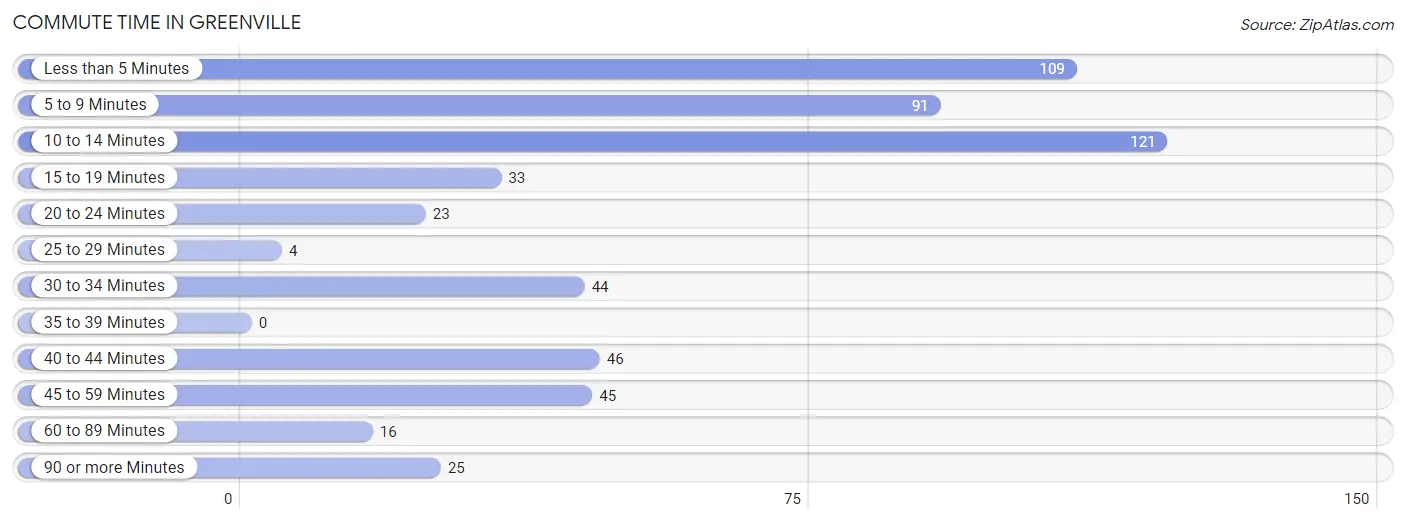
| Commute Time | # Commuters | % Commuters |
| Less than 5 Minutes | 109 | 19.6% |
| 5 to 9 Minutes | 91 | 16.3% |
| 10 to 14 Minutes | 121 | 21.7% |
| 15 to 19 Minutes | 33 | 5.9% |
| 20 to 24 Minutes | 23 | 4.1% |
| 25 to 29 Minutes | 4 | 0.7% |
| 30 to 34 Minutes | 44 | 7.9% |
| 35 to 39 Minutes | 0 | 0.0% |
| 40 to 44 Minutes | 46 | 8.3% |
| 45 to 59 Minutes | 45 | 8.1% |
| 60 to 89 Minutes | 16 | 2.9% |
| 90 or more Minutes | 25 | 4.5% |
Commute Time by Sex in Greenville
The most common commute times in Greenville are 10 to 14 minutes (112 commuters, 33.0%) for males and 5 to 9 minutes (57 commuters, 26.2%) for females.
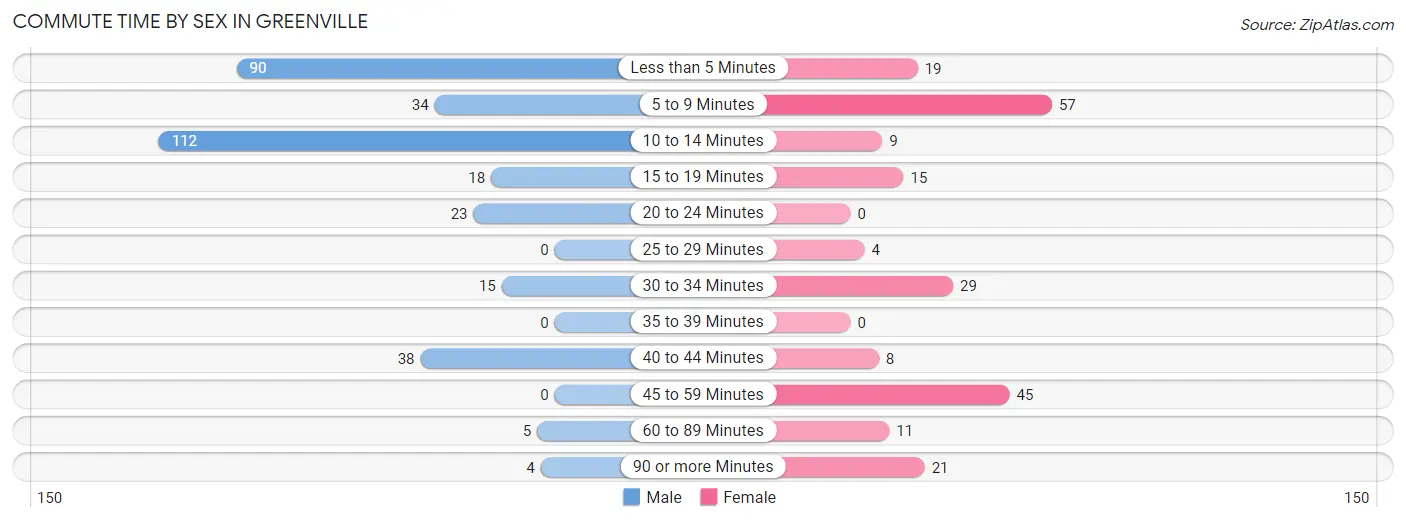
| Commute Time | Male | Female |
| Less than 5 Minutes | 90 (26.6%) | 19 (8.7%) |
| 5 to 9 Minutes | 34 (10.0%) | 57 (26.2%) |
| 10 to 14 Minutes | 112 (33.0%) | 9 (4.1%) |
| 15 to 19 Minutes | 18 (5.3%) | 15 (6.9%) |
| 20 to 24 Minutes | 23 (6.8%) | 0 (0.0%) |
| 25 to 29 Minutes | 0 (0.0%) | 4 (1.8%) |
| 30 to 34 Minutes | 15 (4.4%) | 29 (13.3%) |
| 35 to 39 Minutes | 0 (0.0%) | 0 (0.0%) |
| 40 to 44 Minutes | 38 (11.2%) | 8 (3.7%) |
| 45 to 59 Minutes | 0 (0.0%) | 45 (20.6%) |
| 60 to 89 Minutes | 5 (1.5%) | 11 (5.1%) |
| 90 or more Minutes | 4 (1.2%) | 21 (9.6%) |
Time of Departure to Work by Sex in Greenville
The most frequent times of departure to work in Greenville are 6:00 AM to 6:29 AM (147, 43.4%) for males and 7:00 AM to 7:29 AM (42, 19.3%) for females.
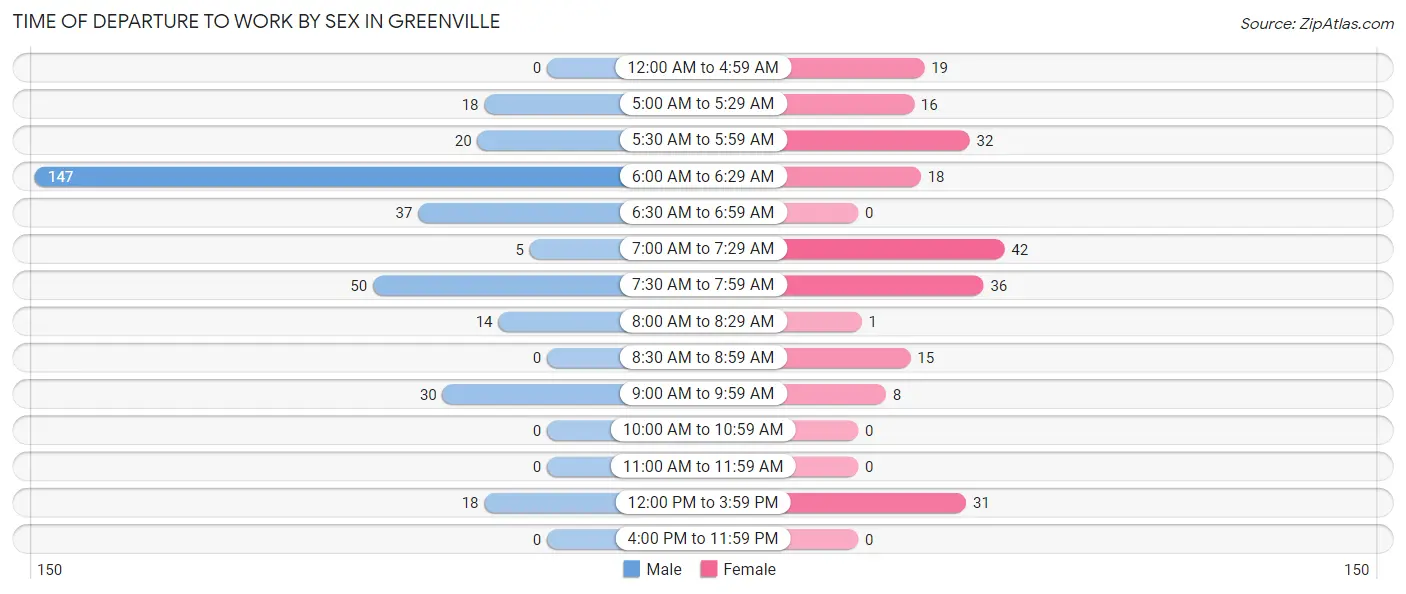
| Time of Departure | Male | Female |
| 12:00 AM to 4:59 AM | 0 (0.0%) | 19 (8.7%) |
| 5:00 AM to 5:29 AM | 18 (5.3%) | 16 (7.3%) |
| 5:30 AM to 5:59 AM | 20 (5.9%) | 32 (14.7%) |
| 6:00 AM to 6:29 AM | 147 (43.4%) | 18 (8.3%) |
| 6:30 AM to 6:59 AM | 37 (10.9%) | 0 (0.0%) |
| 7:00 AM to 7:29 AM | 5 (1.5%) | 42 (19.3%) |
| 7:30 AM to 7:59 AM | 50 (14.7%) | 36 (16.5%) |
| 8:00 AM to 8:29 AM | 14 (4.1%) | 1 (0.5%) |
| 8:30 AM to 8:59 AM | 0 (0.0%) | 15 (6.9%) |
| 9:00 AM to 9:59 AM | 30 (8.8%) | 8 (3.7%) |
| 10:00 AM to 10:59 AM | 0 (0.0%) | 0 (0.0%) |
| 11:00 AM to 11:59 AM | 0 (0.0%) | 0 (0.0%) |
| 12:00 PM to 3:59 PM | 18 (5.3%) | 31 (14.2%) |
| 4:00 PM to 11:59 PM | 0 (0.0%) | 0 (0.0%) |
| Total | 339 (100.0%) | 218 (100.0%) |
Housing Occupancy in Greenville
Occupancy by Ownership in Greenville
Of the total 427 dwellings in Greenville, owner-occupied units account for 326 (76.3%), while renter-occupied units make up 101 (23.6%).
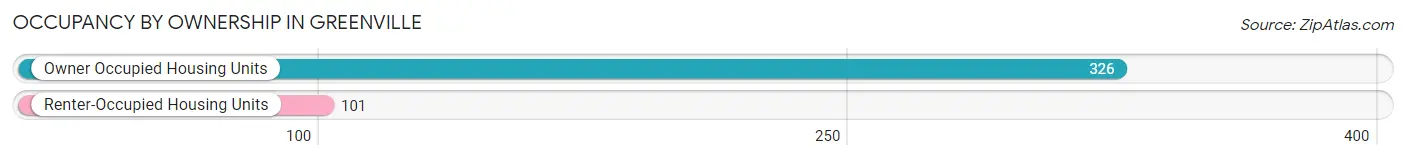
| Occupancy | # Housing Units | % Housing Units |
| Owner Occupied Housing Units | 326 | 76.3% |
| Renter-Occupied Housing Units | 101 | 23.6% |
| Total Occupied Housing Units | 427 | 100.0% |
Occupancy by Household Size in Greenville
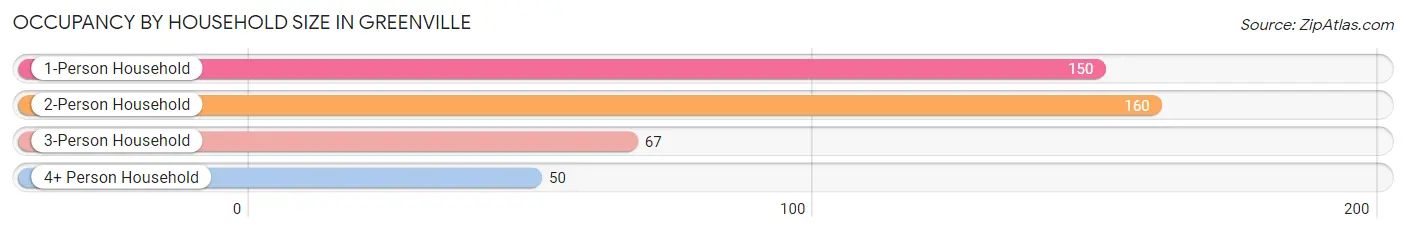
| Household Size | # Housing Units | % Housing Units |
| 1-Person Household | 150 | 35.1% |
| 2-Person Household | 160 | 37.5% |
| 3-Person Household | 67 | 15.7% |
| 4+ Person Household | 50 | 11.7% |
| Total Housing Units | 427 | 100.0% |
Occupancy by Ownership by Household Size in Greenville
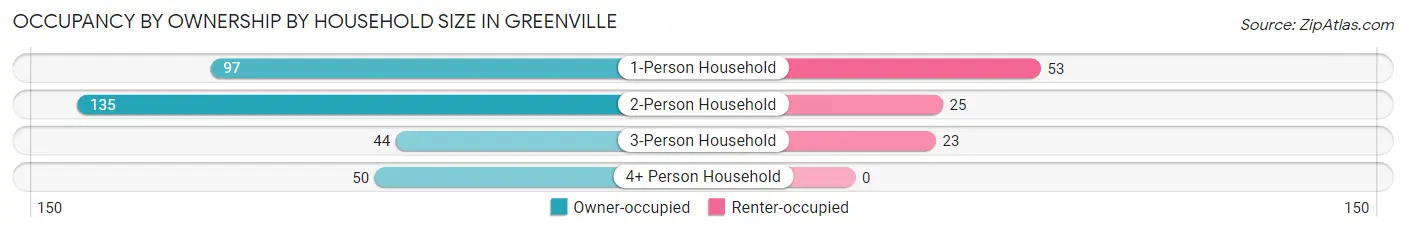
| Household Size | Owner-occupied | Renter-occupied |
| 1-Person Household | 97 (64.7%) | 53 (35.3%) |
| 2-Person Household | 135 (84.4%) | 25 (15.6%) |
| 3-Person Household | 44 (65.7%) | 23 (34.3%) |
| 4+ Person Household | 50 (100.0%) | 0 (0.0%) |
| Total Housing Units | 326 (76.3%) | 101 (23.6%) |
Occupancy by Educational Attainment in Greenville
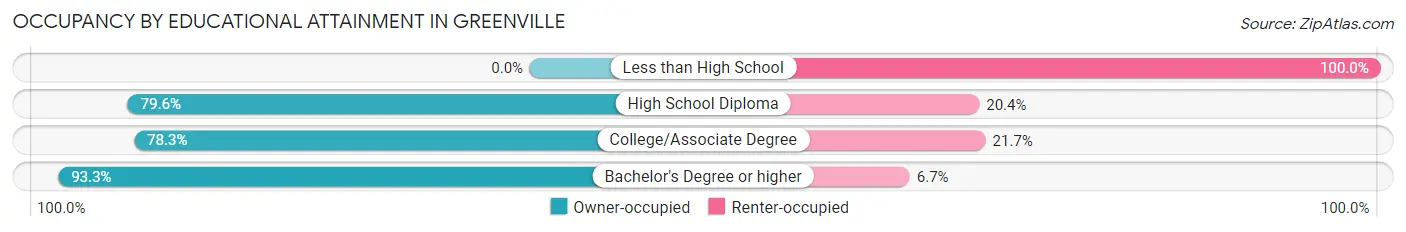
| Household Size | Owner-occupied | Renter-occupied |
| Less than High School | 0 (0.0%) | 33 (100.0%) |
| High School Diploma | 109 (79.6%) | 28 (20.4%) |
| College/Associate Degree | 119 (78.3%) | 33 (21.7%) |
| Bachelor's Degree or higher | 98 (93.3%) | 7 (6.7%) |
Occupancy by Age of Householder in Greenville
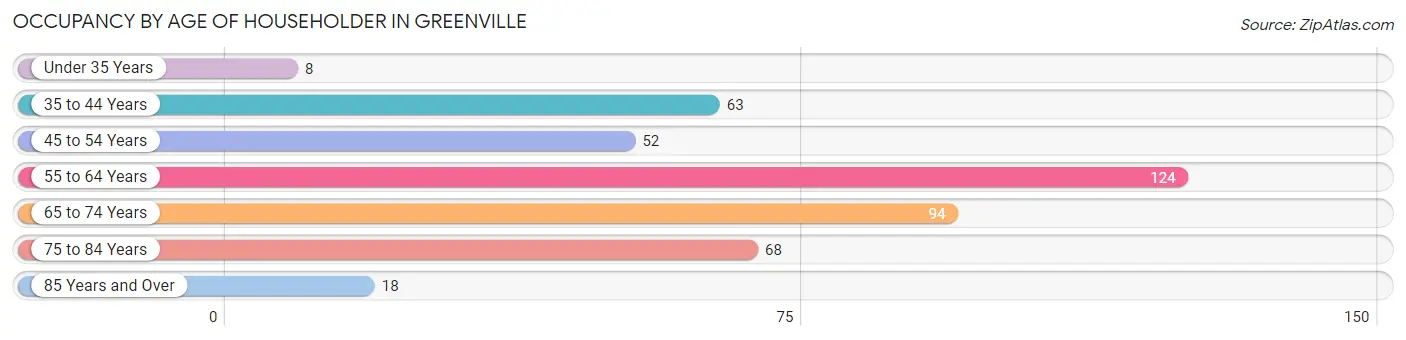
| Age Bracket | # Households | % Households |
| Under 35 Years | 8 | 1.9% |
| 35 to 44 Years | 63 | 14.7% |
| 45 to 54 Years | 52 | 12.2% |
| 55 to 64 Years | 124 | 29.0% |
| 65 to 74 Years | 94 | 22.0% |
| 75 to 84 Years | 68 | 15.9% |
| 85 Years and Over | 18 | 4.2% |
| Total | 427 | 100.0% |
Housing Finances in Greenville
Median Income by Occupancy in Greenville
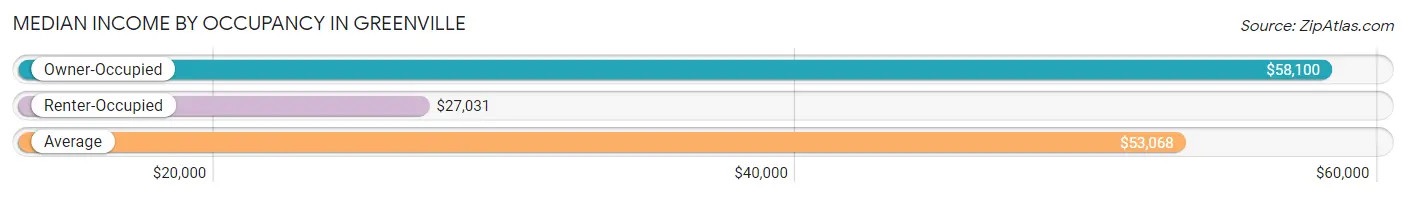
| Occupancy Type | # Households | Median Income |
| Owner-Occupied | 326 (76.3%) | $58,100 |
| Renter-Occupied | 101 (23.6%) | $27,031 |
| Average | 427 (100.0%) | $53,068 |
Occupancy by Householder Income Bracket in Greenville
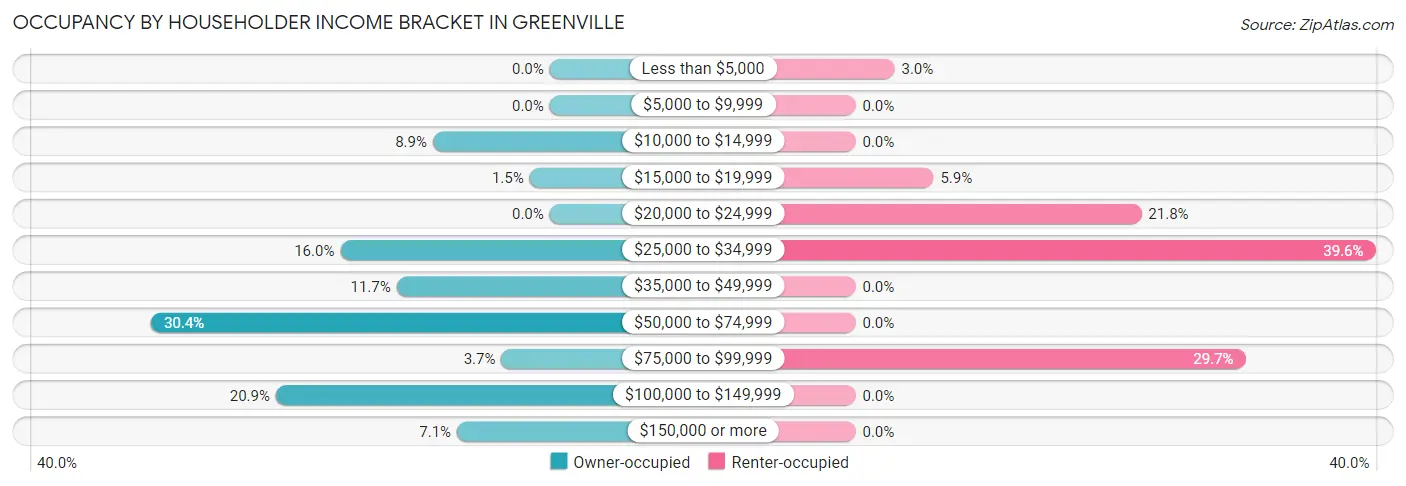
| Income Bracket | Owner-occupied | Renter-occupied |
| Less than $5,000 | 0 (0.0%) | 3 (3.0%) |
| $5,000 to $9,999 | 0 (0.0%) | 0 (0.0%) |
| $10,000 to $14,999 | 29 (8.9%) | 0 (0.0%) |
| $15,000 to $19,999 | 5 (1.5%) | 6 (5.9%) |
| $20,000 to $24,999 | 0 (0.0%) | 22 (21.8%) |
| $25,000 to $34,999 | 52 (16.0%) | 40 (39.6%) |
| $35,000 to $49,999 | 38 (11.7%) | 0 (0.0%) |
| $50,000 to $74,999 | 99 (30.4%) | 0 (0.0%) |
| $75,000 to $99,999 | 12 (3.7%) | 30 (29.7%) |
| $100,000 to $149,999 | 68 (20.9%) | 0 (0.0%) |
| $150,000 or more | 23 (7.1%) | 0 (0.0%) |
| Total | 326 (100.0%) | 101 (100.0%) |
Monthly Housing Cost Tiers in Greenville
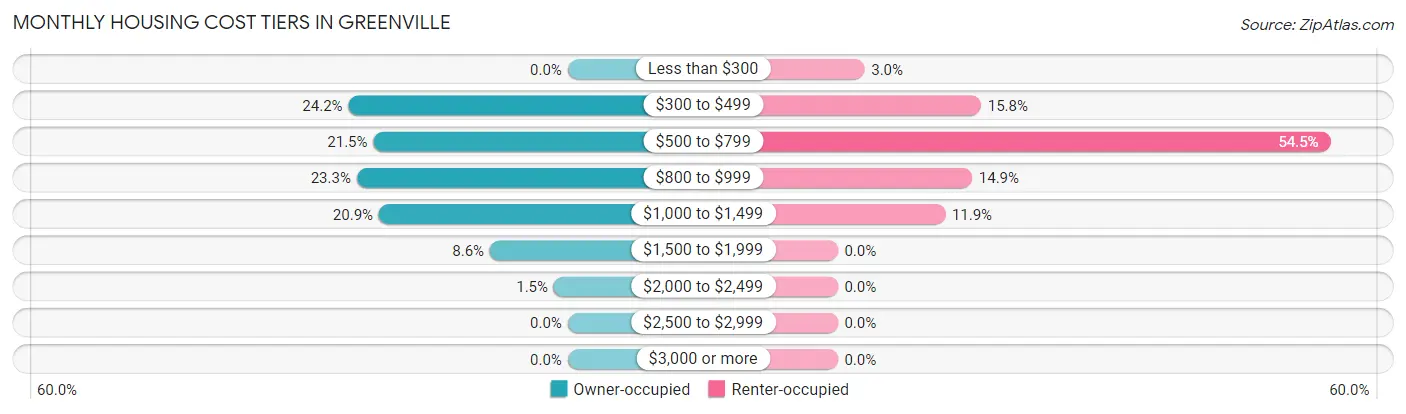
| Monthly Cost | Owner-occupied | Renter-occupied |
| Less than $300 | 0 (0.0%) | 3 (3.0%) |
| $300 to $499 | 79 (24.2%) | 16 (15.8%) |
| $500 to $799 | 70 (21.5%) | 55 (54.5%) |
| $800 to $999 | 76 (23.3%) | 15 (14.8%) |
| $1,000 to $1,499 | 68 (20.9%) | 12 (11.9%) |
| $1,500 to $1,999 | 28 (8.6%) | 0 (0.0%) |
| $2,000 to $2,499 | 5 (1.5%) | 0 (0.0%) |
| $2,500 to $2,999 | 0 (0.0%) | 0 (0.0%) |
| $3,000 or more | 0 (0.0%) | 0 (0.0%) |
| Total | 326 (100.0%) | 101 (100.0%) |
Physical Housing Characteristics in Greenville
Housing Structures in Greenville
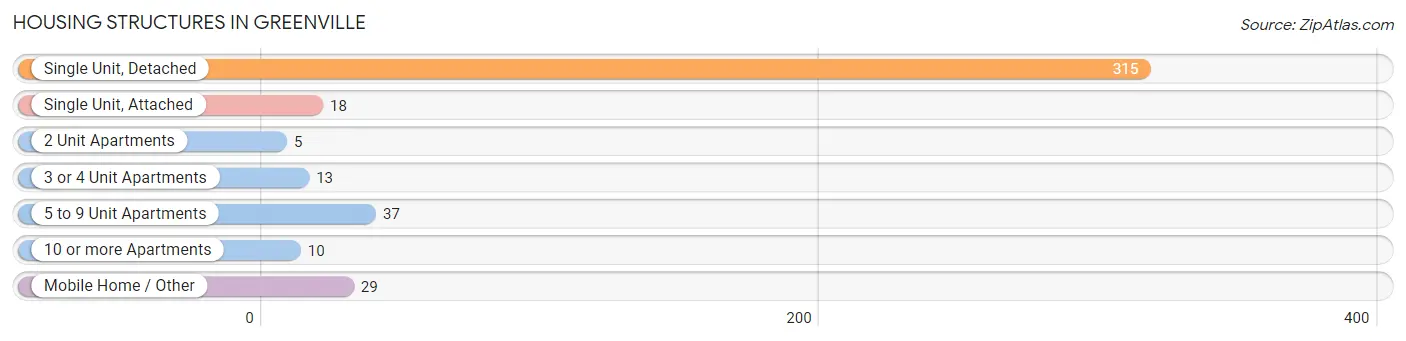
| Structure Type | # Housing Units | % Housing Units |
| Single Unit, Detached | 315 | 73.8% |
| Single Unit, Attached | 18 | 4.2% |
| 2 Unit Apartments | 5 | 1.2% |
| 3 or 4 Unit Apartments | 13 | 3.0% |
| 5 to 9 Unit Apartments | 37 | 8.7% |
| 10 or more Apartments | 10 | 2.3% |
| Mobile Home / Other | 29 | 6.8% |
| Total | 427 | 100.0% |
Housing Structures by Occupancy in Greenville
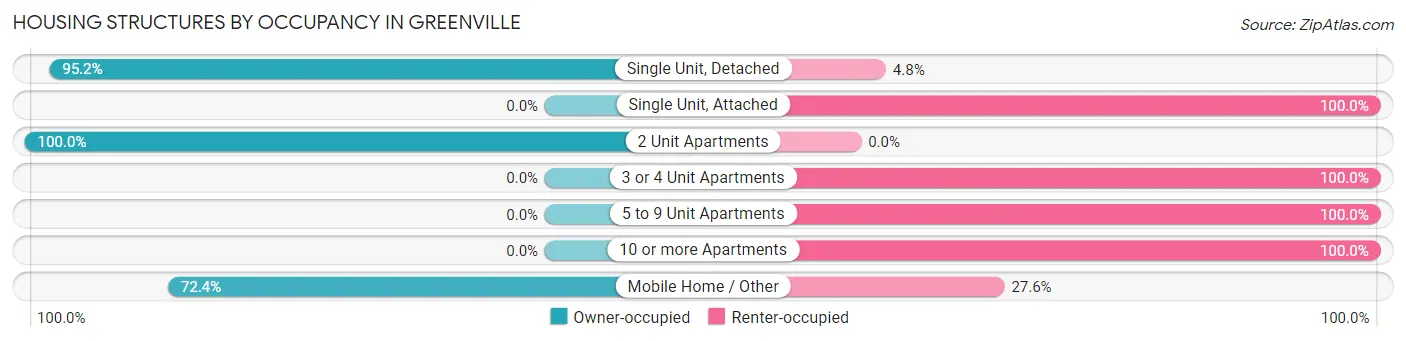
| Structure Type | Owner-occupied | Renter-occupied |
| Single Unit, Detached | 300 (95.2%) | 15 (4.8%) |
| Single Unit, Attached | 0 (0.0%) | 18 (100.0%) |
| 2 Unit Apartments | 5 (100.0%) | 0 (0.0%) |
| 3 or 4 Unit Apartments | 0 (0.0%) | 13 (100.0%) |
| 5 to 9 Unit Apartments | 0 (0.0%) | 37 (100.0%) |
| 10 or more Apartments | 0 (0.0%) | 10 (100.0%) |
| Mobile Home / Other | 21 (72.4%) | 8 (27.6%) |
| Total | 326 (76.3%) | 101 (23.6%) |
Housing Structures by Number of Rooms in Greenville
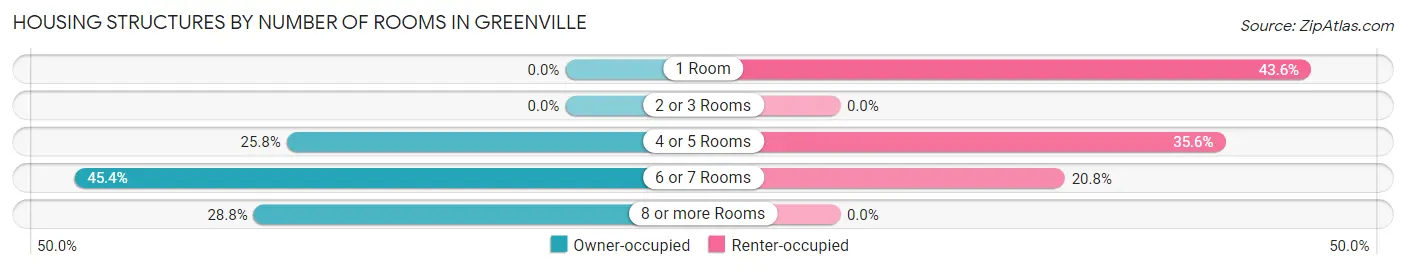
| Number of Rooms | Owner-occupied | Renter-occupied |
| 1 Room | 0 (0.0%) | 44 (43.6%) |
| 2 or 3 Rooms | 0 (0.0%) | 0 (0.0%) |
| 4 or 5 Rooms | 84 (25.8%) | 36 (35.6%) |
| 6 or 7 Rooms | 148 (45.4%) | 21 (20.8%) |
| 8 or more Rooms | 94 (28.8%) | 0 (0.0%) |
| Total | 326 (100.0%) | 101 (100.0%) |
Housing Structure by Heating Type in Greenville
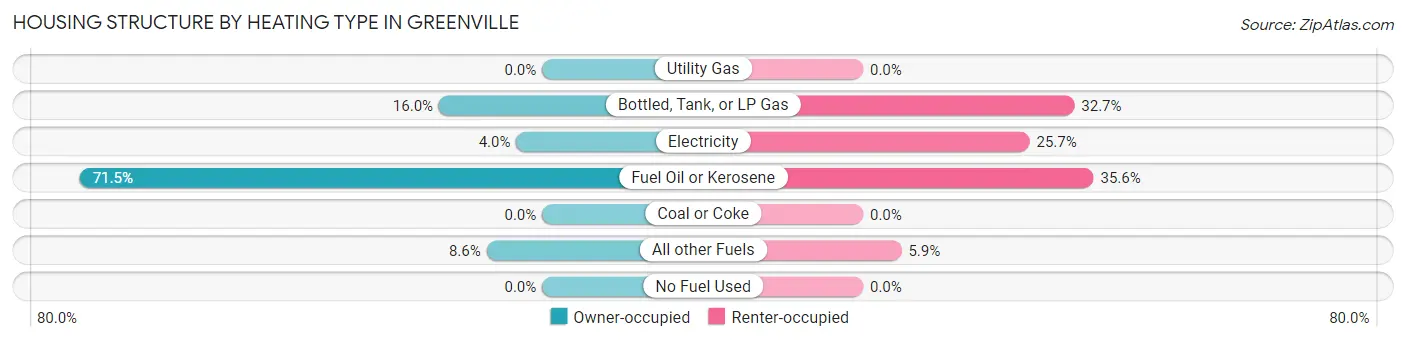
| Heating Type | Owner-occupied | Renter-occupied |
| Utility Gas | 0 (0.0%) | 0 (0.0%) |
| Bottled, Tank, or LP Gas | 52 (16.0%) | 33 (32.7%) |
| Electricity | 13 (4.0%) | 26 (25.7%) |
| Fuel Oil or Kerosene | 233 (71.5%) | 36 (35.6%) |
| Coal or Coke | 0 (0.0%) | 0 (0.0%) |
| All other Fuels | 28 (8.6%) | 6 (5.9%) |
| No Fuel Used | 0 (0.0%) | 0 (0.0%) |
| Total | 326 (100.0%) | 101 (100.0%) |
Household Vehicle Usage in Greenville
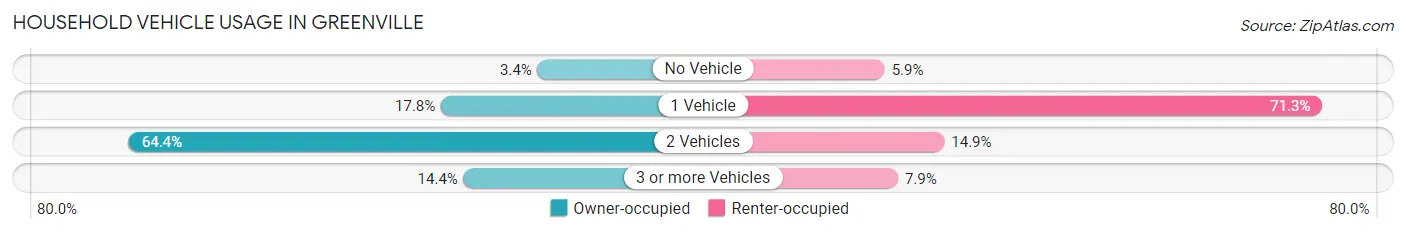
| Vehicles per Household | Owner-occupied | Renter-occupied |
| No Vehicle | 11 (3.4%) | 6 (5.9%) |
| 1 Vehicle | 58 (17.8%) | 72 (71.3%) |
| 2 Vehicles | 210 (64.4%) | 15 (14.8%) |
| 3 or more Vehicles | 47 (14.4%) | 8 (7.9%) |
| Total | 326 (100.0%) | 101 (100.0%) |
Real Estate & Mortgages in Greenville
Real Estate and Mortgage Overview in Greenville
| Characteristic | Without Mortgage | With Mortgage |
| Housing Units | 164 | 162 |
| Median Property Value | $204,500 | $123,900 |
| Median Household Income | $52,031 | $23 |
| Monthly Housing Costs | $520 | $0 |
| Real Estate Taxes | $1,900 | $0 |
Property Value by Mortgage Status in Greenville
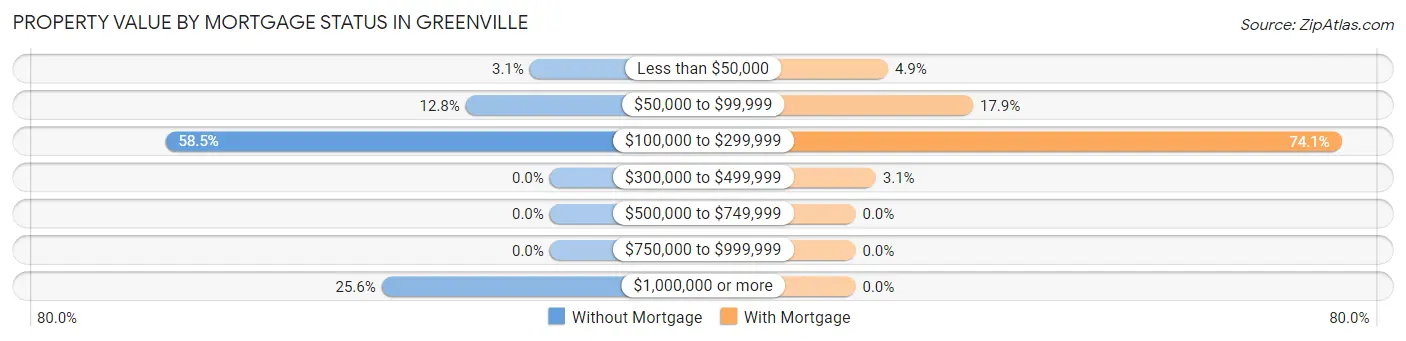
| Property Value | Without Mortgage | With Mortgage |
| Less than $50,000 | 5 (3.0%) | 8 (4.9%) |
| $50,000 to $99,999 | 21 (12.8%) | 29 (17.9%) |
| $100,000 to $299,999 | 96 (58.5%) | 120 (74.1%) |
| $300,000 to $499,999 | 0 (0.0%) | 5 (3.1%) |
| $500,000 to $749,999 | 0 (0.0%) | 0 (0.0%) |
| $750,000 to $999,999 | 0 (0.0%) | 0 (0.0%) |
| $1,000,000 or more | 42 (25.6%) | 0 (0.0%) |
| Total | 164 (100.0%) | 162 (100.0%) |
Household Income by Mortgage Status in Greenville
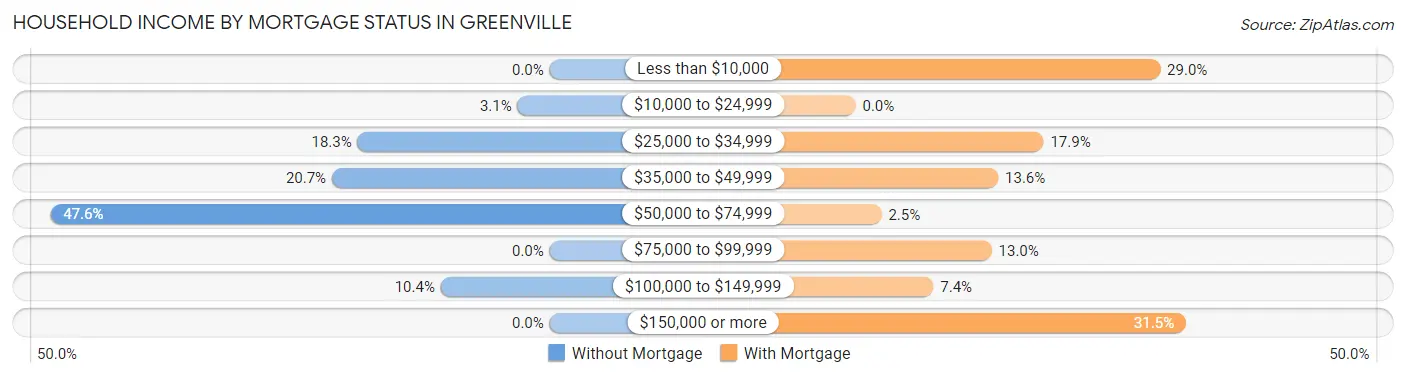
| Household Income | Without Mortgage | With Mortgage |
| Less than $10,000 | 0 (0.0%) | 47 (29.0%) |
| $10,000 to $24,999 | 5 (3.0%) | 0 (0.0%) |
| $25,000 to $34,999 | 30 (18.3%) | 29 (17.9%) |
| $35,000 to $49,999 | 34 (20.7%) | 22 (13.6%) |
| $50,000 to $74,999 | 78 (47.6%) | 4 (2.5%) |
| $75,000 to $99,999 | 0 (0.0%) | 21 (13.0%) |
| $100,000 to $149,999 | 17 (10.4%) | 12 (7.4%) |
| $150,000 or more | 0 (0.0%) | 51 (31.5%) |
| Total | 164 (100.0%) | 162 (100.0%) |
Property Value to Household Income Ratio in Greenville
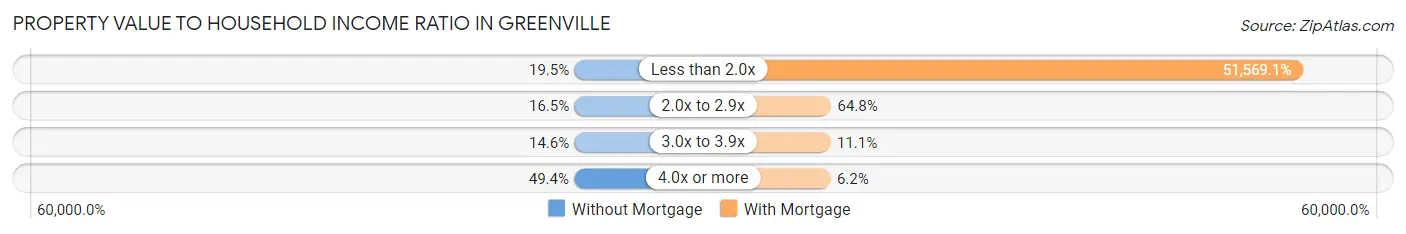
| Value-to-Income Ratio | Without Mortgage | With Mortgage |
| Less than 2.0x | 32 (19.5%) | 83,542 (51,569.1%) |
| 2.0x to 2.9x | 27 (16.5%) | 105 (64.8%) |
| 3.0x to 3.9x | 24 (14.6%) | 18 (11.1%) |
| 4.0x or more | 81 (49.4%) | 10 (6.2%) |
| Total | 164 (100.0%) | 162 (100.0%) |
Real Estate Taxes by Mortgage Status in Greenville
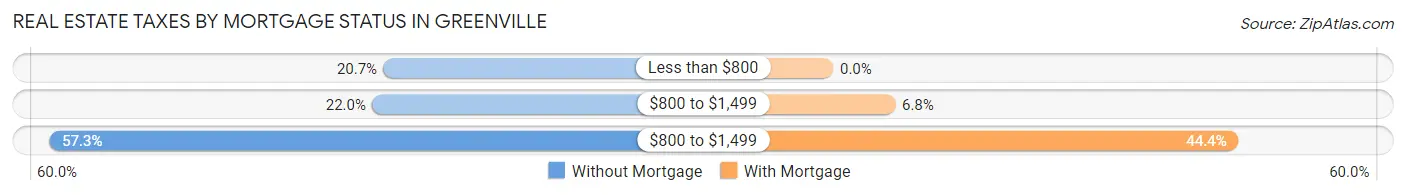
| Property Taxes | Without Mortgage | With Mortgage |
| Less than $800 | 34 (20.7%) | 0 (0.0%) |
| $800 to $1,499 | 36 (22.0%) | 11 (6.8%) |
| $800 to $1,499 | 94 (57.3%) | 72 (44.4%) |
| Total | 164 (100.0%) | 162 (100.0%) |
Health & Disability in Greenville
Health Insurance Coverage by Age in Greenville
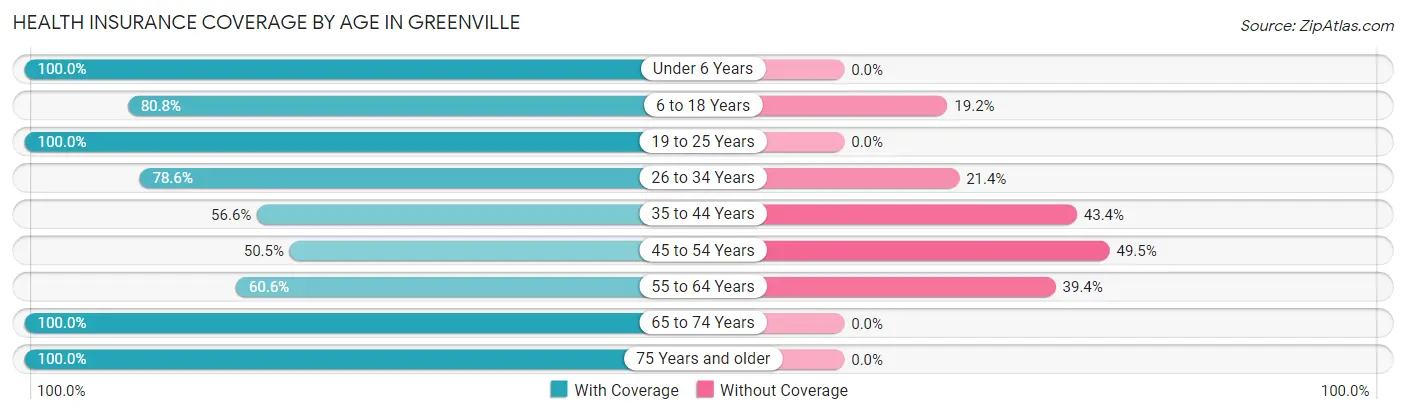
| Age Bracket | With Coverage | Without Coverage |
| Under 6 Years | 33 (100.0%) | 0 (0.0%) |
| 6 to 18 Years | 105 (80.8%) | 25 (19.2%) |
| 19 to 25 Years | 6 (100.0%) | 0 (0.0%) |
| 26 to 34 Years | 33 (78.6%) | 9 (21.4%) |
| 35 to 44 Years | 47 (56.6%) | 36 (43.4%) |
| 45 to 54 Years | 47 (50.5%) | 46 (49.5%) |
| 55 to 64 Years | 206 (60.6%) | 134 (39.4%) |
| 65 to 74 Years | 120 (100.0%) | 0 (0.0%) |
| 75 Years and older | 97 (100.0%) | 0 (0.0%) |
| Total | 694 (73.5%) | 250 (26.5%) |
Health Insurance Coverage by Citizenship Status in Greenville
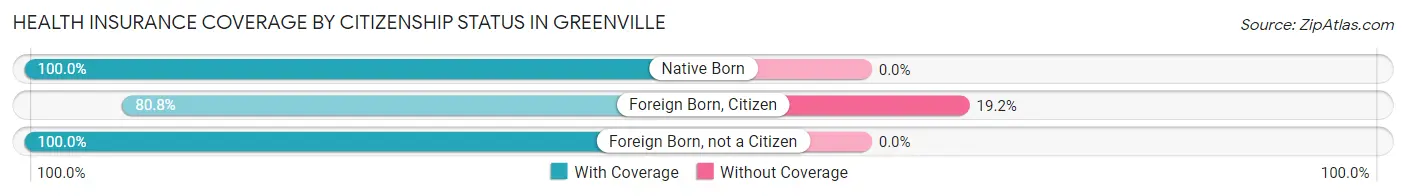
| Citizenship Status | With Coverage | Without Coverage |
| Native Born | 33 (100.0%) | 0 (0.0%) |
| Foreign Born, Citizen | 105 (80.8%) | 25 (19.2%) |
| Foreign Born, not a Citizen | 6 (100.0%) | 0 (0.0%) |
Health Insurance Coverage by Household Income in Greenville
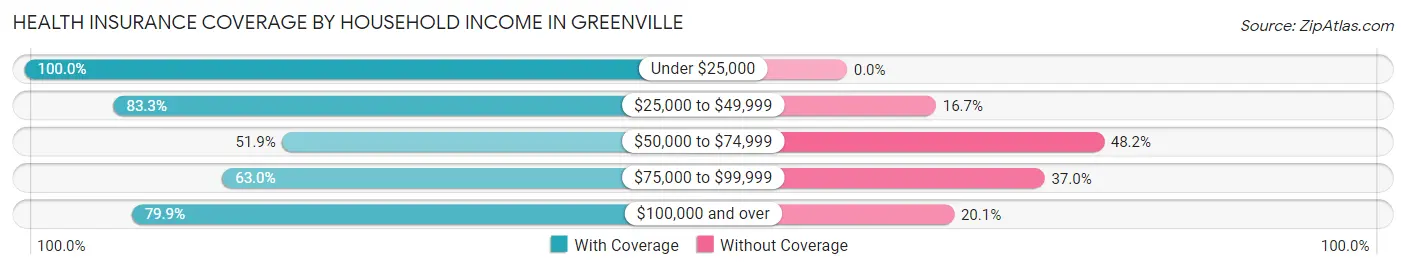
| Household Income | With Coverage | Without Coverage |
| Under $25,000 | 83 (100.0%) | 0 (0.0%) |
| $25,000 to $49,999 | 210 (83.3%) | 42 (16.7%) |
| $50,000 to $74,999 | 126 (51.8%) | 117 (48.1%) |
| $75,000 to $99,999 | 68 (63.0%) | 40 (37.0%) |
| $100,000 and over | 203 (79.9%) | 51 (20.1%) |
Public vs Private Health Insurance Coverage by Age in Greenville
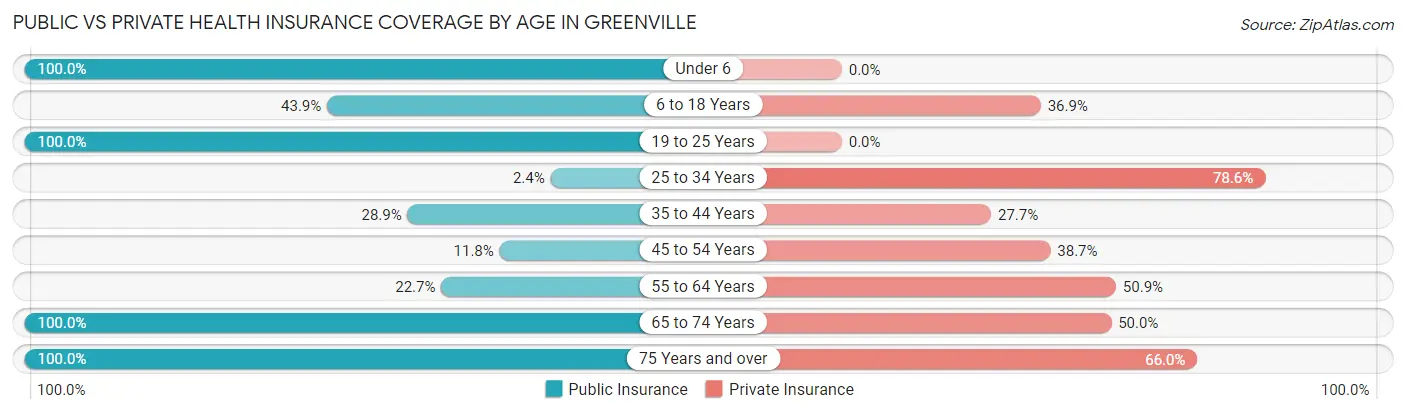
| Age Bracket | Public Insurance | Private Insurance |
| Under 6 | 33 (100.0%) | 0 (0.0%) |
| 6 to 18 Years | 57 (43.9%) | 48 (36.9%) |
| 19 to 25 Years | 6 (100.0%) | 0 (0.0%) |
| 25 to 34 Years | 1 (2.4%) | 33 (78.6%) |
| 35 to 44 Years | 24 (28.9%) | 23 (27.7%) |
| 45 to 54 Years | 11 (11.8%) | 36 (38.7%) |
| 55 to 64 Years | 77 (22.7%) | 173 (50.9%) |
| 65 to 74 Years | 120 (100.0%) | 60 (50.0%) |
| 75 Years and over | 97 (100.0%) | 64 (66.0%) |
| Total | 426 (45.1%) | 437 (46.3%) |
Disability Status by Sex by Age in Greenville
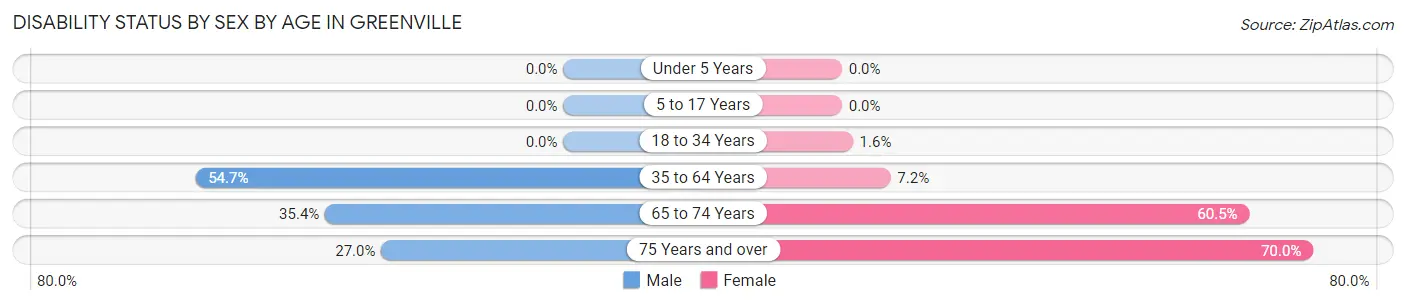
| Age Bracket | Male | Female |
| Under 5 Years | 0 (0.0%) | 0 (0.0%) |
| 5 to 17 Years | 0 (0.0%) | 0 (0.0%) |
| 18 to 34 Years | 0 (0.0%) | 1 (1.6%) |
| 35 to 64 Years | 176 (54.7%) | 14 (7.2%) |
| 65 to 74 Years | 29 (35.4%) | 23 (60.5%) |
| 75 Years and over | 10 (27.0%) | 42 (70.0%) |
Disability Class by Sex by Age in Greenville
Disability Class: Hearing Difficulty
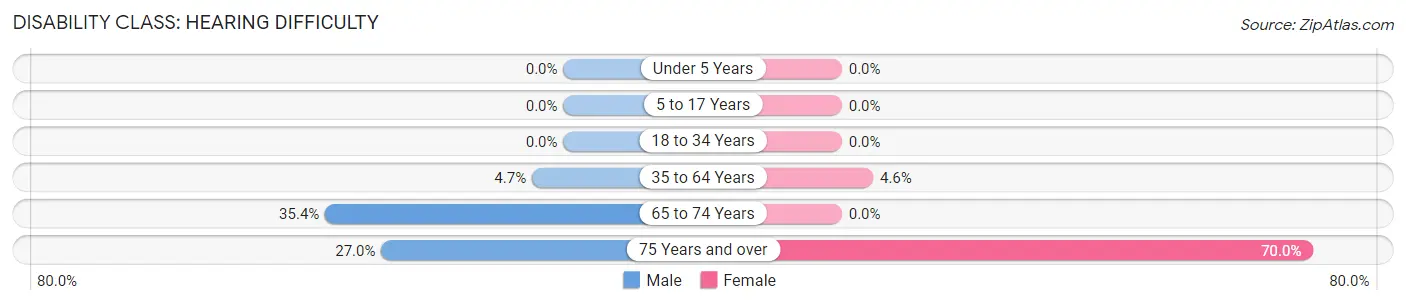
| Age Bracket | Male | Female |
| Under 5 Years | 0 (0.0%) | 0 (0.0%) |
| 5 to 17 Years | 0 (0.0%) | 0 (0.0%) |
| 18 to 34 Years | 0 (0.0%) | 0 (0.0%) |
| 35 to 64 Years | 15 (4.7%) | 9 (4.6%) |
| 65 to 74 Years | 29 (35.4%) | 0 (0.0%) |
| 75 Years and over | 10 (27.0%) | 42 (70.0%) |
Disability Class: Vision Difficulty
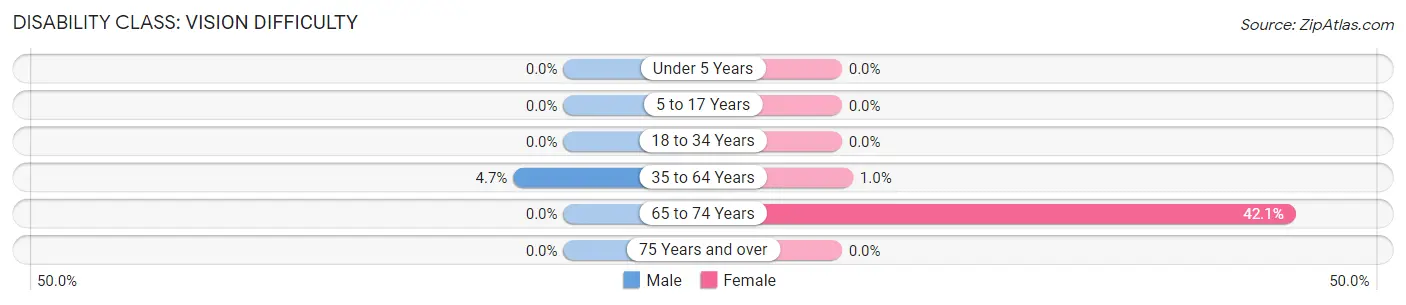
| Age Bracket | Male | Female |
| Under 5 Years | 0 (0.0%) | 0 (0.0%) |
| 5 to 17 Years | 0 (0.0%) | 0 (0.0%) |
| 18 to 34 Years | 0 (0.0%) | 0 (0.0%) |
| 35 to 64 Years | 15 (4.7%) | 2 (1.0%) |
| 65 to 74 Years | 0 (0.0%) | 16 (42.1%) |
| 75 Years and over | 0 (0.0%) | 0 (0.0%) |
Disability Class: Cognitive Difficulty
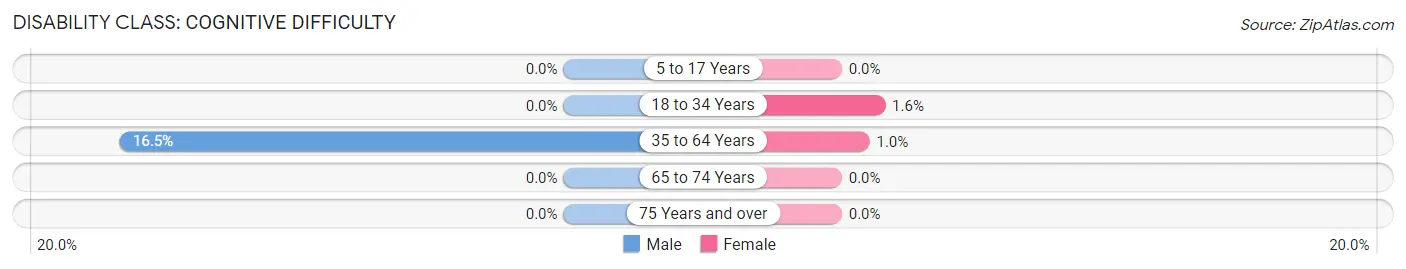
| Age Bracket | Male | Female |
| 5 to 17 Years | 0 (0.0%) | 0 (0.0%) |
| 18 to 34 Years | 0 (0.0%) | 1 (1.6%) |
| 35 to 64 Years | 53 (16.5%) | 2 (1.0%) |
| 65 to 74 Years | 0 (0.0%) | 0 (0.0%) |
| 75 Years and over | 0 (0.0%) | 0 (0.0%) |
Disability Class: Ambulatory Difficulty
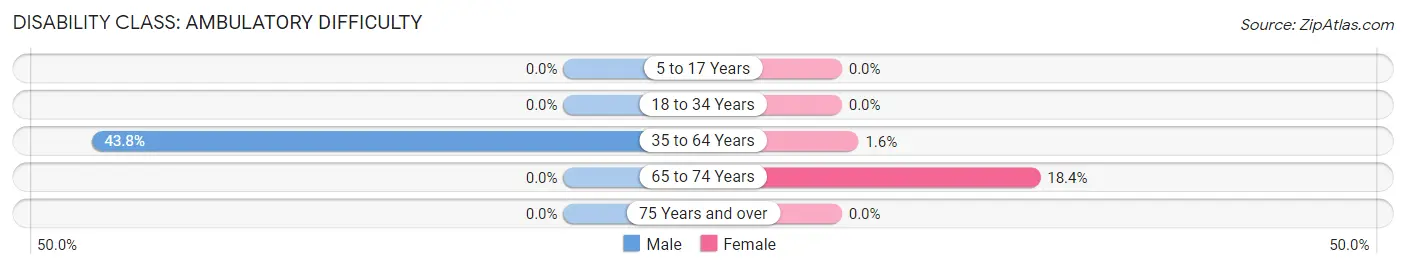
| Age Bracket | Male | Female |
| 5 to 17 Years | 0 (0.0%) | 0 (0.0%) |
| 18 to 34 Years | 0 (0.0%) | 0 (0.0%) |
| 35 to 64 Years | 141 (43.8%) | 3 (1.5%) |
| 65 to 74 Years | 0 (0.0%) | 7 (18.4%) |
| 75 Years and over | 0 (0.0%) | 0 (0.0%) |
Disability Class: Self-Care Difficulty
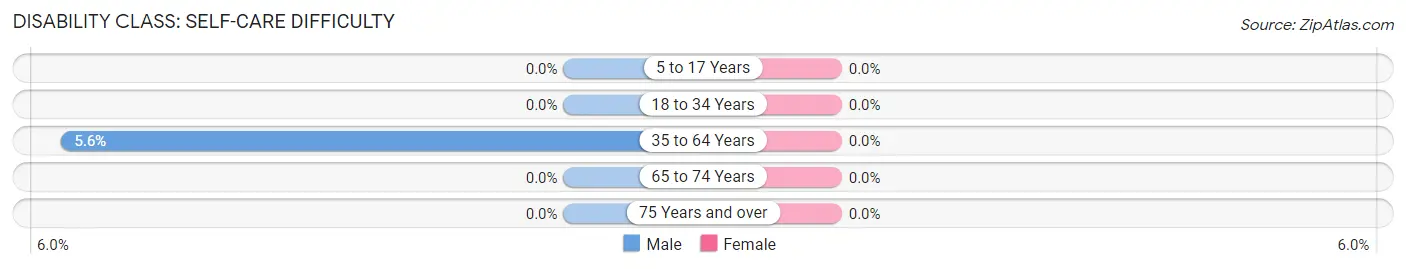
| Age Bracket | Male | Female |
| 5 to 17 Years | 0 (0.0%) | 0 (0.0%) |
| 18 to 34 Years | 0 (0.0%) | 0 (0.0%) |
| 35 to 64 Years | 18 (5.6%) | 0 (0.0%) |
| 65 to 74 Years | 0 (0.0%) | 0 (0.0%) |
| 75 Years and over | 0 (0.0%) | 0 (0.0%) |
Technology Access in Greenville
Computing Device Access in Greenville
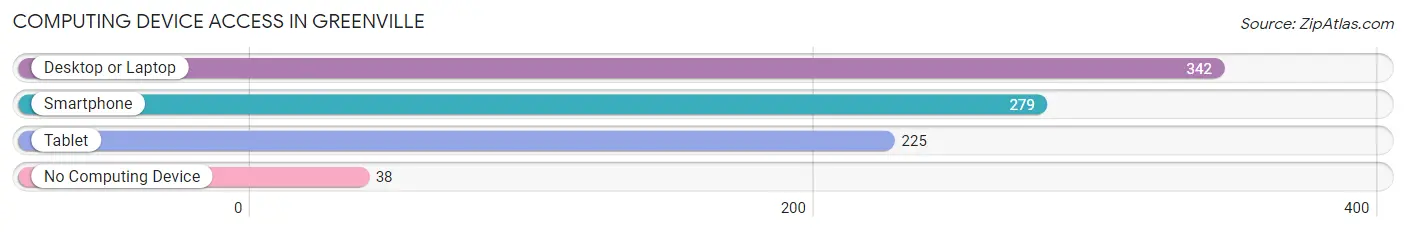
| Device Type | # Households | % Households |
| Desktop or Laptop | 342 | 80.1% |
| Smartphone | 279 | 65.3% |
| Tablet | 225 | 52.7% |
| No Computing Device | 38 | 8.9% |
| Total | 427 | 100.0% |
Internet Access in Greenville
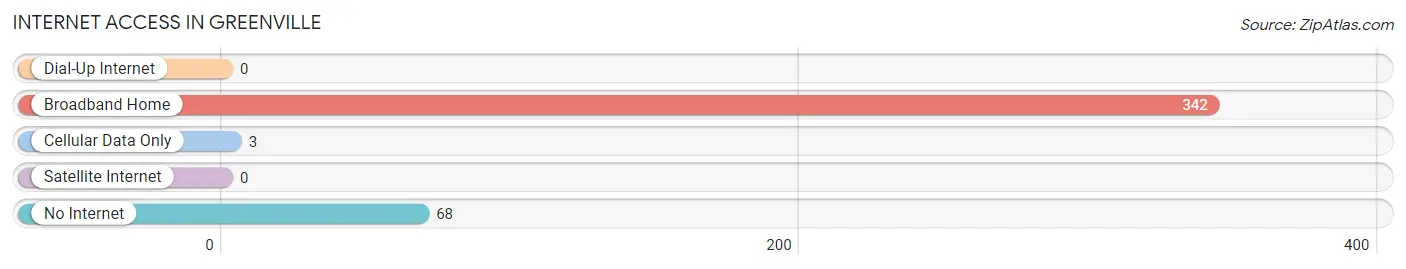
| Internet Type | # Households | % Households |
| Dial-Up Internet | 0 | 0.0% |
| Broadband Home | 342 | 80.1% |
| Cellular Data Only | 3 | 0.7% |
| Satellite Internet | 0 | 0.0% |
| No Internet | 68 | 15.9% |
| Total | 427 | 100.0% |
Greenville Summary
Greenville, Maine is a small town located in Piscataquis County, in the state of Maine. It is situated on the banks of the Moosehead Lake, the largest lake in the state. The town has a population of 1,641 people, according to the 2010 census.
History
Greenville was first settled in 1803 by a group of settlers from Massachusetts. The town was named after General Nathanael Greene, a Revolutionary War hero. The town was incorporated in 1816.
In the early 19th century, Greenville was a thriving lumber town. The town was home to several sawmills and gristmills, and the lumber industry was the main source of income for the town. The lumber industry declined in the late 19th century, and the town shifted its focus to tourism.
Geography
Greenville is located in the western part of Piscataquis County, in the state of Maine. The town is situated on the banks of the Moosehead Lake, the largest lake in the state. The town is bordered by the towns of Shirley, Beaver Cove, and Rockwood.
The town has a total area of 24.2 square miles, of which 23.7 square miles is land and 0.5 square miles is water. The town is located in the Appalachian Mountains, and the terrain is mostly mountainous and heavily forested.
Economy
Greenville’s economy is largely based on tourism. The town is a popular destination for outdoor recreation, such as fishing, hunting, camping, and hiking. The town is also home to several resorts and lodges, which attract visitors from all over the world.
The town is also home to several small businesses, such as restaurants, shops, and galleries. The town is also home to several manufacturing companies, such as paper mills and woodworking companies.
Demographics
According to the 2010 census, Greenville has a population of 1,641 people. The town has a median household income of $37,917, and the median age is 44.7 years. The town is predominantly white, with 95.3% of the population identifying as white. The town also has a small Native American population, with 1.2% of the population identifying as Native American.
Conclusion
Greenville, Maine is a small town located in Piscataquis County, in the state of Maine. The town has a population of 1,641 people, according to the 2010 census. The town’s economy is largely based on tourism, and the town is a popular destination for outdoor recreation. The town is predominantly white, with 95.3% of the population identifying as white. Greenville is a small town with a rich history and a vibrant economy.
Common Questions
What is Per Capita Income in Greenville?
Per Capita income in Greenville is $32,207.
What is the Median Family Income in Greenville?
Median Family Income in Greenville is $59,239.
What is the Median Household income in Greenville?
Median Household Income in Greenville is $53,068.
What is Income or Wage Gap in Greenville?
Income or Wage Gap in Greenville is 3.3%.
Women in Greenville earn 96.7 cents for every dollar earned by a man.
What is Inequality or Gini Index in Greenville?
Inequality or Gini Index in Greenville is 0.41.
What is the Total Population of Greenville?
Total Population of Greenville is 972.
What is the Total Male Population of Greenville?
Total Male Population of Greenville is 535.
What is the Total Female Population of Greenville?
Total Female Population of Greenville is 437.
What is the Ratio of Males per 100 Females in Greenville?
There are 122.43 Males per 100 Females in Greenville.
What is the Ratio of Females per 100 Males in Greenville?
There are 81.68 Females per 100 Males in Greenville.
What is the Median Population Age in Greenville?
Median Population Age in Greenville is 59.9 Years.
What is the Average Family Size in Greenville
Average Family Size in Greenville is 2.8 People.
What is the Average Household Size in Greenville
Average Household Size in Greenville is 2.2 People.
How Large is the Labor Force in Greenville?
There are 589 People in the Labor Forcein in Greenville.
What is the Percentage of People in the Labor Force in Greenville?
68.9% of People are in the Labor Force in Greenville.
What is the Unemployment Rate in Greenville?
Unemployment Rate in Greenville is 4.8%.