Kennebunkport, ME Map & Demographics
Kennebunkport Map
Kennebunkport Overview
$96,341
PER CAPITA INCOME
$114,904
AVG FAMILY INCOME
$113,456
AVG HOUSEHOLD INCOME
48.0%
WAGE / INCOME GAP [ % ]
52.0¢/ $1
WAGE / INCOME GAP [ $ ]
0.59
INEQUALITY / GINI INDEX
1,318
TOTAL POPULATION
688
MALE POPULATION
630
FEMALE POPULATION
109.21
MALES / 100 FEMALES
91.57
FEMALES / 100 MALES
61.3
MEDIAN AGE
2.6
AVG FAMILY SIZE
2.1
AVG HOUSEHOLD SIZE
565
LABOR FORCE [ PEOPLE ]
47.5%
PERCENT IN LABOR FORCE
8.1%
UNEMPLOYMENT RATE
Kennebunkport Zip Codes
Kennebunkport Area Codes
Income in Kennebunkport
Income Overview in Kennebunkport
Per Capita Income in Kennebunkport is $96,341, while median incomes of families and households are $114,904 and $113,456 respectively.
| Characteristic | Number | Measure |
| Per Capita Income | 1,318 | $96,341 |
| Median Family Income | 346 | $114,904 |
| Mean Family Income | 346 | $229,022 |
| Median Household Income | 628 | $113,456 |
| Mean Household Income | 628 | $204,761 |
| Income Deficit | 346 | $0 |
| Wage / Income Gap (%) | 1,318 | 48.02% |
| Wage / Income Gap ($) | 1,318 | 51.98¢ per $1 |
| Gini / Inequality Index | 1,318 | 0.59 |
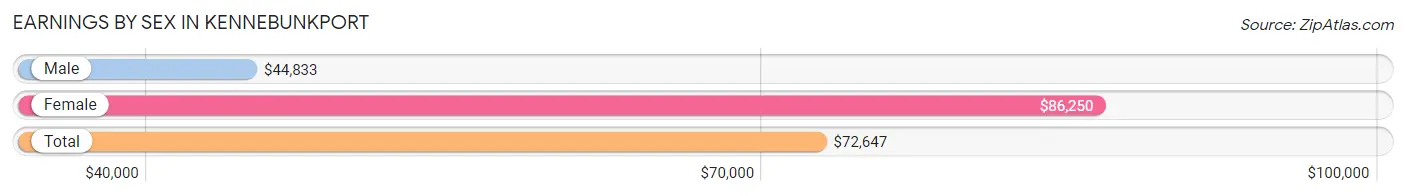
Earnings by Sex in Kennebunkport
Average Earnings in Kennebunkport are $72,647, $44,833 for men and $86,250 for women, a difference of 48.0%.
| Sex | Number | Average Earnings |
| Male | 312 (49.1%) | $44,833 |
| Female | 324 (50.9%) | $86,250 |
| Total | 636 (100.0%) | $72,647 |
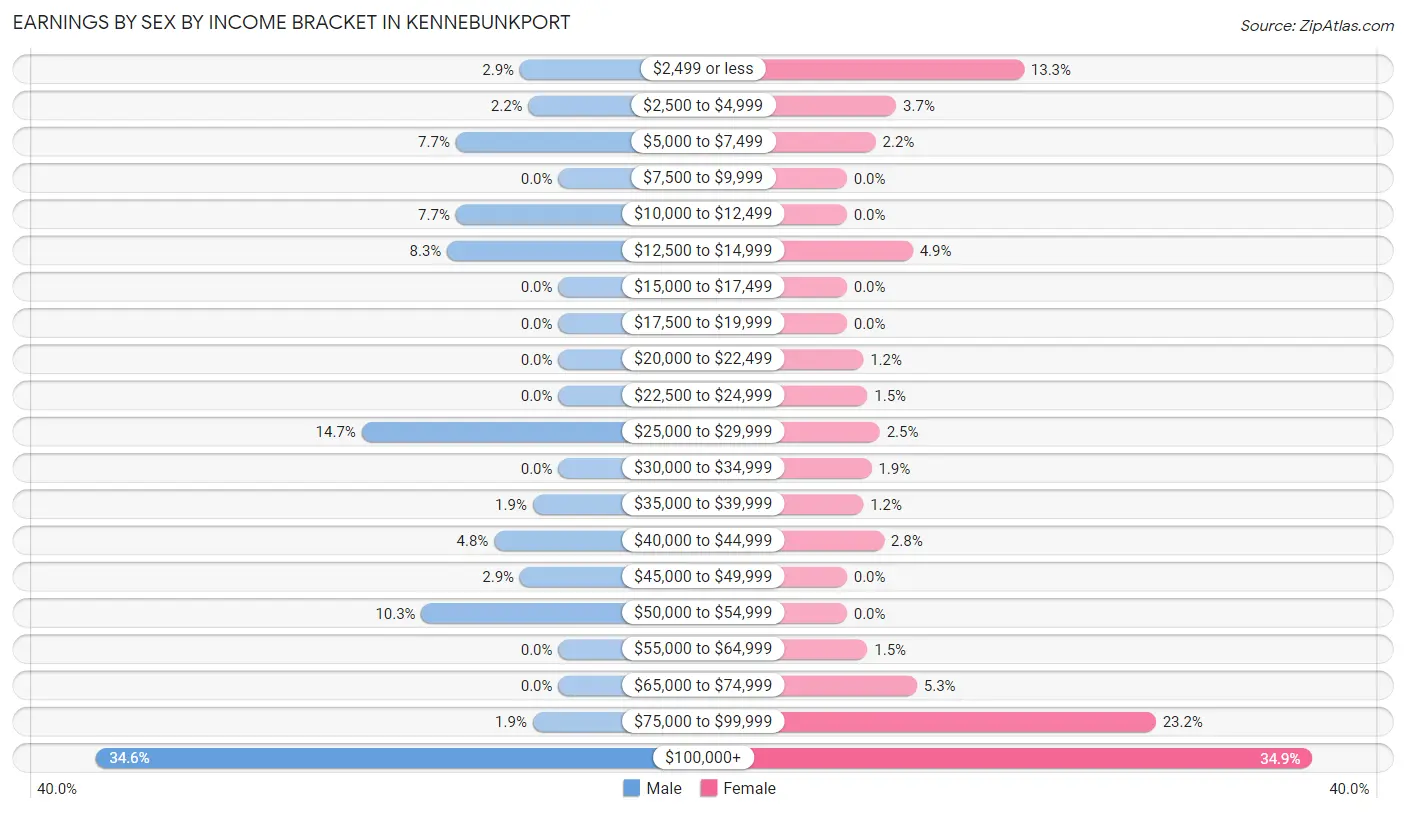
Earnings by Sex by Income Bracket in Kennebunkport
The most common earnings brackets in Kennebunkport are $100,000+ for men (108 | 34.6%) and $100,000+ for women (113 | 34.9%).
| Income | Male | Female |
| $2,499 or less | 9 (2.9%) | 43 (13.3%) |
| $2,500 to $4,999 | 7 (2.2%) | 12 (3.7%) |
| $5,000 to $7,499 | 24 (7.7%) | 7 (2.2%) |
| $7,500 to $9,999 | 0 (0.0%) | 0 (0.0%) |
| $10,000 to $12,499 | 24 (7.7%) | 0 (0.0%) |
| $12,500 to $14,999 | 26 (8.3%) | 16 (4.9%) |
| $15,000 to $17,499 | 0 (0.0%) | 0 (0.0%) |
| $17,500 to $19,999 | 0 (0.0%) | 0 (0.0%) |
| $20,000 to $22,499 | 0 (0.0%) | 4 (1.2%) |
| $22,500 to $24,999 | 0 (0.0%) | 5 (1.5%) |
| $25,000 to $29,999 | 46 (14.7%) | 8 (2.5%) |
| $30,000 to $34,999 | 0 (0.0%) | 6 (1.8%) |
| $35,000 to $39,999 | 6 (1.9%) | 4 (1.2%) |
| $40,000 to $44,999 | 15 (4.8%) | 9 (2.8%) |
| $45,000 to $49,999 | 9 (2.9%) | 0 (0.0%) |
| $50,000 to $54,999 | 32 (10.3%) | 0 (0.0%) |
| $55,000 to $64,999 | 0 (0.0%) | 5 (1.5%) |
| $65,000 to $74,999 | 0 (0.0%) | 17 (5.2%) |
| $75,000 to $99,999 | 6 (1.9%) | 75 (23.2%) |
| $100,000+ | 108 (34.6%) | 113 (34.9%) |
| Total | 312 (100.0%) | 324 (100.0%) |
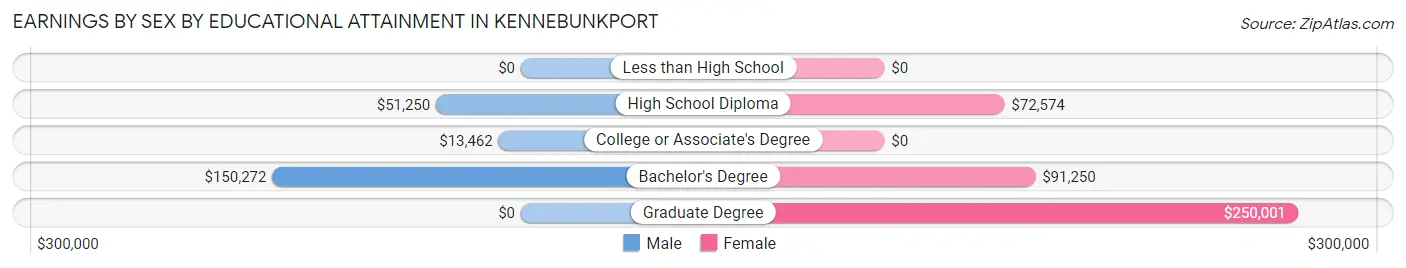
Earnings by Sex by Educational Attainment in Kennebunkport
Average earnings in Kennebunkport are $44,833 for men and $86,995 for women, a difference of 48.5%. Men with an educational attainment of bachelor's degree enjoy the highest average annual earnings of $150,272, while those with college or associate's degree education earn the least with $13,462. Women with an educational attainment of graduate degree earn the most with the average annual earnings of $250,001, while those with high school diploma education have the smallest earnings of $72,574.
| Educational Attainment | Male Income | Female Income |
| Less than High School | - | - |
| High School Diploma | $51,250 | $72,574 |
| College or Associate's Degree | $13,462 | $0 |
| Bachelor's Degree | $150,272 | $91,250 |
| Graduate Degree | - | - |
| Total | $44,833 | $86,995 |
Family Income in Kennebunkport
Family Income Brackets in Kennebunkport
According to the Kennebunkport family income data, there are 125 families falling into the $200,000+ income range, which is the most common income bracket and makes up 36.1% of all families.
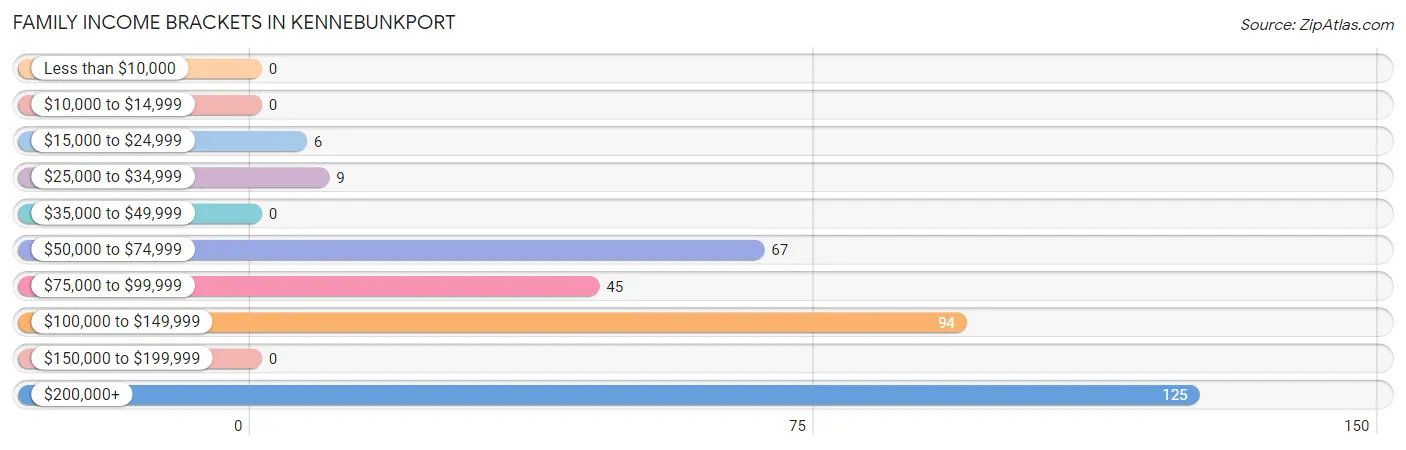
| Income Bracket | # Families | % Families |
| Less than $10,000 | 0 | 0.0% |
| $10,000 to $14,999 | 0 | 0.0% |
| $15,000 to $24,999 | 6 | 1.7% |
| $25,000 to $34,999 | 9 | 2.6% |
| $35,000 to $49,999 | 0 | 0.0% |
| $50,000 to $74,999 | 67 | 19.4% |
| $75,000 to $99,999 | 45 | 13.0% |
| $100,000 to $149,999 | 94 | 27.2% |
| $150,000 to $199,999 | 0 | 0.0% |
| $200,000+ | 125 | 36.1% |
Family Income by Famaliy Size in Kennebunkport
2-person families (233 | 67.3%) account for the highest median family income in Kennebunkport with $95,781 per family, while 2-person families (233 | 67.3%) have the highest median income of $47,890 per family member.
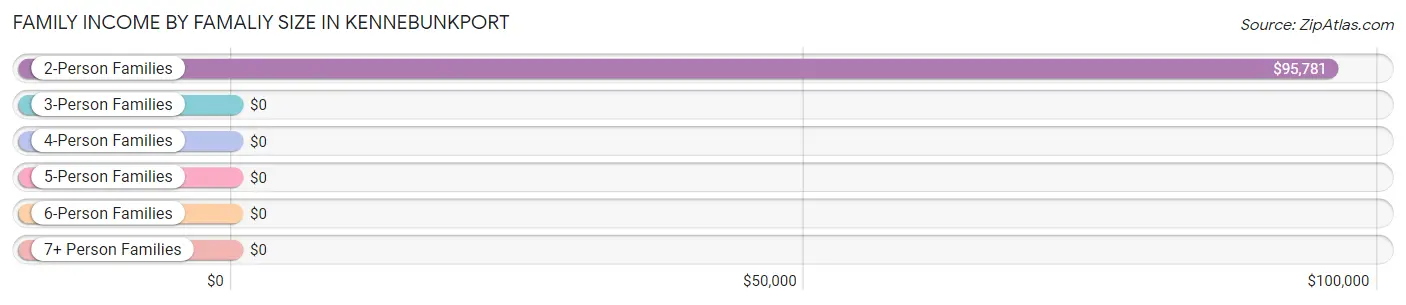
| Income Bracket | # Families | Median Income |
| 2-Person Families | 233 (67.3%) | $95,781 |
| 3-Person Families | 89 (25.7%) | $0 |
| 4-Person Families | 0 (0.0%) | $0 |
| 5-Person Families | 0 (0.0%) | $0 |
| 6-Person Families | 24 (6.9%) | $0 |
| 7+ Person Families | 0 (0.0%) | $0 |
| Total | 346 (100.0%) | $114,904 |
Family Income by Number of Earners in Kennebunkport
The median family income in Kennebunkport is $114,904, with families comprising 2 earners (105) having the highest median family income of $235,299, while families with no earners (93) have the lowest median family income of $75,724, accounting for 30.3% and 26.9% of families, respectively.
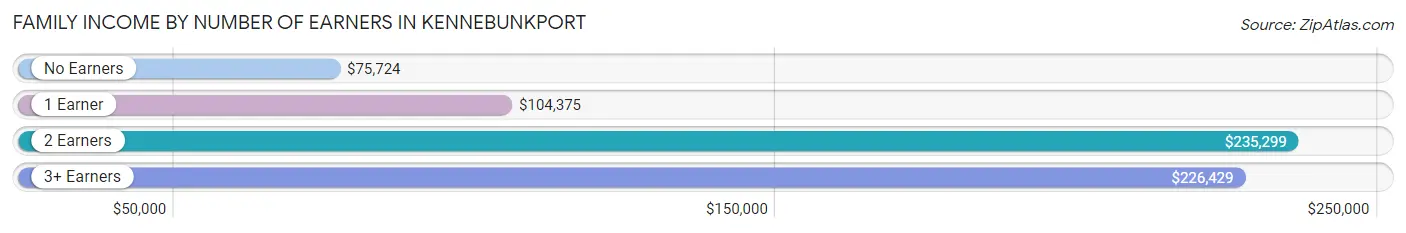
| Number of Earners | # Families | Median Income |
| No Earners | 93 (26.9%) | $75,724 |
| 1 Earner | 94 (27.2%) | $104,375 |
| 2 Earners | 105 (30.3%) | $235,299 |
| 3+ Earners | 54 (15.6%) | $226,429 |
| Total | 346 (100.0%) | $114,904 |
Household Income in Kennebunkport
Household Income Brackets in Kennebunkport
With 205 households falling in the category, the $100,000 to $149,999 income range is the most frequent in Kennebunkport, accounting for 32.6% of all households.
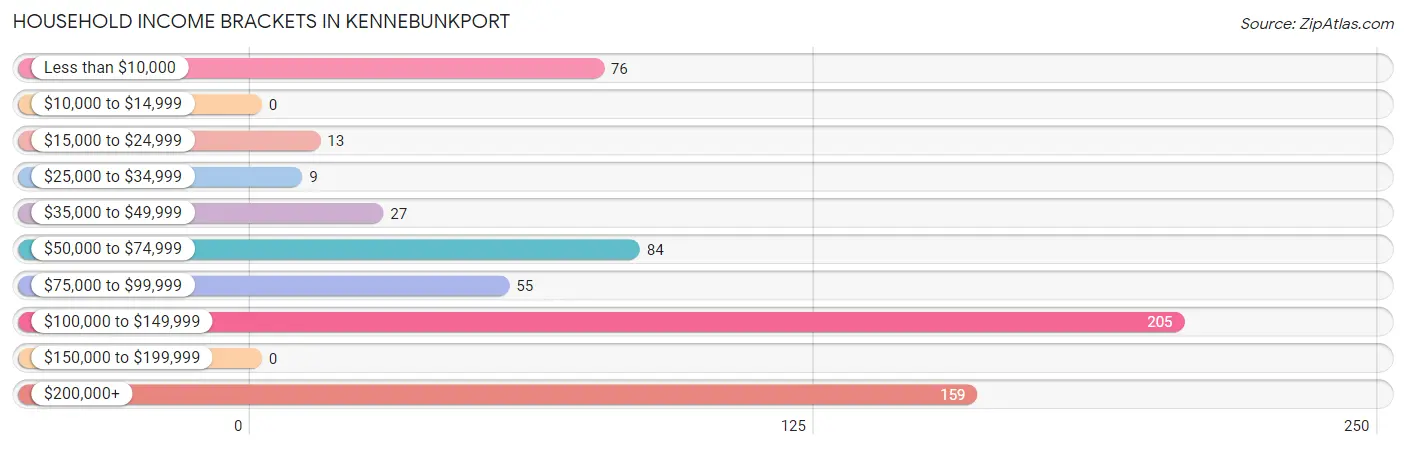
| Income Bracket | # Households | % Households |
| Less than $10,000 | 76 | 12.1% |
| $10,000 to $14,999 | 0 | 0.0% |
| $15,000 to $24,999 | 13 | 2.1% |
| $25,000 to $34,999 | 9 | 1.4% |
| $35,000 to $49,999 | 27 | 4.3% |
| $50,000 to $74,999 | 84 | 13.4% |
| $75,000 to $99,999 | 55 | 8.8% |
| $100,000 to $149,999 | 205 | 32.6% |
| $150,000 to $199,999 | 0 | 0.0% |
| $200,000+ | 159 | 25.3% |
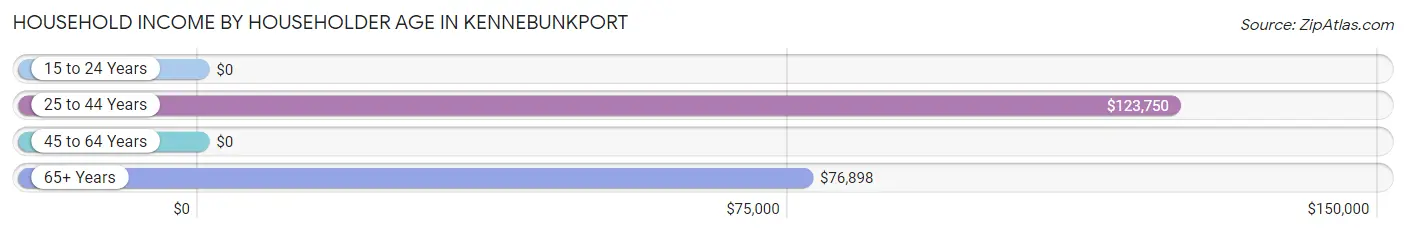
Household Income by Householder Age in Kennebunkport
The median household income in Kennebunkport is $113,456, with the highest median household income of $123,750 found in the 25 to 44 years age bracket for the primary householder. A total of 48 households (7.6%) fall into this category. Meanwhile, the 15 to 24 years age bracket for the primary householder has the lowest median household income of $0, with 16 households (2.5%) in this group.
| Income Bracket | # Households | Median Income |
| 15 to 24 Years | 16 (2.5%) | $0 |
| 25 to 44 Years | 48 (7.6%) | $123,750 |
| 45 to 64 Years | 261 (41.6%) | $0 |
| 65+ Years | 303 (48.2%) | $76,898 |
| Total | 628 (100.0%) | $113,456 |
Poverty in Kennebunkport
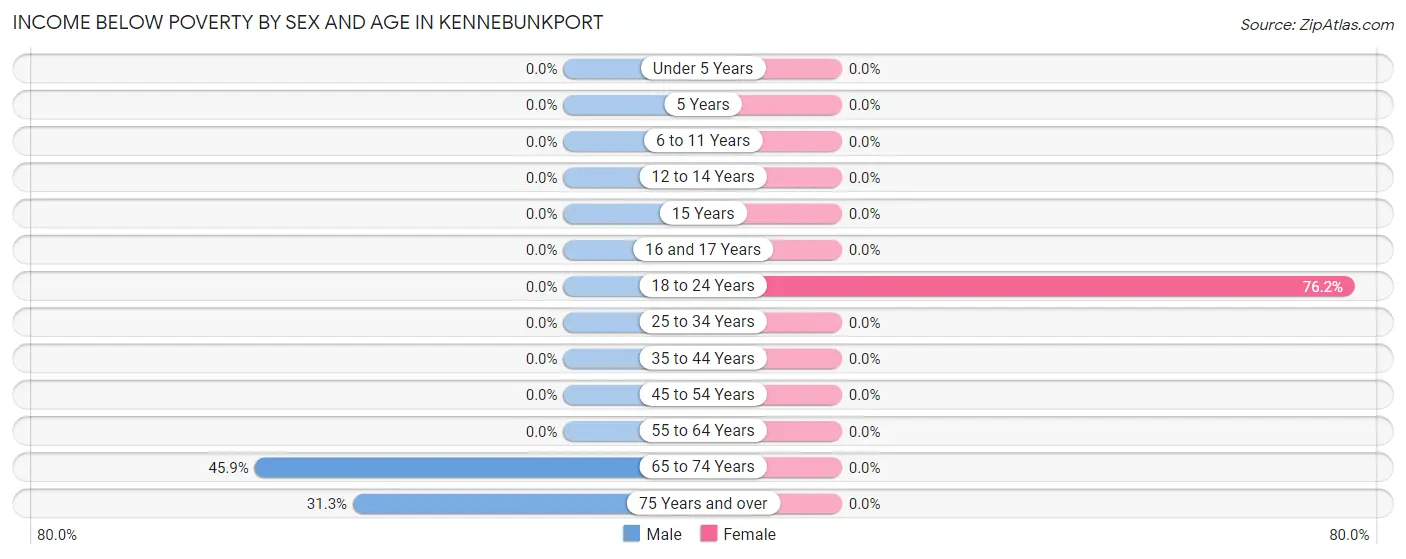
Income Below Poverty by Sex and Age in Kennebunkport
With 19.2% poverty level for males and 2.5% for females among the residents of Kennebunkport, 65 to 74 year old males and 18 to 24 year old females are the most vulnerable to poverty, with 72 males (45.9%) and 16 females (76.2%) in their respective age groups living below the poverty level.
| Age Bracket | Male | Female |
| Under 5 Years | 0 (0.0%) | 0 (0.0%) |
| 5 Years | 0 (0.0%) | 0 (0.0%) |
| 6 to 11 Years | 0 (0.0%) | 0 (0.0%) |
| 12 to 14 Years | 0 (0.0%) | 0 (0.0%) |
| 15 Years | 0 (0.0%) | 0 (0.0%) |
| 16 and 17 Years | 0 (0.0%) | 0 (0.0%) |
| 18 to 24 Years | 0 (0.0%) | 16 (76.2%) |
| 25 to 34 Years | 0 (0.0%) | 0 (0.0%) |
| 35 to 44 Years | 0 (0.0%) | 0 (0.0%) |
| 45 to 54 Years | 0 (0.0%) | 0 (0.0%) |
| 55 to 64 Years | 0 (0.0%) | 0 (0.0%) |
| 65 to 74 Years | 72 (45.9%) | 0 (0.0%) |
| 75 Years and over | 60 (31.2%) | 0 (0.0%) |
| Total | 132 (19.2%) | 16 (2.5%) |
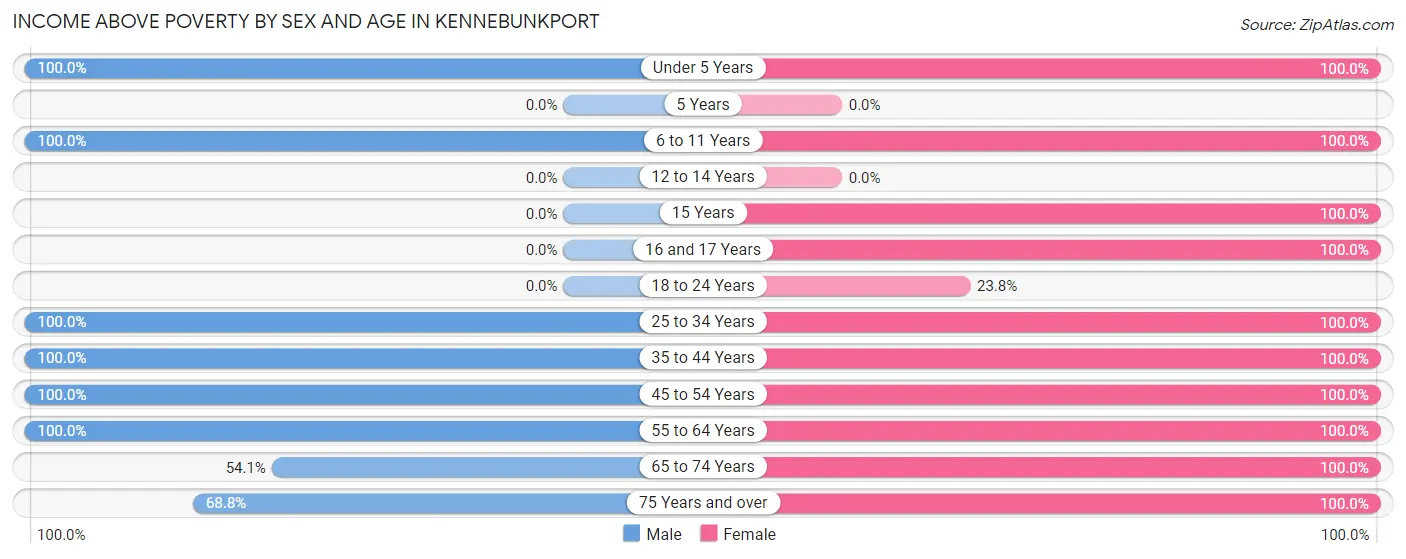
Income Above Poverty by Sex and Age in Kennebunkport
According to the poverty statistics in Kennebunkport, males aged under 5 years and females aged under 5 years are the age groups that are most secure financially, with 100.0% of males and 100.0% of females in these age groups living above the poverty line.
| Age Bracket | Male | Female |
| Under 5 Years | 28 (100.0%) | 25 (100.0%) |
| 5 Years | 0 (0.0%) | 0 (0.0%) |
| 6 to 11 Years | 29 (100.0%) | 27 (100.0%) |
| 12 to 14 Years | 0 (0.0%) | 0 (0.0%) |
| 15 Years | 0 (0.0%) | 19 (100.0%) |
| 16 and 17 Years | 0 (0.0%) | 26 (100.0%) |
| 18 to 24 Years | 0 (0.0%) | 5 (23.8%) |
| 25 to 34 Years | 44 (100.0%) | 3 (100.0%) |
| 35 to 44 Years | 68 (100.0%) | 61 (100.0%) |
| 45 to 54 Years | 81 (100.0%) | 118 (100.0%) |
| 55 to 64 Years | 89 (100.0%) | 132 (100.0%) |
| 65 to 74 Years | 85 (54.1%) | 69 (100.0%) |
| 75 Years and over | 132 (68.8%) | 129 (100.0%) |
| Total | 556 (80.8%) | 614 (97.5%) |
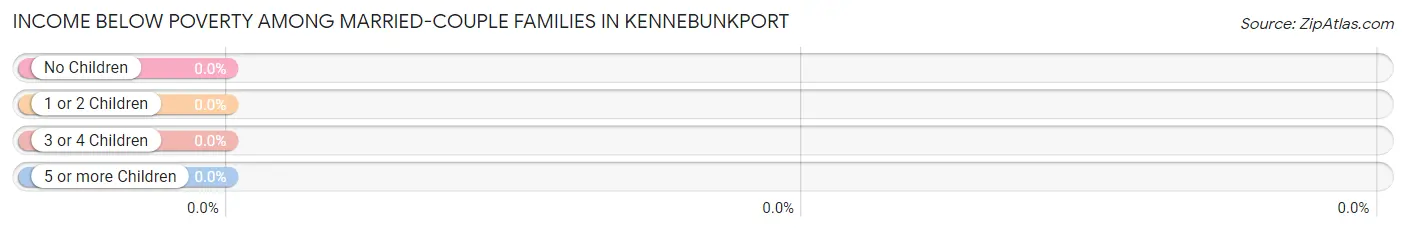
Income Below Poverty Among Married-Couple Families in Kennebunkport
| Children | Above Poverty | Below Poverty |
| No Children | 239 (100.0%) | 0 (0.0%) |
| 1 or 2 Children | 24 (100.0%) | 0 (0.0%) |
| 3 or 4 Children | 24 (100.0%) | 0 (0.0%) |
| 5 or more Children | 0 (0.0%) | 0 (0.0%) |
| Total | 287 (100.0%) | 0 (0.0%) |
Income Below Poverty Among Single-Parent Households in Kennebunkport
| Children | Single Father | Single Mother |
| No Children | 0 (0.0%) | 0 (0.0%) |
| 1 or 2 Children | 0 (0.0%) | 0 (0.0%) |
| 3 or 4 Children | 0 (0.0%) | 0 (0.0%) |
| 5 or more Children | 0 (0.0%) | 0 (0.0%) |
| Total | 0 (0.0%) | 0 (0.0%) |
Income Below Poverty Among Married-Couple vs Single-Parent Households in Kennebunkport
| Children | Married-Couple Families | Single-Parent Households |
| No Children | 0 (0.0%) | 0 (0.0%) |
| 1 or 2 Children | 0 (0.0%) | 0 (0.0%) |
| 3 or 4 Children | 0 (0.0%) | 0 (0.0%) |
| 5 or more Children | 0 (0.0%) | 0 (0.0%) |
| Total | 0 (0.0%) | 0 (0.0%) |
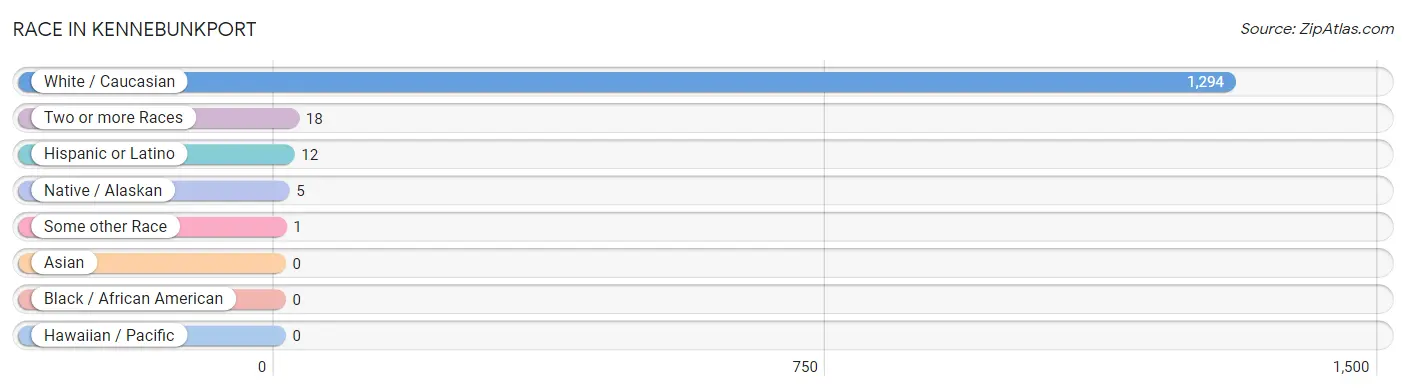
Race in Kennebunkport
The most populous races in Kennebunkport are White / Caucasian (1,294 | 98.2%), Two or more Races (18 | 1.4%), and Hispanic or Latino (12 | 0.9%).
| Race | # Population | % Population |
| Asian | 0 | 0.0% |
| Black / African American | 0 | 0.0% |
| Hawaiian / Pacific | 0 | 0.0% |
| Hispanic or Latino | 12 | 0.9% |
| Native / Alaskan | 5 | 0.4% |
| White / Caucasian | 1,294 | 98.2% |
| Two or more Races | 18 | 1.4% |
| Some other Race | 1 | 0.1% |
| Total | 1,318 | 100.0% |
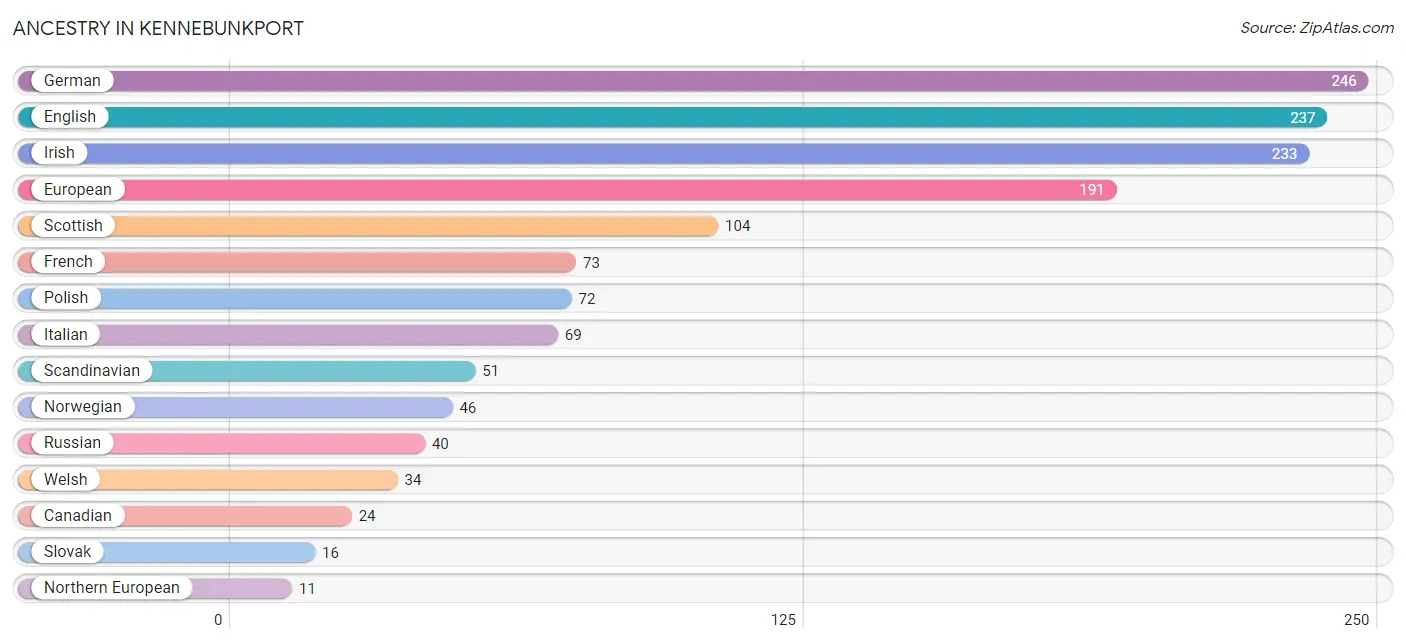
Ancestry in Kennebunkport
The most populous ancestries reported in Kennebunkport are German (246 | 18.7%), English (237 | 18.0%), Irish (233 | 17.7%), European (191 | 14.5%), and Scottish (104 | 7.9%), together accounting for 76.7% of all Kennebunkport residents.
| Ancestry | # Population | % Population |
| American | 8 | 0.6% |
| Canadian | 24 | 1.8% |
| Central American | 1 | 0.1% |
| Cherokee | 1 | 0.1% |
| Danish | 5 | 0.4% |
| English | 237 | 18.0% |
| European | 191 | 14.5% |
| French | 73 | 5.5% |
| French Canadian | 7 | 0.5% |
| German | 246 | 18.7% |
| Honduran | 1 | 0.1% |
| Irish | 233 | 17.7% |
| Italian | 69 | 5.2% |
| Latvian | 3 | 0.2% |
| Lithuanian | 5 | 0.4% |
| Northern European | 11 | 0.8% |
| Norwegian | 46 | 3.5% |
| Polish | 72 | 5.5% |
| Portuguese | 4 | 0.3% |
| Puerto Rican | 11 | 0.8% |
| Russian | 40 | 3.0% |
| Scandinavian | 51 | 3.9% |
| Scottish | 104 | 7.9% |
| Slovak | 16 | 1.2% |
| Welsh | 34 | 2.6% | View All 25 Rows |
Immigrants in Kennebunkport
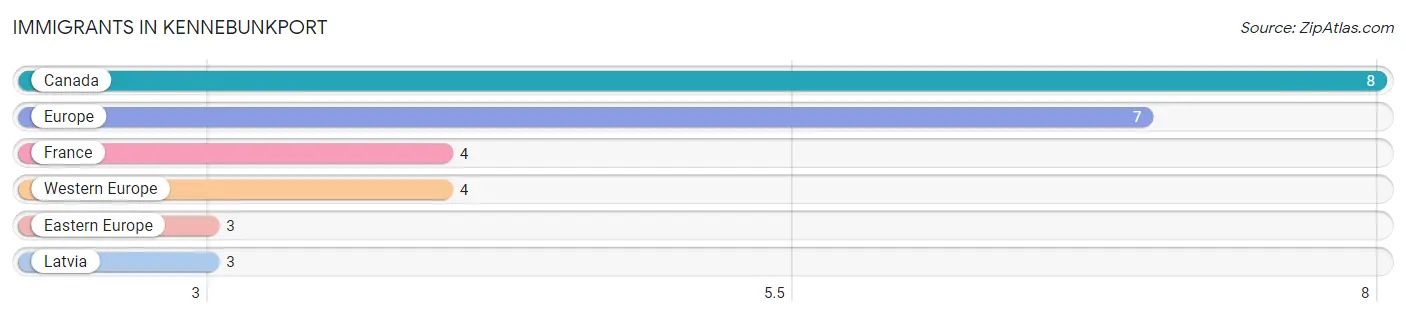
The most numerous immigrant groups reported in Kennebunkport came from Canada (8 | 0.6%), Europe (7 | 0.5%), France (4 | 0.3%), Western Europe (4 | 0.3%), and Eastern Europe (3 | 0.2%), together accounting for 2.0% of all Kennebunkport residents.
| Immigration Origin | # Population | % Population |
| Canada | 8 | 0.6% |
| Eastern Europe | 3 | 0.2% |
| Europe | 7 | 0.5% |
| France | 4 | 0.3% |
| Latvia | 3 | 0.2% |
| Western Europe | 4 | 0.3% | View All 6 Rows |
Sex and Age in Kennebunkport
Sex and Age in Kennebunkport
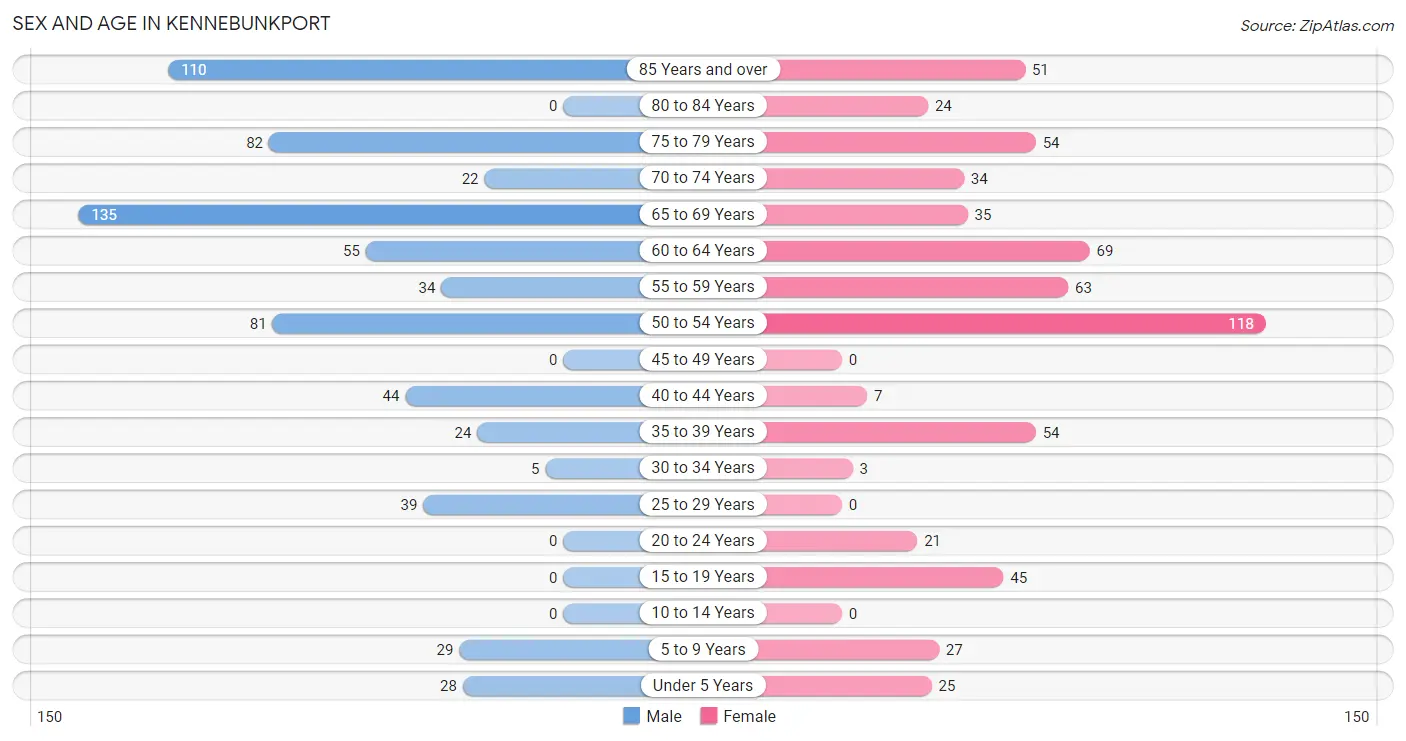
The most populous age groups in Kennebunkport are 65 to 69 Years (135 | 19.6%) for men and 50 to 54 Years (118 | 18.7%) for women.
| Age Bracket | Male | Female |
| Under 5 Years | 28 (4.1%) | 25 (4.0%) |
| 5 to 9 Years | 29 (4.2%) | 27 (4.3%) |
| 10 to 14 Years | 0 (0.0%) | 0 (0.0%) |
| 15 to 19 Years | 0 (0.0%) | 45 (7.1%) |
| 20 to 24 Years | 0 (0.0%) | 21 (3.3%) |
| 25 to 29 Years | 39 (5.7%) | 0 (0.0%) |
| 30 to 34 Years | 5 (0.7%) | 3 (0.5%) |
| 35 to 39 Years | 24 (3.5%) | 54 (8.6%) |
| 40 to 44 Years | 44 (6.4%) | 7 (1.1%) |
| 45 to 49 Years | 0 (0.0%) | 0 (0.0%) |
| 50 to 54 Years | 81 (11.8%) | 118 (18.7%) |
| 55 to 59 Years | 34 (4.9%) | 63 (10.0%) |
| 60 to 64 Years | 55 (8.0%) | 69 (11.0%) |
| 65 to 69 Years | 135 (19.6%) | 35 (5.6%) |
| 70 to 74 Years | 22 (3.2%) | 34 (5.4%) |
| 75 to 79 Years | 82 (11.9%) | 54 (8.6%) |
| 80 to 84 Years | 0 (0.0%) | 24 (3.8%) |
| 85 Years and over | 110 (16.0%) | 51 (8.1%) |
| Total | 688 (100.0%) | 630 (100.0%) |
Families and Households in Kennebunkport
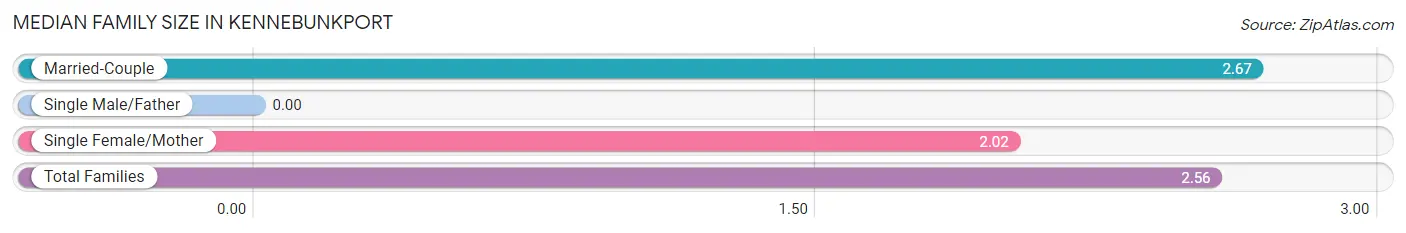
Median Family Size in Kennebunkport
| Family Type | # Families | Family Size |
| Married-Couple | 287 (83.0%) | 2.67 |
| Single Male/Father | 0 (0.0%) | - |
| Single Female/Mother | 59 (17.1%) | 2.02 |
| Total Families | 346 (100.0%) | 2.56 |
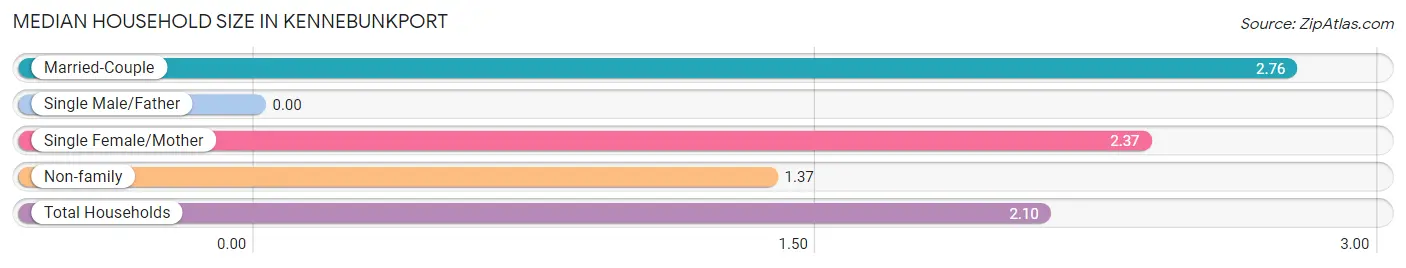
Median Household Size in Kennebunkport
| Household Type | # Households | Household Size |
| Married-Couple | 287 (45.7%) | 2.76 |
| Single Male/Father | 0 (0.0%) | - |
| Single Female/Mother | 59 (9.4%) | 2.37 |
| Non-family | 282 (44.9%) | 1.37 |
| Total Households | 628 (100.0%) | 2.10 |
Household Size by Marriage Status in Kennebunkport
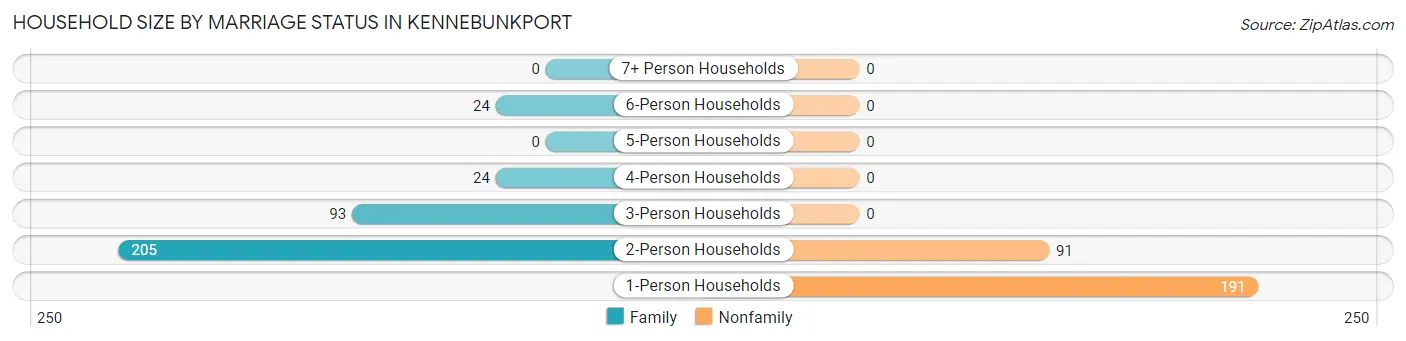
Out of a total of 628 households in Kennebunkport, 346 (55.1%) are family households, while 282 (44.9%) are nonfamily households. The most numerous type of family households are 2-person households, comprising 205, and the most common type of nonfamily households are 1-person households, comprising 191.
| Household Size | Family Households | Nonfamily Households |
| 1-Person Households | - | 191 (30.4%) |
| 2-Person Households | 205 (32.6%) | 91 (14.5%) |
| 3-Person Households | 93 (14.8%) | 0 (0.0%) |
| 4-Person Households | 24 (3.8%) | 0 (0.0%) |
| 5-Person Households | 0 (0.0%) | 0 (0.0%) |
| 6-Person Households | 24 (3.8%) | 0 (0.0%) |
| 7+ Person Households | 0 (0.0%) | 0 (0.0%) |
| Total | 346 (55.1%) | 282 (44.9%) |
Female Fertility in Kennebunkport
Fertility by Age in Kennebunkport
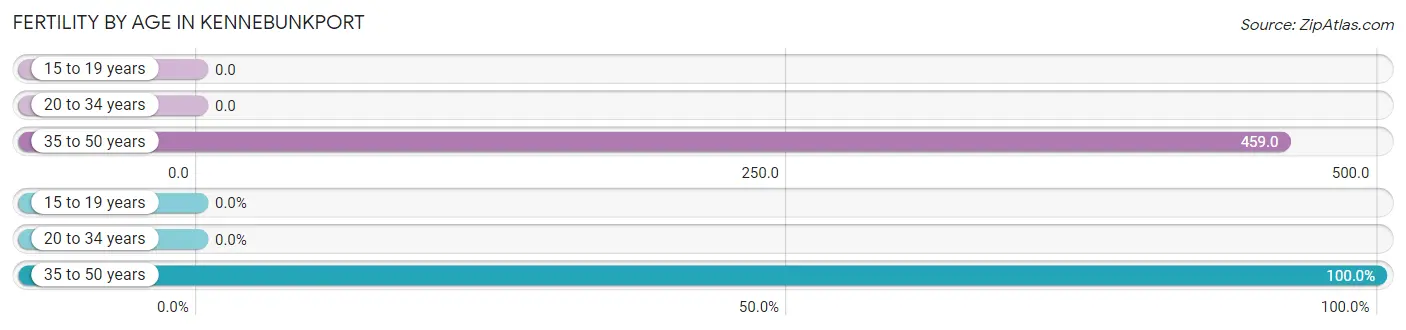
Average fertility rate in Kennebunkport is 215.0 births per 1,000 women. Women in the age bracket of 35 to 50 years have the highest fertility rate with 459.0 births per 1,000 women. Women in the age bracket of 35 to 50 years acount for 100.0% of all women with births.
| Age Bracket | Women with Births | Births / 1,000 Women |
| 15 to 19 years | 0 (0.0%) | 0.0 |
| 20 to 34 years | 0 (0.0%) | 0.0 |
| 35 to 50 years | 28 (100.0%) | 459.0 |
| Total | 28 (100.0%) | 215.0 |
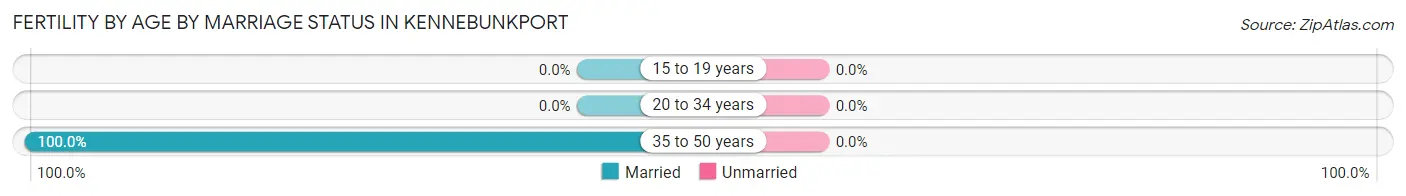
Fertility by Age by Marriage Status in Kennebunkport
| Age Bracket | Married | Unmarried |
| 15 to 19 years | 0 (0.0%) | 0 (0.0%) |
| 20 to 34 years | 0 (0.0%) | 0 (0.0%) |
| 35 to 50 years | 28 (100.0%) | 0 (0.0%) |
| Total | 28 (100.0%) | 0 (0.0%) |
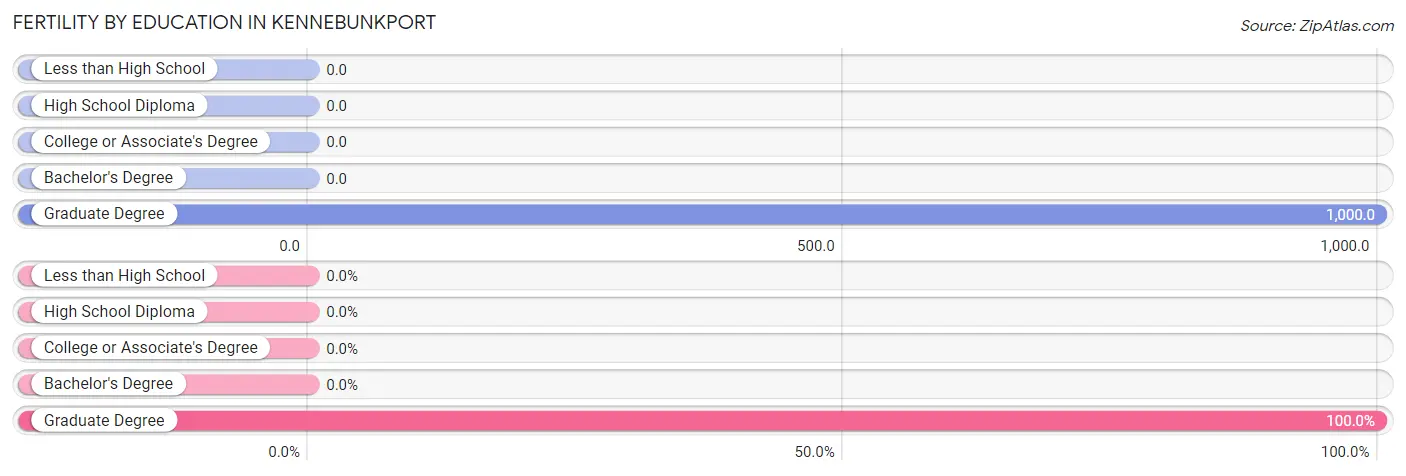
Fertility by Education in Kennebunkport
| Educational Attainment | Women with Births | Births / 1,000 Women |
| Less than High School | 0 (0.0%) | 0.0 |
| High School Diploma | 0 (0.0%) | 0.0 |
| College or Associate's Degree | 0 (0.0%) | 0.0 |
| Bachelor's Degree | 0 (0.0%) | 0.0 |
| Graduate Degree | 28 (100.0%) | 1,000.0 |
| Total | 28 (100.0%) | 215.0 |
Fertility by Education by Marriage Status in Kennebunkport
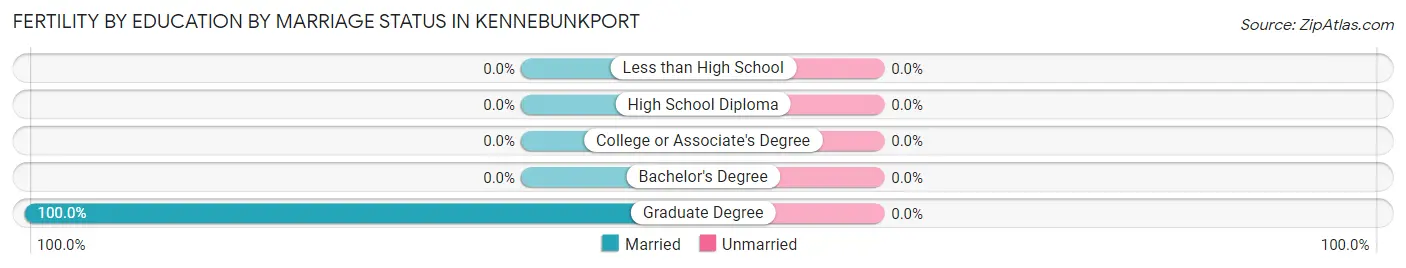
| Educational Attainment | Married | Unmarried |
| Less than High School | 0 (0.0%) | 0 (0.0%) |
| High School Diploma | 0 (0.0%) | 0 (0.0%) |
| College or Associate's Degree | 0 (0.0%) | 0 (0.0%) |
| Bachelor's Degree | 0 (0.0%) | 0 (0.0%) |
| Graduate Degree | 28 (100.0%) | 0 (0.0%) |
| Total | 28 (100.0%) | 0 (0.0%) |
Employment Characteristics in Kennebunkport
Employment by Class of Employer in Kennebunkport
Among the 519 employed individuals in Kennebunkport, private company employees (324 | 62.4%), self-employed (incorporated) (67 | 12.9%), and self-employed (not incorporated) (65 | 12.5%) make up the most common classes of employment.
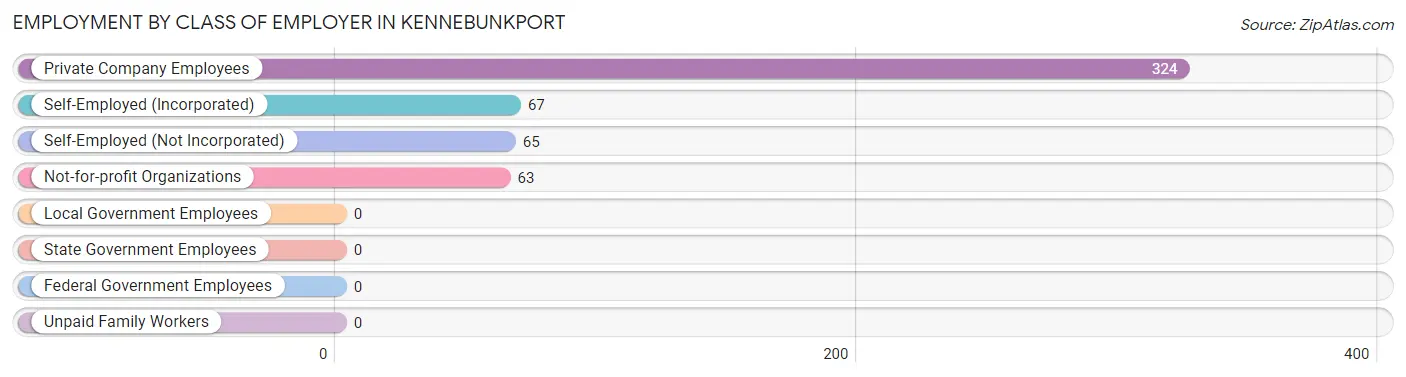
| Employer Class | # Employees | % Employees |
| Private Company Employees | 324 | 62.4% |
| Self-Employed (Incorporated) | 67 | 12.9% |
| Self-Employed (Not Incorporated) | 65 | 12.5% |
| Not-for-profit Organizations | 63 | 12.1% |
| Local Government Employees | 0 | 0.0% |
| State Government Employees | 0 | 0.0% |
| Federal Government Employees | 0 | 0.0% |
| Unpaid Family Workers | 0 | 0.0% |
| Total | 519 | 100.0% |
Employment Status by Age in Kennebunkport
According to the labor force statistics for Kennebunkport, out of the total population over 16 years of age (1,190), 47.5% or 565 individuals are in the labor force, with 8.1% or 46 of them unemployed. The age group with the highest labor force participation rate is 25 to 29 years, with 100.0% or 39 individuals in the labor force. Within the labor force, the 45 to 54 years age range has the highest percentage of unemployed individuals, with 28.2% or 46 of them being unemployed.
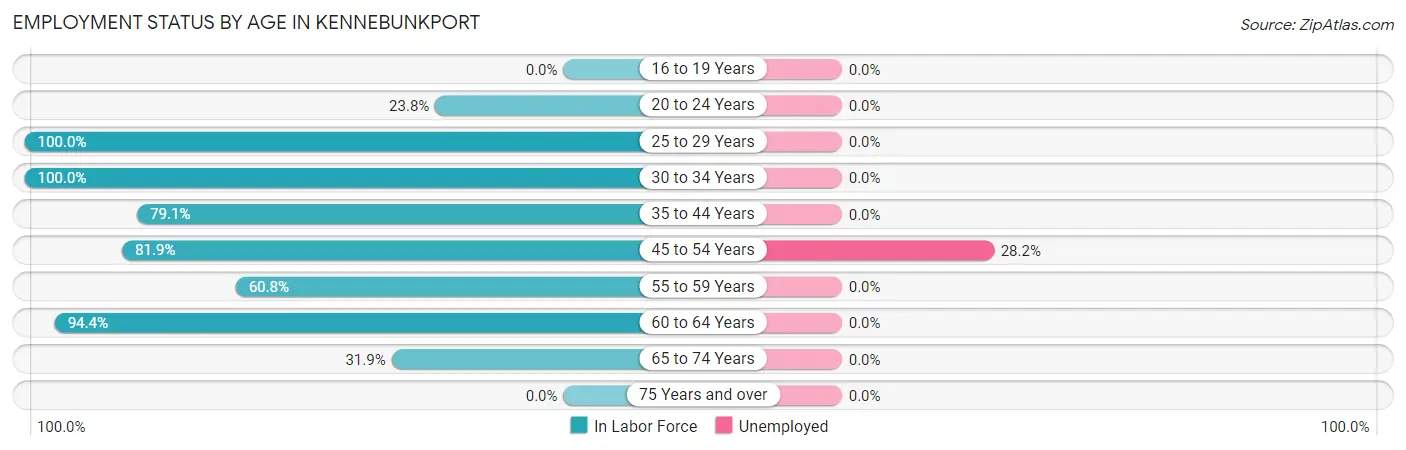
| Age Bracket | In Labor Force | Unemployed |
| 16 to 19 Years | 0 (0.0%) | 0 (0.0%) |
| 20 to 24 Years | 5 (23.8%) | 0 (0.0%) |
| 25 to 29 Years | 39 (100.0%) | 0 (0.0%) |
| 30 to 34 Years | 8 (100.0%) | 0 (0.0%) |
| 35 to 44 Years | 102 (79.1%) | 0 (0.0%) |
| 45 to 54 Years | 163 (81.9%) | 46 (28.2%) |
| 55 to 59 Years | 59 (60.8%) | 0 (0.0%) |
| 60 to 64 Years | 117 (94.4%) | 0 (0.0%) |
| 65 to 74 Years | 72 (31.9%) | 0 (0.0%) |
| 75 Years and over | 0 (0.0%) | 0 (0.0%) |
| Total | 565 (47.5%) | 46 (8.1%) |
Employment Status by Educational Attainment in Kennebunkport
According to labor force statistics for Kennebunkport, 81.9% of individuals (488) out of the total population between 25 and 64 years of age (596) are in the labor force, with 9.4% or 46 of them being unemployed. The group with the highest labor force participation rate are those with the educational attainment of college / associate degree, with 98.0% or 196 individuals in the labor force. Within the labor force, individuals with bachelor's degree or higher education have the highest percentage of unemployment, with 17.1% or 46 of them being unemployed.
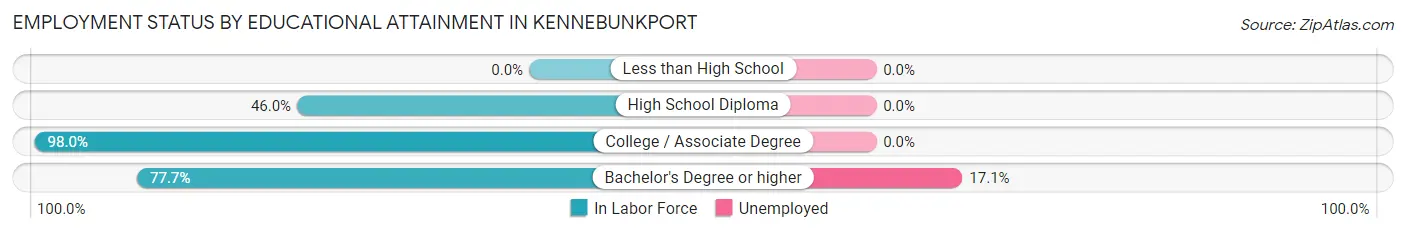
| Educational Attainment | In Labor Force | Unemployed |
| Less than High School | 0 (0.0%) | 0 (0.0%) |
| High School Diploma | 23 (46.0%) | 0 (0.0%) |
| College / Associate Degree | 196 (98.0%) | 0 (0.0%) |
| Bachelor's Degree or higher | 269 (77.7%) | 59 (17.1%) |
| Total | 488 (81.9%) | 56 (9.4%) |
Employment Occupations by Sex in Kennebunkport
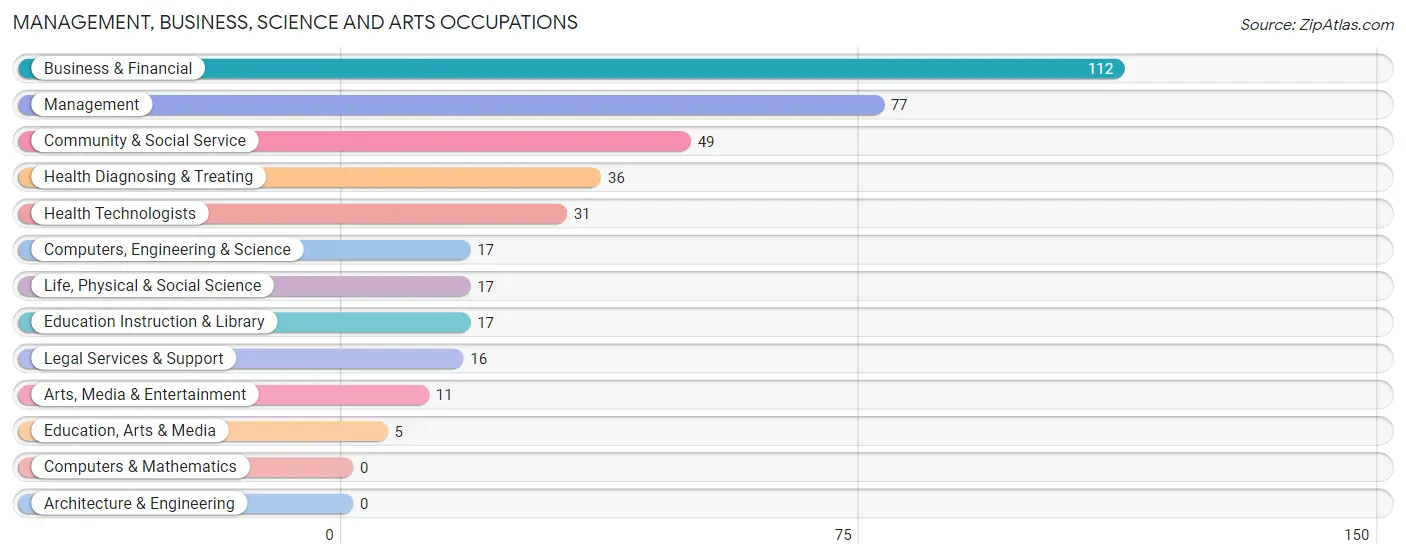
Management, Business, Science and Arts Occupations
The most common Management, Business, Science and Arts occupations in Kennebunkport are Business & Financial (112 | 21.6%), Management (77 | 14.8%), Community & Social Service (49 | 9.4%), Health Diagnosing & Treating (36 | 6.9%), and Health Technologists (31 | 6.0%).
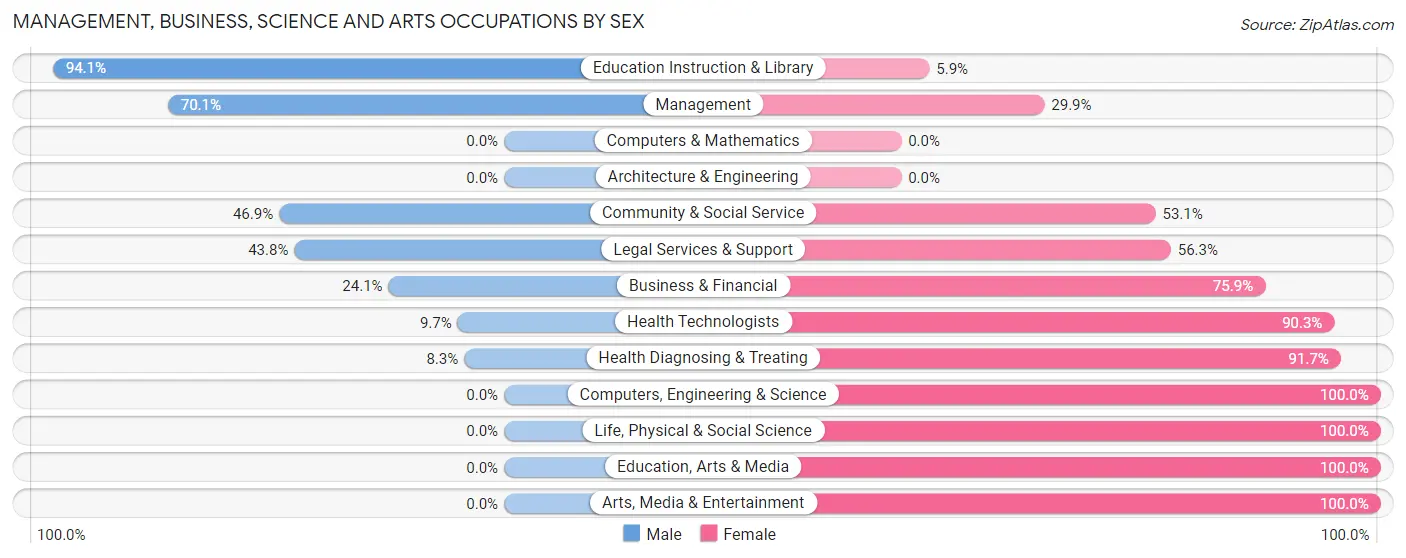
Management, Business, Science and Arts Occupations by Sex
Within the Management, Business, Science and Arts occupations in Kennebunkport, the most male-oriented occupations are Education Instruction & Library (94.1%), Management (70.1%), and Community & Social Service (46.9%), while the most female-oriented occupations are Computers, Engineering & Science (100.0%), Life, Physical & Social Science (100.0%), and Education, Arts & Media (100.0%).
| Occupation | Male | Female |
| Management | 54 (70.1%) | 23 (29.9%) |
| Business & Financial | 27 (24.1%) | 85 (75.9%) |
| Computers, Engineering & Science | 0 (0.0%) | 17 (100.0%) |
| Computers & Mathematics | 0 (0.0%) | 0 (0.0%) |
| Architecture & Engineering | 0 (0.0%) | 0 (0.0%) |
| Life, Physical & Social Science | 0 (0.0%) | 17 (100.0%) |
| Community & Social Service | 23 (46.9%) | 26 (53.1%) |
| Education, Arts & Media | 0 (0.0%) | 5 (100.0%) |
| Legal Services & Support | 7 (43.8%) | 9 (56.2%) |
| Education Instruction & Library | 16 (94.1%) | 1 (5.9%) |
| Arts, Media & Entertainment | 0 (0.0%) | 11 (100.0%) |
| Health Diagnosing & Treating | 3 (8.3%) | 33 (91.7%) |
| Health Technologists | 3 (9.7%) | 28 (90.3%) |
| Total (Category) | 107 (36.8%) | 184 (63.2%) |
| Total (Overall) | 257 (49.5%) | 262 (50.5%) |
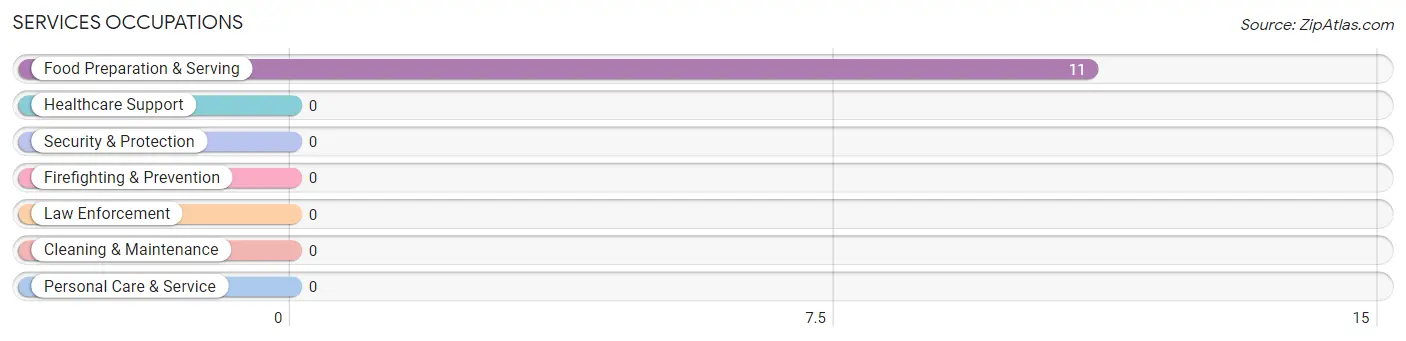
Services Occupations
The most common Services occupations in Kennebunkport are , and Food Preparation & Serving (11 | 2.1%).
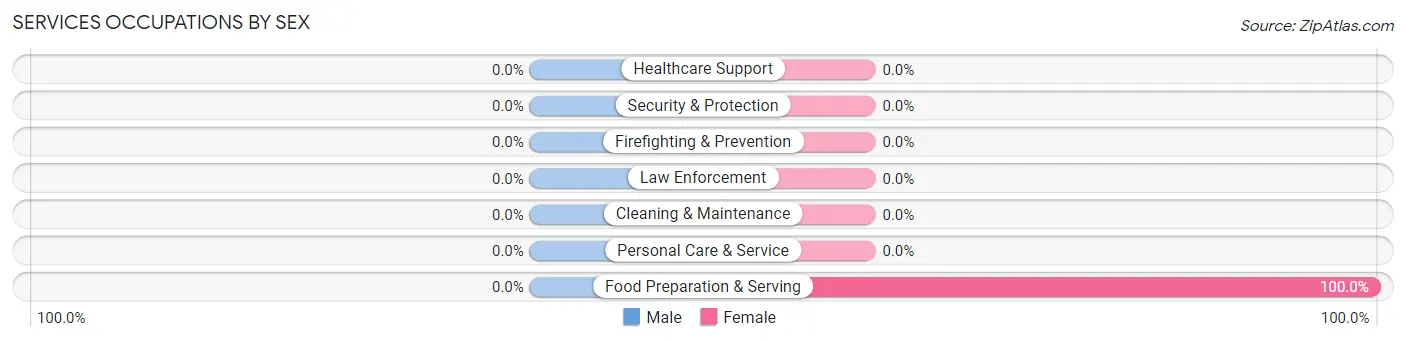
Services Occupations by Sex
| Occupation | Male | Female |
| Healthcare Support | 0 (0.0%) | 0 (0.0%) |
| Security & Protection | 0 (0.0%) | 0 (0.0%) |
| Firefighting & Prevention | 0 (0.0%) | 0 (0.0%) |
| Law Enforcement | 0 (0.0%) | 0 (0.0%) |
| Food Preparation & Serving | 0 (0.0%) | 11 (100.0%) |
| Cleaning & Maintenance | 0 (0.0%) | 0 (0.0%) |
| Personal Care & Service | 0 (0.0%) | 0 (0.0%) |
| Total (Category) | 0 (0.0%) | 11 (100.0%) |
| Total (Overall) | 257 (49.5%) | 262 (50.5%) |
Sales and Office Occupations
The most common Sales and Office occupations in Kennebunkport are Office & Administration (67 | 12.9%), and Sales & Related (50 | 9.6%).
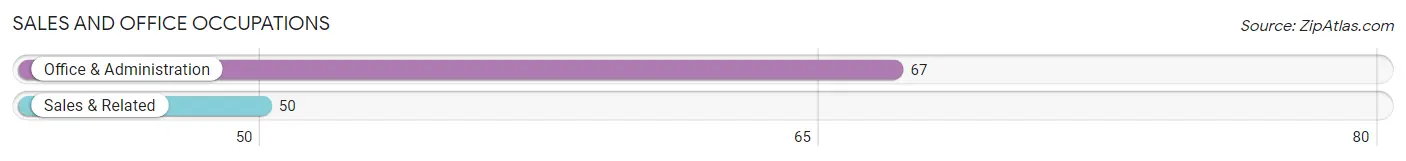
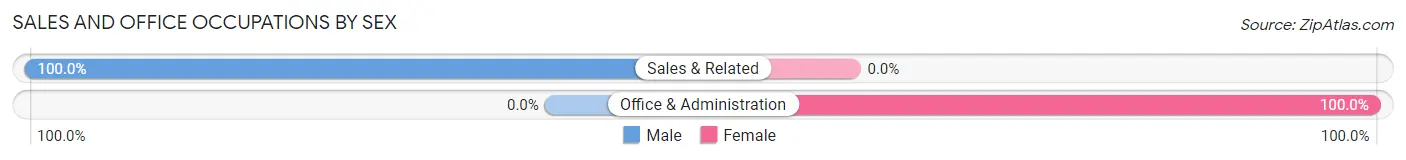
Sales and Office Occupations by Sex
| Occupation | Male | Female |
| Sales & Related | 50 (100.0%) | 0 (0.0%) |
| Office & Administration | 0 (0.0%) | 67 (100.0%) |
| Total (Category) | 50 (42.7%) | 67 (57.3%) |
| Total (Overall) | 257 (49.5%) | 262 (50.5%) |
Natural Resources, Construction and Maintenance Occupations
The most common Natural Resources, Construction and Maintenance occupations in Kennebunkport are , and Construction & Extraction (25 | 4.8%).
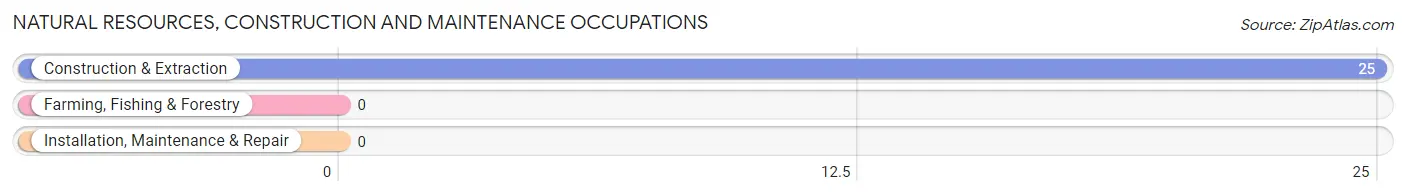
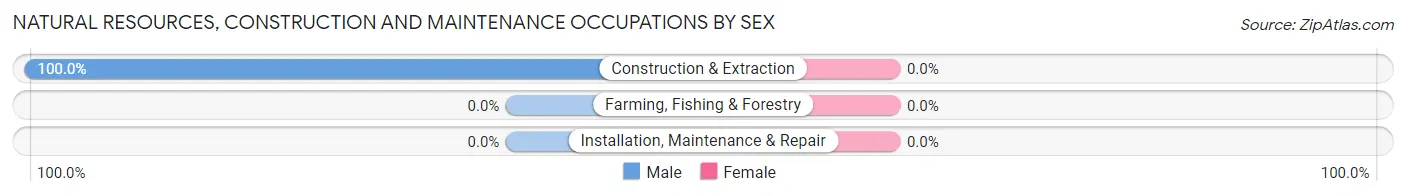
Natural Resources, Construction and Maintenance Occupations by Sex
| Occupation | Male | Female |
| Farming, Fishing & Forestry | 0 (0.0%) | 0 (0.0%) |
| Construction & Extraction | 25 (100.0%) | 0 (0.0%) |
| Installation, Maintenance & Repair | 0 (0.0%) | 0 (0.0%) |
| Total (Category) | 25 (100.0%) | 0 (0.0%) |
| Total (Overall) | 257 (49.5%) | 262 (50.5%) |
Production, Transportation and Moving Occupations
The most common Production, Transportation and Moving occupations in Kennebunkport are Production (52 | 10.0%), and Transportation (23 | 4.4%).
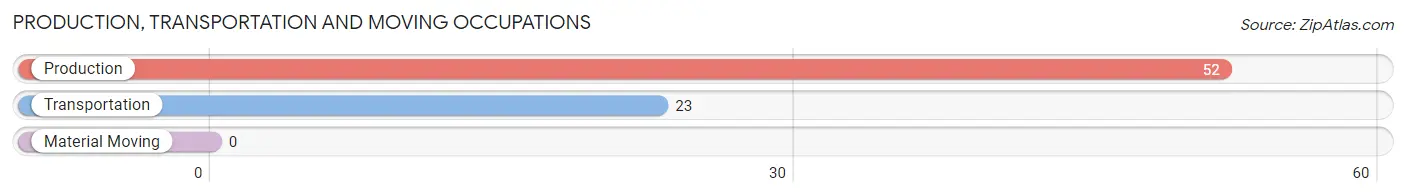
Production, Transportation and Moving Occupations by Sex
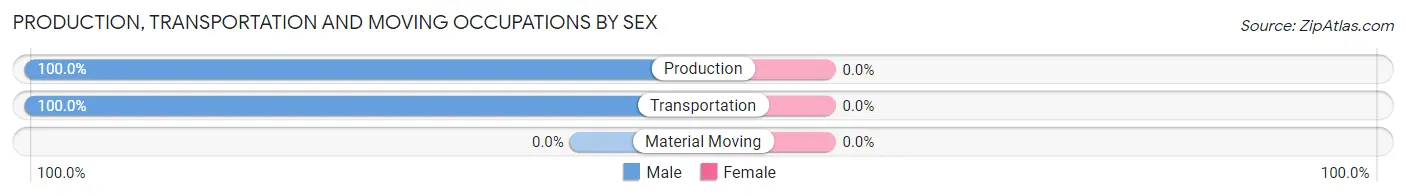
| Occupation | Male | Female |
| Production | 52 (100.0%) | 0 (0.0%) |
| Transportation | 23 (100.0%) | 0 (0.0%) |
| Material Moving | 0 (0.0%) | 0 (0.0%) |
| Total (Category) | 75 (100.0%) | 0 (0.0%) |
| Total (Overall) | 257 (49.5%) | 262 (50.5%) |
Employment Industries by Sex in Kennebunkport
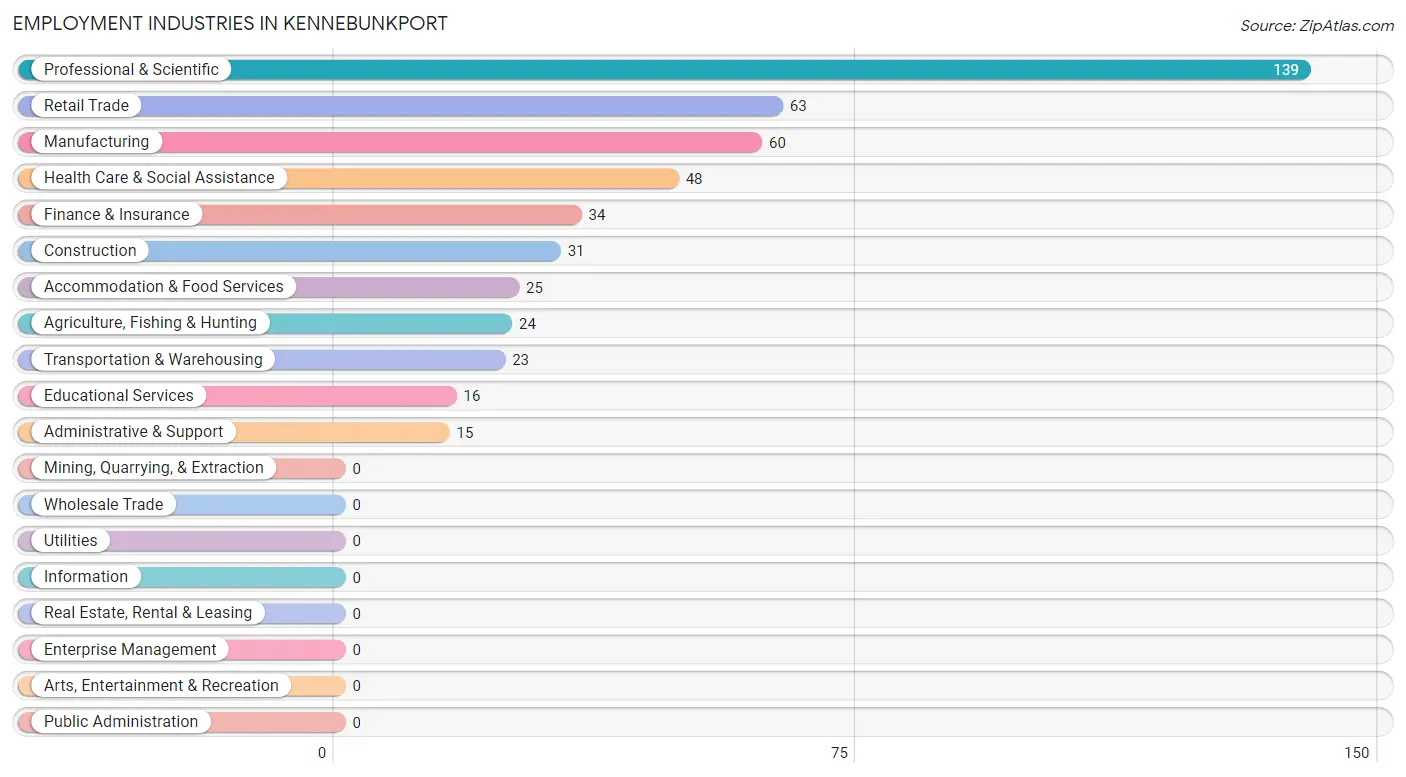
Employment Industries in Kennebunkport
The major employment industries in Kennebunkport include Professional & Scientific (139 | 26.8%), Retail Trade (63 | 12.1%), Manufacturing (60 | 11.6%), Health Care & Social Assistance (48 | 9.2%), and Finance & Insurance (34 | 6.6%).
Employment Industries by Sex in Kennebunkport
The Kennebunkport industries that see more men than women are Agriculture, Fishing & Hunting (100.0%), Construction (100.0%), and Transportation & Warehousing (100.0%), whereas the industries that tend to have a higher number of women are Health Care & Social Assistance (85.4%), Professional & Scientific (83.5%), and Accommodation & Food Services (72.0%).
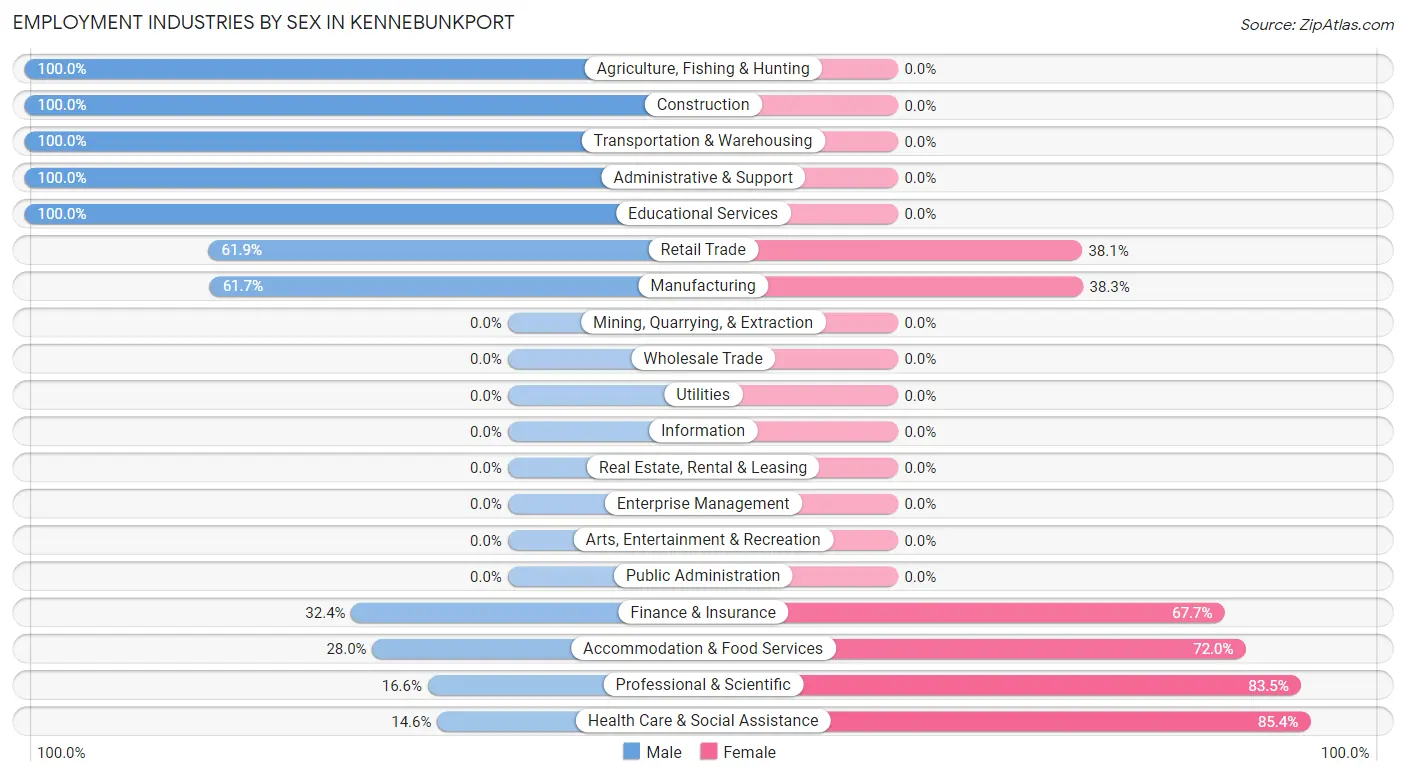
| Industry | Male | Female |
| Agriculture, Fishing & Hunting | 24 (100.0%) | 0 (0.0%) |
| Mining, Quarrying, & Extraction | 0 (0.0%) | 0 (0.0%) |
| Construction | 31 (100.0%) | 0 (0.0%) |
| Manufacturing | 37 (61.7%) | 23 (38.3%) |
| Wholesale Trade | 0 (0.0%) | 0 (0.0%) |
| Retail Trade | 39 (61.9%) | 24 (38.1%) |
| Transportation & Warehousing | 23 (100.0%) | 0 (0.0%) |
| Utilities | 0 (0.0%) | 0 (0.0%) |
| Information | 0 (0.0%) | 0 (0.0%) |
| Finance & Insurance | 11 (32.4%) | 23 (67.6%) |
| Real Estate, Rental & Leasing | 0 (0.0%) | 0 (0.0%) |
| Professional & Scientific | 23 (16.6%) | 116 (83.5%) |
| Enterprise Management | 0 (0.0%) | 0 (0.0%) |
| Administrative & Support | 15 (100.0%) | 0 (0.0%) |
| Educational Services | 16 (100.0%) | 0 (0.0%) |
| Health Care & Social Assistance | 7 (14.6%) | 41 (85.4%) |
| Arts, Entertainment & Recreation | 0 (0.0%) | 0 (0.0%) |
| Accommodation & Food Services | 7 (28.0%) | 18 (72.0%) |
| Public Administration | 0 (0.0%) | 0 (0.0%) |
| Total | 257 (49.5%) | 262 (50.5%) |
Education in Kennebunkport
School Enrollment in Kennebunkport
The most common levels of schooling among the 137 students in Kennebunkport are elementary school (56 | 40.9%), high school (45 | 32.9%), and nursery / preschool (25 | 18.2%).
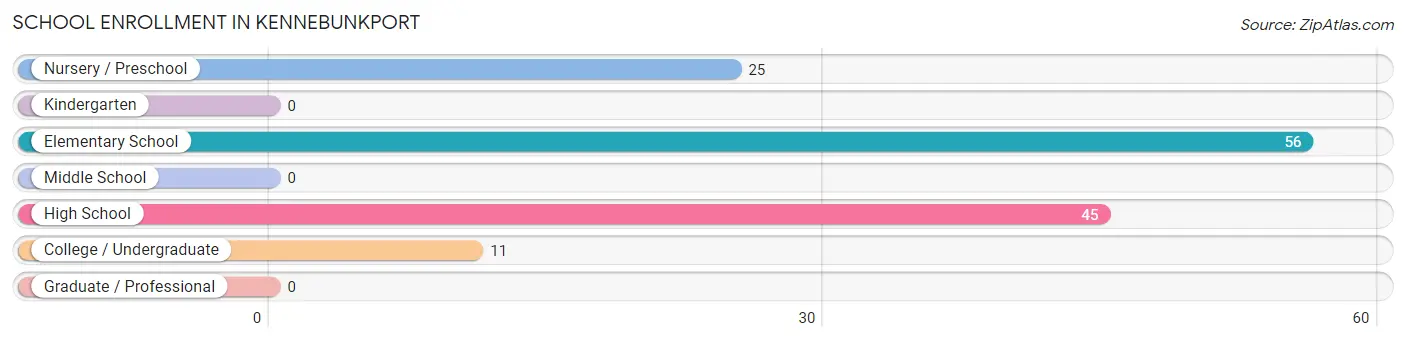
| School Level | # Students | % Students |
| Nursery / Preschool | 25 | 18.2% |
| Kindergarten | 0 | 0.0% |
| Elementary School | 56 | 40.9% |
| Middle School | 0 | 0.0% |
| High School | 45 | 32.9% |
| College / Undergraduate | 11 | 8.0% |
| Graduate / Professional | 0 | 0.0% |
| Total | 137 | 100.0% |
School Enrollment by Age by Funding Source in Kennebunkport
Out of a total of 137 students who are enrolled in schools in Kennebunkport, 51 (37.2%) attend a private institution, while the remaining 86 (62.8%) are enrolled in public schools. The age group of 3 to 4 year olds has the highest likelihood of being enrolled in private schools, with 25 (100.0% in the age bracket) enrolled. Conversely, the age group of 5 to 9 year old has the lowest likelihood of being enrolled in a private school, with 56 (100.0% in the age bracket) attending a public institution.
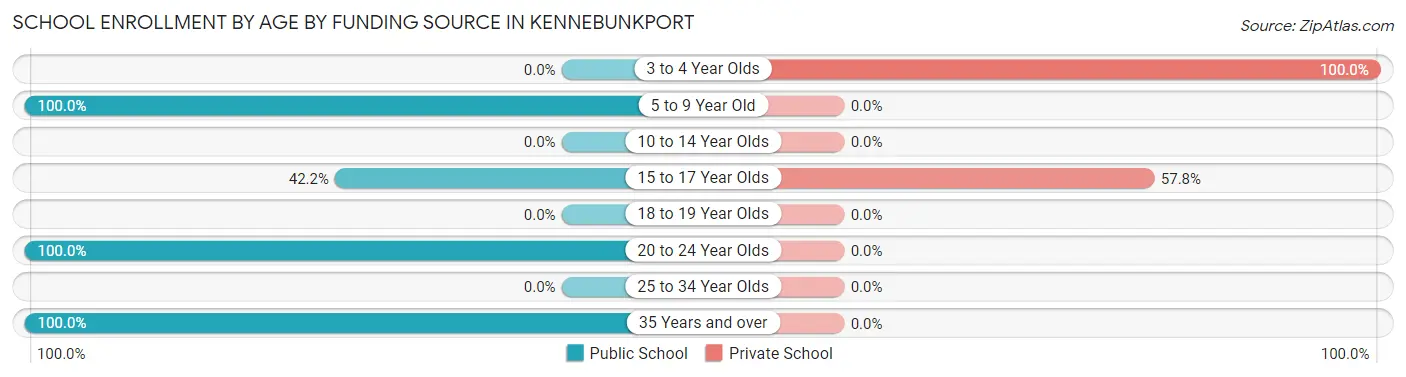
| Age Bracket | Public School | Private School |
| 3 to 4 Year Olds | 0 (0.0%) | 25 (100.0%) |
| 5 to 9 Year Old | 56 (100.0%) | 0 (0.0%) |
| 10 to 14 Year Olds | 0 (0.0%) | 0 (0.0%) |
| 15 to 17 Year Olds | 19 (42.2%) | 26 (57.8%) |
| 18 to 19 Year Olds | 0 (0.0%) | 0 (0.0%) |
| 20 to 24 Year Olds | 4 (100.0%) | 0 (0.0%) |
| 25 to 34 Year Olds | 0 (0.0%) | 0 (0.0%) |
| 35 Years and over | 7 (100.0%) | 0 (0.0%) |
| Total | 86 (62.8%) | 51 (37.2%) |
Educational Attainment by Field of Study in Kennebunkport
Social sciences (117 | 17.0%), visual & performing arts (82 | 11.9%), business (81 | 11.7%), literature & languages (71 | 10.3%), and science & technology (56 | 8.1%) are the most common fields of study among 690 individuals in Kennebunkport who have obtained a bachelor's degree or higher.
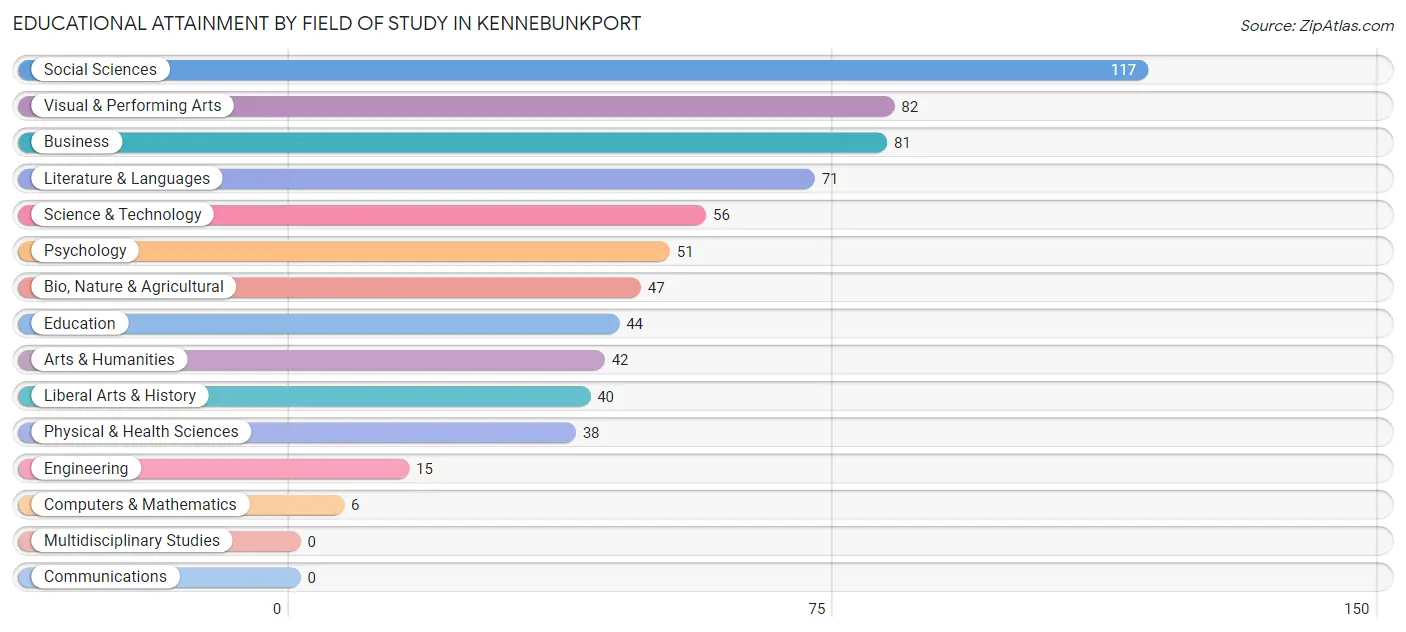
| Field of Study | # Graduates | % Graduates |
| Computers & Mathematics | 6 | 0.9% |
| Bio, Nature & Agricultural | 47 | 6.8% |
| Physical & Health Sciences | 38 | 5.5% |
| Psychology | 51 | 7.4% |
| Social Sciences | 117 | 17.0% |
| Engineering | 15 | 2.2% |
| Multidisciplinary Studies | 0 | 0.0% |
| Science & Technology | 56 | 8.1% |
| Business | 81 | 11.7% |
| Education | 44 | 6.4% |
| Literature & Languages | 71 | 10.3% |
| Liberal Arts & History | 40 | 5.8% |
| Visual & Performing Arts | 82 | 11.9% |
| Communications | 0 | 0.0% |
| Arts & Humanities | 42 | 6.1% |
| Total | 690 | 100.0% |
Transportation & Commute in Kennebunkport
Vehicle Availability by Sex in Kennebunkport
The most prevalent vehicle ownership categories in Kennebunkport are males with 2 vehicles (103, accounting for 40.1%) and females with 2 vehicles (100, making up 39.3%).
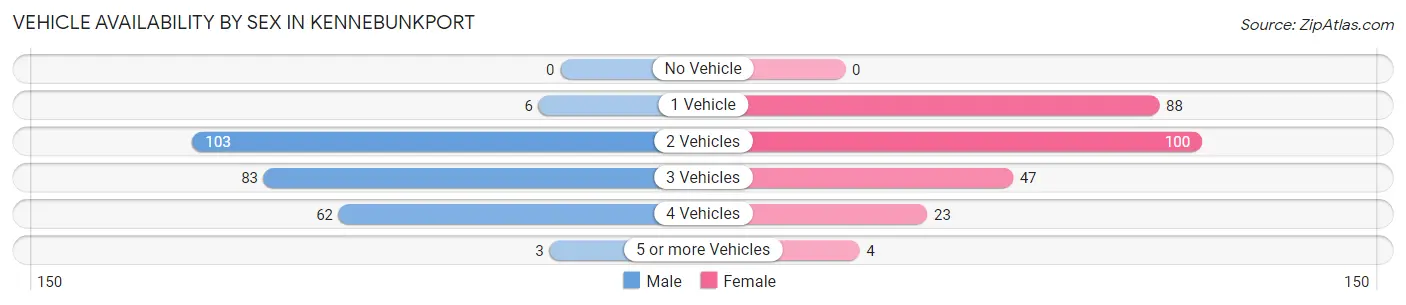
| Vehicles Available | Male | Female |
| No Vehicle | 0 (0.0%) | 0 (0.0%) |
| 1 Vehicle | 6 (2.3%) | 88 (33.6%) |
| 2 Vehicles | 103 (40.1%) | 100 (38.2%) |
| 3 Vehicles | 83 (32.3%) | 47 (17.9%) |
| 4 Vehicles | 62 (24.1%) | 23 (8.8%) |
| 5 or more Vehicles | 3 (1.2%) | 4 (1.5%) |
| Total | 257 (100.0%) | 262 (100.0%) |
Commute Time in Kennebunkport
The most frequently occuring commute durations in Kennebunkport are 5 to 9 minutes (94 commuters, 29.5%), 15 to 19 minutes (58 commuters, 18.2%), and 90 or more minutes (49 commuters, 15.4%).
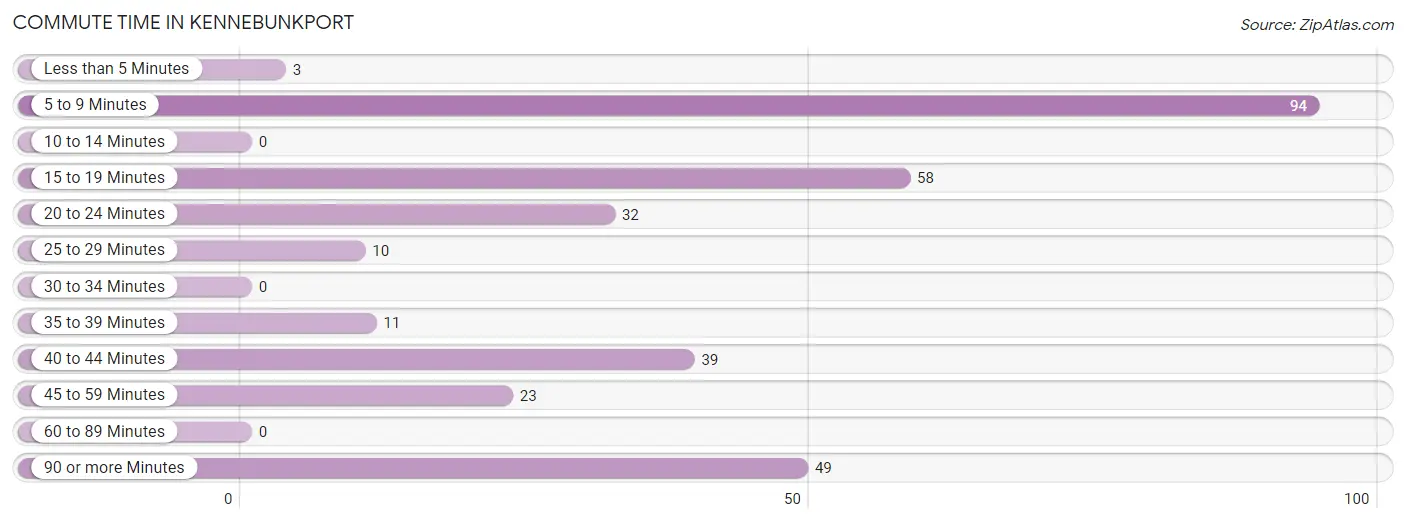
| Commute Time | # Commuters | % Commuters |
| Less than 5 Minutes | 3 | 0.9% |
| 5 to 9 Minutes | 94 | 29.5% |
| 10 to 14 Minutes | 0 | 0.0% |
| 15 to 19 Minutes | 58 | 18.2% |
| 20 to 24 Minutes | 32 | 10.0% |
| 25 to 29 Minutes | 10 | 3.1% |
| 30 to 34 Minutes | 0 | 0.0% |
| 35 to 39 Minutes | 11 | 3.5% |
| 40 to 44 Minutes | 39 | 12.2% |
| 45 to 59 Minutes | 23 | 7.2% |
| 60 to 89 Minutes | 0 | 0.0% |
| 90 or more Minutes | 49 | 15.4% |
Commute Time by Sex in Kennebunkport
The most common commute times in Kennebunkport are 5 to 9 minutes (55 commuters, 26.4%) for males and 5 to 9 minutes (39 commuters, 35.1%) for females.
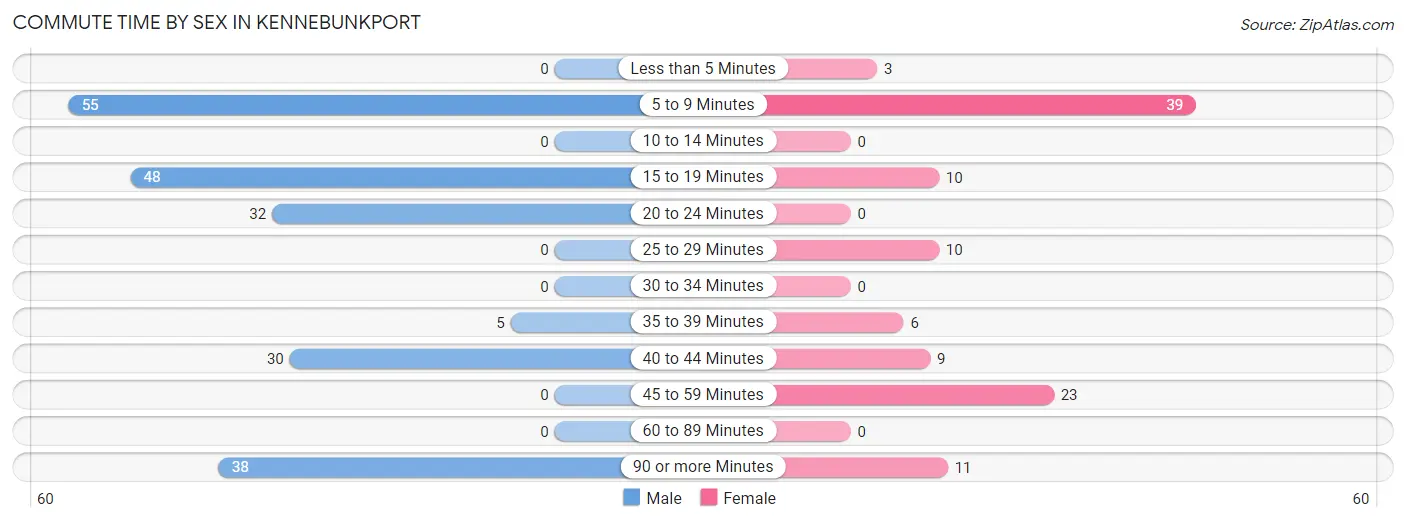
| Commute Time | Male | Female |
| Less than 5 Minutes | 0 (0.0%) | 3 (2.7%) |
| 5 to 9 Minutes | 55 (26.4%) | 39 (35.1%) |
| 10 to 14 Minutes | 0 (0.0%) | 0 (0.0%) |
| 15 to 19 Minutes | 48 (23.1%) | 10 (9.0%) |
| 20 to 24 Minutes | 32 (15.4%) | 0 (0.0%) |
| 25 to 29 Minutes | 0 (0.0%) | 10 (9.0%) |
| 30 to 34 Minutes | 0 (0.0%) | 0 (0.0%) |
| 35 to 39 Minutes | 5 (2.4%) | 6 (5.4%) |
| 40 to 44 Minutes | 30 (14.4%) | 9 (8.1%) |
| 45 to 59 Minutes | 0 (0.0%) | 23 (20.7%) |
| 60 to 89 Minutes | 0 (0.0%) | 0 (0.0%) |
| 90 or more Minutes | 38 (18.3%) | 11 (9.9%) |
Time of Departure to Work by Sex in Kennebunkport
The most frequent times of departure to work in Kennebunkport are 6:00 AM to 6:29 AM (58, 27.9%) for males and 8:30 AM to 8:59 AM (28, 25.2%) for females.
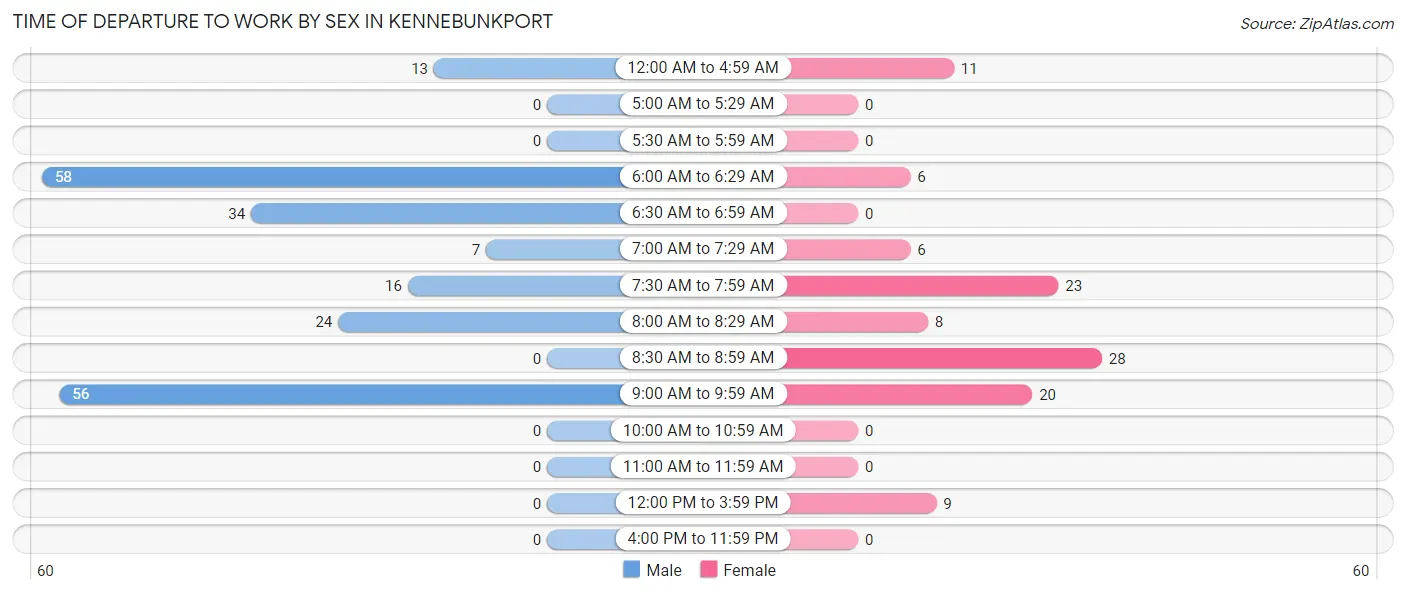
| Time of Departure | Male | Female |
| 12:00 AM to 4:59 AM | 13 (6.2%) | 11 (9.9%) |
| 5:00 AM to 5:29 AM | 0 (0.0%) | 0 (0.0%) |
| 5:30 AM to 5:59 AM | 0 (0.0%) | 0 (0.0%) |
| 6:00 AM to 6:29 AM | 58 (27.9%) | 6 (5.4%) |
| 6:30 AM to 6:59 AM | 34 (16.4%) | 0 (0.0%) |
| 7:00 AM to 7:29 AM | 7 (3.4%) | 6 (5.4%) |
| 7:30 AM to 7:59 AM | 16 (7.7%) | 23 (20.7%) |
| 8:00 AM to 8:29 AM | 24 (11.5%) | 8 (7.2%) |
| 8:30 AM to 8:59 AM | 0 (0.0%) | 28 (25.2%) |
| 9:00 AM to 9:59 AM | 56 (26.9%) | 20 (18.0%) |
| 10:00 AM to 10:59 AM | 0 (0.0%) | 0 (0.0%) |
| 11:00 AM to 11:59 AM | 0 (0.0%) | 0 (0.0%) |
| 12:00 PM to 3:59 PM | 0 (0.0%) | 9 (8.1%) |
| 4:00 PM to 11:59 PM | 0 (0.0%) | 0 (0.0%) |
| Total | 208 (100.0%) | 111 (100.0%) |
Housing Occupancy in Kennebunkport
Occupancy by Ownership in Kennebunkport
Of the total 628 dwellings in Kennebunkport, owner-occupied units account for 570 (90.8%), while renter-occupied units make up 58 (9.2%).
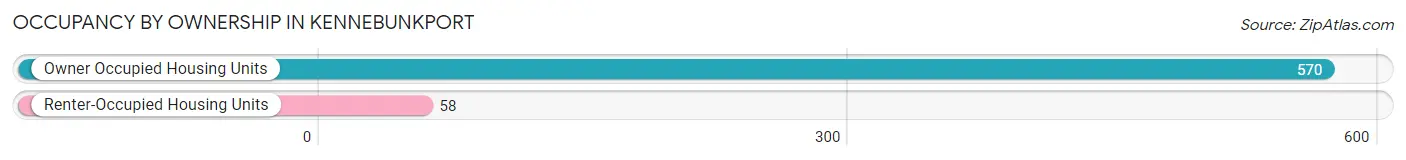
| Occupancy | # Housing Units | % Housing Units |
| Owner Occupied Housing Units | 570 | 90.8% |
| Renter-Occupied Housing Units | 58 | 9.2% |
| Total Occupied Housing Units | 628 | 100.0% |
Occupancy by Household Size in Kennebunkport
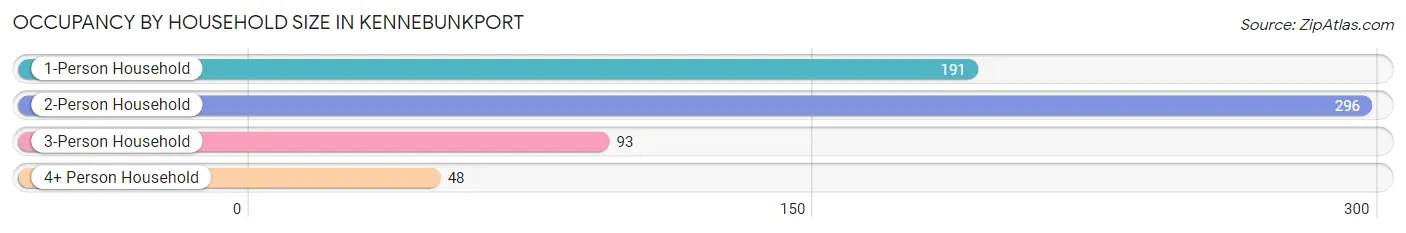
| Household Size | # Housing Units | % Housing Units |
| 1-Person Household | 191 | 30.4% |
| 2-Person Household | 296 | 47.1% |
| 3-Person Household | 93 | 14.8% |
| 4+ Person Household | 48 | 7.6% |
| Total Housing Units | 628 | 100.0% |
Occupancy by Ownership by Household Size in Kennebunkport
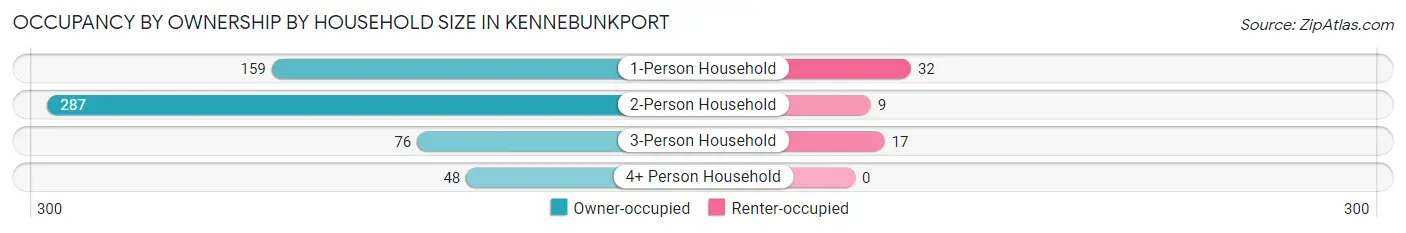
| Household Size | Owner-occupied | Renter-occupied |
| 1-Person Household | 159 (83.3%) | 32 (16.8%) |
| 2-Person Household | 287 (97.0%) | 9 (3.0%) |
| 3-Person Household | 76 (81.7%) | 17 (18.3%) |
| 4+ Person Household | 48 (100.0%) | 0 (0.0%) |
| Total Housing Units | 570 (90.8%) | 58 (9.2%) |
Occupancy by Educational Attainment in Kennebunkport
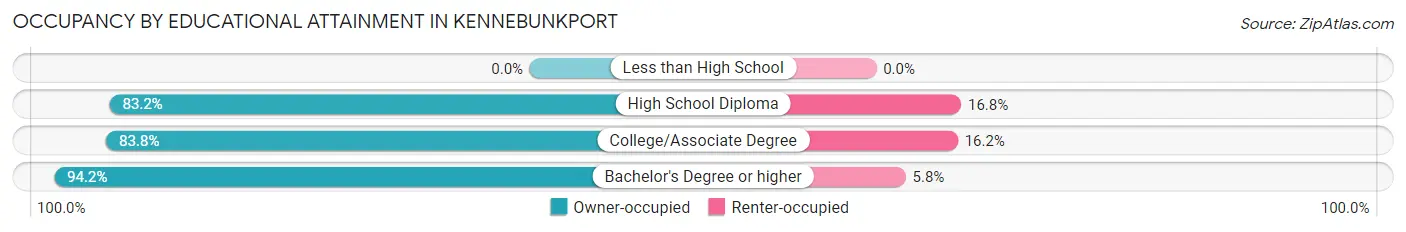
| Household Size | Owner-occupied | Renter-occupied |
| Less than High School | 0 (0.0%) | 0 (0.0%) |
| High School Diploma | 84 (83.2%) | 17 (16.8%) |
| College/Associate Degree | 83 (83.8%) | 16 (16.2%) |
| Bachelor's Degree or higher | 403 (94.2%) | 25 (5.8%) |
Occupancy by Age of Householder in Kennebunkport
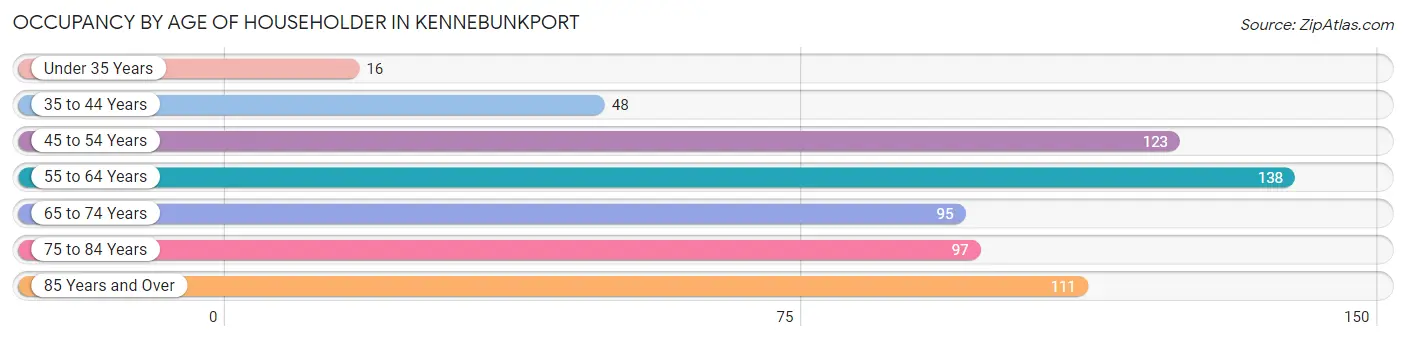
| Age Bracket | # Households | % Households |
| Under 35 Years | 16 | 2.5% |
| 35 to 44 Years | 48 | 7.6% |
| 45 to 54 Years | 123 | 19.6% |
| 55 to 64 Years | 138 | 22.0% |
| 65 to 74 Years | 95 | 15.1% |
| 75 to 84 Years | 97 | 15.4% |
| 85 Years and Over | 111 | 17.7% |
| Total | 628 | 100.0% |
Housing Finances in Kennebunkport
Median Income by Occupancy in Kennebunkport
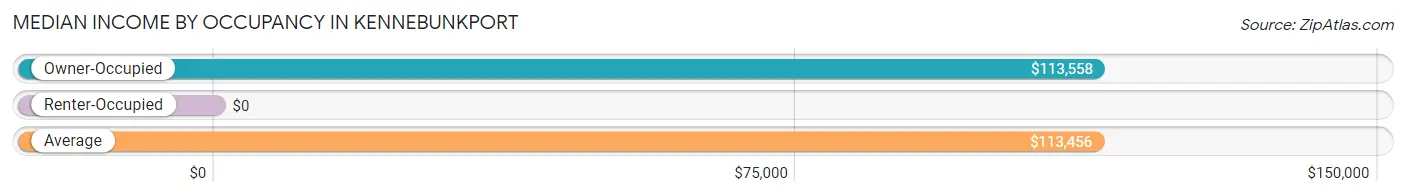
| Occupancy Type | # Households | Median Income |
| Owner-Occupied | 570 (90.8%) | $113,558 |
| Renter-Occupied | 58 (9.2%) | $0 |
| Average | 628 (100.0%) | $113,456 |
Occupancy by Householder Income Bracket in Kennebunkport
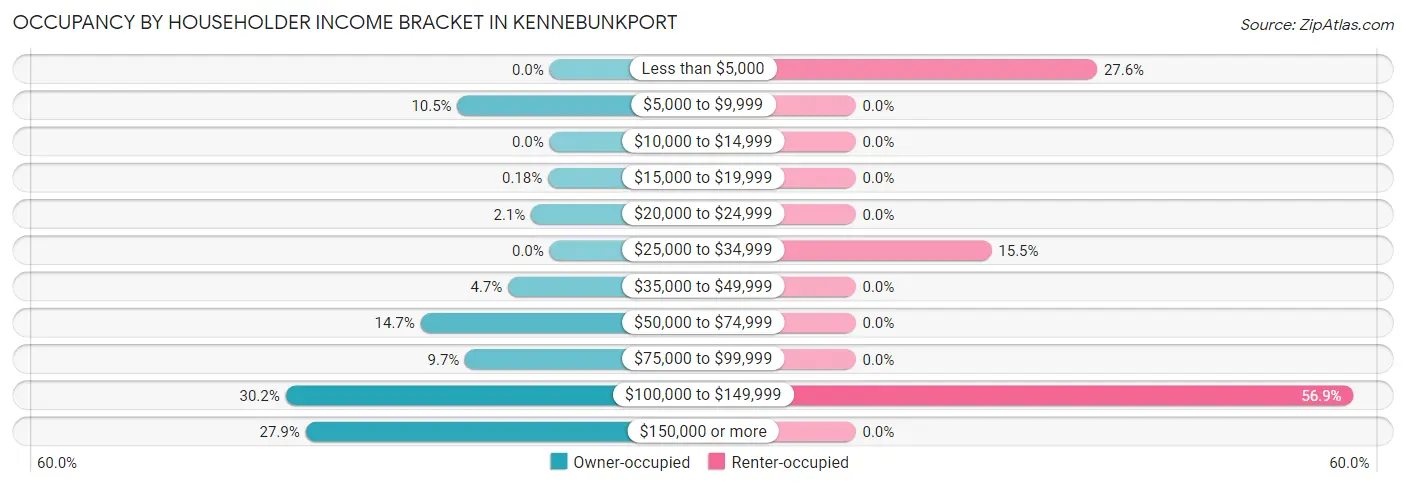
| Income Bracket | Owner-occupied | Renter-occupied |
| Less than $5,000 | 0 (0.0%) | 16 (27.6%) |
| $5,000 to $9,999 | 60 (10.5%) | 0 (0.0%) |
| $10,000 to $14,999 | 0 (0.0%) | 0 (0.0%) |
| $15,000 to $19,999 | 1 (0.2%) | 0 (0.0%) |
| $20,000 to $24,999 | 12 (2.1%) | 0 (0.0%) |
| $25,000 to $34,999 | 0 (0.0%) | 9 (15.5%) |
| $35,000 to $49,999 | 27 (4.7%) | 0 (0.0%) |
| $50,000 to $74,999 | 84 (14.7%) | 0 (0.0%) |
| $75,000 to $99,999 | 55 (9.7%) | 0 (0.0%) |
| $100,000 to $149,999 | 172 (30.2%) | 33 (56.9%) |
| $150,000 or more | 159 (27.9%) | 0 (0.0%) |
| Total | 570 (100.0%) | 58 (100.0%) |
Monthly Housing Cost Tiers in Kennebunkport
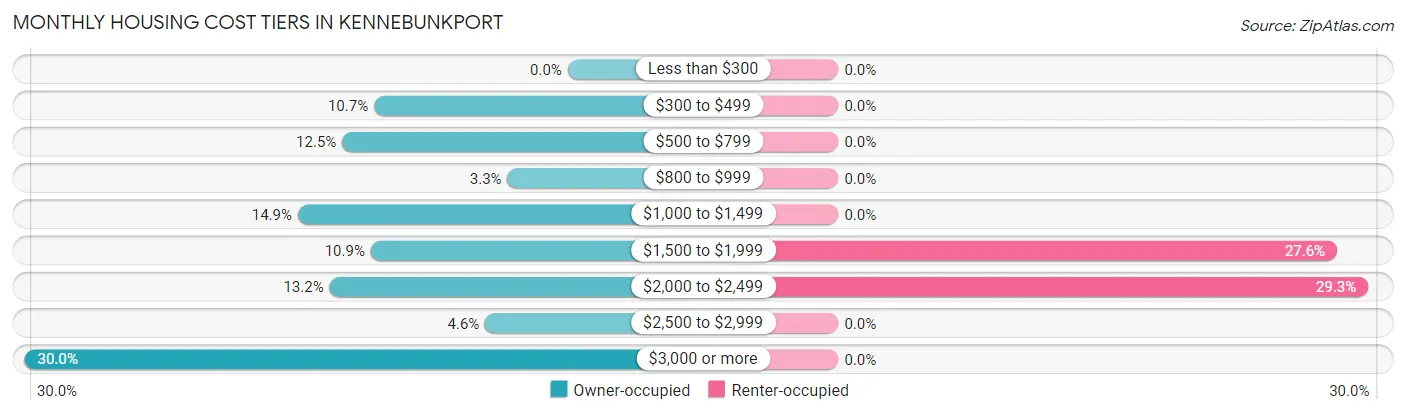
| Monthly Cost | Owner-occupied | Renter-occupied |
| Less than $300 | 0 (0.0%) | 0 (0.0%) |
| $300 to $499 | 61 (10.7%) | 0 (0.0%) |
| $500 to $799 | 71 (12.5%) | 0 (0.0%) |
| $800 to $999 | 19 (3.3%) | 0 (0.0%) |
| $1,000 to $1,499 | 85 (14.9%) | 0 (0.0%) |
| $1,500 to $1,999 | 62 (10.9%) | 16 (27.6%) |
| $2,000 to $2,499 | 75 (13.2%) | 17 (29.3%) |
| $2,500 to $2,999 | 26 (4.6%) | 0 (0.0%) |
| $3,000 or more | 171 (30.0%) | 0 (0.0%) |
| Total | 570 (100.0%) | 58 (100.0%) |
Physical Housing Characteristics in Kennebunkport
Housing Structures in Kennebunkport
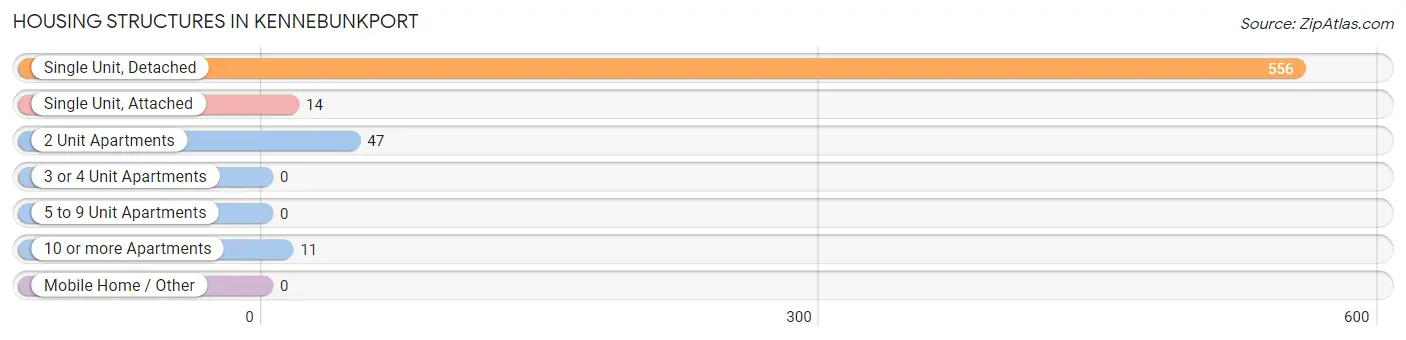
| Structure Type | # Housing Units | % Housing Units |
| Single Unit, Detached | 556 | 88.5% |
| Single Unit, Attached | 14 | 2.2% |
| 2 Unit Apartments | 47 | 7.5% |
| 3 or 4 Unit Apartments | 0 | 0.0% |
| 5 to 9 Unit Apartments | 0 | 0.0% |
| 10 or more Apartments | 11 | 1.8% |
| Mobile Home / Other | 0 | 0.0% |
| Total | 628 | 100.0% |
Housing Structures by Occupancy in Kennebunkport
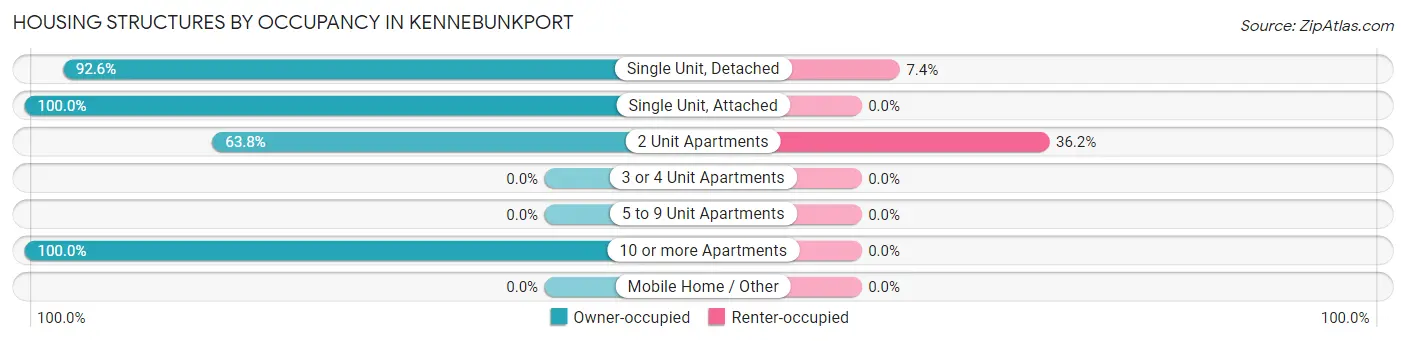
| Structure Type | Owner-occupied | Renter-occupied |
| Single Unit, Detached | 515 (92.6%) | 41 (7.4%) |
| Single Unit, Attached | 14 (100.0%) | 0 (0.0%) |
| 2 Unit Apartments | 30 (63.8%) | 17 (36.2%) |
| 3 or 4 Unit Apartments | 0 (0.0%) | 0 (0.0%) |
| 5 to 9 Unit Apartments | 0 (0.0%) | 0 (0.0%) |
| 10 or more Apartments | 11 (100.0%) | 0 (0.0%) |
| Mobile Home / Other | 0 (0.0%) | 0 (0.0%) |
| Total | 570 (90.8%) | 58 (9.2%) |
Housing Structures by Number of Rooms in Kennebunkport
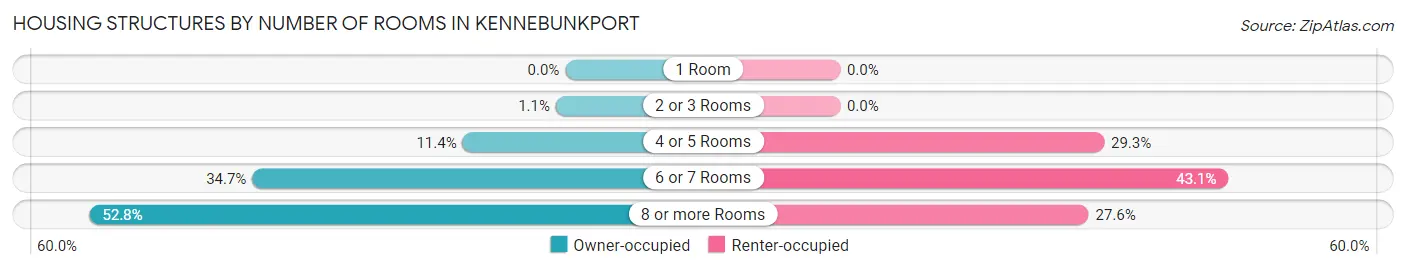
| Number of Rooms | Owner-occupied | Renter-occupied |
| 1 Room | 0 (0.0%) | 0 (0.0%) |
| 2 or 3 Rooms | 6 (1.1%) | 0 (0.0%) |
| 4 or 5 Rooms | 65 (11.4%) | 17 (29.3%) |
| 6 or 7 Rooms | 198 (34.7%) | 25 (43.1%) |
| 8 or more Rooms | 301 (52.8%) | 16 (27.6%) |
| Total | 570 (100.0%) | 58 (100.0%) |
Housing Structure by Heating Type in Kennebunkport
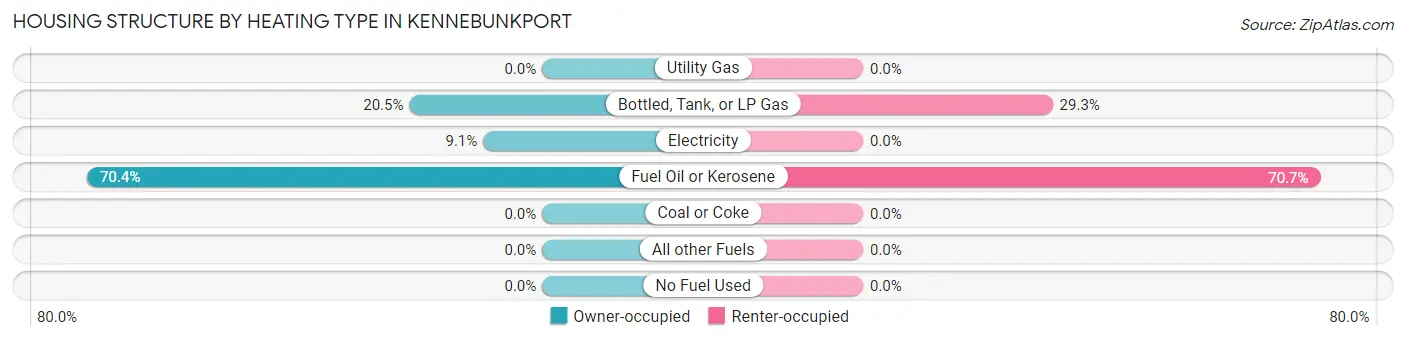
| Heating Type | Owner-occupied | Renter-occupied |
| Utility Gas | 0 (0.0%) | 0 (0.0%) |
| Bottled, Tank, or LP Gas | 117 (20.5%) | 17 (29.3%) |
| Electricity | 52 (9.1%) | 0 (0.0%) |
| Fuel Oil or Kerosene | 401 (70.4%) | 41 (70.7%) |
| Coal or Coke | 0 (0.0%) | 0 (0.0%) |
| All other Fuels | 0 (0.0%) | 0 (0.0%) |
| No Fuel Used | 0 (0.0%) | 0 (0.0%) |
| Total | 570 (100.0%) | 58 (100.0%) |
Household Vehicle Usage in Kennebunkport
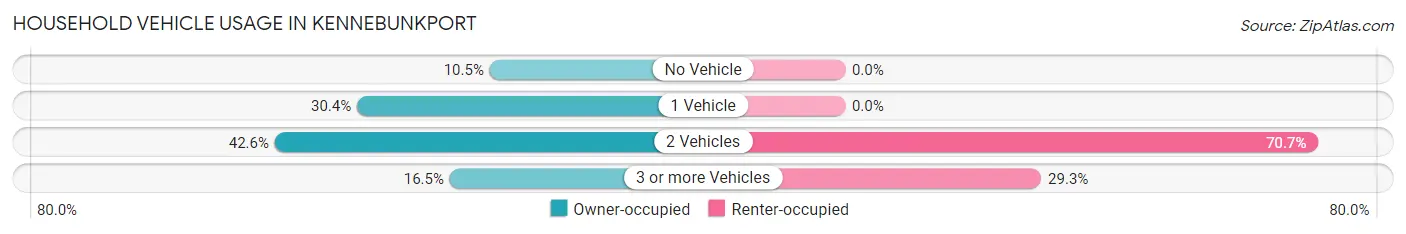
| Vehicles per Household | Owner-occupied | Renter-occupied |
| No Vehicle | 60 (10.5%) | 0 (0.0%) |
| 1 Vehicle | 173 (30.3%) | 0 (0.0%) |
| 2 Vehicles | 243 (42.6%) | 41 (70.7%) |
| 3 or more Vehicles | 94 (16.5%) | 17 (29.3%) |
| Total | 570 (100.0%) | 58 (100.0%) |
Real Estate & Mortgages in Kennebunkport
Real Estate and Mortgage Overview in Kennebunkport
| Characteristic | Without Mortgage | With Mortgage |
| Housing Units | 278 | 292 |
| Median Property Value | $663,500 | $916,700 |
| Median Household Income | - | - |
| Monthly Housing Costs | $936 | $171 |
| Real Estate Taxes | $3,866 | $0 |
Property Value by Mortgage Status in Kennebunkport
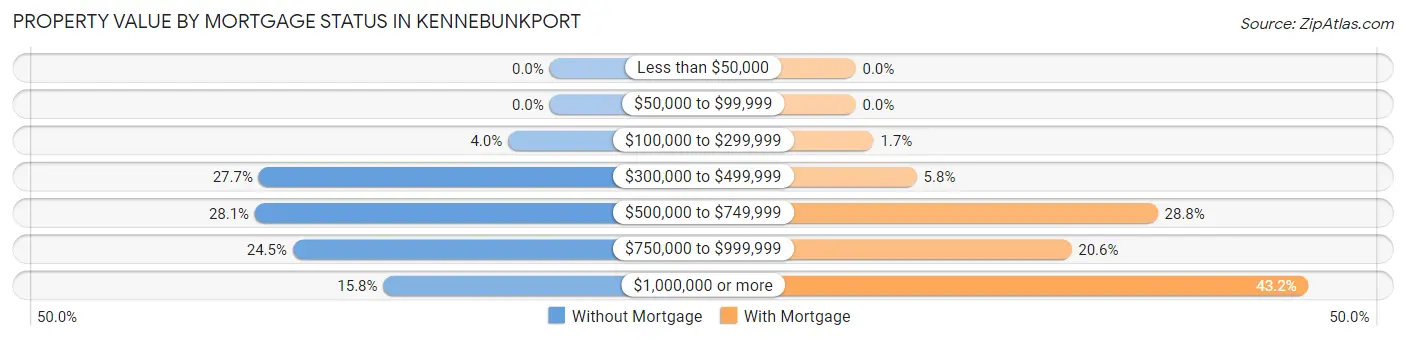
| Property Value | Without Mortgage | With Mortgage |
| Less than $50,000 | 0 (0.0%) | 0 (0.0%) |
| $50,000 to $99,999 | 0 (0.0%) | 0 (0.0%) |
| $100,000 to $299,999 | 11 (4.0%) | 5 (1.7%) |
| $300,000 to $499,999 | 77 (27.7%) | 17 (5.8%) |
| $500,000 to $749,999 | 78 (28.1%) | 84 (28.8%) |
| $750,000 to $999,999 | 68 (24.5%) | 60 (20.5%) |
| $1,000,000 or more | 44 (15.8%) | 126 (43.1%) |
| Total | 278 (100.0%) | 292 (100.0%) |
Household Income by Mortgage Status in Kennebunkport
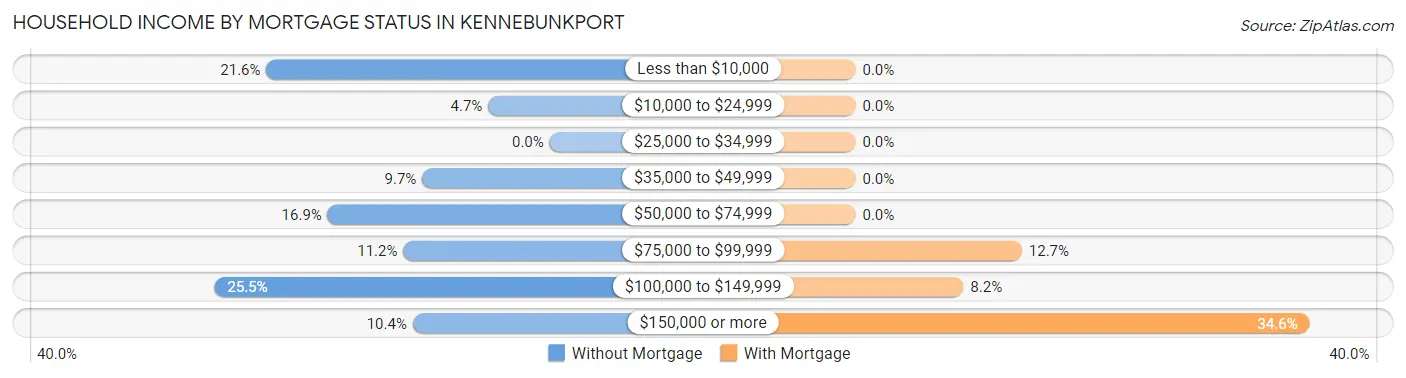
| Household Income | Without Mortgage | With Mortgage |
| Less than $10,000 | 60 (21.6%) | 0 (0.0%) |
| $10,000 to $24,999 | 13 (4.7%) | 0 (0.0%) |
| $25,000 to $34,999 | 0 (0.0%) | 0 (0.0%) |
| $35,000 to $49,999 | 27 (9.7%) | 0 (0.0%) |
| $50,000 to $74,999 | 47 (16.9%) | 0 (0.0%) |
| $75,000 to $99,999 | 31 (11.2%) | 37 (12.7%) |
| $100,000 to $149,999 | 71 (25.5%) | 24 (8.2%) |
| $150,000 or more | 29 (10.4%) | 101 (34.6%) |
| Total | 278 (100.0%) | 292 (100.0%) |
Property Value to Household Income Ratio in Kennebunkport
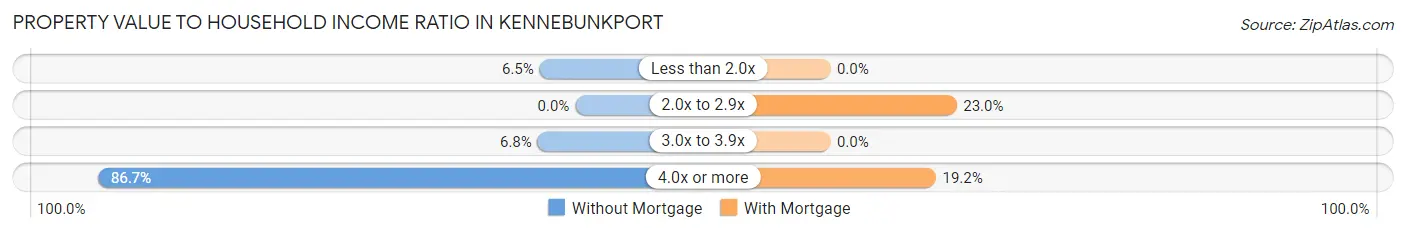
| Value-to-Income Ratio | Without Mortgage | With Mortgage |
| Less than 2.0x | 18 (6.5%) | 0 (0.0%) |
| 2.0x to 2.9x | 0 (0.0%) | 67 (23.0%) |
| 3.0x to 3.9x | 19 (6.8%) | 0 (0.0%) |
| 4.0x or more | 241 (86.7%) | 56 (19.2%) |
| Total | 278 (100.0%) | 292 (100.0%) |
Real Estate Taxes by Mortgage Status in Kennebunkport
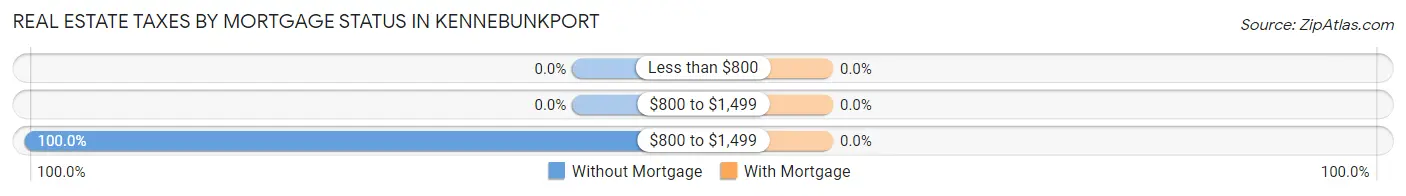
| Property Taxes | Without Mortgage | With Mortgage |
| Less than $800 | 0 (0.0%) | 0 (0.0%) |
| $800 to $1,499 | 0 (0.0%) | 0 (0.0%) |
| $800 to $1,499 | 278 (100.0%) | 0 (0.0%) |
| Total | 278 (100.0%) | 292 (100.0%) |
Health & Disability in Kennebunkport
Health Insurance Coverage by Age in Kennebunkport
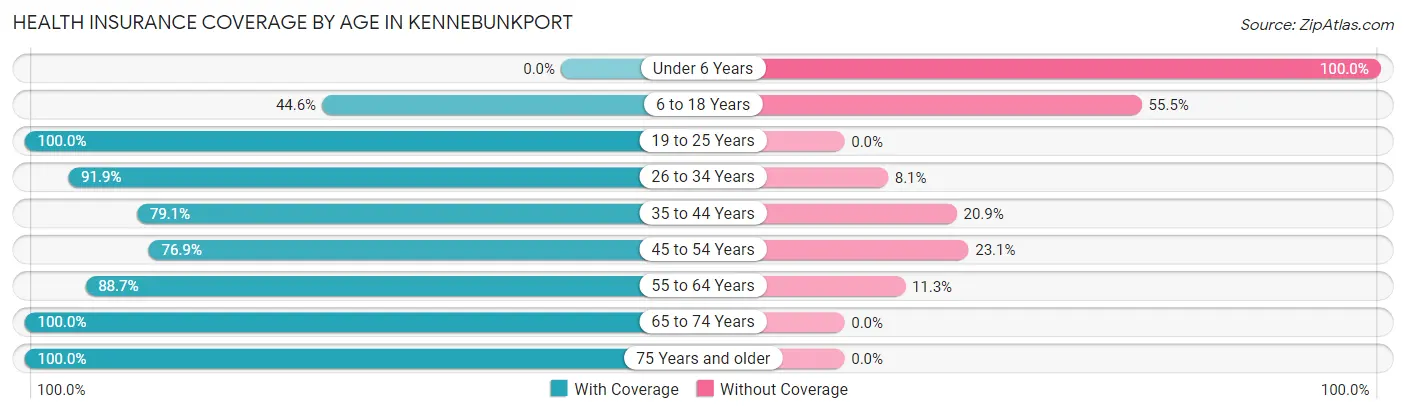
| Age Bracket | With Coverage | Without Coverage |
| Under 6 Years | 0 (0.0%) | 53 (100.0%) |
| 6 to 18 Years | 45 (44.6%) | 56 (55.4%) |
| 19 to 25 Years | 31 (100.0%) | 0 (0.0%) |
| 26 to 34 Years | 34 (91.9%) | 3 (8.1%) |
| 35 to 44 Years | 102 (79.1%) | 27 (20.9%) |
| 45 to 54 Years | 153 (76.9%) | 46 (23.1%) |
| 55 to 64 Years | 196 (88.7%) | 25 (11.3%) |
| 65 to 74 Years | 226 (100.0%) | 0 (0.0%) |
| 75 Years and older | 321 (100.0%) | 0 (0.0%) |
| Total | 1,108 (84.1%) | 210 (15.9%) |
Health Insurance Coverage by Citizenship Status in Kennebunkport
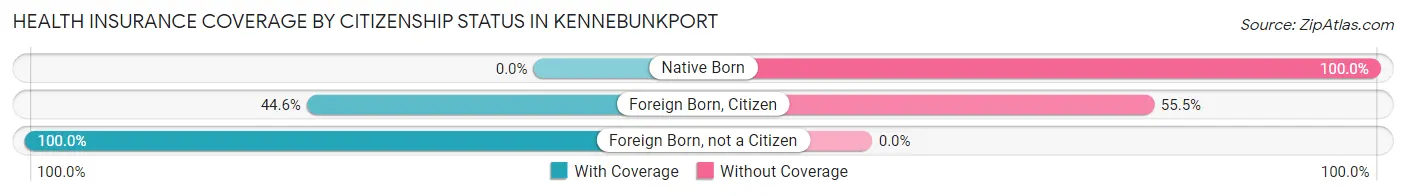
| Citizenship Status | With Coverage | Without Coverage |
| Native Born | 0 (0.0%) | 53 (100.0%) |
| Foreign Born, Citizen | 45 (44.6%) | 56 (55.4%) |
| Foreign Born, not a Citizen | 31 (100.0%) | 0 (0.0%) |
Health Insurance Coverage by Household Income in Kennebunkport
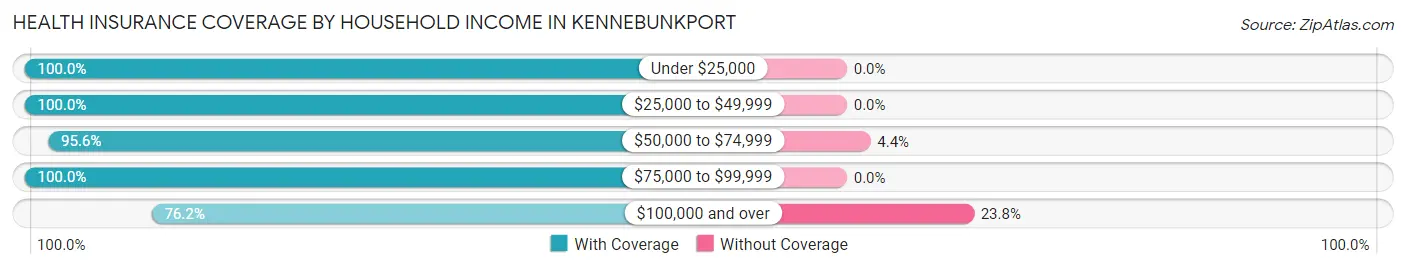
| Household Income | With Coverage | Without Coverage |
| Under $25,000 | 165 (100.0%) | 0 (0.0%) |
| $25,000 to $49,999 | 66 (100.0%) | 0 (0.0%) |
| $50,000 to $74,999 | 130 (95.6%) | 6 (4.4%) |
| $75,000 to $99,999 | 93 (100.0%) | 0 (0.0%) |
| $100,000 and over | 654 (76.2%) | 204 (23.8%) |
Public vs Private Health Insurance Coverage by Age in Kennebunkport
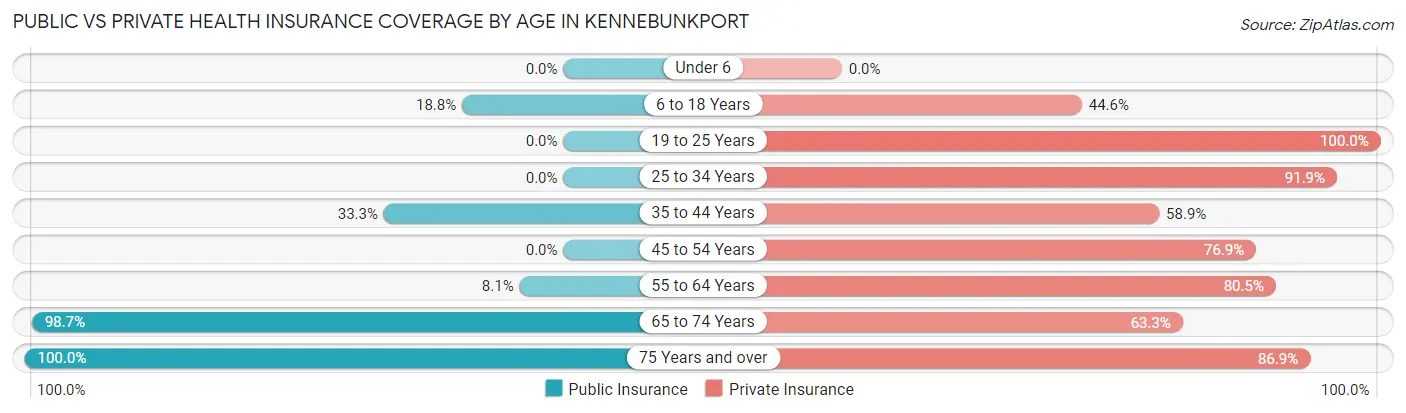
| Age Bracket | Public Insurance | Private Insurance |
| Under 6 | 0 (0.0%) | 0 (0.0%) |
| 6 to 18 Years | 19 (18.8%) | 45 (44.6%) |
| 19 to 25 Years | 0 (0.0%) | 31 (100.0%) |
| 25 to 34 Years | 0 (0.0%) | 34 (91.9%) |
| 35 to 44 Years | 43 (33.3%) | 76 (58.9%) |
| 45 to 54 Years | 0 (0.0%) | 153 (76.9%) |
| 55 to 64 Years | 18 (8.1%) | 178 (80.5%) |
| 65 to 74 Years | 223 (98.7%) | 143 (63.3%) |
| 75 Years and over | 321 (100.0%) | 279 (86.9%) |
| Total | 624 (47.3%) | 939 (71.2%) |
Disability Status by Sex by Age in Kennebunkport
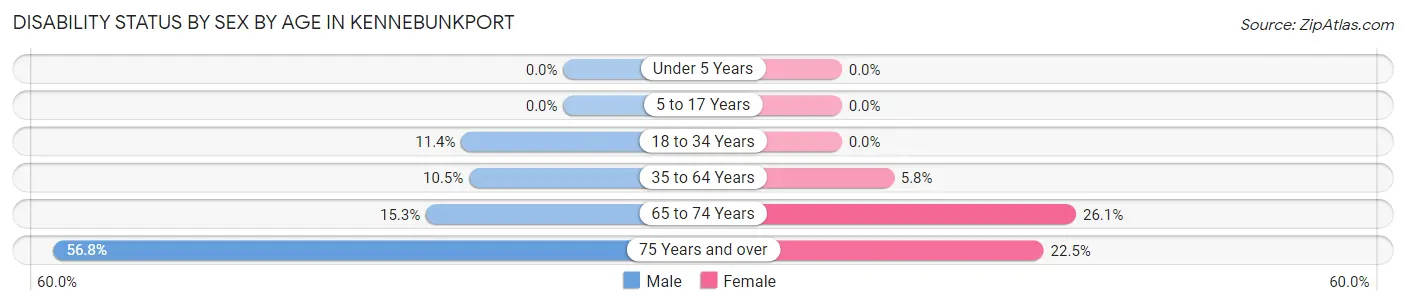
| Age Bracket | Male | Female |
| Under 5 Years | 0 (0.0%) | 0 (0.0%) |
| 5 to 17 Years | 0 (0.0%) | 0 (0.0%) |
| 18 to 34 Years | 5 (11.4%) | 0 (0.0%) |
| 35 to 64 Years | 25 (10.5%) | 18 (5.8%) |
| 65 to 74 Years | 24 (15.3%) | 18 (26.1%) |
| 75 Years and over | 109 (56.8%) | 29 (22.5%) |
Disability Class by Sex by Age in Kennebunkport
Disability Class: Hearing Difficulty
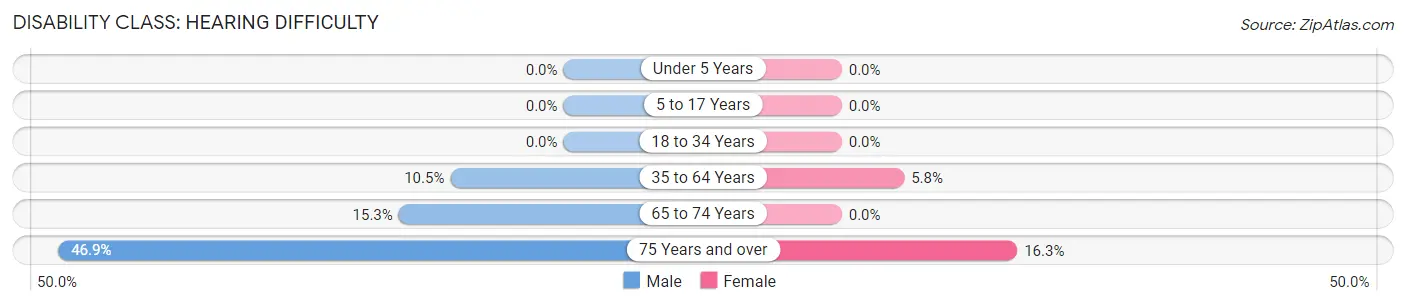
| Age Bracket | Male | Female |
| Under 5 Years | 0 (0.0%) | 0 (0.0%) |
| 5 to 17 Years | 0 (0.0%) | 0 (0.0%) |
| 18 to 34 Years | 0 (0.0%) | 0 (0.0%) |
| 35 to 64 Years | 25 (10.5%) | 18 (5.8%) |
| 65 to 74 Years | 24 (15.3%) | 0 (0.0%) |
| 75 Years and over | 90 (46.9%) | 21 (16.3%) |
Disability Class: Vision Difficulty
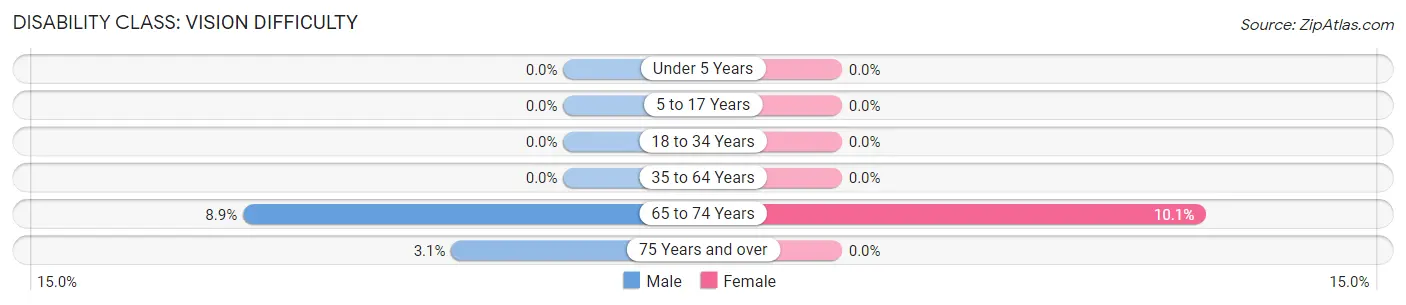
| Age Bracket | Male | Female |
| Under 5 Years | 0 (0.0%) | 0 (0.0%) |
| 5 to 17 Years | 0 (0.0%) | 0 (0.0%) |
| 18 to 34 Years | 0 (0.0%) | 0 (0.0%) |
| 35 to 64 Years | 0 (0.0%) | 0 (0.0%) |
| 65 to 74 Years | 14 (8.9%) | 7 (10.1%) |
| 75 Years and over | 6 (3.1%) | 0 (0.0%) |
Disability Class: Cognitive Difficulty
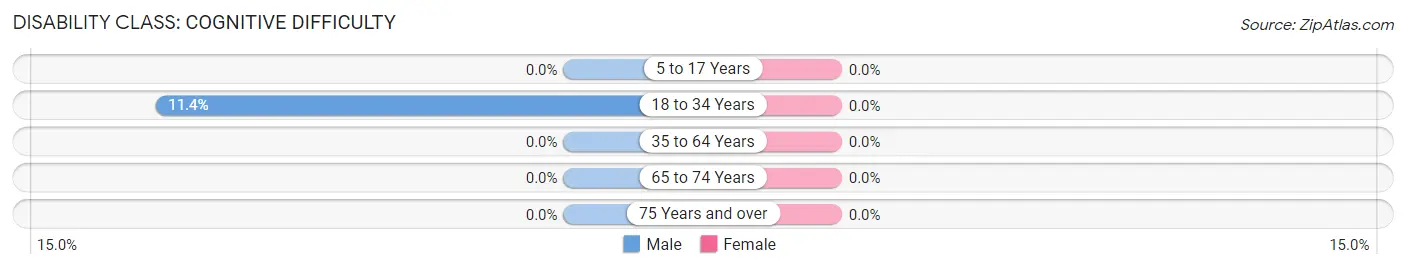
| Age Bracket | Male | Female |
| 5 to 17 Years | 0 (0.0%) | 0 (0.0%) |
| 18 to 34 Years | 5 (11.4%) | 0 (0.0%) |
| 35 to 64 Years | 0 (0.0%) | 0 (0.0%) |
| 65 to 74 Years | 0 (0.0%) | 0 (0.0%) |
| 75 Years and over | 0 (0.0%) | 0 (0.0%) |
Disability Class: Ambulatory Difficulty
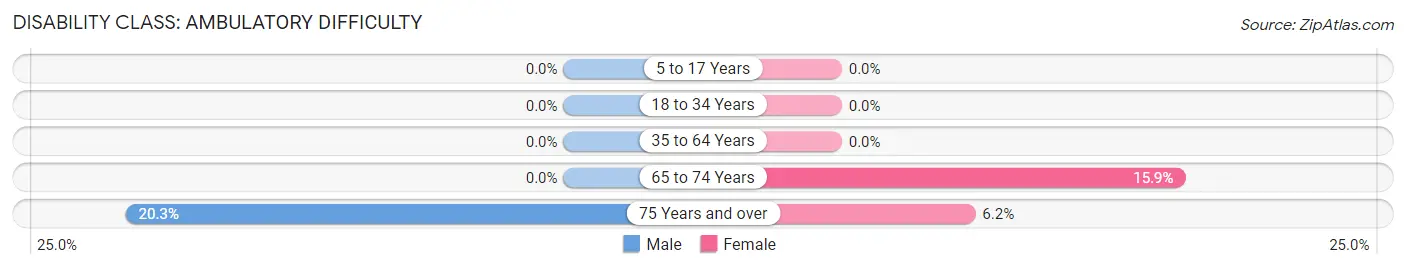
| Age Bracket | Male | Female |
| 5 to 17 Years | 0 (0.0%) | 0 (0.0%) |
| 18 to 34 Years | 0 (0.0%) | 0 (0.0%) |
| 35 to 64 Years | 0 (0.0%) | 0 (0.0%) |
| 65 to 74 Years | 0 (0.0%) | 11 (15.9%) |
| 75 Years and over | 39 (20.3%) | 8 (6.2%) |
Disability Class: Self-Care Difficulty
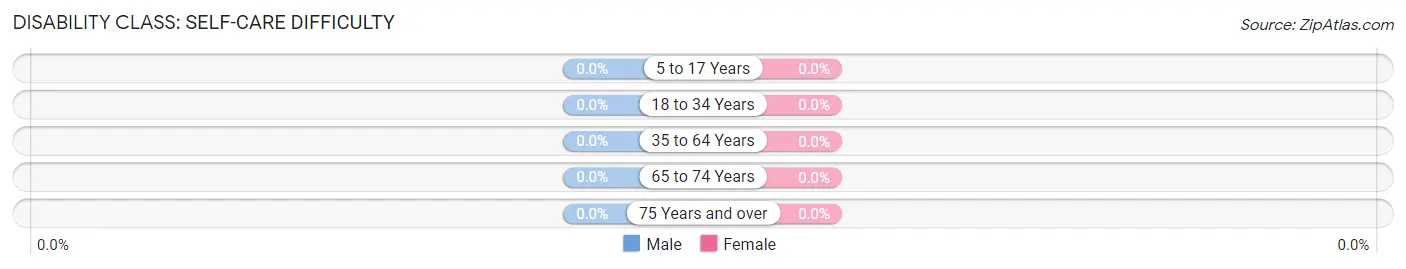
| Age Bracket | Male | Female |
| 5 to 17 Years | 0 (0.0%) | 0 (0.0%) |
| 18 to 34 Years | 0 (0.0%) | 0 (0.0%) |
| 35 to 64 Years | 0 (0.0%) | 0 (0.0%) |
| 65 to 74 Years | 0 (0.0%) | 0 (0.0%) |
| 75 Years and over | 0 (0.0%) | 0 (0.0%) |
Technology Access in Kennebunkport
Computing Device Access in Kennebunkport
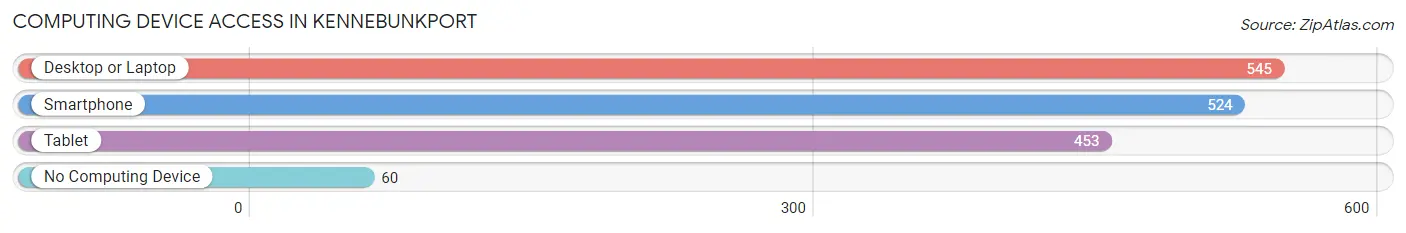
| Device Type | # Households | % Households |
| Desktop or Laptop | 545 | 86.8% |
| Smartphone | 524 | 83.4% |
| Tablet | 453 | 72.1% |
| No Computing Device | 60 | 9.6% |
| Total | 628 | 100.0% |
Internet Access in Kennebunkport
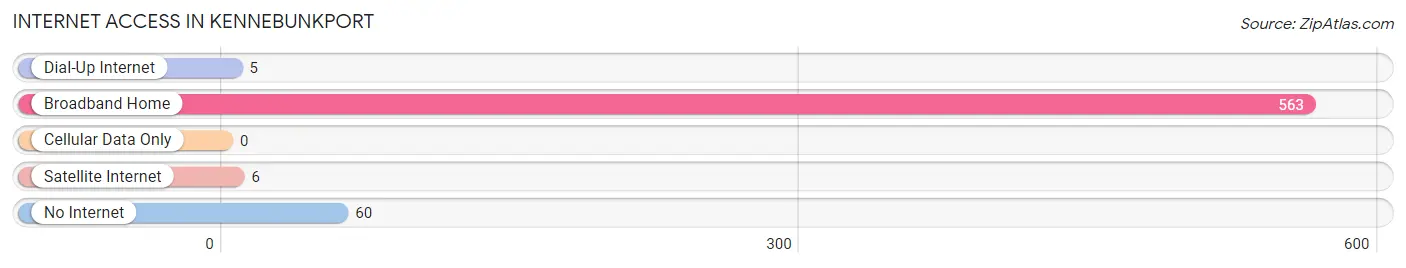
| Internet Type | # Households | % Households |
| Dial-Up Internet | 5 | 0.8% |
| Broadband Home | 563 | 89.6% |
| Cellular Data Only | 0 | 0.0% |
| Satellite Internet | 6 | 1.0% |
| No Internet | 60 | 9.6% |
| Total | 628 | 100.0% |
Kennebunkport Summary
Kennebunkport is a town located in York County, Maine, United States. It is situated along the Atlantic Ocean, approximately 25 miles south of Portland. The town is a popular tourist destination, known for its picturesque harbor, sandy beaches, and historic sites. As of the 2010 census, the town had a population of 3,474.
History
Kennebunkport was first settled in 1653 by English colonists. The town was originally part of the town of Wells, but was incorporated as a separate town in 1820. The town was named after the Kennebunk River, which flows through the area.
The town was a major shipbuilding center in the 19th century, and was home to several prominent shipbuilders. The town was also a popular summer destination for wealthy families from Boston and New York.
Geography
Kennebunkport is located at 43°20'N 70°32'W (43.33, -70.53). According to the United States Census Bureau, the town has a total area of 24.2 square miles, of which, 19.2 square miles is land and 5.0 square miles is water.
The town is situated along the Atlantic Ocean, and is bordered by the towns of Wells to the north, Arundel to the east, and Kennebunk to the south. The Kennebunk River flows through the town, and empties into the Atlantic Ocean.
Economy
Kennebunkport is a popular tourist destination, and the town's economy is largely based on tourism. The town is home to several resorts, hotels, and restaurants, as well as numerous shops and galleries. The town is also home to several marinas, which provide services to recreational boaters.
The town is also home to several manufacturing companies, including a boatbuilding company, a furniture manufacturer, and a seafood processing plant.
Demographics
As of the 2010 census, there were 3,474 people, 1,541 households, and 990 families residing in the town. The population density was 181.2 people per square mile. There were 1,845 housing units at an average density of 95.9 per square mile. The racial makeup of the town was 97.3% White, 0.7% African American, 0.2% Native American, 0.6% Asian, 0.1% Pacific Islander, 0.3% from other races, and 0.9% from two or more races. Hispanic or Latino of any race were 1.2% of the population.
There were 1,541 households, out of which 24.2% had children under the age of 18 living with them, 53.2% were married couples living together, 8.2% had a female householder with no husband present, and 35.2% were non-families. 29.2% of all households were made up of individuals, and 13.2% had someone living alone who was 65 years of age or older. The average household size was 2.25 and the average family size was 2.77.
In the town, the population was spread out, with 20.2% under the age of 18, 5.2% from 18 to 24, 24.2% from 25 to 44, 32.2% from 45 to 64, and 18.2% who were 65 years of age or older. The median age was 45 years. For every 100 females, there were 92.2 males. For every 100 females age 18 and over, there were 89.2 males.
The median income for a household in the town was $50,938, and the median income for a family was $62,917. Males had a median income of $45,000 versus $31,250 for females. The per capita income for the town was $30,945. About 4.2% of families and 6.7% of the population were below the poverty line, including 8.2% of those under age 18 and 5.2% of those age 65 or over.
Common Questions
What is Per Capita Income in Kennebunkport?
Per Capita income in Kennebunkport is $96,341.
What is the Median Family Income in Kennebunkport?
Median Family Income in Kennebunkport is $114,904.
What is the Median Household income in Kennebunkport?
Median Household Income in Kennebunkport is $113,456.
What is Income or Wage Gap in Kennebunkport?
Income or Wage Gap in Kennebunkport is 48.0%.
Women in Kennebunkport earn 52.0 cents for every dollar earned by a man.
What is Inequality or Gini Index in Kennebunkport?
Inequality or Gini Index in Kennebunkport is 0.59.
What is the Total Population of Kennebunkport?
Total Population of Kennebunkport is 1,318.
What is the Total Male Population of Kennebunkport?
Total Male Population of Kennebunkport is 688.
What is the Total Female Population of Kennebunkport?
Total Female Population of Kennebunkport is 630.
What is the Ratio of Males per 100 Females in Kennebunkport?
There are 109.21 Males per 100 Females in Kennebunkport.
What is the Ratio of Females per 100 Males in Kennebunkport?
There are 91.57 Females per 100 Males in Kennebunkport.
What is the Median Population Age in Kennebunkport?
Median Population Age in Kennebunkport is 61.3 Years.
What is the Average Family Size in Kennebunkport
Average Family Size in Kennebunkport is 2.6 People.
What is the Average Household Size in Kennebunkport
Average Household Size in Kennebunkport is 2.1 People.
How Large is the Labor Force in Kennebunkport?
There are 565 People in the Labor Forcein in Kennebunkport.
What is the Percentage of People in the Labor Force in Kennebunkport?
47.5% of People are in the Labor Force in Kennebunkport.
What is the Unemployment Rate in Kennebunkport?
Unemployment Rate in Kennebunkport is 8.1%.