East Millinocket, ME Map & Demographics
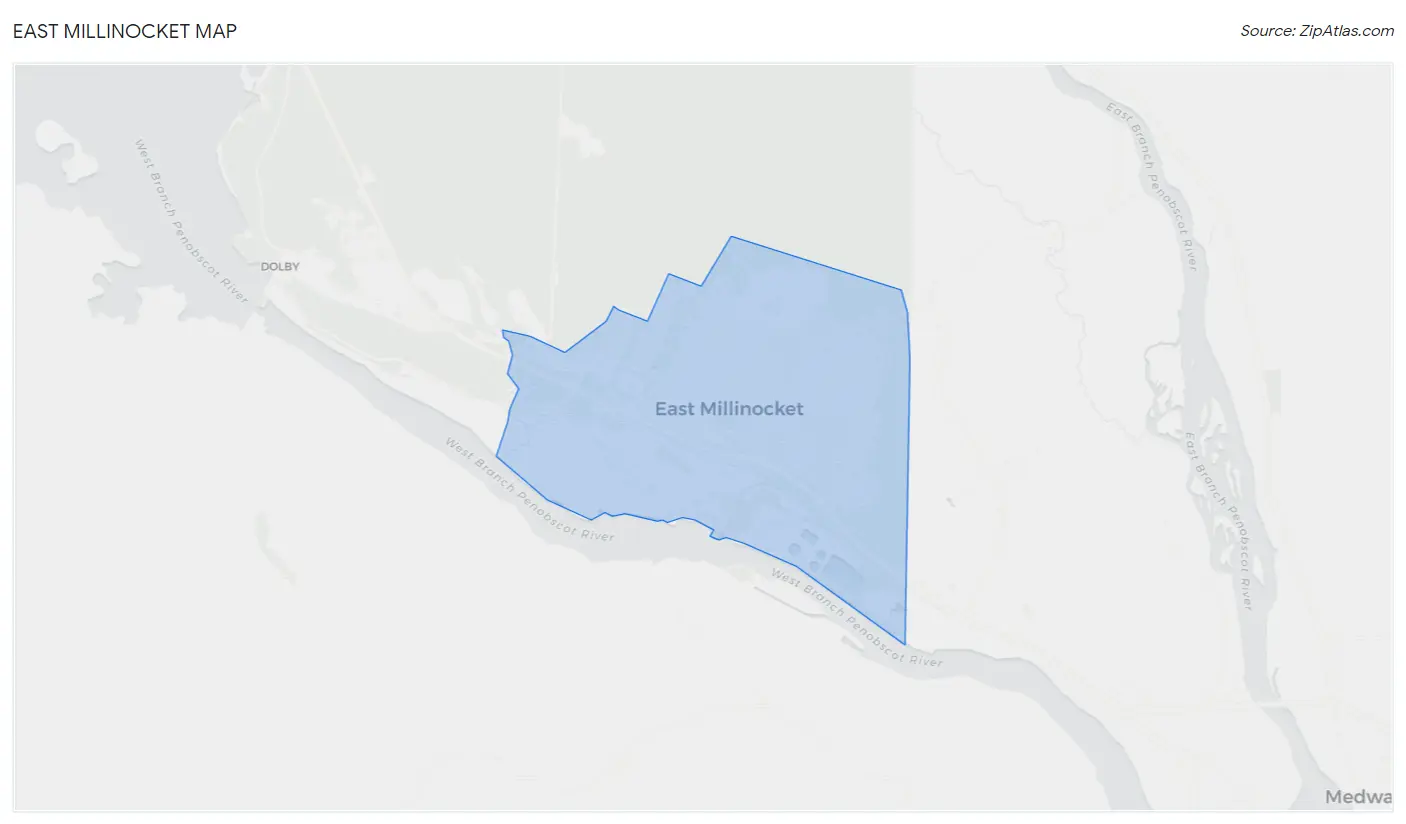
East Millinocket Map
East Millinocket Overview
$28,103
PER CAPITA INCOME
$66,083
AVG FAMILY INCOME
$44,531
AVG HOUSEHOLD INCOME
1.2%
WAGE / INCOME GAP [ % ]
98.8¢/ $1
WAGE / INCOME GAP [ $ ]
$17,972
FAMILY INCOME DEFICIT
0.46
INEQUALITY / GINI INDEX
1,541
TOTAL POPULATION
733
MALE POPULATION
808
FEMALE POPULATION
90.72
MALES / 100 FEMALES
110.23
FEMALES / 100 MALES
45.9
MEDIAN AGE
2.6
AVG FAMILY SIZE
2.2
AVG HOUSEHOLD SIZE
632
LABOR FORCE [ PEOPLE ]
48.5%
PERCENT IN LABOR FORCE
5.2%
UNEMPLOYMENT RATE
East Millinocket Zip Codes
East Millinocket Area Codes
Income in East Millinocket
Income Overview in East Millinocket
Per Capita Income in East Millinocket is $28,103, while median incomes of families and households are $66,083 and $44,531 respectively.
| Characteristic | Number | Measure |
| Per Capita Income | 1,541 | $28,103 |
| Median Family Income | 420 | $66,083 |
| Mean Family Income | 420 | $75,332 |
| Median Household Income | 695 | $44,531 |
| Mean Household Income | 695 | $59,423 |
| Income Deficit | 420 | $17,972 |
| Wage / Income Gap (%) | 1,541 | 1.22% |
| Wage / Income Gap ($) | 1,541 | 98.78¢ per $1 |
| Gini / Inequality Index | 1,541 | 0.46 |
Earnings by Sex in East Millinocket
Average Earnings in East Millinocket are $38,352, $38,622 for men and $38,149 for women, a difference of 1.2%.
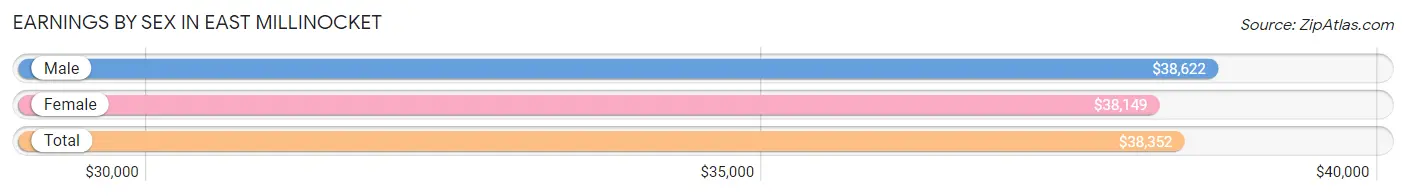
| Sex | Number | Average Earnings |
| Male | 357 (53.9%) | $38,622 |
| Female | 305 (46.1%) | $38,149 |
| Total | 662 (100.0%) | $38,352 |
Earnings by Sex by Income Bracket in East Millinocket
The most common earnings brackets in East Millinocket are $45,000 to $49,999 for men (62 | 17.4%) and $35,000 to $39,999 for women (52 | 17.1%).
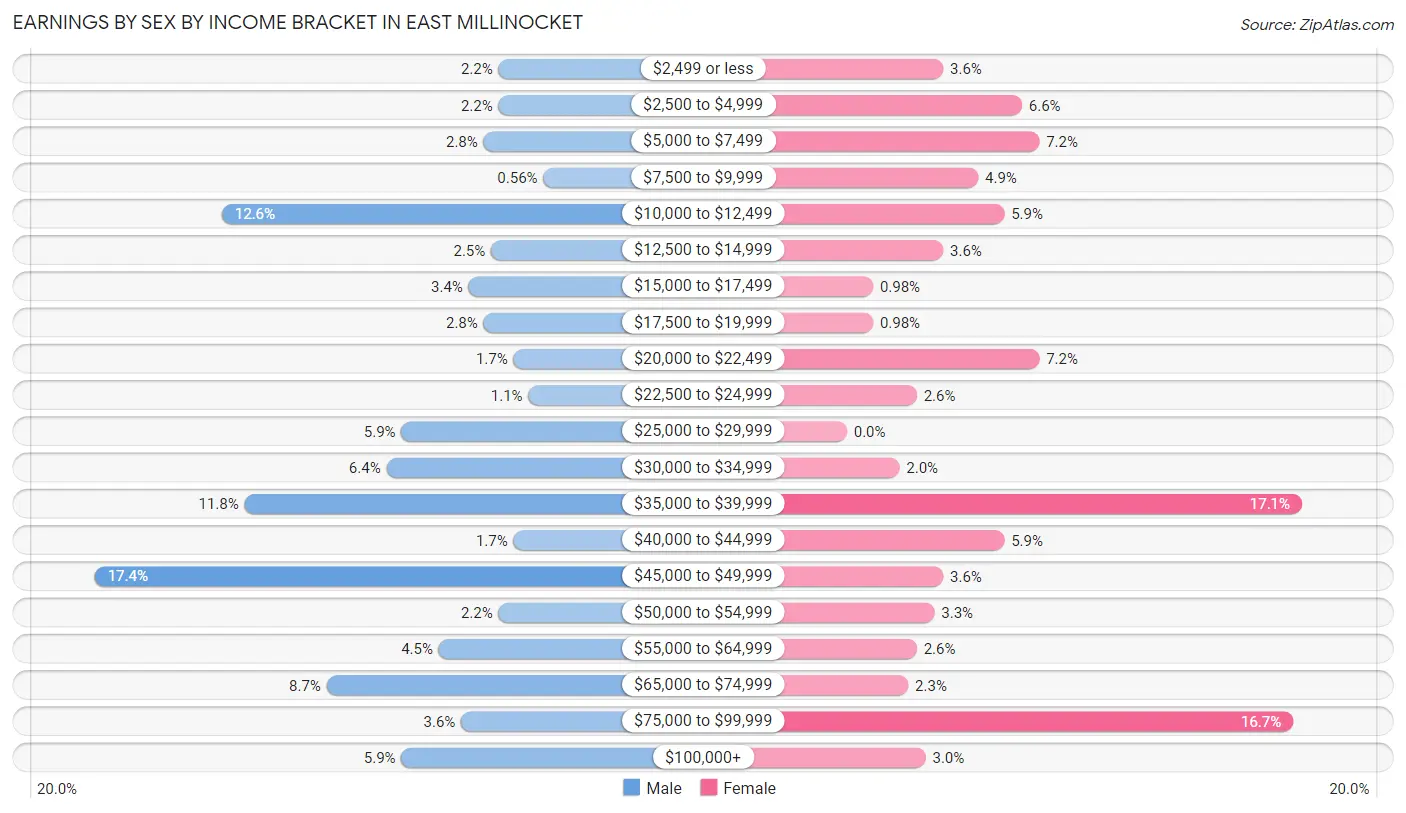
| Income | Male | Female |
| $2,499 or less | 8 (2.2%) | 11 (3.6%) |
| $2,500 to $4,999 | 8 (2.2%) | 20 (6.6%) |
| $5,000 to $7,499 | 10 (2.8%) | 22 (7.2%) |
| $7,500 to $9,999 | 2 (0.6%) | 15 (4.9%) |
| $10,000 to $12,499 | 45 (12.6%) | 18 (5.9%) |
| $12,500 to $14,999 | 9 (2.5%) | 11 (3.6%) |
| $15,000 to $17,499 | 12 (3.4%) | 3 (1.0%) |
| $17,500 to $19,999 | 10 (2.8%) | 3 (1.0%) |
| $20,000 to $22,499 | 6 (1.7%) | 22 (7.2%) |
| $22,500 to $24,999 | 4 (1.1%) | 8 (2.6%) |
| $25,000 to $29,999 | 21 (5.9%) | 0 (0.0%) |
| $30,000 to $34,999 | 23 (6.4%) | 6 (2.0%) |
| $35,000 to $39,999 | 42 (11.8%) | 52 (17.1%) |
| $40,000 to $44,999 | 6 (1.7%) | 18 (5.9%) |
| $45,000 to $49,999 | 62 (17.4%) | 11 (3.6%) |
| $50,000 to $54,999 | 8 (2.2%) | 10 (3.3%) |
| $55,000 to $64,999 | 16 (4.5%) | 8 (2.6%) |
| $65,000 to $74,999 | 31 (8.7%) | 7 (2.3%) |
| $75,000 to $99,999 | 13 (3.6%) | 51 (16.7%) |
| $100,000+ | 21 (5.9%) | 9 (2.9%) |
| Total | 357 (100.0%) | 305 (100.0%) |
Earnings by Sex by Educational Attainment in East Millinocket
Average earnings in East Millinocket are $45,101 for men and $38,582 for women, a difference of 14.4%. Men with an educational attainment of college or associate's degree enjoy the highest average annual earnings of $45,967, while those with bachelor's degree education earn the least with $28,382. Women with an educational attainment of bachelor's degree earn the most with the average annual earnings of $55,000, while those with college or associate's degree education have the smallest earnings of $37,538.
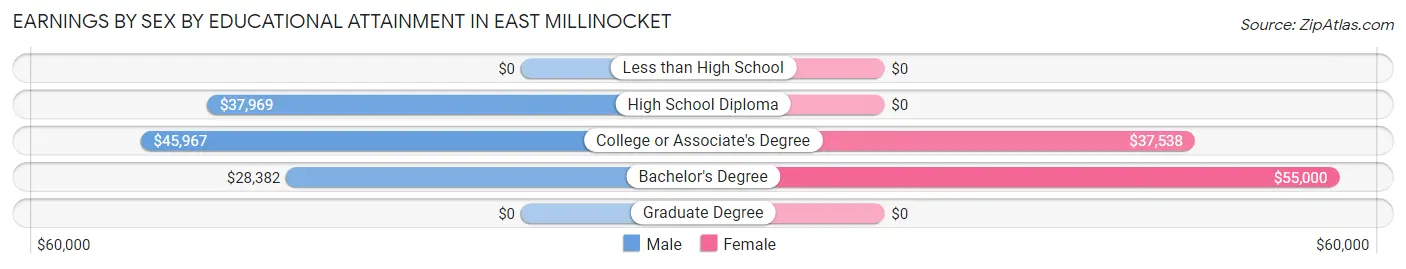
| Educational Attainment | Male Income | Female Income |
| Less than High School | - | - |
| High School Diploma | $37,969 | $0 |
| College or Associate's Degree | $45,967 | $37,538 |
| Bachelor's Degree | $28,382 | $55,000 |
| Graduate Degree | - | - |
| Total | $45,101 | $38,582 |
Family Income in East Millinocket
Family Income Brackets in East Millinocket
According to the East Millinocket family income data, there are 125 families falling into the $75,000 to $99,999 income range, which is the most common income bracket and makes up 29.8% of all families. Conversely, the $150,000 to $199,999 income bracket is the least frequent group with only 2 families (0.5%) belonging to this category.
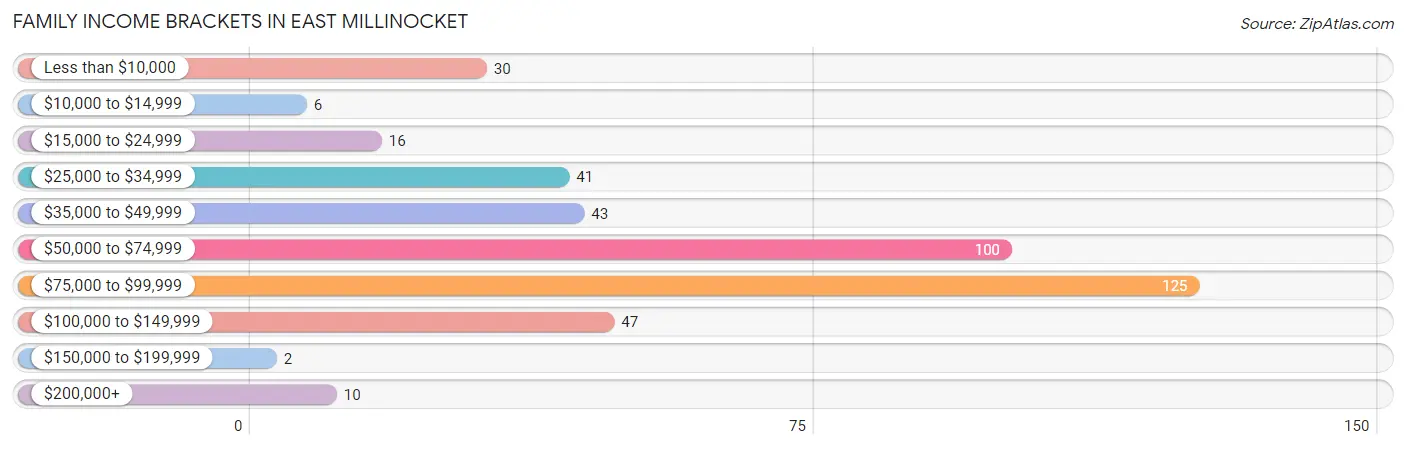
| Income Bracket | # Families | % Families |
| Less than $10,000 | 30 | 7.1% |
| $10,000 to $14,999 | 6 | 1.4% |
| $15,000 to $24,999 | 16 | 3.8% |
| $25,000 to $34,999 | 41 | 9.8% |
| $35,000 to $49,999 | 43 | 10.2% |
| $50,000 to $74,999 | 100 | 23.8% |
| $75,000 to $99,999 | 125 | 29.8% |
| $100,000 to $149,999 | 47 | 11.2% |
| $150,000 to $199,999 | 2 | 0.5% |
| $200,000+ | 10 | 2.4% |
Family Income by Famaliy Size in East Millinocket
4-person families (41 | 9.8%) account for the highest median family income in East Millinocket with $77,321 per family, while 2-person families (261 | 62.1%) have the highest median income of $32,838 per family member.
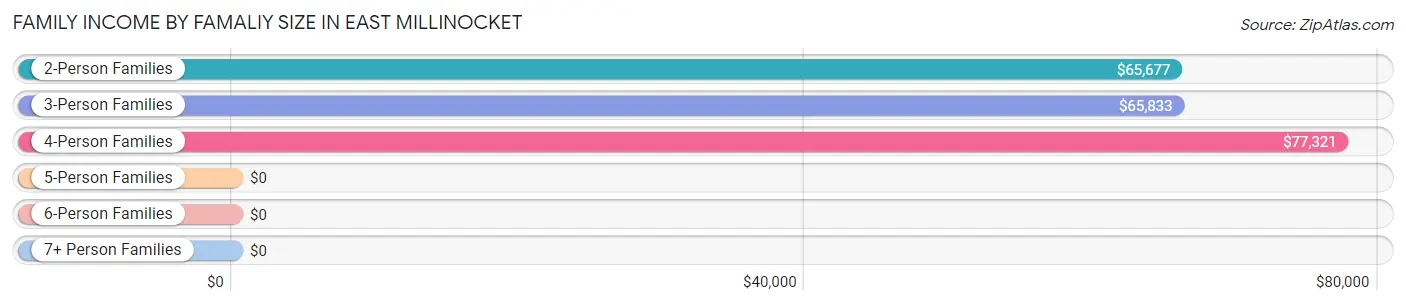
| Income Bracket | # Families | Median Income |
| 2-Person Families | 261 (62.1%) | $65,677 |
| 3-Person Families | 110 (26.2%) | $65,833 |
| 4-Person Families | 41 (9.8%) | $77,321 |
| 5-Person Families | 0 (0.0%) | $0 |
| 6-Person Families | 8 (1.9%) | $0 |
| 7+ Person Families | 0 (0.0%) | $0 |
| Total | 420 (100.0%) | $66,083 |
Family Income by Number of Earners in East Millinocket
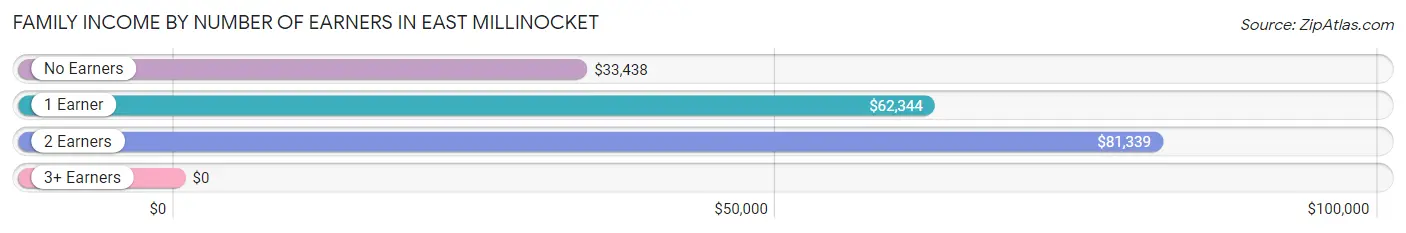
| Number of Earners | # Families | Median Income |
| No Earners | 103 (24.5%) | $33,438 |
| 1 Earner | 144 (34.3%) | $62,344 |
| 2 Earners | 159 (37.9%) | $81,339 |
| 3+ Earners | 14 (3.3%) | $0 |
| Total | 420 (100.0%) | $66,083 |
Household Income in East Millinocket
Household Income Brackets in East Millinocket
With 120 households falling in the category, the $75,000 to $99,999 income range is the most frequent in East Millinocket, accounting for 17.3% of all households. In contrast, only 2 households (0.3%) fall into the $150,000 to $199,999 income bracket, making it the least populous group.
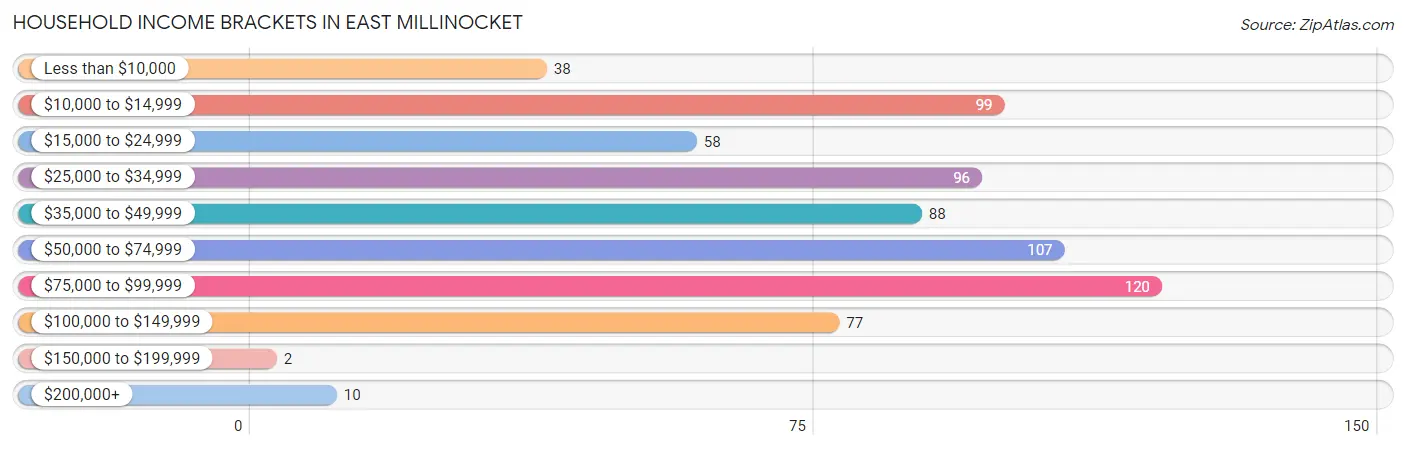
| Income Bracket | # Households | % Households |
| Less than $10,000 | 38 | 5.5% |
| $10,000 to $14,999 | 99 | 14.2% |
| $15,000 to $24,999 | 58 | 8.3% |
| $25,000 to $34,999 | 96 | 13.8% |
| $35,000 to $49,999 | 88 | 12.7% |
| $50,000 to $74,999 | 107 | 15.4% |
| $75,000 to $99,999 | 120 | 17.3% |
| $100,000 to $149,999 | 77 | 11.1% |
| $150,000 to $199,999 | 2 | 0.3% |
| $200,000+ | 10 | 1.4% |
Household Income by Householder Age in East Millinocket
The median household income in East Millinocket is $44,531, with the highest median household income of $65,987 found in the 25 to 44 years age bracket for the primary householder. A total of 185 households (26.6%) fall into this category. Meanwhile, the 15 to 24 years age bracket for the primary householder has the lowest median household income of $0, with 4 households (0.6%) in this group.
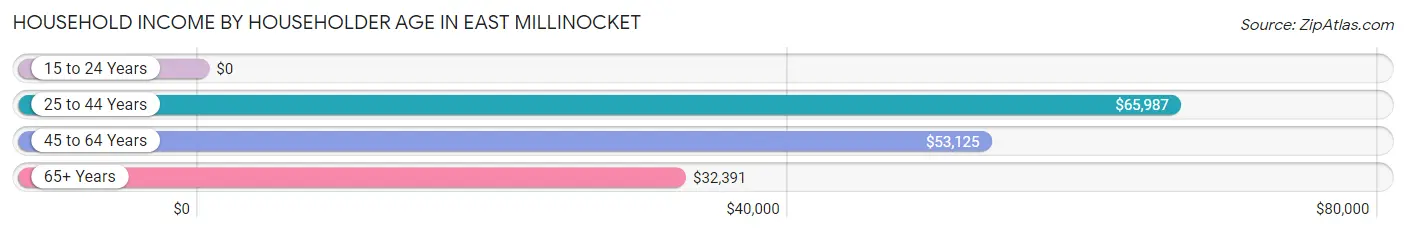
| Income Bracket | # Households | Median Income |
| 15 to 24 Years | 4 (0.6%) | $0 |
| 25 to 44 Years | 185 (26.6%) | $65,987 |
| 45 to 64 Years | 260 (37.4%) | $53,125 |
| 65+ Years | 246 (35.4%) | $32,391 |
| Total | 695 (100.0%) | $44,531 |
Poverty in East Millinocket
Income Below Poverty by Sex and Age in East Millinocket
With 16.2% poverty level for males and 17.9% for females among the residents of East Millinocket, 12 to 14 year old males and 25 to 34 year old females are the most vulnerable to poverty, with 21 males (70.0%) and 28 females (35.9%) in their respective age groups living below the poverty level.
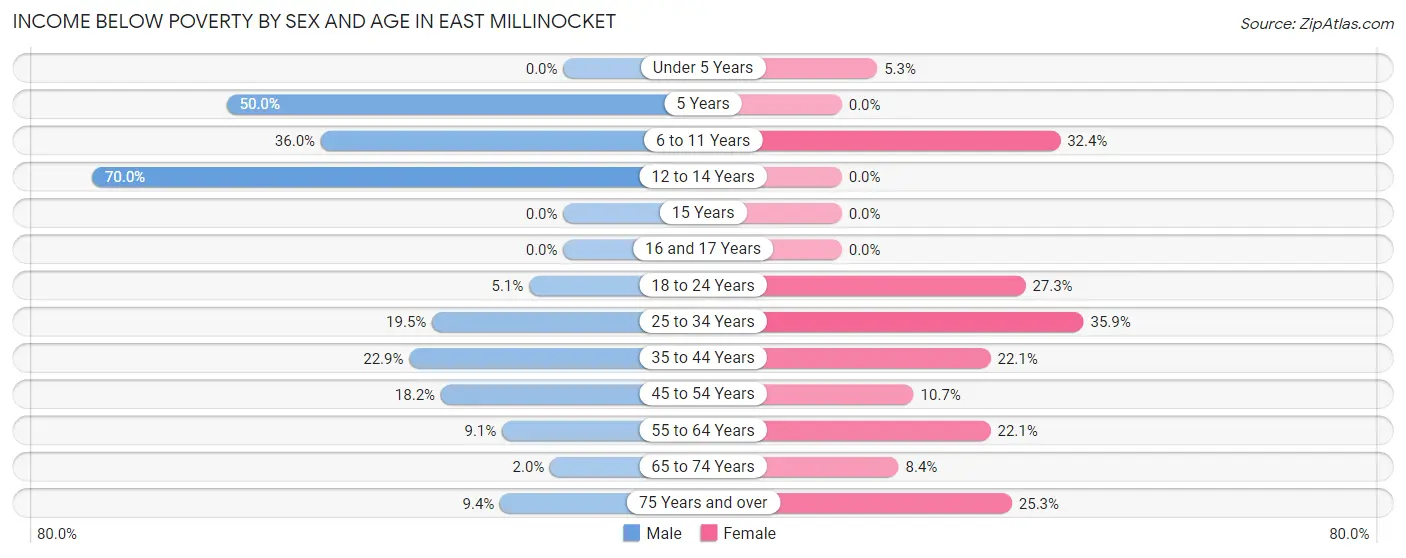
| Age Bracket | Male | Female |
| Under 5 Years | 0 (0.0%) | 2 (5.3%) |
| 5 Years | 3 (50.0%) | 0 (0.0%) |
| 6 to 11 Years | 18 (36.0%) | 12 (32.4%) |
| 12 to 14 Years | 21 (70.0%) | 0 (0.0%) |
| 15 Years | 0 (0.0%) | 0 (0.0%) |
| 16 and 17 Years | 0 (0.0%) | 0 (0.0%) |
| 18 to 24 Years | 3 (5.1%) | 3 (27.3%) |
| 25 to 34 Years | 15 (19.5%) | 28 (35.9%) |
| 35 to 44 Years | 27 (22.9%) | 19 (22.1%) |
| 45 to 54 Years | 12 (18.2%) | 8 (10.7%) |
| 55 to 64 Years | 11 (9.1%) | 38 (22.1%) |
| 65 to 74 Years | 2 (2.0%) | 7 (8.4%) |
| 75 Years and over | 6 (9.4%) | 25 (25.3%) |
| Total | 118 (16.2%) | 142 (17.9%) |
Income Above Poverty by Sex and Age in East Millinocket
According to the poverty statistics in East Millinocket, males aged under 5 years and females aged 12 to 14 years are the age groups that are most secure financially, with 100.0% of males and 100.0% of females in these age groups living above the poverty line.
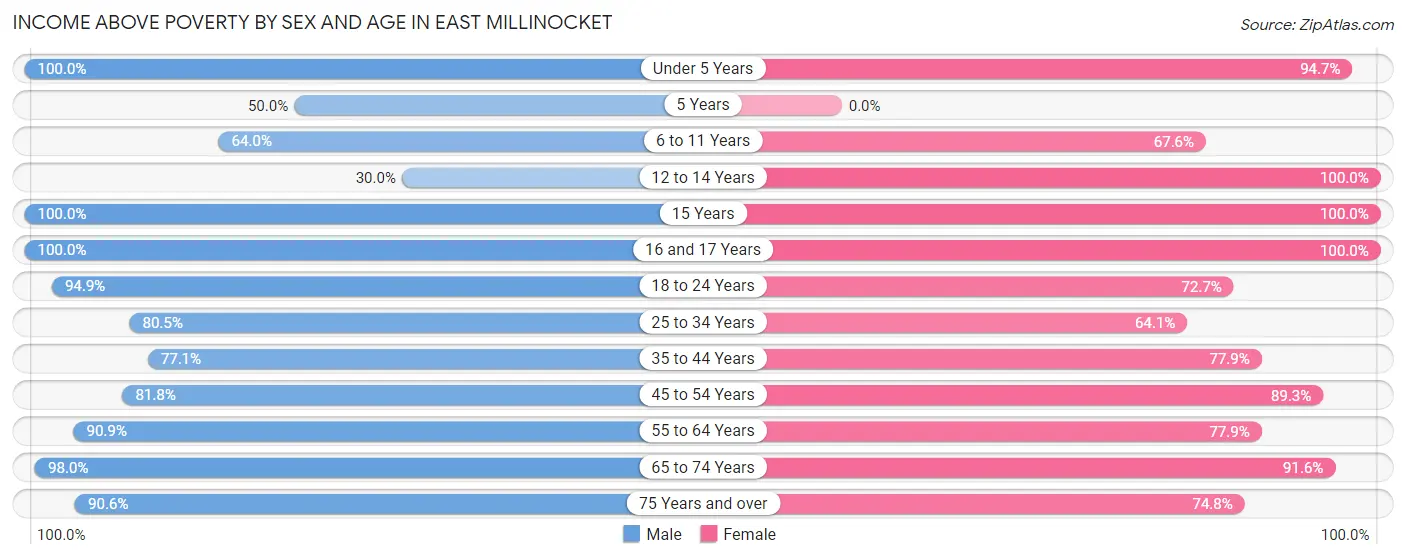
| Age Bracket | Male | Female |
| Under 5 Years | 16 (100.0%) | 36 (94.7%) |
| 5 Years | 3 (50.0%) | 0 (0.0%) |
| 6 to 11 Years | 32 (64.0%) | 25 (67.6%) |
| 12 to 14 Years | 9 (30.0%) | 22 (100.0%) |
| 15 Years | 11 (100.0%) | 4 (100.0%) |
| 16 and 17 Years | 7 (100.0%) | 86 (100.0%) |
| 18 to 24 Years | 56 (94.9%) | 8 (72.7%) |
| 25 to 34 Years | 62 (80.5%) | 50 (64.1%) |
| 35 to 44 Years | 91 (77.1%) | 67 (77.9%) |
| 45 to 54 Years | 54 (81.8%) | 67 (89.3%) |
| 55 to 64 Years | 110 (90.9%) | 134 (77.9%) |
| 65 to 74 Years | 100 (98.0%) | 76 (91.6%) |
| 75 Years and over | 58 (90.6%) | 74 (74.8%) |
| Total | 609 (83.8%) | 649 (82.1%) |
Income Below Poverty Among Married-Couple Families in East Millinocket
The poverty statistics for married-couple families in East Millinocket show that 7.2% or 21 of the total 291 families live below the poverty line. Families with 3 or 4 children have the highest poverty rate of 75.0%, comprising of 6 families. On the other hand, families with 1 or 2 children have the lowest poverty rate of 3.5%, which includes 2 families.
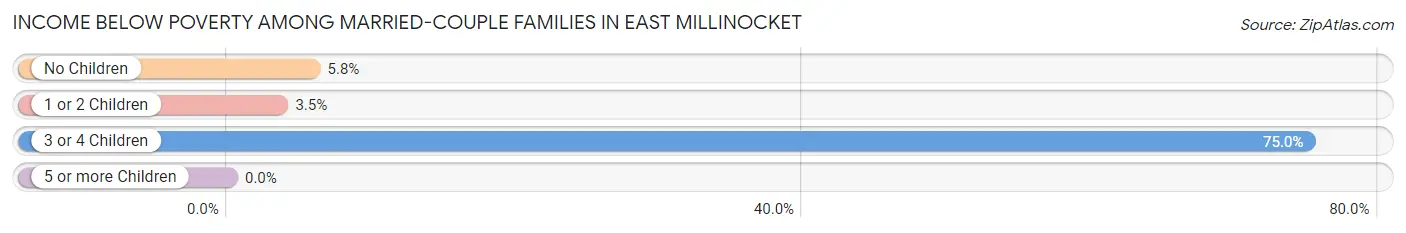
| Children | Above Poverty | Below Poverty |
| No Children | 213 (94.3%) | 13 (5.8%) |
| 1 or 2 Children | 55 (96.5%) | 2 (3.5%) |
| 3 or 4 Children | 2 (25.0%) | 6 (75.0%) |
| 5 or more Children | 0 (0.0%) | 0 (0.0%) |
| Total | 270 (92.8%) | 21 (7.2%) |
Income Below Poverty Among Single-Parent Households in East Millinocket
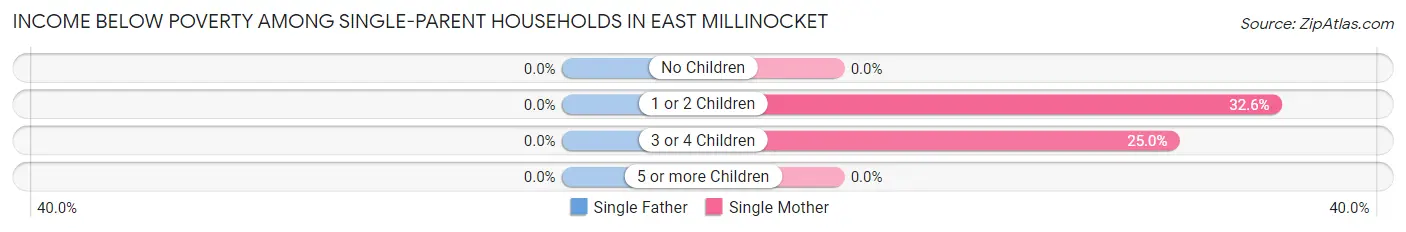
| Children | Single Father | Single Mother |
| No Children | 0 (0.0%) | 0 (0.0%) |
| 1 or 2 Children | 0 (0.0%) | 15 (32.6%) |
| 3 or 4 Children | 0 (0.0%) | 3 (25.0%) |
| 5 or more Children | 0 (0.0%) | 0 (0.0%) |
| Total | 0 (0.0%) | 18 (24.3%) |
Income Below Poverty Among Married-Couple vs Single-Parent Households in East Millinocket
The poverty data for East Millinocket shows that 21 of the married-couple family households (7.2%) and 18 of the single-parent households (14.0%) are living below the poverty level. Within the married-couple family households, those with 3 or 4 children have the highest poverty rate, with 6 households (75.0%) falling below the poverty line. Among the single-parent households, those with 3 or 4 children have the highest poverty rate, with 3 household (25.0%) living below poverty.
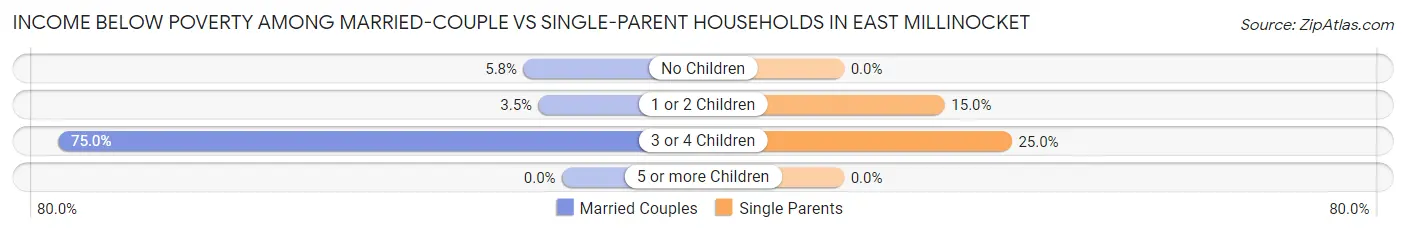
| Children | Married-Couple Families | Single-Parent Households |
| No Children | 13 (5.8%) | 0 (0.0%) |
| 1 or 2 Children | 2 (3.5%) | 15 (15.0%) |
| 3 or 4 Children | 6 (75.0%) | 3 (25.0%) |
| 5 or more Children | 0 (0.0%) | 0 (0.0%) |
| Total | 21 (7.2%) | 18 (14.0%) |
Race in East Millinocket
The most populous races in East Millinocket are White / Caucasian (1,526 | 99.0%), Hispanic or Latino (27 | 1.8%), and Two or more Races (14 | 0.9%).
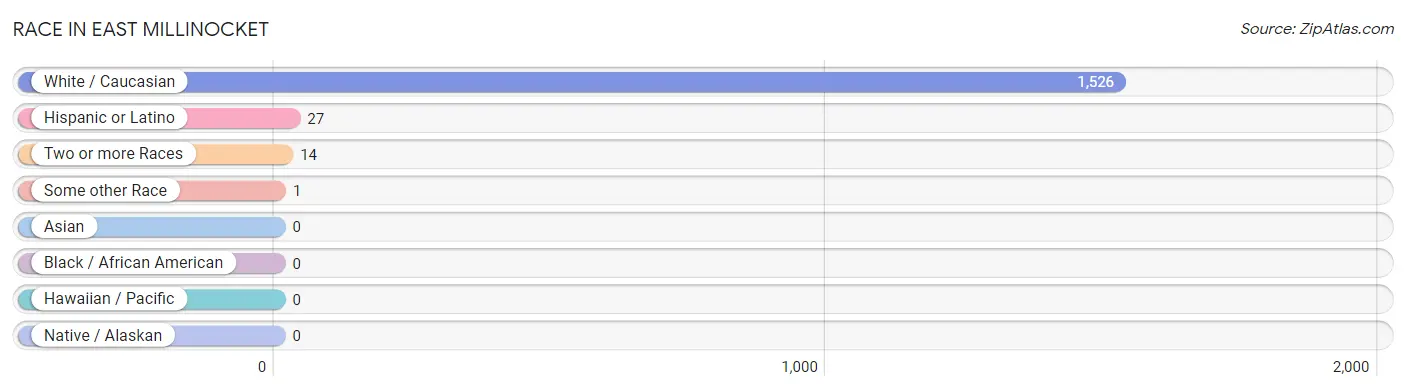
| Race | # Population | % Population |
| Asian | 0 | 0.0% |
| Black / African American | 0 | 0.0% |
| Hawaiian / Pacific | 0 | 0.0% |
| Hispanic or Latino | 27 | 1.8% |
| Native / Alaskan | 0 | 0.0% |
| White / Caucasian | 1,526 | 99.0% |
| Two or more Races | 14 | 0.9% |
| Some other Race | 1 | 0.1% |
| Total | 1,541 | 100.0% |
Ancestry in East Millinocket
The most populous ancestries reported in East Millinocket are Irish (332 | 21.5%), American (294 | 19.1%), English (251 | 16.3%), French (246 | 16.0%), and German (69 | 4.5%), together accounting for 77.3% of all East Millinocket residents.
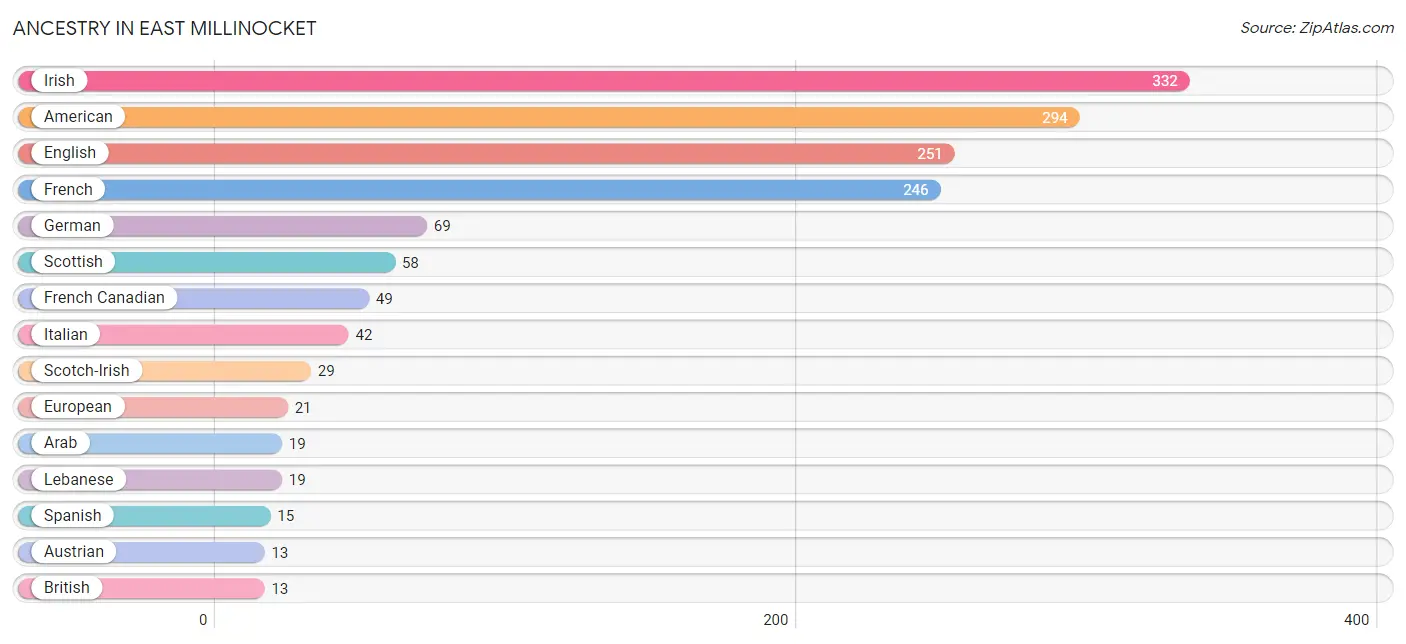
| Ancestry | # Population | % Population |
| American | 294 | 19.1% |
| Arab | 19 | 1.2% |
| Austrian | 13 | 0.8% |
| British | 13 | 0.8% |
| Canadian | 12 | 0.8% |
| Danish | 5 | 0.3% |
| Dutch | 4 | 0.3% |
| English | 251 | 16.3% |
| European | 21 | 1.4% |
| Finnish | 10 | 0.6% |
| French | 246 | 16.0% |
| French Canadian | 49 | 3.2% |
| German | 69 | 4.5% |
| Irish | 332 | 21.5% |
| Italian | 42 | 2.7% |
| Lebanese | 19 | 1.2% |
| Lithuanian | 4 | 0.3% |
| Norwegian | 6 | 0.4% |
| Polish | 10 | 0.6% |
| Puerto Rican | 12 | 0.8% |
| Russian | 6 | 0.4% |
| Scotch-Irish | 29 | 1.9% |
| Scottish | 58 | 3.8% |
| Spanish | 15 | 1.0% |
| Swedish | 6 | 0.4% |
| Turkish | 4 | 0.3% |
| Ukrainian | 3 | 0.2% | View All 27 Rows |
Immigrants in East Millinocket
The most numerous immigrant groups reported in East Millinocket came from Canada (7 | 0.4%), Europe (5 | 0.3%), Germany (5 | 0.3%), and Western Europe (5 | 0.3%), together accounting for 1.4% of all East Millinocket residents.
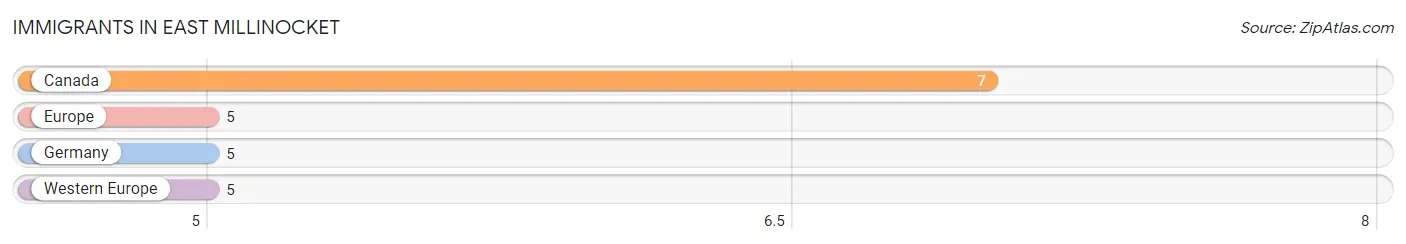
| Immigration Origin | # Population | % Population |
| Canada | 7 | 0.4% |
| Europe | 5 | 0.3% |
| Germany | 5 | 0.3% |
| Western Europe | 5 | 0.3% | View All 4 Rows |
Sex and Age in East Millinocket
Sex and Age in East Millinocket
The most populous age groups in East Millinocket are 40 to 44 Years (99 | 13.5%) for men and 60 to 64 Years (116 | 14.4%) for women.
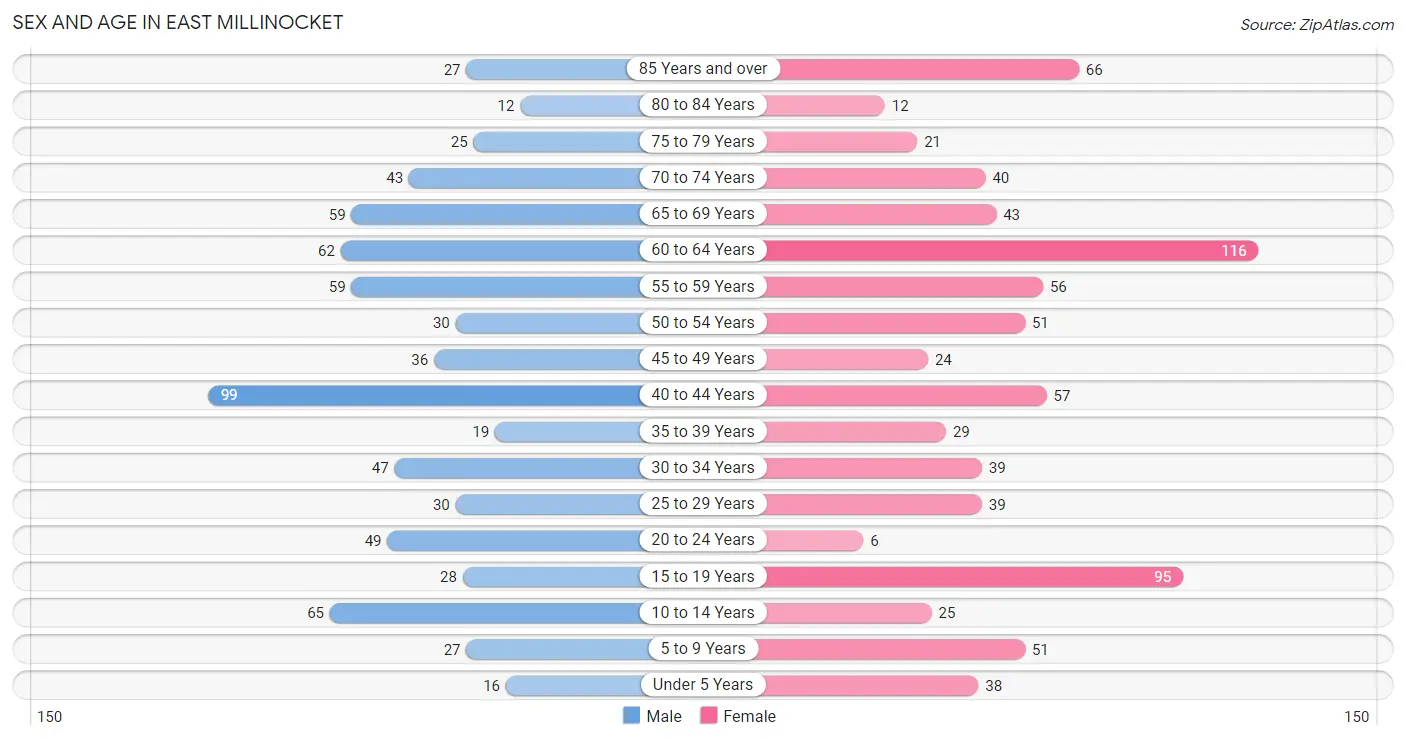
| Age Bracket | Male | Female |
| Under 5 Years | 16 (2.2%) | 38 (4.7%) |
| 5 to 9 Years | 27 (3.7%) | 51 (6.3%) |
| 10 to 14 Years | 65 (8.9%) | 25 (3.1%) |
| 15 to 19 Years | 28 (3.8%) | 95 (11.8%) |
| 20 to 24 Years | 49 (6.7%) | 6 (0.7%) |
| 25 to 29 Years | 30 (4.1%) | 39 (4.8%) |
| 30 to 34 Years | 47 (6.4%) | 39 (4.8%) |
| 35 to 39 Years | 19 (2.6%) | 29 (3.6%) |
| 40 to 44 Years | 99 (13.5%) | 57 (7.0%) |
| 45 to 49 Years | 36 (4.9%) | 24 (3.0%) |
| 50 to 54 Years | 30 (4.1%) | 51 (6.3%) |
| 55 to 59 Years | 59 (8.1%) | 56 (6.9%) |
| 60 to 64 Years | 62 (8.5%) | 116 (14.4%) |
| 65 to 69 Years | 59 (8.1%) | 43 (5.3%) |
| 70 to 74 Years | 43 (5.9%) | 40 (5.0%) |
| 75 to 79 Years | 25 (3.4%) | 21 (2.6%) |
| 80 to 84 Years | 12 (1.6%) | 12 (1.5%) |
| 85 Years and over | 27 (3.7%) | 66 (8.2%) |
| Total | 733 (100.0%) | 808 (100.0%) |
Families and Households in East Millinocket
Median Family Size in East Millinocket
The median family size in East Millinocket is 2.64 persons per family, with single female/mother families (74 | 17.6%) accounting for the largest median family size of 3.42 persons per family. On the other hand, single male/father families (55 | 13.1%) represent the smallest median family size with 2.45 persons per family.
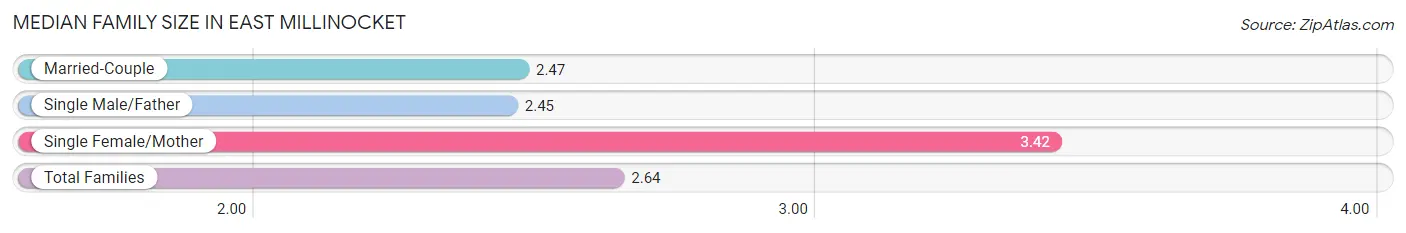
| Family Type | # Families | Family Size |
| Married-Couple | 291 (69.3%) | 2.47 |
| Single Male/Father | 55 (13.1%) | 2.45 |
| Single Female/Mother | 74 (17.6%) | 3.42 |
| Total Families | 420 (100.0%) | 2.64 |
Median Household Size in East Millinocket
The median household size in East Millinocket is 2.19 persons per household, with single female/mother households (74 | 10.6%) accounting for the largest median household size of 4.26 persons per household. non-family households (275 | 39.6%) represent the smallest median household size with 1.12 persons per household.
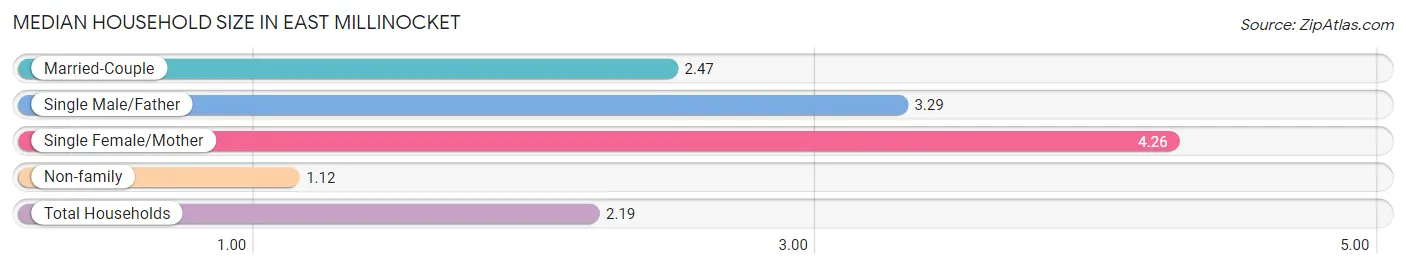
| Household Type | # Households | Household Size |
| Married-Couple | 291 (41.9%) | 2.47 |
| Single Male/Father | 55 (7.9%) | 3.29 |
| Single Female/Mother | 74 (10.6%) | 4.26 |
| Non-family | 275 (39.6%) | 1.12 |
| Total Households | 695 (100.0%) | 2.19 |
Household Size by Marriage Status in East Millinocket
Out of a total of 695 households in East Millinocket, 420 (60.4%) are family households, while 275 (39.6%) are nonfamily households. The most numerous type of family households are 2-person households, comprising 238, and the most common type of nonfamily households are 1-person households, comprising 240.
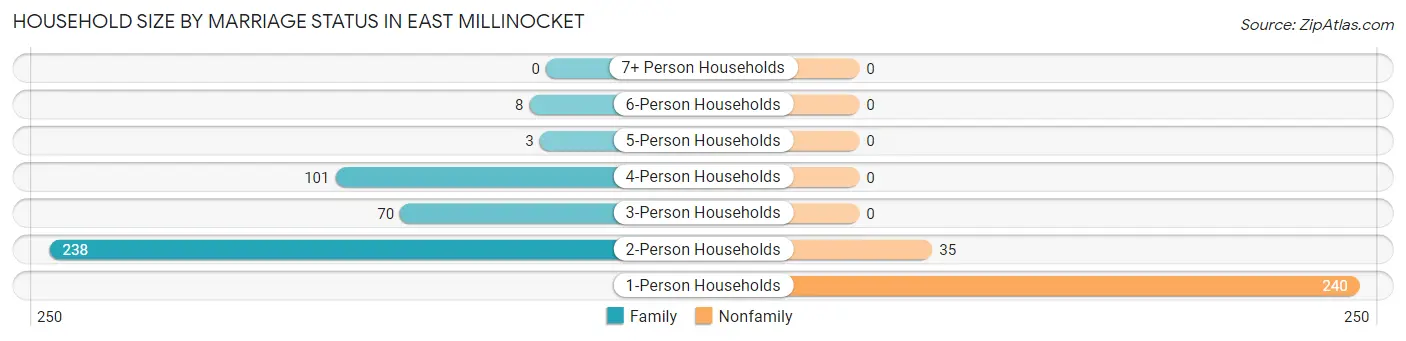
| Household Size | Family Households | Nonfamily Households |
| 1-Person Households | - | 240 (34.5%) |
| 2-Person Households | 238 (34.2%) | 35 (5.0%) |
| 3-Person Households | 70 (10.1%) | 0 (0.0%) |
| 4-Person Households | 101 (14.5%) | 0 (0.0%) |
| 5-Person Households | 3 (0.4%) | 0 (0.0%) |
| 6-Person Households | 8 (1.1%) | 0 (0.0%) |
| 7+ Person Households | 0 (0.0%) | 0 (0.0%) |
| Total | 420 (60.4%) | 275 (39.6%) |
Female Fertility in East Millinocket
Fertility by Age in East Millinocket
Average fertility rate in East Millinocket is 102.0 births per 1,000 women. Women in the age bracket of 20 to 34 years have the highest fertility rate with 369.0 births per 1,000 women. Women in the age bracket of 20 to 34 years acount for 100.0% of all women with births.
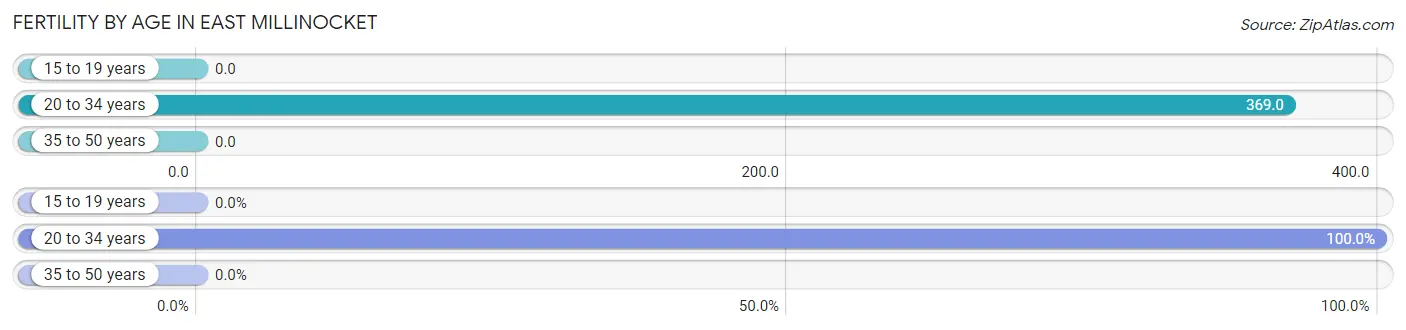
| Age Bracket | Women with Births | Births / 1,000 Women |
| 15 to 19 years | 0 (0.0%) | 0.0 |
| 20 to 34 years | 31 (100.0%) | 369.0 |
| 35 to 50 years | 0 (0.0%) | 0.0 |
| Total | 31 (100.0%) | 102.0 |
Fertility by Age by Marriage Status in East Millinocket
38.7% of women with births (31) in East Millinocket are married. The highest percentage of unmarried women with births falls into 20 to 34 years age bracket with 61.3% of them unmarried at the time of birth, while the lowest percentage of unmarried women with births belong to 20 to 34 years age bracket with 61.3% of them unmarried.
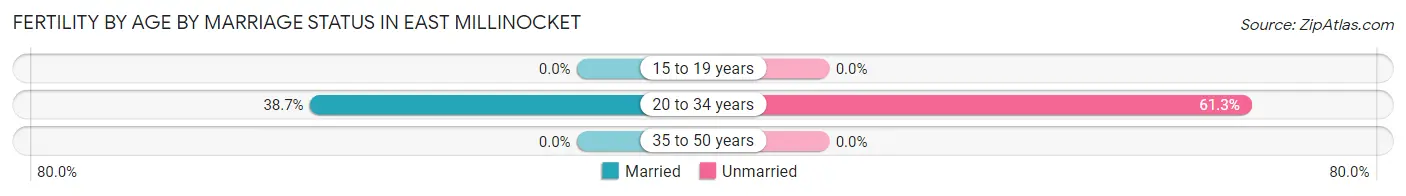
| Age Bracket | Married | Unmarried |
| 15 to 19 years | 0 (0.0%) | 0 (0.0%) |
| 20 to 34 years | 12 (38.7%) | 19 (61.3%) |
| 35 to 50 years | 0 (0.0%) | 0 (0.0%) |
| Total | 12 (38.7%) | 19 (61.3%) |
Fertility by Education in East Millinocket
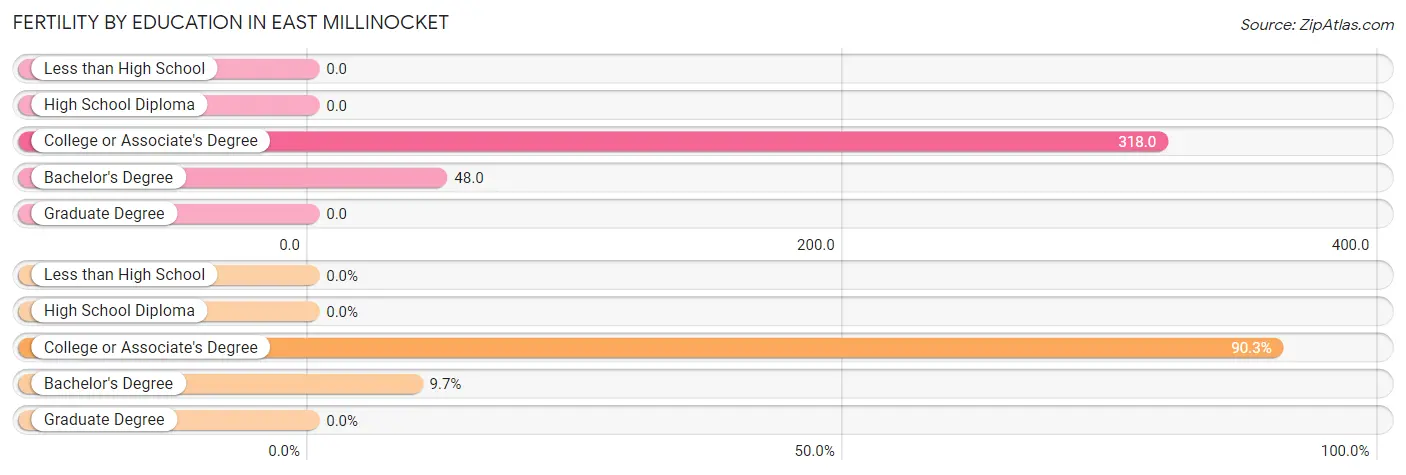
| Educational Attainment | Women with Births | Births / 1,000 Women |
| Less than High School | 0 (0.0%) | 0.0 |
| High School Diploma | 0 (0.0%) | 0.0 |
| College or Associate's Degree | 28 (90.3%) | 318.0 |
| Bachelor's Degree | 3 (9.7%) | 48.0 |
| Graduate Degree | 0 (0.0%) | 0.0 |
| Total | 31 (100.0%) | 102.0 |
Fertility by Education by Marriage Status in East Millinocket
61.3% of women with births in East Millinocket are unmarried. Women with the educational attainment of bachelor's degree are most likely to be married with 100.0% of them married at childbirth, while women with the educational attainment of college or associate's degree are least likely to be married with 67.9% of them unmarried at childbirth.
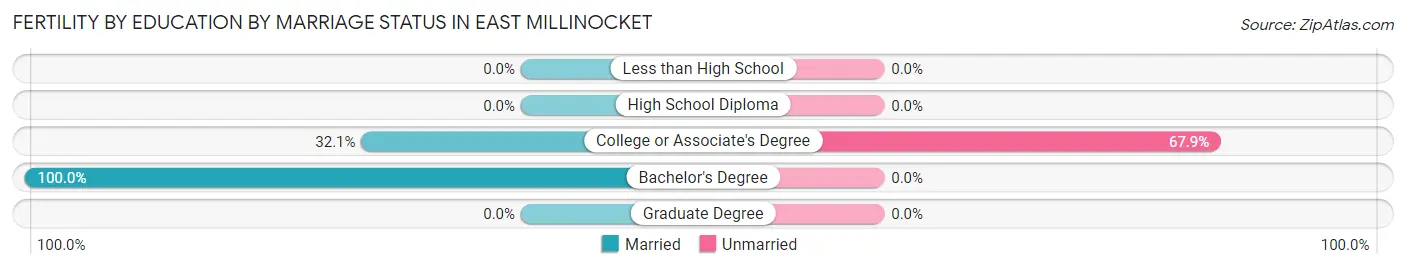
| Educational Attainment | Married | Unmarried |
| Less than High School | 0 (0.0%) | 0 (0.0%) |
| High School Diploma | 0 (0.0%) | 0 (0.0%) |
| College or Associate's Degree | 9 (32.1%) | 19 (67.9%) |
| Bachelor's Degree | 3 (100.0%) | 0 (0.0%) |
| Graduate Degree | 0 (0.0%) | 0 (0.0%) |
| Total | 12 (38.7%) | 19 (61.3%) |
Employment Characteristics in East Millinocket
Employment by Class of Employer in East Millinocket
Among the 567 employed individuals in East Millinocket, private company employees (303 | 53.4%), not-for-profit organizations (128 | 22.6%), and local government employees (60 | 10.6%) make up the most common classes of employment.
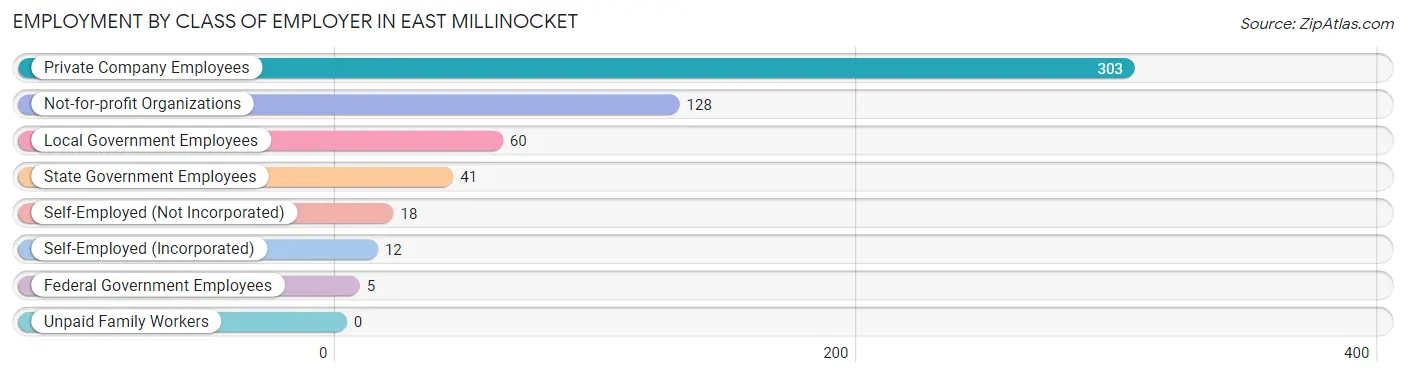
| Employer Class | # Employees | % Employees |
| Private Company Employees | 303 | 53.4% |
| Self-Employed (Incorporated) | 12 | 2.1% |
| Self-Employed (Not Incorporated) | 18 | 3.2% |
| Not-for-profit Organizations | 128 | 22.6% |
| Local Government Employees | 60 | 10.6% |
| State Government Employees | 41 | 7.2% |
| Federal Government Employees | 5 | 0.9% |
| Unpaid Family Workers | 0 | 0.0% |
| Total | 567 | 100.0% |
Employment Status by Age in East Millinocket
According to the labor force statistics for East Millinocket, out of the total population over 16 years of age (1,304), 48.5% or 632 individuals are in the labor force, with 5.2% or 33 of them unemployed. The age group with the highest labor force participation rate is 20 to 24 years, with 100.0% or 55 individuals in the labor force. Within the labor force, the 16 to 19 years age range has the highest percentage of unemployed individuals, with 39.1% or 9 of them being unemployed.
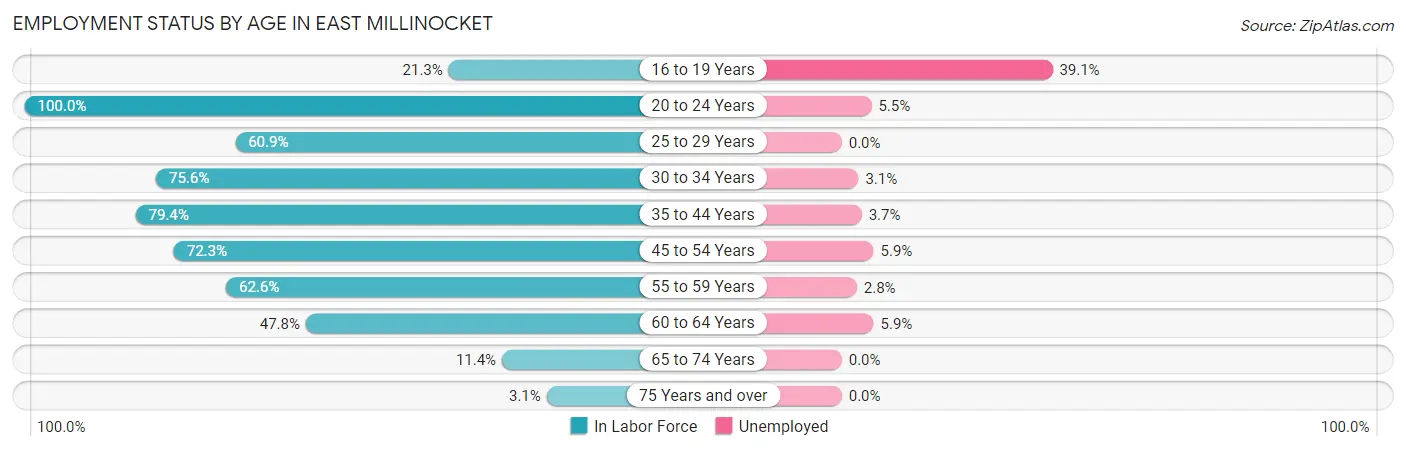
| Age Bracket | In Labor Force | Unemployed |
| 16 to 19 Years | 23 (21.3%) | 9 (39.1%) |
| 20 to 24 Years | 55 (100.0%) | 3 (5.5%) |
| 25 to 29 Years | 42 (60.9%) | 0 (0.0%) |
| 30 to 34 Years | 65 (75.6%) | 2 (3.1%) |
| 35 to 44 Years | 162 (79.4%) | 6 (3.7%) |
| 45 to 54 Years | 102 (72.3%) | 6 (5.9%) |
| 55 to 59 Years | 72 (62.6%) | 2 (2.8%) |
| 60 to 64 Years | 85 (47.8%) | 5 (5.9%) |
| 65 to 74 Years | 21 (11.4%) | 0 (0.0%) |
| 75 Years and over | 5 (3.1%) | 0 (0.0%) |
| Total | 632 (48.5%) | 33 (5.2%) |
Employment Status by Educational Attainment in East Millinocket
According to labor force statistics for East Millinocket, 66.6% of individuals (528) out of the total population between 25 and 64 years of age (793) are in the labor force, with 4.0% or 21 of them being unemployed. The group with the highest labor force participation rate are those with the educational attainment of bachelor's degree or higher, with 86.2% or 162 individuals in the labor force. Within the labor force, individuals with high school diploma education have the highest percentage of unemployment, with 16.7% or 14 of them being unemployed.
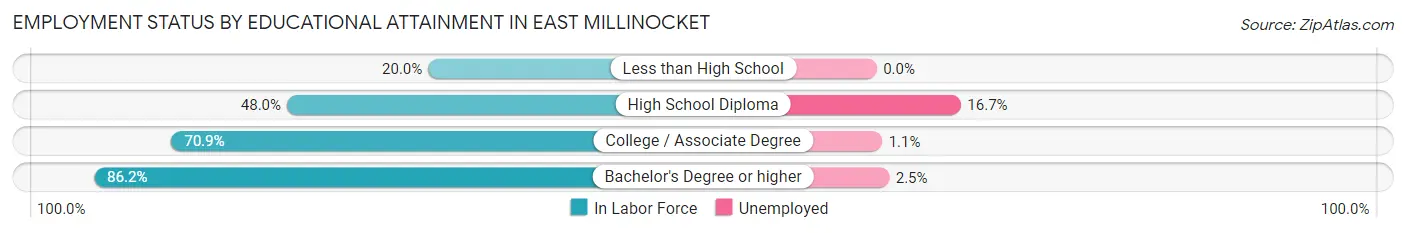
| Educational Attainment | In Labor Force | Unemployed |
| Less than High School | 9 (20.0%) | 0 (0.0%) |
| High School Diploma | 84 (48.0%) | 29 (16.7%) |
| College / Associate Degree | 273 (70.9%) | 4 (1.1%) |
| Bachelor's Degree or higher | 162 (86.2%) | 5 (2.5%) |
| Total | 528 (66.6%) | 32 (4.0%) |
Employment Occupations by Sex in East Millinocket
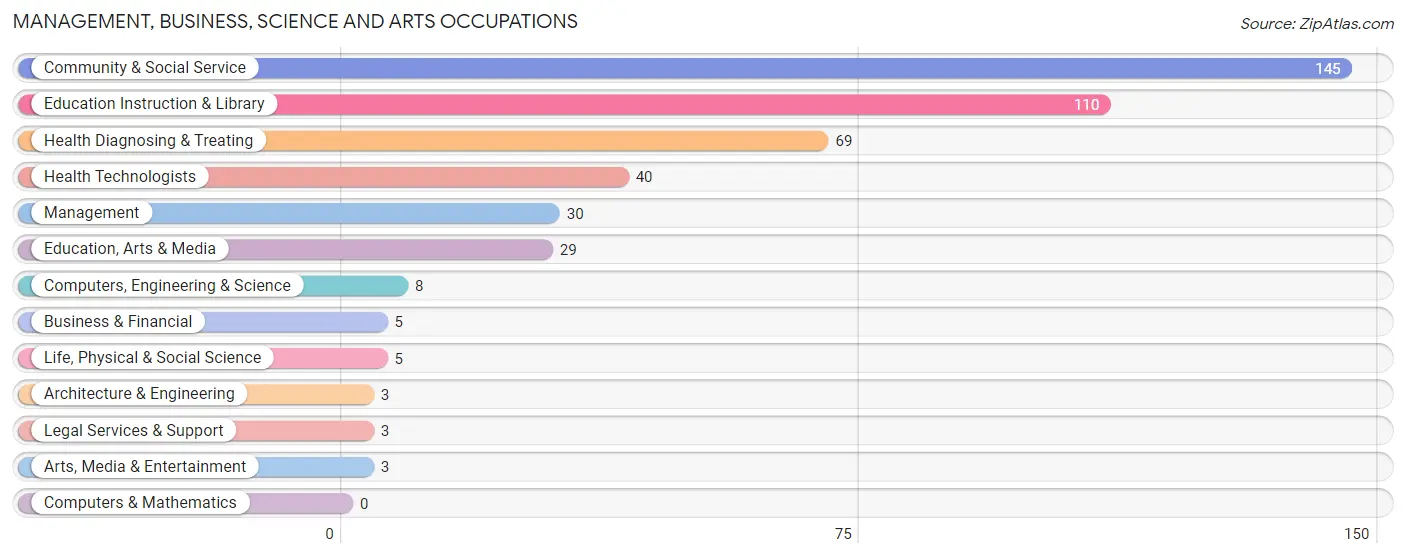
Management, Business, Science and Arts Occupations
The most common Management, Business, Science and Arts occupations in East Millinocket are Community & Social Service (145 | 24.2%), Education Instruction & Library (110 | 18.4%), Health Diagnosing & Treating (69 | 11.5%), Health Technologists (40 | 6.7%), and Management (30 | 5.0%).
Management, Business, Science and Arts Occupations by Sex
Within the Management, Business, Science and Arts occupations in East Millinocket, the most male-oriented occupations are Business & Financial (100.0%), Architecture & Engineering (100.0%), and Legal Services & Support (100.0%), while the most female-oriented occupations are Health Diagnosing & Treating (94.2%), Health Technologists (90.0%), and Management (60.0%).
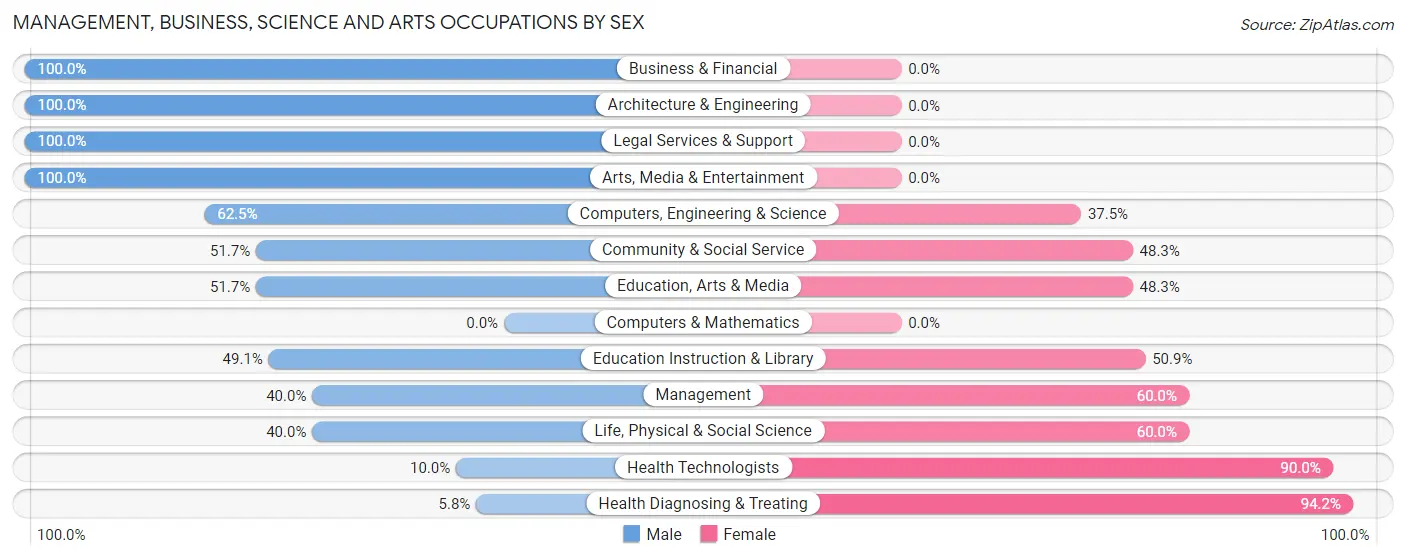
| Occupation | Male | Female |
| Management | 12 (40.0%) | 18 (60.0%) |
| Business & Financial | 5 (100.0%) | 0 (0.0%) |
| Computers, Engineering & Science | 5 (62.5%) | 3 (37.5%) |
| Computers & Mathematics | 0 (0.0%) | 0 (0.0%) |
| Architecture & Engineering | 3 (100.0%) | 0 (0.0%) |
| Life, Physical & Social Science | 2 (40.0%) | 3 (60.0%) |
| Community & Social Service | 75 (51.7%) | 70 (48.3%) |
| Education, Arts & Media | 15 (51.7%) | 14 (48.3%) |
| Legal Services & Support | 3 (100.0%) | 0 (0.0%) |
| Education Instruction & Library | 54 (49.1%) | 56 (50.9%) |
| Arts, Media & Entertainment | 3 (100.0%) | 0 (0.0%) |
| Health Diagnosing & Treating | 4 (5.8%) | 65 (94.2%) |
| Health Technologists | 4 (10.0%) | 36 (90.0%) |
| Total (Category) | 101 (39.3%) | 156 (60.7%) |
| Total (Overall) | 328 (54.8%) | 271 (45.2%) |
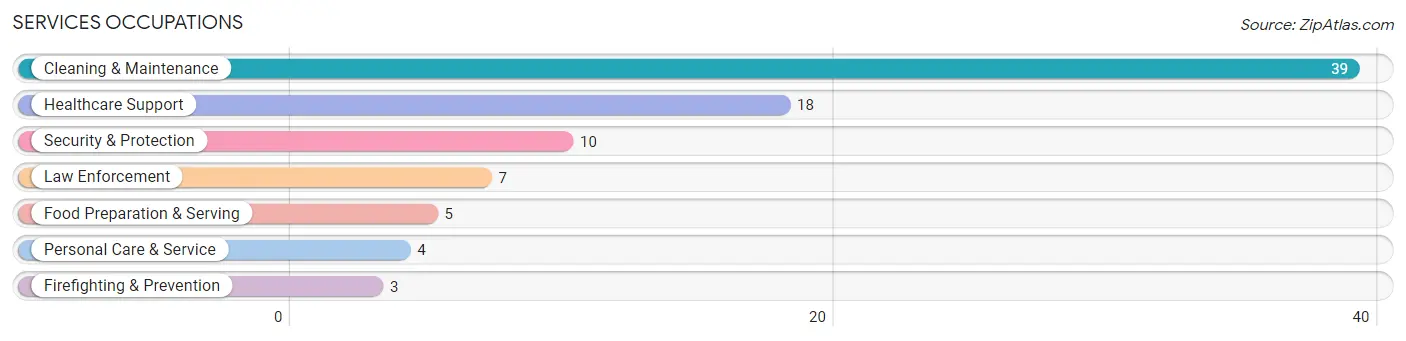
Services Occupations
The most common Services occupations in East Millinocket are Cleaning & Maintenance (39 | 6.5%), Healthcare Support (18 | 3.0%), Security & Protection (10 | 1.7%), Law Enforcement (7 | 1.2%), and Food Preparation & Serving (5 | 0.8%).
Services Occupations by Sex
Within the Services occupations in East Millinocket, the most male-oriented occupations are Security & Protection (100.0%), Firefighting & Prevention (100.0%), and Law Enforcement (100.0%), while the most female-oriented occupations are Personal Care & Service (100.0%), Healthcare Support (83.3%), and Food Preparation & Serving (60.0%).
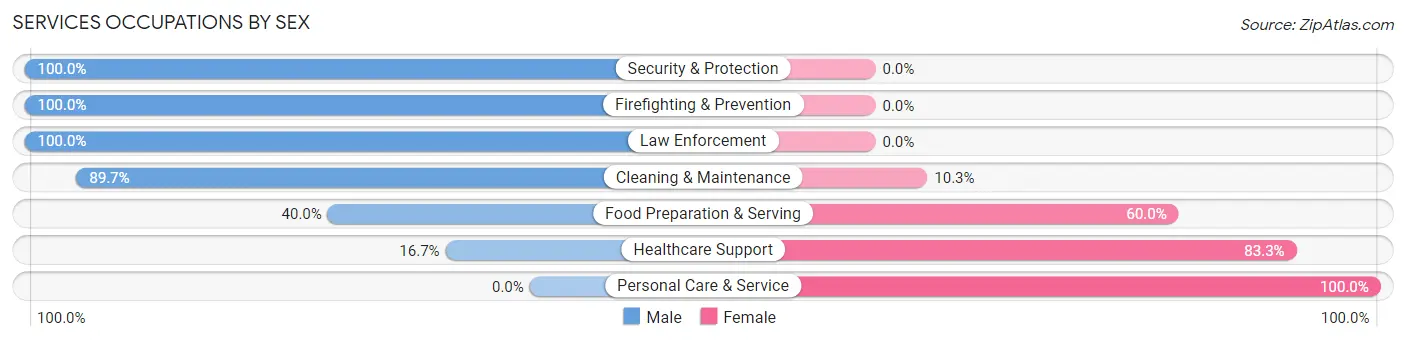
| Occupation | Male | Female |
| Healthcare Support | 3 (16.7%) | 15 (83.3%) |
| Security & Protection | 10 (100.0%) | 0 (0.0%) |
| Firefighting & Prevention | 3 (100.0%) | 0 (0.0%) |
| Law Enforcement | 7 (100.0%) | 0 (0.0%) |
| Food Preparation & Serving | 2 (40.0%) | 3 (60.0%) |
| Cleaning & Maintenance | 35 (89.7%) | 4 (10.3%) |
| Personal Care & Service | 0 (0.0%) | 4 (100.0%) |
| Total (Category) | 50 (65.8%) | 26 (34.2%) |
| Total (Overall) | 328 (54.8%) | 271 (45.2%) |
Sales and Office Occupations
The most common Sales and Office occupations in East Millinocket are Office & Administration (116 | 19.4%), and Sales & Related (56 | 9.3%).
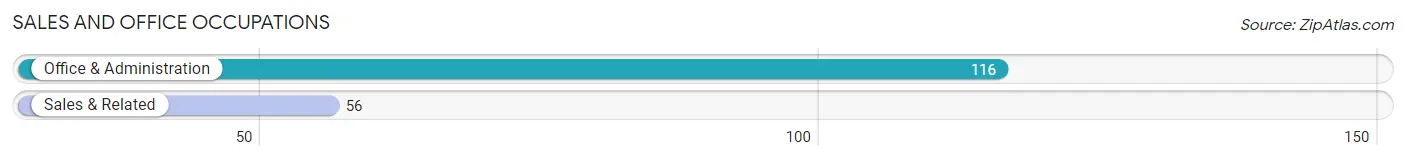
Sales and Office Occupations by Sex
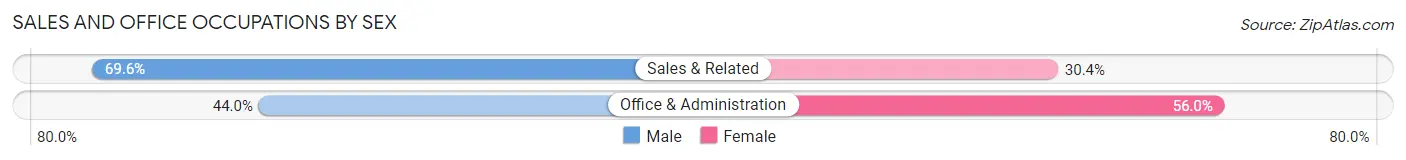
| Occupation | Male | Female |
| Sales & Related | 39 (69.6%) | 17 (30.4%) |
| Office & Administration | 51 (44.0%) | 65 (56.0%) |
| Total (Category) | 90 (52.3%) | 82 (47.7%) |
| Total (Overall) | 328 (54.8%) | 271 (45.2%) |
Natural Resources, Construction and Maintenance Occupations
The most common Natural Resources, Construction and Maintenance occupations in East Millinocket are Installation, Maintenance & Repair (35 | 5.8%), and Construction & Extraction (17 | 2.8%).
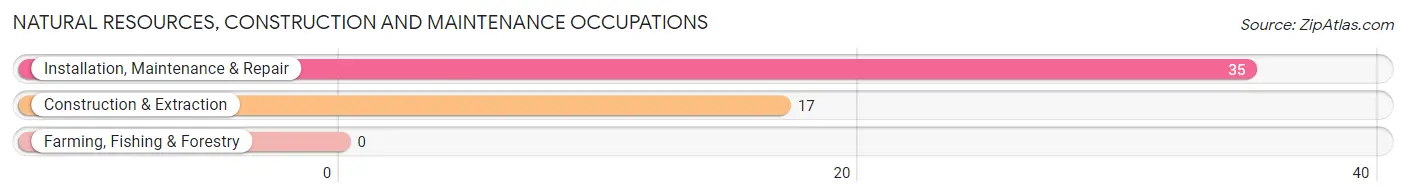
Natural Resources, Construction and Maintenance Occupations by Sex

| Occupation | Male | Female |
| Farming, Fishing & Forestry | 0 (0.0%) | 0 (0.0%) |
| Construction & Extraction | 15 (88.2%) | 2 (11.8%) |
| Installation, Maintenance & Repair | 35 (100.0%) | 0 (0.0%) |
| Total (Category) | 50 (96.2%) | 2 (3.8%) |
| Total (Overall) | 328 (54.8%) | 271 (45.2%) |
Production, Transportation and Moving Occupations
The most common Production, Transportation and Moving occupations in East Millinocket are Production (15 | 2.5%), Transportation (15 | 2.5%), and Material Moving (12 | 2.0%).
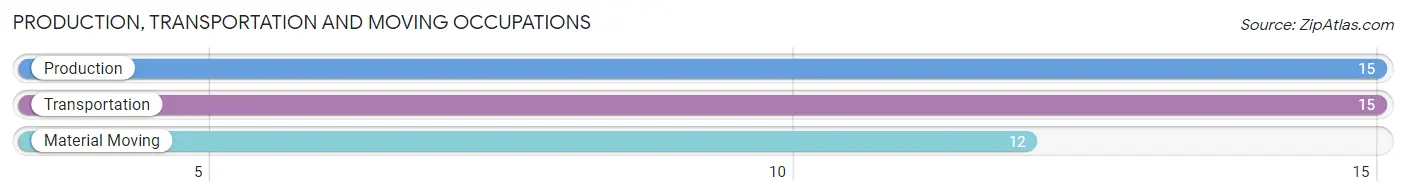
Production, Transportation and Moving Occupations by Sex
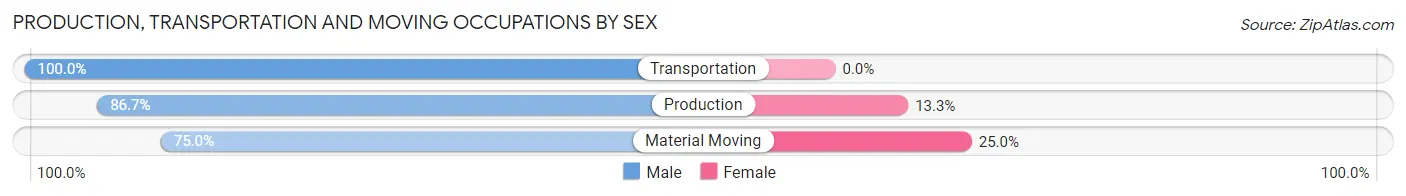
| Occupation | Male | Female |
| Production | 13 (86.7%) | 2 (13.3%) |
| Transportation | 15 (100.0%) | 0 (0.0%) |
| Material Moving | 9 (75.0%) | 3 (25.0%) |
| Total (Category) | 37 (88.1%) | 5 (11.9%) |
| Total (Overall) | 328 (54.8%) | 271 (45.2%) |
Employment Industries by Sex in East Millinocket
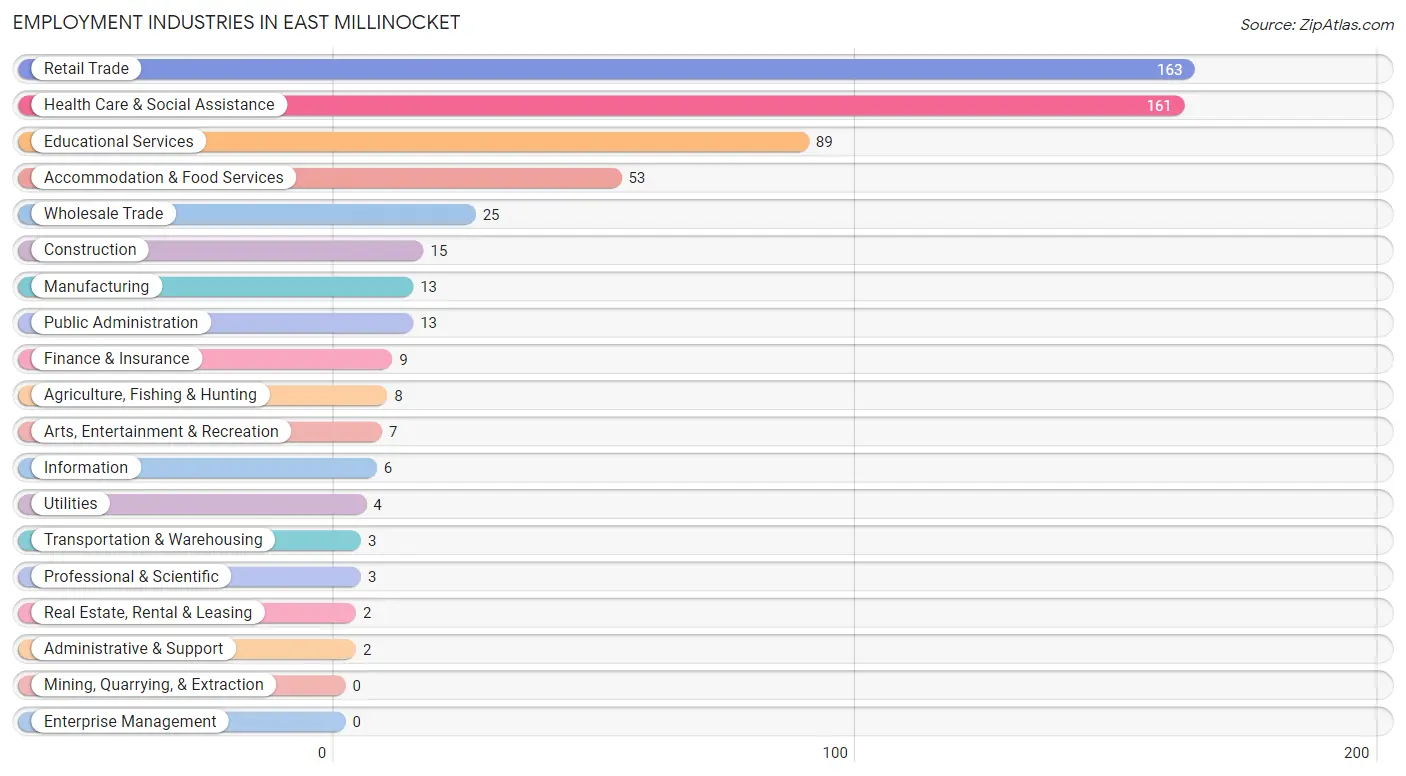
Employment Industries in East Millinocket
The major employment industries in East Millinocket include Retail Trade (163 | 27.2%), Health Care & Social Assistance (161 | 26.9%), Educational Services (89 | 14.9%), Accommodation & Food Services (53 | 8.8%), and Wholesale Trade (25 | 4.2%).
Employment Industries by Sex in East Millinocket
The East Millinocket industries that see more men than women are Agriculture, Fishing & Hunting (100.0%), Manufacturing (100.0%), and Wholesale Trade (100.0%), whereas the industries that tend to have a higher number of women are Real Estate, Rental & Leasing (100.0%), Educational Services (78.6%), and Health Care & Social Assistance (78.3%).
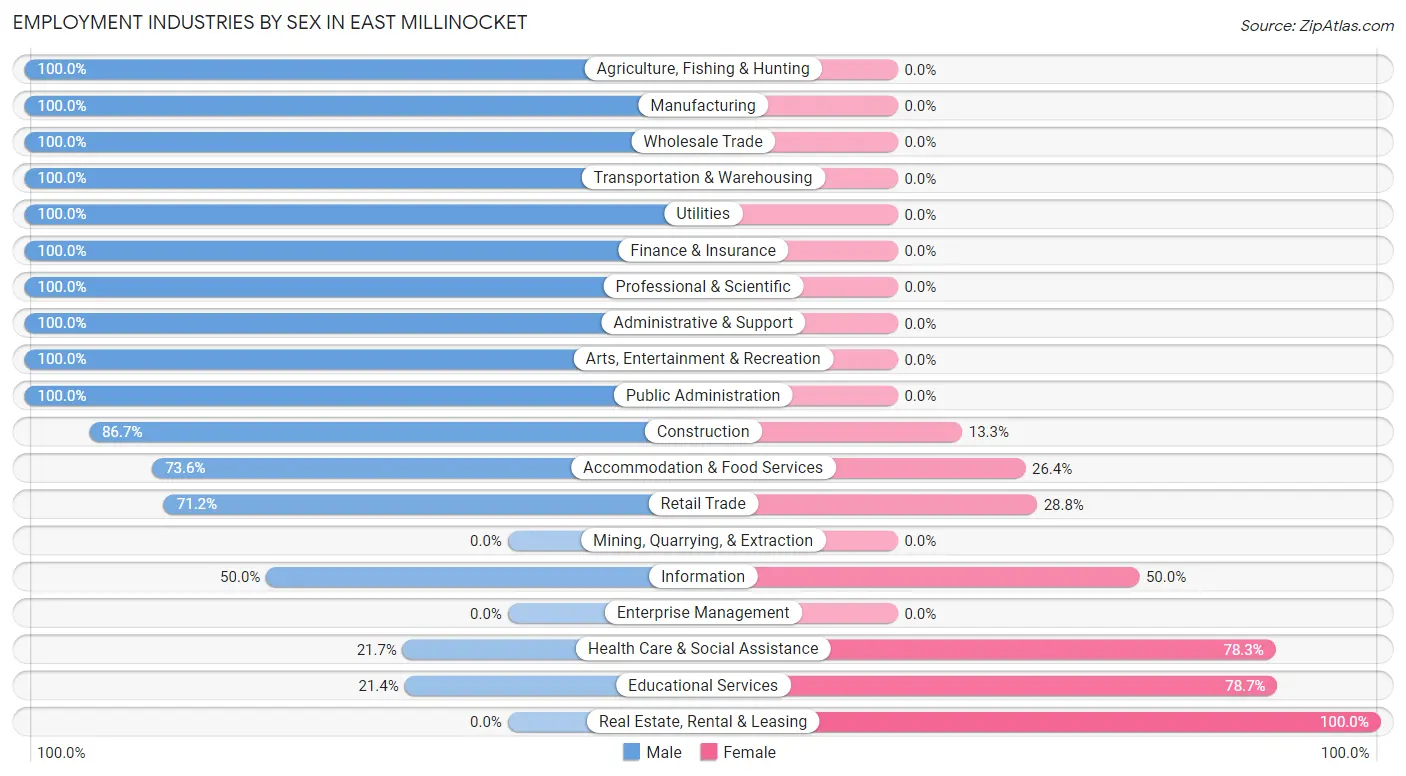
| Industry | Male | Female |
| Agriculture, Fishing & Hunting | 8 (100.0%) | 0 (0.0%) |
| Mining, Quarrying, & Extraction | 0 (0.0%) | 0 (0.0%) |
| Construction | 13 (86.7%) | 2 (13.3%) |
| Manufacturing | 13 (100.0%) | 0 (0.0%) |
| Wholesale Trade | 25 (100.0%) | 0 (0.0%) |
| Retail Trade | 116 (71.2%) | 47 (28.8%) |
| Transportation & Warehousing | 3 (100.0%) | 0 (0.0%) |
| Utilities | 4 (100.0%) | 0 (0.0%) |
| Information | 3 (50.0%) | 3 (50.0%) |
| Finance & Insurance | 9 (100.0%) | 0 (0.0%) |
| Real Estate, Rental & Leasing | 0 (0.0%) | 2 (100.0%) |
| Professional & Scientific | 3 (100.0%) | 0 (0.0%) |
| Enterprise Management | 0 (0.0%) | 0 (0.0%) |
| Administrative & Support | 2 (100.0%) | 0 (0.0%) |
| Educational Services | 19 (21.3%) | 70 (78.6%) |
| Health Care & Social Assistance | 35 (21.7%) | 126 (78.3%) |
| Arts, Entertainment & Recreation | 7 (100.0%) | 0 (0.0%) |
| Accommodation & Food Services | 39 (73.6%) | 14 (26.4%) |
| Public Administration | 13 (100.0%) | 0 (0.0%) |
| Total | 328 (54.8%) | 271 (45.2%) |
Education in East Millinocket
School Enrollment in East Millinocket
The most common levels of schooling among the 343 students in East Millinocket are high school (117 | 34.1%), elementary school (75 | 21.9%), and middle school (69 | 20.1%).
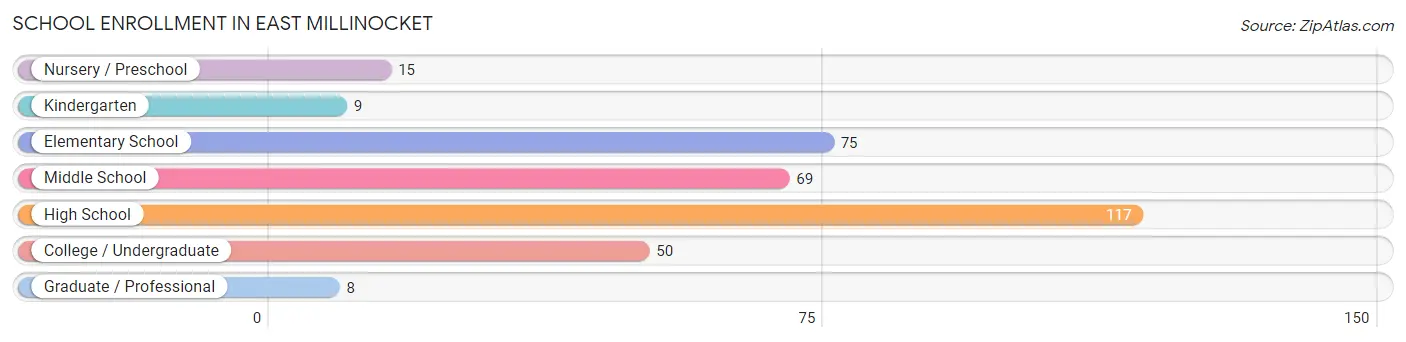
| School Level | # Students | % Students |
| Nursery / Preschool | 15 | 4.4% |
| Kindergarten | 9 | 2.6% |
| Elementary School | 75 | 21.9% |
| Middle School | 69 | 20.1% |
| High School | 117 | 34.1% |
| College / Undergraduate | 50 | 14.6% |
| Graduate / Professional | 8 | 2.3% |
| Total | 343 | 100.0% |
School Enrollment by Age by Funding Source in East Millinocket
Out of a total of 343 students who are enrolled in schools in East Millinocket, 16 (4.7%) attend a private institution, while the remaining 327 (95.3%) are enrolled in public schools. The age group of 3 to 4 year olds has the highest likelihood of being enrolled in private schools, with 9 (100.0% in the age bracket) enrolled. Conversely, the age group of 5 to 9 year old has the lowest likelihood of being enrolled in a private school, with 78 (100.0% in the age bracket) attending a public institution.
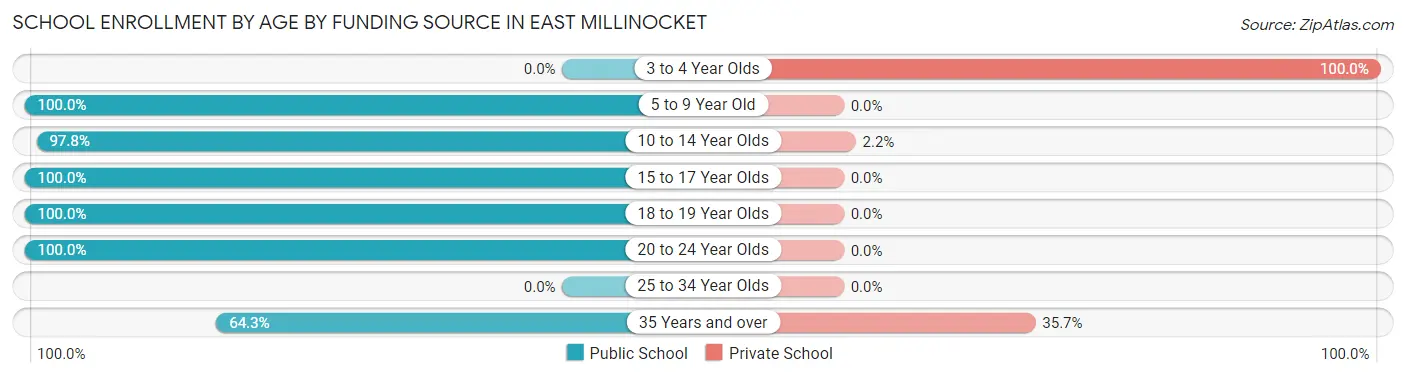
| Age Bracket | Public School | Private School |
| 3 to 4 Year Olds | 0 (0.0%) | 9 (100.0%) |
| 5 to 9 Year Old | 78 (100.0%) | 0 (0.0%) |
| 10 to 14 Year Olds | 88 (97.8%) | 2 (2.2%) |
| 15 to 17 Year Olds | 108 (100.0%) | 0 (0.0%) |
| 18 to 19 Year Olds | 5 (100.0%) | 0 (0.0%) |
| 20 to 24 Year Olds | 39 (100.0%) | 0 (0.0%) |
| 25 to 34 Year Olds | 0 (0.0%) | 0 (0.0%) |
| 35 Years and over | 9 (64.3%) | 5 (35.7%) |
| Total | 327 (95.3%) | 16 (4.7%) |
Educational Attainment by Field of Study in East Millinocket
Education (73 | 27.1%), science & technology (54 | 20.1%), business (38 | 14.1%), social sciences (32 | 11.9%), and arts & humanities (19 | 7.1%) are the most common fields of study among 269 individuals in East Millinocket who have obtained a bachelor's degree or higher.
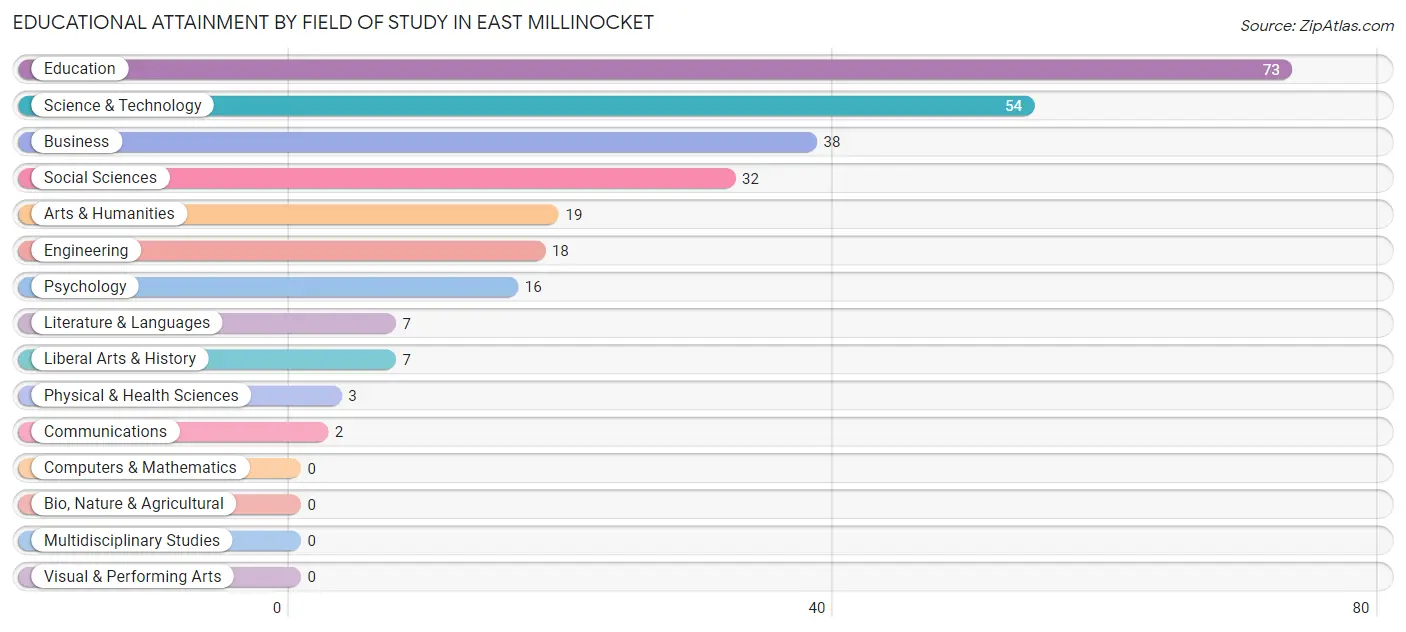
| Field of Study | # Graduates | % Graduates |
| Computers & Mathematics | 0 | 0.0% |
| Bio, Nature & Agricultural | 0 | 0.0% |
| Physical & Health Sciences | 3 | 1.1% |
| Psychology | 16 | 5.9% |
| Social Sciences | 32 | 11.9% |
| Engineering | 18 | 6.7% |
| Multidisciplinary Studies | 0 | 0.0% |
| Science & Technology | 54 | 20.1% |
| Business | 38 | 14.1% |
| Education | 73 | 27.1% |
| Literature & Languages | 7 | 2.6% |
| Liberal Arts & History | 7 | 2.6% |
| Visual & Performing Arts | 0 | 0.0% |
| Communications | 2 | 0.7% |
| Arts & Humanities | 19 | 7.1% |
| Total | 269 | 100.0% |
Transportation & Commute in East Millinocket
Vehicle Availability by Sex in East Millinocket
The most prevalent vehicle ownership categories in East Millinocket are males with 2 vehicles (134, accounting for 43.2%) and females with 2 vehicles (148, making up 52.5%).
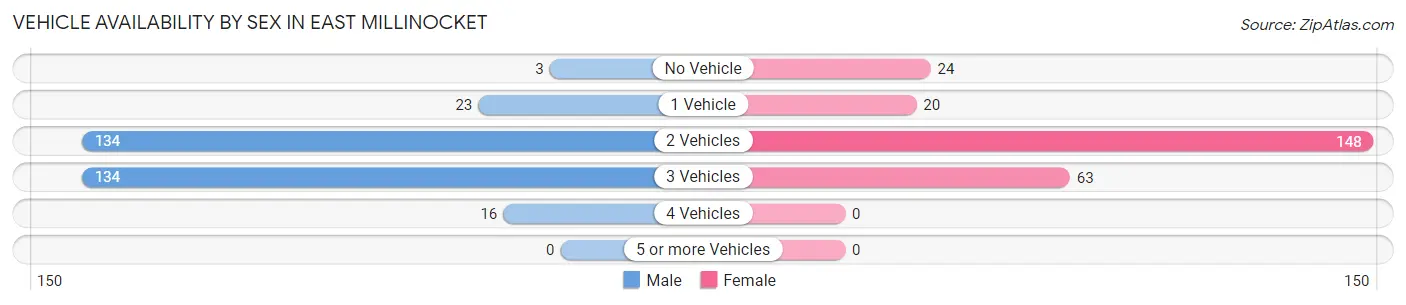
| Vehicles Available | Male | Female |
| No Vehicle | 3 (1.0%) | 24 (9.4%) |
| 1 Vehicle | 23 (7.4%) | 20 (7.8%) |
| 2 Vehicles | 134 (43.2%) | 148 (58.0%) |
| 3 Vehicles | 134 (43.2%) | 63 (24.7%) |
| 4 Vehicles | 16 (5.2%) | 0 (0.0%) |
| 5 or more Vehicles | 0 (0.0%) | 0 (0.0%) |
| Total | 310 (100.0%) | 255 (100.0%) |
Commute Time in East Millinocket
The most frequently occuring commute durations in East Millinocket are 10 to 14 minutes (185 commuters, 36.4%), 15 to 19 minutes (89 commuters, 17.5%), and less than 5 minutes (65 commuters, 12.8%).
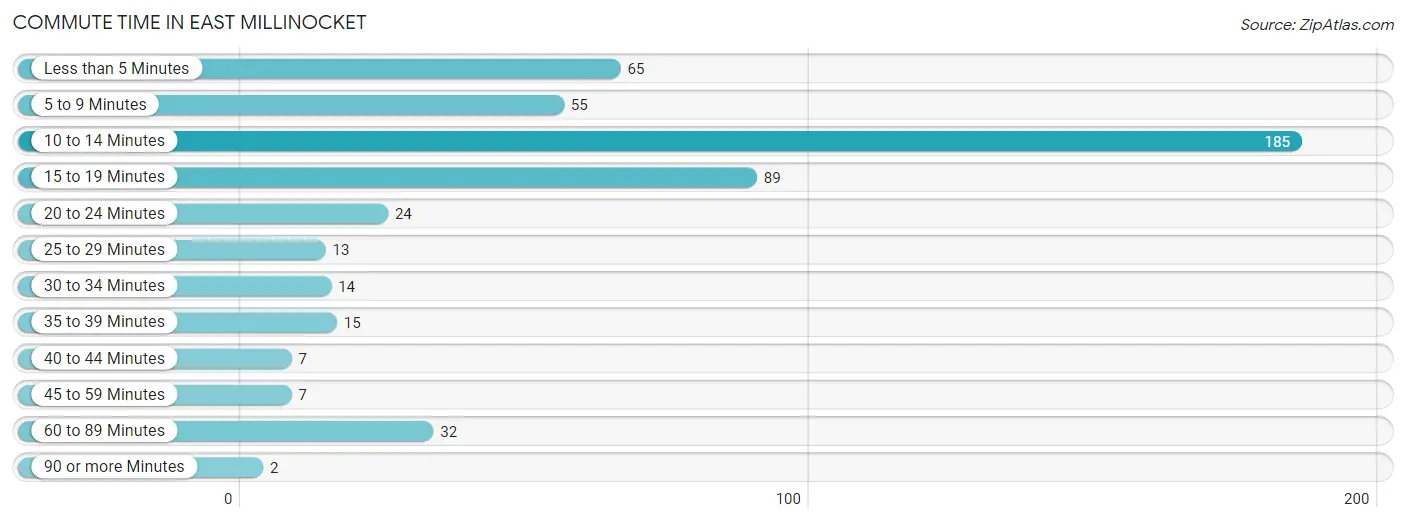
| Commute Time | # Commuters | % Commuters |
| Less than 5 Minutes | 65 | 12.8% |
| 5 to 9 Minutes | 55 | 10.8% |
| 10 to 14 Minutes | 185 | 36.4% |
| 15 to 19 Minutes | 89 | 17.5% |
| 20 to 24 Minutes | 24 | 4.7% |
| 25 to 29 Minutes | 13 | 2.6% |
| 30 to 34 Minutes | 14 | 2.8% |
| 35 to 39 Minutes | 15 | 2.9% |
| 40 to 44 Minutes | 7 | 1.4% |
| 45 to 59 Minutes | 7 | 1.4% |
| 60 to 89 Minutes | 32 | 6.3% |
| 90 or more Minutes | 2 | 0.4% |
Commute Time by Sex in East Millinocket
The most common commute times in East Millinocket are 10 to 14 minutes (141 commuters, 49.8%) for males and 15 to 19 minutes (70 commuters, 31.1%) for females.
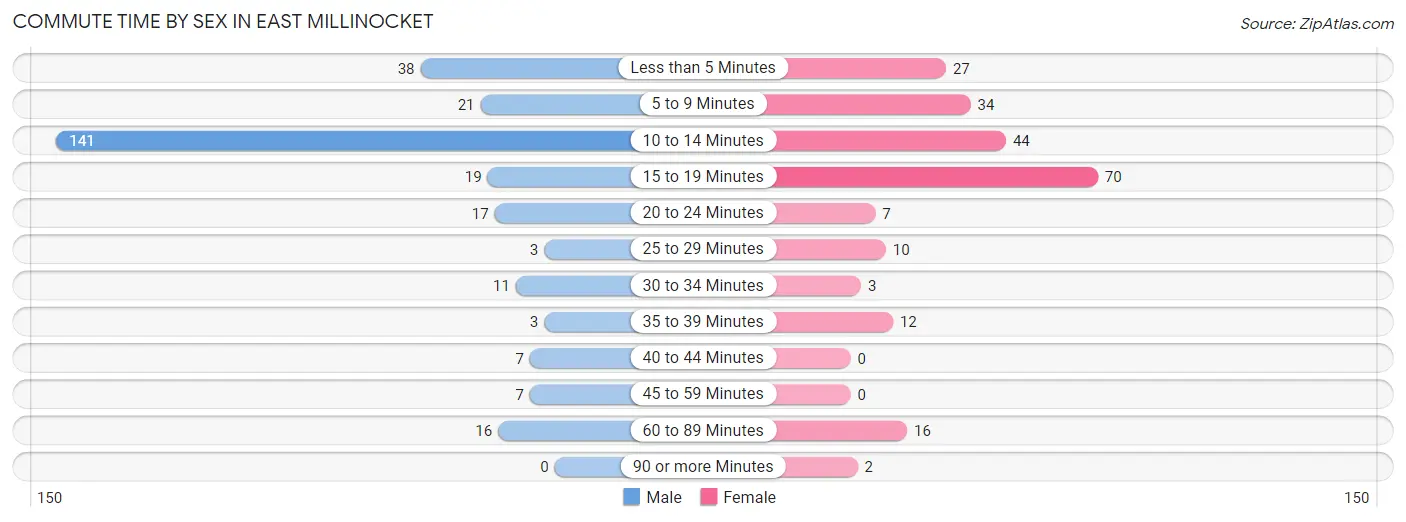
| Commute Time | Male | Female |
| Less than 5 Minutes | 38 (13.4%) | 27 (12.0%) |
| 5 to 9 Minutes | 21 (7.4%) | 34 (15.1%) |
| 10 to 14 Minutes | 141 (49.8%) | 44 (19.6%) |
| 15 to 19 Minutes | 19 (6.7%) | 70 (31.1%) |
| 20 to 24 Minutes | 17 (6.0%) | 7 (3.1%) |
| 25 to 29 Minutes | 3 (1.1%) | 10 (4.4%) |
| 30 to 34 Minutes | 11 (3.9%) | 3 (1.3%) |
| 35 to 39 Minutes | 3 (1.1%) | 12 (5.3%) |
| 40 to 44 Minutes | 7 (2.5%) | 0 (0.0%) |
| 45 to 59 Minutes | 7 (2.5%) | 0 (0.0%) |
| 60 to 89 Minutes | 16 (5.7%) | 16 (7.1%) |
| 90 or more Minutes | 0 (0.0%) | 2 (0.9%) |
Time of Departure to Work by Sex in East Millinocket
The most frequent times of departure to work in East Millinocket are 5:30 AM to 5:59 AM (88, 31.1%) for males and 7:00 AM to 7:29 AM (50, 22.2%) for females.
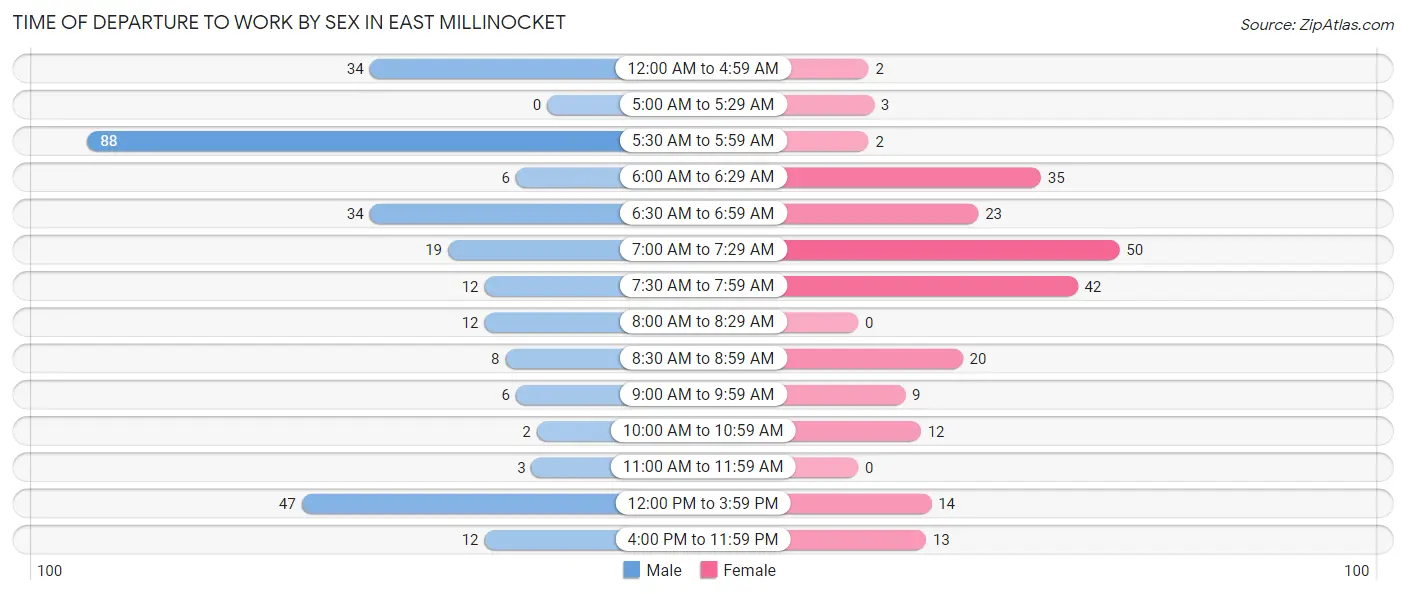
| Time of Departure | Male | Female |
| 12:00 AM to 4:59 AM | 34 (12.0%) | 2 (0.9%) |
| 5:00 AM to 5:29 AM | 0 (0.0%) | 3 (1.3%) |
| 5:30 AM to 5:59 AM | 88 (31.1%) | 2 (0.9%) |
| 6:00 AM to 6:29 AM | 6 (2.1%) | 35 (15.6%) |
| 6:30 AM to 6:59 AM | 34 (12.0%) | 23 (10.2%) |
| 7:00 AM to 7:29 AM | 19 (6.7%) | 50 (22.2%) |
| 7:30 AM to 7:59 AM | 12 (4.2%) | 42 (18.7%) |
| 8:00 AM to 8:29 AM | 12 (4.2%) | 0 (0.0%) |
| 8:30 AM to 8:59 AM | 8 (2.8%) | 20 (8.9%) |
| 9:00 AM to 9:59 AM | 6 (2.1%) | 9 (4.0%) |
| 10:00 AM to 10:59 AM | 2 (0.7%) | 12 (5.3%) |
| 11:00 AM to 11:59 AM | 3 (1.1%) | 0 (0.0%) |
| 12:00 PM to 3:59 PM | 47 (16.6%) | 14 (6.2%) |
| 4:00 PM to 11:59 PM | 12 (4.2%) | 13 (5.8%) |
| Total | 283 (100.0%) | 225 (100.0%) |
Housing Occupancy in East Millinocket
Occupancy by Ownership in East Millinocket
Of the total 695 dwellings in East Millinocket, owner-occupied units account for 530 (76.3%), while renter-occupied units make up 165 (23.7%).
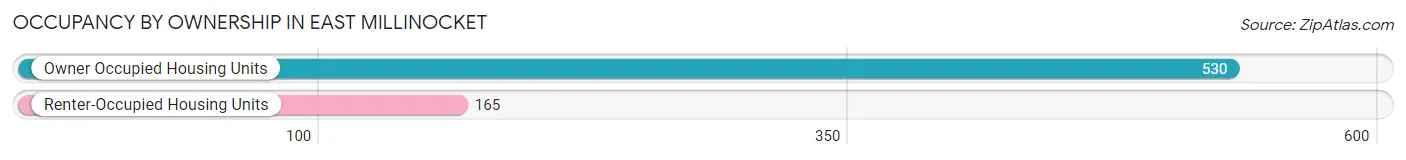
| Occupancy | # Housing Units | % Housing Units |
| Owner Occupied Housing Units | 530 | 76.3% |
| Renter-Occupied Housing Units | 165 | 23.7% |
| Total Occupied Housing Units | 695 | 100.0% |
Occupancy by Household Size in East Millinocket
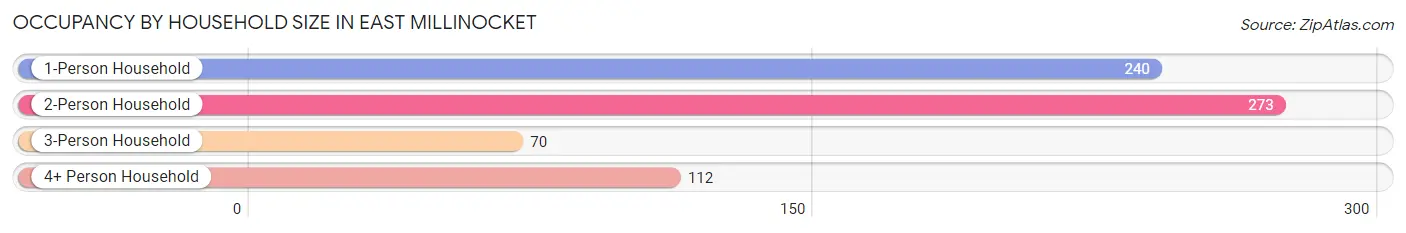
| Household Size | # Housing Units | % Housing Units |
| 1-Person Household | 240 | 34.5% |
| 2-Person Household | 273 | 39.3% |
| 3-Person Household | 70 | 10.1% |
| 4+ Person Household | 112 | 16.1% |
| Total Housing Units | 695 | 100.0% |
Occupancy by Ownership by Household Size in East Millinocket
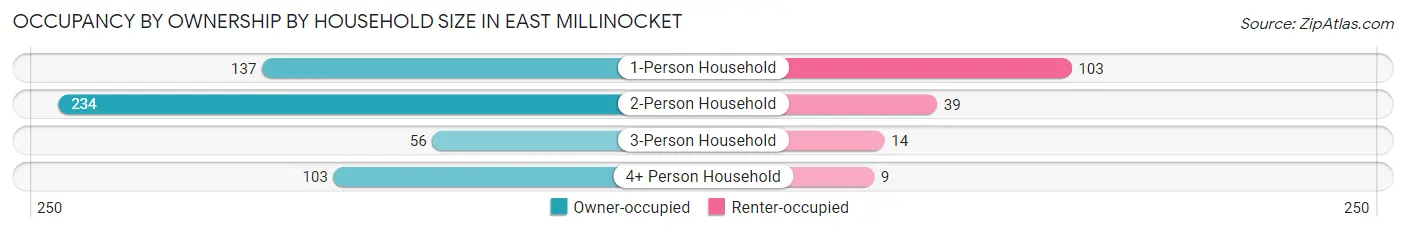
| Household Size | Owner-occupied | Renter-occupied |
| 1-Person Household | 137 (57.1%) | 103 (42.9%) |
| 2-Person Household | 234 (85.7%) | 39 (14.3%) |
| 3-Person Household | 56 (80.0%) | 14 (20.0%) |
| 4+ Person Household | 103 (92.0%) | 9 (8.0%) |
| Total Housing Units | 530 (76.3%) | 165 (23.7%) |
Occupancy by Educational Attainment in East Millinocket
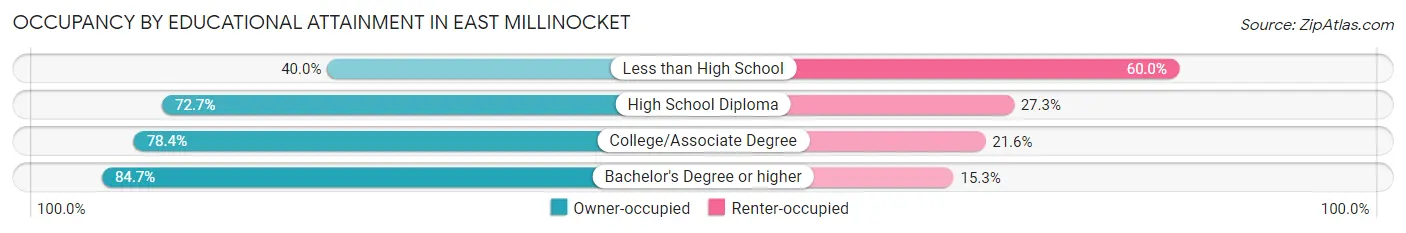
| Household Size | Owner-occupied | Renter-occupied |
| Less than High School | 16 (40.0%) | 24 (60.0%) |
| High School Diploma | 144 (72.7%) | 54 (27.3%) |
| College/Associate Degree | 210 (78.4%) | 58 (21.6%) |
| Bachelor's Degree or higher | 160 (84.7%) | 29 (15.3%) |
Occupancy by Age of Householder in East Millinocket
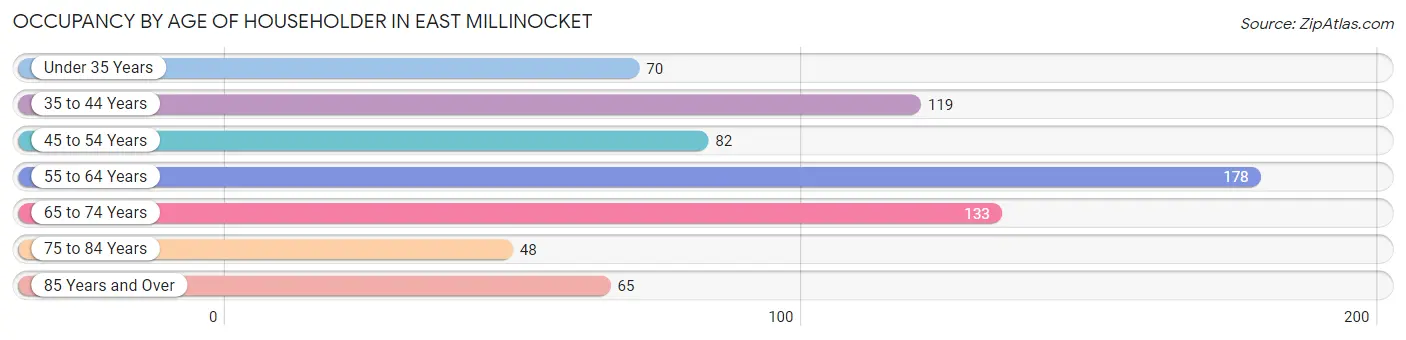
| Age Bracket | # Households | % Households |
| Under 35 Years | 70 | 10.1% |
| 35 to 44 Years | 119 | 17.1% |
| 45 to 54 Years | 82 | 11.8% |
| 55 to 64 Years | 178 | 25.6% |
| 65 to 74 Years | 133 | 19.1% |
| 75 to 84 Years | 48 | 6.9% |
| 85 Years and Over | 65 | 9.3% |
| Total | 695 | 100.0% |
Housing Finances in East Millinocket
Median Income by Occupancy in East Millinocket
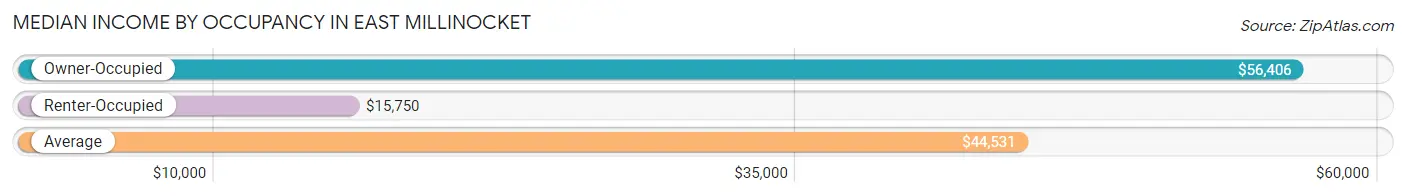
| Occupancy Type | # Households | Median Income |
| Owner-Occupied | 530 (76.3%) | $56,406 |
| Renter-Occupied | 165 (23.7%) | $15,750 |
| Average | 695 (100.0%) | $44,531 |
Occupancy by Householder Income Bracket in East Millinocket
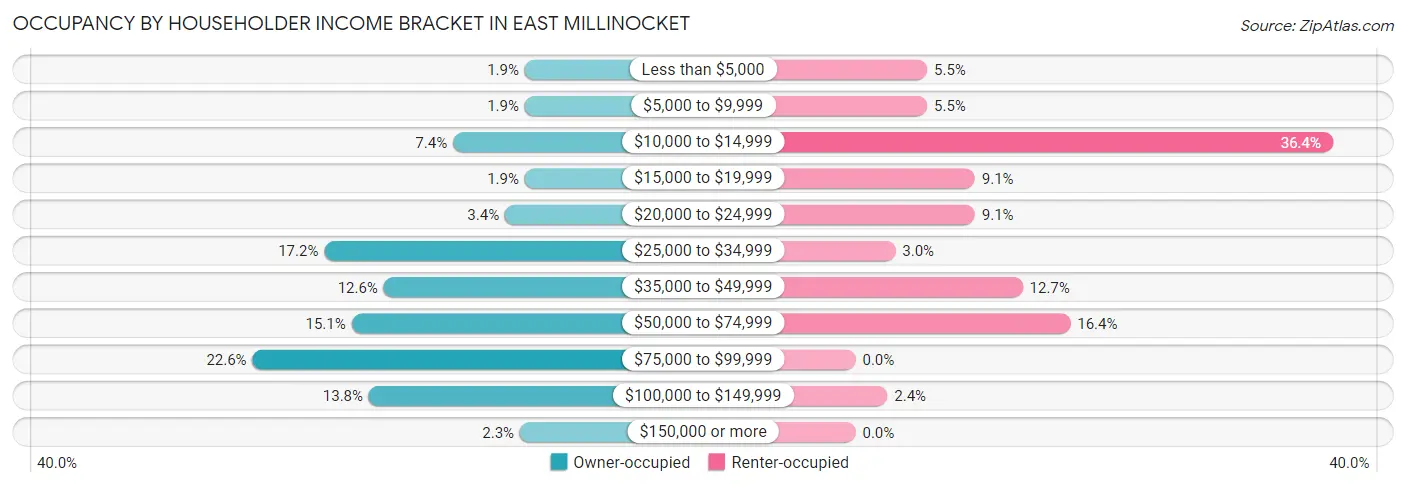
| Income Bracket | Owner-occupied | Renter-occupied |
| Less than $5,000 | 10 (1.9%) | 9 (5.4%) |
| $5,000 to $9,999 | 10 (1.9%) | 9 (5.4%) |
| $10,000 to $14,999 | 39 (7.4%) | 60 (36.4%) |
| $15,000 to $19,999 | 10 (1.9%) | 15 (9.1%) |
| $20,000 to $24,999 | 18 (3.4%) | 15 (9.1%) |
| $25,000 to $34,999 | 91 (17.2%) | 5 (3.0%) |
| $35,000 to $49,999 | 67 (12.6%) | 21 (12.7%) |
| $50,000 to $74,999 | 80 (15.1%) | 27 (16.4%) |
| $75,000 to $99,999 | 120 (22.6%) | 0 (0.0%) |
| $100,000 to $149,999 | 73 (13.8%) | 4 (2.4%) |
| $150,000 or more | 12 (2.3%) | 0 (0.0%) |
| Total | 530 (100.0%) | 165 (100.0%) |
Monthly Housing Cost Tiers in East Millinocket
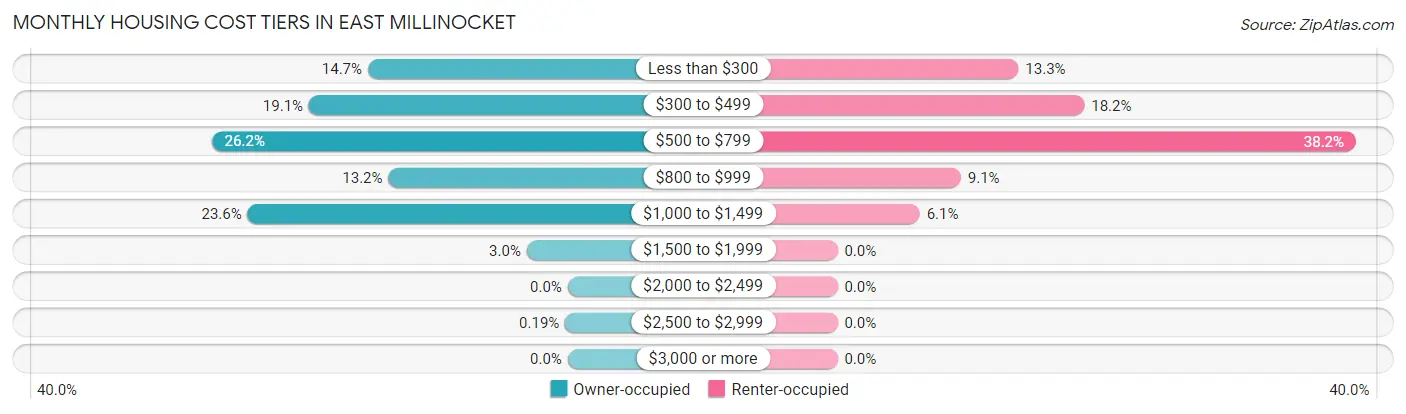
| Monthly Cost | Owner-occupied | Renter-occupied |
| Less than $300 | 78 (14.7%) | 22 (13.3%) |
| $300 to $499 | 101 (19.1%) | 30 (18.2%) |
| $500 to $799 | 139 (26.2%) | 63 (38.2%) |
| $800 to $999 | 70 (13.2%) | 15 (9.1%) |
| $1,000 to $1,499 | 125 (23.6%) | 10 (6.1%) |
| $1,500 to $1,999 | 16 (3.0%) | 0 (0.0%) |
| $2,000 to $2,499 | 0 (0.0%) | 0 (0.0%) |
| $2,500 to $2,999 | 1 (0.2%) | 0 (0.0%) |
| $3,000 or more | 0 (0.0%) | 0 (0.0%) |
| Total | 530 (100.0%) | 165 (100.0%) |
Physical Housing Characteristics in East Millinocket
Housing Structures in East Millinocket
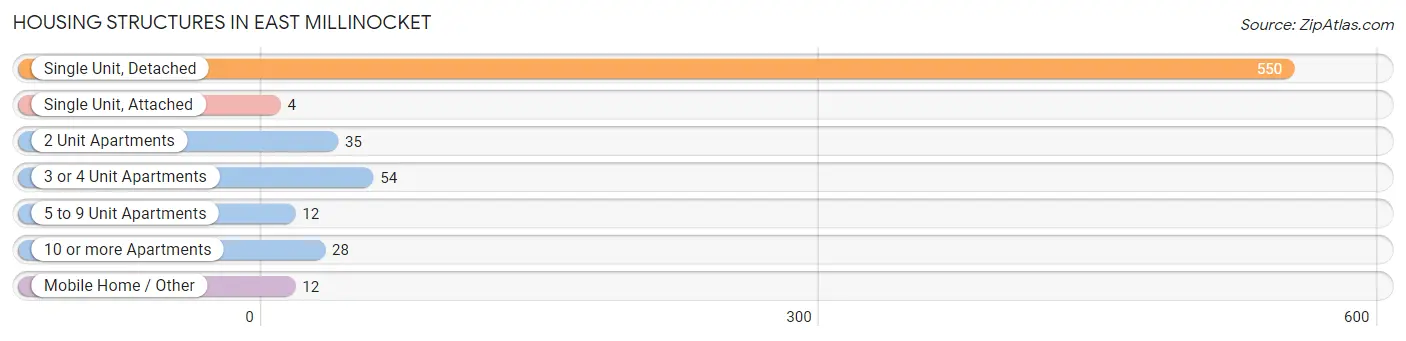
| Structure Type | # Housing Units | % Housing Units |
| Single Unit, Detached | 550 | 79.1% |
| Single Unit, Attached | 4 | 0.6% |
| 2 Unit Apartments | 35 | 5.0% |
| 3 or 4 Unit Apartments | 54 | 7.8% |
| 5 to 9 Unit Apartments | 12 | 1.7% |
| 10 or more Apartments | 28 | 4.0% |
| Mobile Home / Other | 12 | 1.7% |
| Total | 695 | 100.0% |
Housing Structures by Occupancy in East Millinocket
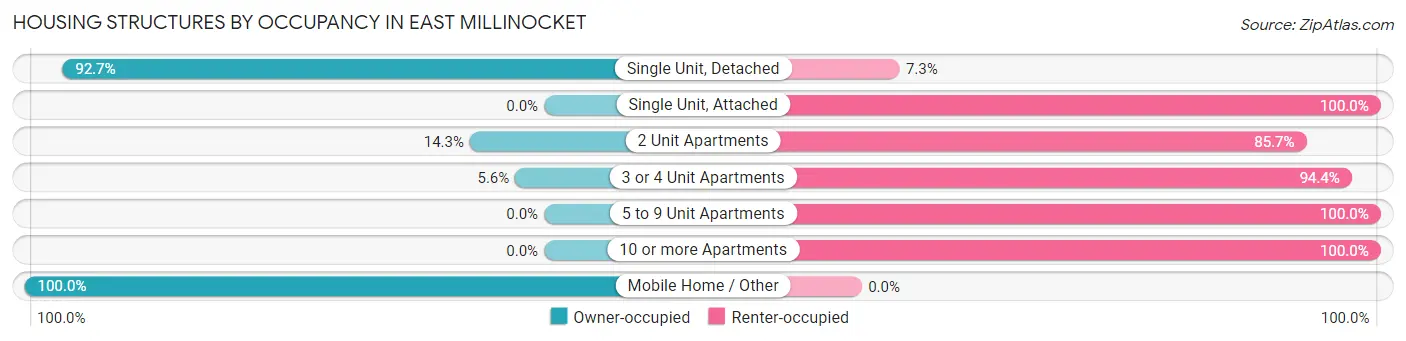
| Structure Type | Owner-occupied | Renter-occupied |
| Single Unit, Detached | 510 (92.7%) | 40 (7.3%) |
| Single Unit, Attached | 0 (0.0%) | 4 (100.0%) |
| 2 Unit Apartments | 5 (14.3%) | 30 (85.7%) |
| 3 or 4 Unit Apartments | 3 (5.6%) | 51 (94.4%) |
| 5 to 9 Unit Apartments | 0 (0.0%) | 12 (100.0%) |
| 10 or more Apartments | 0 (0.0%) | 28 (100.0%) |
| Mobile Home / Other | 12 (100.0%) | 0 (0.0%) |
| Total | 530 (76.3%) | 165 (23.7%) |
Housing Structures by Number of Rooms in East Millinocket
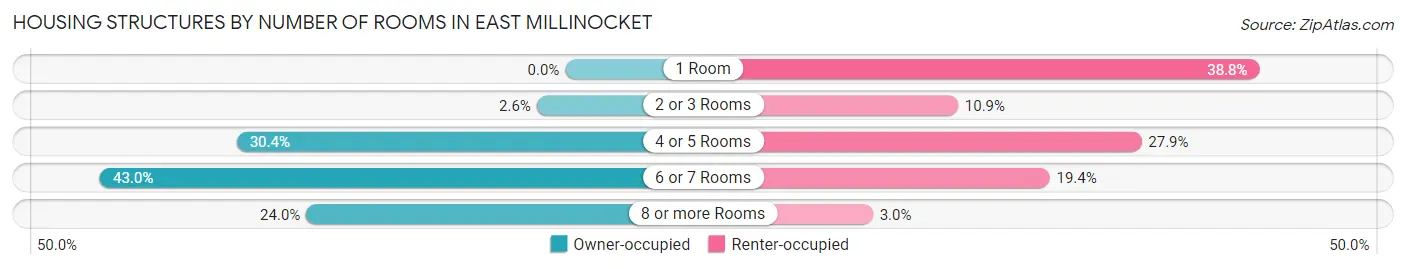
| Number of Rooms | Owner-occupied | Renter-occupied |
| 1 Room | 0 (0.0%) | 64 (38.8%) |
| 2 or 3 Rooms | 14 (2.6%) | 18 (10.9%) |
| 4 or 5 Rooms | 161 (30.4%) | 46 (27.9%) |
| 6 or 7 Rooms | 228 (43.0%) | 32 (19.4%) |
| 8 or more Rooms | 127 (24.0%) | 5 (3.0%) |
| Total | 530 (100.0%) | 165 (100.0%) |
Housing Structure by Heating Type in East Millinocket
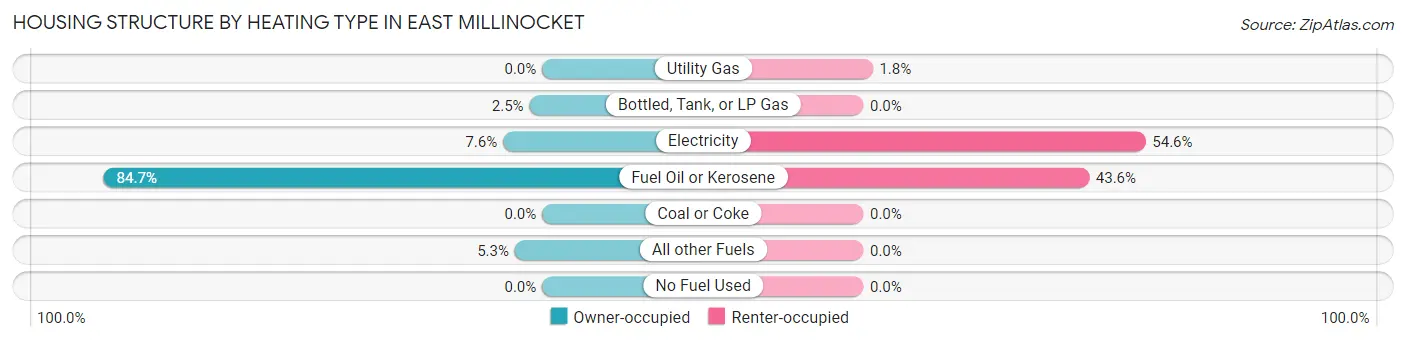
| Heating Type | Owner-occupied | Renter-occupied |
| Utility Gas | 0 (0.0%) | 3 (1.8%) |
| Bottled, Tank, or LP Gas | 13 (2.5%) | 0 (0.0%) |
| Electricity | 40 (7.5%) | 90 (54.5%) |
| Fuel Oil or Kerosene | 449 (84.7%) | 72 (43.6%) |
| Coal or Coke | 0 (0.0%) | 0 (0.0%) |
| All other Fuels | 28 (5.3%) | 0 (0.0%) |
| No Fuel Used | 0 (0.0%) | 0 (0.0%) |
| Total | 530 (100.0%) | 165 (100.0%) |
Household Vehicle Usage in East Millinocket
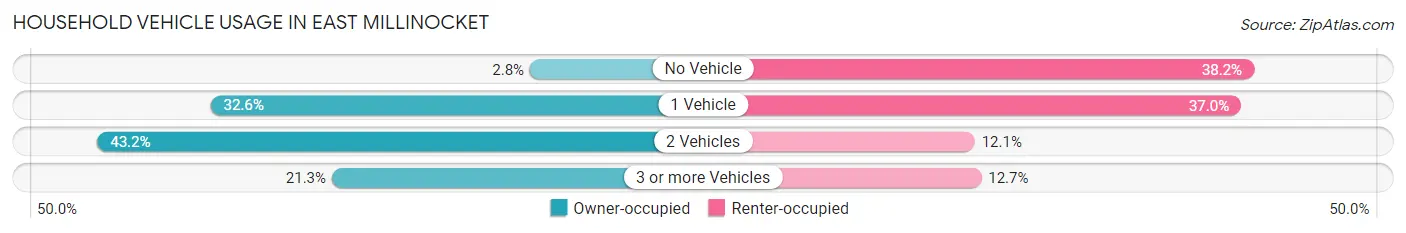
| Vehicles per Household | Owner-occupied | Renter-occupied |
| No Vehicle | 15 (2.8%) | 63 (38.2%) |
| 1 Vehicle | 173 (32.6%) | 61 (37.0%) |
| 2 Vehicles | 229 (43.2%) | 20 (12.1%) |
| 3 or more Vehicles | 113 (21.3%) | 21 (12.7%) |
| Total | 530 (100.0%) | 165 (100.0%) |
Real Estate & Mortgages in East Millinocket
Real Estate and Mortgage Overview in East Millinocket
| Characteristic | Without Mortgage | With Mortgage |
| Housing Units | 252 | 278 |
| Median Property Value | $59,400 | $74,300 |
| Median Household Income | $31,739 | $12 |
| Monthly Housing Costs | $421 | $0 |
| Real Estate Taxes | $1,060 | $6 |
Property Value by Mortgage Status in East Millinocket
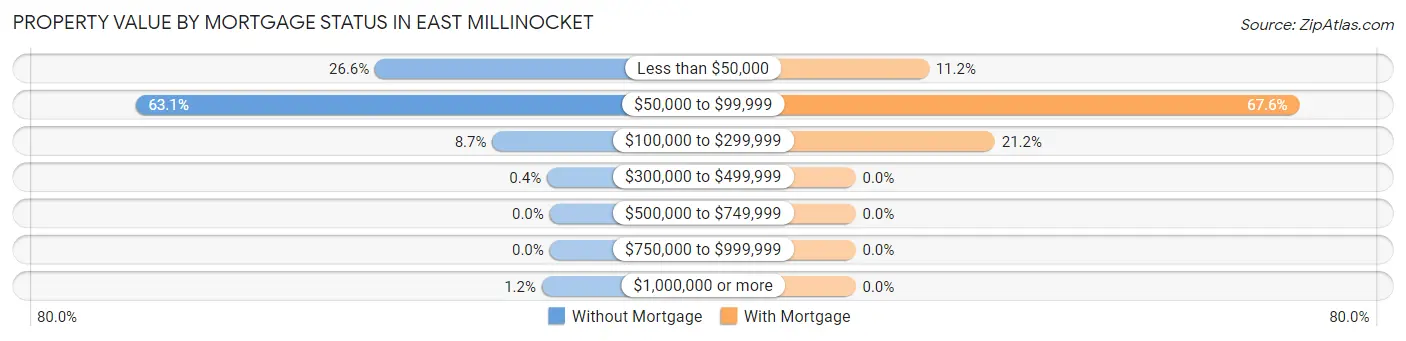
| Property Value | Without Mortgage | With Mortgage |
| Less than $50,000 | 67 (26.6%) | 31 (11.2%) |
| $50,000 to $99,999 | 159 (63.1%) | 188 (67.6%) |
| $100,000 to $299,999 | 22 (8.7%) | 59 (21.2%) |
| $300,000 to $499,999 | 1 (0.4%) | 0 (0.0%) |
| $500,000 to $749,999 | 0 (0.0%) | 0 (0.0%) |
| $750,000 to $999,999 | 0 (0.0%) | 0 (0.0%) |
| $1,000,000 or more | 3 (1.2%) | 0 (0.0%) |
| Total | 252 (100.0%) | 278 (100.0%) |
Household Income by Mortgage Status in East Millinocket
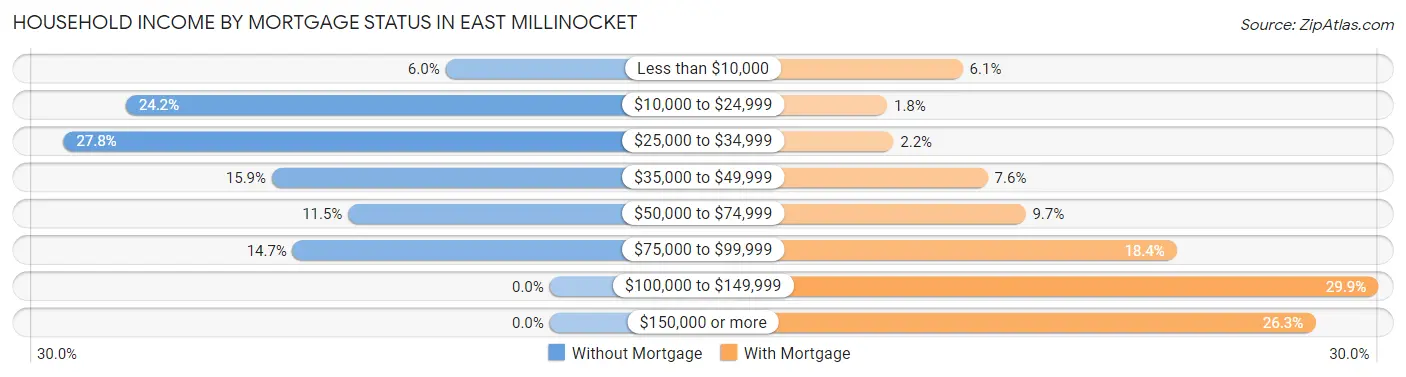
| Household Income | Without Mortgage | With Mortgage |
| Less than $10,000 | 15 (5.9%) | 17 (6.1%) |
| $10,000 to $24,999 | 61 (24.2%) | 5 (1.8%) |
| $25,000 to $34,999 | 70 (27.8%) | 6 (2.2%) |
| $35,000 to $49,999 | 40 (15.9%) | 21 (7.5%) |
| $50,000 to $74,999 | 29 (11.5%) | 27 (9.7%) |
| $75,000 to $99,999 | 37 (14.7%) | 51 (18.3%) |
| $100,000 to $149,999 | 0 (0.0%) | 83 (29.9%) |
| $150,000 or more | 0 (0.0%) | 73 (26.3%) |
| Total | 252 (100.0%) | 278 (100.0%) |
Property Value to Household Income Ratio in East Millinocket
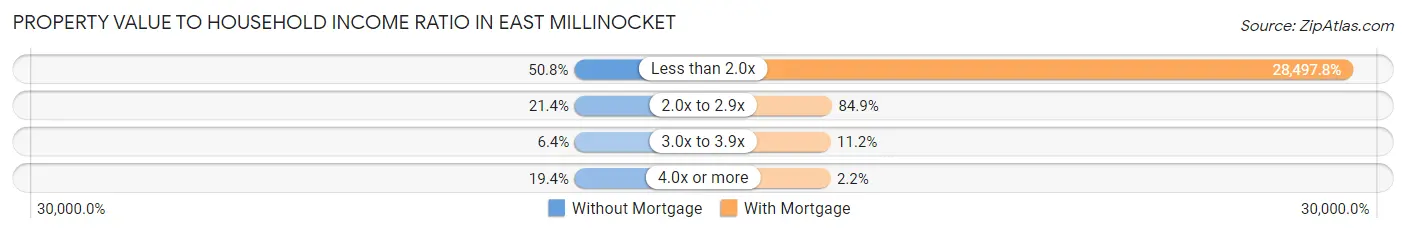
| Value-to-Income Ratio | Without Mortgage | With Mortgage |
| Less than 2.0x | 128 (50.8%) | 79,224 (28,497.8%) |
| 2.0x to 2.9x | 54 (21.4%) | 236 (84.9%) |
| 3.0x to 3.9x | 16 (6.4%) | 31 (11.2%) |
| 4.0x or more | 49 (19.4%) | 6 (2.2%) |
| Total | 252 (100.0%) | 278 (100.0%) |
Real Estate Taxes by Mortgage Status in East Millinocket
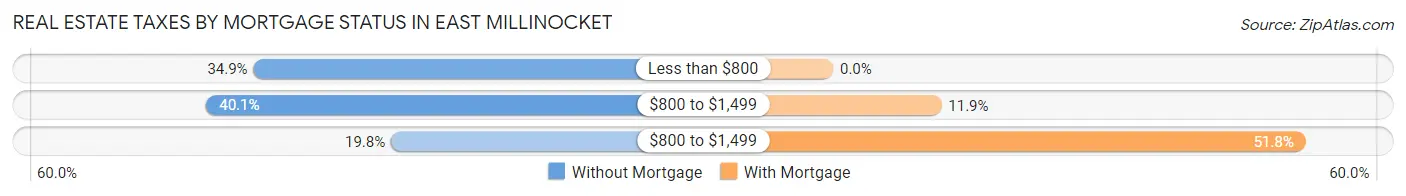
| Property Taxes | Without Mortgage | With Mortgage |
| Less than $800 | 88 (34.9%) | 0 (0.0%) |
| $800 to $1,499 | 101 (40.1%) | 33 (11.9%) |
| $800 to $1,499 | 50 (19.8%) | 144 (51.8%) |
| Total | 252 (100.0%) | 278 (100.0%) |
Health & Disability in East Millinocket
Health Insurance Coverage by Age in East Millinocket
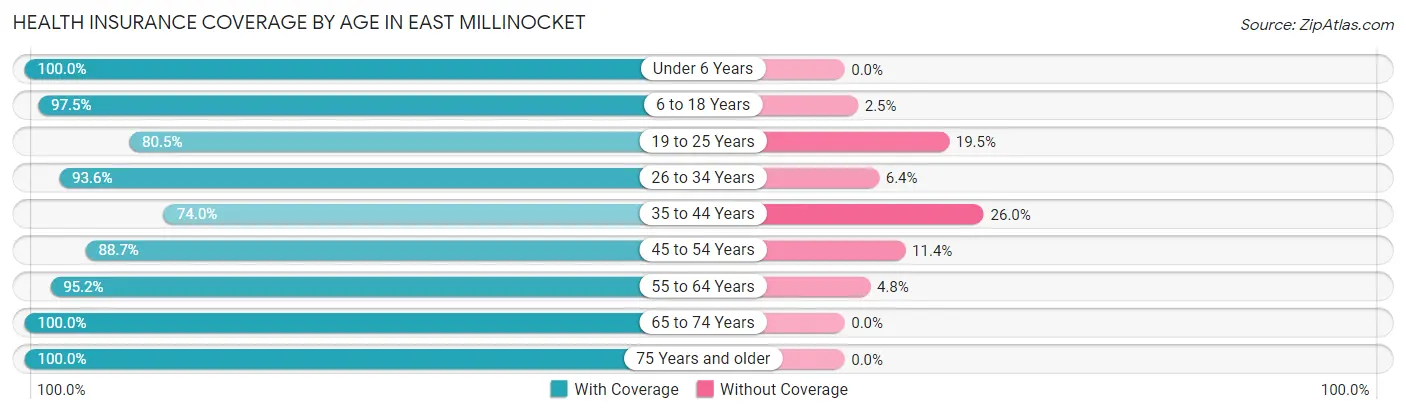
| Age Bracket | With Coverage | Without Coverage |
| Under 6 Years | 60 (100.0%) | 0 (0.0%) |
| 6 to 18 Years | 271 (97.5%) | 7 (2.5%) |
| 19 to 25 Years | 62 (80.5%) | 15 (19.5%) |
| 26 to 34 Years | 131 (93.6%) | 9 (6.4%) |
| 35 to 44 Years | 151 (74.0%) | 53 (26.0%) |
| 45 to 54 Years | 125 (88.6%) | 16 (11.4%) |
| 55 to 64 Years | 279 (95.2%) | 14 (4.8%) |
| 65 to 74 Years | 185 (100.0%) | 0 (0.0%) |
| 75 Years and older | 163 (100.0%) | 0 (0.0%) |
| Total | 1,427 (92.6%) | 114 (7.4%) |
Health Insurance Coverage by Citizenship Status in East Millinocket
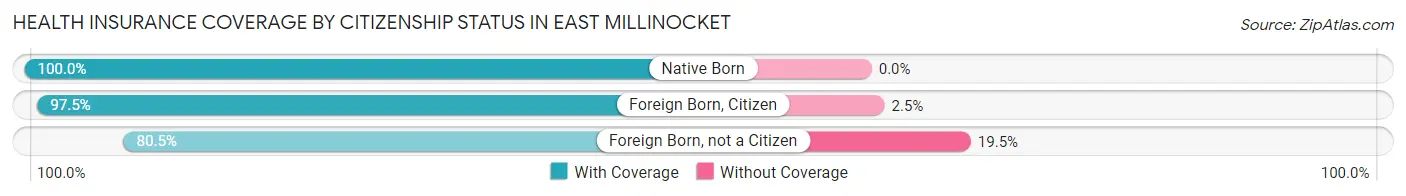
| Citizenship Status | With Coverage | Without Coverage |
| Native Born | 60 (100.0%) | 0 (0.0%) |
| Foreign Born, Citizen | 271 (97.5%) | 7 (2.5%) |
| Foreign Born, not a Citizen | 62 (80.5%) | 15 (19.5%) |
Health Insurance Coverage by Household Income in East Millinocket
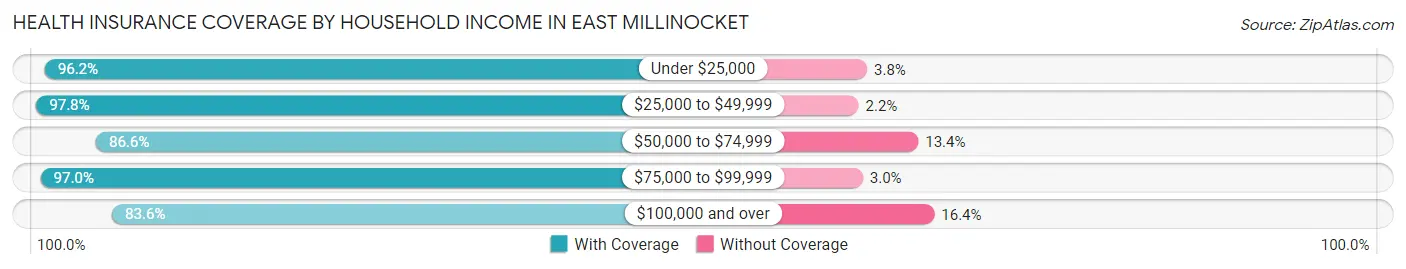
| Household Income | With Coverage | Without Coverage |
| Under $25,000 | 253 (96.2%) | 10 (3.8%) |
| $25,000 to $49,999 | 354 (97.8%) | 8 (2.2%) |
| $50,000 to $74,999 | 207 (86.6%) | 32 (13.4%) |
| $75,000 to $99,999 | 322 (97.0%) | 10 (3.0%) |
| $100,000 and over | 275 (83.6%) | 54 (16.4%) |
Public vs Private Health Insurance Coverage by Age in East Millinocket
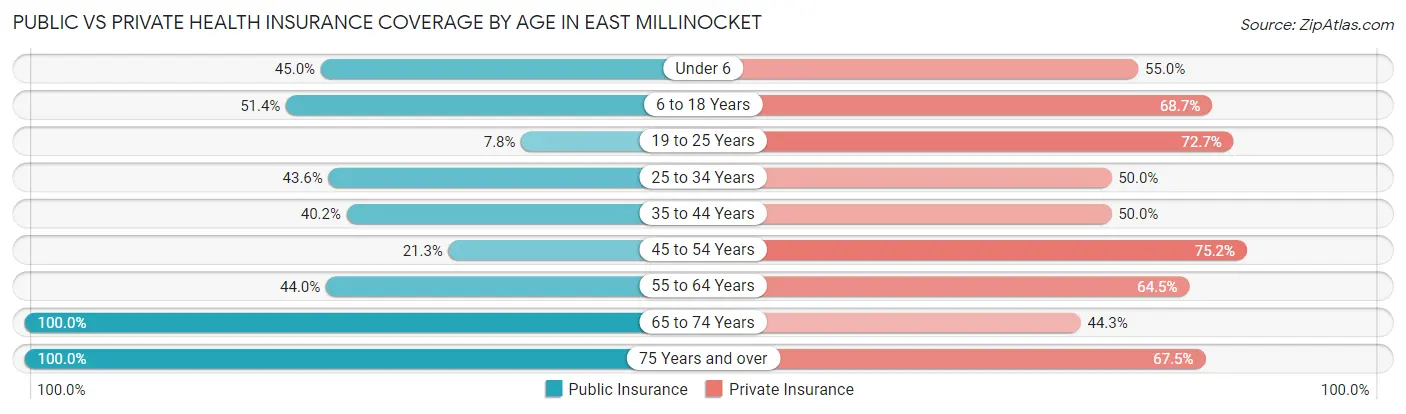
| Age Bracket | Public Insurance | Private Insurance |
| Under 6 | 27 (45.0%) | 33 (55.0%) |
| 6 to 18 Years | 143 (51.4%) | 191 (68.7%) |
| 19 to 25 Years | 6 (7.8%) | 56 (72.7%) |
| 25 to 34 Years | 61 (43.6%) | 70 (50.0%) |
| 35 to 44 Years | 82 (40.2%) | 102 (50.0%) |
| 45 to 54 Years | 30 (21.3%) | 106 (75.2%) |
| 55 to 64 Years | 129 (44.0%) | 189 (64.5%) |
| 65 to 74 Years | 185 (100.0%) | 82 (44.3%) |
| 75 Years and over | 163 (100.0%) | 110 (67.5%) |
| Total | 826 (53.6%) | 939 (60.9%) |
Disability Status by Sex by Age in East Millinocket
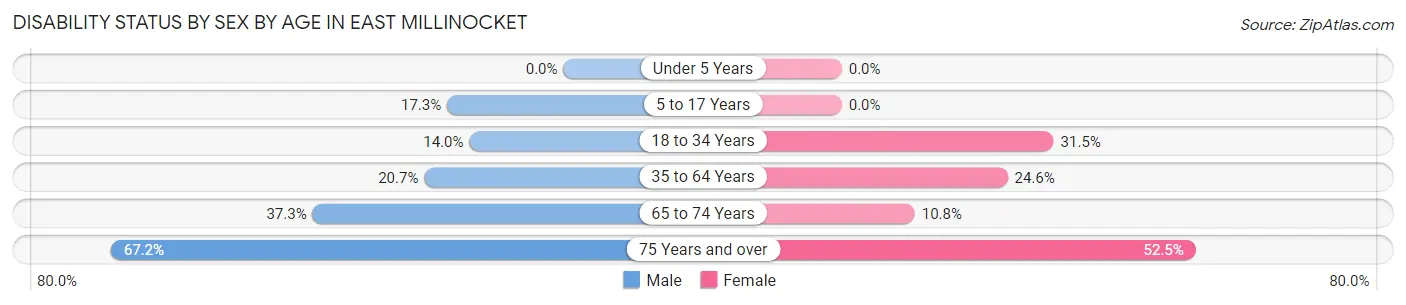
| Age Bracket | Male | Female |
| Under 5 Years | 0 (0.0%) | 0 (0.0%) |
| 5 to 17 Years | 19 (17.3%) | 0 (0.0%) |
| 18 to 34 Years | 19 (14.0%) | 28 (31.5%) |
| 35 to 64 Years | 63 (20.7%) | 82 (24.6%) |
| 65 to 74 Years | 38 (37.2%) | 9 (10.8%) |
| 75 Years and over | 43 (67.2%) | 52 (52.5%) |
Disability Class by Sex by Age in East Millinocket
Disability Class: Hearing Difficulty
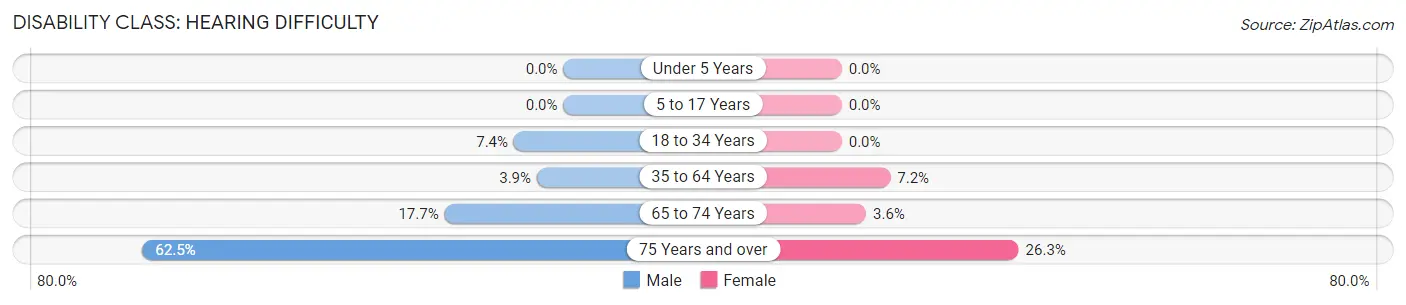
| Age Bracket | Male | Female |
| Under 5 Years | 0 (0.0%) | 0 (0.0%) |
| 5 to 17 Years | 0 (0.0%) | 0 (0.0%) |
| 18 to 34 Years | 10 (7.3%) | 0 (0.0%) |
| 35 to 64 Years | 12 (3.9%) | 24 (7.2%) |
| 65 to 74 Years | 18 (17.6%) | 3 (3.6%) |
| 75 Years and over | 40 (62.5%) | 26 (26.3%) |
Disability Class: Vision Difficulty
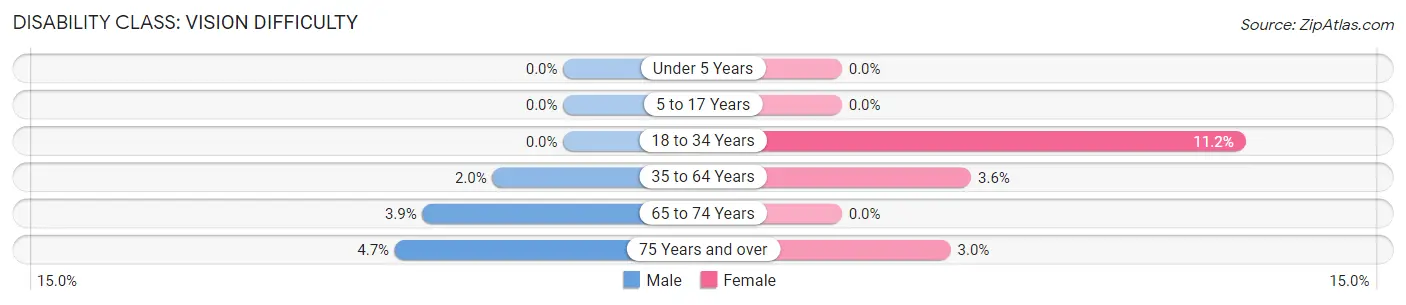
| Age Bracket | Male | Female |
| Under 5 Years | 0 (0.0%) | 0 (0.0%) |
| 5 to 17 Years | 0 (0.0%) | 0 (0.0%) |
| 18 to 34 Years | 0 (0.0%) | 10 (11.2%) |
| 35 to 64 Years | 6 (2.0%) | 12 (3.6%) |
| 65 to 74 Years | 4 (3.9%) | 0 (0.0%) |
| 75 Years and over | 3 (4.7%) | 3 (3.0%) |
Disability Class: Cognitive Difficulty
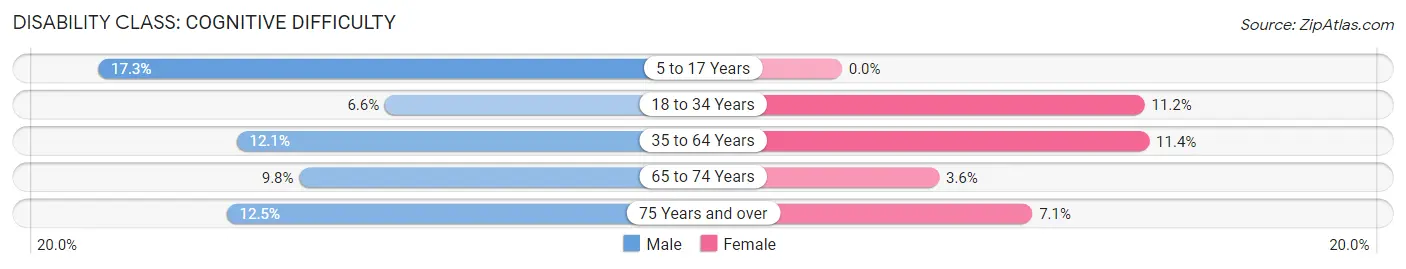
| Age Bracket | Male | Female |
| 5 to 17 Years | 19 (17.3%) | 0 (0.0%) |
| 18 to 34 Years | 9 (6.6%) | 10 (11.2%) |
| 35 to 64 Years | 37 (12.1%) | 38 (11.4%) |
| 65 to 74 Years | 10 (9.8%) | 3 (3.6%) |
| 75 Years and over | 8 (12.5%) | 7 (7.1%) |
Disability Class: Ambulatory Difficulty
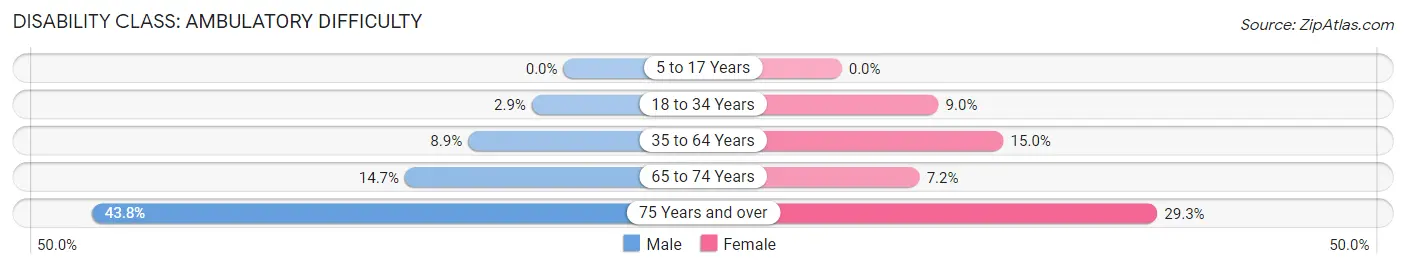
| Age Bracket | Male | Female |
| 5 to 17 Years | 0 (0.0%) | 0 (0.0%) |
| 18 to 34 Years | 4 (2.9%) | 8 (9.0%) |
| 35 to 64 Years | 27 (8.8%) | 50 (15.0%) |
| 65 to 74 Years | 15 (14.7%) | 6 (7.2%) |
| 75 Years and over | 28 (43.8%) | 29 (29.3%) |
Disability Class: Self-Care Difficulty
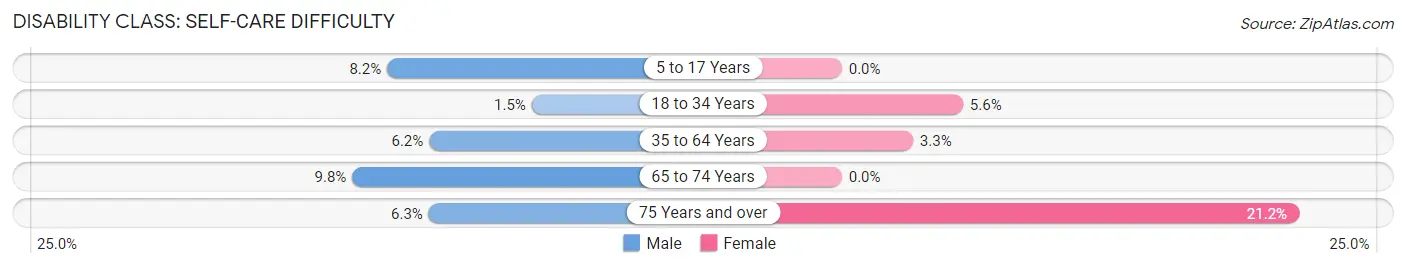
| Age Bracket | Male | Female |
| 5 to 17 Years | 9 (8.2%) | 0 (0.0%) |
| 18 to 34 Years | 2 (1.5%) | 5 (5.6%) |
| 35 to 64 Years | 19 (6.2%) | 11 (3.3%) |
| 65 to 74 Years | 10 (9.8%) | 0 (0.0%) |
| 75 Years and over | 4 (6.2%) | 21 (21.2%) |
Technology Access in East Millinocket
Computing Device Access in East Millinocket
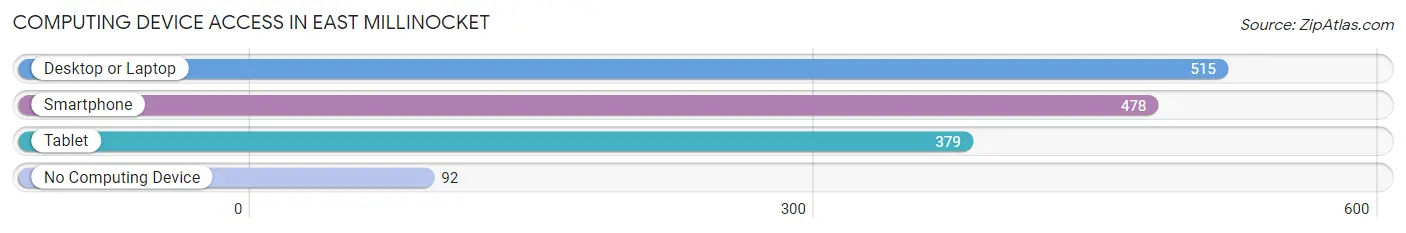
| Device Type | # Households | % Households |
| Desktop or Laptop | 515 | 74.1% |
| Smartphone | 478 | 68.8% |
| Tablet | 379 | 54.5% |
| No Computing Device | 92 | 13.2% |
| Total | 695 | 100.0% |
Internet Access in East Millinocket
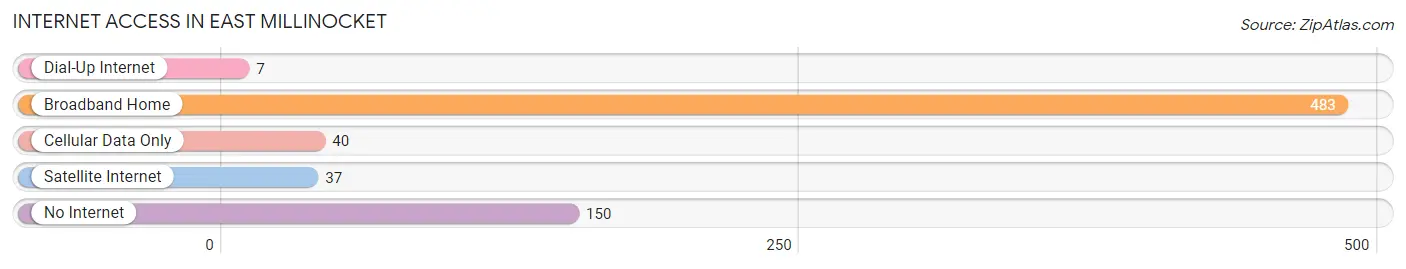
| Internet Type | # Households | % Households |
| Dial-Up Internet | 7 | 1.0% |
| Broadband Home | 483 | 69.5% |
| Cellular Data Only | 40 | 5.8% |
| Satellite Internet | 37 | 5.3% |
| No Internet | 150 | 21.6% |
| Total | 695 | 100.0% |
East Millinocket Summary
Millinocket, Maine is a small town located in the northern part of the state, in Penobscot County. It is situated on the banks of the Penobscot River, and is bordered by the towns of East Millinocket, Medway, and Woodville. The town has a population of 4,506 people, according to the 2010 census.
History
Millinocket was first settled in 1829 by a group of settlers from Massachusetts. The town was originally called "Millinocket Plantation," and was incorporated in 1851. The town was named after the nearby Millinocket Stream, which was named by the Penobscot Indians. The name means "place of many islands."
The town was initially a lumbering and milling center, and the first sawmill was built in 1845. The town grew rapidly, and by the late 19th century, it was home to several large lumber mills. The town was also home to a paper mill, which was built in 1892. The paper mill was the largest employer in the town for many years, and it was the main source of income for the town.
The town experienced a decline in the late 20th century, as the paper mill closed in 2003. The town has since been trying to diversify its economy, and has become a popular tourist destination.
Geography
Millinocket is located in the northern part of the state, in Penobscot County. It is situated on the banks of the Penobscot River, and is bordered by the towns of East Millinocket, Medway, and Woodville. The town has a total area of 11.3 square miles, of which 11.2 square miles is land and 0.1 square miles is water.
The town is located in a mountainous region, and is surrounded by the Appalachian Mountains. The highest point in the town is Mount Katahdin, which is the highest peak in the state of Maine. The town is also home to several lakes, including Millinocket Lake, which is the largest lake in the town.
Economy
Millinocket is a small town, and its economy is largely based on tourism. The town is home to several tourist attractions, including Baxter State Park, which is the largest state park in the state. The park is home to Mount Katahdin, and is a popular destination for hikers and outdoor enthusiasts.
The town is also home to several small businesses, including restaurants, shops, and lodging. The town is also home to several manufacturing companies, including a paper mill and a sawmill.
Demographics
According to the 2010 census, the town has a population of 4,506 people. The racial makeup of the town is 97.3% White, 0.7% African American, 0.3% Native American, 0.3% Asian, 0.1% Pacific Islander, 0.2% from other races, and 1.2% from two or more races. The median household income in the town is $37,917, and the median family income is $45,938. The per capita income in the town is $20,845.
Common Questions
What is Per Capita Income in East Millinocket?
Per Capita income in East Millinocket is $28,103.
What is the Median Family Income in East Millinocket?
Median Family Income in East Millinocket is $66,083.
What is the Median Household income in East Millinocket?
Median Household Income in East Millinocket is $44,531.
What is Income or Wage Gap in East Millinocket?
Income or Wage Gap in East Millinocket is 1.2%.
Women in East Millinocket earn 98.8 cents for every dollar earned by a man.
What is Family Income Deficit in East Millinocket?
Family Income Deficit in East Millinocket is $17,972.
Families that are below poverty line in East Millinocket earn $17,972 less on average than the poverty threshold level.
What is Inequality or Gini Index in East Millinocket?
Inequality or Gini Index in East Millinocket is 0.46.
What is the Total Population of East Millinocket?
Total Population of East Millinocket is 1,541.
What is the Total Male Population of East Millinocket?
Total Male Population of East Millinocket is 733.
What is the Total Female Population of East Millinocket?
Total Female Population of East Millinocket is 808.
What is the Ratio of Males per 100 Females in East Millinocket?
There are 90.72 Males per 100 Females in East Millinocket.
What is the Ratio of Females per 100 Males in East Millinocket?
There are 110.23 Females per 100 Males in East Millinocket.
What is the Median Population Age in East Millinocket?
Median Population Age in East Millinocket is 45.9 Years.
What is the Average Family Size in East Millinocket
Average Family Size in East Millinocket is 2.6 People.
What is the Average Household Size in East Millinocket
Average Household Size in East Millinocket is 2.2 People.
How Large is the Labor Force in East Millinocket?
There are 632 People in the Labor Forcein in East Millinocket.
What is the Percentage of People in the Labor Force in East Millinocket?
48.5% of People are in the Labor Force in East Millinocket.
What is the Unemployment Rate in East Millinocket?
Unemployment Rate in East Millinocket is 5.2%.