Milo, ME Map & Demographics
Milo Map
Milo Overview
$27,014
PER CAPITA INCOME
$55,491
AVG FAMILY INCOME
$51,528
AVG HOUSEHOLD INCOME
21.1%
WAGE / INCOME GAP [ % ]
78.9¢/ $1
WAGE / INCOME GAP [ $ ]
0.38
INEQUALITY / GINI INDEX
1,409
TOTAL POPULATION
711
MALE POPULATION
698
FEMALE POPULATION
101.86
MALES / 100 FEMALES
98.17
FEMALES / 100 MALES
52.5
MEDIAN AGE
2.4
AVG FAMILY SIZE
2.1
AVG HOUSEHOLD SIZE
524
LABOR FORCE [ PEOPLE ]
41.7%
PERCENT IN LABOR FORCE
2.1%
UNEMPLOYMENT RATE
Milo Zip Codes
Milo Area Codes
Income in Milo
Income Overview in Milo
Per Capita Income in Milo is $27,014, while median incomes of families and households are $55,491 and $51,528 respectively.
| Characteristic | Number | Measure |
| Per Capita Income | 1,409 | $27,014 |
| Median Family Income | 445 | $55,491 |
| Mean Family Income | 445 | $66,964 |
| Median Household Income | 677 | $51,528 |
| Mean Household Income | 677 | $55,377 |
| Income Deficit | 445 | $0 |
| Wage / Income Gap (%) | 1,409 | 21.06% |
| Wage / Income Gap ($) | 1,409 | 78.94¢ per $1 |
| Gini / Inequality Index | 1,409 | 0.38 |
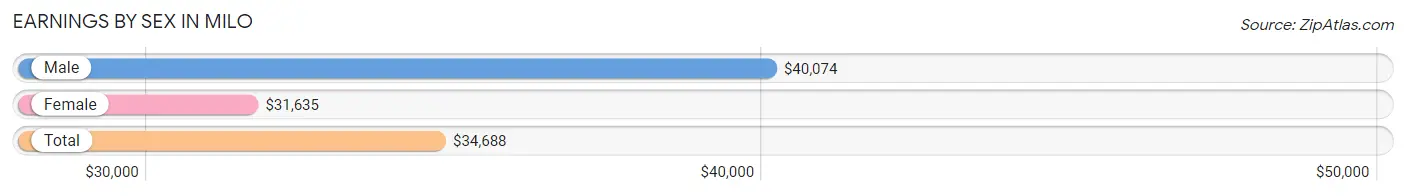
Earnings by Sex in Milo
Average Earnings in Milo are $34,688, $40,074 for men and $31,635 for women, a difference of 21.1%.
| Sex | Number | Average Earnings |
| Male | 305 (51.2%) | $40,074 |
| Female | 291 (48.8%) | $31,635 |
| Total | 596 (100.0%) | $34,688 |
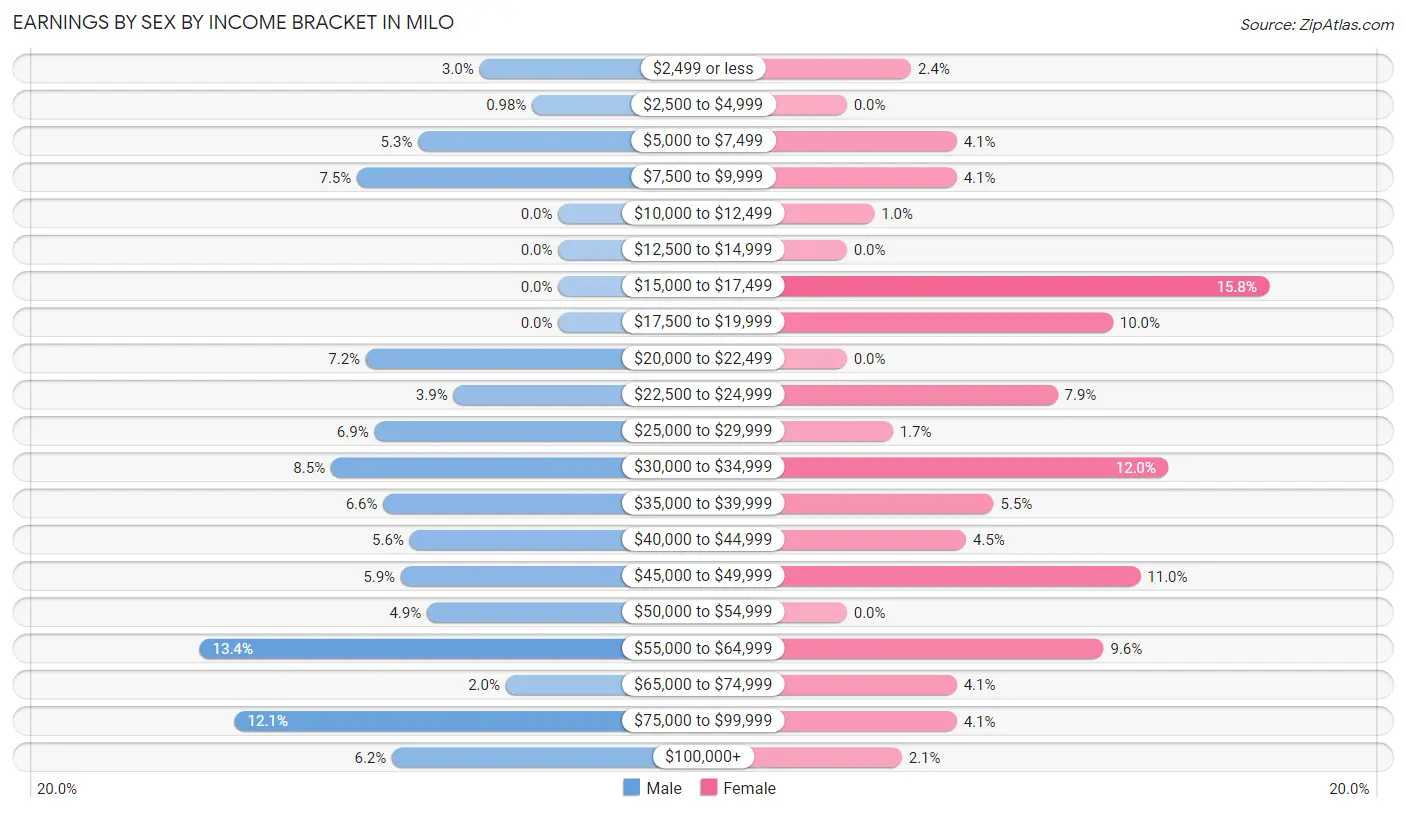
Earnings by Sex by Income Bracket in Milo
The most common earnings brackets in Milo are $55,000 to $64,999 for men (41 | 13.4%) and $15,000 to $17,499 for women (46 | 15.8%).
| Income | Male | Female |
| $2,499 or less | 9 (2.9%) | 7 (2.4%) |
| $2,500 to $4,999 | 3 (1.0%) | 0 (0.0%) |
| $5,000 to $7,499 | 16 (5.2%) | 12 (4.1%) |
| $7,500 to $9,999 | 23 (7.5%) | 12 (4.1%) |
| $10,000 to $12,499 | 0 (0.0%) | 3 (1.0%) |
| $12,500 to $14,999 | 0 (0.0%) | 0 (0.0%) |
| $15,000 to $17,499 | 0 (0.0%) | 46 (15.8%) |
| $17,500 to $19,999 | 0 (0.0%) | 29 (10.0%) |
| $20,000 to $22,499 | 22 (7.2%) | 0 (0.0%) |
| $22,500 to $24,999 | 12 (3.9%) | 23 (7.9%) |
| $25,000 to $29,999 | 21 (6.9%) | 5 (1.7%) |
| $30,000 to $34,999 | 26 (8.5%) | 35 (12.0%) |
| $35,000 to $39,999 | 20 (6.6%) | 16 (5.5%) |
| $40,000 to $44,999 | 17 (5.6%) | 13 (4.5%) |
| $45,000 to $49,999 | 18 (5.9%) | 32 (11.0%) |
| $50,000 to $54,999 | 15 (4.9%) | 0 (0.0%) |
| $55,000 to $64,999 | 41 (13.4%) | 28 (9.6%) |
| $65,000 to $74,999 | 6 (2.0%) | 12 (4.1%) |
| $75,000 to $99,999 | 37 (12.1%) | 12 (4.1%) |
| $100,000+ | 19 (6.2%) | 6 (2.1%) |
| Total | 305 (100.0%) | 291 (100.0%) |
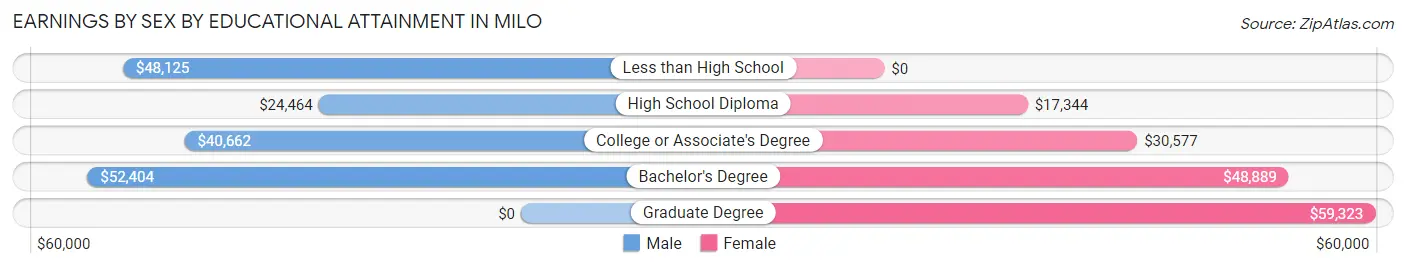
Earnings by Sex by Educational Attainment in Milo
Average earnings in Milo are $41,250 for men and $32,212 for women, a difference of 21.9%. Men with an educational attainment of bachelor's degree enjoy the highest average annual earnings of $52,404, while those with high school diploma education earn the least with $24,464. Women with an educational attainment of graduate degree earn the most with the average annual earnings of $59,323, while those with high school diploma education have the smallest earnings of $17,344.
| Educational Attainment | Male Income | Female Income |
| Less than High School | $48,125 | $0 |
| High School Diploma | $24,464 | $17,344 |
| College or Associate's Degree | $40,662 | $30,577 |
| Bachelor's Degree | $52,404 | $48,889 |
| Graduate Degree | - | - |
| Total | $41,250 | $32,212 |
Family Income in Milo
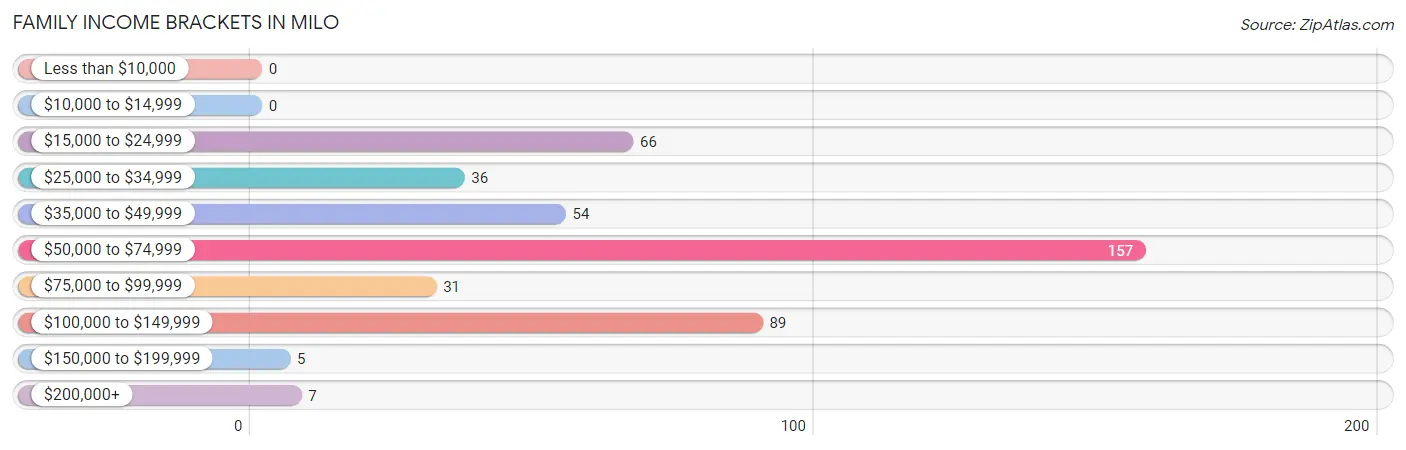
Family Income Brackets in Milo
According to the Milo family income data, there are 157 families falling into the $50,000 to $74,999 income range, which is the most common income bracket and makes up 35.3% of all families.
| Income Bracket | # Families | % Families |
| Less than $10,000 | 0 | 0.0% |
| $10,000 to $14,999 | 0 | 0.0% |
| $15,000 to $24,999 | 66 | 14.8% |
| $25,000 to $34,999 | 36 | 8.1% |
| $35,000 to $49,999 | 54 | 12.1% |
| $50,000 to $74,999 | 157 | 35.3% |
| $75,000 to $99,999 | 31 | 7.0% |
| $100,000 to $149,999 | 89 | 20.0% |
| $150,000 to $199,999 | 5 | 1.1% |
| $200,000+ | 7 | 1.6% |
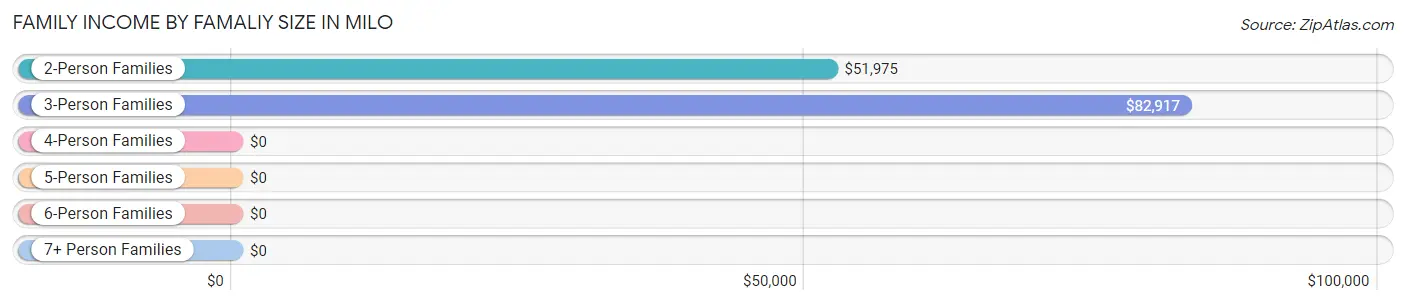
Family Income by Famaliy Size in Milo
3-person families (70 | 15.7%) account for the highest median family income in Milo with $82,917 per family, while 3-person families (70 | 15.7%) have the highest median income of $27,639 per family member.
| Income Bracket | # Families | Median Income |
| 2-Person Families | 317 (71.2%) | $51,975 |
| 3-Person Families | 70 (15.7%) | $82,917 |
| 4-Person Families | 40 (9.0%) | $0 |
| 5-Person Families | 15 (3.4%) | $0 |
| 6-Person Families | 3 (0.7%) | $0 |
| 7+ Person Families | 0 (0.0%) | $0 |
| Total | 445 (100.0%) | $55,491 |
Family Income by Number of Earners in Milo
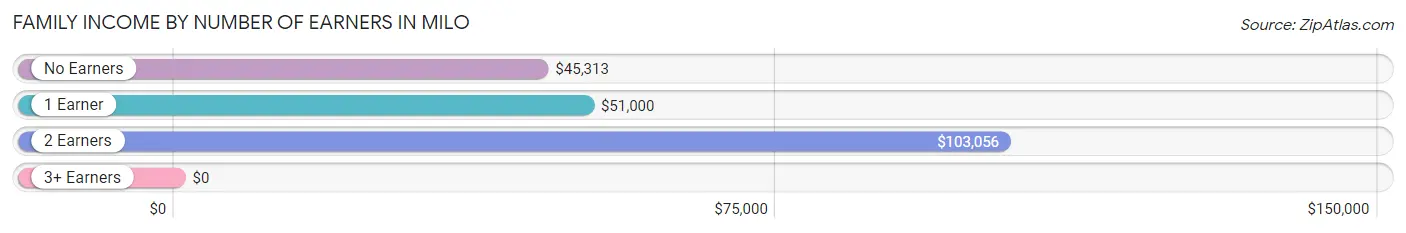
| Number of Earners | # Families | Median Income |
| No Earners | 101 (22.7%) | $45,313 |
| 1 Earner | 182 (40.9%) | $51,000 |
| 2 Earners | 144 (32.4%) | $103,056 |
| 3+ Earners | 18 (4.0%) | $0 |
| Total | 445 (100.0%) | $55,491 |
Household Income in Milo
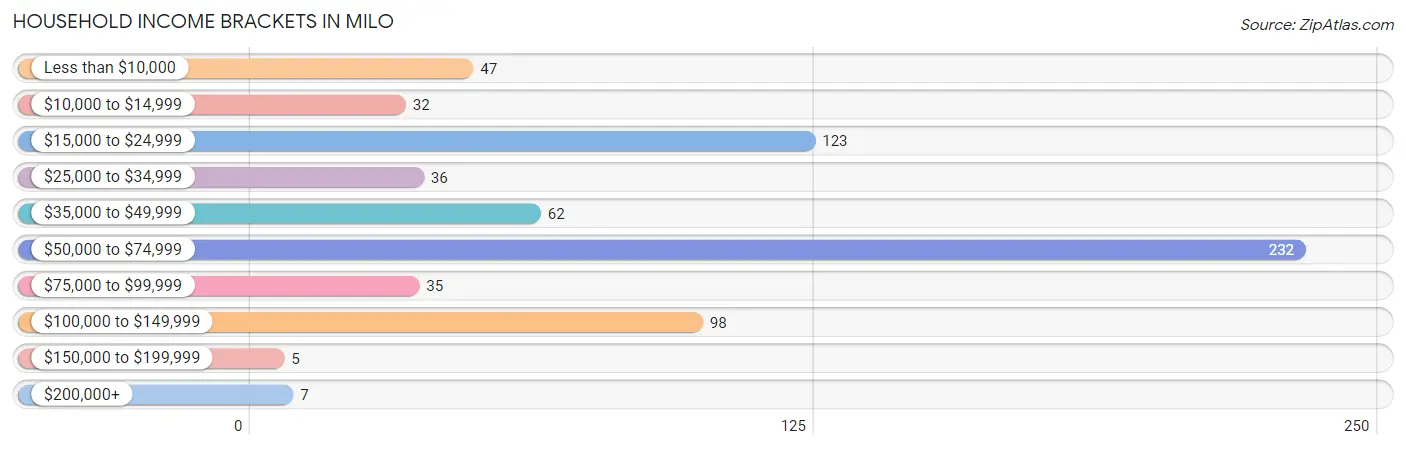
Household Income Brackets in Milo
With 232 households falling in the category, the $50,000 to $74,999 income range is the most frequent in Milo, accounting for 34.3% of all households. In contrast, only 5 households (0.7%) fall into the $150,000 to $199,999 income bracket, making it the least populous group.
| Income Bracket | # Households | % Households |
| Less than $10,000 | 47 | 6.9% |
| $10,000 to $14,999 | 32 | 4.7% |
| $15,000 to $24,999 | 123 | 18.2% |
| $25,000 to $34,999 | 36 | 5.3% |
| $35,000 to $49,999 | 62 | 9.2% |
| $50,000 to $74,999 | 232 | 34.3% |
| $75,000 to $99,999 | 35 | 5.2% |
| $100,000 to $149,999 | 98 | 14.5% |
| $150,000 to $199,999 | 5 | 0.7% |
| $200,000+ | 7 | 1.0% |
Household Income by Householder Age in Milo
The median household income in Milo is $51,528, with the highest median household income of $55,450 found in the 45 to 64 years age bracket for the primary householder. A total of 311 households (45.9%) fall into this category.
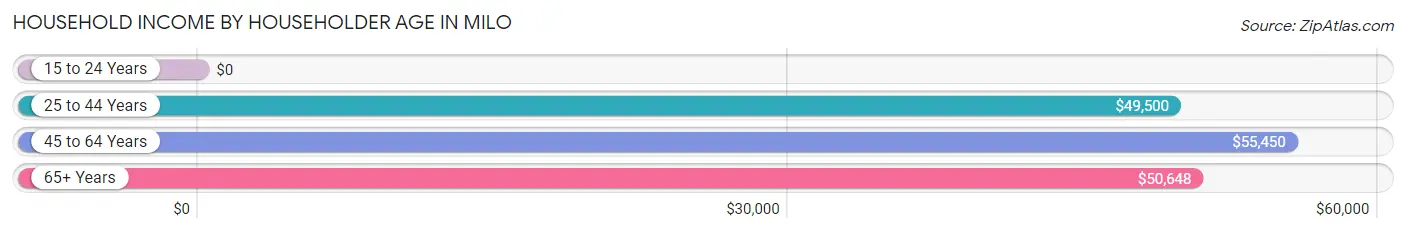
| Income Bracket | # Households | Median Income |
| 15 to 24 Years | 0 (0.0%) | $0 |
| 25 to 44 Years | 164 (24.2%) | $49,500 |
| 45 to 64 Years | 311 (45.9%) | $55,450 |
| 65+ Years | 202 (29.8%) | $50,648 |
| Total | 677 (100.0%) | $51,528 |
Poverty in Milo
Income Below Poverty by Sex and Age in Milo
With 11.6% poverty level for males and 21.3% for females among the residents of Milo, 25 to 34 year old males and 16 and 17 year old females are the most vulnerable to poverty, with 16 males (32.0%) and 22 females (84.6%) in their respective age groups living below the poverty level.
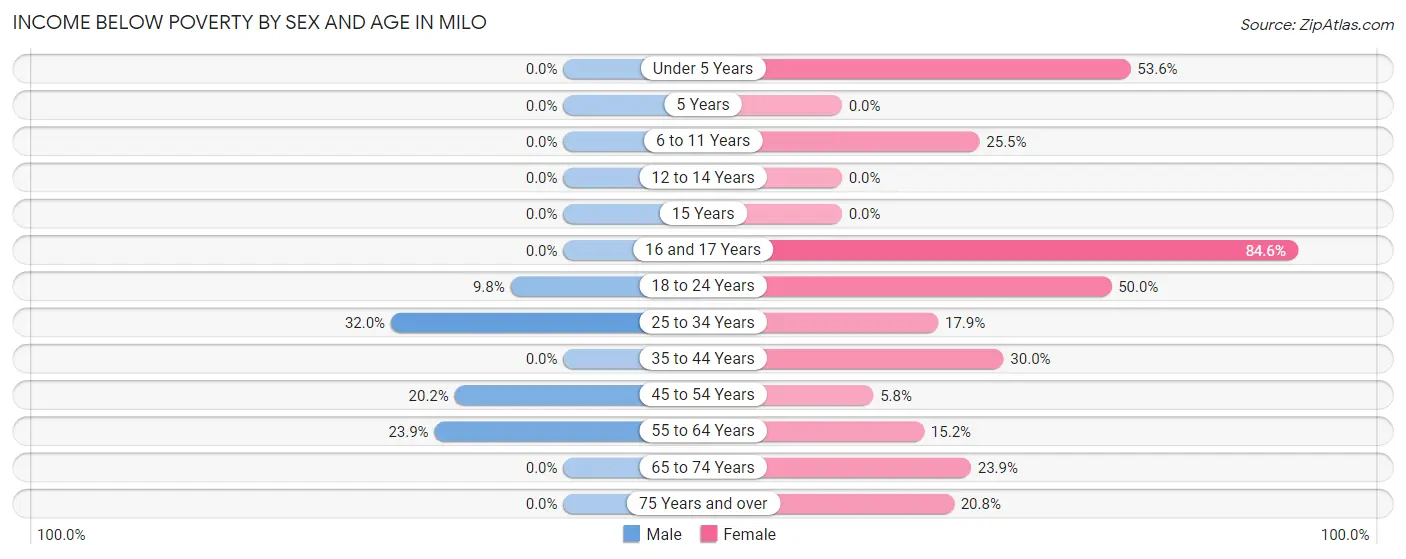
| Age Bracket | Male | Female |
| Under 5 Years | 0 (0.0%) | 15 (53.6%) |
| 5 Years | 0 (0.0%) | 0 (0.0%) |
| 6 to 11 Years | 0 (0.0%) | 12 (25.5%) |
| 12 to 14 Years | 0 (0.0%) | 0 (0.0%) |
| 15 Years | 0 (0.0%) | 0 (0.0%) |
| 16 and 17 Years | 0 (0.0%) | 22 (84.6%) |
| 18 to 24 Years | 5 (9.8%) | 3 (50.0%) |
| 25 to 34 Years | 16 (32.0%) | 15 (17.9%) |
| 35 to 44 Years | 0 (0.0%) | 18 (30.0%) |
| 45 to 54 Years | 22 (20.2%) | 6 (5.8%) |
| 55 to 64 Years | 39 (23.9%) | 25 (15.2%) |
| 65 to 74 Years | 0 (0.0%) | 17 (23.9%) |
| 75 Years and over | 0 (0.0%) | 16 (20.8%) |
| Total | 82 (11.6%) | 149 (21.3%) |
Income Above Poverty by Sex and Age in Milo
According to the poverty statistics in Milo, males aged under 5 years and females aged 5 years are the age groups that are most secure financially, with 100.0% of males and 100.0% of females in these age groups living above the poverty line.
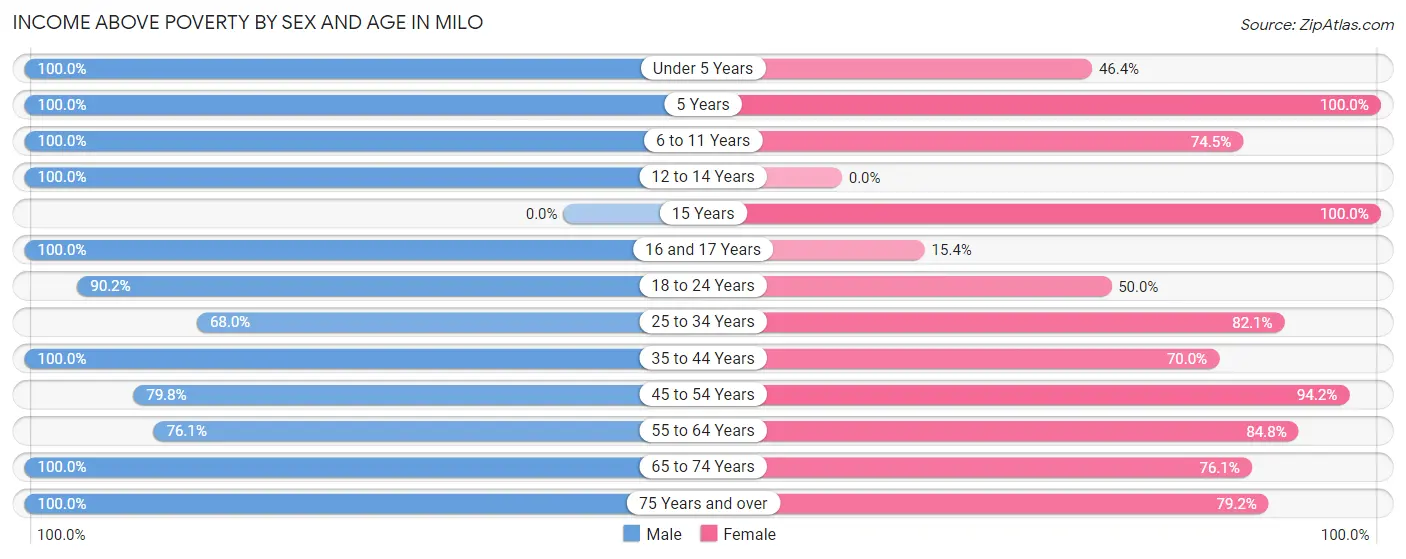
| Age Bracket | Male | Female |
| Under 5 Years | 4 (100.0%) | 13 (46.4%) |
| 5 Years | 5 (100.0%) | 5 (100.0%) |
| 6 to 11 Years | 30 (100.0%) | 35 (74.5%) |
| 12 to 14 Years | 3 (100.0%) | 0 (0.0%) |
| 15 Years | 0 (0.0%) | 27 (100.0%) |
| 16 and 17 Years | 37 (100.0%) | 4 (15.4%) |
| 18 to 24 Years | 46 (90.2%) | 3 (50.0%) |
| 25 to 34 Years | 34 (68.0%) | 69 (82.1%) |
| 35 to 44 Years | 99 (100.0%) | 42 (70.0%) |
| 45 to 54 Years | 87 (79.8%) | 97 (94.2%) |
| 55 to 64 Years | 124 (76.1%) | 139 (84.8%) |
| 65 to 74 Years | 84 (100.0%) | 54 (76.1%) |
| 75 Years and over | 72 (100.0%) | 61 (79.2%) |
| Total | 625 (88.4%) | 549 (78.6%) |
Income Below Poverty Among Married-Couple Families in Milo
The poverty statistics for married-couple families in Milo show that 1.8% or 6 of the total 340 families live below the poverty line. Families with 1 or 2 children have the highest poverty rate of 12.8%, comprising of 6 families. On the other hand, families with no children have the lowest poverty rate of 0.0%, which includes 0 families.
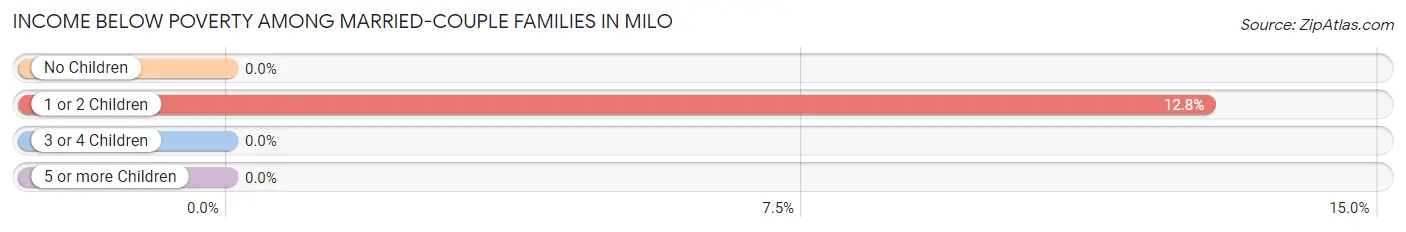
| Children | Above Poverty | Below Poverty |
| No Children | 275 (100.0%) | 0 (0.0%) |
| 1 or 2 Children | 41 (87.2%) | 6 (12.8%) |
| 3 or 4 Children | 18 (100.0%) | 0 (0.0%) |
| 5 or more Children | 0 (0.0%) | 0 (0.0%) |
| Total | 334 (98.2%) | 6 (1.8%) |
Income Below Poverty Among Single-Parent Households in Milo
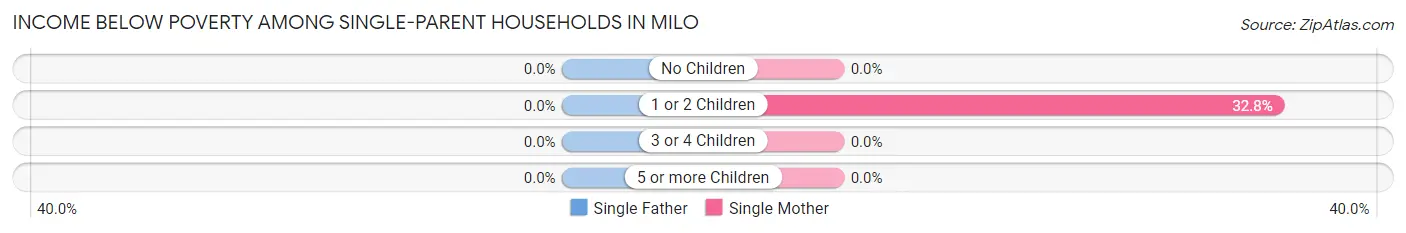
| Children | Single Father | Single Mother |
| No Children | 0 (0.0%) | 0 (0.0%) |
| 1 or 2 Children | 0 (0.0%) | 22 (32.8%) |
| 3 or 4 Children | 0 (0.0%) | 0 (0.0%) |
| 5 or more Children | 0 (0.0%) | 0 (0.0%) |
| Total | 0 (0.0%) | 22 (27.5%) |
Income Below Poverty Among Married-Couple vs Single-Parent Households in Milo
The poverty data for Milo shows that 6 of the married-couple family households (1.8%) and 22 of the single-parent households (20.9%) are living below the poverty level. Within the married-couple family households, those with 1 or 2 children have the highest poverty rate, with 6 households (12.8%) falling below the poverty line. Among the single-parent households, those with 1 or 2 children have the highest poverty rate, with 22 household (32.8%) living below poverty.
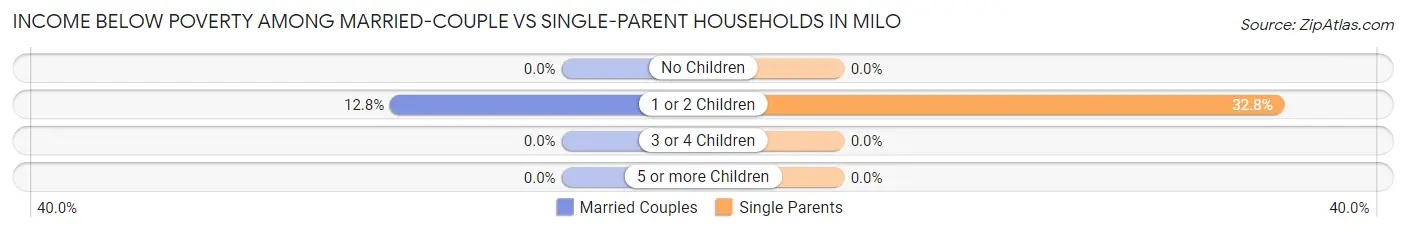
| Children | Married-Couple Families | Single-Parent Households |
| No Children | 0 (0.0%) | 0 (0.0%) |
| 1 or 2 Children | 6 (12.8%) | 22 (32.8%) |
| 3 or 4 Children | 0 (0.0%) | 0 (0.0%) |
| 5 or more Children | 0 (0.0%) | 0 (0.0%) |
| Total | 6 (1.8%) | 22 (20.9%) |
Race in Milo
The most populous races in Milo are White / Caucasian (1,367 | 97.0%), Two or more Races (23 | 1.6%), and Asian (19 | 1.3%).
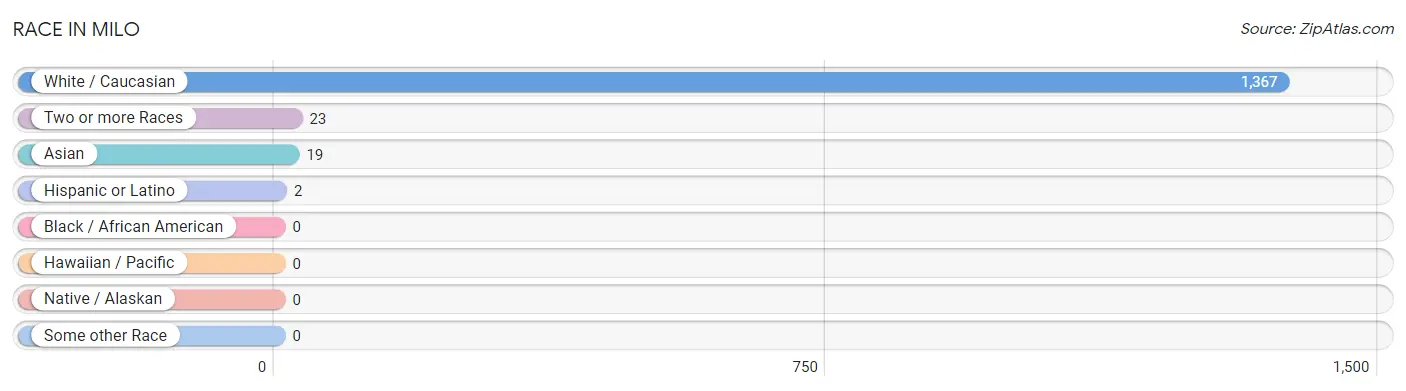
| Race | # Population | % Population |
| Asian | 19 | 1.3% |
| Black / African American | 0 | 0.0% |
| Hawaiian / Pacific | 0 | 0.0% |
| Hispanic or Latino | 2 | 0.1% |
| Native / Alaskan | 0 | 0.0% |
| White / Caucasian | 1,367 | 97.0% |
| Two or more Races | 23 | 1.6% |
| Some other Race | 0 | 0.0% |
| Total | 1,409 | 100.0% |
Ancestry in Milo
The most populous ancestries reported in Milo are Irish (267 | 19.0%), English (259 | 18.4%), American (113 | 8.0%), French (93 | 6.6%), and German (80 | 5.7%), together accounting for 57.6% of all Milo residents.
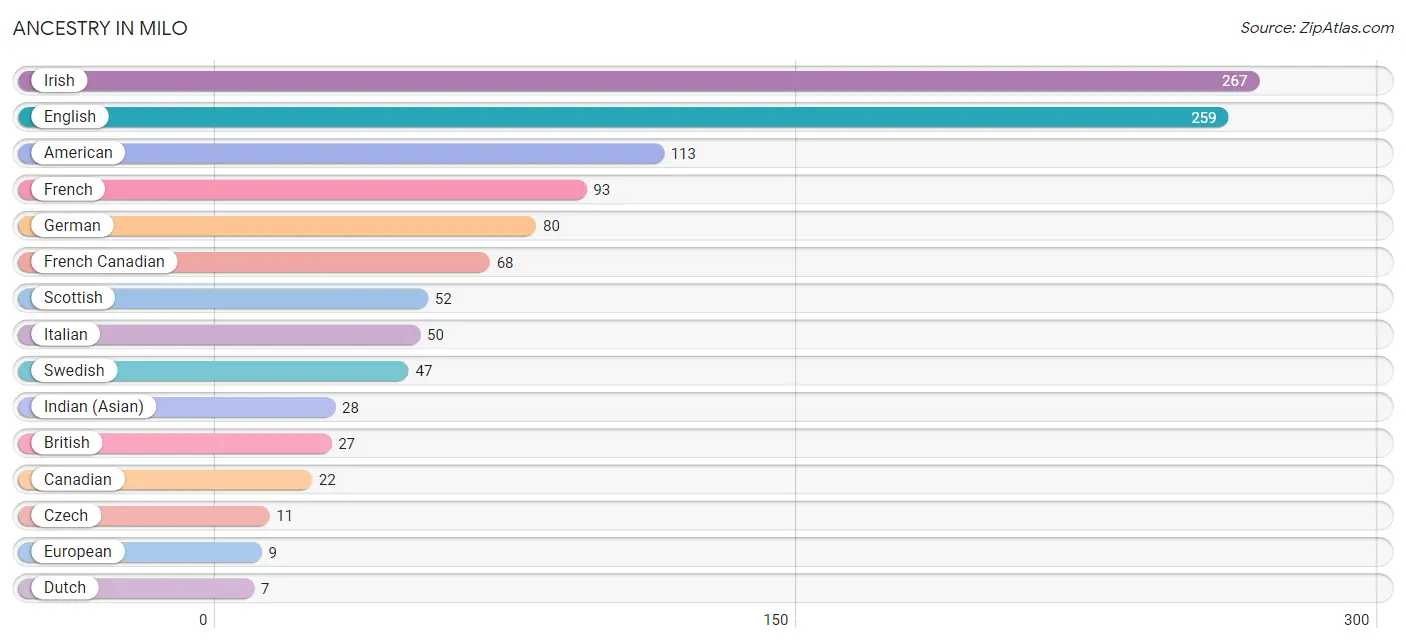
| Ancestry | # Population | % Population |
| American | 113 | 8.0% |
| Austrian | 6 | 0.4% |
| British | 27 | 1.9% |
| Canadian | 22 | 1.6% |
| Czech | 11 | 0.8% |
| Dutch | 7 | 0.5% |
| English | 259 | 18.4% |
| European | 9 | 0.6% |
| French | 93 | 6.6% |
| French Canadian | 68 | 4.8% |
| German | 80 | 5.7% |
| Greek | 6 | 0.4% |
| Indian (Asian) | 28 | 2.0% |
| Irish | 267 | 19.0% |
| Italian | 50 | 3.5% |
| Mexican | 2 | 0.1% |
| Polish | 6 | 0.4% |
| Scotch-Irish | 7 | 0.5% |
| Scottish | 52 | 3.7% |
| Swedish | 47 | 3.3% |
| Swiss | 7 | 0.5% |
| Welsh | 3 | 0.2% | View All 22 Rows |
Immigrants in Milo
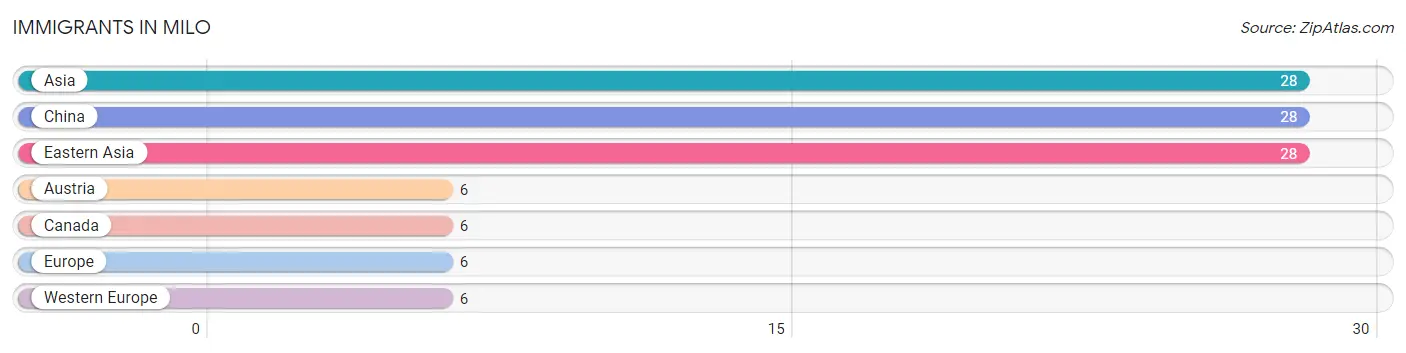
The most numerous immigrant groups reported in Milo came from Asia (28 | 2.0%), China (28 | 2.0%), Eastern Asia (28 | 2.0%), Austria (6 | 0.4%), and Canada (6 | 0.4%), together accounting for 6.8% of all Milo residents.
| Immigration Origin | # Population | % Population |
| Asia | 28 | 2.0% |
| Austria | 6 | 0.4% |
| Canada | 6 | 0.4% |
| China | 28 | 2.0% |
| Eastern Asia | 28 | 2.0% |
| Europe | 6 | 0.4% |
| Western Europe | 6 | 0.4% | View All 7 Rows |
Sex and Age in Milo
Sex and Age in Milo
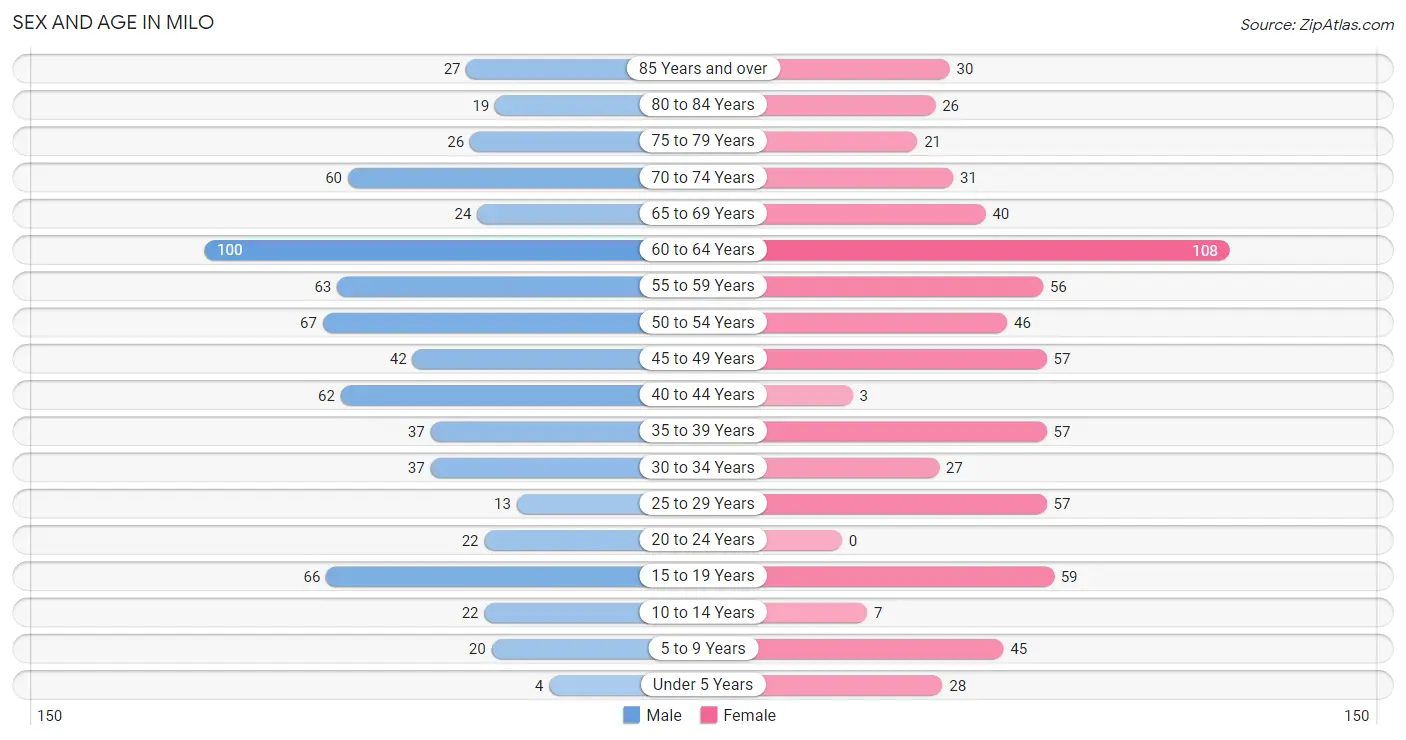
The most populous age groups in Milo are 60 to 64 Years (100 | 14.1%) for men and 60 to 64 Years (108 | 15.5%) for women.
| Age Bracket | Male | Female |
| Under 5 Years | 4 (0.6%) | 28 (4.0%) |
| 5 to 9 Years | 20 (2.8%) | 45 (6.5%) |
| 10 to 14 Years | 22 (3.1%) | 7 (1.0%) |
| 15 to 19 Years | 66 (9.3%) | 59 (8.5%) |
| 20 to 24 Years | 22 (3.1%) | 0 (0.0%) |
| 25 to 29 Years | 13 (1.8%) | 57 (8.2%) |
| 30 to 34 Years | 37 (5.2%) | 27 (3.9%) |
| 35 to 39 Years | 37 (5.2%) | 57 (8.2%) |
| 40 to 44 Years | 62 (8.7%) | 3 (0.4%) |
| 45 to 49 Years | 42 (5.9%) | 57 (8.2%) |
| 50 to 54 Years | 67 (9.4%) | 46 (6.6%) |
| 55 to 59 Years | 63 (8.9%) | 56 (8.0%) |
| 60 to 64 Years | 100 (14.1%) | 108 (15.5%) |
| 65 to 69 Years | 24 (3.4%) | 40 (5.7%) |
| 70 to 74 Years | 60 (8.4%) | 31 (4.4%) |
| 75 to 79 Years | 26 (3.7%) | 21 (3.0%) |
| 80 to 84 Years | 19 (2.7%) | 26 (3.7%) |
| 85 Years and over | 27 (3.8%) | 30 (4.3%) |
| Total | 711 (100.0%) | 698 (100.0%) |
Families and Households in Milo
Median Family Size in Milo
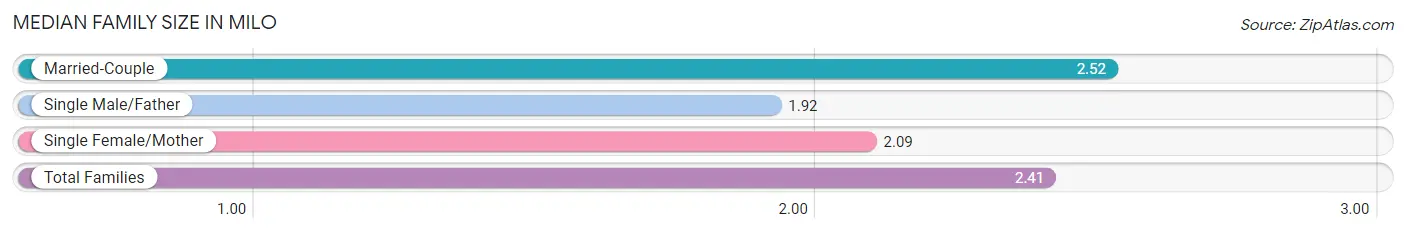
The median family size in Milo is 2.41 persons per family, with married-couple families (340 | 76.4%) accounting for the largest median family size of 2.52 persons per family. On the other hand, single male/father families (25 | 5.6%) represent the smallest median family size with 1.92 persons per family.
| Family Type | # Families | Family Size |
| Married-Couple | 340 (76.4%) | 2.52 |
| Single Male/Father | 25 (5.6%) | 1.92 |
| Single Female/Mother | 80 (18.0%) | 2.09 |
| Total Families | 445 (100.0%) | 2.41 |
Median Household Size in Milo
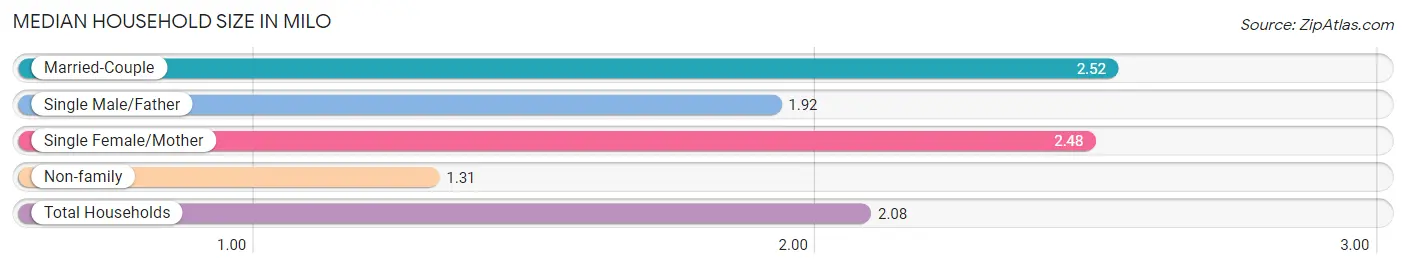
The median household size in Milo is 2.08 persons per household, with married-couple households (340 | 50.2%) accounting for the largest median household size of 2.52 persons per household. non-family households (232 | 34.3%) represent the smallest median household size with 1.31 persons per household.
| Household Type | # Households | Household Size |
| Married-Couple | 340 (50.2%) | 2.52 |
| Single Male/Father | 25 (3.7%) | 1.92 |
| Single Female/Mother | 80 (11.8%) | 2.48 |
| Non-family | 232 (34.3%) | 1.31 |
| Total Households | 677 (100.0%) | 2.08 |
Household Size by Marriage Status in Milo
Out of a total of 677 households in Milo, 445 (65.7%) are family households, while 232 (34.3%) are nonfamily households. The most numerous type of family households are 2-person households, comprising 295, and the most common type of nonfamily households are 1-person households, comprising 187.
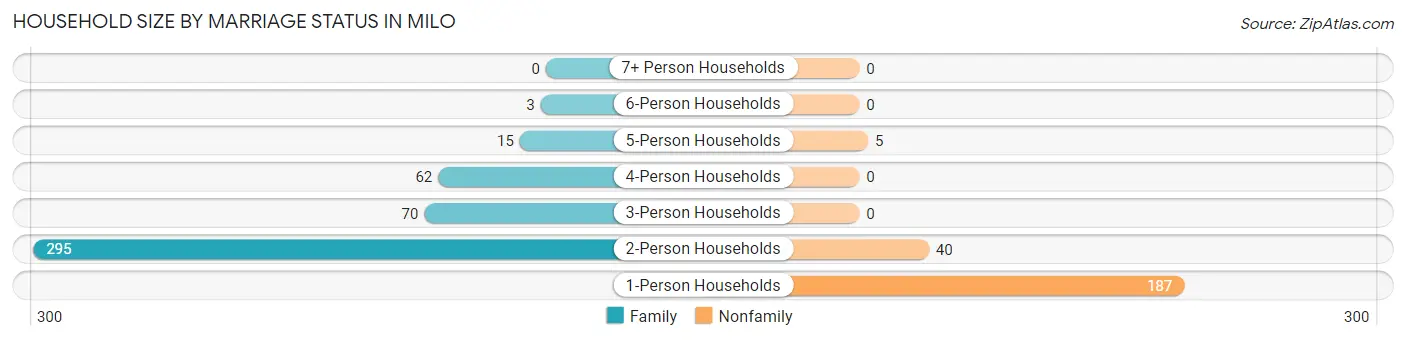
| Household Size | Family Households | Nonfamily Households |
| 1-Person Households | - | 187 (27.6%) |
| 2-Person Households | 295 (43.6%) | 40 (5.9%) |
| 3-Person Households | 70 (10.3%) | 0 (0.0%) |
| 4-Person Households | 62 (9.2%) | 0 (0.0%) |
| 5-Person Households | 15 (2.2%) | 5 (0.7%) |
| 6-Person Households | 3 (0.4%) | 0 (0.0%) |
| 7+ Person Households | 0 (0.0%) | 0 (0.0%) |
| Total | 445 (65.7%) | 232 (34.3%) |
Female Fertility in Milo
Fertility by Age in Milo
Average fertility rate in Milo is 12.0 births per 1,000 women. Women in the age bracket of 35 to 50 years have the highest fertility rate with 26.0 births per 1,000 women. Women in the age bracket of 35 to 50 years acount for 100.0% of all women with births.
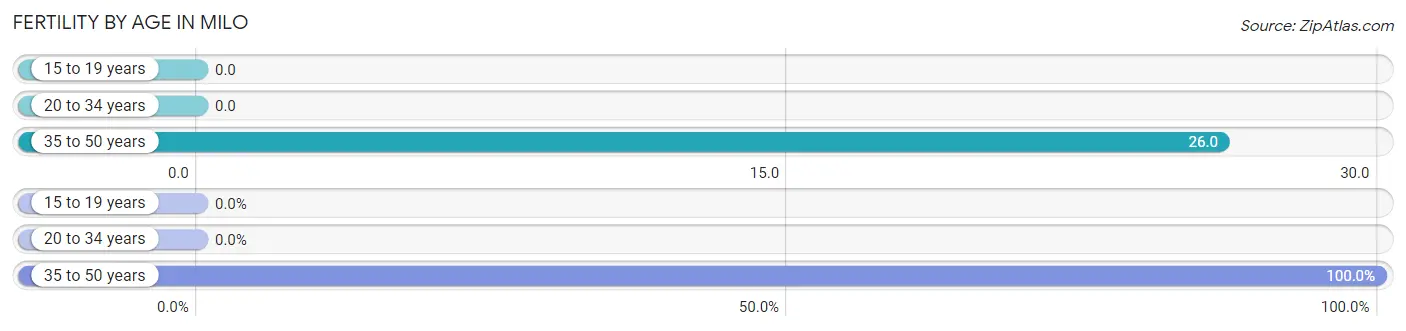
| Age Bracket | Women with Births | Births / 1,000 Women |
| 15 to 19 years | 0 (0.0%) | 0.0 |
| 20 to 34 years | 0 (0.0%) | 0.0 |
| 35 to 50 years | 3 (100.0%) | 26.0 |
| Total | 3 (100.0%) | 12.0 |
Fertility by Age by Marriage Status in Milo
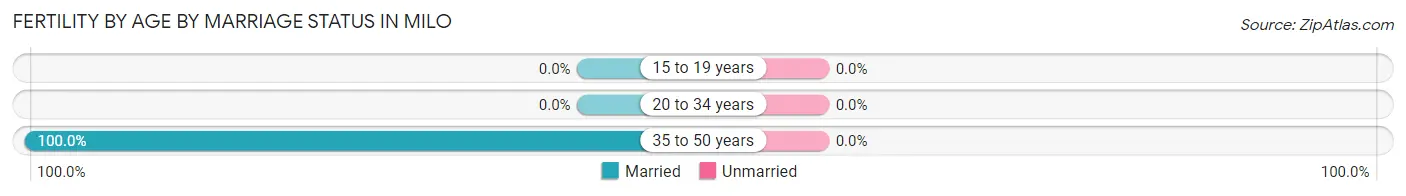
| Age Bracket | Married | Unmarried |
| 15 to 19 years | 0 (0.0%) | 0 (0.0%) |
| 20 to 34 years | 0 (0.0%) | 0 (0.0%) |
| 35 to 50 years | 3 (100.0%) | 0 (0.0%) |
| Total | 3 (100.0%) | 0 (0.0%) |
Fertility by Education in Milo
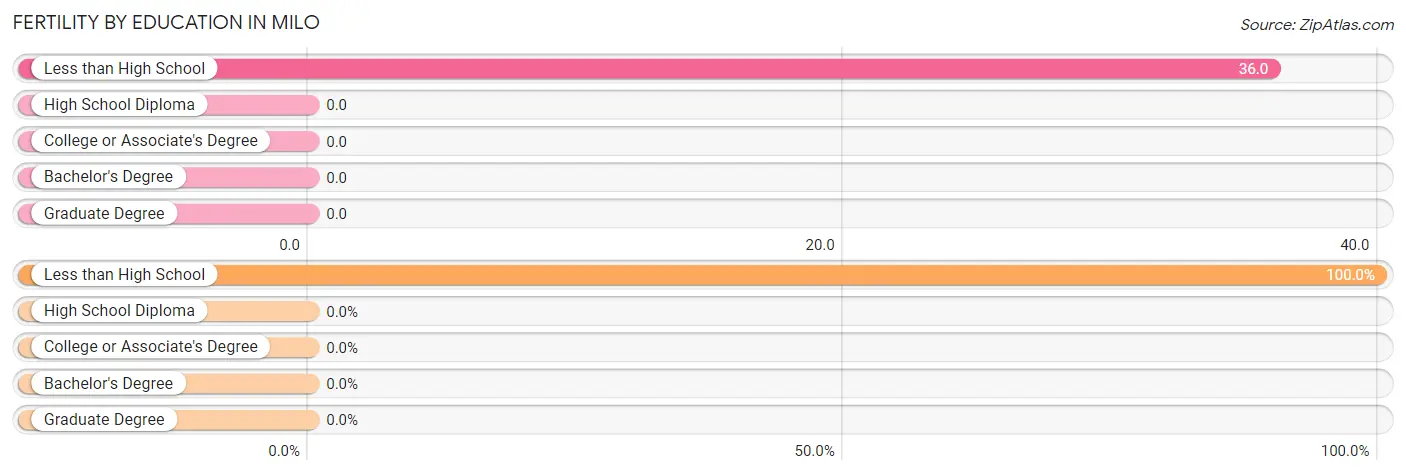
| Educational Attainment | Women with Births | Births / 1,000 Women |
| Less than High School | 3 (100.0%) | 36.0 |
| High School Diploma | 0 (0.0%) | 0.0 |
| College or Associate's Degree | 0 (0.0%) | 0.0 |
| Bachelor's Degree | 0 (0.0%) | 0.0 |
| Graduate Degree | 0 (0.0%) | 0.0 |
| Total | 3 (100.0%) | 12.0 |
Fertility by Education by Marriage Status in Milo
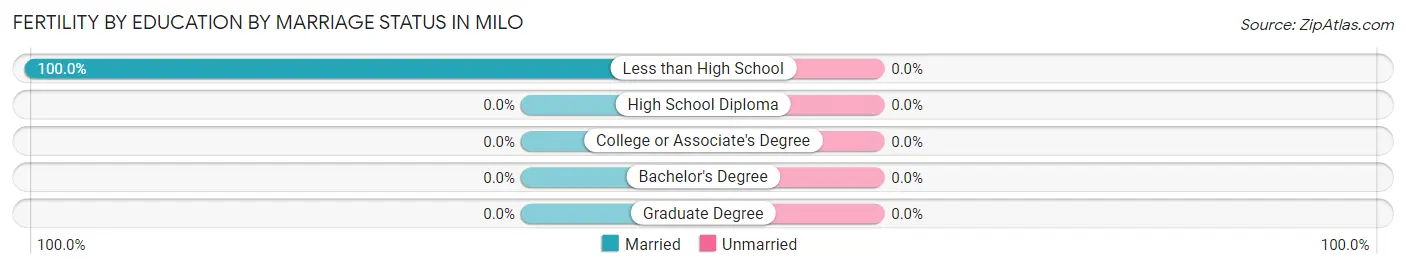
| Educational Attainment | Married | Unmarried |
| Less than High School | 3 (100.0%) | 0 (0.0%) |
| High School Diploma | 0 (0.0%) | 0 (0.0%) |
| College or Associate's Degree | 0 (0.0%) | 0 (0.0%) |
| Bachelor's Degree | 0 (0.0%) | 0 (0.0%) |
| Graduate Degree | 0 (0.0%) | 0 (0.0%) |
| Total | 3 (100.0%) | 0 (0.0%) |
Employment Characteristics in Milo
Employment by Class of Employer in Milo
Among the 507 employed individuals in Milo, private company employees (333 | 65.7%), state government employees (59 | 11.6%), and federal government employees (34 | 6.7%) make up the most common classes of employment.
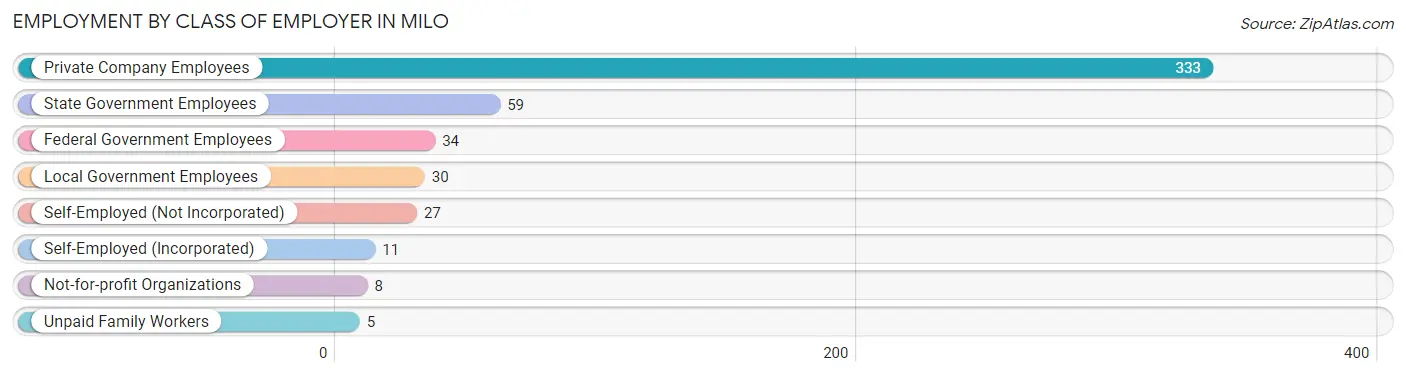
| Employer Class | # Employees | % Employees |
| Private Company Employees | 333 | 65.7% |
| Self-Employed (Incorporated) | 11 | 2.2% |
| Self-Employed (Not Incorporated) | 27 | 5.3% |
| Not-for-profit Organizations | 8 | 1.6% |
| Local Government Employees | 30 | 5.9% |
| State Government Employees | 59 | 11.6% |
| Federal Government Employees | 34 | 6.7% |
| Unpaid Family Workers | 5 | 1.0% |
| Total | 507 | 100.0% |
Employment Status by Age in Milo
According to the labor force statistics for Milo, out of the total population over 16 years of age (1,256), 41.7% or 524 individuals are in the labor force, with 2.1% or 11 of them unemployed. The age group with the highest labor force participation rate is 45 to 54 years, with 87.3% or 185 individuals in the labor force. Within the labor force, the 16 to 19 years age range has the highest percentage of unemployed individuals, with 70.0% or 7 of them being unemployed.
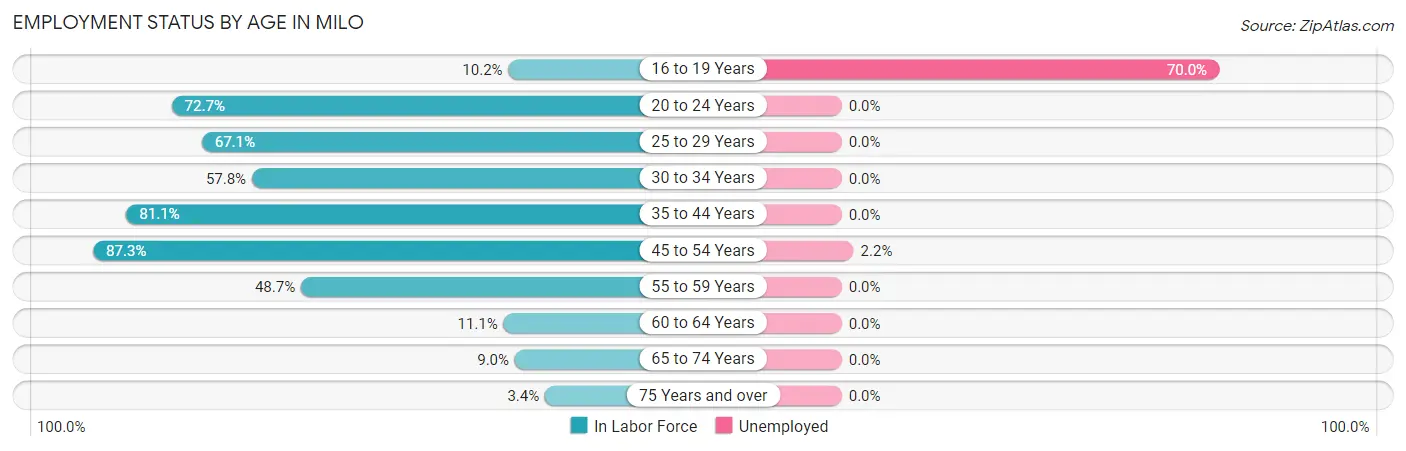
| Age Bracket | In Labor Force | Unemployed |
| 16 to 19 Years | 10 (10.2%) | 7 (70.0%) |
| 20 to 24 Years | 16 (72.7%) | 0 (0.0%) |
| 25 to 29 Years | 47 (67.1%) | 0 (0.0%) |
| 30 to 34 Years | 37 (57.8%) | 0 (0.0%) |
| 35 to 44 Years | 129 (81.1%) | 0 (0.0%) |
| 45 to 54 Years | 185 (87.3%) | 4 (2.2%) |
| 55 to 59 Years | 58 (48.7%) | 0 (0.0%) |
| 60 to 64 Years | 23 (11.1%) | 0 (0.0%) |
| 65 to 74 Years | 14 (9.0%) | 0 (0.0%) |
| 75 Years and over | 5 (3.4%) | 0 (0.0%) |
| Total | 524 (41.7%) | 11 (2.1%) |
Employment Status by Educational Attainment in Milo
According to labor force statistics for Milo, 57.6% of individuals (479) out of the total population between 25 and 64 years of age (832) are in the labor force, with 0.8% or 4 of them being unemployed. The group with the highest labor force participation rate are those with the educational attainment of bachelor's degree or higher, with 71.5% or 133 individuals in the labor force. Within the labor force, individuals with less than high school education have the highest percentage of unemployment, with 16.0% or 4 of them being unemployed.
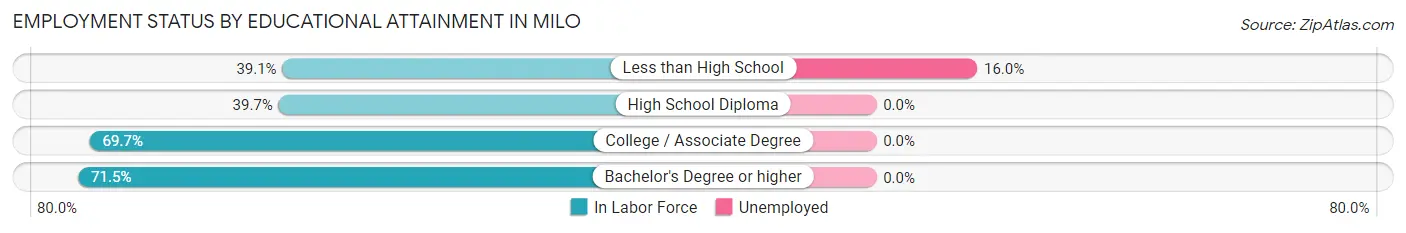
| Educational Attainment | In Labor Force | Unemployed |
| Less than High School | 25 (39.1%) | 10 (16.0%) |
| High School Diploma | 112 (39.7%) | 0 (0.0%) |
| College / Associate Degree | 209 (69.7%) | 0 (0.0%) |
| Bachelor's Degree or higher | 133 (71.5%) | 0 (0.0%) |
| Total | 479 (57.6%) | 7 (0.8%) |
Employment Occupations by Sex in Milo
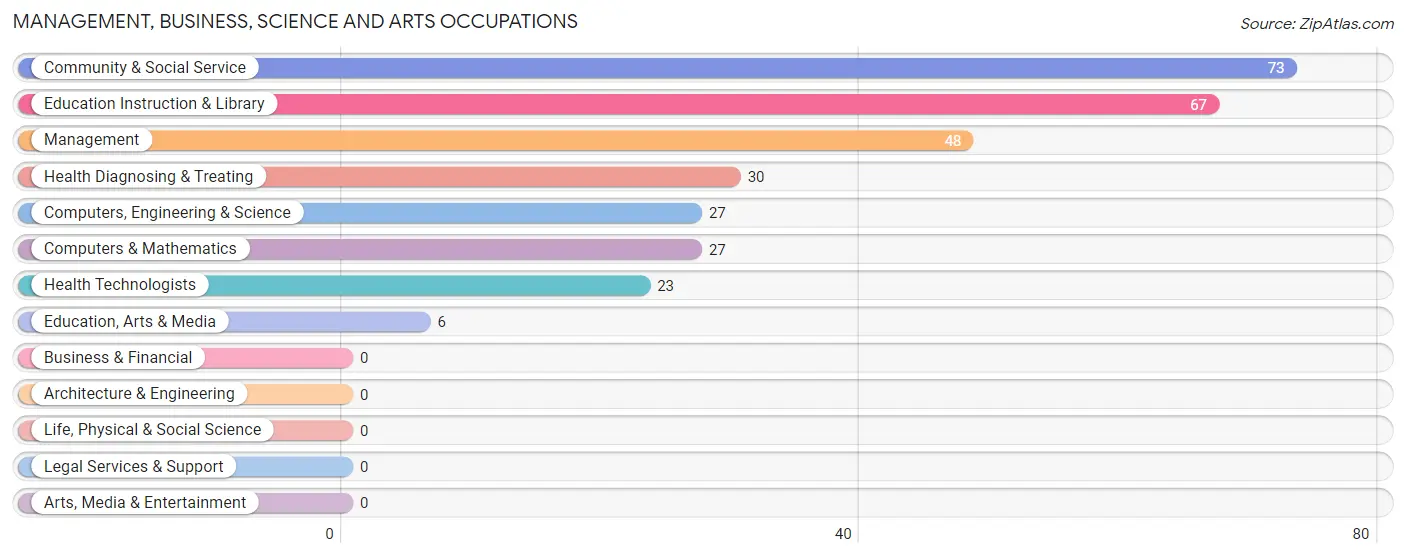
Management, Business, Science and Arts Occupations
The most common Management, Business, Science and Arts occupations in Milo are Community & Social Service (73 | 14.2%), Education Instruction & Library (67 | 13.1%), Management (48 | 9.4%), Health Diagnosing & Treating (30 | 5.9%), and Computers, Engineering & Science (27 | 5.3%).
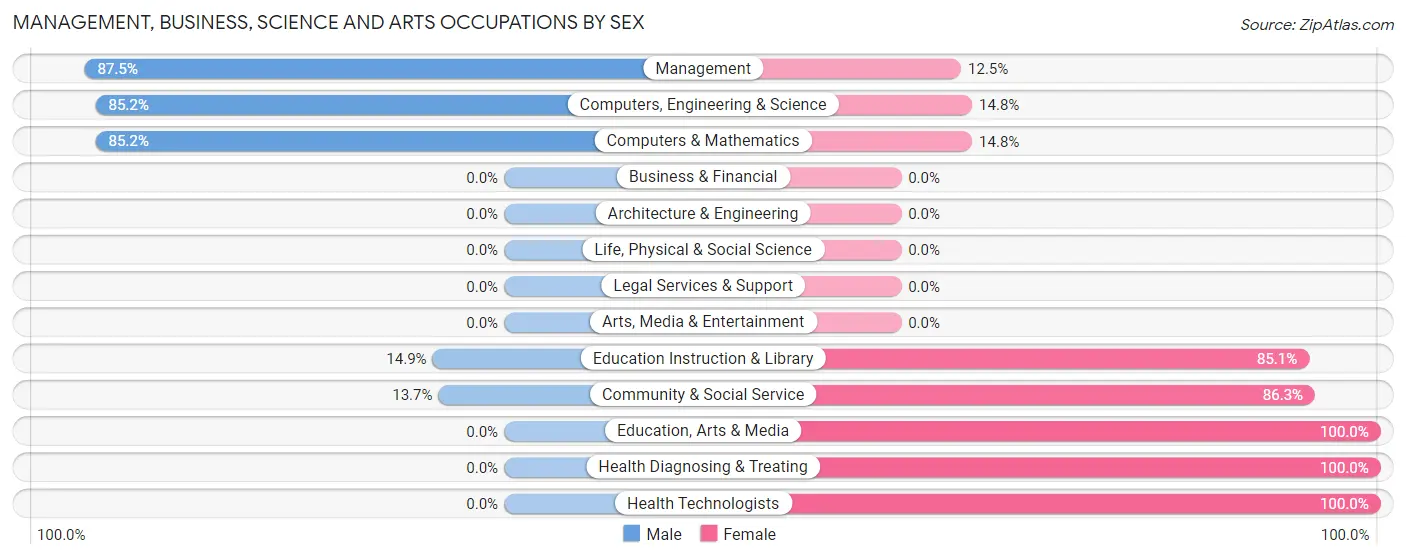
Management, Business, Science and Arts Occupations by Sex
Within the Management, Business, Science and Arts occupations in Milo, the most male-oriented occupations are Management (87.5%), Computers, Engineering & Science (85.2%), and Computers & Mathematics (85.2%), while the most female-oriented occupations are Education, Arts & Media (100.0%), Health Diagnosing & Treating (100.0%), and Health Technologists (100.0%).
| Occupation | Male | Female |
| Management | 42 (87.5%) | 6 (12.5%) |
| Business & Financial | 0 (0.0%) | 0 (0.0%) |
| Computers, Engineering & Science | 23 (85.2%) | 4 (14.8%) |
| Computers & Mathematics | 23 (85.2%) | 4 (14.8%) |
| Architecture & Engineering | 0 (0.0%) | 0 (0.0%) |
| Life, Physical & Social Science | 0 (0.0%) | 0 (0.0%) |
| Community & Social Service | 10 (13.7%) | 63 (86.3%) |
| Education, Arts & Media | 0 (0.0%) | 6 (100.0%) |
| Legal Services & Support | 0 (0.0%) | 0 (0.0%) |
| Education Instruction & Library | 10 (14.9%) | 57 (85.1%) |
| Arts, Media & Entertainment | 0 (0.0%) | 0 (0.0%) |
| Health Diagnosing & Treating | 0 (0.0%) | 30 (100.0%) |
| Health Technologists | 0 (0.0%) | 23 (100.0%) |
| Total (Category) | 75 (42.1%) | 103 (57.9%) |
| Total (Overall) | 273 (53.2%) | 240 (46.8%) |
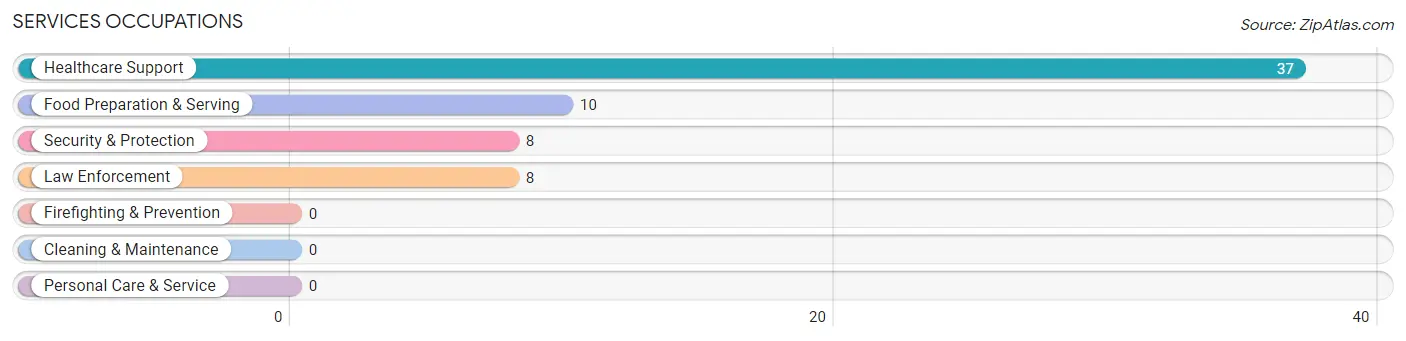
Services Occupations
The most common Services occupations in Milo are Healthcare Support (37 | 7.2%), Food Preparation & Serving (10 | 1.9%), Security & Protection (8 | 1.6%), and Law Enforcement (8 | 1.6%).
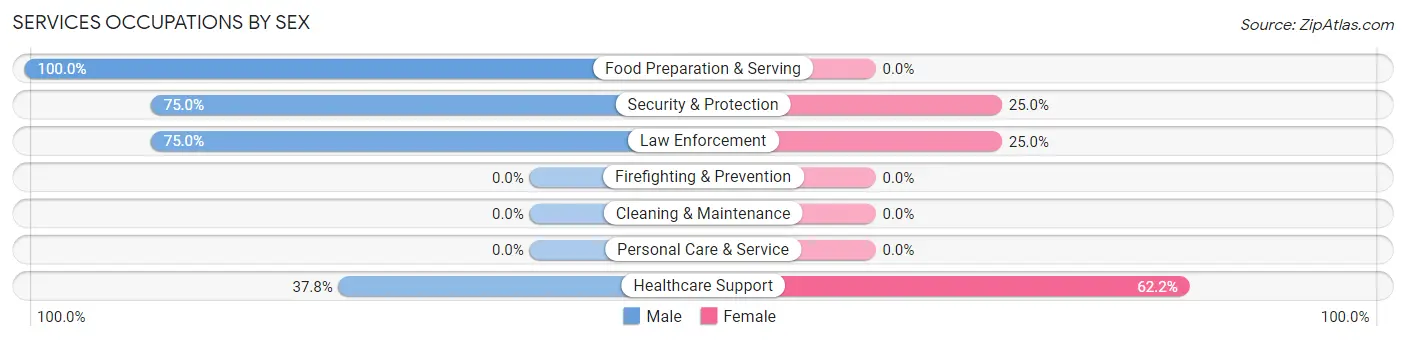
Services Occupations by Sex
Within the Services occupations in Milo, the most male-oriented occupations are Food Preparation & Serving (100.0%), Security & Protection (75.0%), and Law Enforcement (75.0%), while the most female-oriented occupations are Healthcare Support (62.2%), Security & Protection (25.0%), and Law Enforcement (25.0%).
| Occupation | Male | Female |
| Healthcare Support | 14 (37.8%) | 23 (62.2%) |
| Security & Protection | 6 (75.0%) | 2 (25.0%) |
| Firefighting & Prevention | 0 (0.0%) | 0 (0.0%) |
| Law Enforcement | 6 (75.0%) | 2 (25.0%) |
| Food Preparation & Serving | 10 (100.0%) | 0 (0.0%) |
| Cleaning & Maintenance | 0 (0.0%) | 0 (0.0%) |
| Personal Care & Service | 0 (0.0%) | 0 (0.0%) |
| Total (Category) | 30 (54.5%) | 25 (45.5%) |
| Total (Overall) | 273 (53.2%) | 240 (46.8%) |
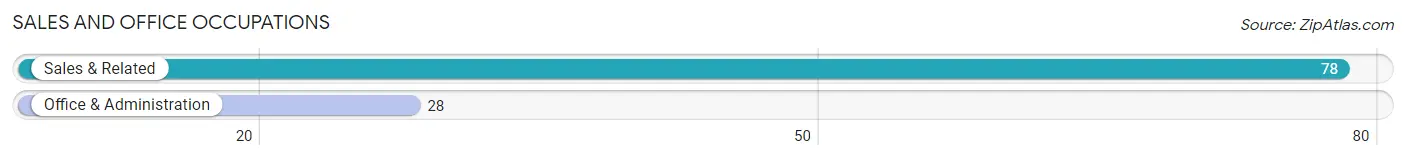
Sales and Office Occupations
The most common Sales and Office occupations in Milo are Sales & Related (78 | 15.2%), and Office & Administration (28 | 5.5%).
Sales and Office Occupations by Sex
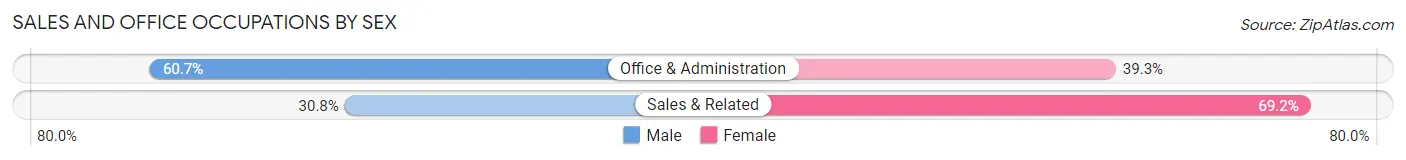
| Occupation | Male | Female |
| Sales & Related | 24 (30.8%) | 54 (69.2%) |
| Office & Administration | 17 (60.7%) | 11 (39.3%) |
| Total (Category) | 41 (38.7%) | 65 (61.3%) |
| Total (Overall) | 273 (53.2%) | 240 (46.8%) |
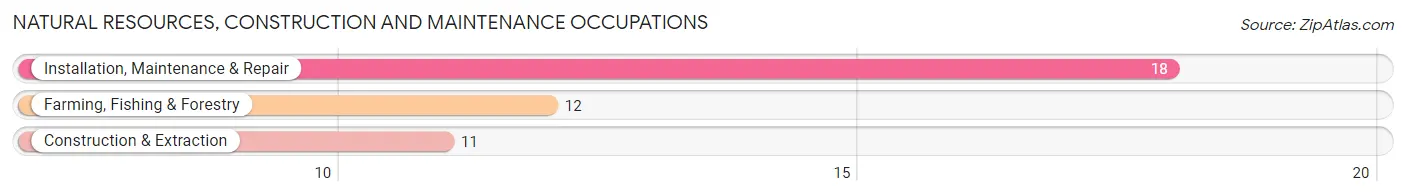
Natural Resources, Construction and Maintenance Occupations
The most common Natural Resources, Construction and Maintenance occupations in Milo are Installation, Maintenance & Repair (18 | 3.5%), Farming, Fishing & Forestry (12 | 2.3%), and Construction & Extraction (11 | 2.1%).
Natural Resources, Construction and Maintenance Occupations by Sex
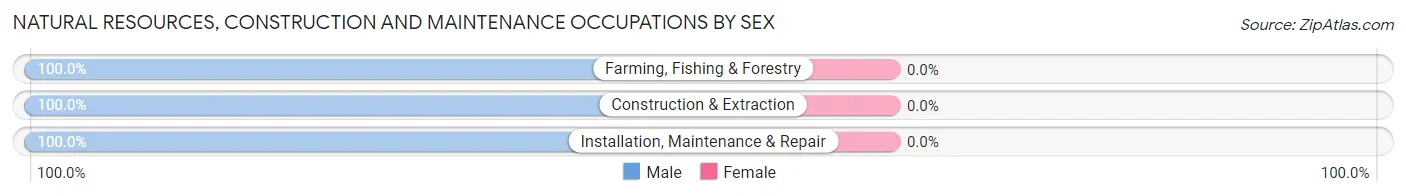
| Occupation | Male | Female |
| Farming, Fishing & Forestry | 12 (100.0%) | 0 (0.0%) |
| Construction & Extraction | 11 (100.0%) | 0 (0.0%) |
| Installation, Maintenance & Repair | 18 (100.0%) | 0 (0.0%) |
| Total (Category) | 41 (100.0%) | 0 (0.0%) |
| Total (Overall) | 273 (53.2%) | 240 (46.8%) |
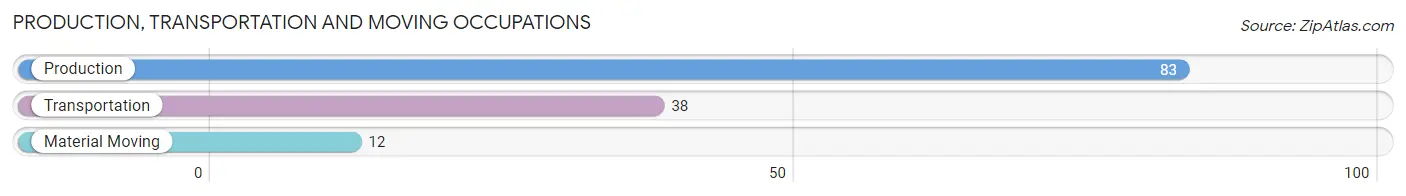
Production, Transportation and Moving Occupations
The most common Production, Transportation and Moving occupations in Milo are Production (83 | 16.2%), Transportation (38 | 7.4%), and Material Moving (12 | 2.3%).
Production, Transportation and Moving Occupations by Sex
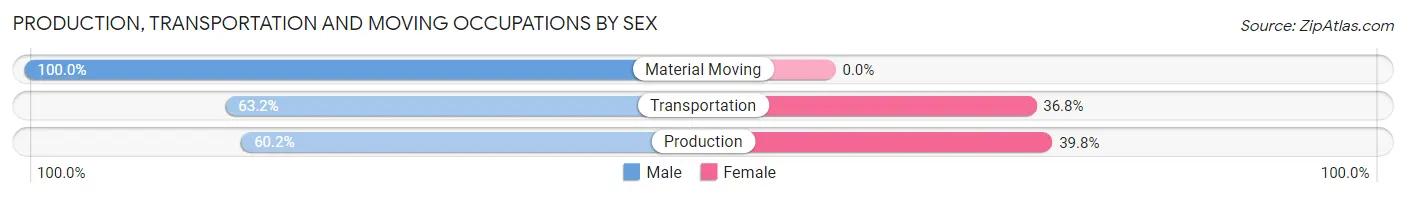
| Occupation | Male | Female |
| Production | 50 (60.2%) | 33 (39.8%) |
| Transportation | 24 (63.2%) | 14 (36.8%) |
| Material Moving | 12 (100.0%) | 0 (0.0%) |
| Total (Category) | 86 (64.7%) | 47 (35.3%) |
| Total (Overall) | 273 (53.2%) | 240 (46.8%) |
Employment Industries by Sex in Milo
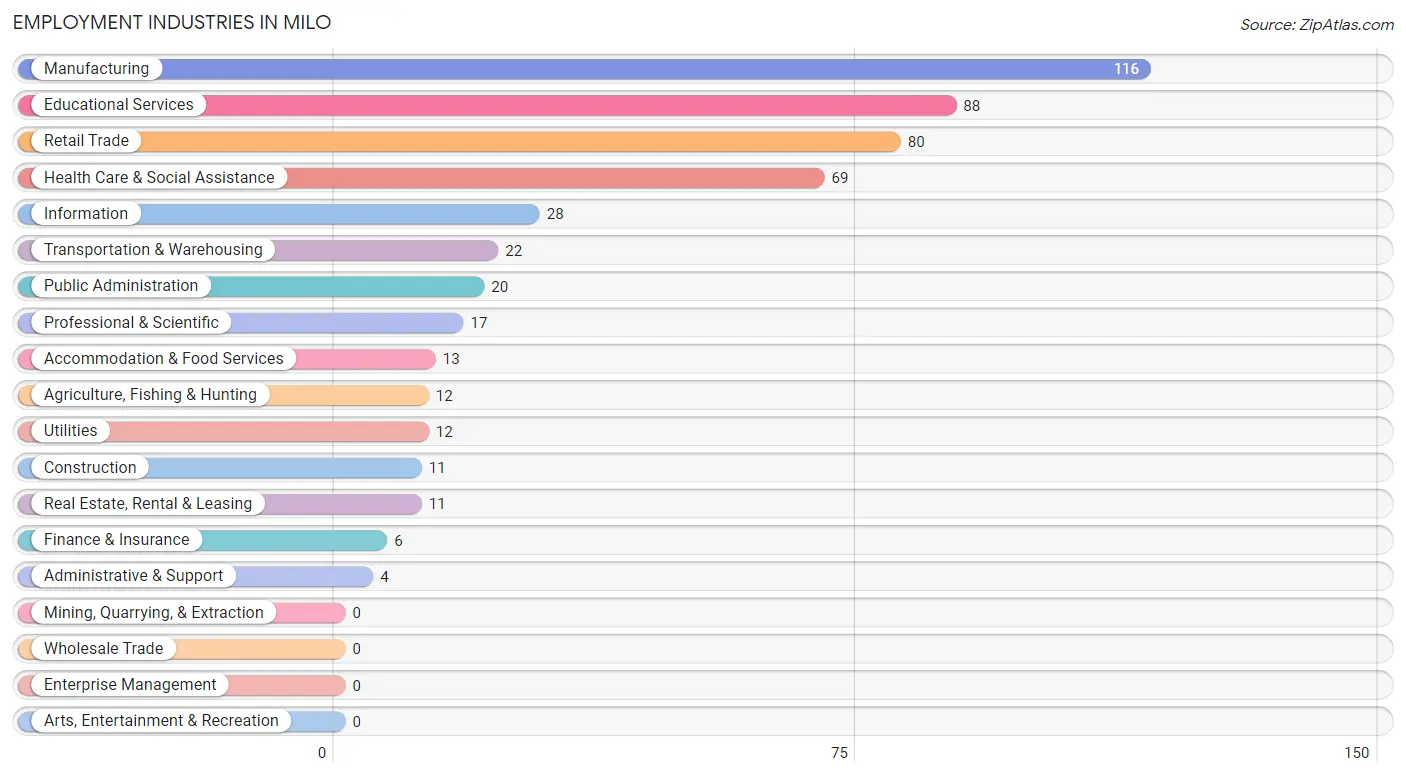
Employment Industries in Milo
The major employment industries in Milo include Manufacturing (116 | 22.6%), Educational Services (88 | 17.2%), Retail Trade (80 | 15.6%), Health Care & Social Assistance (69 | 13.5%), and Information (28 | 5.5%).
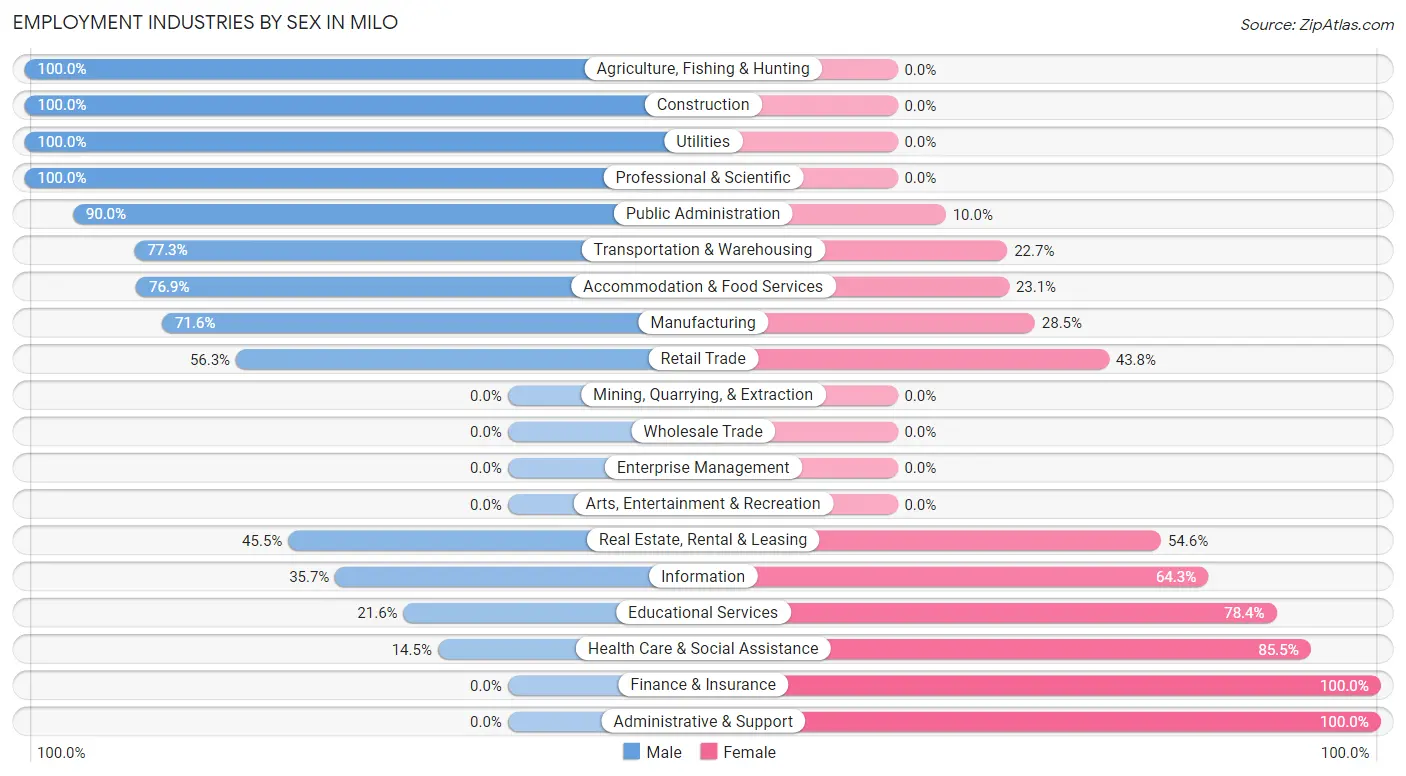
Employment Industries by Sex in Milo
The Milo industries that see more men than women are Agriculture, Fishing & Hunting (100.0%), Construction (100.0%), and Utilities (100.0%), whereas the industries that tend to have a higher number of women are Finance & Insurance (100.0%), Administrative & Support (100.0%), and Health Care & Social Assistance (85.5%).
| Industry | Male | Female |
| Agriculture, Fishing & Hunting | 12 (100.0%) | 0 (0.0%) |
| Mining, Quarrying, & Extraction | 0 (0.0%) | 0 (0.0%) |
| Construction | 11 (100.0%) | 0 (0.0%) |
| Manufacturing | 83 (71.6%) | 33 (28.4%) |
| Wholesale Trade | 0 (0.0%) | 0 (0.0%) |
| Retail Trade | 45 (56.2%) | 35 (43.8%) |
| Transportation & Warehousing | 17 (77.3%) | 5 (22.7%) |
| Utilities | 12 (100.0%) | 0 (0.0%) |
| Information | 10 (35.7%) | 18 (64.3%) |
| Finance & Insurance | 0 (0.0%) | 6 (100.0%) |
| Real Estate, Rental & Leasing | 5 (45.5%) | 6 (54.5%) |
| Professional & Scientific | 17 (100.0%) | 0 (0.0%) |
| Enterprise Management | 0 (0.0%) | 0 (0.0%) |
| Administrative & Support | 0 (0.0%) | 4 (100.0%) |
| Educational Services | 19 (21.6%) | 69 (78.4%) |
| Health Care & Social Assistance | 10 (14.5%) | 59 (85.5%) |
| Arts, Entertainment & Recreation | 0 (0.0%) | 0 (0.0%) |
| Accommodation & Food Services | 10 (76.9%) | 3 (23.1%) |
| Public Administration | 18 (90.0%) | 2 (10.0%) |
| Total | 273 (53.2%) | 240 (46.8%) |
Education in Milo
School Enrollment in Milo
The most common levels of schooling among the 270 students in Milo are high school (113 | 41.8%), college / undergraduate (35 | 13.0%), and elementary school (34 | 12.6%).
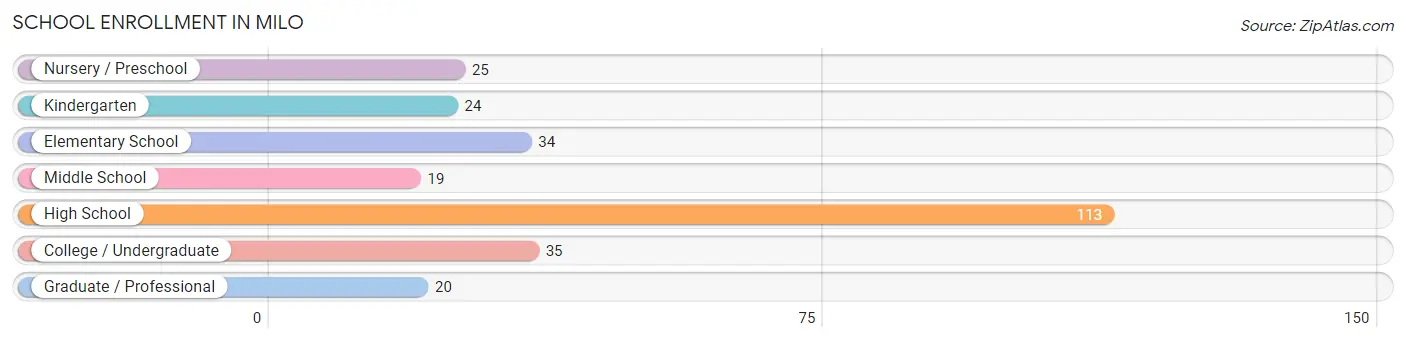
| School Level | # Students | % Students |
| Nursery / Preschool | 25 | 9.3% |
| Kindergarten | 24 | 8.9% |
| Elementary School | 34 | 12.6% |
| Middle School | 19 | 7.0% |
| High School | 113 | 41.8% |
| College / Undergraduate | 35 | 13.0% |
| Graduate / Professional | 20 | 7.4% |
| Total | 270 | 100.0% |
School Enrollment by Age by Funding Source in Milo
Out of a total of 270 students who are enrolled in schools in Milo, 96 (35.6%) attend a private institution, while the remaining 174 (64.4%) are enrolled in public schools. The age group of 35 years and over has the highest likelihood of being enrolled in private schools, with 33 (86.8% in the age bracket) enrolled. Conversely, the age group of 15 to 17 year olds has the lowest likelihood of being enrolled in a private school, with 83 (92.2% in the age bracket) attending a public institution.
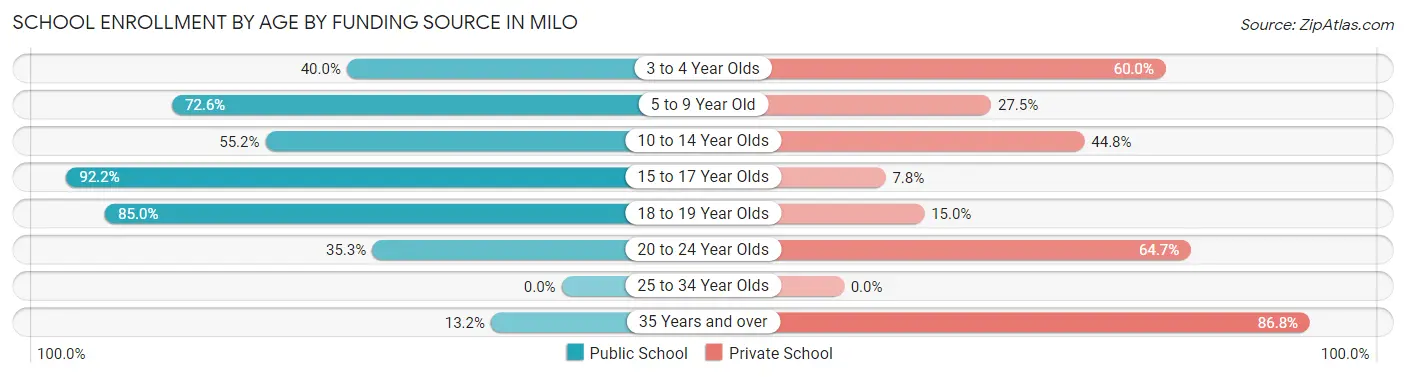
| Age Bracket | Public School | Private School |
| 3 to 4 Year Olds | 10 (40.0%) | 15 (60.0%) |
| 5 to 9 Year Old | 37 (72.6%) | 14 (27.5%) |
| 10 to 14 Year Olds | 16 (55.2%) | 13 (44.8%) |
| 15 to 17 Year Olds | 83 (92.2%) | 7 (7.8%) |
| 18 to 19 Year Olds | 17 (85.0%) | 3 (15.0%) |
| 20 to 24 Year Olds | 6 (35.3%) | 11 (64.7%) |
| 25 to 34 Year Olds | 0 (0.0%) | 0 (0.0%) |
| 35 Years and over | 5 (13.2%) | 33 (86.8%) |
| Total | 174 (64.4%) | 96 (35.6%) |
Educational Attainment by Field of Study in Milo
Education (100 | 35.0%), business (61 | 21.3%), bio, nature & agricultural (37 | 12.9%), social sciences (19 | 6.6%), and engineering (18 | 6.3%) are the most common fields of study among 286 individuals in Milo who have obtained a bachelor's degree or higher.
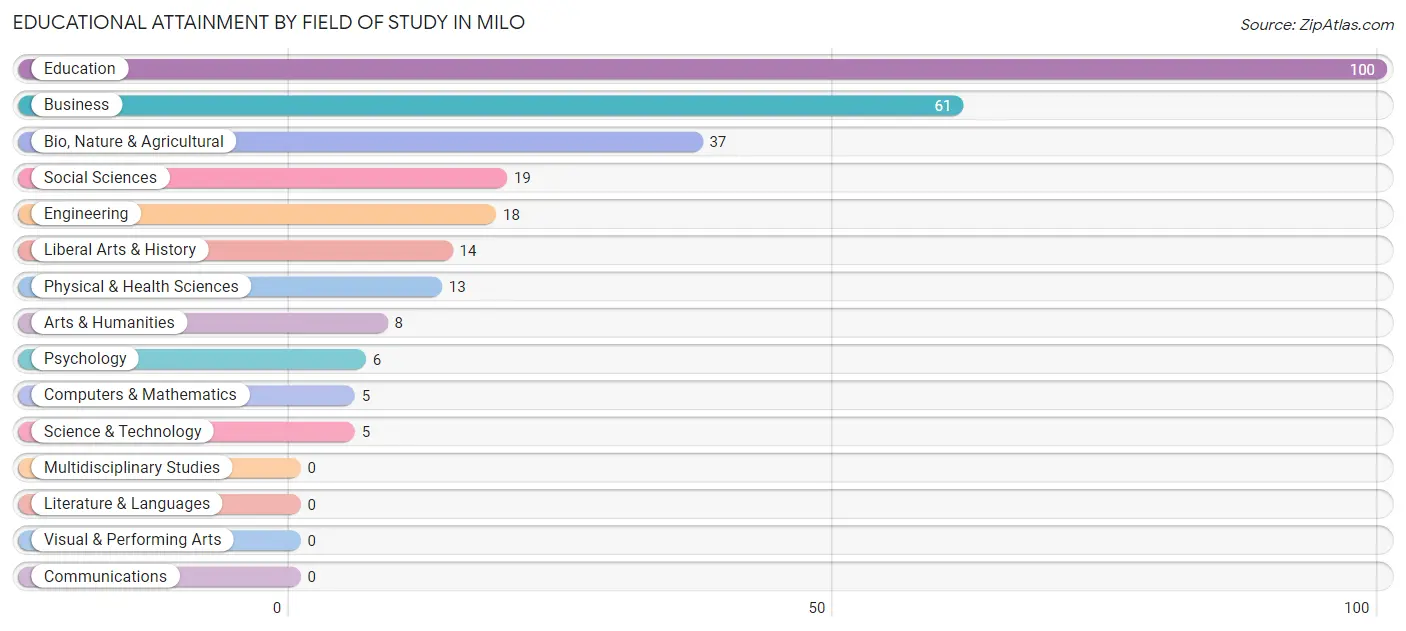
| Field of Study | # Graduates | % Graduates |
| Computers & Mathematics | 5 | 1.8% |
| Bio, Nature & Agricultural | 37 | 12.9% |
| Physical & Health Sciences | 13 | 4.5% |
| Psychology | 6 | 2.1% |
| Social Sciences | 19 | 6.6% |
| Engineering | 18 | 6.3% |
| Multidisciplinary Studies | 0 | 0.0% |
| Science & Technology | 5 | 1.8% |
| Business | 61 | 21.3% |
| Education | 100 | 35.0% |
| Literature & Languages | 0 | 0.0% |
| Liberal Arts & History | 14 | 4.9% |
| Visual & Performing Arts | 0 | 0.0% |
| Communications | 0 | 0.0% |
| Arts & Humanities | 8 | 2.8% |
| Total | 286 | 100.0% |
Transportation & Commute in Milo
Vehicle Availability by Sex in Milo
The most prevalent vehicle ownership categories in Milo are males with 2 vehicles (157, accounting for 58.8%) and females with 2 vehicles (102, making up 65.4%).
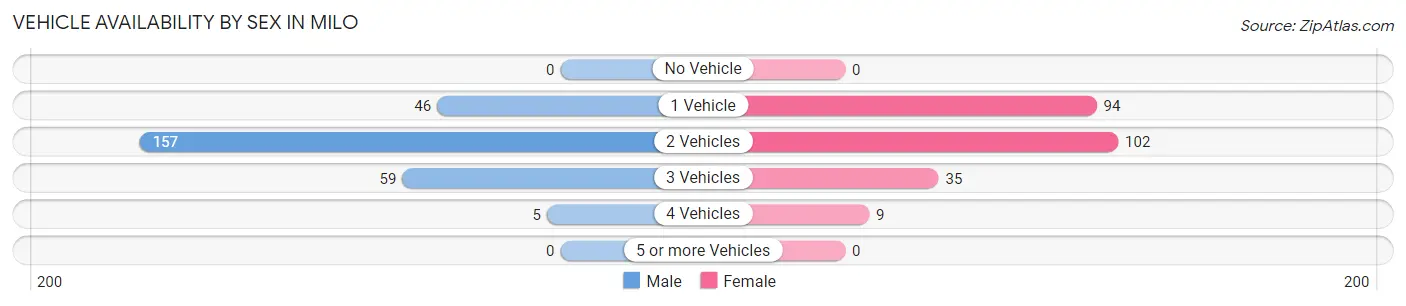
| Vehicles Available | Male | Female |
| No Vehicle | 0 (0.0%) | 0 (0.0%) |
| 1 Vehicle | 46 (17.2%) | 94 (39.2%) |
| 2 Vehicles | 157 (58.8%) | 102 (42.5%) |
| 3 Vehicles | 59 (22.1%) | 35 (14.6%) |
| 4 Vehicles | 5 (1.9%) | 9 (3.7%) |
| 5 or more Vehicles | 0 (0.0%) | 0 (0.0%) |
| Total | 267 (100.0%) | 240 (100.0%) |
Commute Time in Milo
The most frequently occuring commute durations in Milo are 45 to 59 minutes (126 commuters, 28.1%), less than 5 minutes (59 commuters, 13.1%), and 5 to 9 minutes (52 commuters, 11.6%).
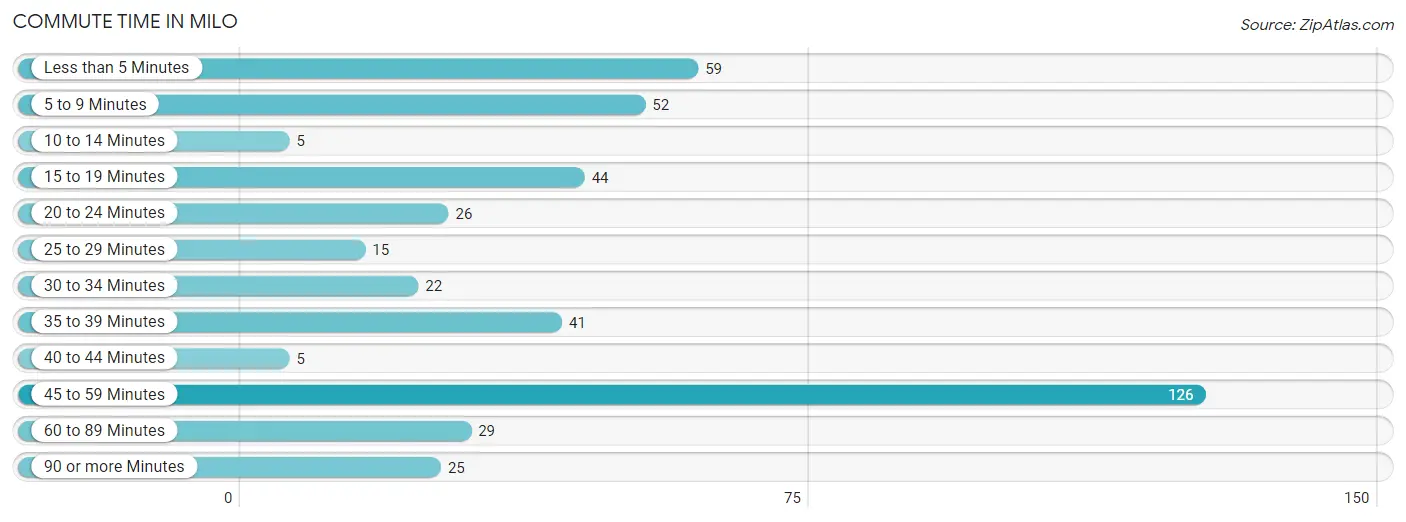
| Commute Time | # Commuters | % Commuters |
| Less than 5 Minutes | 59 | 13.1% |
| 5 to 9 Minutes | 52 | 11.6% |
| 10 to 14 Minutes | 5 | 1.1% |
| 15 to 19 Minutes | 44 | 9.8% |
| 20 to 24 Minutes | 26 | 5.8% |
| 25 to 29 Minutes | 15 | 3.3% |
| 30 to 34 Minutes | 22 | 4.9% |
| 35 to 39 Minutes | 41 | 9.1% |
| 40 to 44 Minutes | 5 | 1.1% |
| 45 to 59 Minutes | 126 | 28.1% |
| 60 to 89 Minutes | 29 | 6.5% |
| 90 or more Minutes | 25 | 5.6% |
Commute Time by Sex in Milo
The most common commute times in Milo are 45 to 59 minutes (69 commuters, 31.5%) for males and 45 to 59 minutes (57 commuters, 24.8%) for females.
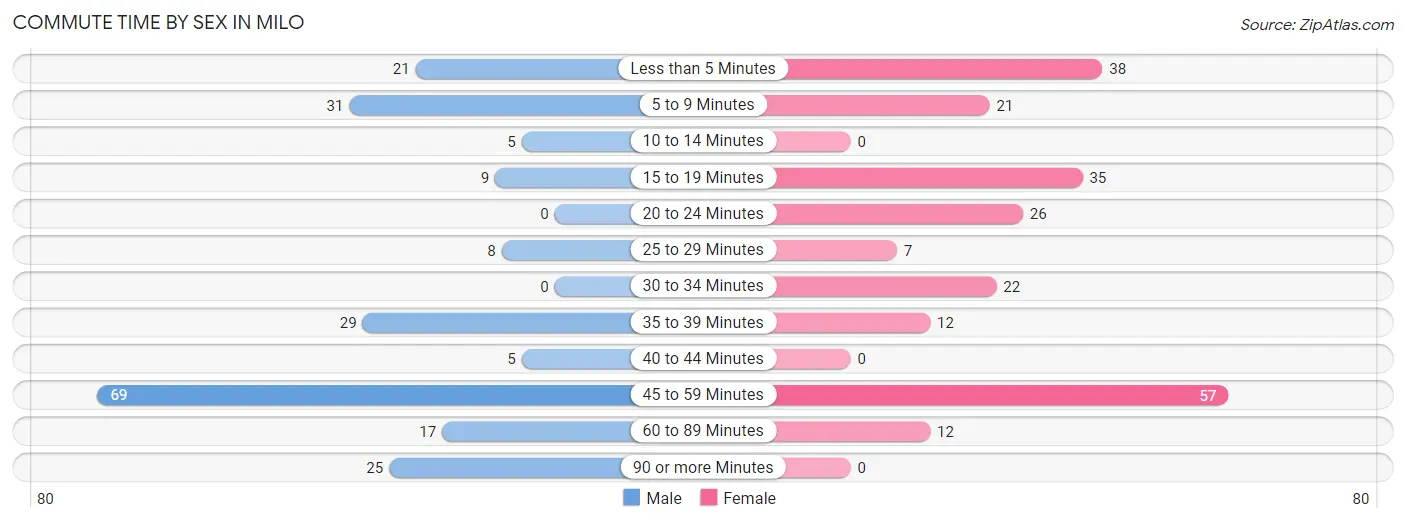
| Commute Time | Male | Female |
| Less than 5 Minutes | 21 (9.6%) | 38 (16.5%) |
| 5 to 9 Minutes | 31 (14.2%) | 21 (9.1%) |
| 10 to 14 Minutes | 5 (2.3%) | 0 (0.0%) |
| 15 to 19 Minutes | 9 (4.1%) | 35 (15.2%) |
| 20 to 24 Minutes | 0 (0.0%) | 26 (11.3%) |
| 25 to 29 Minutes | 8 (3.6%) | 7 (3.0%) |
| 30 to 34 Minutes | 0 (0.0%) | 22 (9.6%) |
| 35 to 39 Minutes | 29 (13.2%) | 12 (5.2%) |
| 40 to 44 Minutes | 5 (2.3%) | 0 (0.0%) |
| 45 to 59 Minutes | 69 (31.5%) | 57 (24.8%) |
| 60 to 89 Minutes | 17 (7.8%) | 12 (5.2%) |
| 90 or more Minutes | 25 (11.4%) | 0 (0.0%) |
Time of Departure to Work by Sex in Milo
The most frequent times of departure to work in Milo are 12:00 PM to 3:59 PM (52, 23.7%) for males and 7:00 AM to 7:29 AM (49, 21.3%) for females.
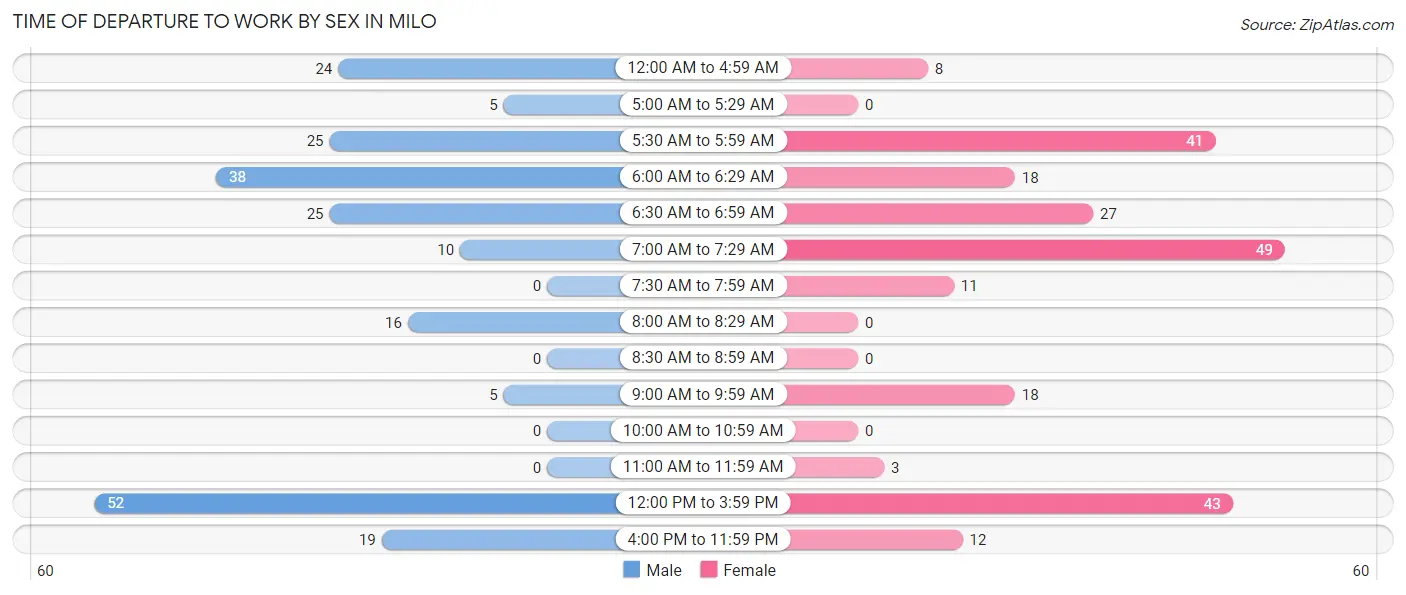
| Time of Departure | Male | Female |
| 12:00 AM to 4:59 AM | 24 (11.0%) | 8 (3.5%) |
| 5:00 AM to 5:29 AM | 5 (2.3%) | 0 (0.0%) |
| 5:30 AM to 5:59 AM | 25 (11.4%) | 41 (17.8%) |
| 6:00 AM to 6:29 AM | 38 (17.3%) | 18 (7.8%) |
| 6:30 AM to 6:59 AM | 25 (11.4%) | 27 (11.7%) |
| 7:00 AM to 7:29 AM | 10 (4.6%) | 49 (21.3%) |
| 7:30 AM to 7:59 AM | 0 (0.0%) | 11 (4.8%) |
| 8:00 AM to 8:29 AM | 16 (7.3%) | 0 (0.0%) |
| 8:30 AM to 8:59 AM | 0 (0.0%) | 0 (0.0%) |
| 9:00 AM to 9:59 AM | 5 (2.3%) | 18 (7.8%) |
| 10:00 AM to 10:59 AM | 0 (0.0%) | 0 (0.0%) |
| 11:00 AM to 11:59 AM | 0 (0.0%) | 3 (1.3%) |
| 12:00 PM to 3:59 PM | 52 (23.7%) | 43 (18.7%) |
| 4:00 PM to 11:59 PM | 19 (8.7%) | 12 (5.2%) |
| Total | 219 (100.0%) | 230 (100.0%) |
Housing Occupancy in Milo
Occupancy by Ownership in Milo
Of the total 677 dwellings in Milo, owner-occupied units account for 520 (76.8%), while renter-occupied units make up 157 (23.2%).
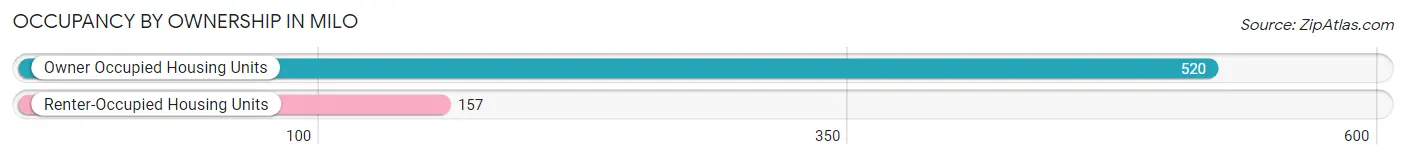
| Occupancy | # Housing Units | % Housing Units |
| Owner Occupied Housing Units | 520 | 76.8% |
| Renter-Occupied Housing Units | 157 | 23.2% |
| Total Occupied Housing Units | 677 | 100.0% |
Occupancy by Household Size in Milo
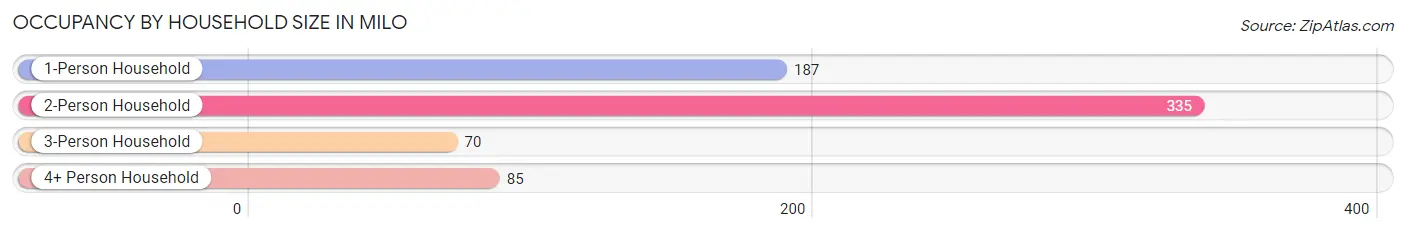
| Household Size | # Housing Units | % Housing Units |
| 1-Person Household | 187 | 27.6% |
| 2-Person Household | 335 | 49.5% |
| 3-Person Household | 70 | 10.3% |
| 4+ Person Household | 85 | 12.6% |
| Total Housing Units | 677 | 100.0% |
Occupancy by Ownership by Household Size in Milo
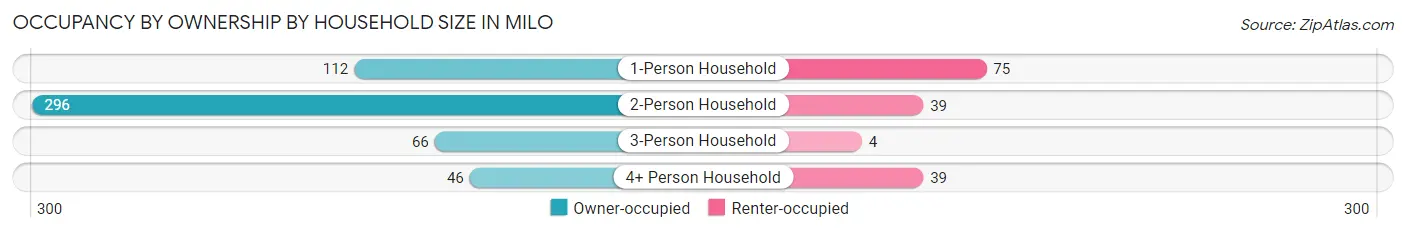
| Household Size | Owner-occupied | Renter-occupied |
| 1-Person Household | 112 (59.9%) | 75 (40.1%) |
| 2-Person Household | 296 (88.4%) | 39 (11.6%) |
| 3-Person Household | 66 (94.3%) | 4 (5.7%) |
| 4+ Person Household | 46 (54.1%) | 39 (45.9%) |
| Total Housing Units | 520 (76.8%) | 157 (23.2%) |
Occupancy by Educational Attainment in Milo
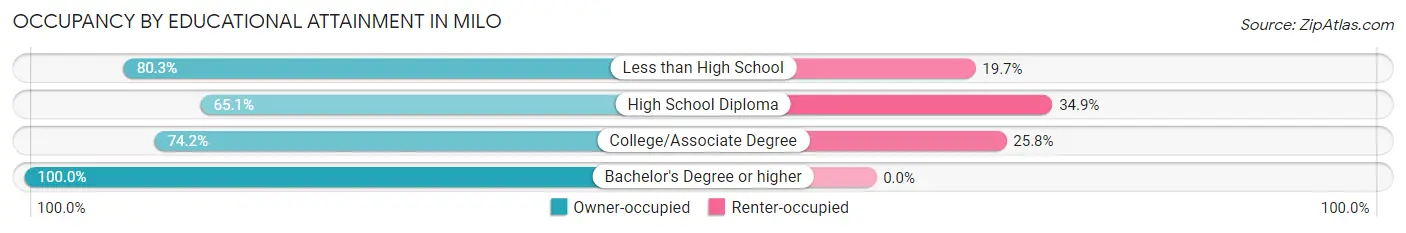
| Household Size | Owner-occupied | Renter-occupied |
| Less than High School | 49 (80.3%) | 12 (19.7%) |
| High School Diploma | 166 (65.1%) | 89 (34.9%) |
| College/Associate Degree | 161 (74.2%) | 56 (25.8%) |
| Bachelor's Degree or higher | 144 (100.0%) | 0 (0.0%) |
Occupancy by Age of Householder in Milo
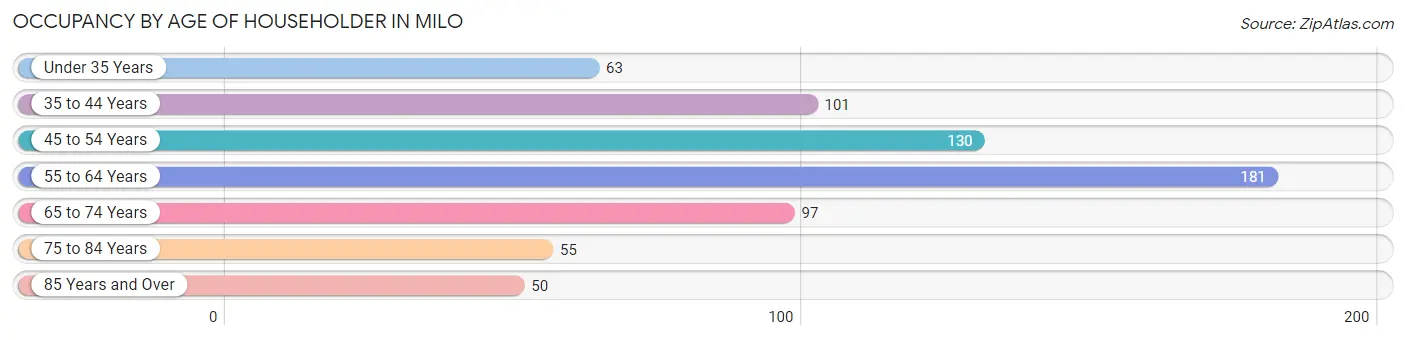
| Age Bracket | # Households | % Households |
| Under 35 Years | 63 | 9.3% |
| 35 to 44 Years | 101 | 14.9% |
| 45 to 54 Years | 130 | 19.2% |
| 55 to 64 Years | 181 | 26.7% |
| 65 to 74 Years | 97 | 14.3% |
| 75 to 84 Years | 55 | 8.1% |
| 85 Years and Over | 50 | 7.4% |
| Total | 677 | 100.0% |
Housing Finances in Milo
Median Income by Occupancy in Milo
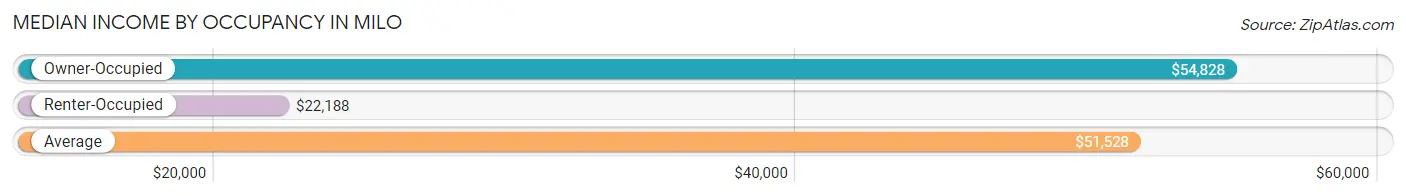
| Occupancy Type | # Households | Median Income |
| Owner-Occupied | 520 (76.8%) | $54,828 |
| Renter-Occupied | 157 (23.2%) | $22,188 |
| Average | 677 (100.0%) | $51,528 |
Occupancy by Householder Income Bracket in Milo
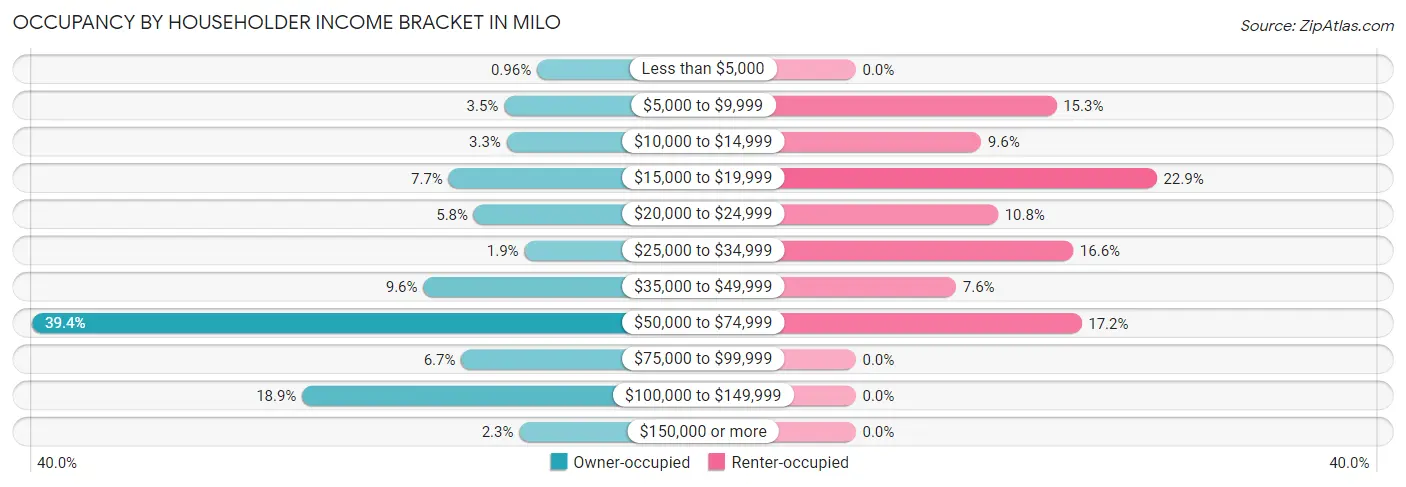
| Income Bracket | Owner-occupied | Renter-occupied |
| Less than $5,000 | 5 (1.0%) | 0 (0.0%) |
| $5,000 to $9,999 | 18 (3.5%) | 24 (15.3%) |
| $10,000 to $14,999 | 17 (3.3%) | 15 (9.6%) |
| $15,000 to $19,999 | 40 (7.7%) | 36 (22.9%) |
| $20,000 to $24,999 | 30 (5.8%) | 17 (10.8%) |
| $25,000 to $34,999 | 10 (1.9%) | 26 (16.6%) |
| $35,000 to $49,999 | 50 (9.6%) | 12 (7.6%) |
| $50,000 to $74,999 | 205 (39.4%) | 27 (17.2%) |
| $75,000 to $99,999 | 35 (6.7%) | 0 (0.0%) |
| $100,000 to $149,999 | 98 (18.9%) | 0 (0.0%) |
| $150,000 or more | 12 (2.3%) | 0 (0.0%) |
| Total | 520 (100.0%) | 157 (100.0%) |
Monthly Housing Cost Tiers in Milo
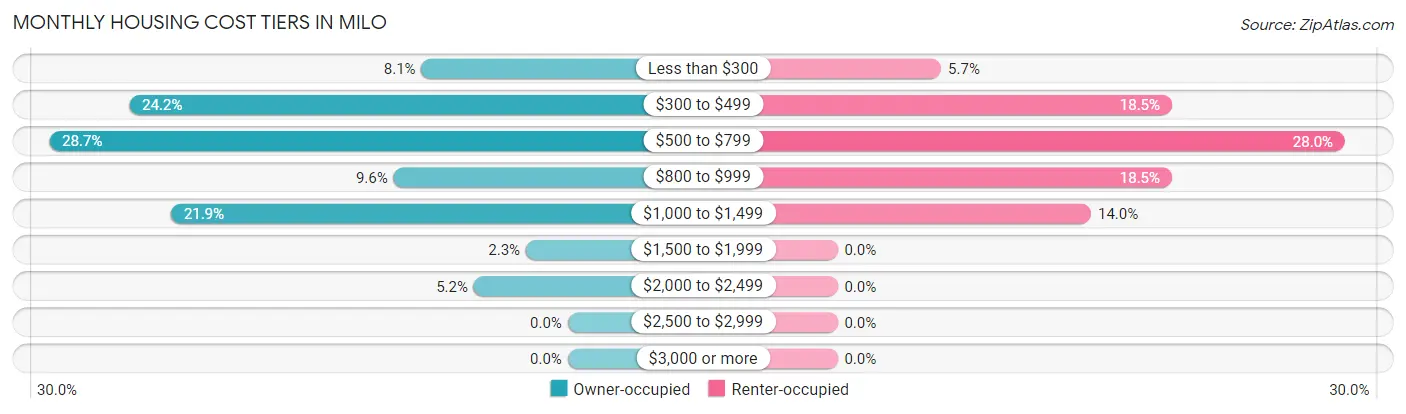
| Monthly Cost | Owner-occupied | Renter-occupied |
| Less than $300 | 42 (8.1%) | 9 (5.7%) |
| $300 to $499 | 126 (24.2%) | 29 (18.5%) |
| $500 to $799 | 149 (28.6%) | 44 (28.0%) |
| $800 to $999 | 50 (9.6%) | 29 (18.5%) |
| $1,000 to $1,499 | 114 (21.9%) | 22 (14.0%) |
| $1,500 to $1,999 | 12 (2.3%) | 0 (0.0%) |
| $2,000 to $2,499 | 27 (5.2%) | 0 (0.0%) |
| $2,500 to $2,999 | 0 (0.0%) | 0 (0.0%) |
| $3,000 or more | 0 (0.0%) | 0 (0.0%) |
| Total | 520 (100.0%) | 157 (100.0%) |
Physical Housing Characteristics in Milo
Housing Structures in Milo
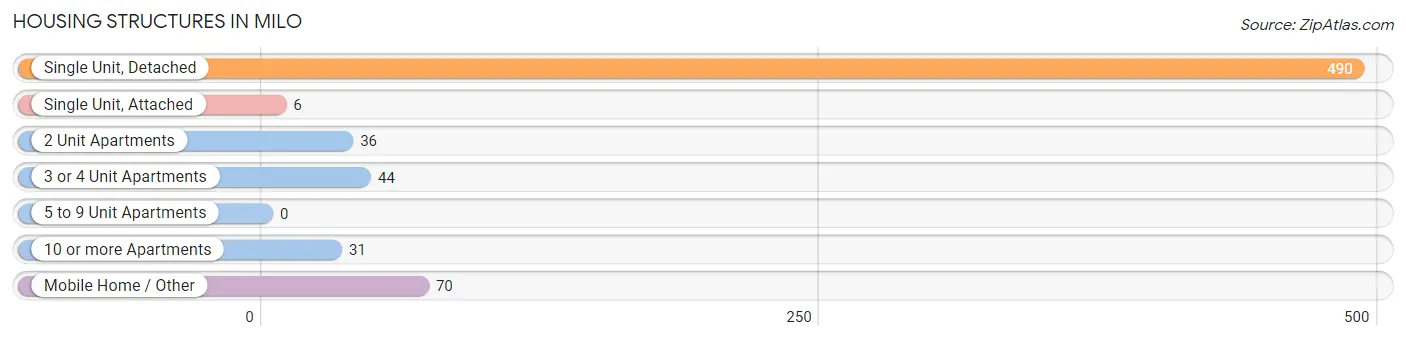
| Structure Type | # Housing Units | % Housing Units |
| Single Unit, Detached | 490 | 72.4% |
| Single Unit, Attached | 6 | 0.9% |
| 2 Unit Apartments | 36 | 5.3% |
| 3 or 4 Unit Apartments | 44 | 6.5% |
| 5 to 9 Unit Apartments | 0 | 0.0% |
| 10 or more Apartments | 31 | 4.6% |
| Mobile Home / Other | 70 | 10.3% |
| Total | 677 | 100.0% |
Housing Structures by Occupancy in Milo
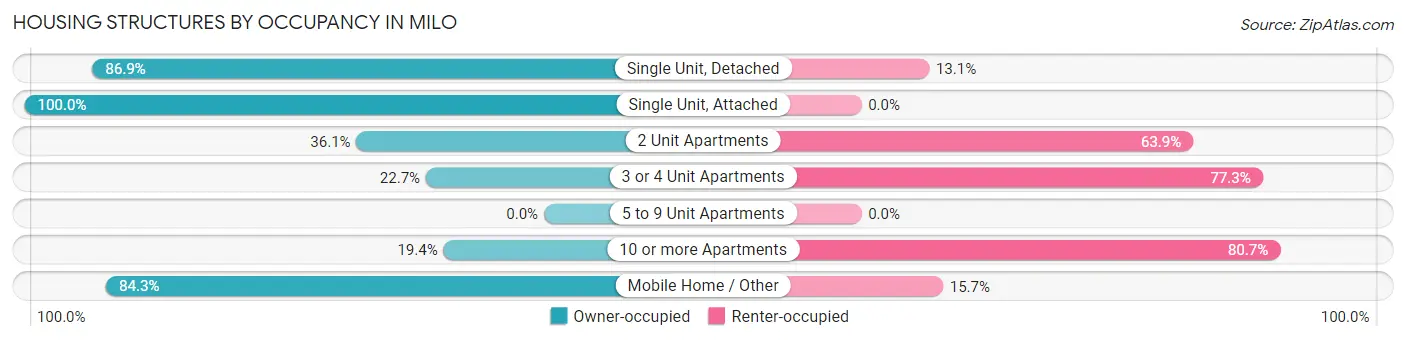
| Structure Type | Owner-occupied | Renter-occupied |
| Single Unit, Detached | 426 (86.9%) | 64 (13.1%) |
| Single Unit, Attached | 6 (100.0%) | 0 (0.0%) |
| 2 Unit Apartments | 13 (36.1%) | 23 (63.9%) |
| 3 or 4 Unit Apartments | 10 (22.7%) | 34 (77.3%) |
| 5 to 9 Unit Apartments | 0 (0.0%) | 0 (0.0%) |
| 10 or more Apartments | 6 (19.4%) | 25 (80.6%) |
| Mobile Home / Other | 59 (84.3%) | 11 (15.7%) |
| Total | 520 (76.8%) | 157 (23.2%) |
Housing Structures by Number of Rooms in Milo
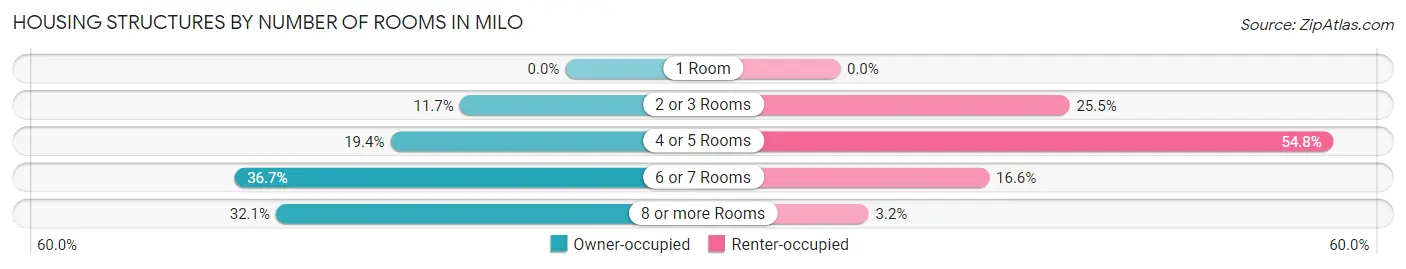
| Number of Rooms | Owner-occupied | Renter-occupied |
| 1 Room | 0 (0.0%) | 0 (0.0%) |
| 2 or 3 Rooms | 61 (11.7%) | 40 (25.5%) |
| 4 or 5 Rooms | 101 (19.4%) | 86 (54.8%) |
| 6 or 7 Rooms | 191 (36.7%) | 26 (16.6%) |
| 8 or more Rooms | 167 (32.1%) | 5 (3.2%) |
| Total | 520 (100.0%) | 157 (100.0%) |
Housing Structure by Heating Type in Milo
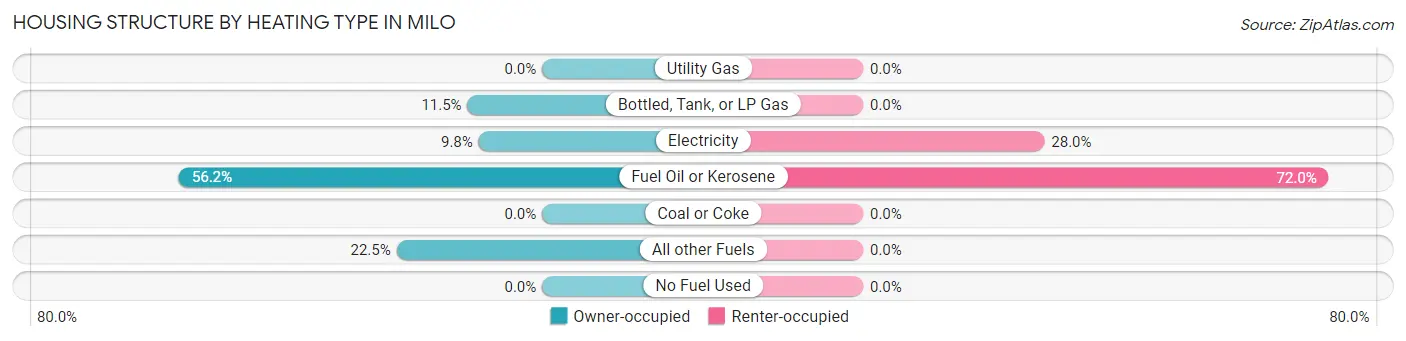
| Heating Type | Owner-occupied | Renter-occupied |
| Utility Gas | 0 (0.0%) | 0 (0.0%) |
| Bottled, Tank, or LP Gas | 60 (11.5%) | 0 (0.0%) |
| Electricity | 51 (9.8%) | 44 (28.0%) |
| Fuel Oil or Kerosene | 292 (56.1%) | 113 (72.0%) |
| Coal or Coke | 0 (0.0%) | 0 (0.0%) |
| All other Fuels | 117 (22.5%) | 0 (0.0%) |
| No Fuel Used | 0 (0.0%) | 0 (0.0%) |
| Total | 520 (100.0%) | 157 (100.0%) |
Household Vehicle Usage in Milo
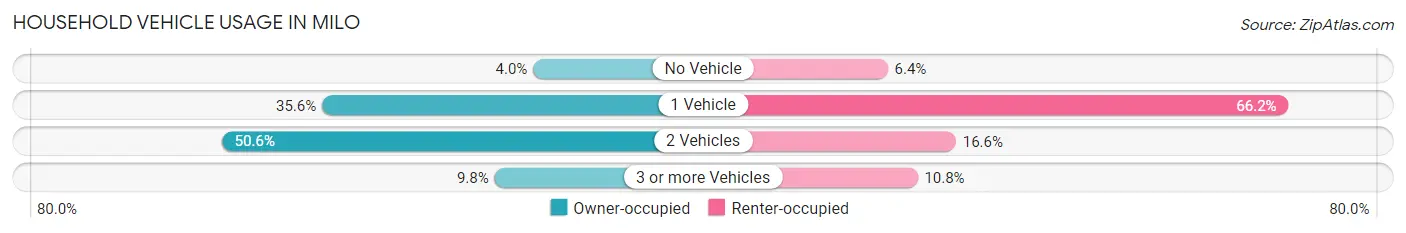
| Vehicles per Household | Owner-occupied | Renter-occupied |
| No Vehicle | 21 (4.0%) | 10 (6.4%) |
| 1 Vehicle | 185 (35.6%) | 104 (66.2%) |
| 2 Vehicles | 263 (50.6%) | 26 (16.6%) |
| 3 or more Vehicles | 51 (9.8%) | 17 (10.8%) |
| Total | 520 (100.0%) | 157 (100.0%) |
Real Estate & Mortgages in Milo
Real Estate and Mortgage Overview in Milo
| Characteristic | Without Mortgage | With Mortgage |
| Housing Units | 313 | 207 |
| Median Property Value | $55,500 | $109,500 |
| Median Household Income | $52,409 | $12 |
| Monthly Housing Costs | $494 | $0 |
| Real Estate Taxes | $1,388 | $0 |
Property Value by Mortgage Status in Milo
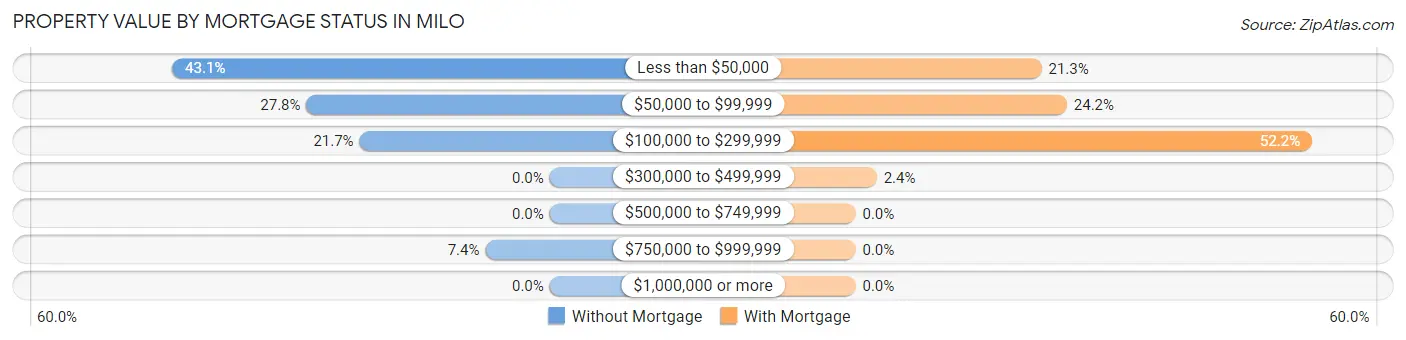
| Property Value | Without Mortgage | With Mortgage |
| Less than $50,000 | 135 (43.1%) | 44 (21.3%) |
| $50,000 to $99,999 | 87 (27.8%) | 50 (24.1%) |
| $100,000 to $299,999 | 68 (21.7%) | 108 (52.2%) |
| $300,000 to $499,999 | 0 (0.0%) | 5 (2.4%) |
| $500,000 to $749,999 | 0 (0.0%) | 0 (0.0%) |
| $750,000 to $999,999 | 23 (7.3%) | 0 (0.0%) |
| $1,000,000 or more | 0 (0.0%) | 0 (0.0%) |
| Total | 313 (100.0%) | 207 (100.0%) |
Household Income by Mortgage Status in Milo
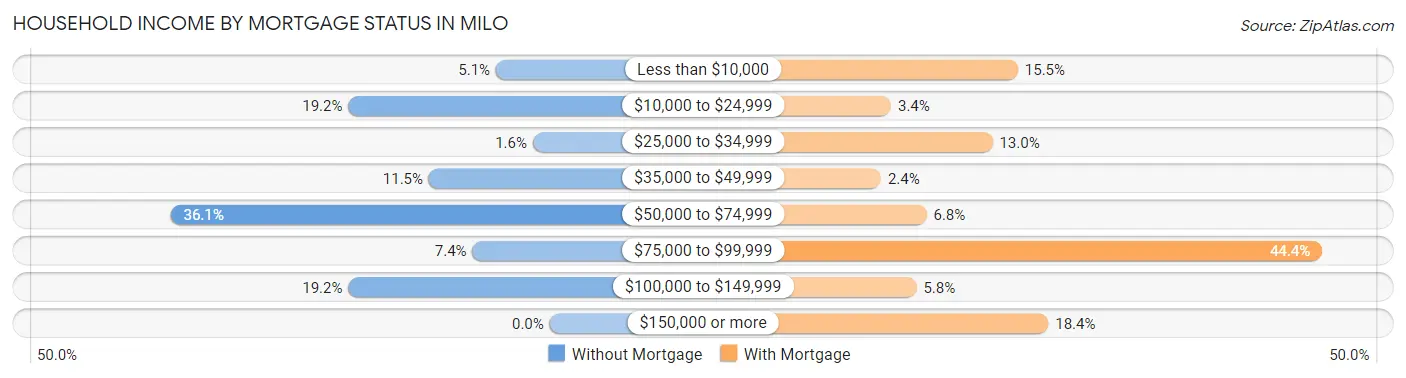
| Household Income | Without Mortgage | With Mortgage |
| Less than $10,000 | 16 (5.1%) | 32 (15.5%) |
| $10,000 to $24,999 | 60 (19.2%) | 7 (3.4%) |
| $25,000 to $34,999 | 5 (1.6%) | 27 (13.0%) |
| $35,000 to $49,999 | 36 (11.5%) | 5 (2.4%) |
| $50,000 to $74,999 | 113 (36.1%) | 14 (6.8%) |
| $75,000 to $99,999 | 23 (7.3%) | 92 (44.4%) |
| $100,000 to $149,999 | 60 (19.2%) | 12 (5.8%) |
| $150,000 or more | 0 (0.0%) | 38 (18.4%) |
| Total | 313 (100.0%) | 207 (100.0%) |
Property Value to Household Income Ratio in Milo
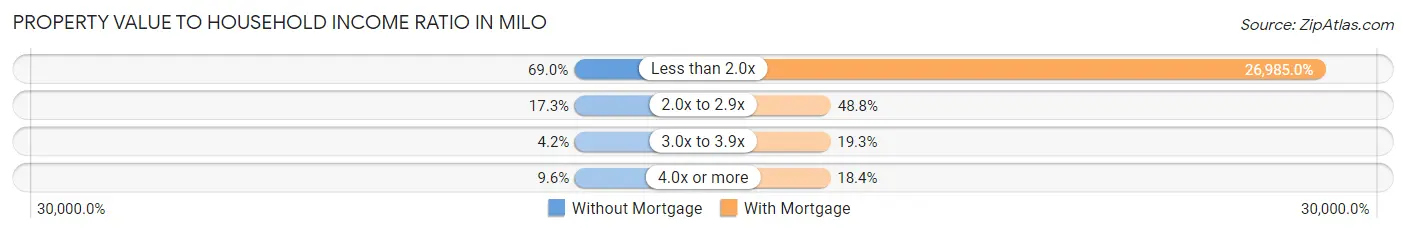
| Value-to-Income Ratio | Without Mortgage | With Mortgage |
| Less than 2.0x | 216 (69.0%) | 55,859 (26,985.0%) |
| 2.0x to 2.9x | 54 (17.2%) | 101 (48.8%) |
| 3.0x to 3.9x | 13 (4.2%) | 40 (19.3%) |
| 4.0x or more | 30 (9.6%) | 38 (18.4%) |
| Total | 313 (100.0%) | 207 (100.0%) |
Real Estate Taxes by Mortgage Status in Milo
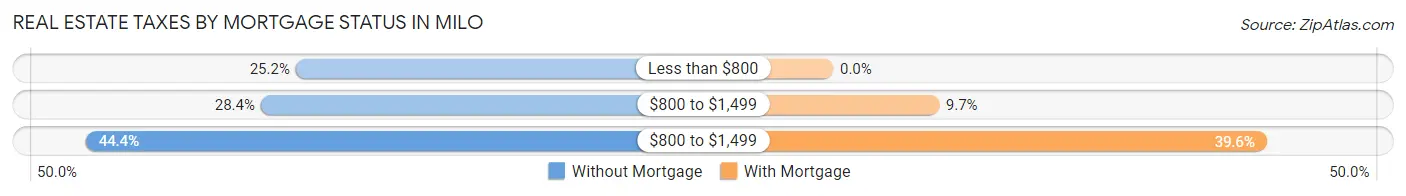
| Property Taxes | Without Mortgage | With Mortgage |
| Less than $800 | 79 (25.2%) | 0 (0.0%) |
| $800 to $1,499 | 89 (28.4%) | 20 (9.7%) |
| $800 to $1,499 | 139 (44.4%) | 82 (39.6%) |
| Total | 313 (100.0%) | 207 (100.0%) |
Health & Disability in Milo
Health Insurance Coverage by Age in Milo
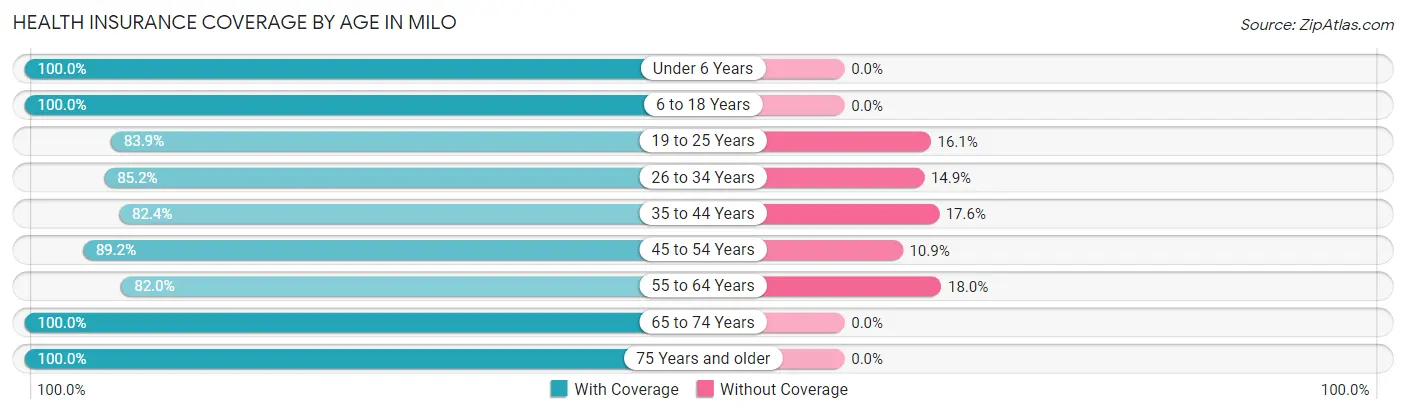
| Age Bracket | With Coverage | Without Coverage |
| Under 6 Years | 42 (100.0%) | 0 (0.0%) |
| 6 to 18 Years | 177 (100.0%) | 0 (0.0%) |
| 19 to 25 Years | 73 (83.9%) | 14 (16.1%) |
| 26 to 34 Years | 86 (85.2%) | 15 (14.8%) |
| 35 to 44 Years | 131 (82.4%) | 28 (17.6%) |
| 45 to 54 Years | 189 (89.1%) | 23 (10.8%) |
| 55 to 64 Years | 268 (82.0%) | 59 (18.0%) |
| 65 to 74 Years | 155 (100.0%) | 0 (0.0%) |
| 75 Years and older | 149 (100.0%) | 0 (0.0%) |
| Total | 1,270 (90.1%) | 139 (9.9%) |
Health Insurance Coverage by Citizenship Status in Milo
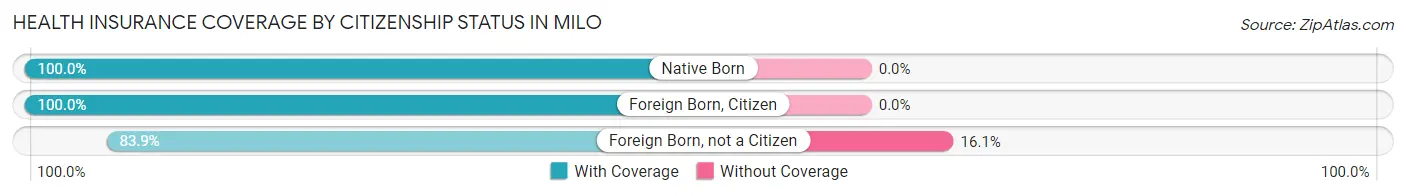
| Citizenship Status | With Coverage | Without Coverage |
| Native Born | 42 (100.0%) | 0 (0.0%) |
| Foreign Born, Citizen | 177 (100.0%) | 0 (0.0%) |
| Foreign Born, not a Citizen | 73 (83.9%) | 14 (16.1%) |
Health Insurance Coverage by Household Income in Milo
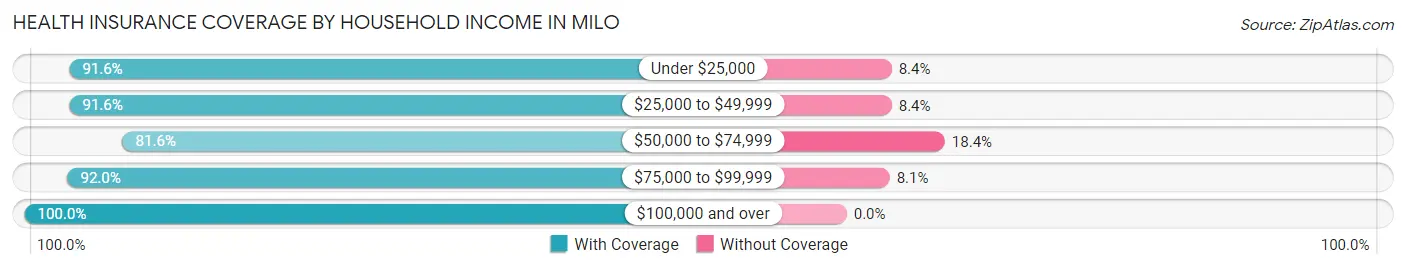
| Household Income | With Coverage | Without Coverage |
| Under $25,000 | 283 (91.6%) | 26 (8.4%) |
| $25,000 to $49,999 | 239 (91.6%) | 22 (8.4%) |
| $50,000 to $74,999 | 373 (81.6%) | 84 (18.4%) |
| $75,000 to $99,999 | 80 (91.9%) | 7 (8.1%) |
| $100,000 and over | 295 (100.0%) | 0 (0.0%) |
Public vs Private Health Insurance Coverage by Age in Milo
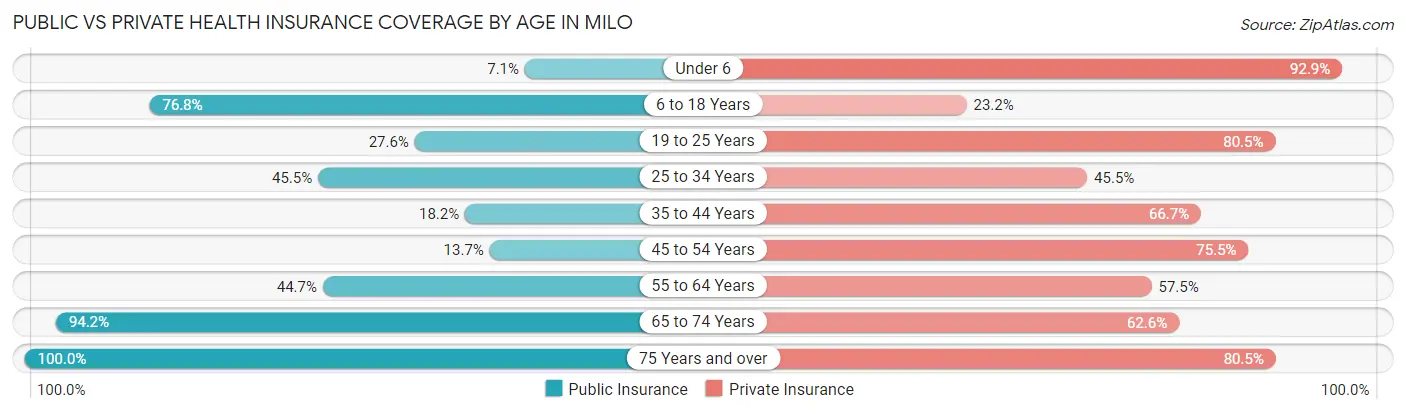
| Age Bracket | Public Insurance | Private Insurance |
| Under 6 | 3 (7.1%) | 39 (92.9%) |
| 6 to 18 Years | 136 (76.8%) | 41 (23.2%) |
| 19 to 25 Years | 24 (27.6%) | 70 (80.5%) |
| 25 to 34 Years | 46 (45.5%) | 46 (45.5%) |
| 35 to 44 Years | 29 (18.2%) | 106 (66.7%) |
| 45 to 54 Years | 29 (13.7%) | 160 (75.5%) |
| 55 to 64 Years | 146 (44.7%) | 188 (57.5%) |
| 65 to 74 Years | 146 (94.2%) | 97 (62.6%) |
| 75 Years and over | 149 (100.0%) | 120 (80.5%) |
| Total | 708 (50.2%) | 867 (61.5%) |
Disability Status by Sex by Age in Milo
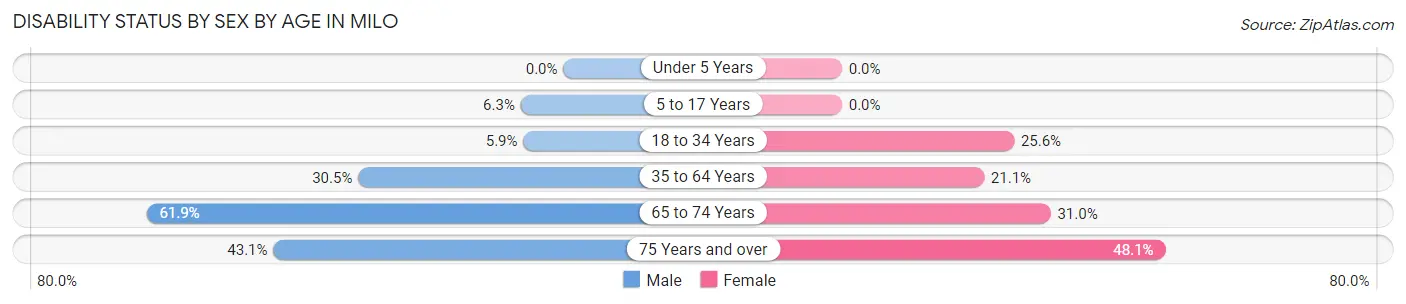
| Age Bracket | Male | Female |
| Under 5 Years | 0 (0.0%) | 0 (0.0%) |
| 5 to 17 Years | 5 (6.3%) | 0 (0.0%) |
| 18 to 34 Years | 6 (5.9%) | 23 (25.6%) |
| 35 to 64 Years | 113 (30.5%) | 69 (21.1%) |
| 65 to 74 Years | 52 (61.9%) | 22 (31.0%) |
| 75 Years and over | 31 (43.1%) | 37 (48.0%) |
Disability Class by Sex by Age in Milo
Disability Class: Hearing Difficulty
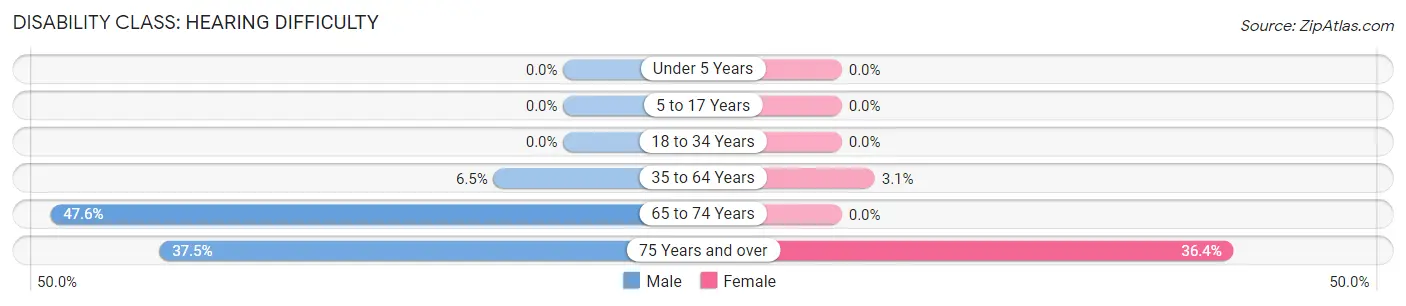
| Age Bracket | Male | Female |
| Under 5 Years | 0 (0.0%) | 0 (0.0%) |
| 5 to 17 Years | 0 (0.0%) | 0 (0.0%) |
| 18 to 34 Years | 0 (0.0%) | 0 (0.0%) |
| 35 to 64 Years | 24 (6.5%) | 10 (3.1%) |
| 65 to 74 Years | 40 (47.6%) | 0 (0.0%) |
| 75 Years and over | 27 (37.5%) | 28 (36.4%) |
Disability Class: Vision Difficulty
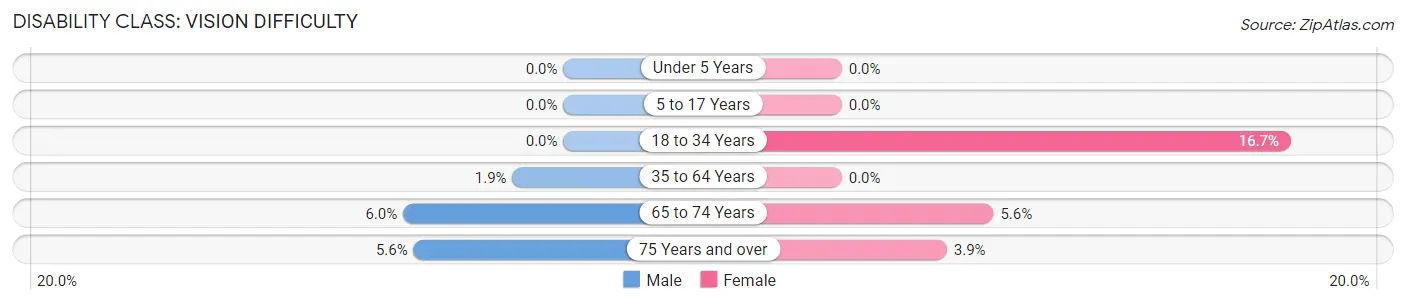
| Age Bracket | Male | Female |
| Under 5 Years | 0 (0.0%) | 0 (0.0%) |
| 5 to 17 Years | 0 (0.0%) | 0 (0.0%) |
| 18 to 34 Years | 0 (0.0%) | 15 (16.7%) |
| 35 to 64 Years | 7 (1.9%) | 0 (0.0%) |
| 65 to 74 Years | 5 (5.9%) | 4 (5.6%) |
| 75 Years and over | 4 (5.6%) | 3 (3.9%) |
Disability Class: Cognitive Difficulty
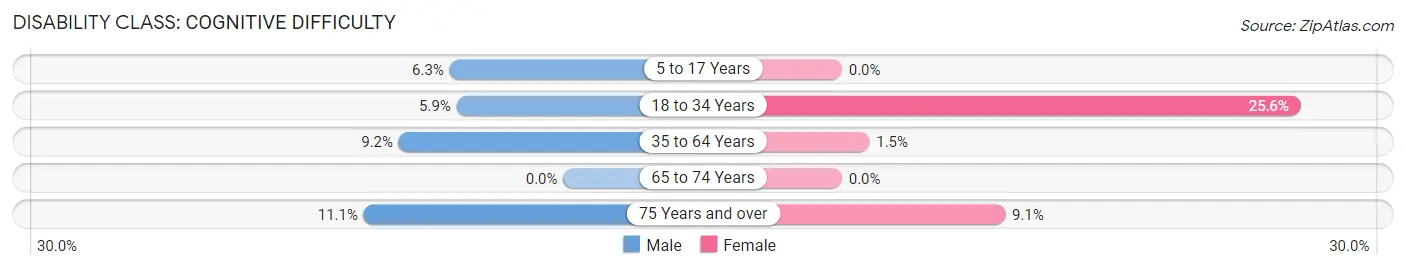
| Age Bracket | Male | Female |
| 5 to 17 Years | 5 (6.3%) | 0 (0.0%) |
| 18 to 34 Years | 6 (5.9%) | 23 (25.6%) |
| 35 to 64 Years | 34 (9.2%) | 5 (1.5%) |
| 65 to 74 Years | 0 (0.0%) | 0 (0.0%) |
| 75 Years and over | 8 (11.1%) | 7 (9.1%) |
Disability Class: Ambulatory Difficulty
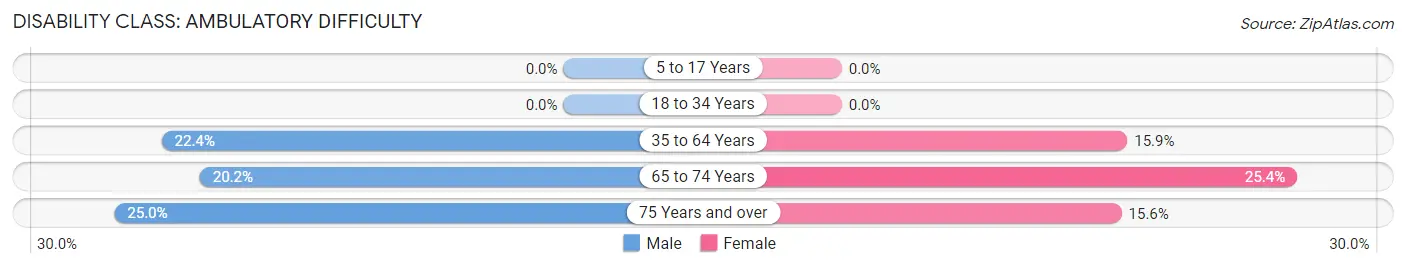
| Age Bracket | Male | Female |
| 5 to 17 Years | 0 (0.0%) | 0 (0.0%) |
| 18 to 34 Years | 0 (0.0%) | 0 (0.0%) |
| 35 to 64 Years | 83 (22.4%) | 52 (15.9%) |
| 65 to 74 Years | 17 (20.2%) | 18 (25.4%) |
| 75 Years and over | 18 (25.0%) | 12 (15.6%) |
Disability Class: Self-Care Difficulty
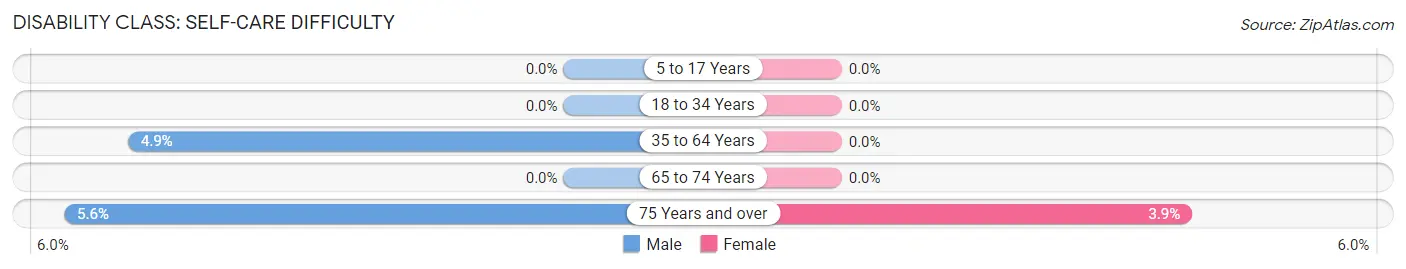
| Age Bracket | Male | Female |
| 5 to 17 Years | 0 (0.0%) | 0 (0.0%) |
| 18 to 34 Years | 0 (0.0%) | 0 (0.0%) |
| 35 to 64 Years | 18 (4.9%) | 0 (0.0%) |
| 65 to 74 Years | 0 (0.0%) | 0 (0.0%) |
| 75 Years and over | 4 (5.6%) | 3 (3.9%) |
Technology Access in Milo
Computing Device Access in Milo
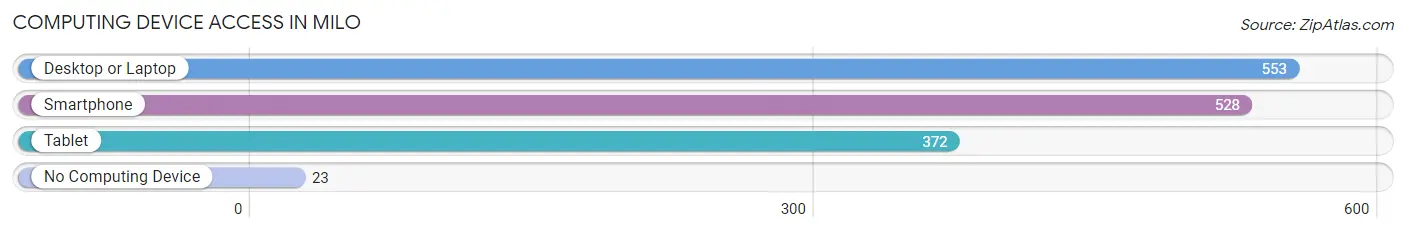
| Device Type | # Households | % Households |
| Desktop or Laptop | 553 | 81.7% |
| Smartphone | 528 | 78.0% |
| Tablet | 372 | 54.9% |
| No Computing Device | 23 | 3.4% |
| Total | 677 | 100.0% |
Internet Access in Milo
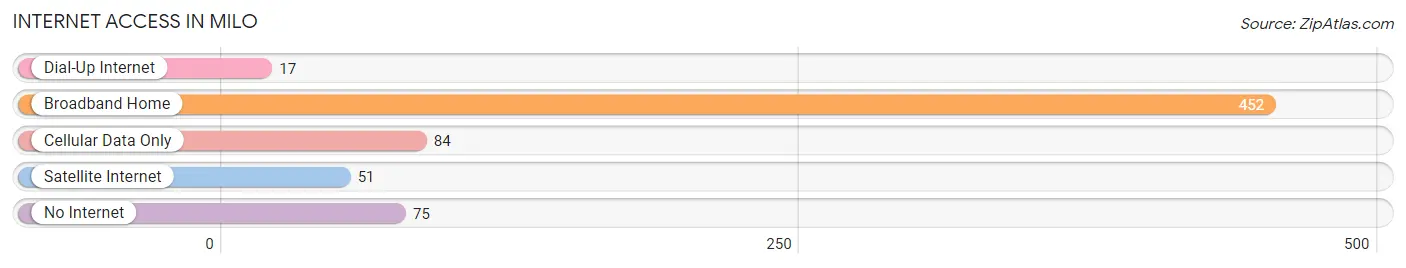
| Internet Type | # Households | % Households |
| Dial-Up Internet | 17 | 2.5% |
| Broadband Home | 452 | 66.8% |
| Cellular Data Only | 84 | 12.4% |
| Satellite Internet | 51 | 7.5% |
| No Internet | 75 | 11.1% |
| Total | 677 | 100.0% |
Milo Summary
Milo is a town located in Piscataquis County, Maine, United States. The population was 2,345 at the 2010 census. It is part of the Bangor, Maine metropolitan statistical area.
Geography
Milo is located at 44°37′N 69°2′W (44.619, -69.033). According to the United States Census Bureau, the town has a total area of 35.2sqmi, of which, 34.7sqmi of it is land and 0.5sqmi of it (1.37%) is water.
History
Milo was first settled in 1812 by settlers from Massachusetts. It was incorporated as a town on March 6, 1820. The town was named after Milo, the son of Hercules in Greek mythology.
The town was originally a farming community, but in the late 19th century, it became a center for the lumber industry. The town was also home to several granite quarries, which provided stone for many of the buildings in the area.
Economy
Milo is a rural town with a population of 2,345 people. The town is home to several small businesses, including a lumber mill, a granite quarry, and a few small retail stores. The town also has a few restaurants and a few small manufacturing businesses.
The town is also home to a few small farms, which produce a variety of crops, including potatoes, corn, and hay. The town also has a few small apple orchards, which produce apples for local consumption.
Demographics
As of the census of 2010, there were 2,345 people, 945 households, and 645 families residing in the town. The population density was 67.3 people per square mile (25.9/km2). There were 1,039 housing units at an average density of 29.9 per square mile (11.6/km2). The racial makeup of the town was 97.2% White, 0.3% African American, 0.3% Native American, 0.2% Asian, 0.1% Pacific Islander, 0.3% from other races, and 1.6% from two or more races. Hispanic or Latino of any race were 0.9% of the population.
There were 945 households, out of which 28.2% had children under the age of 18 living with them, 51.2% were married couples living together, 10.7% had a female householder with no husband present, and 33.2% were non-families. 28.2% of all households were made up of individuals, and 13.2% had someone living alone who was 65 years of age or older. The average household size was 2.41 and the average family size was 2.91.
In the town, the population was spread out, with 23.2% under the age of 18, 6.7% from 18 to 24, 25.2% from 25 to 44, 28.2% from 45 to 64, and 16.7% who were 65 years of age or older. The median age was 41 years. For every 100 females, there were 95.2 males. For every 100 females age 18 and over, there were 92.2 males.
The median income for a household in the town was $30,938, and the median income for a family was $37,917. Males had a median income of $30,000 versus $21,250 for females. The per capita income for the town was $15,945. About 11.2% of families and 14.2% of the population were below the poverty line, including 19.2% of those under age 18 and 10.2% of those age 65 or over.
Common Questions
What is Per Capita Income in Milo?
Per Capita income in Milo is $27,014.
What is the Median Family Income in Milo?
Median Family Income in Milo is $55,491.
What is the Median Household income in Milo?
Median Household Income in Milo is $51,528.
What is Income or Wage Gap in Milo?
Income or Wage Gap in Milo is 21.1%.
Women in Milo earn 78.9 cents for every dollar earned by a man.
What is Inequality or Gini Index in Milo?
Inequality or Gini Index in Milo is 0.38.
What is the Total Population of Milo?
Total Population of Milo is 1,409.
What is the Total Male Population of Milo?
Total Male Population of Milo is 711.
What is the Total Female Population of Milo?
Total Female Population of Milo is 698.
What is the Ratio of Males per 100 Females in Milo?
There are 101.86 Males per 100 Females in Milo.
What is the Ratio of Females per 100 Males in Milo?
There are 98.17 Females per 100 Males in Milo.
What is the Median Population Age in Milo?
Median Population Age in Milo is 52.5 Years.
What is the Average Family Size in Milo
Average Family Size in Milo is 2.4 People.
What is the Average Household Size in Milo
Average Household Size in Milo is 2.1 People.
How Large is the Labor Force in Milo?
There are 524 People in the Labor Forcein in Milo.
What is the Percentage of People in the Labor Force in Milo?
41.7% of People are in the Labor Force in Milo.
What is the Unemployment Rate in Milo?
Unemployment Rate in Milo is 2.1%.