Norridgewock, ME Map & Demographics
Norridgewock Map
Norridgewock Overview
$56,236
PER CAPITA INCOME
$71,786
AVG FAMILY INCOME
$41,944
AVG HOUSEHOLD INCOME
58.5%
WAGE / INCOME GAP [ % ]
41.5¢/ $1
WAGE / INCOME GAP [ $ ]
0.70
INEQUALITY / GINI INDEX
1,099
TOTAL POPULATION
627
MALE POPULATION
472
FEMALE POPULATION
132.84
MALES / 100 FEMALES
75.28
FEMALES / 100 MALES
51.8
MEDIAN AGE
2.6
AVG FAMILY SIZE
2.0
AVG HOUSEHOLD SIZE
574
LABOR FORCE [ PEOPLE ]
58.7%
PERCENT IN LABOR FORCE
Norridgewock Zip Codes
Norridgewock Area Codes
Income in Norridgewock
Income Overview in Norridgewock
Per Capita Income in Norridgewock is $56,236, while median incomes of families and households are $71,786 and $41,944 respectively.
| Characteristic | Number | Measure |
| Per Capita Income | 1,099 | $56,236 |
| Median Family Income | 286 | $71,786 |
| Mean Family Income | 286 | $175,808 |
| Median Household Income | 548 | $41,944 |
| Mean Household Income | 548 | $106,029 |
| Income Deficit | 286 | $0 |
| Wage / Income Gap (%) | 1,099 | 58.54% |
| Wage / Income Gap ($) | 1,099 | 41.46¢ per $1 |
| Gini / Inequality Index | 1,099 | 0.70 |
Earnings by Sex in Norridgewock
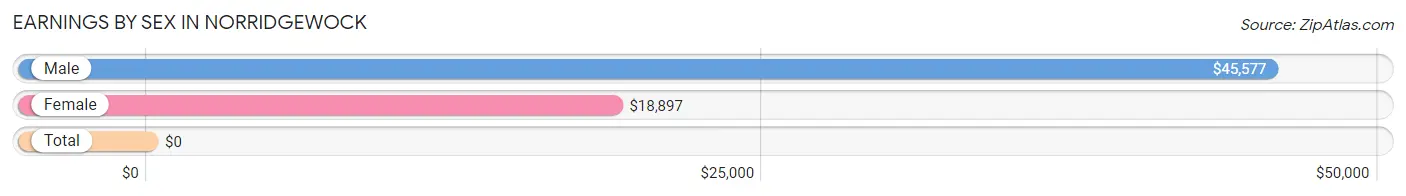
| Sex | Number | Average Earnings |
| Male | 388 (67.6%) | $45,577 |
| Female | 186 (32.4%) | $18,897 |
| Total | 574 (100.0%) | $0 |
Earnings by Sex by Income Bracket in Norridgewock
The most common earnings brackets in Norridgewock are $7,500 to $9,999 for men (124 | 32.0%) and $7,500 to $9,999 for women (36 | 19.4%).
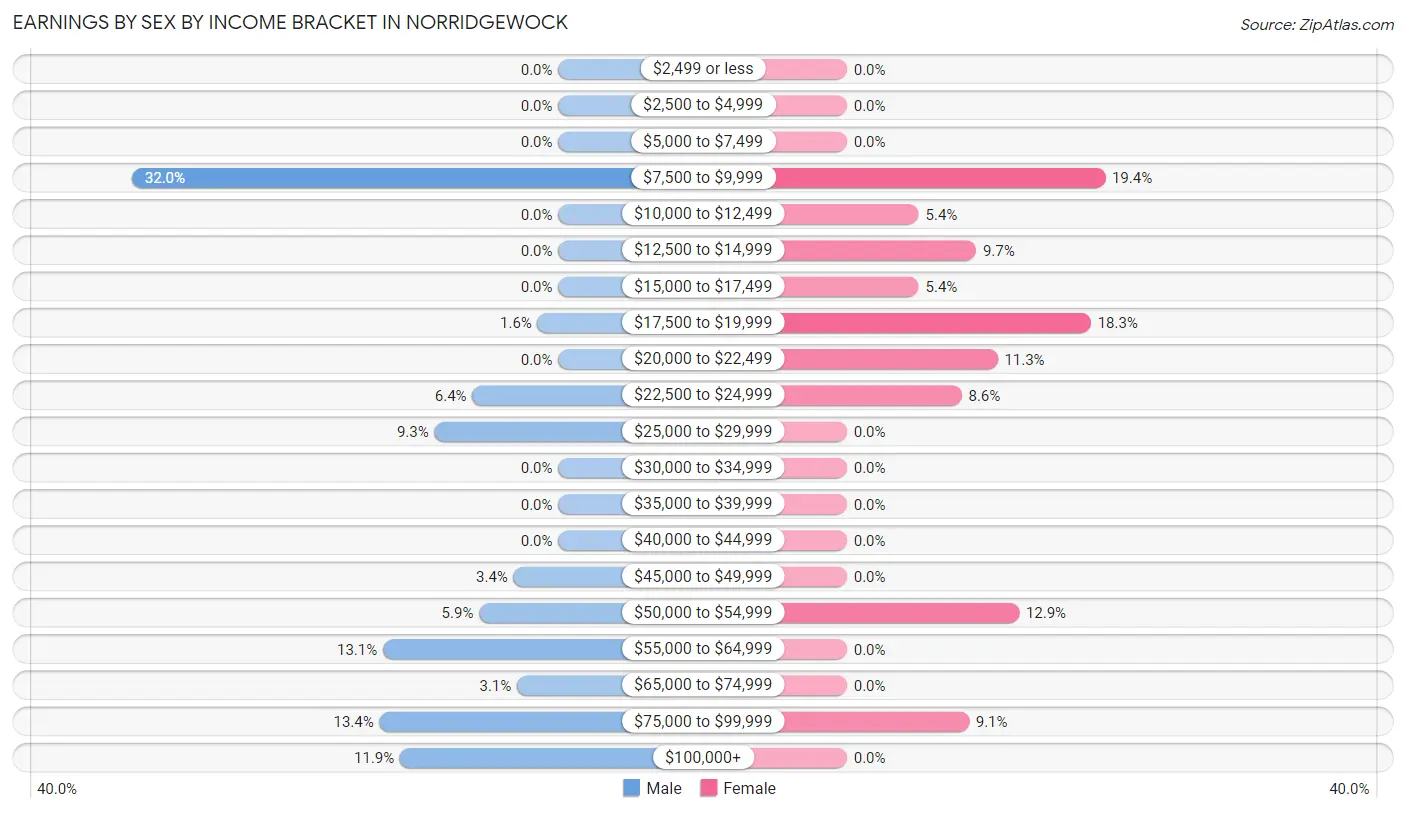
| Income | Male | Female |
| $2,499 or less | 0 (0.0%) | 0 (0.0%) |
| $2,500 to $4,999 | 0 (0.0%) | 0 (0.0%) |
| $5,000 to $7,499 | 0 (0.0%) | 0 (0.0%) |
| $7,500 to $9,999 | 124 (32.0%) | 36 (19.4%) |
| $10,000 to $12,499 | 0 (0.0%) | 10 (5.4%) |
| $12,500 to $14,999 | 0 (0.0%) | 18 (9.7%) |
| $15,000 to $17,499 | 0 (0.0%) | 10 (5.4%) |
| $17,500 to $19,999 | 6 (1.5%) | 34 (18.3%) |
| $20,000 to $22,499 | 0 (0.0%) | 21 (11.3%) |
| $22,500 to $24,999 | 25 (6.4%) | 16 (8.6%) |
| $25,000 to $29,999 | 36 (9.3%) | 0 (0.0%) |
| $30,000 to $34,999 | 0 (0.0%) | 0 (0.0%) |
| $35,000 to $39,999 | 0 (0.0%) | 0 (0.0%) |
| $40,000 to $44,999 | 0 (0.0%) | 0 (0.0%) |
| $45,000 to $49,999 | 13 (3.4%) | 0 (0.0%) |
| $50,000 to $54,999 | 23 (5.9%) | 24 (12.9%) |
| $55,000 to $64,999 | 51 (13.1%) | 0 (0.0%) |
| $65,000 to $74,999 | 12 (3.1%) | 0 (0.0%) |
| $75,000 to $99,999 | 52 (13.4%) | 17 (9.1%) |
| $100,000+ | 46 (11.9%) | 0 (0.0%) |
| Total | 388 (100.0%) | 186 (100.0%) |
Earnings by Sex by Educational Attainment in Norridgewock
Average earnings in Norridgewock are $55,686 for men and $18,897 for women, a difference of 66.1%. Men with an educational attainment of bachelor's degree enjoy the highest average annual earnings of $86,150, while those with college or associate's degree education earn the least with $51,071. Women with an educational attainment of high school diploma earn the most with the average annual earnings of $13,681, while those with high school diploma education have the smallest earnings of $13,681.
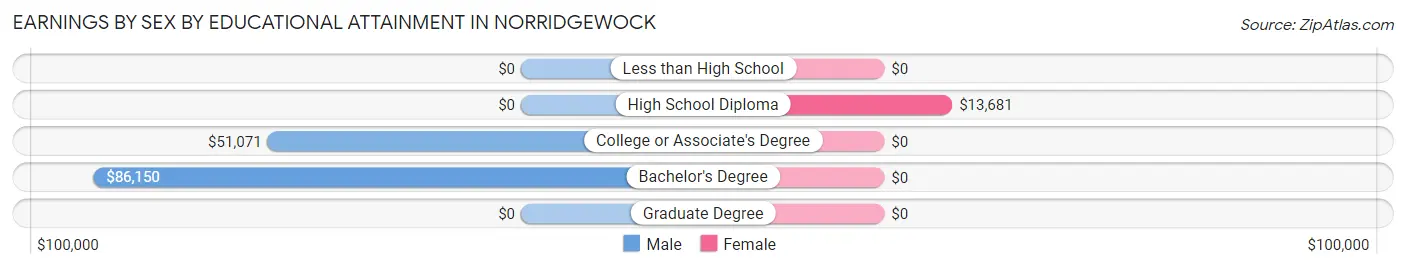
| Educational Attainment | Male Income | Female Income |
| Less than High School | - | - |
| High School Diploma | - | - |
| College or Associate's Degree | $51,071 | $0 |
| Bachelor's Degree | $86,150 | $0 |
| Graduate Degree | - | - |
| Total | $55,686 | $18,897 |
Family Income in Norridgewock
Family Income Brackets in Norridgewock
According to the Norridgewock family income data, there are 103 families falling into the $50,000 to $74,999 income range, which is the most common income bracket and makes up 36.0% of all families.
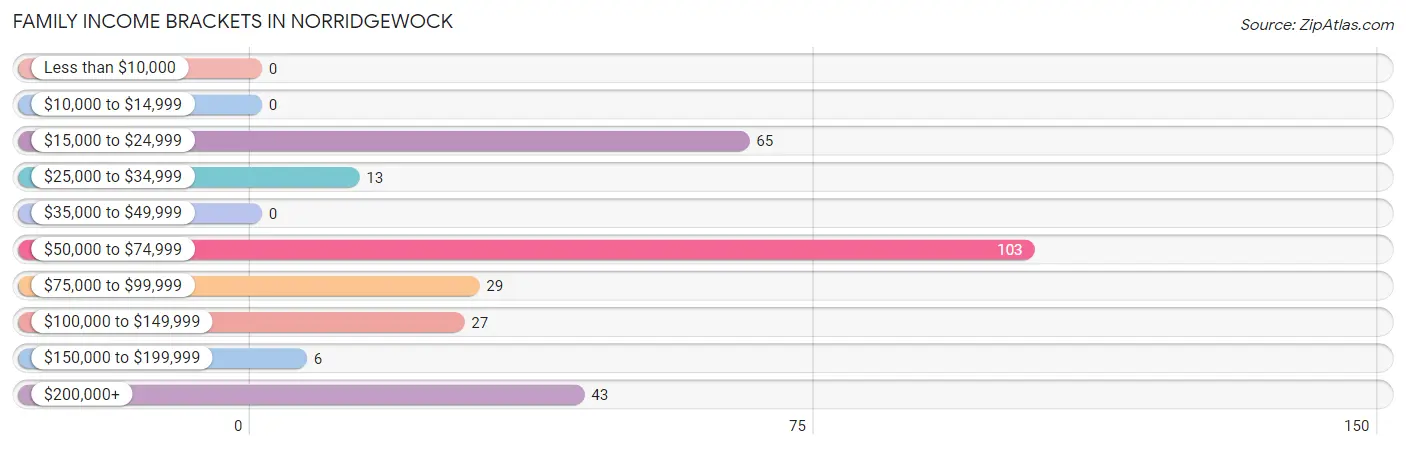
| Income Bracket | # Families | % Families |
| Less than $10,000 | 0 | 0.0% |
| $10,000 to $14,999 | 0 | 0.0% |
| $15,000 to $24,999 | 65 | 22.7% |
| $25,000 to $34,999 | 13 | 4.5% |
| $35,000 to $49,999 | 0 | 0.0% |
| $50,000 to $74,999 | 103 | 36.0% |
| $75,000 to $99,999 | 29 | 10.1% |
| $100,000 to $149,999 | 27 | 9.4% |
| $150,000 to $199,999 | 6 | 2.1% |
| $200,000+ | 43 | 15.0% |
Family Income by Famaliy Size in Norridgewock
3-person families (36 | 12.6%) account for the highest median family income in Norridgewock with $91,071 per family, while 3-person families (36 | 12.6%) have the highest median income of $30,357 per family member.
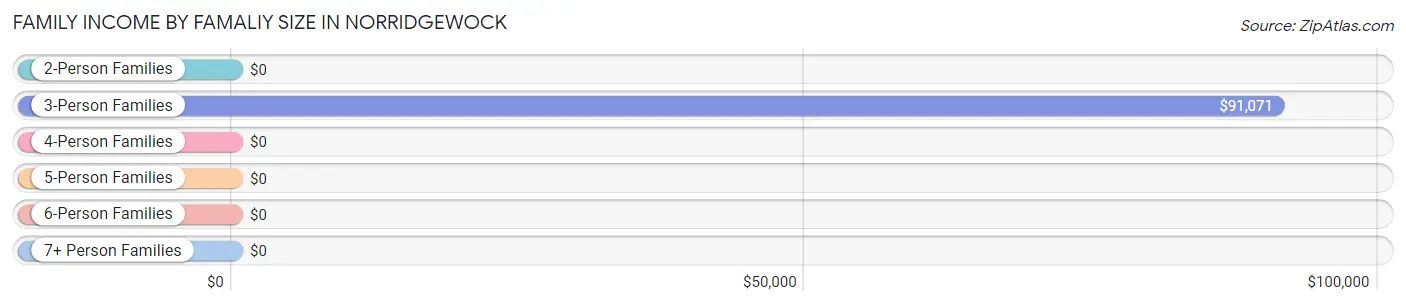
| Income Bracket | # Families | Median Income |
| 2-Person Families | 206 (72.0%) | $0 |
| 3-Person Families | 36 (12.6%) | $91,071 |
| 4-Person Families | 0 (0.0%) | $0 |
| 5-Person Families | 44 (15.4%) | $0 |
| 6-Person Families | 0 (0.0%) | $0 |
| 7+ Person Families | 0 (0.0%) | $0 |
| Total | 286 (100.0%) | $71,786 |
Family Income by Number of Earners in Norridgewock
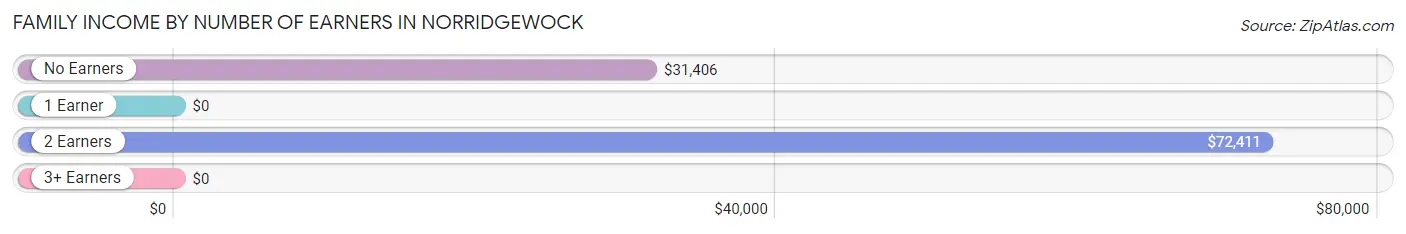
| Number of Earners | # Families | Median Income |
| No Earners | 23 (8.0%) | $31,406 |
| 1 Earner | 68 (23.8%) | $0 |
| 2 Earners | 195 (68.2%) | $72,411 |
| 3+ Earners | 0 (0.0%) | $0 |
| Total | 286 (100.0%) | $71,786 |
Household Income in Norridgewock
Household Income Brackets in Norridgewock
With 122 households falling in the category, the $15,000 to $24,999 income range is the most frequent in Norridgewock, accounting for 22.3% of all households. In contrast, only 6 households (1.1%) fall into the $150,000 to $199,999 income bracket, making it the least populous group.
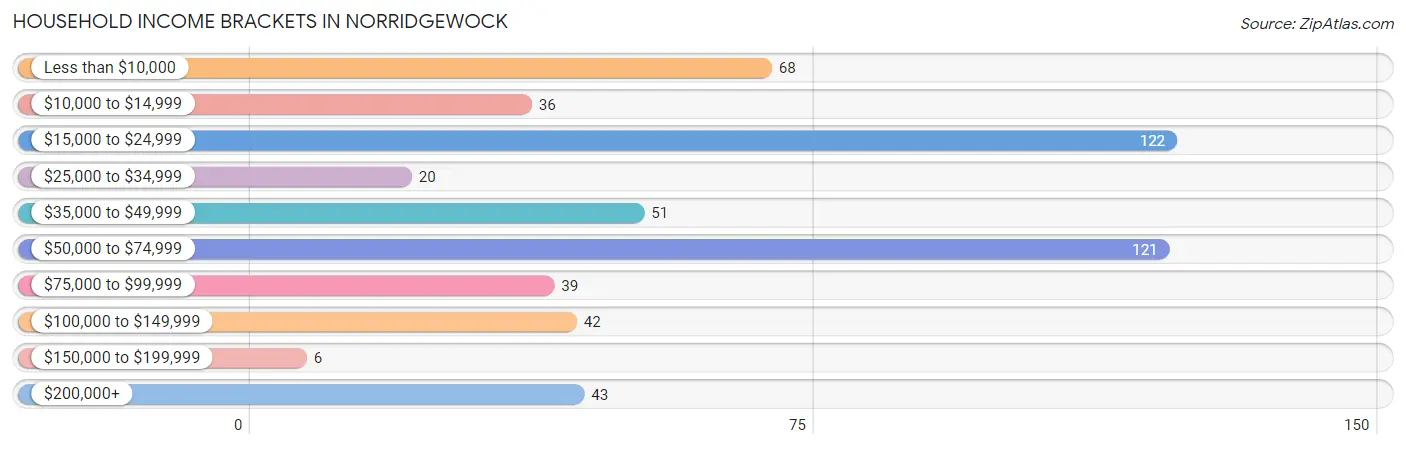
| Income Bracket | # Households | % Households |
| Less than $10,000 | 68 | 12.4% |
| $10,000 to $14,999 | 36 | 6.6% |
| $15,000 to $24,999 | 122 | 22.3% |
| $25,000 to $34,999 | 20 | 3.6% |
| $35,000 to $49,999 | 51 | 9.3% |
| $50,000 to $74,999 | 121 | 22.1% |
| $75,000 to $99,999 | 39 | 7.1% |
| $100,000 to $149,999 | 42 | 7.7% |
| $150,000 to $199,999 | 6 | 1.1% |
| $200,000+ | 43 | 7.8% |
Household Income by Householder Age in Norridgewock
The median household income in Norridgewock is $41,944, with the highest median household income of $73,971 found in the 25 to 44 years age bracket for the primary householder. A total of 60 households (11.0%) fall into this category.
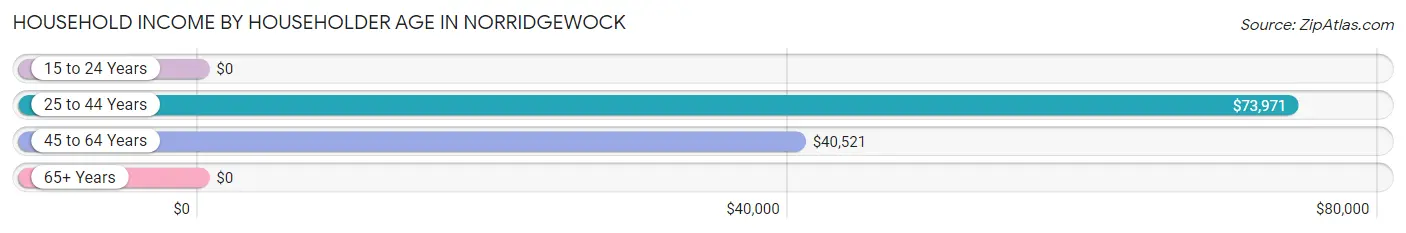
| Income Bracket | # Households | Median Income |
| 15 to 24 Years | 0 (0.0%) | $0 |
| 25 to 44 Years | 60 (11.0%) | $73,971 |
| 45 to 64 Years | 249 (45.4%) | $40,521 |
| 65+ Years | 239 (43.6%) | $0 |
| Total | 548 (100.0%) | $41,944 |
Poverty in Norridgewock
Income Below Poverty by Sex and Age in Norridgewock
With 26.8% poverty level for males and 20.5% for females among the residents of Norridgewock, 18 to 24 year old males and 65 to 74 year old females are the most vulnerable to poverty, with 66 males (75.0%) and 54 females (42.9%) in their respective age groups living below the poverty level.
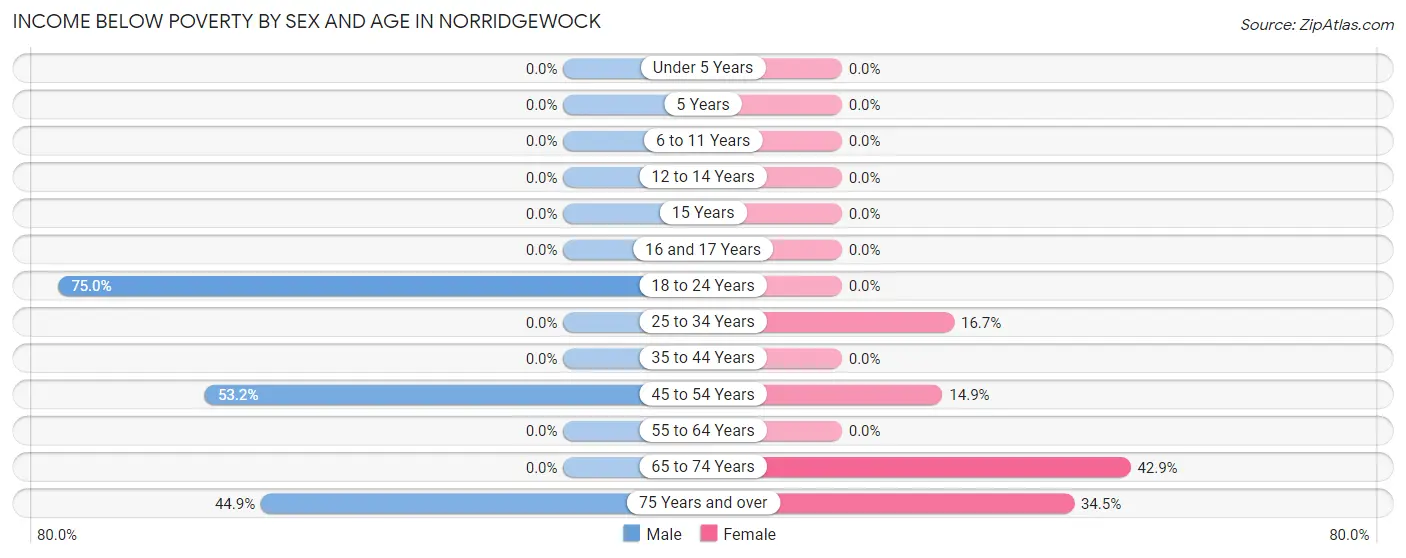
| Age Bracket | Male | Female |
| Under 5 Years | 0 (0.0%) | 0 (0.0%) |
| 5 Years | 0 (0.0%) | 0 (0.0%) |
| 6 to 11 Years | 0 (0.0%) | 0 (0.0%) |
| 12 to 14 Years | 0 (0.0%) | 0 (0.0%) |
| 15 Years | 0 (0.0%) | 0 (0.0%) |
| 16 and 17 Years | 0 (0.0%) | 0 (0.0%) |
| 18 to 24 Years | 66 (75.0%) | 0 (0.0%) |
| 25 to 34 Years | 0 (0.0%) | 10 (16.7%) |
| 35 to 44 Years | 0 (0.0%) | 0 (0.0%) |
| 45 to 54 Years | 58 (53.2%) | 13 (14.9%) |
| 55 to 64 Years | 0 (0.0%) | 0 (0.0%) |
| 65 to 74 Years | 0 (0.0%) | 54 (42.9%) |
| 75 Years and over | 44 (44.9%) | 20 (34.5%) |
| Total | 168 (26.8%) | 97 (20.5%) |
Income Above Poverty by Sex and Age in Norridgewock
According to the poverty statistics in Norridgewock, males aged under 5 years and females aged under 5 years are the age groups that are most secure financially, with 100.0% of males and 100.0% of females in these age groups living above the poverty line.
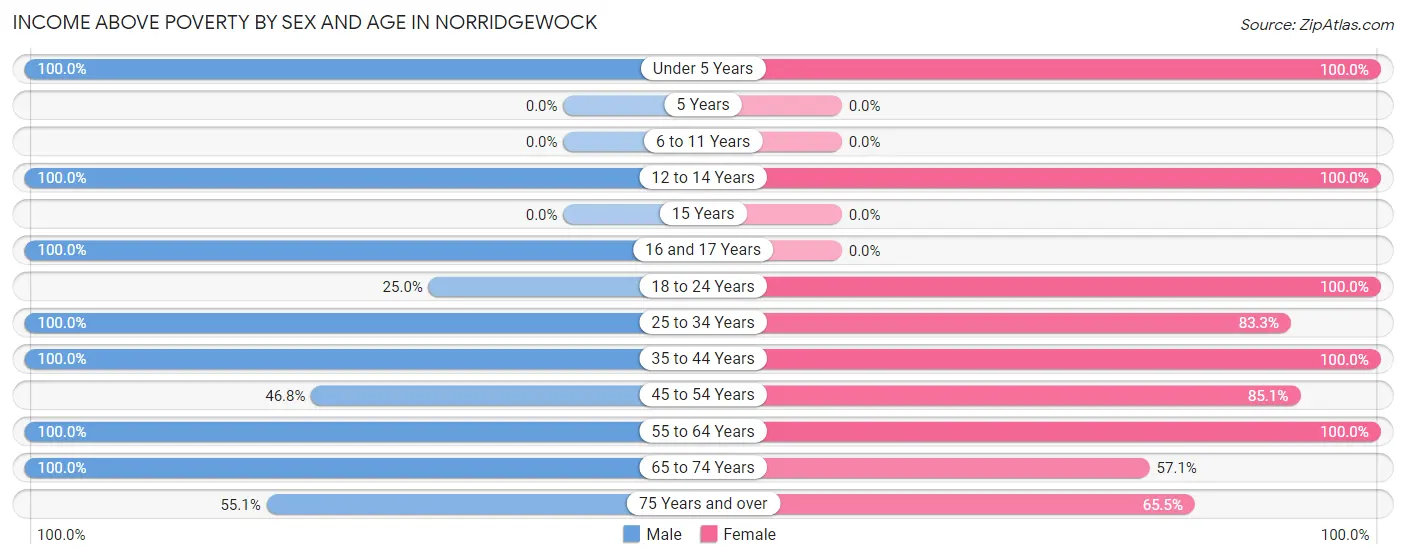
| Age Bracket | Male | Female |
| Under 5 Years | 93 (100.0%) | 13 (100.0%) |
| 5 Years | 0 (0.0%) | 0 (0.0%) |
| 6 to 11 Years | 0 (0.0%) | 0 (0.0%) |
| 12 to 14 Years | 12 (100.0%) | 3 (100.0%) |
| 15 Years | 0 (0.0%) | 0 (0.0%) |
| 16 and 17 Years | 17 (100.0%) | 0 (0.0%) |
| 18 to 24 Years | 22 (25.0%) | 15 (100.0%) |
| 25 to 34 Years | 64 (100.0%) | 50 (83.3%) |
| 35 to 44 Years | 20 (100.0%) | 16 (100.0%) |
| 45 to 54 Years | 51 (46.8%) | 74 (85.1%) |
| 55 to 64 Years | 70 (100.0%) | 94 (100.0%) |
| 65 to 74 Years | 56 (100.0%) | 72 (57.1%) |
| 75 Years and over | 54 (55.1%) | 38 (65.5%) |
| Total | 459 (73.2%) | 375 (79.4%) |
Income Below Poverty Among Married-Couple Families in Norridgewock
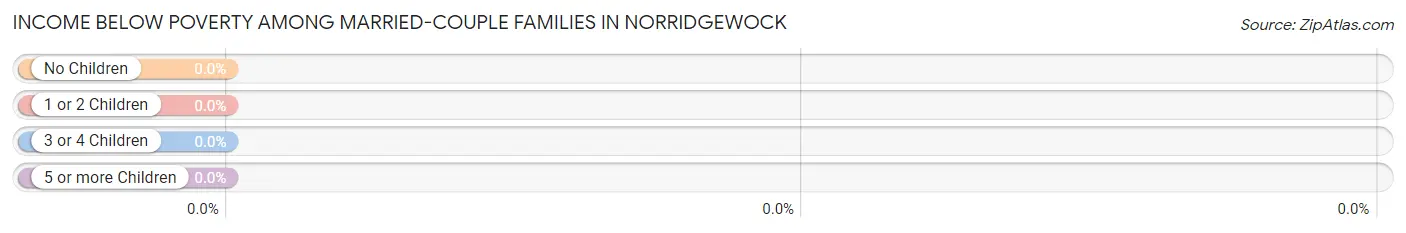
| Children | Above Poverty | Below Poverty |
| No Children | 156 (100.0%) | 0 (0.0%) |
| 1 or 2 Children | 6 (100.0%) | 0 (0.0%) |
| 3 or 4 Children | 44 (100.0%) | 0 (0.0%) |
| 5 or more Children | 0 (0.0%) | 0 (0.0%) |
| Total | 206 (100.0%) | 0 (0.0%) |
Income Below Poverty Among Single-Parent Households in Norridgewock
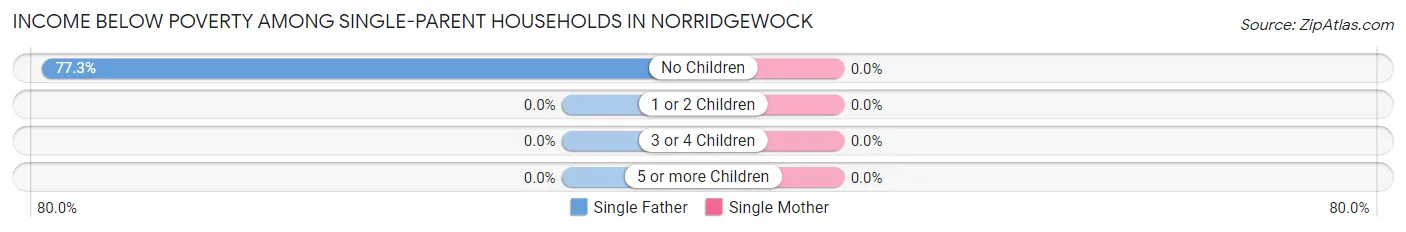
| Children | Single Father | Single Mother |
| No Children | 58 (77.3%) | 0 (0.0%) |
| 1 or 2 Children | 0 (0.0%) | 0 (0.0%) |
| 3 or 4 Children | 0 (0.0%) | 0 (0.0%) |
| 5 or more Children | 0 (0.0%) | 0 (0.0%) |
| Total | 58 (77.3%) | 0 (0.0%) |
Income Below Poverty Among Married-Couple vs Single-Parent Households in Norridgewock
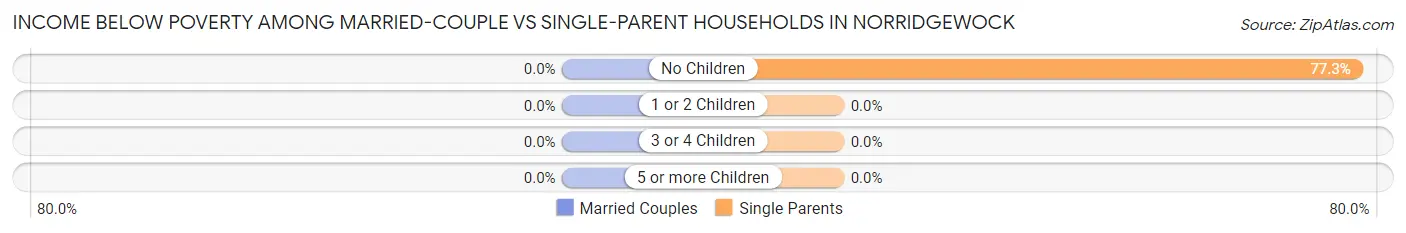
| Children | Married-Couple Families | Single-Parent Households |
| No Children | 0 (0.0%) | 58 (77.3%) |
| 1 or 2 Children | 0 (0.0%) | 0 (0.0%) |
| 3 or 4 Children | 0 (0.0%) | 0 (0.0%) |
| 5 or more Children | 0 (0.0%) | 0 (0.0%) |
| Total | 0 (0.0%) | 58 (72.5%) |
Race in Norridgewock
The most populous races in Norridgewock are White / Caucasian (1,059 | 96.4%), Black / African American (33 | 3.0%), and Two or more Races (7 | 0.6%).
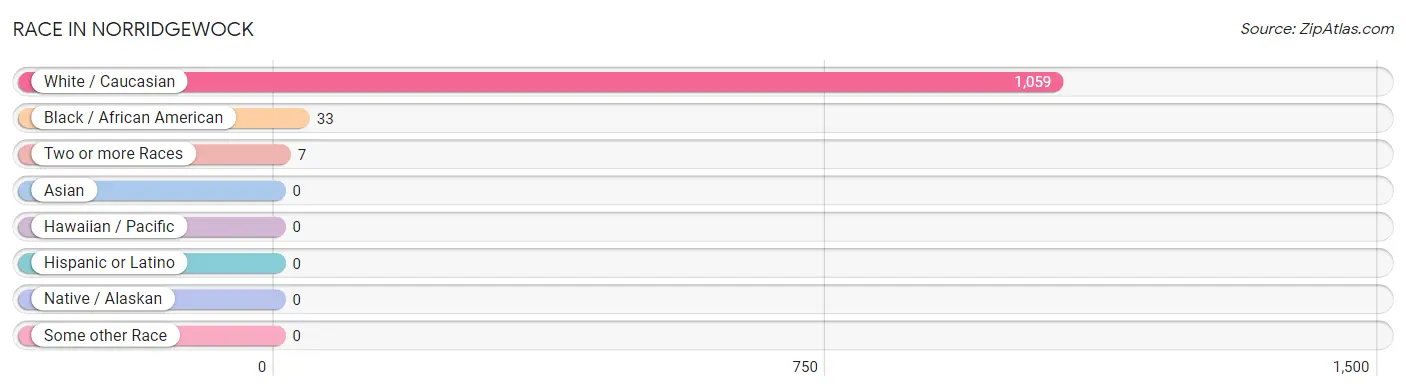
| Race | # Population | % Population |
| Asian | 0 | 0.0% |
| Black / African American | 33 | 3.0% |
| Hawaiian / Pacific | 0 | 0.0% |
| Hispanic or Latino | 0 | 0.0% |
| Native / Alaskan | 0 | 0.0% |
| White / Caucasian | 1,059 | 96.4% |
| Two or more Races | 7 | 0.6% |
| Some other Race | 0 | 0.0% |
| Total | 1,099 | 100.0% |
Ancestry in Norridgewock
The most populous ancestries reported in Norridgewock are English (298 | 27.1%), Scottish (141 | 12.8%), Irish (113 | 10.3%), American (91 | 8.3%), and German (68 | 6.2%), together accounting for 64.7% of all Norridgewock residents.
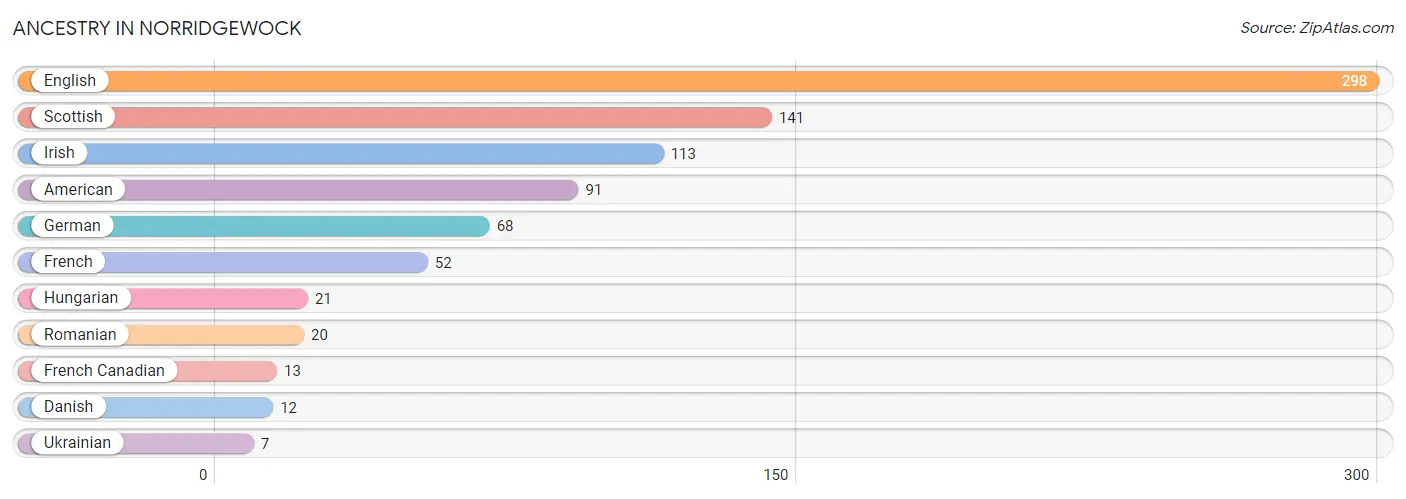
| Ancestry | # Population | % Population |
| American | 91 | 8.3% |
| Danish | 12 | 1.1% |
| English | 298 | 27.1% |
| French | 52 | 4.7% |
| French Canadian | 13 | 1.2% |
| German | 68 | 6.2% |
| Hungarian | 21 | 1.9% |
| Irish | 113 | 10.3% |
| Romanian | 20 | 1.8% |
| Scottish | 141 | 12.8% |
| Ukrainian | 7 | 0.6% | View All 11 Rows |
Immigrants in Norridgewock

| Immigration Origin | # Population | % Population | View All 0 Rows |
Sex and Age in Norridgewock
Sex and Age in Norridgewock
The most populous age groups in Norridgewock are Under 5 Years (93 | 14.8%) for men and 70 to 74 Years (73 | 15.5%) for women.
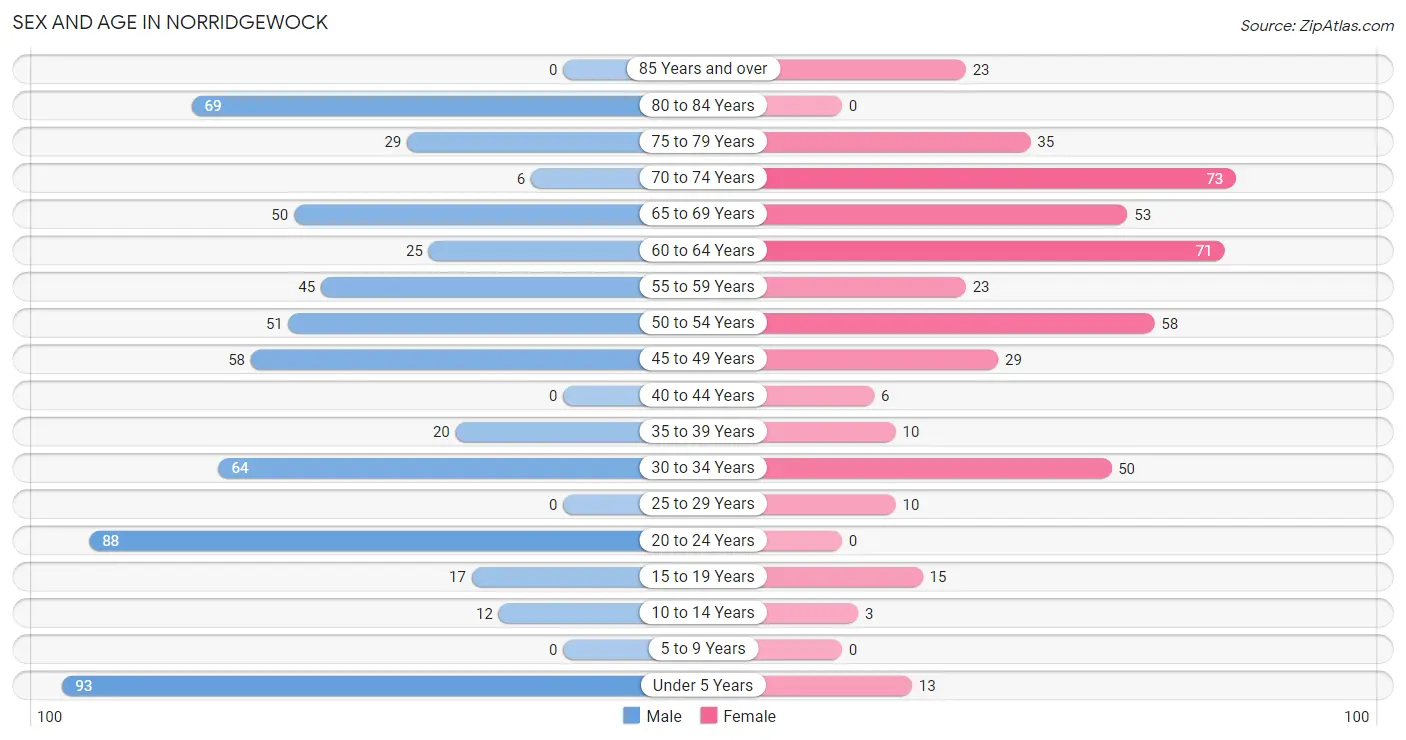
| Age Bracket | Male | Female |
| Under 5 Years | 93 (14.8%) | 13 (2.8%) |
| 5 to 9 Years | 0 (0.0%) | 0 (0.0%) |
| 10 to 14 Years | 12 (1.9%) | 3 (0.6%) |
| 15 to 19 Years | 17 (2.7%) | 15 (3.2%) |
| 20 to 24 Years | 88 (14.0%) | 0 (0.0%) |
| 25 to 29 Years | 0 (0.0%) | 10 (2.1%) |
| 30 to 34 Years | 64 (10.2%) | 50 (10.6%) |
| 35 to 39 Years | 20 (3.2%) | 10 (2.1%) |
| 40 to 44 Years | 0 (0.0%) | 6 (1.3%) |
| 45 to 49 Years | 58 (9.2%) | 29 (6.1%) |
| 50 to 54 Years | 51 (8.1%) | 58 (12.3%) |
| 55 to 59 Years | 45 (7.2%) | 23 (4.9%) |
| 60 to 64 Years | 25 (4.0%) | 71 (15.0%) |
| 65 to 69 Years | 50 (8.0%) | 53 (11.2%) |
| 70 to 74 Years | 6 (1.0%) | 73 (15.5%) |
| 75 to 79 Years | 29 (4.6%) | 35 (7.4%) |
| 80 to 84 Years | 69 (11.0%) | 0 (0.0%) |
| 85 Years and over | 0 (0.0%) | 23 (4.9%) |
| Total | 627 (100.0%) | 472 (100.0%) |
Families and Households in Norridgewock
Median Family Size in Norridgewock
The median family size in Norridgewock is 2.62 persons per family, with single female/mother families (5 | 1.8%) accounting for the largest median family size of 5.2 persons per family. On the other hand, single male/father families (75 | 26.2%) represent the smallest median family size with 2.09 persons per family.
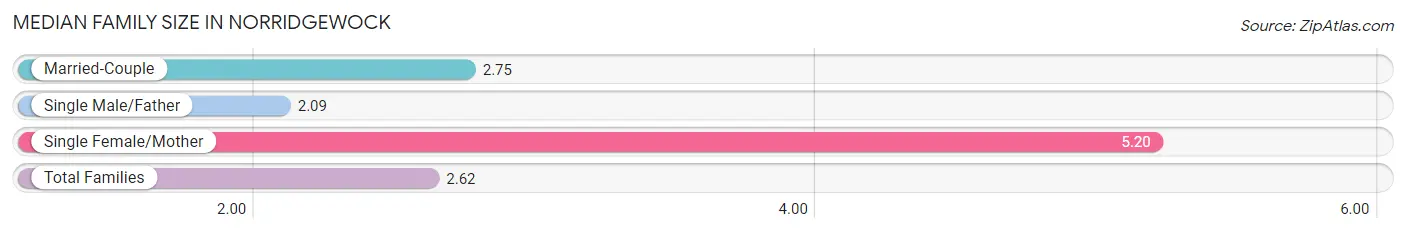
| Family Type | # Families | Family Size |
| Married-Couple | 206 (72.0%) | 2.75 |
| Single Male/Father | 75 (26.2%) | 2.09 |
| Single Female/Mother | 5 (1.8%) | 5.20 |
| Total Families | 286 (100.0%) | 2.62 |
Median Household Size in Norridgewock
The median household size in Norridgewock is 2.01 persons per household, with single female/mother households (5 | 0.9%) accounting for the largest median household size of 5.2 persons per household. non-family households (262 | 47.8%) represent the smallest median household size with 1.33 persons per household.
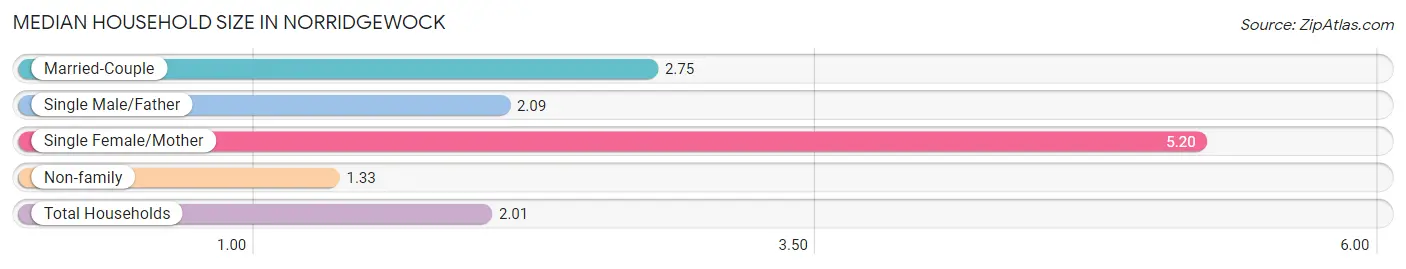
| Household Type | # Households | Household Size |
| Married-Couple | 206 (37.6%) | 2.75 |
| Single Male/Father | 75 (13.7%) | 2.09 |
| Single Female/Mother | 5 (0.9%) | 5.20 |
| Non-family | 262 (47.8%) | 1.33 |
| Total Households | 548 (100.0%) | 2.01 |
Household Size by Marriage Status in Norridgewock
Out of a total of 548 households in Norridgewock, 286 (52.2%) are family households, while 262 (47.8%) are nonfamily households. The most numerous type of family households are 2-person households, comprising 206, and the most common type of nonfamily households are 1-person households, comprising 189.
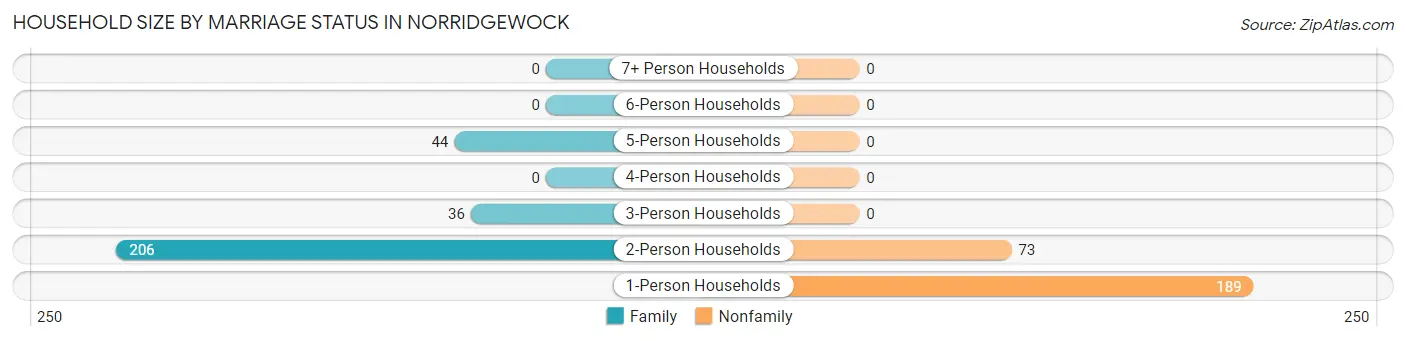
| Household Size | Family Households | Nonfamily Households |
| 1-Person Households | - | 189 (34.5%) |
| 2-Person Households | 206 (37.6%) | 73 (13.3%) |
| 3-Person Households | 36 (6.6%) | 0 (0.0%) |
| 4-Person Households | 0 (0.0%) | 0 (0.0%) |
| 5-Person Households | 44 (8.0%) | 0 (0.0%) |
| 6-Person Households | 0 (0.0%) | 0 (0.0%) |
| 7+ Person Households | 0 (0.0%) | 0 (0.0%) |
| Total | 286 (52.2%) | 262 (47.8%) |
Female Fertility in Norridgewock
Fertility by Age in Norridgewock
Average fertility rate in Norridgewock is 246.0 births per 1,000 women. Women in the age bracket of 20 to 34 years have the highest fertility rate with 567.0 births per 1,000 women. Women in the age bracket of 20 to 34 years acount for 100.0% of all women with births.
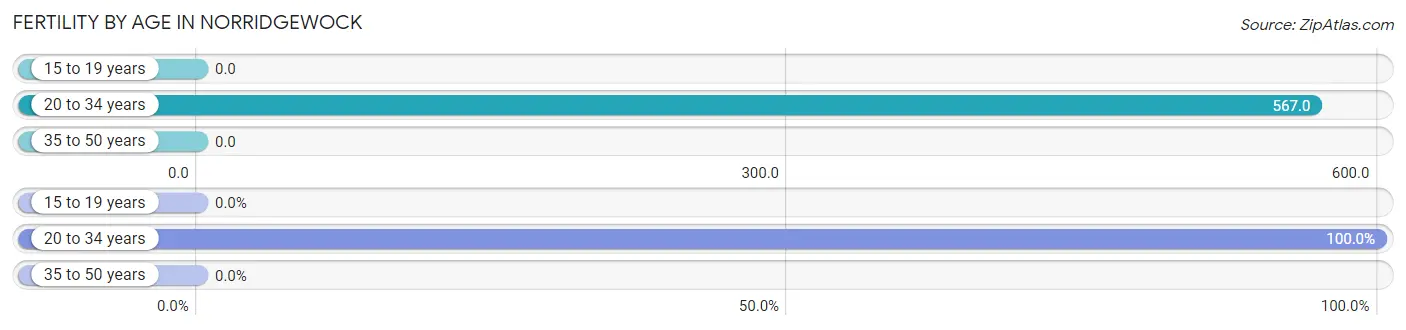
| Age Bracket | Women with Births | Births / 1,000 Women |
| 15 to 19 years | 0 (0.0%) | 0.0 |
| 20 to 34 years | 34 (100.0%) | 567.0 |
| 35 to 50 years | 0 (0.0%) | 0.0 |
| Total | 34 (100.0%) | 246.0 |
Fertility by Age by Marriage Status in Norridgewock
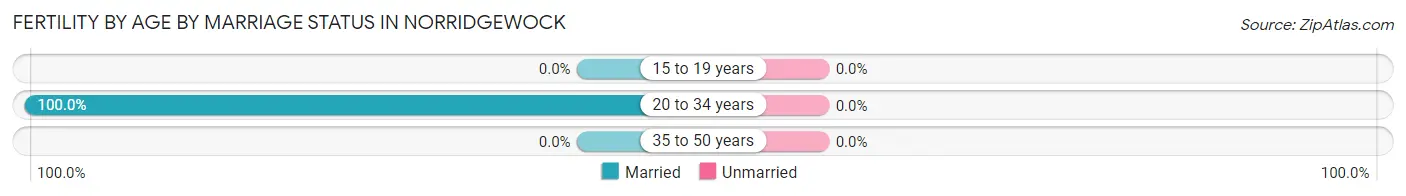
| Age Bracket | Married | Unmarried |
| 15 to 19 years | 0 (0.0%) | 0 (0.0%) |
| 20 to 34 years | 34 (100.0%) | 0 (0.0%) |
| 35 to 50 years | 0 (0.0%) | 0 (0.0%) |
| Total | 34 (100.0%) | 0 (0.0%) |
Fertility by Education in Norridgewock
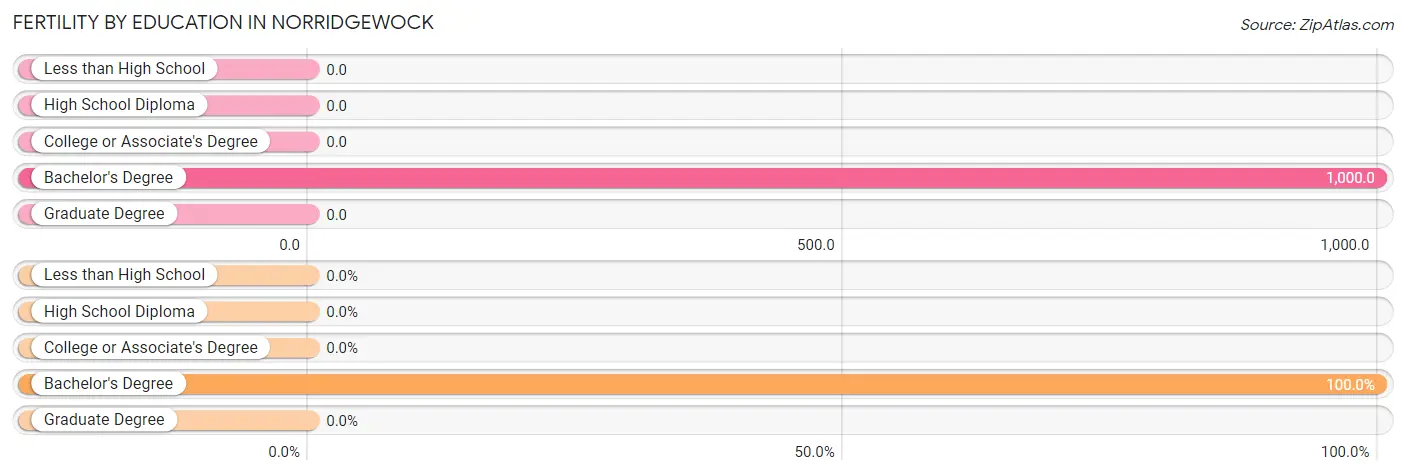
| Educational Attainment | Women with Births | Births / 1,000 Women |
| Less than High School | 0 (0.0%) | 0.0 |
| High School Diploma | 0 (0.0%) | 0.0 |
| College or Associate's Degree | 0 (0.0%) | 0.0 |
| Bachelor's Degree | 34 (100.0%) | 1,000.0 |
| Graduate Degree | 0 (0.0%) | 0.0 |
| Total | 34 (100.0%) | 246.0 |
Fertility by Education by Marriage Status in Norridgewock
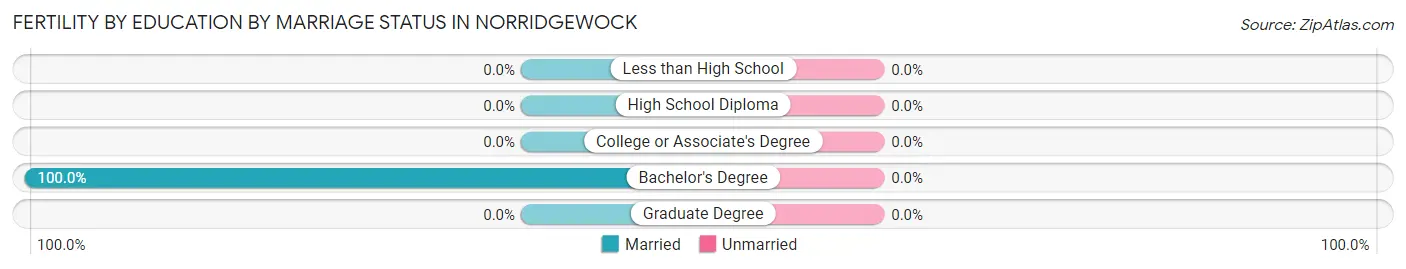
| Educational Attainment | Married | Unmarried |
| Less than High School | 0 (0.0%) | 0 (0.0%) |
| High School Diploma | 0 (0.0%) | 0 (0.0%) |
| College or Associate's Degree | 0 (0.0%) | 0 (0.0%) |
| Bachelor's Degree | 34 (100.0%) | 0 (0.0%) |
| Graduate Degree | 0 (0.0%) | 0 (0.0%) |
| Total | 34 (100.0%) | 0 (0.0%) |
Employment Characteristics in Norridgewock
Employment by Class of Employer in Norridgewock
Among the 574 employed individuals in Norridgewock, private company employees (271 | 47.2%), self-employed (not incorporated) (148 | 25.8%), and local government employees (61 | 10.6%) make up the most common classes of employment.
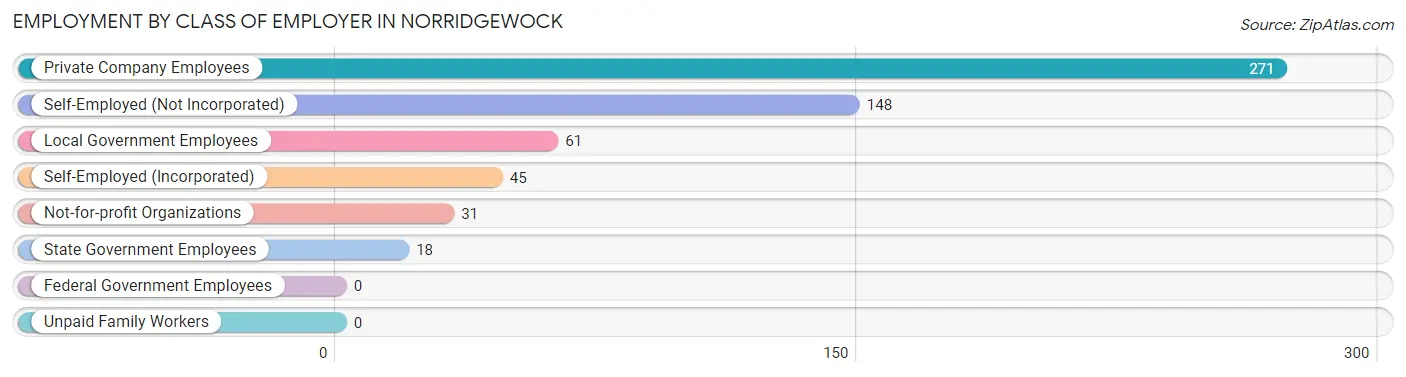
| Employer Class | # Employees | % Employees |
| Private Company Employees | 271 | 47.2% |
| Self-Employed (Incorporated) | 45 | 7.8% |
| Self-Employed (Not Incorporated) | 148 | 25.8% |
| Not-for-profit Organizations | 31 | 5.4% |
| Local Government Employees | 61 | 10.6% |
| State Government Employees | 18 | 3.1% |
| Federal Government Employees | 0 | 0.0% |
| Unpaid Family Workers | 0 | 0.0% |
| Total | 574 | 100.0% |
Employment Status by Age in Norridgewock
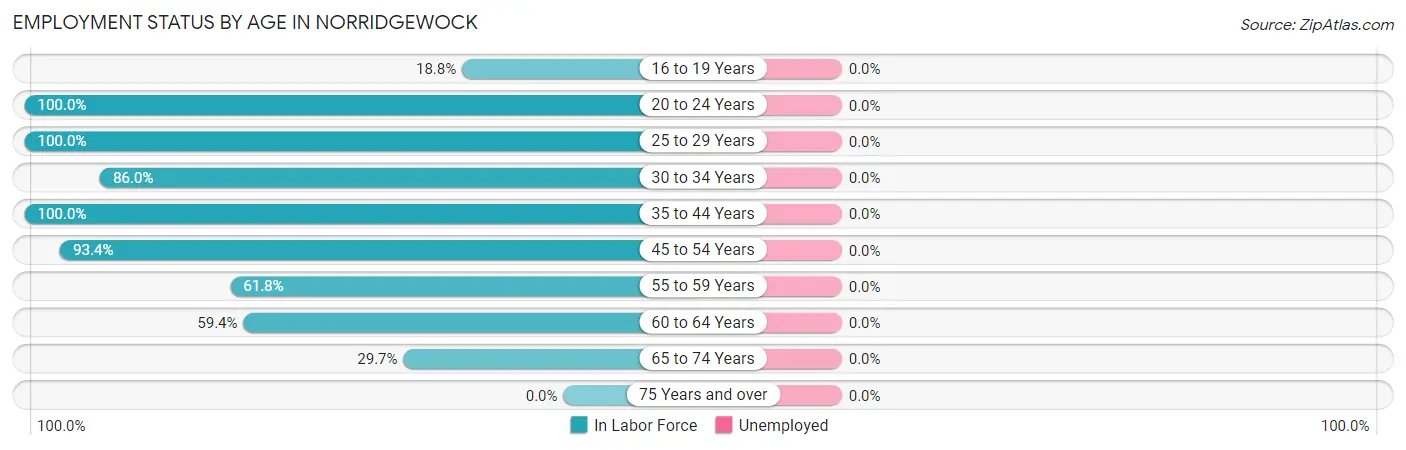
| Age Bracket | In Labor Force | Unemployed |
| 16 to 19 Years | 6 (18.8%) | 0 (0.0%) |
| 20 to 24 Years | 88 (100.0%) | 0 (0.0%) |
| 25 to 29 Years | 10 (100.0%) | 0 (0.0%) |
| 30 to 34 Years | 98 (86.0%) | 0 (0.0%) |
| 35 to 44 Years | 36 (100.0%) | 0 (0.0%) |
| 45 to 54 Years | 183 (93.4%) | 0 (0.0%) |
| 55 to 59 Years | 42 (61.8%) | 0 (0.0%) |
| 60 to 64 Years | 57 (59.4%) | 0 (0.0%) |
| 65 to 74 Years | 54 (29.7%) | 0 (0.0%) |
| 75 Years and over | 0 (0.0%) | 0 (0.0%) |
| Total | 574 (58.7%) | 0 (0.0%) |
Employment Status by Educational Attainment in Norridgewock
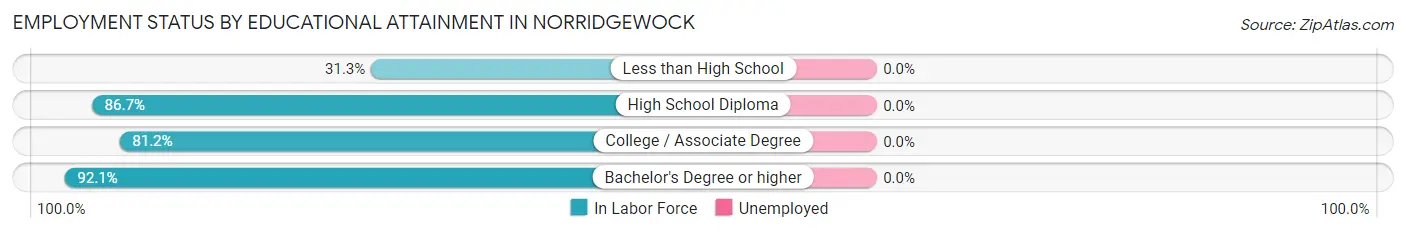
| Educational Attainment | In Labor Force | Unemployed |
| Less than High School | 15 (31.3%) | 0 (0.0%) |
| High School Diploma | 176 (86.7%) | 0 (0.0%) |
| College / Associate Degree | 95 (81.2%) | 0 (0.0%) |
| Bachelor's Degree or higher | 140 (92.1%) | 0 (0.0%) |
| Total | 426 (81.9%) | 0 (0.0%) |
Employment Occupations by Sex in Norridgewock
Management, Business, Science and Arts Occupations
The most common Management, Business, Science and Arts occupations in Norridgewock are Community & Social Service (23 | 4.0%), Management (16 | 2.8%), Education, Arts & Media (14 | 2.4%), Health Diagnosing & Treating (11 | 1.9%), and Legal Services & Support (9 | 1.6%).
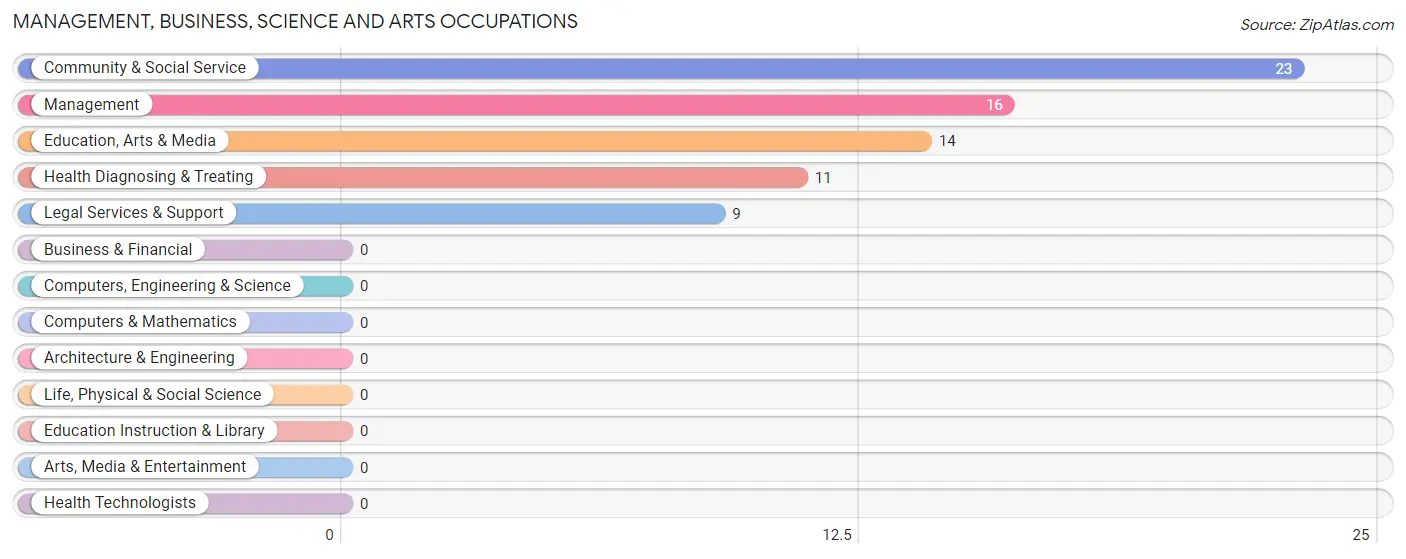
Management, Business, Science and Arts Occupations by Sex
Within the Management, Business, Science and Arts occupations in Norridgewock, the most male-oriented occupations are Community & Social Service (100.0%), Education, Arts & Media (100.0%), and Legal Services & Support (100.0%), while the most female-oriented occupations are Management (100.0%), and Health Diagnosing & Treating (100.0%).
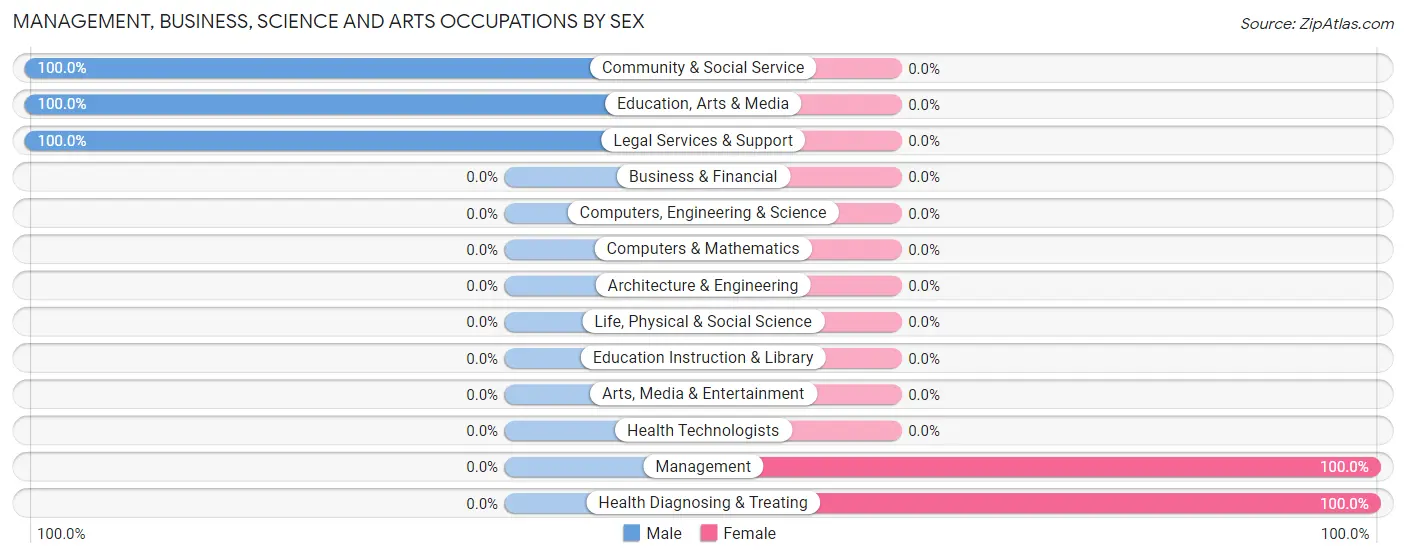
| Occupation | Male | Female |
| Management | 0 (0.0%) | 16 (100.0%) |
| Business & Financial | 0 (0.0%) | 0 (0.0%) |
| Computers, Engineering & Science | 0 (0.0%) | 0 (0.0%) |
| Computers & Mathematics | 0 (0.0%) | 0 (0.0%) |
| Architecture & Engineering | 0 (0.0%) | 0 (0.0%) |
| Life, Physical & Social Science | 0 (0.0%) | 0 (0.0%) |
| Community & Social Service | 23 (100.0%) | 0 (0.0%) |
| Education, Arts & Media | 14 (100.0%) | 0 (0.0%) |
| Legal Services & Support | 9 (100.0%) | 0 (0.0%) |
| Education Instruction & Library | 0 (0.0%) | 0 (0.0%) |
| Arts, Media & Entertainment | 0 (0.0%) | 0 (0.0%) |
| Health Diagnosing & Treating | 0 (0.0%) | 11 (100.0%) |
| Health Technologists | 0 (0.0%) | 0 (0.0%) |
| Total (Category) | 23 (46.0%) | 27 (54.0%) |
| Total (Overall) | 388 (67.6%) | 186 (32.4%) |
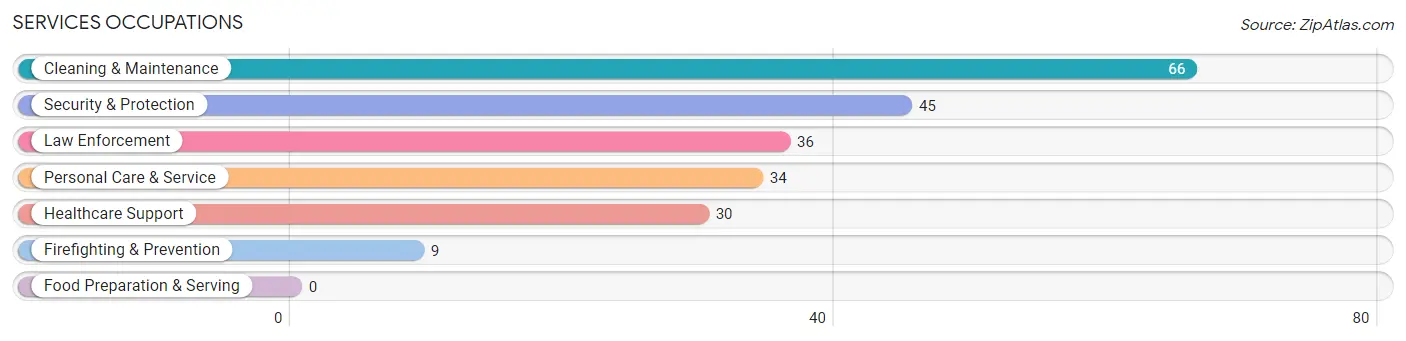
Services Occupations
The most common Services occupations in Norridgewock are Cleaning & Maintenance (66 | 11.5%), Security & Protection (45 | 7.8%), Law Enforcement (36 | 6.3%), Personal Care & Service (34 | 5.9%), and Healthcare Support (30 | 5.2%).
Services Occupations by Sex
Within the Services occupations in Norridgewock, the most male-oriented occupations are Security & Protection (100.0%), Firefighting & Prevention (100.0%), and Law Enforcement (100.0%), while the most female-oriented occupations are Healthcare Support (100.0%), and Personal Care & Service (100.0%).
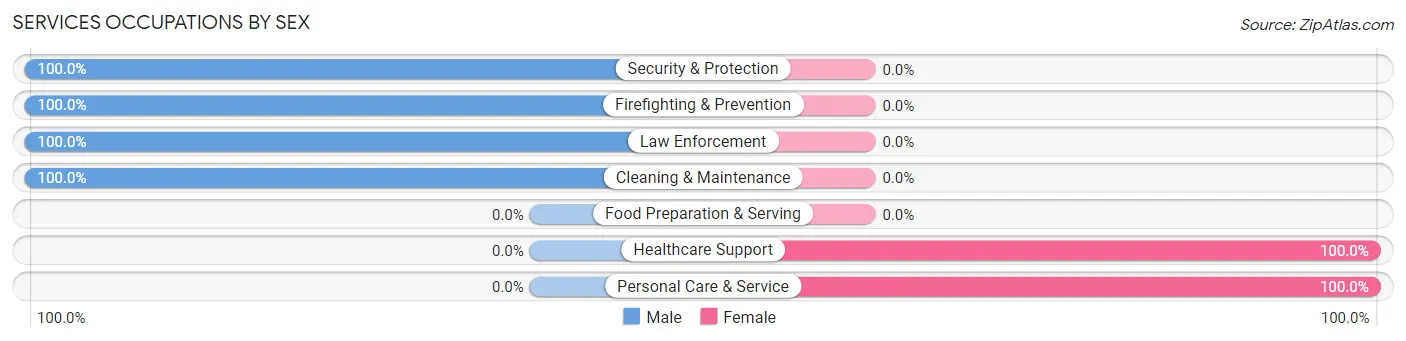
| Occupation | Male | Female |
| Healthcare Support | 0 (0.0%) | 30 (100.0%) |
| Security & Protection | 45 (100.0%) | 0 (0.0%) |
| Firefighting & Prevention | 9 (100.0%) | 0 (0.0%) |
| Law Enforcement | 36 (100.0%) | 0 (0.0%) |
| Food Preparation & Serving | 0 (0.0%) | 0 (0.0%) |
| Cleaning & Maintenance | 66 (100.0%) | 0 (0.0%) |
| Personal Care & Service | 0 (0.0%) | 34 (100.0%) |
| Total (Category) | 111 (63.4%) | 64 (36.6%) |
| Total (Overall) | 388 (67.6%) | 186 (32.4%) |
Sales and Office Occupations
The most common Sales and Office occupations in Norridgewock are Sales & Related (206 | 35.9%), and Office & Administration (87 | 15.2%).
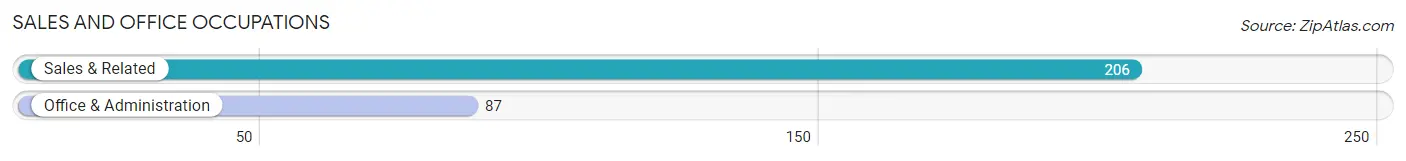
Sales and Office Occupations by Sex
| Occupation | Male | Female |
| Sales & Related | 198 (96.1%) | 8 (3.9%) |
| Office & Administration | 16 (18.4%) | 71 (81.6%) |
| Total (Category) | 214 (73.0%) | 79 (27.0%) |
| Total (Overall) | 388 (67.6%) | 186 (32.4%) |
Natural Resources, Construction and Maintenance Occupations
The most common Natural Resources, Construction and Maintenance occupations in Norridgewock are , and Construction & Extraction (25 | 4.4%).
Natural Resources, Construction and Maintenance Occupations by Sex
| Occupation | Male | Female |
| Farming, Fishing & Forestry | 0 (0.0%) | 0 (0.0%) |
| Construction & Extraction | 25 (100.0%) | 0 (0.0%) |
| Installation, Maintenance & Repair | 0 (0.0%) | 0 (0.0%) |
| Total (Category) | 25 (100.0%) | 0 (0.0%) |
| Total (Overall) | 388 (67.6%) | 186 (32.4%) |
Production, Transportation and Moving Occupations
The most common Production, Transportation and Moving occupations in Norridgewock are , and Transportation (31 | 5.4%).
Production, Transportation and Moving Occupations by Sex
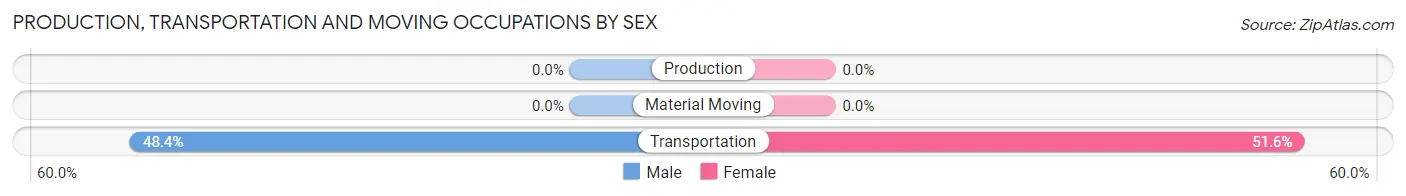
| Occupation | Male | Female |
| Production | 0 (0.0%) | 0 (0.0%) |
| Transportation | 15 (48.4%) | 16 (51.6%) |
| Material Moving | 0 (0.0%) | 0 (0.0%) |
| Total (Category) | 15 (48.4%) | 16 (51.6%) |
| Total (Overall) | 388 (67.6%) | 186 (32.4%) |
Employment Industries by Sex in Norridgewock
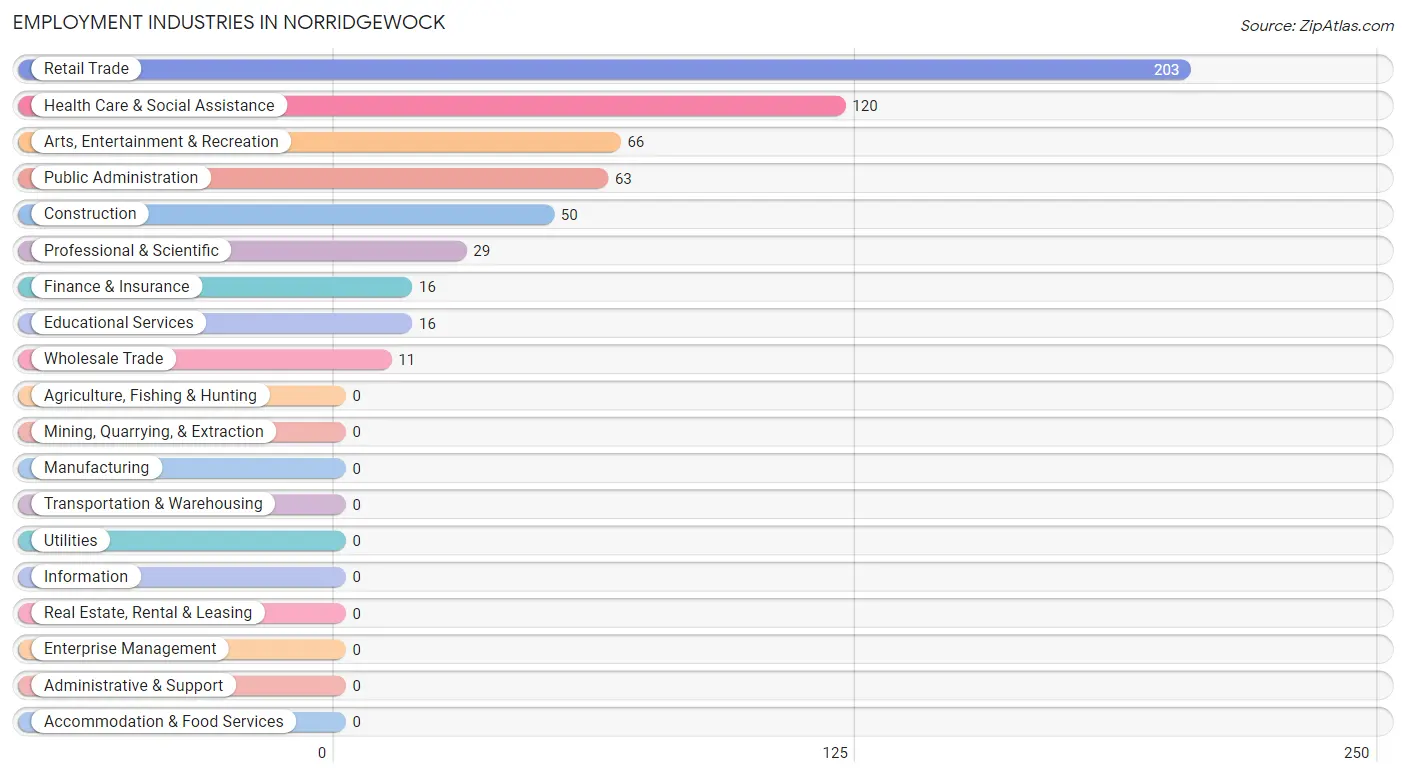
Employment Industries in Norridgewock
The major employment industries in Norridgewock include Retail Trade (203 | 35.4%), Health Care & Social Assistance (120 | 20.9%), Arts, Entertainment & Recreation (66 | 11.5%), Public Administration (63 | 11.0%), and Construction (50 | 8.7%).
Employment Industries by Sex in Norridgewock
The Norridgewock industries that see more men than women are Wholesale Trade (100.0%), Retail Trade (100.0%), and Arts, Entertainment & Recreation (100.0%), whereas the industries that tend to have a higher number of women are Finance & Insurance (100.0%), Professional & Scientific (100.0%), and Educational Services (100.0%).
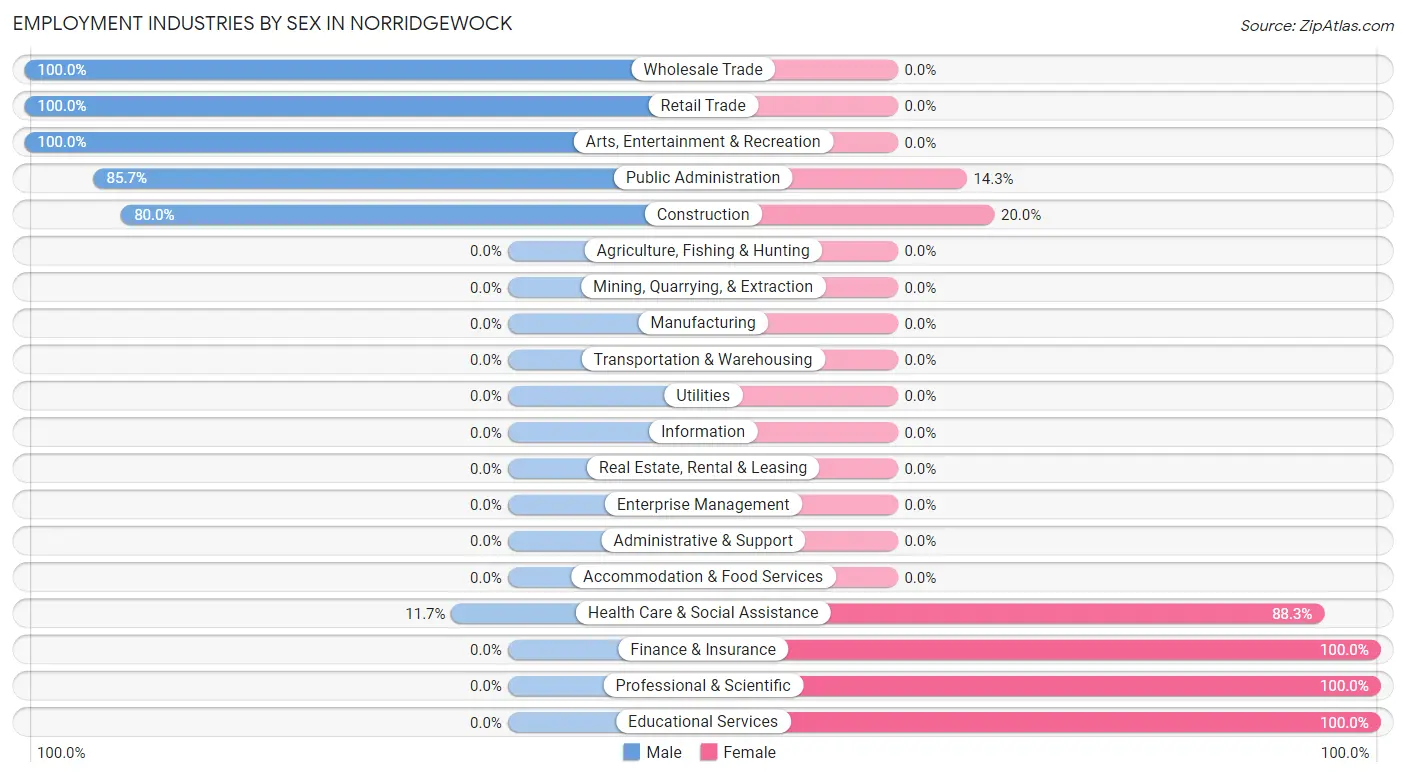
| Industry | Male | Female |
| Agriculture, Fishing & Hunting | 0 (0.0%) | 0 (0.0%) |
| Mining, Quarrying, & Extraction | 0 (0.0%) | 0 (0.0%) |
| Construction | 40 (80.0%) | 10 (20.0%) |
| Manufacturing | 0 (0.0%) | 0 (0.0%) |
| Wholesale Trade | 11 (100.0%) | 0 (0.0%) |
| Retail Trade | 203 (100.0%) | 0 (0.0%) |
| Transportation & Warehousing | 0 (0.0%) | 0 (0.0%) |
| Utilities | 0 (0.0%) | 0 (0.0%) |
| Information | 0 (0.0%) | 0 (0.0%) |
| Finance & Insurance | 0 (0.0%) | 16 (100.0%) |
| Real Estate, Rental & Leasing | 0 (0.0%) | 0 (0.0%) |
| Professional & Scientific | 0 (0.0%) | 29 (100.0%) |
| Enterprise Management | 0 (0.0%) | 0 (0.0%) |
| Administrative & Support | 0 (0.0%) | 0 (0.0%) |
| Educational Services | 0 (0.0%) | 16 (100.0%) |
| Health Care & Social Assistance | 14 (11.7%) | 106 (88.3%) |
| Arts, Entertainment & Recreation | 66 (100.0%) | 0 (0.0%) |
| Accommodation & Food Services | 0 (0.0%) | 0 (0.0%) |
| Public Administration | 54 (85.7%) | 9 (14.3%) |
| Total | 388 (67.6%) | 186 (32.4%) |
Education in Norridgewock
School Enrollment in Norridgewock
The most common levels of schooling among the 139 students in Norridgewock are college / undergraduate (76 | 54.7%), nursery / preschool (31 | 22.3%), and high school (17 | 12.2%).
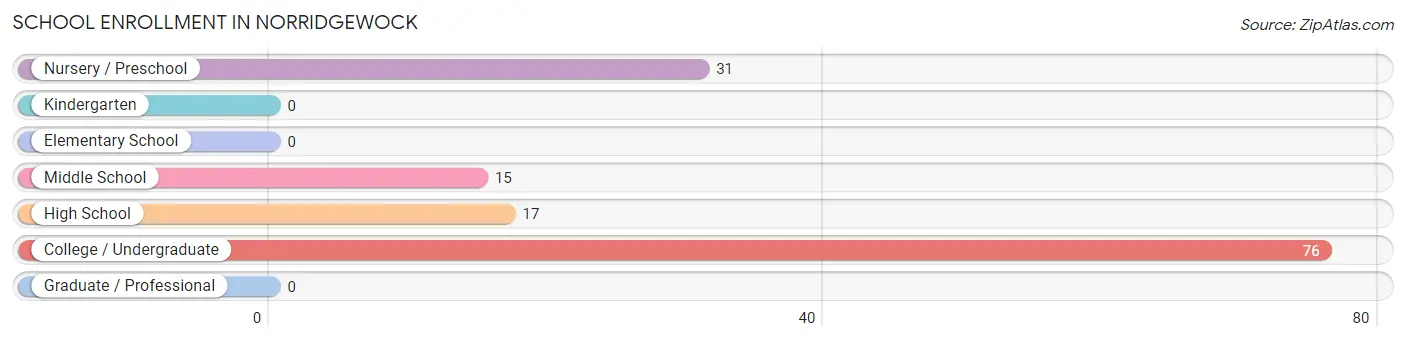
| School Level | # Students | % Students |
| Nursery / Preschool | 31 | 22.3% |
| Kindergarten | 0 | 0.0% |
| Elementary School | 0 | 0.0% |
| Middle School | 15 | 10.8% |
| High School | 17 | 12.2% |
| College / Undergraduate | 76 | 54.7% |
| Graduate / Professional | 0 | 0.0% |
| Total | 139 | 100.0% |
School Enrollment by Age by Funding Source in Norridgewock
Out of a total of 139 students who are enrolled in schools in Norridgewock, 31 (22.3%) attend a private institution, while the remaining 108 (77.7%) are enrolled in public schools. The age group of 3 to 4 year olds has the highest likelihood of being enrolled in private schools, with 31 (100.0% in the age bracket) enrolled. Conversely, the age group of 10 to 14 year olds has the lowest likelihood of being enrolled in a private school, with 15 (100.0% in the age bracket) attending a public institution.
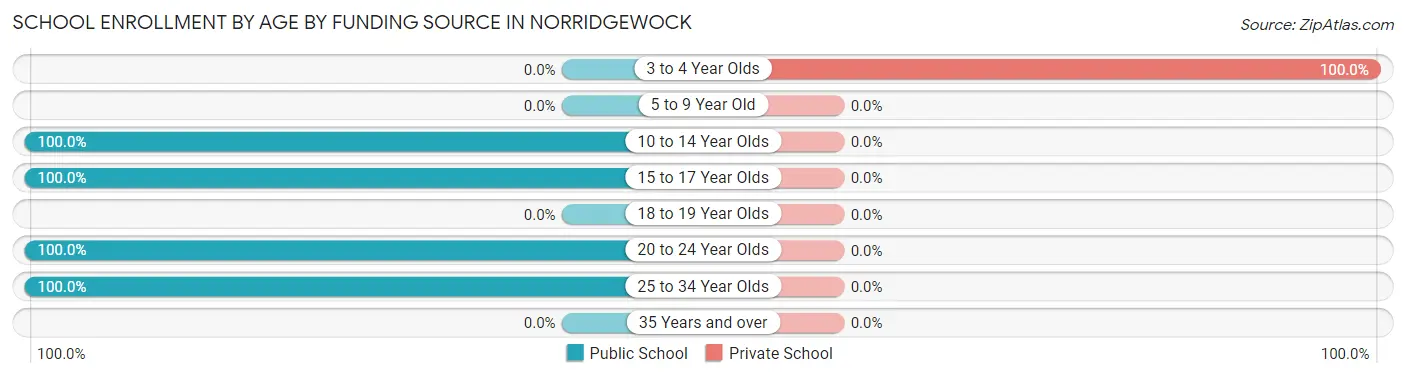
| Age Bracket | Public School | Private School |
| 3 to 4 Year Olds | 0 (0.0%) | 31 (100.0%) |
| 5 to 9 Year Old | 0 (0.0%) | 0 (0.0%) |
| 10 to 14 Year Olds | 15 (100.0%) | 0 (0.0%) |
| 15 to 17 Year Olds | 17 (100.0%) | 0 (0.0%) |
| 18 to 19 Year Olds | 0 (0.0%) | 0 (0.0%) |
| 20 to 24 Year Olds | 66 (100.0%) | 0 (0.0%) |
| 25 to 34 Year Olds | 10 (100.0%) | 0 (0.0%) |
| 35 Years and over | 0 (0.0%) | 0 (0.0%) |
| Total | 108 (77.7%) | 31 (22.3%) |
Educational Attainment by Field of Study in Norridgewock
Liberal arts & history (60 | 20.7%), education (46 | 15.9%), business (42 | 14.5%), social sciences (36 | 12.4%), and bio, nature & agricultural (34 | 11.7%) are the most common fields of study among 290 individuals in Norridgewock who have obtained a bachelor's degree or higher.
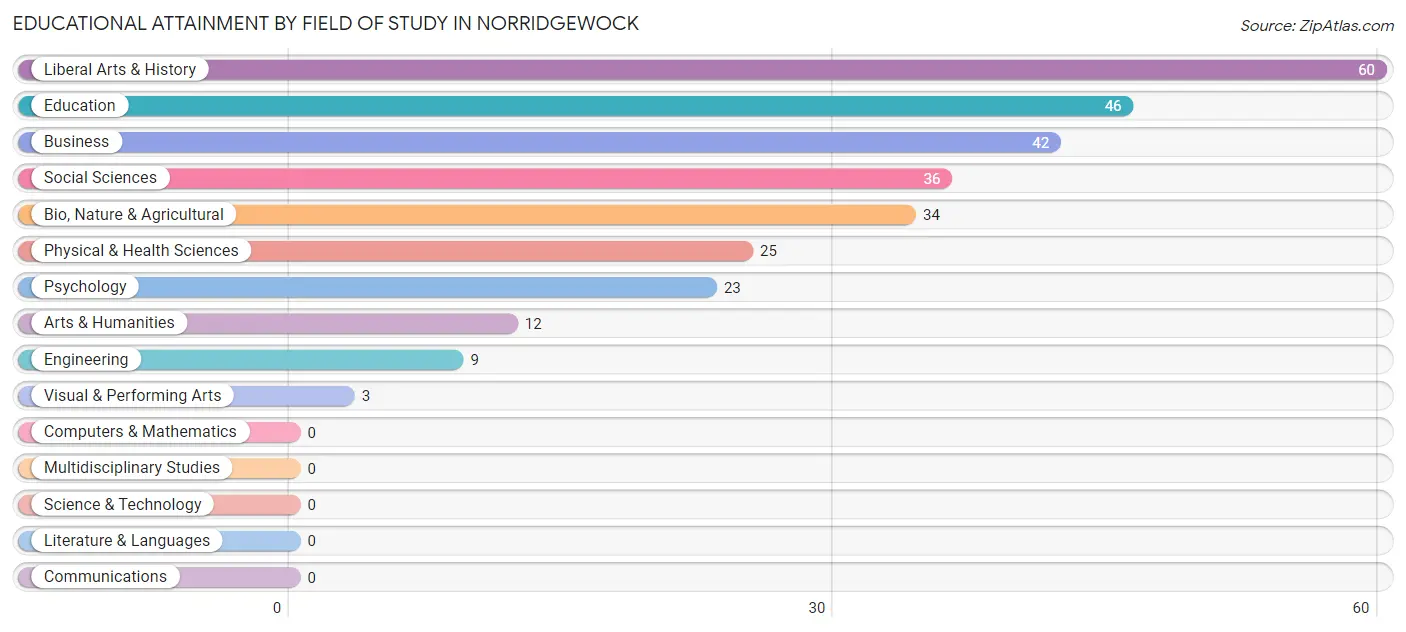
| Field of Study | # Graduates | % Graduates |
| Computers & Mathematics | 0 | 0.0% |
| Bio, Nature & Agricultural | 34 | 11.7% |
| Physical & Health Sciences | 25 | 8.6% |
| Psychology | 23 | 7.9% |
| Social Sciences | 36 | 12.4% |
| Engineering | 9 | 3.1% |
| Multidisciplinary Studies | 0 | 0.0% |
| Science & Technology | 0 | 0.0% |
| Business | 42 | 14.5% |
| Education | 46 | 15.9% |
| Literature & Languages | 0 | 0.0% |
| Liberal Arts & History | 60 | 20.7% |
| Visual & Performing Arts | 3 | 1.0% |
| Communications | 0 | 0.0% |
| Arts & Humanities | 12 | 4.1% |
| Total | 290 | 100.0% |
Transportation & Commute in Norridgewock
Vehicle Availability by Sex in Norridgewock
The most prevalent vehicle ownership categories in Norridgewock are males with 3 vehicles (180, accounting for 46.4%) and females with 3 vehicles (37, making up 96.8%).
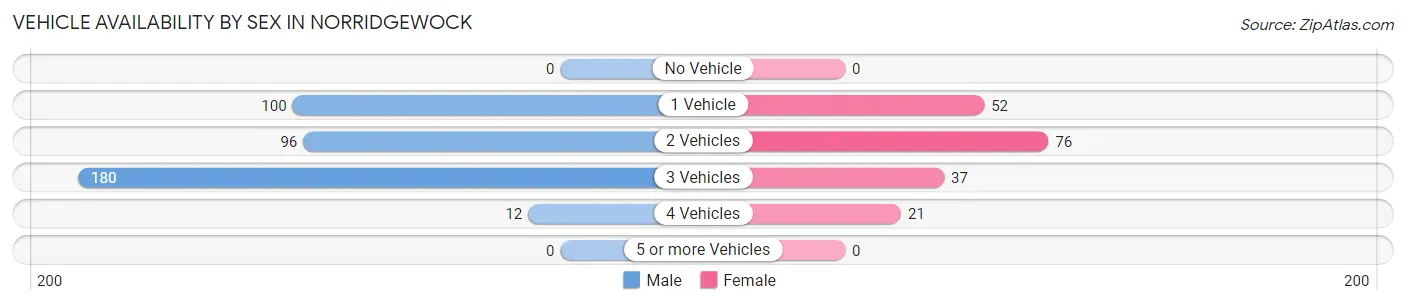
| Vehicles Available | Male | Female |
| No Vehicle | 0 (0.0%) | 0 (0.0%) |
| 1 Vehicle | 100 (25.8%) | 52 (28.0%) |
| 2 Vehicles | 96 (24.7%) | 76 (40.9%) |
| 3 Vehicles | 180 (46.4%) | 37 (19.9%) |
| 4 Vehicles | 12 (3.1%) | 21 (11.3%) |
| 5 or more Vehicles | 0 (0.0%) | 0 (0.0%) |
| Total | 388 (100.0%) | 186 (100.0%) |
Commute Time in Norridgewock
The most frequently occuring commute durations in Norridgewock are 10 to 14 minutes (138 commuters, 27.2%), 20 to 24 minutes (137 commuters, 27.0%), and 45 to 59 minutes (64 commuters, 12.6%).
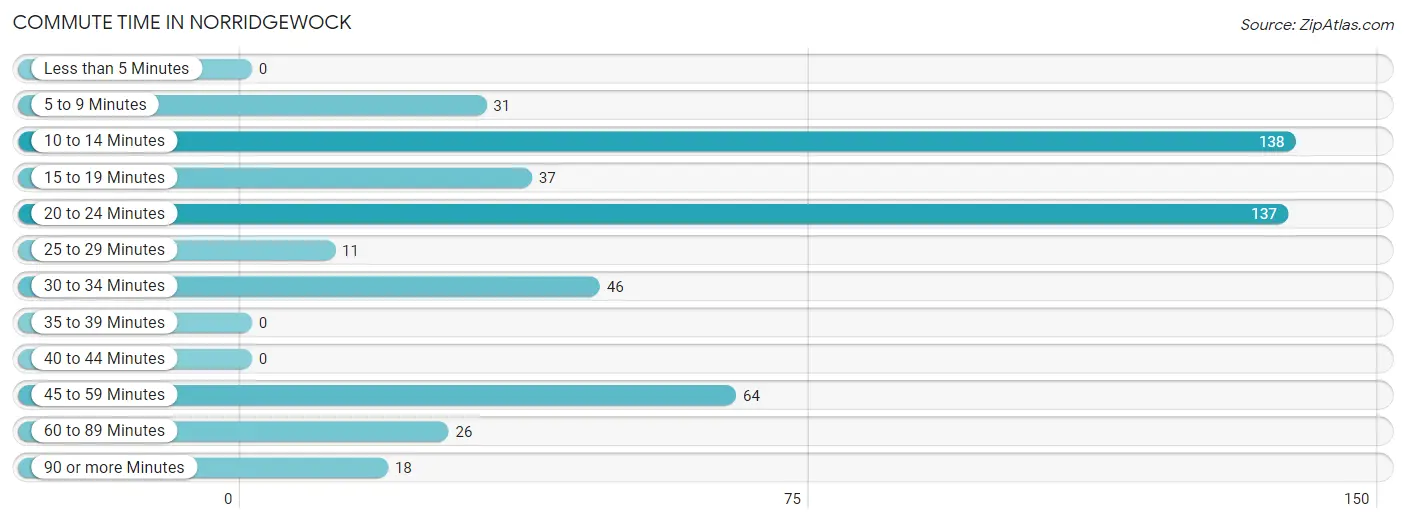
| Commute Time | # Commuters | % Commuters |
| Less than 5 Minutes | 0 | 0.0% |
| 5 to 9 Minutes | 31 | 6.1% |
| 10 to 14 Minutes | 138 | 27.2% |
| 15 to 19 Minutes | 37 | 7.3% |
| 20 to 24 Minutes | 137 | 27.0% |
| 25 to 29 Minutes | 11 | 2.2% |
| 30 to 34 Minutes | 46 | 9.1% |
| 35 to 39 Minutes | 0 | 0.0% |
| 40 to 44 Minutes | 0 | 0.0% |
| 45 to 59 Minutes | 64 | 12.6% |
| 60 to 89 Minutes | 26 | 5.1% |
| 90 or more Minutes | 18 | 3.5% |
Commute Time by Sex in Norridgewock
The most common commute times in Norridgewock are 20 to 24 minutes (137 commuters, 41.5%) for males and 10 to 14 minutes (59 commuters, 33.2%) for females.
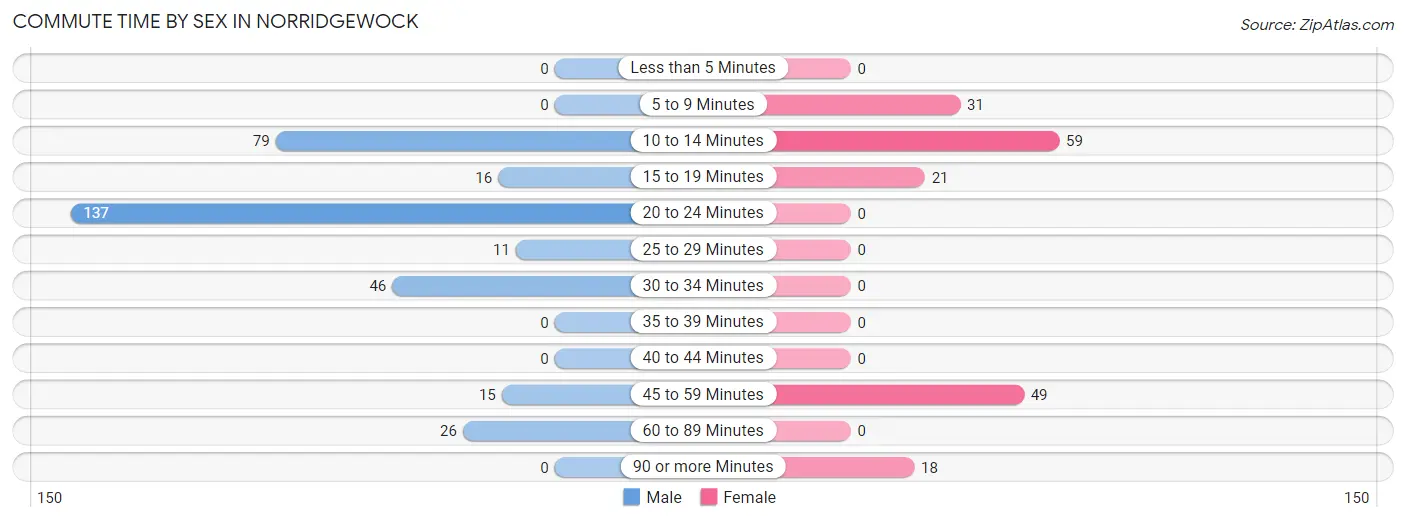
| Commute Time | Male | Female |
| Less than 5 Minutes | 0 (0.0%) | 0 (0.0%) |
| 5 to 9 Minutes | 0 (0.0%) | 31 (17.4%) |
| 10 to 14 Minutes | 79 (23.9%) | 59 (33.2%) |
| 15 to 19 Minutes | 16 (4.9%) | 21 (11.8%) |
| 20 to 24 Minutes | 137 (41.5%) | 0 (0.0%) |
| 25 to 29 Minutes | 11 (3.3%) | 0 (0.0%) |
| 30 to 34 Minutes | 46 (13.9%) | 0 (0.0%) |
| 35 to 39 Minutes | 0 (0.0%) | 0 (0.0%) |
| 40 to 44 Minutes | 0 (0.0%) | 0 (0.0%) |
| 45 to 59 Minutes | 15 (4.5%) | 49 (27.5%) |
| 60 to 89 Minutes | 26 (7.9%) | 0 (0.0%) |
| 90 or more Minutes | 0 (0.0%) | 18 (10.1%) |
Time of Departure to Work by Sex in Norridgewock
The most frequent times of departure to work in Norridgewock are 5:00 AM to 5:29 AM (80, 24.2%) for males and 7:00 AM to 7:29 AM (64, 36.0%) for females.
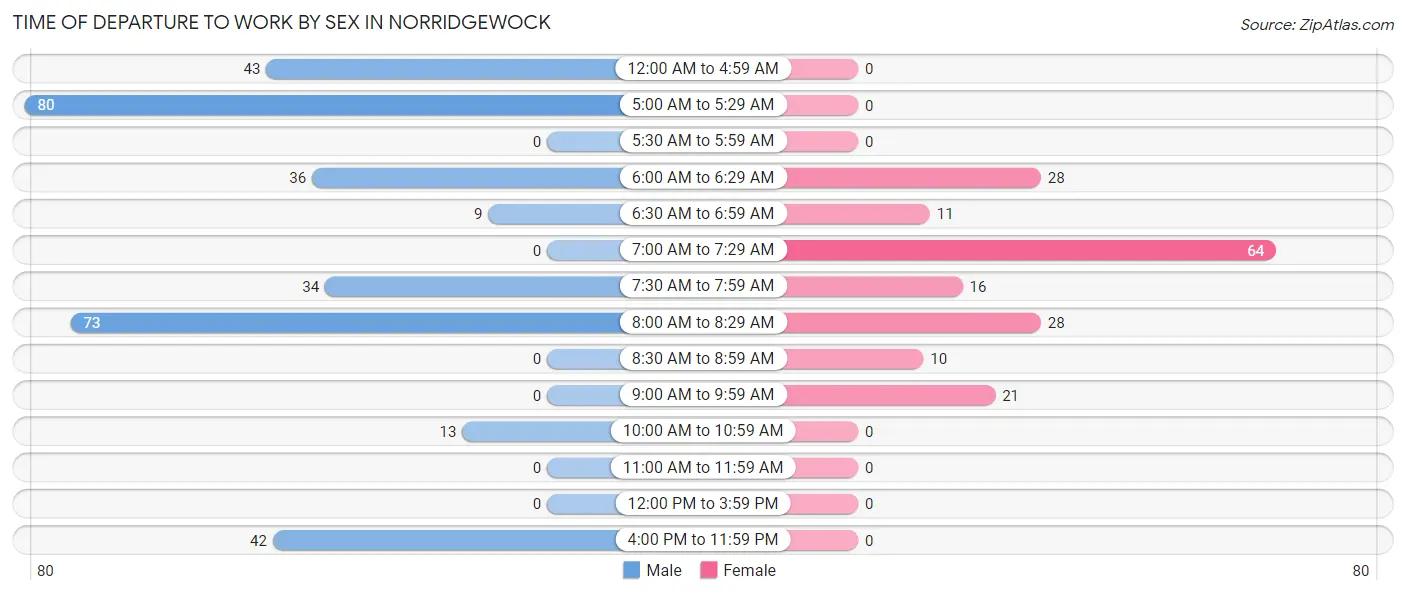
| Time of Departure | Male | Female |
| 12:00 AM to 4:59 AM | 43 (13.0%) | 0 (0.0%) |
| 5:00 AM to 5:29 AM | 80 (24.2%) | 0 (0.0%) |
| 5:30 AM to 5:59 AM | 0 (0.0%) | 0 (0.0%) |
| 6:00 AM to 6:29 AM | 36 (10.9%) | 28 (15.7%) |
| 6:30 AM to 6:59 AM | 9 (2.7%) | 11 (6.2%) |
| 7:00 AM to 7:29 AM | 0 (0.0%) | 64 (36.0%) |
| 7:30 AM to 7:59 AM | 34 (10.3%) | 16 (9.0%) |
| 8:00 AM to 8:29 AM | 73 (22.1%) | 28 (15.7%) |
| 8:30 AM to 8:59 AM | 0 (0.0%) | 10 (5.6%) |
| 9:00 AM to 9:59 AM | 0 (0.0%) | 21 (11.8%) |
| 10:00 AM to 10:59 AM | 13 (3.9%) | 0 (0.0%) |
| 11:00 AM to 11:59 AM | 0 (0.0%) | 0 (0.0%) |
| 12:00 PM to 3:59 PM | 0 (0.0%) | 0 (0.0%) |
| 4:00 PM to 11:59 PM | 42 (12.7%) | 0 (0.0%) |
| Total | 330 (100.0%) | 178 (100.0%) |
Housing Occupancy in Norridgewock
Occupancy by Ownership in Norridgewock
Of the total 548 dwellings in Norridgewock, owner-occupied units account for 425 (77.5%), while renter-occupied units make up 123 (22.5%).
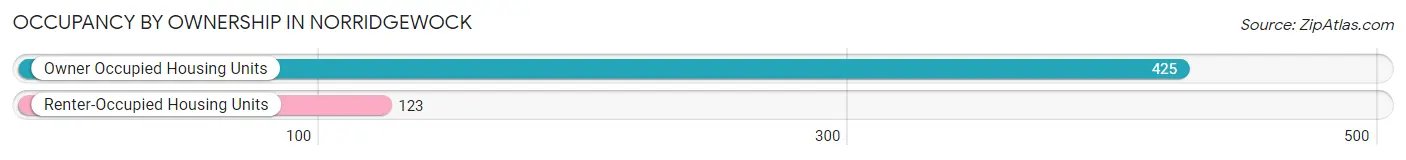
| Occupancy | # Housing Units | % Housing Units |
| Owner Occupied Housing Units | 425 | 77.5% |
| Renter-Occupied Housing Units | 123 | 22.5% |
| Total Occupied Housing Units | 548 | 100.0% |
Occupancy by Household Size in Norridgewock
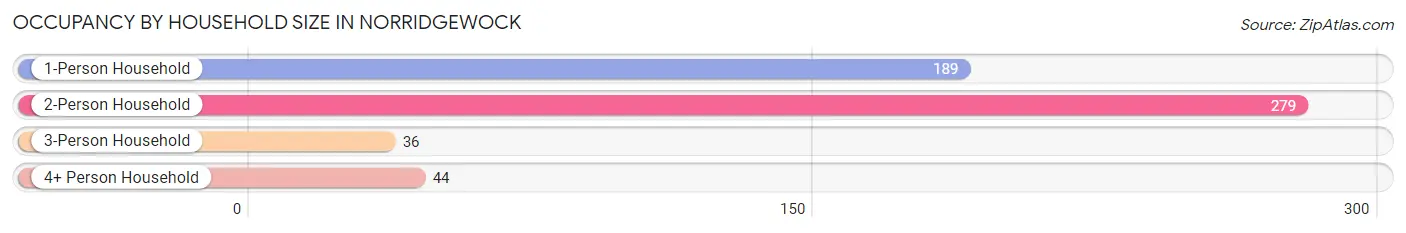
| Household Size | # Housing Units | % Housing Units |
| 1-Person Household | 189 | 34.5% |
| 2-Person Household | 279 | 50.9% |
| 3-Person Household | 36 | 6.6% |
| 4+ Person Household | 44 | 8.0% |
| Total Housing Units | 548 | 100.0% |
Occupancy by Ownership by Household Size in Norridgewock
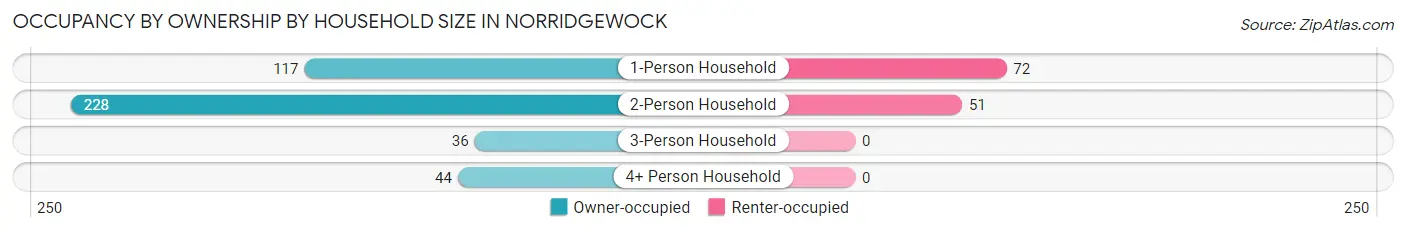
| Household Size | Owner-occupied | Renter-occupied |
| 1-Person Household | 117 (61.9%) | 72 (38.1%) |
| 2-Person Household | 228 (81.7%) | 51 (18.3%) |
| 3-Person Household | 36 (100.0%) | 0 (0.0%) |
| 4+ Person Household | 44 (100.0%) | 0 (0.0%) |
| Total Housing Units | 425 (77.5%) | 123 (22.5%) |
Occupancy by Educational Attainment in Norridgewock
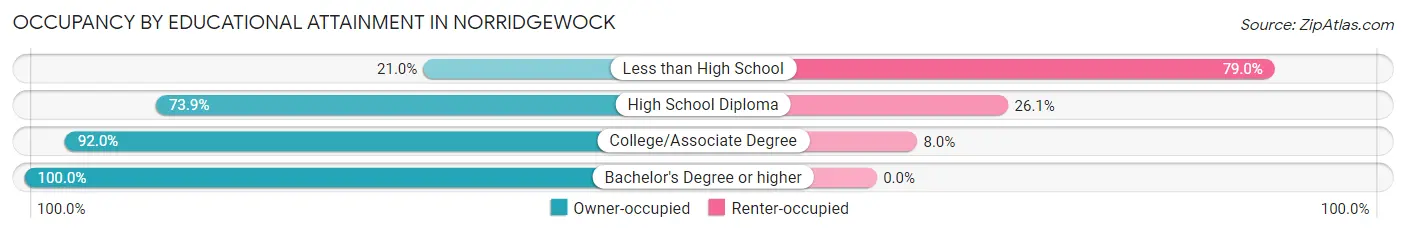
| Household Size | Owner-occupied | Renter-occupied |
| Less than High School | 17 (21.0%) | 64 (79.0%) |
| High School Diploma | 139 (73.9%) | 49 (26.1%) |
| College/Associate Degree | 115 (92.0%) | 10 (8.0%) |
| Bachelor's Degree or higher | 154 (100.0%) | 0 (0.0%) |
Occupancy by Age of Householder in Norridgewock
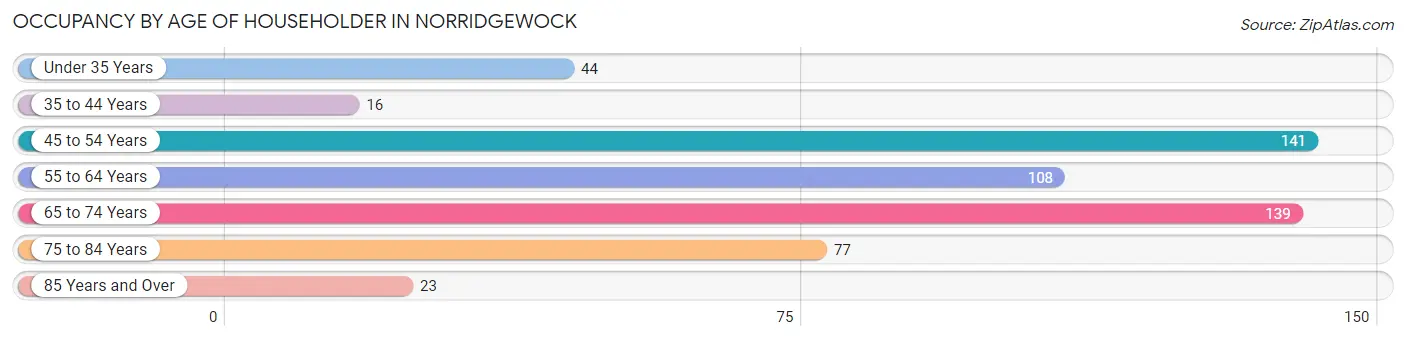
| Age Bracket | # Households | % Households |
| Under 35 Years | 44 | 8.0% |
| 35 to 44 Years | 16 | 2.9% |
| 45 to 54 Years | 141 | 25.7% |
| 55 to 64 Years | 108 | 19.7% |
| 65 to 74 Years | 139 | 25.4% |
| 75 to 84 Years | 77 | 14.1% |
| 85 Years and Over | 23 | 4.2% |
| Total | 548 | 100.0% |
Housing Finances in Norridgewock
Median Income by Occupancy in Norridgewock
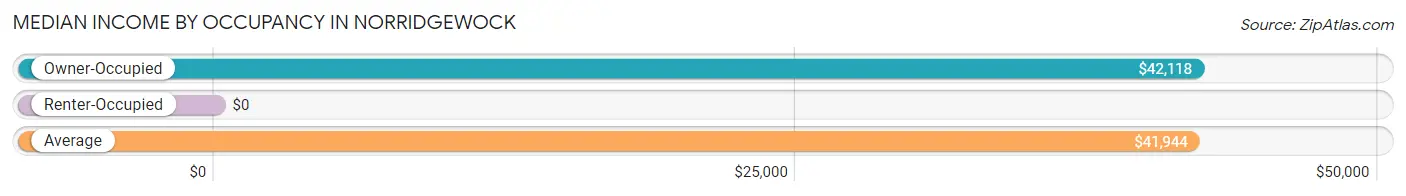
| Occupancy Type | # Households | Median Income |
| Owner-Occupied | 425 (77.5%) | $42,118 |
| Renter-Occupied | 123 (22.5%) | $0 |
| Average | 548 (100.0%) | $41,944 |
Occupancy by Householder Income Bracket in Norridgewock
| Income Bracket | Owner-occupied | Renter-occupied |
| Less than $5,000 | 0 (0.0%) | 57 (46.3%) |
| $5,000 to $9,999 | 11 (2.6%) | 0 (0.0%) |
| $10,000 to $14,999 | 36 (8.5%) | 0 (0.0%) |
| $15,000 to $19,999 | 70 (16.5%) | 0 (0.0%) |
| $20,000 to $24,999 | 52 (12.2%) | 0 (0.0%) |
| $25,000 to $34,999 | 13 (3.1%) | 7 (5.7%) |
| $35,000 to $49,999 | 36 (8.5%) | 15 (12.2%) |
| $50,000 to $74,999 | 87 (20.5%) | 34 (27.6%) |
| $75,000 to $99,999 | 29 (6.8%) | 10 (8.1%) |
| $100,000 to $149,999 | 42 (9.9%) | 0 (0.0%) |
| $150,000 or more | 49 (11.5%) | 0 (0.0%) |
| Total | 425 (100.0%) | 123 (100.0%) |
Monthly Housing Cost Tiers in Norridgewock
| Monthly Cost | Owner-occupied | Renter-occupied |
| Less than $300 | 22 (5.2%) | 0 (0.0%) |
| $300 to $499 | 110 (25.9%) | 0 (0.0%) |
| $500 to $799 | 148 (34.8%) | 0 (0.0%) |
| $800 to $999 | 9 (2.1%) | 41 (33.3%) |
| $1,000 to $1,499 | 92 (21.6%) | 10 (8.1%) |
| $1,500 to $1,999 | 44 (10.3%) | 15 (12.2%) |
| $2,000 to $2,499 | 0 (0.0%) | 0 (0.0%) |
| $2,500 to $2,999 | 0 (0.0%) | 0 (0.0%) |
| $3,000 or more | 0 (0.0%) | 0 (0.0%) |
| Total | 425 (100.0%) | 123 (100.0%) |
Physical Housing Characteristics in Norridgewock
Housing Structures in Norridgewock
| Structure Type | # Housing Units | % Housing Units |
| Single Unit, Detached | 344 | 62.8% |
| Single Unit, Attached | 0 | 0.0% |
| 2 Unit Apartments | 0 | 0.0% |
| 3 or 4 Unit Apartments | 15 | 2.7% |
| 5 to 9 Unit Apartments | 0 | 0.0% |
| 10 or more Apartments | 21 | 3.8% |
| Mobile Home / Other | 168 | 30.7% |
| Total | 548 | 100.0% |
Housing Structures by Occupancy in Norridgewock
| Structure Type | Owner-occupied | Renter-occupied |
| Single Unit, Detached | 300 (87.2%) | 44 (12.8%) |
| Single Unit, Attached | 0 (0.0%) | 0 (0.0%) |
| 2 Unit Apartments | 0 (0.0%) | 0 (0.0%) |
| 3 or 4 Unit Apartments | 0 (0.0%) | 15 (100.0%) |
| 5 to 9 Unit Apartments | 0 (0.0%) | 0 (0.0%) |
| 10 or more Apartments | 21 (100.0%) | 0 (0.0%) |
| Mobile Home / Other | 104 (61.9%) | 64 (38.1%) |
| Total | 425 (77.5%) | 123 (22.5%) |
Housing Structures by Number of Rooms in Norridgewock
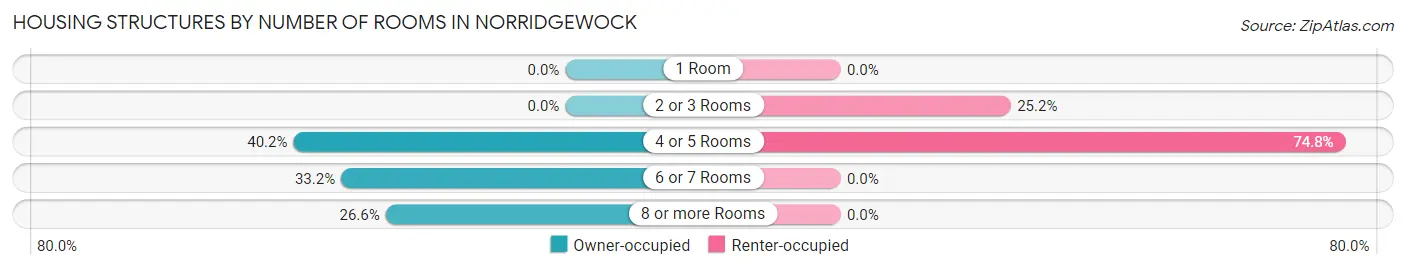
| Number of Rooms | Owner-occupied | Renter-occupied |
| 1 Room | 0 (0.0%) | 0 (0.0%) |
| 2 or 3 Rooms | 0 (0.0%) | 31 (25.2%) |
| 4 or 5 Rooms | 171 (40.2%) | 92 (74.8%) |
| 6 or 7 Rooms | 141 (33.2%) | 0 (0.0%) |
| 8 or more Rooms | 113 (26.6%) | 0 (0.0%) |
| Total | 425 (100.0%) | 123 (100.0%) |
Housing Structure by Heating Type in Norridgewock
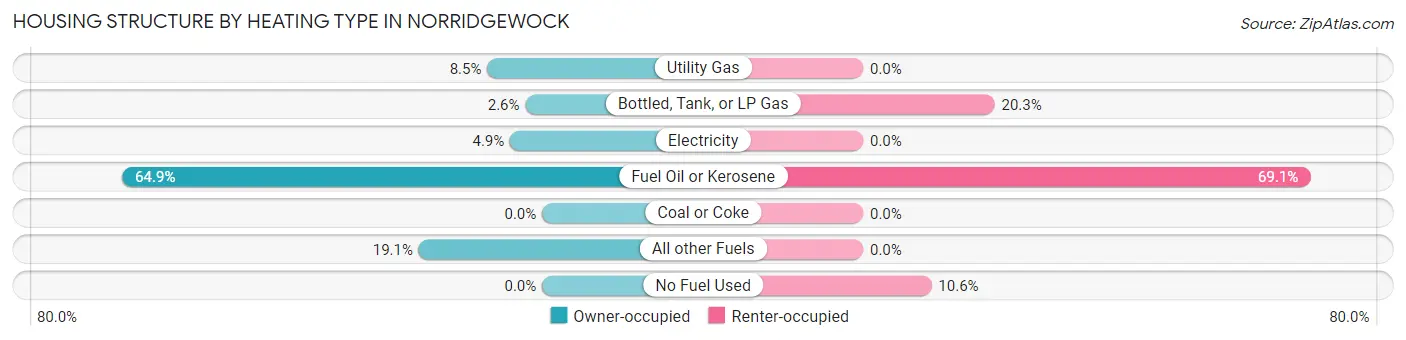
| Heating Type | Owner-occupied | Renter-occupied |
| Utility Gas | 36 (8.5%) | 0 (0.0%) |
| Bottled, Tank, or LP Gas | 11 (2.6%) | 25 (20.3%) |
| Electricity | 21 (4.9%) | 0 (0.0%) |
| Fuel Oil or Kerosene | 276 (64.9%) | 85 (69.1%) |
| Coal or Coke | 0 (0.0%) | 0 (0.0%) |
| All other Fuels | 81 (19.1%) | 0 (0.0%) |
| No Fuel Used | 0 (0.0%) | 13 (10.6%) |
| Total | 425 (100.0%) | 123 (100.0%) |
Household Vehicle Usage in Norridgewock
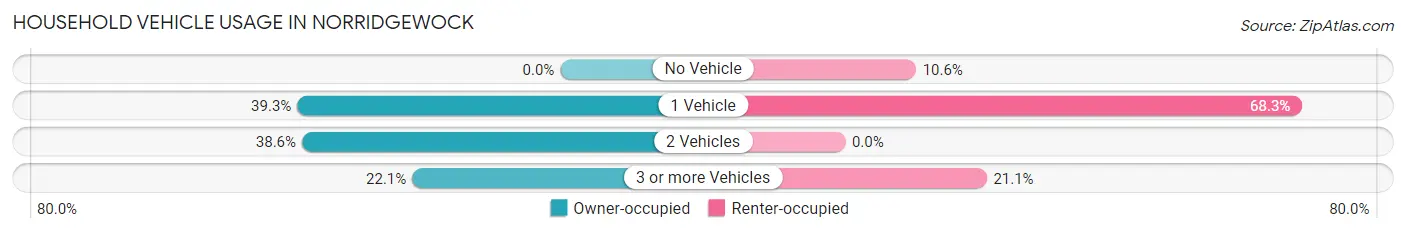
| Vehicles per Household | Owner-occupied | Renter-occupied |
| No Vehicle | 0 (0.0%) | 13 (10.6%) |
| 1 Vehicle | 167 (39.3%) | 84 (68.3%) |
| 2 Vehicles | 164 (38.6%) | 0 (0.0%) |
| 3 or more Vehicles | 94 (22.1%) | 26 (21.1%) |
| Total | 425 (100.0%) | 123 (100.0%) |
Real Estate & Mortgages in Norridgewock
Real Estate and Mortgage Overview in Norridgewock
| Characteristic | Without Mortgage | With Mortgage |
| Housing Units | 280 | 145 |
| Median Property Value | $183,100 | $172,100 |
| Median Household Income | - | - |
| Monthly Housing Costs | $512 | $0 |
| Real Estate Taxes | $2,312 | $0 |
Property Value by Mortgage Status in Norridgewock
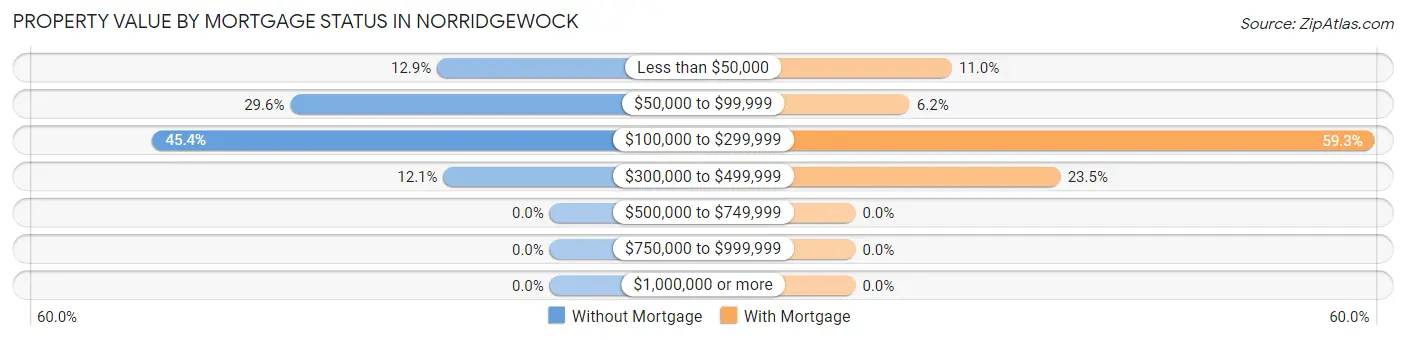
| Property Value | Without Mortgage | With Mortgage |
| Less than $50,000 | 36 (12.9%) | 16 (11.0%) |
| $50,000 to $99,999 | 83 (29.6%) | 9 (6.2%) |
| $100,000 to $299,999 | 127 (45.4%) | 86 (59.3%) |
| $300,000 to $499,999 | 34 (12.1%) | 34 (23.4%) |
| $500,000 to $749,999 | 0 (0.0%) | 0 (0.0%) |
| $750,000 to $999,999 | 0 (0.0%) | 0 (0.0%) |
| $1,000,000 or more | 0 (0.0%) | 0 (0.0%) |
| Total | 280 (100.0%) | 145 (100.0%) |
Household Income by Mortgage Status in Norridgewock
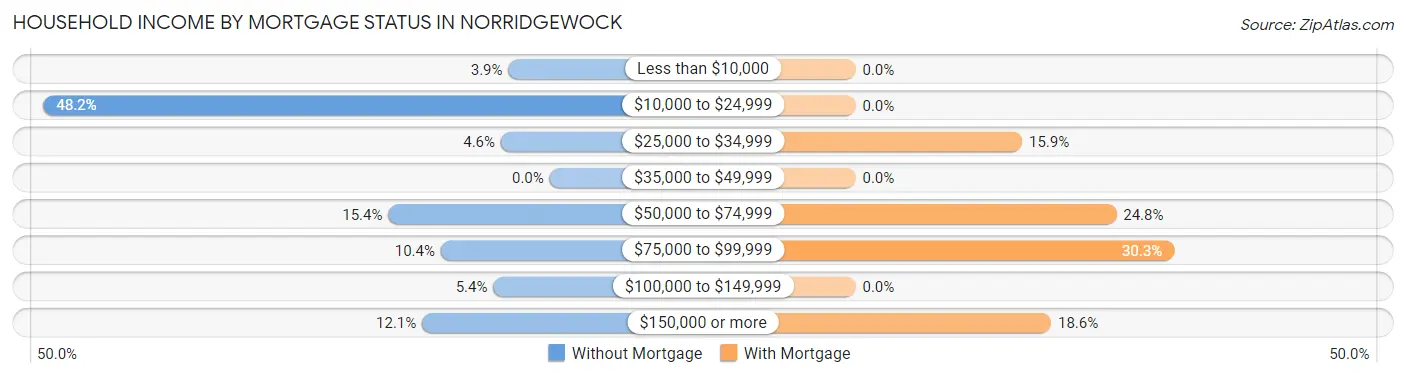
| Household Income | Without Mortgage | With Mortgage |
| Less than $10,000 | 11 (3.9%) | 0 (0.0%) |
| $10,000 to $24,999 | 135 (48.2%) | 0 (0.0%) |
| $25,000 to $34,999 | 13 (4.6%) | 23 (15.9%) |
| $35,000 to $49,999 | 0 (0.0%) | 0 (0.0%) |
| $50,000 to $74,999 | 43 (15.4%) | 36 (24.8%) |
| $75,000 to $99,999 | 29 (10.4%) | 44 (30.3%) |
| $100,000 to $149,999 | 15 (5.4%) | 0 (0.0%) |
| $150,000 or more | 34 (12.1%) | 27 (18.6%) |
| Total | 280 (100.0%) | 145 (100.0%) |
Property Value to Household Income Ratio in Norridgewock
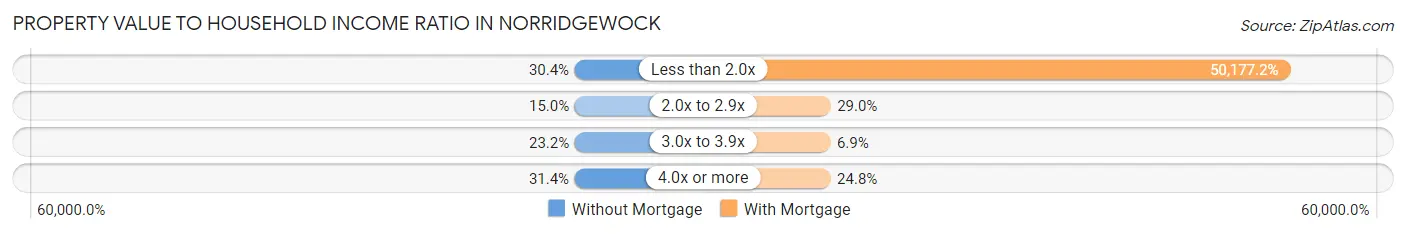
| Value-to-Income Ratio | Without Mortgage | With Mortgage |
| Less than 2.0x | 85 (30.4%) | 72,757 (50,177.2%) |
| 2.0x to 2.9x | 42 (15.0%) | 42 (29.0%) |
| 3.0x to 3.9x | 65 (23.2%) | 10 (6.9%) |
| 4.0x or more | 88 (31.4%) | 36 (24.8%) |
| Total | 280 (100.0%) | 145 (100.0%) |
Real Estate Taxes by Mortgage Status in Norridgewock
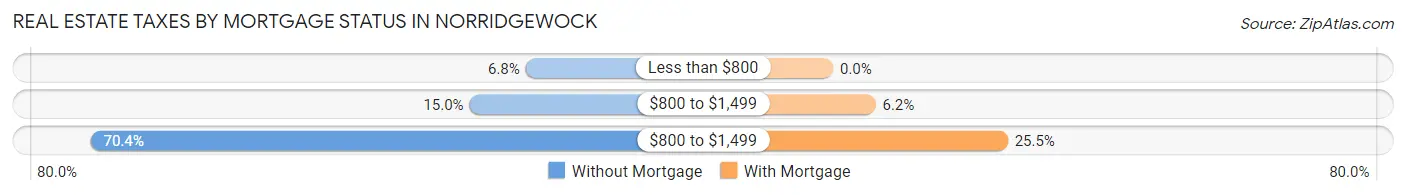
| Property Taxes | Without Mortgage | With Mortgage |
| Less than $800 | 19 (6.8%) | 0 (0.0%) |
| $800 to $1,499 | 42 (15.0%) | 9 (6.2%) |
| $800 to $1,499 | 197 (70.4%) | 37 (25.5%) |
| Total | 280 (100.0%) | 145 (100.0%) |
Health & Disability in Norridgewock
Health Insurance Coverage by Age in Norridgewock
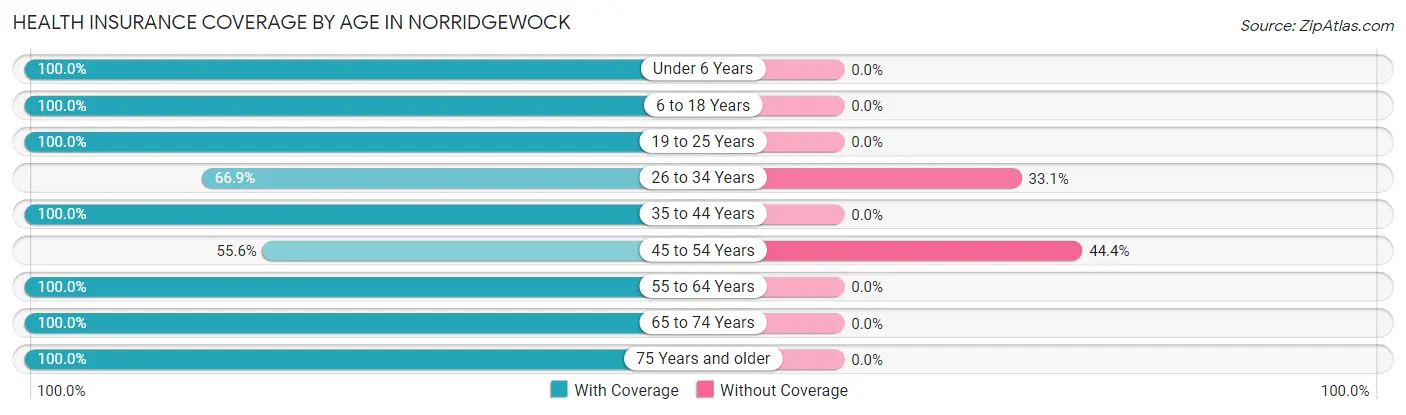
| Age Bracket | With Coverage | Without Coverage |
| Under 6 Years | 106 (100.0%) | 0 (0.0%) |
| 6 to 18 Years | 47 (100.0%) | 0 (0.0%) |
| 19 to 25 Years | 88 (100.0%) | 0 (0.0%) |
| 26 to 34 Years | 83 (66.9%) | 41 (33.1%) |
| 35 to 44 Years | 36 (100.0%) | 0 (0.0%) |
| 45 to 54 Years | 109 (55.6%) | 87 (44.4%) |
| 55 to 64 Years | 164 (100.0%) | 0 (0.0%) |
| 65 to 74 Years | 182 (100.0%) | 0 (0.0%) |
| 75 Years and older | 156 (100.0%) | 0 (0.0%) |
| Total | 971 (88.3%) | 128 (11.7%) |
Health Insurance Coverage by Citizenship Status in Norridgewock
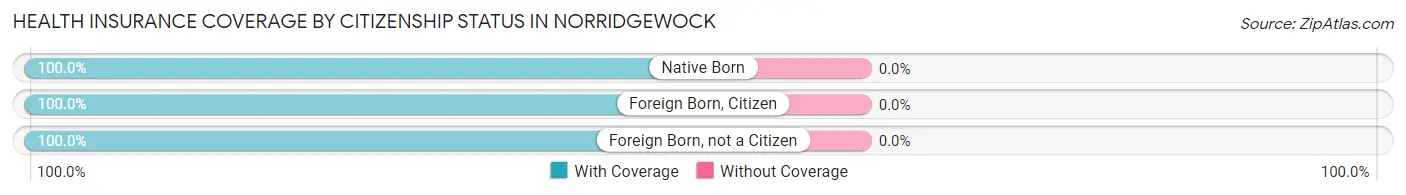
| Citizenship Status | With Coverage | Without Coverage |
| Native Born | 106 (100.0%) | 0 (0.0%) |
| Foreign Born, Citizen | 47 (100.0%) | 0 (0.0%) |
| Foreign Born, not a Citizen | 88 (100.0%) | 0 (0.0%) |
Health Insurance Coverage by Household Income in Norridgewock
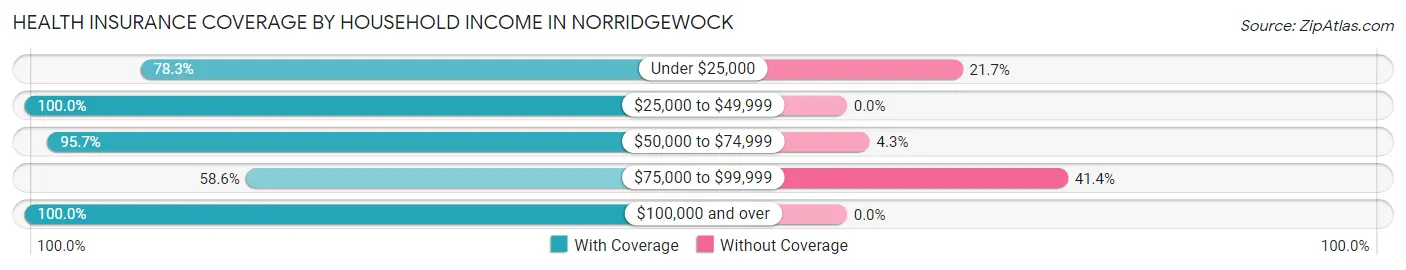
| Household Income | With Coverage | Without Coverage |
| Under $25,000 | 256 (78.3%) | 71 (21.7%) |
| $25,000 to $49,999 | 106 (100.0%) | 0 (0.0%) |
| $50,000 to $74,999 | 358 (95.7%) | 16 (4.3%) |
| $75,000 to $99,999 | 58 (58.6%) | 41 (41.4%) |
| $100,000 and over | 193 (100.0%) | 0 (0.0%) |
Public vs Private Health Insurance Coverage by Age in Norridgewock
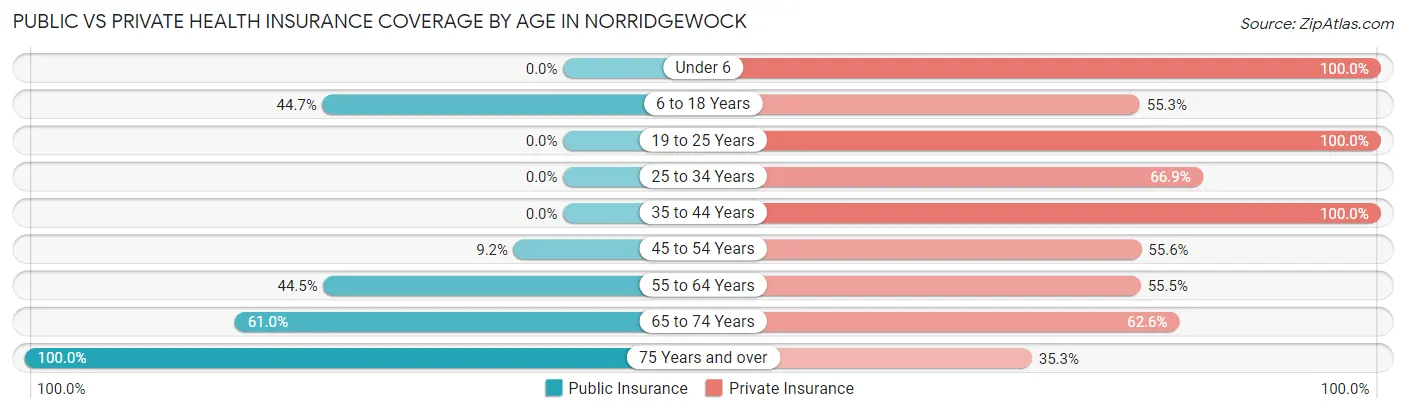
| Age Bracket | Public Insurance | Private Insurance |
| Under 6 | 0 (0.0%) | 106 (100.0%) |
| 6 to 18 Years | 21 (44.7%) | 26 (55.3%) |
| 19 to 25 Years | 0 (0.0%) | 88 (100.0%) |
| 25 to 34 Years | 0 (0.0%) | 83 (66.9%) |
| 35 to 44 Years | 0 (0.0%) | 36 (100.0%) |
| 45 to 54 Years | 18 (9.2%) | 109 (55.6%) |
| 55 to 64 Years | 73 (44.5%) | 91 (55.5%) |
| 65 to 74 Years | 111 (61.0%) | 114 (62.6%) |
| 75 Years and over | 156 (100.0%) | 55 (35.3%) |
| Total | 379 (34.5%) | 708 (64.4%) |
Disability Status by Sex by Age in Norridgewock
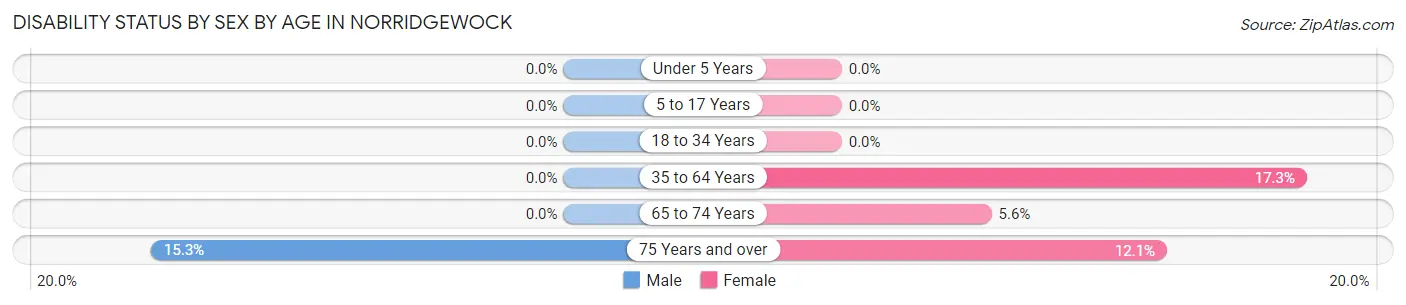
| Age Bracket | Male | Female |
| Under 5 Years | 0 (0.0%) | 0 (0.0%) |
| 5 to 17 Years | 0 (0.0%) | 0 (0.0%) |
| 18 to 34 Years | 0 (0.0%) | 0 (0.0%) |
| 35 to 64 Years | 0 (0.0%) | 34 (17.3%) |
| 65 to 74 Years | 0 (0.0%) | 7 (5.6%) |
| 75 Years and over | 15 (15.3%) | 7 (12.1%) |
Disability Class by Sex by Age in Norridgewock
Disability Class: Hearing Difficulty
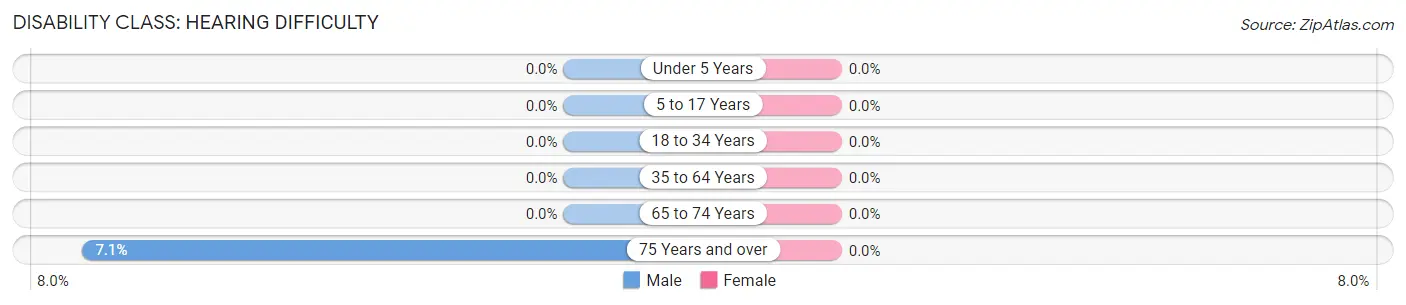
| Age Bracket | Male | Female |
| Under 5 Years | 0 (0.0%) | 0 (0.0%) |
| 5 to 17 Years | 0 (0.0%) | 0 (0.0%) |
| 18 to 34 Years | 0 (0.0%) | 0 (0.0%) |
| 35 to 64 Years | 0 (0.0%) | 0 (0.0%) |
| 65 to 74 Years | 0 (0.0%) | 0 (0.0%) |
| 75 Years and over | 7 (7.1%) | 0 (0.0%) |
Disability Class: Vision Difficulty
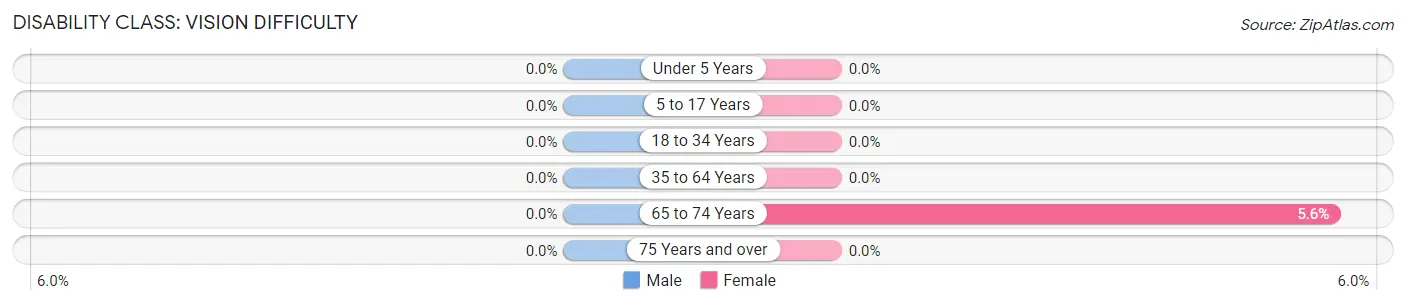
| Age Bracket | Male | Female |
| Under 5 Years | 0 (0.0%) | 0 (0.0%) |
| 5 to 17 Years | 0 (0.0%) | 0 (0.0%) |
| 18 to 34 Years | 0 (0.0%) | 0 (0.0%) |
| 35 to 64 Years | 0 (0.0%) | 0 (0.0%) |
| 65 to 74 Years | 0 (0.0%) | 7 (5.6%) |
| 75 Years and over | 0 (0.0%) | 0 (0.0%) |
Disability Class: Cognitive Difficulty
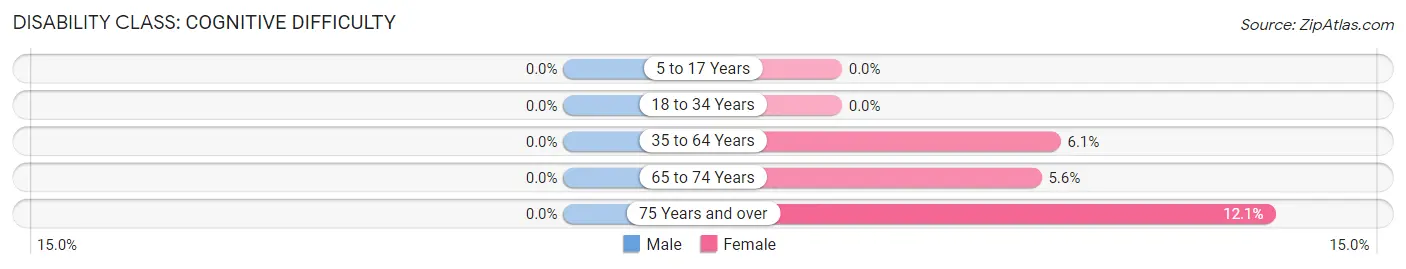
| Age Bracket | Male | Female |
| 5 to 17 Years | 0 (0.0%) | 0 (0.0%) |
| 18 to 34 Years | 0 (0.0%) | 0 (0.0%) |
| 35 to 64 Years | 0 (0.0%) | 12 (6.1%) |
| 65 to 74 Years | 0 (0.0%) | 7 (5.6%) |
| 75 Years and over | 0 (0.0%) | 7 (12.1%) |
Disability Class: Ambulatory Difficulty
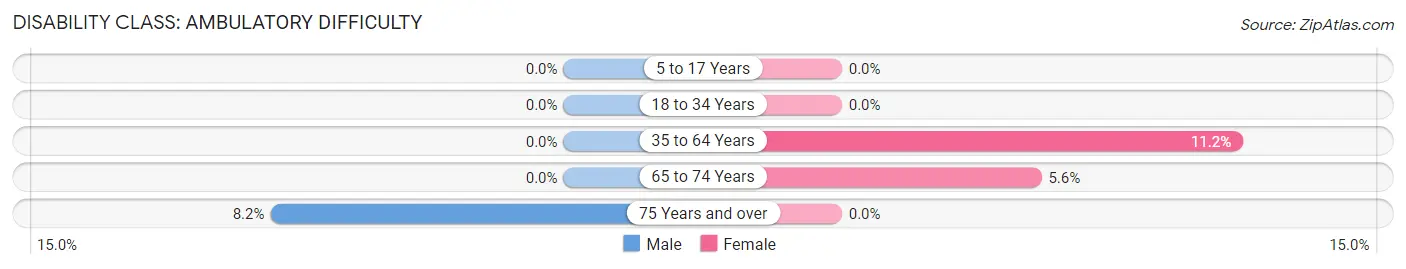
| Age Bracket | Male | Female |
| 5 to 17 Years | 0 (0.0%) | 0 (0.0%) |
| 18 to 34 Years | 0 (0.0%) | 0 (0.0%) |
| 35 to 64 Years | 0 (0.0%) | 22 (11.2%) |
| 65 to 74 Years | 0 (0.0%) | 7 (5.6%) |
| 75 Years and over | 8 (8.2%) | 0 (0.0%) |
Disability Class: Self-Care Difficulty
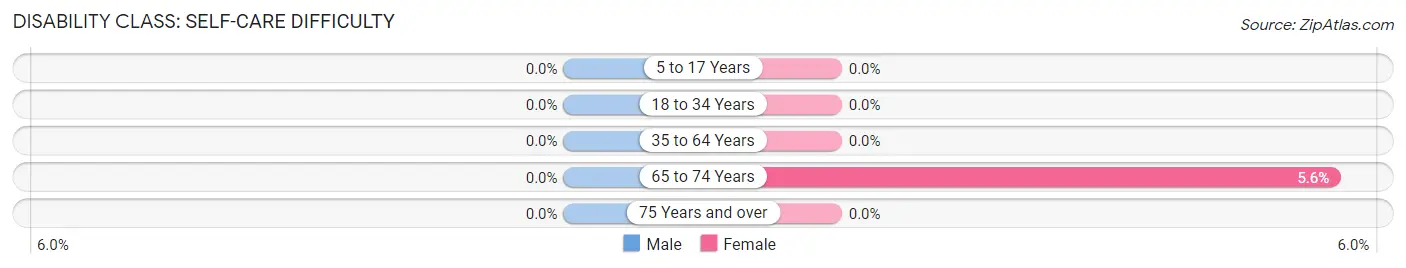
| Age Bracket | Male | Female |
| 5 to 17 Years | 0 (0.0%) | 0 (0.0%) |
| 18 to 34 Years | 0 (0.0%) | 0 (0.0%) |
| 35 to 64 Years | 0 (0.0%) | 0 (0.0%) |
| 65 to 74 Years | 0 (0.0%) | 7 (5.6%) |
| 75 Years and over | 0 (0.0%) | 0 (0.0%) |
Technology Access in Norridgewock
Computing Device Access in Norridgewock
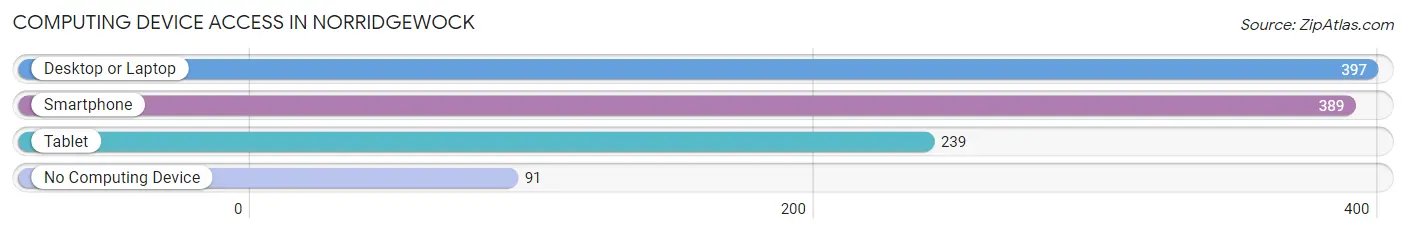
| Device Type | # Households | % Households |
| Desktop or Laptop | 397 | 72.5% |
| Smartphone | 389 | 71.0% |
| Tablet | 239 | 43.6% |
| No Computing Device | 91 | 16.6% |
| Total | 548 | 100.0% |
Internet Access in Norridgewock
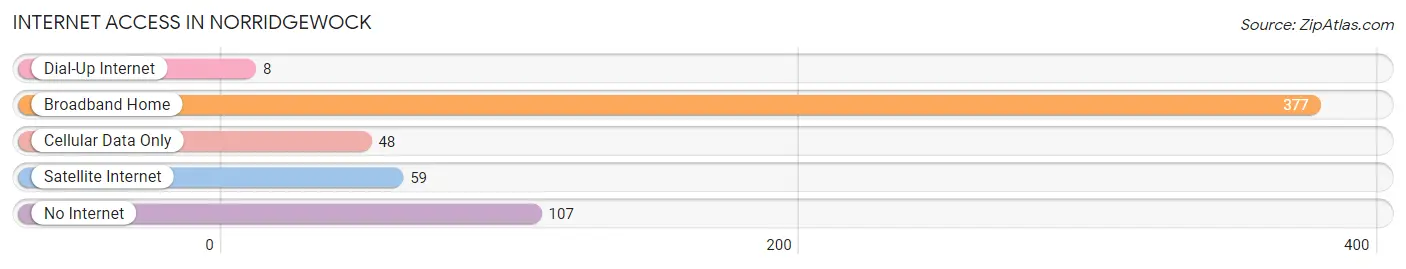
| Internet Type | # Households | % Households |
| Dial-Up Internet | 8 | 1.5% |
| Broadband Home | 377 | 68.8% |
| Cellular Data Only | 48 | 8.8% |
| Satellite Internet | 59 | 10.8% |
| No Internet | 107 | 19.5% |
| Total | 548 | 100.0% |
Norridgewock Summary
Norridgewock is a town located in Somerset County, Maine, United States. The population was 2,719 at the 2010 census. It is part of the Portland–South Portland–Biddeford, Maine metropolitan statistical area.
History
Norridgewock was first settled in 1771 by settlers from Massachusetts. The town was named after the Norridgewock Indians, a tribe of the Abenaki people who lived in the area. The town was incorporated in 1788.
In 1724, the Norridgewock Indians were visited by the Jesuit missionary Father Sebastian Rale. He established a mission in the area and was killed by the English in 1724 during the Father Rale's War.
In 1775, during the American Revolutionary War, the town was attacked by a British force led by Colonel Benedict Arnold. The attack was unsuccessful and the town was spared from destruction.
Geography
Norridgewock is located at 44°37′N 69°59′W (44.619, -69.983). According to the United States Census Bureau, the town has a total area of 33.2 square miles (86.1 km2), of which 32.9 square miles (85.2 km2) is land and 0.3 square miles (0.8 km2) is water.
The town is drained by the Kennebec River. The town is crossed by Interstate 95, U.S. Route 2, and Maine State Route 8.
Demographics
As of the census of 2000, there were 2,719 people, 1,072 households, and 745 families residing in the town. The population density was 82.6 people per square mile (31.9/km2). There were 1,164 housing units at an average density of 35.3 per square mile (13.6/km2). The racial makeup of the town was 97.90% White, 0.07% African American, 0.37% Native American, 0.37% Asian, 0.07% Pacific Islander, 0.22% from other races, and 1.00% from two or more races. Hispanic or Latino of any race were 0.37% of the population.
There were 1,072 households, out of which 33.2% had children under the age of 18 living with them, 56.2% were married couples living together, 9.7% had a female householder with no husband present, and 29.7% were non-families. 24.2% of all households were made up of individuals, and 11.2% had someone living alone who was 65 years of age or older. The average household size was 2.53 and the average family size was 3.00.
In the town, the population was spread out, with 25.9% under the age of 18, 7.2% from 18 to 24, 28.7% from 25 to 44, 24.2% from 45 to 64, and 14.0% who were 65 years of age or older. The median age was 38 years. For every 100 females, there were 97.2 males. For every 100 females age 18 and over, there were 94.2 males.
The median income for a household in the town was $35,938, and the median income for a family was $41,964. Males had a median income of $31,250 versus $22,500 for females. The per capita income for the town was $17,845. About 8.2% of families and 10.3% of the population were below the poverty line, including 13.2% of those under age 18 and 8.2% of those age 65 or over.
Economy
The economy of Norridgewock is largely based on agriculture and forestry. The town is home to several farms, including dairy farms, vegetable farms, and apple orchards. The town is also home to several sawmills and wood-processing plants.
The town is also home to several small businesses, including restaurants, retail stores, and service businesses. The town is also home to several manufacturing companies, including a paper mill and a plastics factory.
The town is served by the Somerset County Airport, which is located just outside of town. The airport offers daily flights to Portland, Maine.
Common Questions
What is Per Capita Income in Norridgewock?
Per Capita income in Norridgewock is $56,236.
What is the Median Family Income in Norridgewock?
Median Family Income in Norridgewock is $71,786.
What is the Median Household income in Norridgewock?
Median Household Income in Norridgewock is $41,944.
What is Income or Wage Gap in Norridgewock?
Income or Wage Gap in Norridgewock is 58.5%.
Women in Norridgewock earn 41.5 cents for every dollar earned by a man.
What is Inequality or Gini Index in Norridgewock?
Inequality or Gini Index in Norridgewock is 0.70.
What is the Total Population of Norridgewock?
Total Population of Norridgewock is 1,099.
What is the Total Male Population of Norridgewock?
Total Male Population of Norridgewock is 627.
What is the Total Female Population of Norridgewock?
Total Female Population of Norridgewock is 472.
What is the Ratio of Males per 100 Females in Norridgewock?
There are 132.84 Males per 100 Females in Norridgewock.
What is the Ratio of Females per 100 Males in Norridgewock?
There are 75.28 Females per 100 Males in Norridgewock.
What is the Median Population Age in Norridgewock?
Median Population Age in Norridgewock is 51.8 Years.
What is the Average Family Size in Norridgewock
Average Family Size in Norridgewock is 2.6 People.
What is the Average Household Size in Norridgewock
Average Household Size in Norridgewock is 2.0 People.
How Large is the Labor Force in Norridgewock?
There are 574 People in the Labor Forcein in Norridgewock.
What is the Percentage of People in the Labor Force in Norridgewock?
58.7% of People are in the Labor Force in Norridgewock.