Kennebunk, ME Map & Demographics
Kennebunk Map
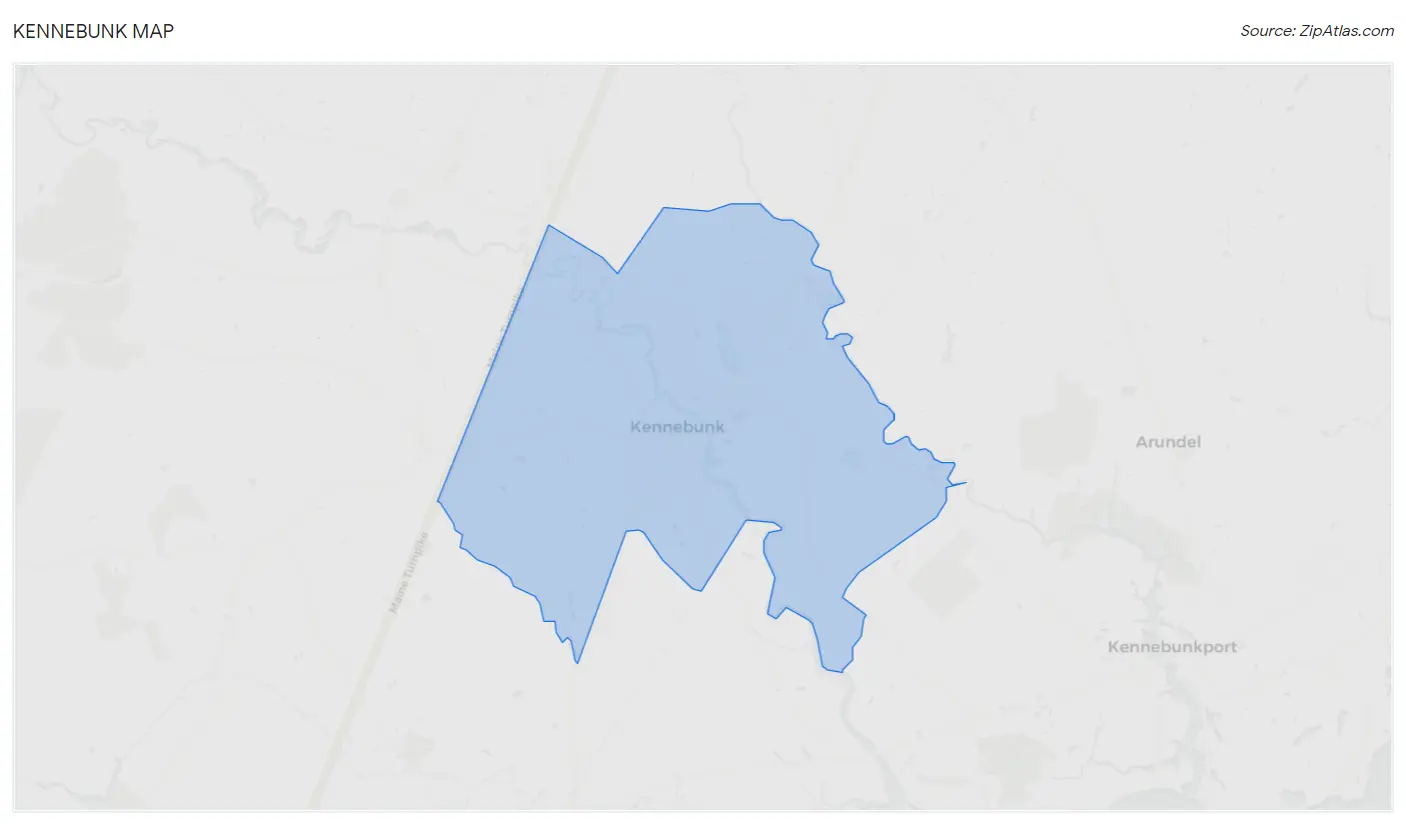
Kennebunk Overview
$43,741
PER CAPITA INCOME
$101,176
AVG FAMILY INCOME
$88,996
AVG HOUSEHOLD INCOME
29.9%
WAGE / INCOME GAP [ % ]
70.1¢/ $1
WAGE / INCOME GAP [ $ ]
0.36
INEQUALITY / GINI INDEX
6,000
TOTAL POPULATION
2,939
MALE POPULATION
3,061
FEMALE POPULATION
96.01
MALES / 100 FEMALES
104.15
FEMALES / 100 MALES
55.1
MEDIAN AGE
2.4
AVG FAMILY SIZE
2.0
AVG HOUSEHOLD SIZE
2,918
LABOR FORCE [ PEOPLE ]
57.7%
PERCENT IN LABOR FORCE
6.5%
UNEMPLOYMENT RATE
Kennebunk Zip Codes
Kennebunk Area Codes
Income in Kennebunk
Income Overview in Kennebunk
Per Capita Income in Kennebunk is $43,741, while median incomes of families and households are $101,176 and $88,996 respectively.
| Characteristic | Number | Measure |
| Per Capita Income | 6,000 | $43,741 |
| Median Family Income | 1,811 | $101,176 |
| Mean Family Income | 1,811 | $112,773 |
| Median Household Income | 2,835 | $88,996 |
| Mean Household Income | 2,835 | $92,226 |
| Income Deficit | 1,811 | $0 |
| Wage / Income Gap (%) | 6,000 | 29.88% |
| Wage / Income Gap ($) | 6,000 | 70.12¢ per $1 |
| Gini / Inequality Index | 6,000 | 0.36 |
Earnings by Sex in Kennebunk
Average Earnings in Kennebunk are $41,154, $50,500 for men and $35,411 for women, a difference of 29.9%.
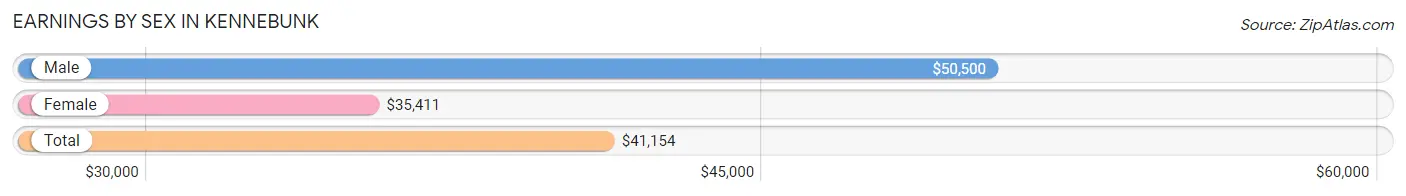
| Sex | Number | Average Earnings |
| Male | 1,384 (45.6%) | $50,500 |
| Female | 1,649 (54.4%) | $35,411 |
| Total | 3,033 (100.0%) | $41,154 |
Earnings by Sex by Income Bracket in Kennebunk
The most common earnings brackets in Kennebunk are $100,000+ for men (371 | 26.8%) and $30,000 to $34,999 for women (288 | 17.5%).
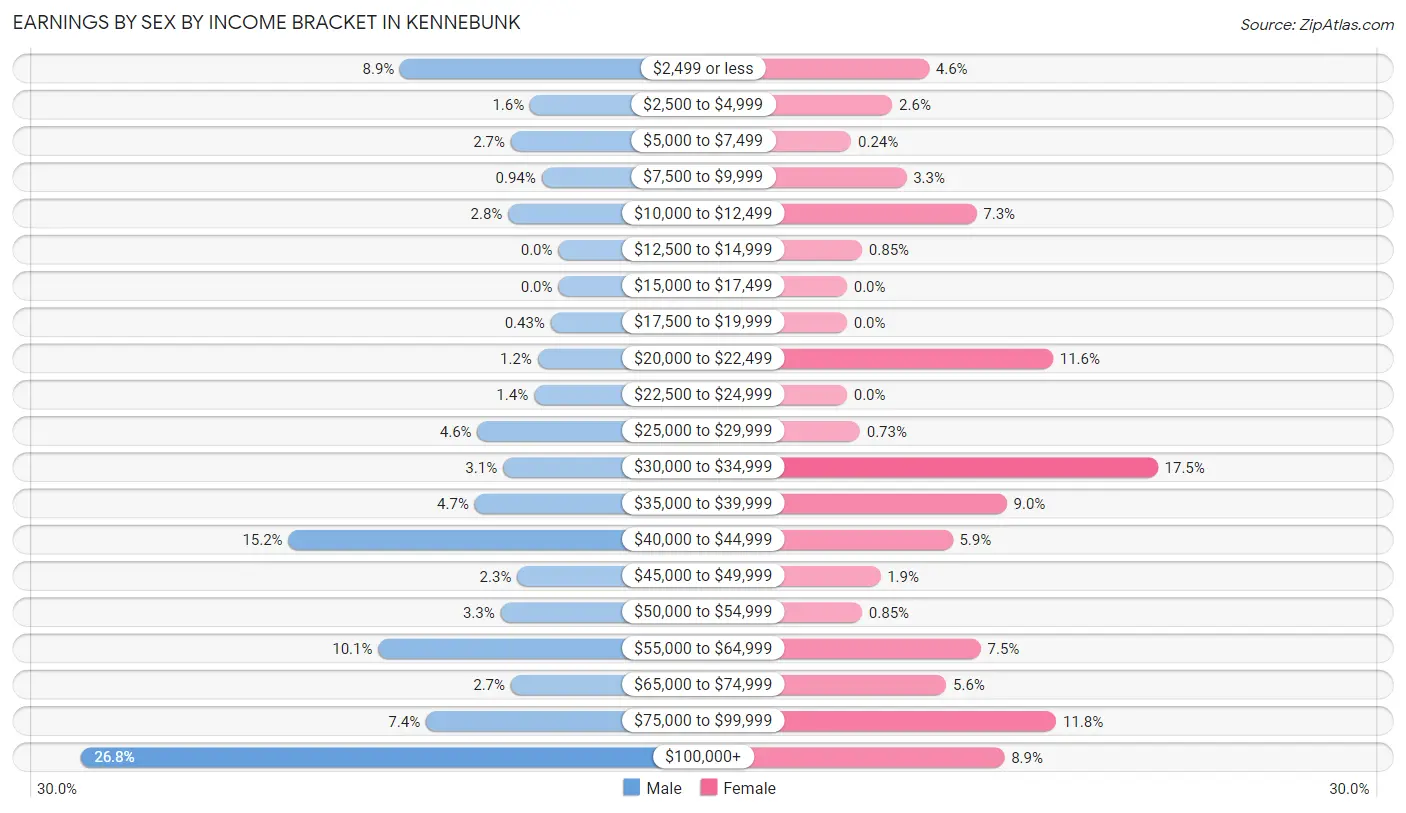
| Income | Male | Female |
| $2,499 or less | 123 (8.9%) | 76 (4.6%) |
| $2,500 to $4,999 | 22 (1.6%) | 42 (2.5%) |
| $5,000 to $7,499 | 37 (2.7%) | 4 (0.2%) |
| $7,500 to $9,999 | 13 (0.9%) | 55 (3.3%) |
| $10,000 to $12,499 | 39 (2.8%) | 120 (7.3%) |
| $12,500 to $14,999 | 0 (0.0%) | 14 (0.9%) |
| $15,000 to $17,499 | 0 (0.0%) | 0 (0.0%) |
| $17,500 to $19,999 | 6 (0.4%) | 0 (0.0%) |
| $20,000 to $22,499 | 16 (1.2%) | 191 (11.6%) |
| $22,500 to $24,999 | 19 (1.4%) | 0 (0.0%) |
| $25,000 to $29,999 | 63 (4.5%) | 12 (0.7%) |
| $30,000 to $34,999 | 43 (3.1%) | 288 (17.5%) |
| $35,000 to $39,999 | 65 (4.7%) | 148 (9.0%) |
| $40,000 to $44,999 | 210 (15.2%) | 98 (5.9%) |
| $45,000 to $49,999 | 32 (2.3%) | 31 (1.9%) |
| $50,000 to $54,999 | 45 (3.3%) | 14 (0.9%) |
| $55,000 to $64,999 | 140 (10.1%) | 124 (7.5%) |
| $65,000 to $74,999 | 37 (2.7%) | 92 (5.6%) |
| $75,000 to $99,999 | 103 (7.4%) | 194 (11.8%) |
| $100,000+ | 371 (26.8%) | 146 (8.8%) |
| Total | 1,384 (100.0%) | 1,649 (100.0%) |
Earnings by Sex by Educational Attainment in Kennebunk
Average earnings in Kennebunk are $55,833 for men and $36,186 for women, a difference of 35.2%. Men with an educational attainment of graduate degree enjoy the highest average annual earnings of $117,808, while those with college or associate's degree education earn the least with $41,360. Women with an educational attainment of graduate degree earn the most with the average annual earnings of $55,781, while those with college or associate's degree education have the smallest earnings of $35,000.
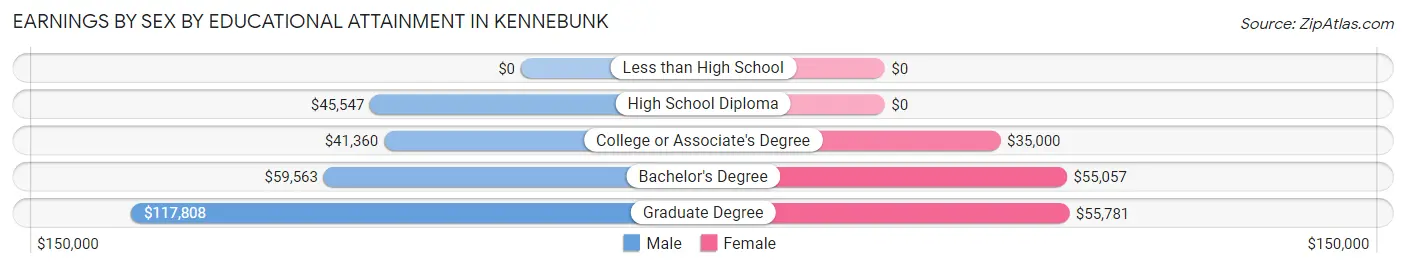
| Educational Attainment | Male Income | Female Income |
| Less than High School | - | - |
| High School Diploma | $45,547 | $0 |
| College or Associate's Degree | $41,360 | $35,000 |
| Bachelor's Degree | $59,563 | $55,057 |
| Graduate Degree | $117,808 | $55,781 |
| Total | $55,833 | $36,186 |
Family Income in Kennebunk
Family Income Brackets in Kennebunk
According to the Kennebunk family income data, there are 710 families falling into the $100,000 to $149,999 income range, which is the most common income bracket and makes up 39.2% of all families.
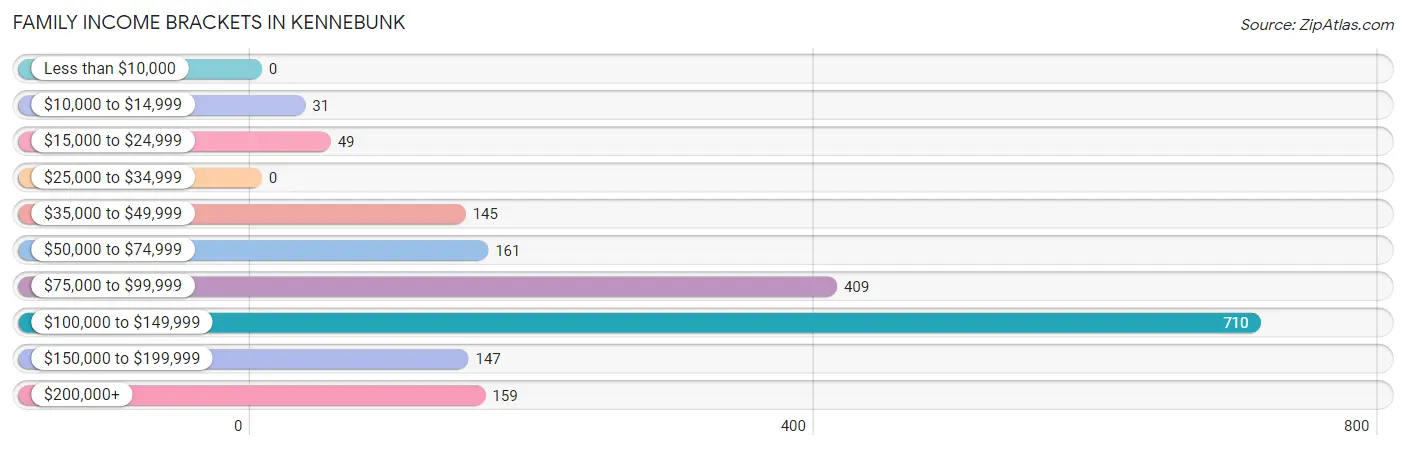
| Income Bracket | # Families | % Families |
| Less than $10,000 | 0 | 0.0% |
| $10,000 to $14,999 | 31 | 1.7% |
| $15,000 to $24,999 | 49 | 2.7% |
| $25,000 to $34,999 | 0 | 0.0% |
| $35,000 to $49,999 | 145 | 8.0% |
| $50,000 to $74,999 | 161 | 8.9% |
| $75,000 to $99,999 | 409 | 22.6% |
| $100,000 to $149,999 | 710 | 39.2% |
| $150,000 to $199,999 | 147 | 8.1% |
| $200,000+ | 159 | 8.8% |
Family Income by Famaliy Size in Kennebunk
5-person families (212 | 11.7%) account for the highest median family income in Kennebunk with $140,845 per family, while 2-person families (1,127 | 62.2%) have the highest median income of $50,467 per family member.
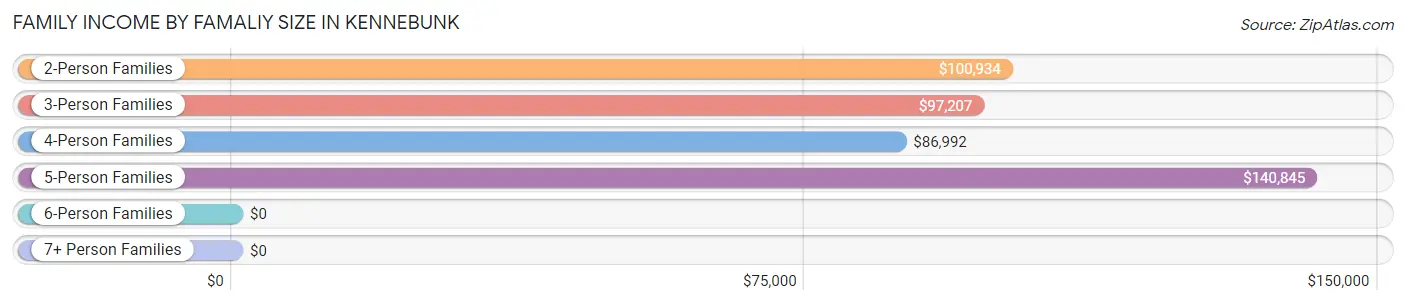
| Income Bracket | # Families | Median Income |
| 2-Person Families | 1,127 (62.2%) | $100,934 |
| 3-Person Families | 311 (17.2%) | $97,207 |
| 4-Person Families | 161 (8.9%) | $86,992 |
| 5-Person Families | 212 (11.7%) | $140,845 |
| 6-Person Families | 0 (0.0%) | $0 |
| 7+ Person Families | 0 (0.0%) | $0 |
| Total | 1,811 (100.0%) | $101,176 |
Family Income by Number of Earners in Kennebunk
The median family income in Kennebunk is $101,176, with families comprising 2 earners (1,103) having the highest median family income of $102,052, while families with no earners (358) have the lowest median family income of $84,450, accounting for 60.9% and 19.8% of families, respectively.
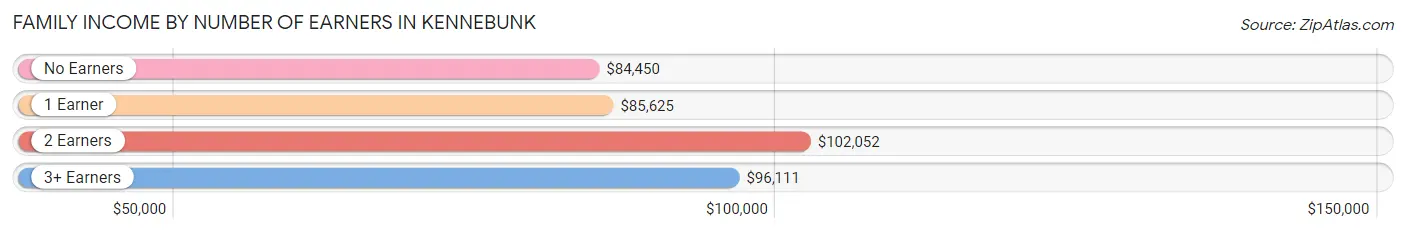
| Number of Earners | # Families | Median Income |
| No Earners | 358 (19.8%) | $84,450 |
| 1 Earner | 292 (16.1%) | $85,625 |
| 2 Earners | 1,103 (60.9%) | $102,052 |
| 3+ Earners | 58 (3.2%) | $96,111 |
| Total | 1,811 (100.0%) | $101,176 |
Household Income in Kennebunk
Household Income Brackets in Kennebunk
With 771 households falling in the category, the $100,000 to $149,999 income range is the most frequent in Kennebunk, accounting for 27.2% of all households. In contrast, only 82 households (2.9%) fall into the $10,000 to $14,999 income bracket, making it the least populous group.
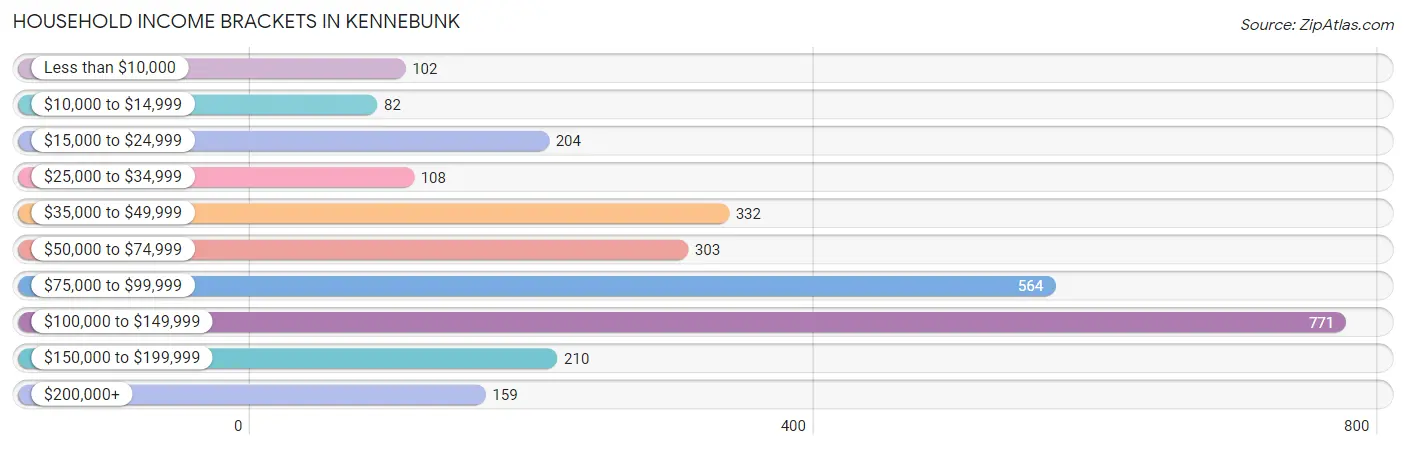
| Income Bracket | # Households | % Households |
| Less than $10,000 | 102 | 3.6% |
| $10,000 to $14,999 | 82 | 2.9% |
| $15,000 to $24,999 | 204 | 7.2% |
| $25,000 to $34,999 | 108 | 3.8% |
| $35,000 to $49,999 | 332 | 11.7% |
| $50,000 to $74,999 | 303 | 10.7% |
| $75,000 to $99,999 | 564 | 19.9% |
| $100,000 to $149,999 | 771 | 27.2% |
| $150,000 to $199,999 | 210 | 7.4% |
| $200,000+ | 159 | 5.6% |
Household Income by Householder Age in Kennebunk
The median household income in Kennebunk is $88,996, with the highest median household income of $103,049 found in the 25 to 44 years age bracket for the primary householder. A total of 546 households (19.3%) fall into this category.
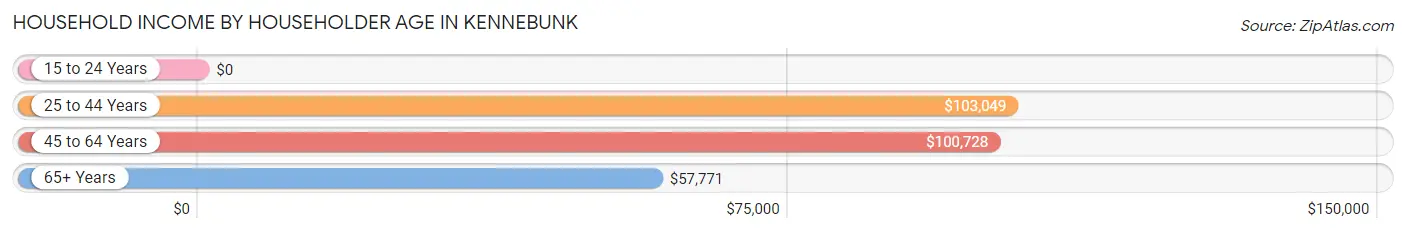
| Income Bracket | # Households | Median Income |
| 15 to 24 Years | 0 (0.0%) | $0 |
| 25 to 44 Years | 546 (19.3%) | $103,049 |
| 45 to 64 Years | 1,022 (36.0%) | $100,728 |
| 65+ Years | 1,267 (44.7%) | $57,771 |
| Total | 2,835 (100.0%) | $88,996 |
Poverty in Kennebunk
Income Below Poverty by Sex and Age in Kennebunk
With 10.9% poverty level for males and 5.9% for females among the residents of Kennebunk, 16 and 17 year old males and 35 to 44 year old females are the most vulnerable to poverty, with 37 males (36.3%) and 34 females (16.5%) in their respective age groups living below the poverty level.
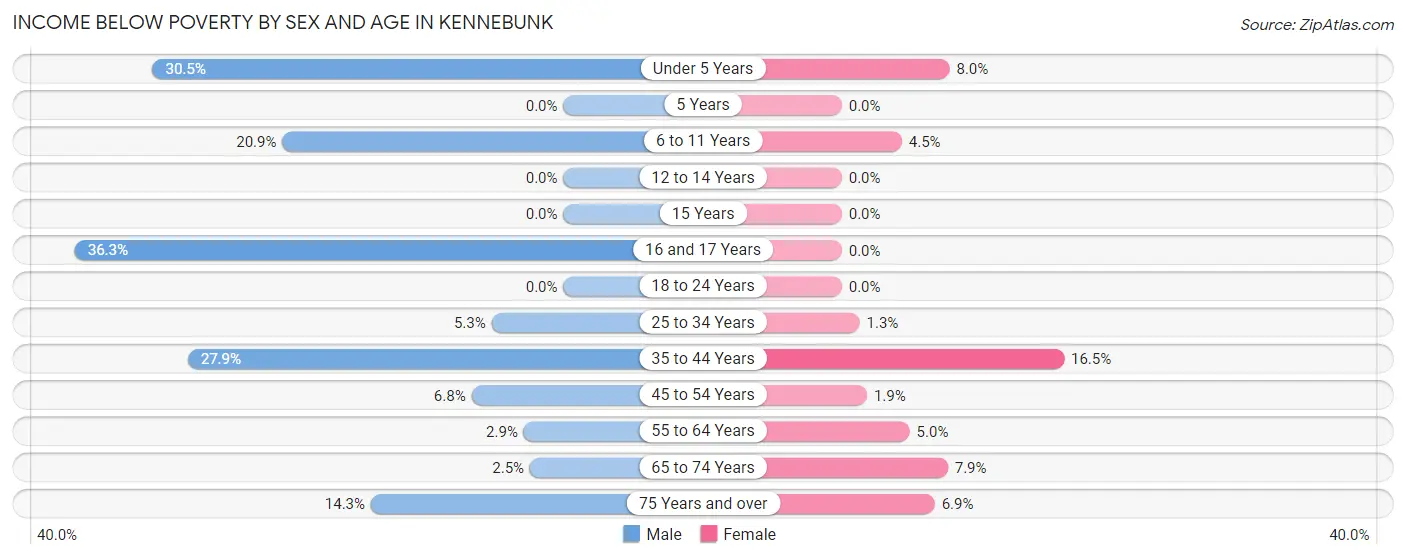
| Age Bracket | Male | Female |
| Under 5 Years | 43 (30.5%) | 4 (8.0%) |
| 5 Years | 0 (0.0%) | 0 (0.0%) |
| 6 to 11 Years | 43 (20.9%) | 5 (4.5%) |
| 12 to 14 Years | 0 (0.0%) | 0 (0.0%) |
| 15 Years | 0 (0.0%) | 0 (0.0%) |
| 16 and 17 Years | 37 (36.3%) | 0 (0.0%) |
| 18 to 24 Years | 0 (0.0%) | 0 (0.0%) |
| 25 to 34 Years | 18 (5.3%) | 4 (1.3%) |
| 35 to 44 Years | 75 (27.9%) | 34 (16.5%) |
| 45 to 54 Years | 29 (6.8%) | 5 (1.9%) |
| 55 to 64 Years | 6 (2.9%) | 34 (5.0%) |
| 65 to 74 Years | 13 (2.5%) | 50 (7.9%) |
| 75 Years and over | 45 (14.3%) | 31 (6.9%) |
| Total | 309 (10.9%) | 167 (5.9%) |
Income Above Poverty by Sex and Age in Kennebunk
According to the poverty statistics in Kennebunk, males aged 5 years and females aged 5 years are the age groups that are most secure financially, with 100.0% of males and 100.0% of females in these age groups living above the poverty line.
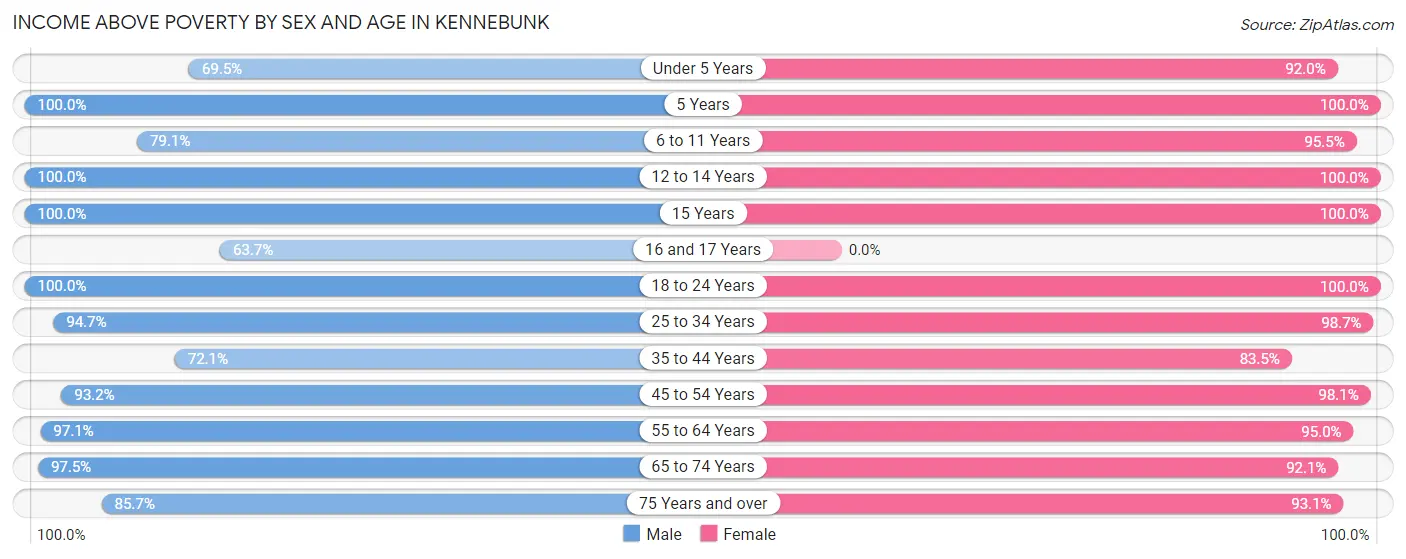
| Age Bracket | Male | Female |
| Under 5 Years | 98 (69.5%) | 46 (92.0%) |
| 5 Years | 44 (100.0%) | 4 (100.0%) |
| 6 to 11 Years | 163 (79.1%) | 107 (95.5%) |
| 12 to 14 Years | 177 (100.0%) | 29 (100.0%) |
| 15 Years | 50 (100.0%) | 24 (100.0%) |
| 16 and 17 Years | 65 (63.7%) | 0 (0.0%) |
| 18 to 24 Years | 39 (100.0%) | 85 (100.0%) |
| 25 to 34 Years | 320 (94.7%) | 299 (98.7%) |
| 35 to 44 Years | 194 (72.1%) | 172 (83.5%) |
| 45 to 54 Years | 396 (93.2%) | 262 (98.1%) |
| 55 to 64 Years | 198 (97.1%) | 640 (95.0%) |
| 65 to 74 Years | 511 (97.5%) | 585 (92.1%) |
| 75 Years and over | 270 (85.7%) | 418 (93.1%) |
| Total | 2,525 (89.1%) | 2,671 (94.1%) |
Income Below Poverty Among Married-Couple Families in Kennebunk
The poverty statistics for married-couple families in Kennebunk show that 1.0% or 15 of the total 1,466 families live below the poverty line. Families with no children have the highest poverty rate of 1.5%, comprising of 15 families. On the other hand, families with 1 or 2 children have the lowest poverty rate of 0.0%, which includes 0 families.
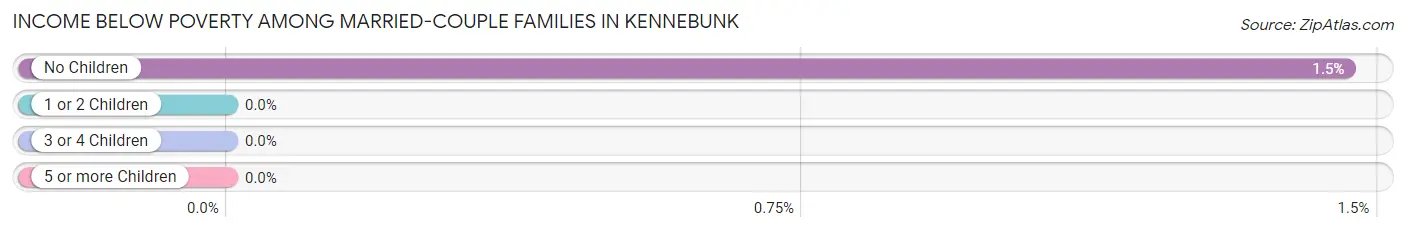
| Children | Above Poverty | Below Poverty |
| No Children | 1,015 (98.5%) | 15 (1.5%) |
| 1 or 2 Children | 283 (100.0%) | 0 (0.0%) |
| 3 or 4 Children | 153 (100.0%) | 0 (0.0%) |
| 5 or more Children | 0 (0.0%) | 0 (0.0%) |
| Total | 1,451 (99.0%) | 15 (1.0%) |
Income Below Poverty Among Single-Parent Households in Kennebunk
According to the poverty data in Kennebunk, 38.2% or 60 single-father households and 2.1% or 4 single-mother households are living below the poverty line. Among single-father households, those with 1 or 2 children have the highest poverty rate, with 60 households (43.2%) experiencing poverty. Likewise, among single-mother households, those with 3 or 4 children have the highest poverty rate, with 4 households (8.3%) falling below the poverty line.
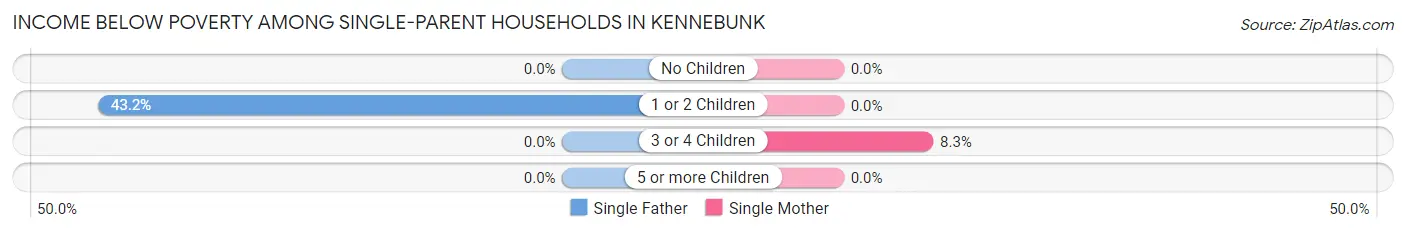
| Children | Single Father | Single Mother |
| No Children | 0 (0.0%) | 0 (0.0%) |
| 1 or 2 Children | 60 (43.2%) | 0 (0.0%) |
| 3 or 4 Children | 0 (0.0%) | 4 (8.3%) |
| 5 or more Children | 0 (0.0%) | 0 (0.0%) |
| Total | 60 (38.2%) | 4 (2.1%) |
Income Below Poverty Among Married-Couple vs Single-Parent Households in Kennebunk
The poverty data for Kennebunk shows that 15 of the married-couple family households (1.0%) and 64 of the single-parent households (18.5%) are living below the poverty level. Within the married-couple family households, those with no children have the highest poverty rate, with 15 households (1.5%) falling below the poverty line. Among the single-parent households, those with 1 or 2 children have the highest poverty rate, with 60 household (36.6%) living below poverty.
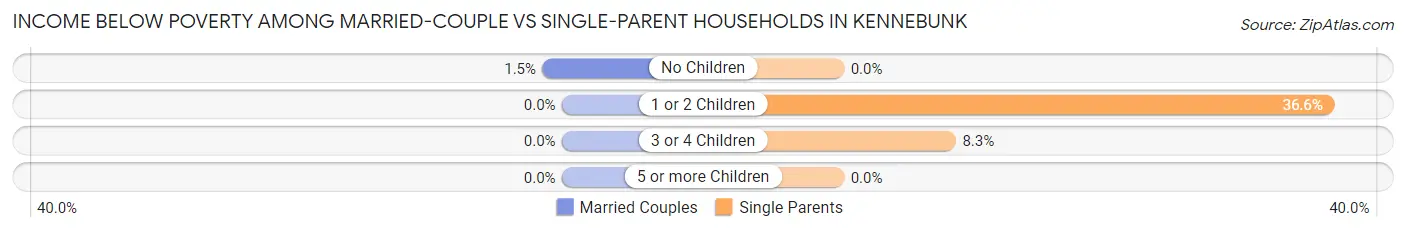
| Children | Married-Couple Families | Single-Parent Households |
| No Children | 15 (1.5%) | 0 (0.0%) |
| 1 or 2 Children | 0 (0.0%) | 60 (36.6%) |
| 3 or 4 Children | 0 (0.0%) | 4 (8.3%) |
| 5 or more Children | 0 (0.0%) | 0 (0.0%) |
| Total | 15 (1.0%) | 64 (18.5%) |
Race in Kennebunk
The most populous races in Kennebunk are White / Caucasian (5,651 | 94.2%), Hispanic or Latino (298 | 5.0%), and Two or more Races (144 | 2.4%).
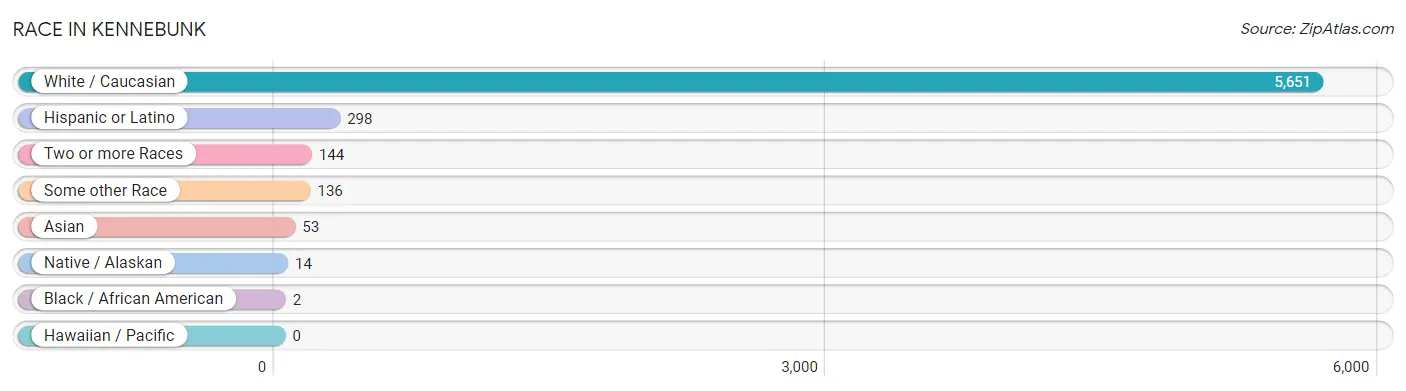
| Race | # Population | % Population |
| Asian | 53 | 0.9% |
| Black / African American | 2 | 0.0% |
| Hawaiian / Pacific | 0 | 0.0% |
| Hispanic or Latino | 298 | 5.0% |
| Native / Alaskan | 14 | 0.2% |
| White / Caucasian | 5,651 | 94.2% |
| Two or more Races | 144 | 2.4% |
| Some other Race | 136 | 2.3% |
| Total | 6,000 | 100.0% |
Ancestry in Kennebunk
The most populous ancestries reported in Kennebunk are English (1,301 | 21.7%), Irish (1,216 | 20.3%), German (661 | 11.0%), Italian (632 | 10.5%), and French (426 | 7.1%), together accounting for 70.6% of all Kennebunk residents.
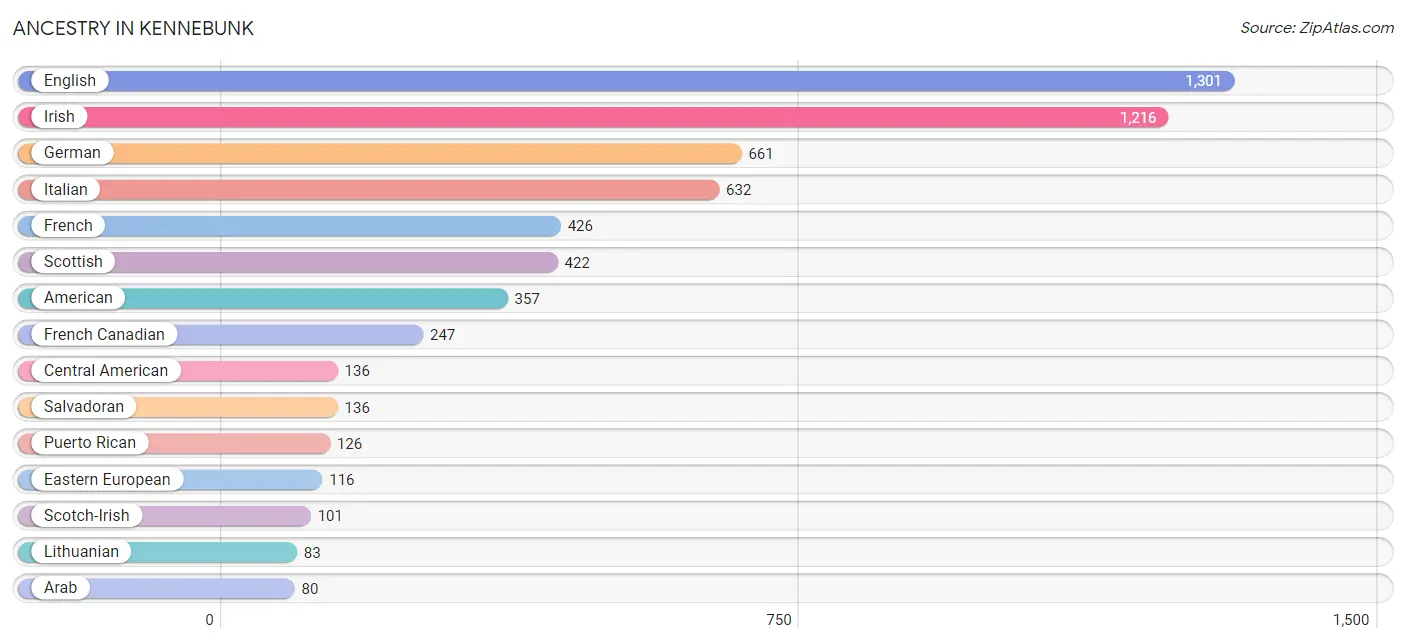
| Ancestry | # Population | % Population |
| Albanian | 62 | 1.0% |
| American | 357 | 5.9% |
| Arab | 80 | 1.3% |
| Armenian | 31 | 0.5% |
| Austrian | 13 | 0.2% |
| Basque | 27 | 0.4% |
| British | 43 | 0.7% |
| Canadian | 55 | 0.9% |
| Celtic | 35 | 0.6% |
| Central American | 136 | 2.3% |
| Croatian | 16 | 0.3% |
| Cuban | 36 | 0.6% |
| Czech | 19 | 0.3% |
| Danish | 11 | 0.2% |
| Dutch | 12 | 0.2% |
| Eastern European | 116 | 1.9% |
| English | 1,301 | 21.7% |
| European | 62 | 1.0% |
| French | 426 | 7.1% |
| French Canadian | 247 | 4.1% |
| German | 661 | 11.0% |
| Greek | 54 | 0.9% |
| Hungarian | 15 | 0.3% |
| Irish | 1,216 | 20.3% |
| Italian | 632 | 10.5% |
| Korean | 53 | 0.9% |
| Lebanese | 80 | 1.3% |
| Lithuanian | 83 | 1.4% |
| Norwegian | 34 | 0.6% |
| Polish | 64 | 1.1% |
| Portuguese | 33 | 0.5% |
| Puerto Rican | 126 | 2.1% |
| Russian | 26 | 0.4% |
| Salvadoran | 136 | 2.3% |
| Scandinavian | 24 | 0.4% |
| Scotch-Irish | 101 | 1.7% |
| Scottish | 422 | 7.0% |
| Subsaharan African | 2 | 0.0% |
| Swedish | 66 | 1.1% |
| Swiss | 10 | 0.2% |
| Syrian | 80 | 1.3% |
| Ukrainian | 7 | 0.1% | View All 42 Rows |
Immigrants in Kennebunk
The most numerous immigrant groups reported in Kennebunk came from Asia (231 | 3.8%), Iraq (215 | 3.6%), Western Asia (215 | 3.6%), Europe (113 | 1.9%), and Latin America (83 | 1.4%), together accounting for 14.3% of all Kennebunk residents.
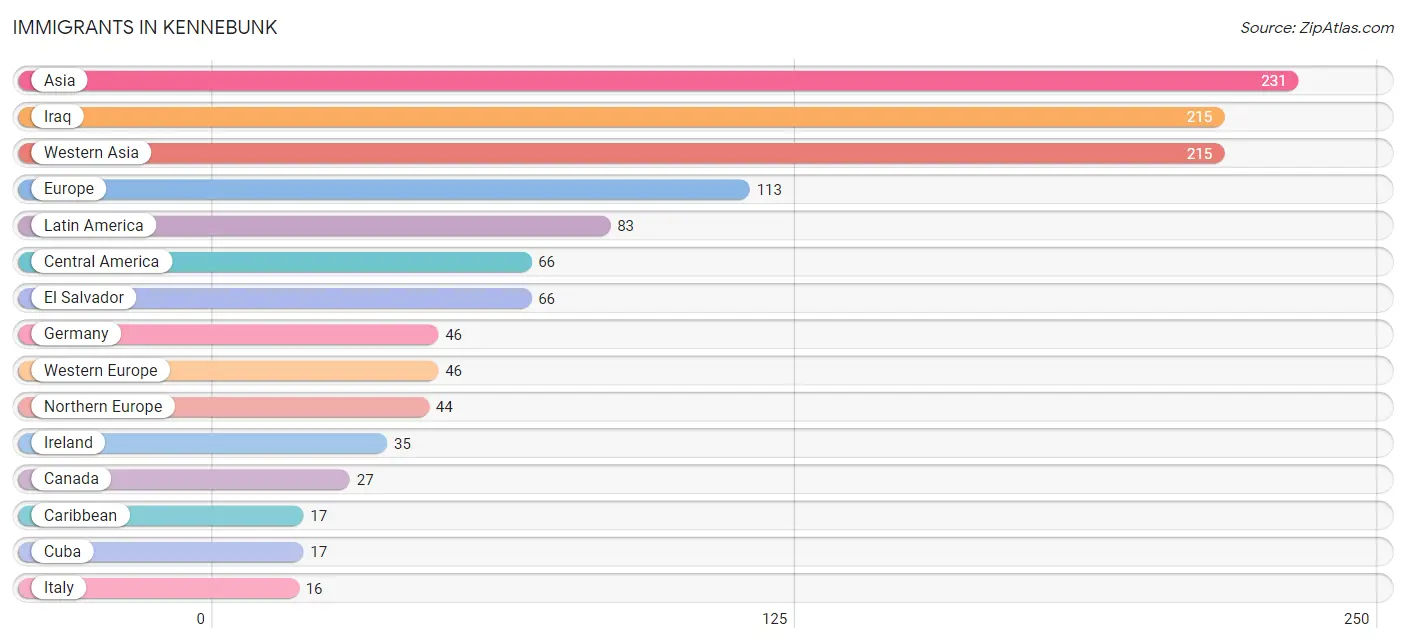
| Immigration Origin | # Population | % Population |
| Africa | 2 | 0.0% |
| Asia | 231 | 3.8% |
| Canada | 27 | 0.4% |
| Caribbean | 17 | 0.3% |
| Central America | 66 | 1.1% |
| Cuba | 17 | 0.3% |
| Eastern Africa | 2 | 0.0% |
| Eastern Europe | 7 | 0.1% |
| El Salvador | 66 | 1.1% |
| Europe | 113 | 1.9% |
| Germany | 46 | 0.8% |
| Iraq | 215 | 3.6% |
| Ireland | 35 | 0.6% |
| Italy | 16 | 0.3% |
| Latin America | 83 | 1.4% |
| Northern Europe | 44 | 0.7% |
| Philippines | 16 | 0.3% |
| Scotland | 9 | 0.2% |
| South Eastern Asia | 16 | 0.3% |
| Southern Europe | 16 | 0.3% |
| Ukraine | 7 | 0.1% |
| Western Asia | 215 | 3.6% |
| Western Europe | 46 | 0.8% | View All 23 Rows |
Sex and Age in Kennebunk
Sex and Age in Kennebunk
The most populous age groups in Kennebunk are 65 to 69 Years (324 | 11.0%) for men and 65 to 69 Years (417 | 13.6%) for women.
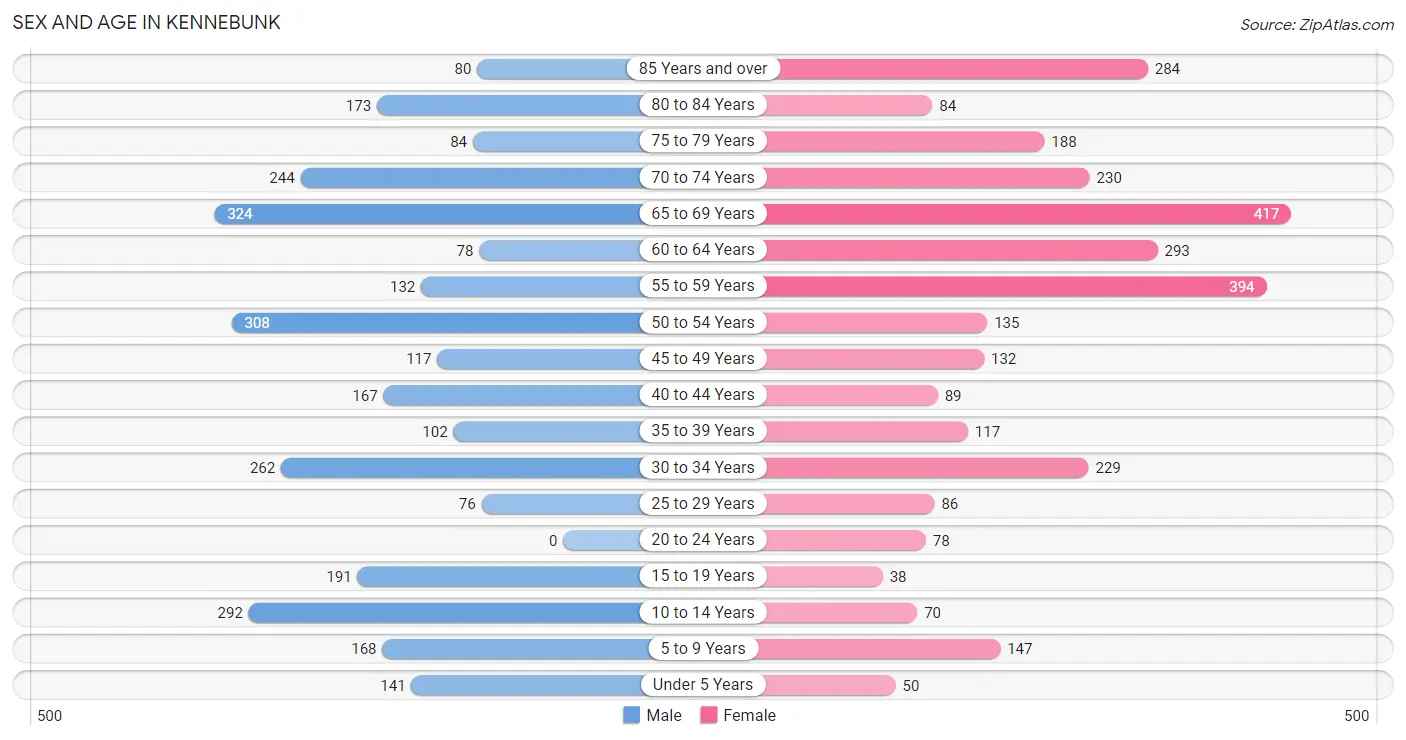
| Age Bracket | Male | Female |
| Under 5 Years | 141 (4.8%) | 50 (1.6%) |
| 5 to 9 Years | 168 (5.7%) | 147 (4.8%) |
| 10 to 14 Years | 292 (9.9%) | 70 (2.3%) |
| 15 to 19 Years | 191 (6.5%) | 38 (1.2%) |
| 20 to 24 Years | 0 (0.0%) | 78 (2.5%) |
| 25 to 29 Years | 76 (2.6%) | 86 (2.8%) |
| 30 to 34 Years | 262 (8.9%) | 229 (7.5%) |
| 35 to 39 Years | 102 (3.5%) | 117 (3.8%) |
| 40 to 44 Years | 167 (5.7%) | 89 (2.9%) |
| 45 to 49 Years | 117 (4.0%) | 132 (4.3%) |
| 50 to 54 Years | 308 (10.5%) | 135 (4.4%) |
| 55 to 59 Years | 132 (4.5%) | 394 (12.9%) |
| 60 to 64 Years | 78 (2.6%) | 293 (9.6%) |
| 65 to 69 Years | 324 (11.0%) | 417 (13.6%) |
| 70 to 74 Years | 244 (8.3%) | 230 (7.5%) |
| 75 to 79 Years | 84 (2.9%) | 188 (6.1%) |
| 80 to 84 Years | 173 (5.9%) | 84 (2.7%) |
| 85 Years and over | 80 (2.7%) | 284 (9.3%) |
| Total | 2,939 (100.0%) | 3,061 (100.0%) |
Families and Households in Kennebunk
Median Family Size in Kennebunk
The median family size in Kennebunk is 2.43 persons per family, with single male/father families (157 | 8.7%) accounting for the largest median family size of 2.85 persons per family. On the other hand, married-couple families (1,466 | 80.9%) represent the smallest median family size with 2.35 persons per family.
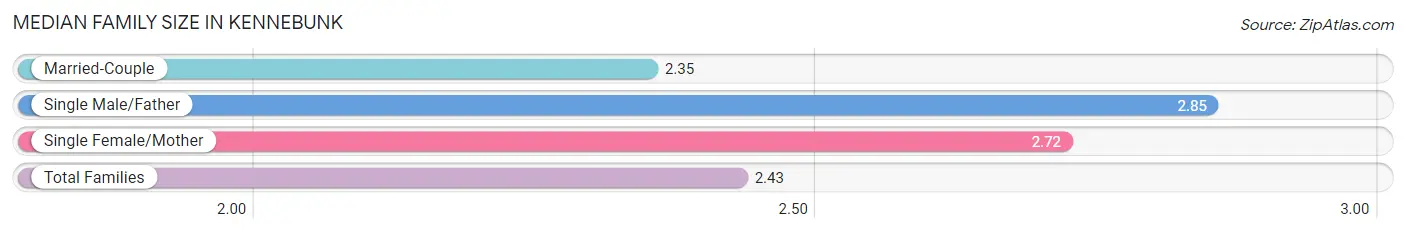
| Family Type | # Families | Family Size |
| Married-Couple | 1,466 (80.9%) | 2.35 |
| Single Male/Father | 157 (8.7%) | 2.85 |
| Single Female/Mother | 188 (10.4%) | 2.72 |
| Total Families | 1,811 (100.0%) | 2.43 |
Median Household Size in Kennebunk
The median household size in Kennebunk is 2.02 persons per household, with single male/father households (157 | 5.5%) accounting for the largest median household size of 4.28 persons per household. non-family households (1,024 | 36.1%) represent the smallest median household size with 1.04 persons per household.
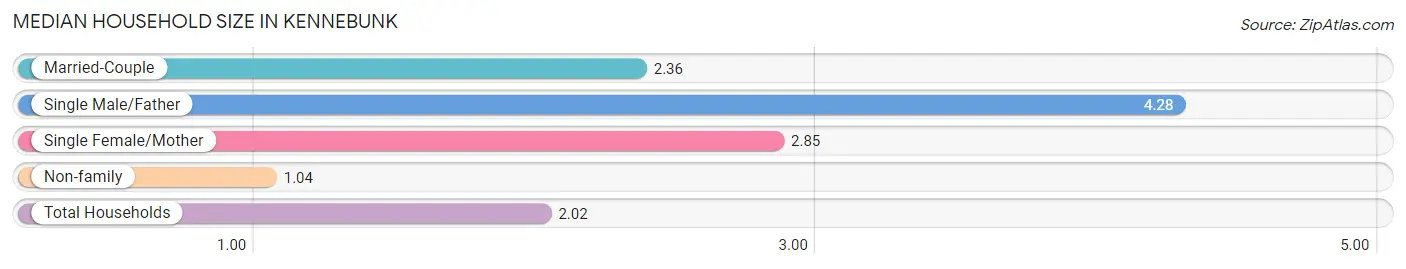
| Household Type | # Households | Household Size |
| Married-Couple | 1,466 (51.7%) | 2.36 |
| Single Male/Father | 157 (5.5%) | 4.28 |
| Single Female/Mother | 188 (6.6%) | 2.85 |
| Non-family | 1,024 (36.1%) | 1.04 |
| Total Households | 2,835 (100.0%) | 2.02 |
Household Size by Marriage Status in Kennebunk
Out of a total of 2,835 households in Kennebunk, 1,811 (63.9%) are family households, while 1,024 (36.1%) are nonfamily households. The most numerous type of family households are 2-person households, comprising 1,054, and the most common type of nonfamily households are 1-person households, comprising 989.
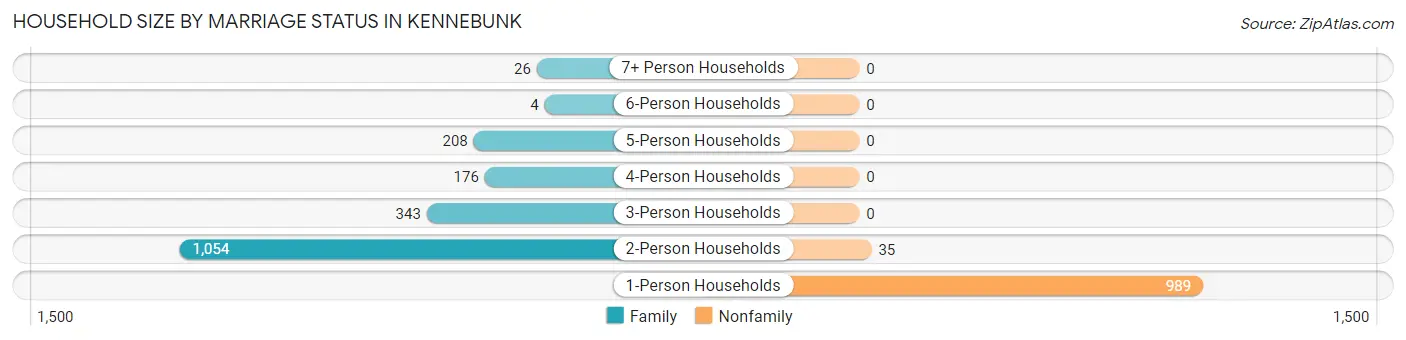
| Household Size | Family Households | Nonfamily Households |
| 1-Person Households | - | 989 (34.9%) |
| 2-Person Households | 1,054 (37.2%) | 35 (1.2%) |
| 3-Person Households | 343 (12.1%) | 0 (0.0%) |
| 4-Person Households | 176 (6.2%) | 0 (0.0%) |
| 5-Person Households | 208 (7.3%) | 0 (0.0%) |
| 6-Person Households | 4 (0.1%) | 0 (0.0%) |
| 7+ Person Households | 26 (0.9%) | 0 (0.0%) |
| Total | 1,811 (63.9%) | 1,024 (36.1%) |
Female Fertility in Kennebunk
Fertility by Age in Kennebunk
Average fertility rate in Kennebunk is 42.0 births per 1,000 women. Women in the age bracket of 20 to 34 years have the highest fertility rate with 59.0 births per 1,000 women. Women in the age bracket of 20 to 34 years acount for 67.6% of all women with births.
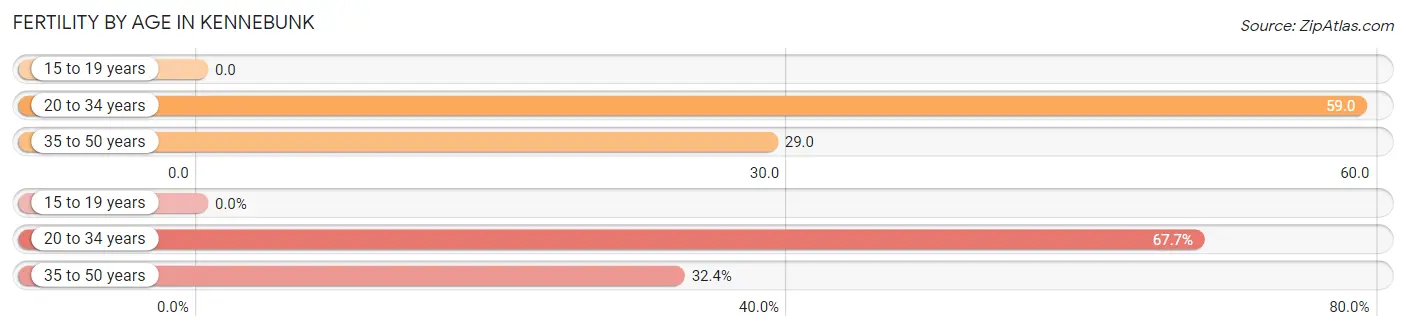
| Age Bracket | Women with Births | Births / 1,000 Women |
| 15 to 19 years | 0 (0.0%) | 0.0 |
| 20 to 34 years | 23 (67.6%) | 59.0 |
| 35 to 50 years | 11 (32.4%) | 29.0 |
| Total | 34 (100.0%) | 42.0 |
Fertility by Age by Marriage Status in Kennebunk
32.4% of women with births (34) in Kennebunk are married. The highest percentage of unmarried women with births falls into 20 to 34 years age bracket with 100.0% of them unmarried at the time of birth, while the lowest percentage of unmarried women with births belong to 35 to 50 years age bracket with 0.0% of them unmarried.
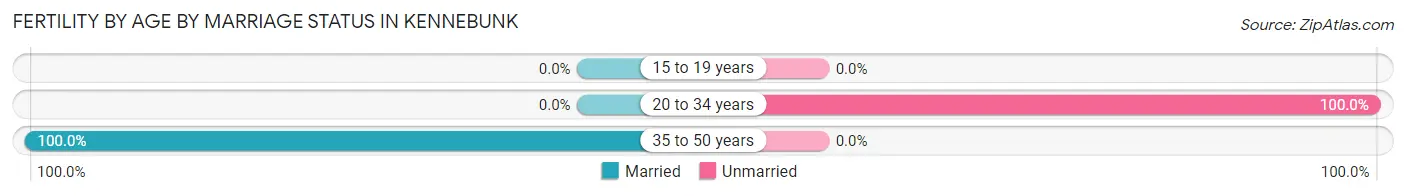
| Age Bracket | Married | Unmarried |
| 15 to 19 years | 0 (0.0%) | 0 (0.0%) |
| 20 to 34 years | 0 (0.0%) | 23 (100.0%) |
| 35 to 50 years | 11 (100.0%) | 0 (0.0%) |
| Total | 11 (32.4%) | 23 (67.6%) |
Fertility by Education in Kennebunk
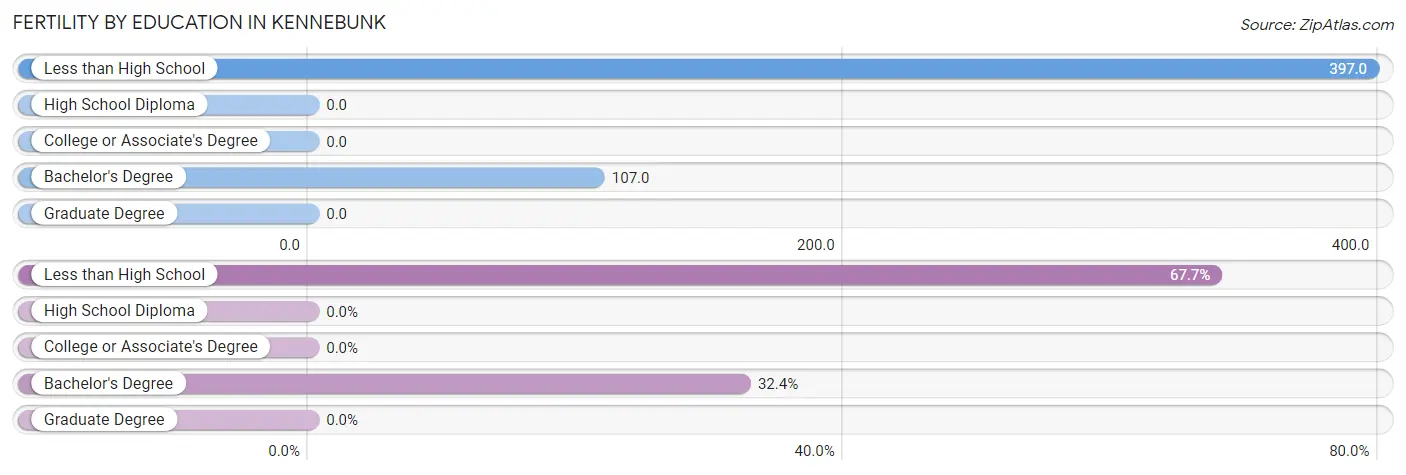
| Educational Attainment | Women with Births | Births / 1,000 Women |
| Less than High School | 23 (67.6%) | 397.0 |
| High School Diploma | 0 (0.0%) | 0.0 |
| College or Associate's Degree | 0 (0.0%) | 0.0 |
| Bachelor's Degree | 11 (32.4%) | 107.0 |
| Graduate Degree | 0 (0.0%) | 0.0 |
| Total | 34 (100.0%) | 42.0 |
Fertility by Education by Marriage Status in Kennebunk
67.6% of women with births in Kennebunk are unmarried. Women with the educational attainment of bachelor's degree are most likely to be married with 100.0% of them married at childbirth, while women with the educational attainment of less than high school are least likely to be married with 100.0% of them unmarried at childbirth.
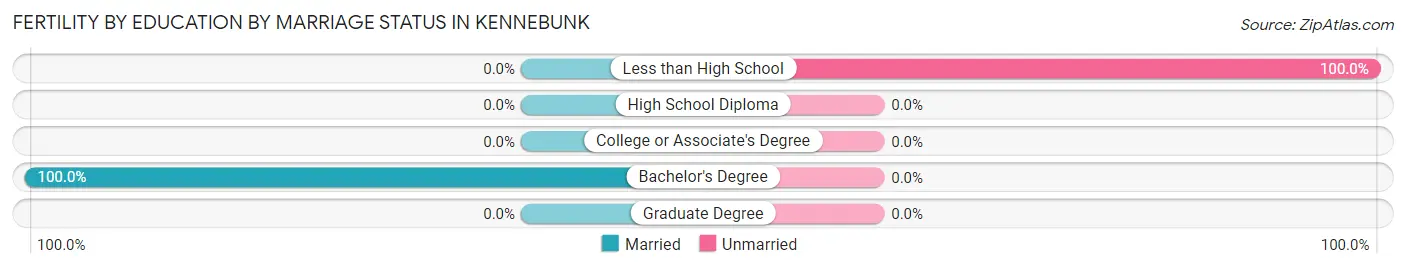
| Educational Attainment | Married | Unmarried |
| Less than High School | 0 (0.0%) | 23 (100.0%) |
| High School Diploma | 0 (0.0%) | 0 (0.0%) |
| College or Associate's Degree | 0 (0.0%) | 0 (0.0%) |
| Bachelor's Degree | 11 (100.0%) | 0 (0.0%) |
| Graduate Degree | 0 (0.0%) | 0 (0.0%) |
| Total | 11 (32.4%) | 23 (67.6%) |
Employment Characteristics in Kennebunk
Employment by Class of Employer in Kennebunk
Among the 2,691 employed individuals in Kennebunk, private company employees (964 | 35.8%), not-for-profit organizations (611 | 22.7%), and self-employed (incorporated) (536 | 19.9%) make up the most common classes of employment.
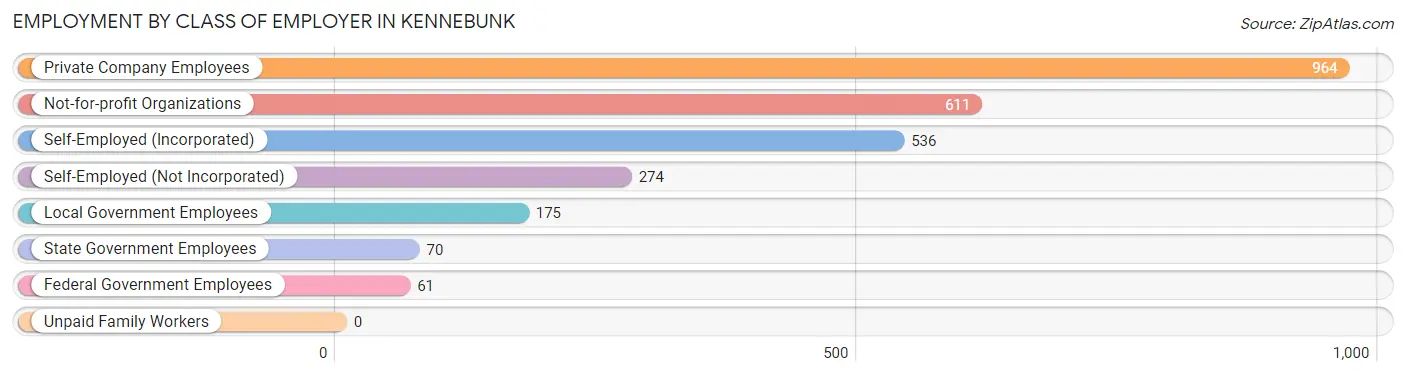
| Employer Class | # Employees | % Employees |
| Private Company Employees | 964 | 35.8% |
| Self-Employed (Incorporated) | 536 | 19.9% |
| Self-Employed (Not Incorporated) | 274 | 10.2% |
| Not-for-profit Organizations | 611 | 22.7% |
| Local Government Employees | 175 | 6.5% |
| State Government Employees | 70 | 2.6% |
| Federal Government Employees | 61 | 2.3% |
| Unpaid Family Workers | 0 | 0.0% |
| Total | 2,691 | 100.0% |
Employment Status by Age in Kennebunk
According to the labor force statistics for Kennebunk, out of the total population over 16 years of age (5,058), 57.7% or 2,918 individuals are in the labor force, with 6.5% or 190 of them unemployed. The age group with the highest labor force participation rate is 25 to 29 years, with 100.0% or 162 individuals in the labor force. Within the labor force, the 20 to 24 years age range has the highest percentage of unemployed individuals, with 100.0% or 30 of them being unemployed.
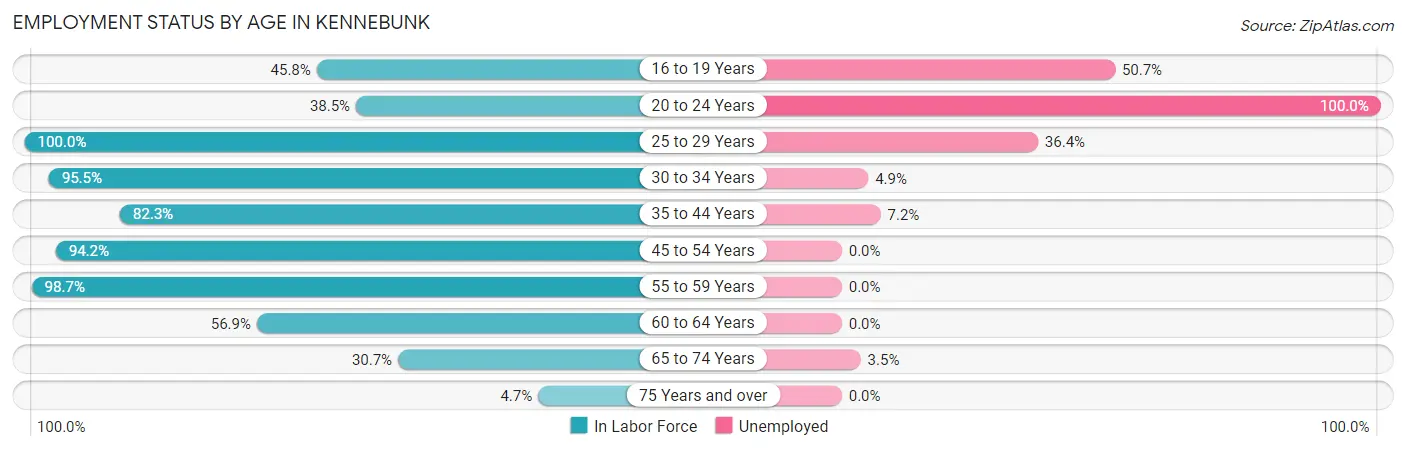
| Age Bracket | In Labor Force | Unemployed |
| 16 to 19 Years | 71 (45.8%) | 36 (50.7%) |
| 20 to 24 Years | 30 (38.5%) | 30 (100.0%) |
| 25 to 29 Years | 162 (100.0%) | 59 (36.4%) |
| 30 to 34 Years | 469 (95.5%) | 23 (4.9%) |
| 35 to 44 Years | 391 (82.3%) | 28 (7.2%) |
| 45 to 54 Years | 652 (94.2%) | 0 (0.0%) |
| 55 to 59 Years | 519 (98.7%) | 0 (0.0%) |
| 60 to 64 Years | 211 (56.9%) | 0 (0.0%) |
| 65 to 74 Years | 373 (30.7%) | 13 (3.5%) |
| 75 Years and over | 42 (4.7%) | 0 (0.0%) |
| Total | 2,918 (57.7%) | 190 (6.5%) |
Employment Status by Educational Attainment in Kennebunk
According to labor force statistics for Kennebunk, 88.5% of individuals (2,405) out of the total population between 25 and 64 years of age (2,717) are in the labor force, with 4.6% or 111 of them being unemployed. The group with the highest labor force participation rate are those with the educational attainment of high school diploma, with 92.1% or 385 individuals in the labor force. Within the labor force, individuals with less than high school education have the highest percentage of unemployment, with 24.7% or 23 of them being unemployed.
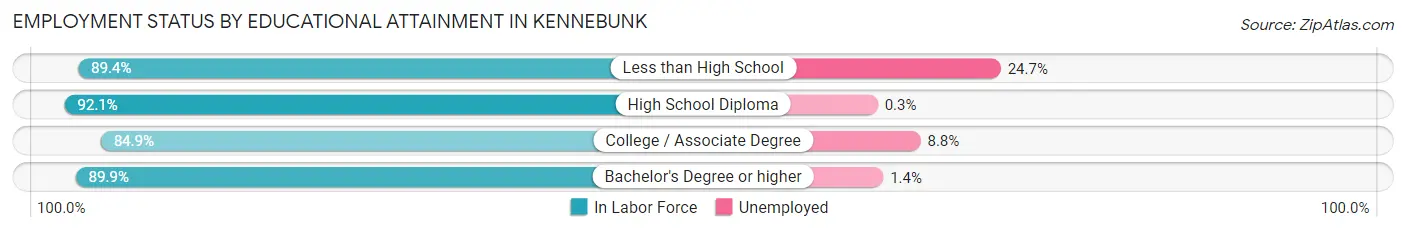
| Educational Attainment | In Labor Force | Unemployed |
| Less than High School | 93 (89.4%) | 26 (24.7%) |
| High School Diploma | 385 (92.1%) | 1 (0.3%) |
| College / Associate Degree | 799 (84.9%) | 83 (8.8%) |
| Bachelor's Degree or higher | 1,127 (89.9%) | 18 (1.4%) |
| Total | 2,405 (88.5%) | 125 (4.6%) |
Employment Occupations by Sex in Kennebunk
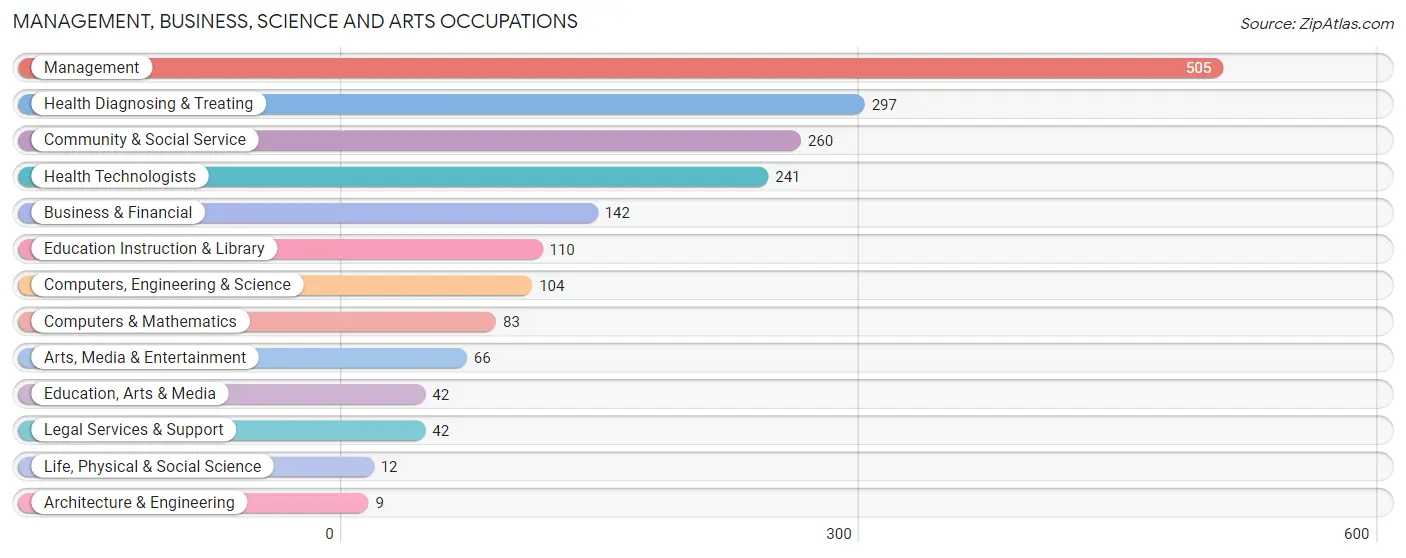
Management, Business, Science and Arts Occupations
The most common Management, Business, Science and Arts occupations in Kennebunk are Management (505 | 18.5%), Health Diagnosing & Treating (297 | 10.9%), Community & Social Service (260 | 9.5%), Health Technologists (241 | 8.8%), and Business & Financial (142 | 5.2%).
Management, Business, Science and Arts Occupations by Sex
Within the Management, Business, Science and Arts occupations in Kennebunk, the most male-oriented occupations are Architecture & Engineering (100.0%), Life, Physical & Social Science (100.0%), and Health Technologists (66.0%), while the most female-oriented occupations are Education, Arts & Media (76.2%), Management (75.8%), and Legal Services & Support (66.7%).
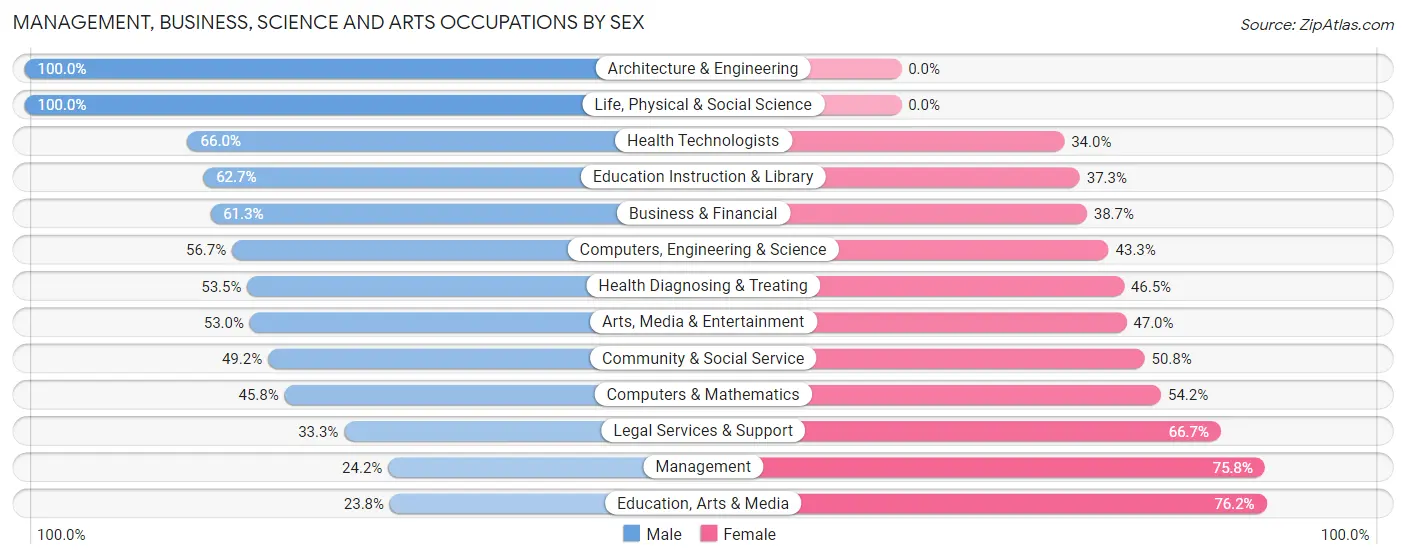
| Occupation | Male | Female |
| Management | 122 (24.2%) | 383 (75.8%) |
| Business & Financial | 87 (61.3%) | 55 (38.7%) |
| Computers, Engineering & Science | 59 (56.7%) | 45 (43.3%) |
| Computers & Mathematics | 38 (45.8%) | 45 (54.2%) |
| Architecture & Engineering | 9 (100.0%) | 0 (0.0%) |
| Life, Physical & Social Science | 12 (100.0%) | 0 (0.0%) |
| Community & Social Service | 128 (49.2%) | 132 (50.8%) |
| Education, Arts & Media | 10 (23.8%) | 32 (76.2%) |
| Legal Services & Support | 14 (33.3%) | 28 (66.7%) |
| Education Instruction & Library | 69 (62.7%) | 41 (37.3%) |
| Arts, Media & Entertainment | 35 (53.0%) | 31 (47.0%) |
| Health Diagnosing & Treating | 159 (53.5%) | 138 (46.5%) |
| Health Technologists | 159 (66.0%) | 82 (34.0%) |
| Total (Category) | 555 (42.4%) | 753 (57.6%) |
| Total (Overall) | 1,271 (46.5%) | 1,460 (53.5%) |
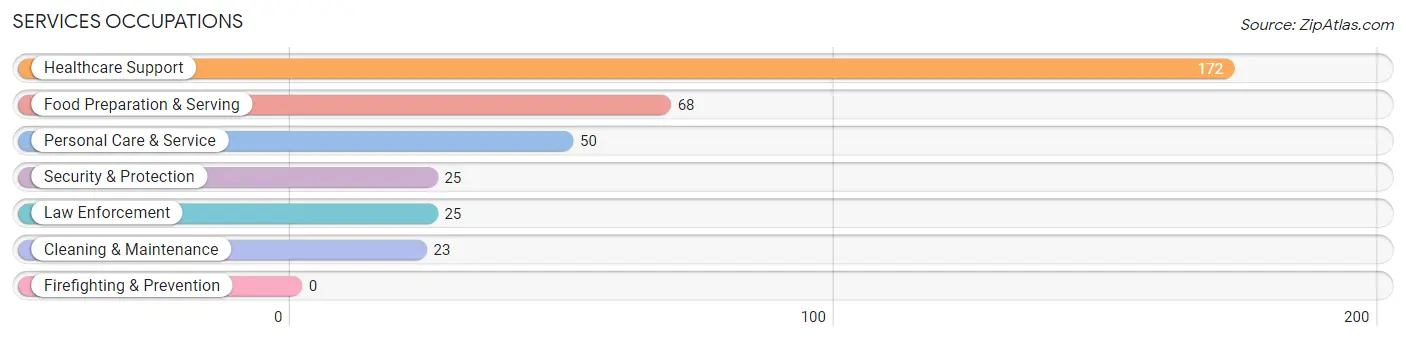
Services Occupations
The most common Services occupations in Kennebunk are Healthcare Support (172 | 6.3%), Food Preparation & Serving (68 | 2.5%), Personal Care & Service (50 | 1.8%), Security & Protection (25 | 0.9%), and Law Enforcement (25 | 0.9%).
Services Occupations by Sex
Within the Services occupations in Kennebunk, the most male-oriented occupations are Security & Protection (100.0%), Law Enforcement (100.0%), and Food Preparation & Serving (55.9%), while the most female-oriented occupations are Cleaning & Maintenance (100.0%), Healthcare Support (90.7%), and Personal Care & Service (88.0%).
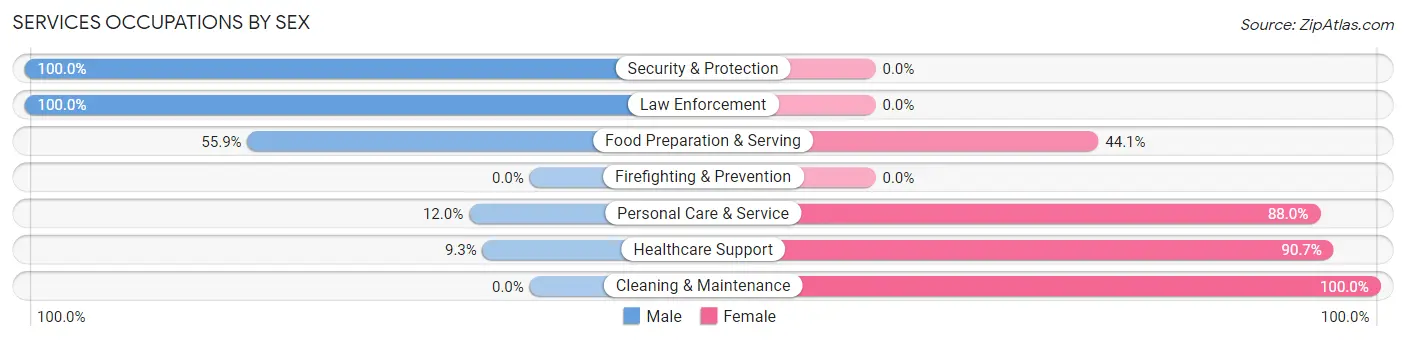
| Occupation | Male | Female |
| Healthcare Support | 16 (9.3%) | 156 (90.7%) |
| Security & Protection | 25 (100.0%) | 0 (0.0%) |
| Firefighting & Prevention | 0 (0.0%) | 0 (0.0%) |
| Law Enforcement | 25 (100.0%) | 0 (0.0%) |
| Food Preparation & Serving | 38 (55.9%) | 30 (44.1%) |
| Cleaning & Maintenance | 0 (0.0%) | 23 (100.0%) |
| Personal Care & Service | 6 (12.0%) | 44 (88.0%) |
| Total (Category) | 85 (25.2%) | 253 (74.9%) |
| Total (Overall) | 1,271 (46.5%) | 1,460 (53.5%) |
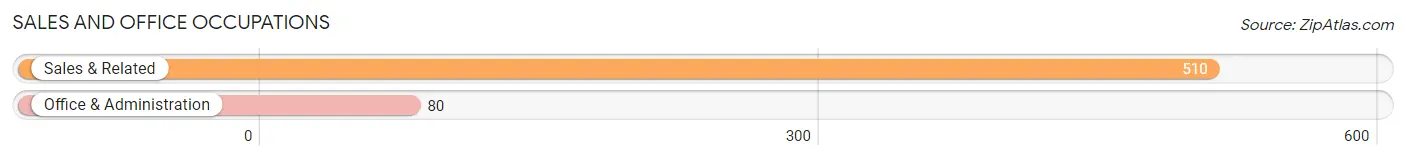
Sales and Office Occupations
The most common Sales and Office occupations in Kennebunk are Sales & Related (510 | 18.7%), and Office & Administration (80 | 2.9%).
Sales and Office Occupations by Sex
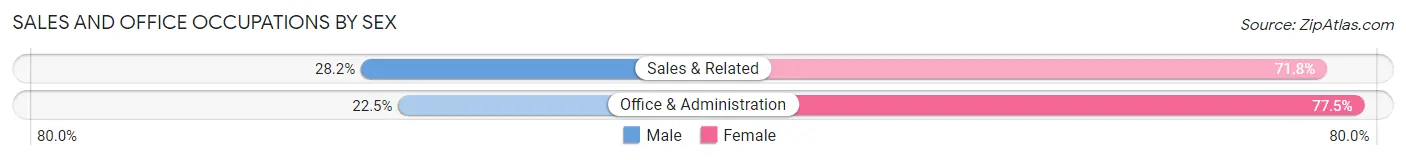
| Occupation | Male | Female |
| Sales & Related | 144 (28.2%) | 366 (71.8%) |
| Office & Administration | 18 (22.5%) | 62 (77.5%) |
| Total (Category) | 162 (27.5%) | 428 (72.5%) |
| Total (Overall) | 1,271 (46.5%) | 1,460 (53.5%) |
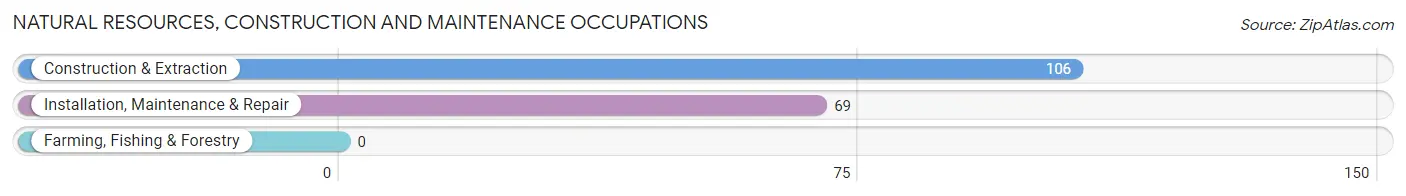
Natural Resources, Construction and Maintenance Occupations
The most common Natural Resources, Construction and Maintenance occupations in Kennebunk are Construction & Extraction (106 | 3.9%), and Installation, Maintenance & Repair (69 | 2.5%).
Natural Resources, Construction and Maintenance Occupations by Sex
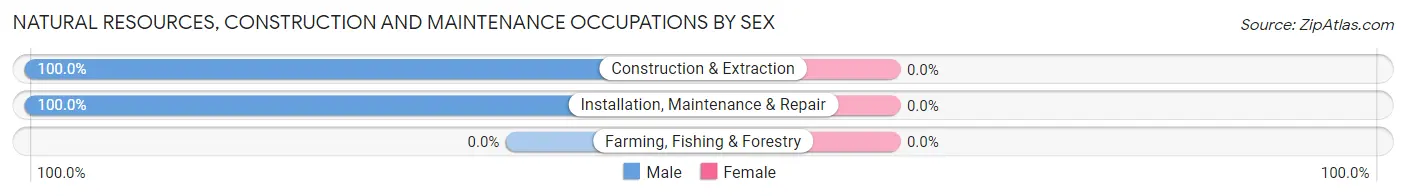
| Occupation | Male | Female |
| Farming, Fishing & Forestry | 0 (0.0%) | 0 (0.0%) |
| Construction & Extraction | 106 (100.0%) | 0 (0.0%) |
| Installation, Maintenance & Repair | 69 (100.0%) | 0 (0.0%) |
| Total (Category) | 175 (100.0%) | 0 (0.0%) |
| Total (Overall) | 1,271 (46.5%) | 1,460 (53.5%) |
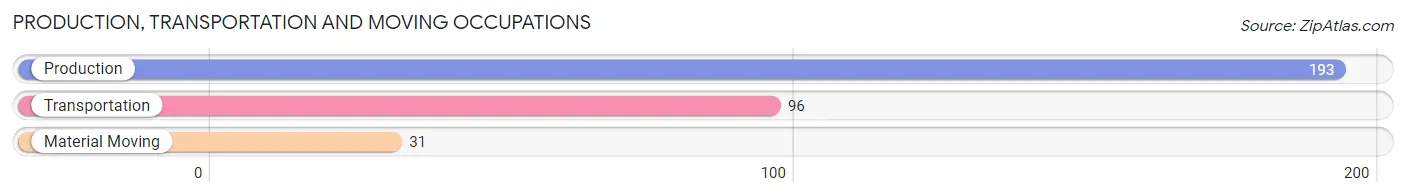
Production, Transportation and Moving Occupations
The most common Production, Transportation and Moving occupations in Kennebunk are Production (193 | 7.1%), Transportation (96 | 3.5%), and Material Moving (31 | 1.1%).
Production, Transportation and Moving Occupations by Sex
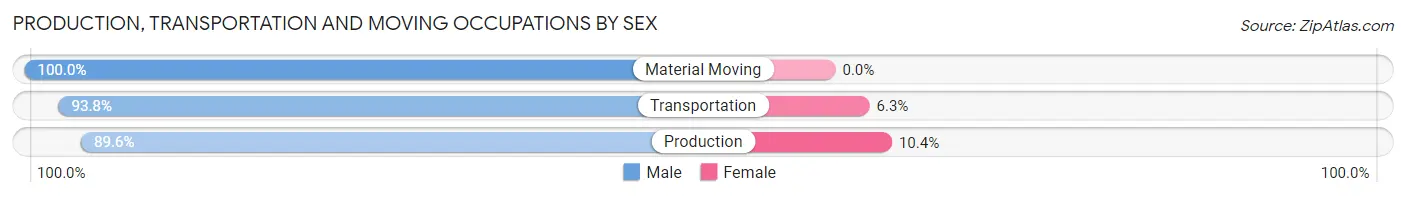
| Occupation | Male | Female |
| Production | 173 (89.6%) | 20 (10.4%) |
| Transportation | 90 (93.8%) | 6 (6.2%) |
| Material Moving | 31 (100.0%) | 0 (0.0%) |
| Total (Category) | 294 (91.9%) | 26 (8.1%) |
| Total (Overall) | 1,271 (46.5%) | 1,460 (53.5%) |
Employment Industries by Sex in Kennebunk
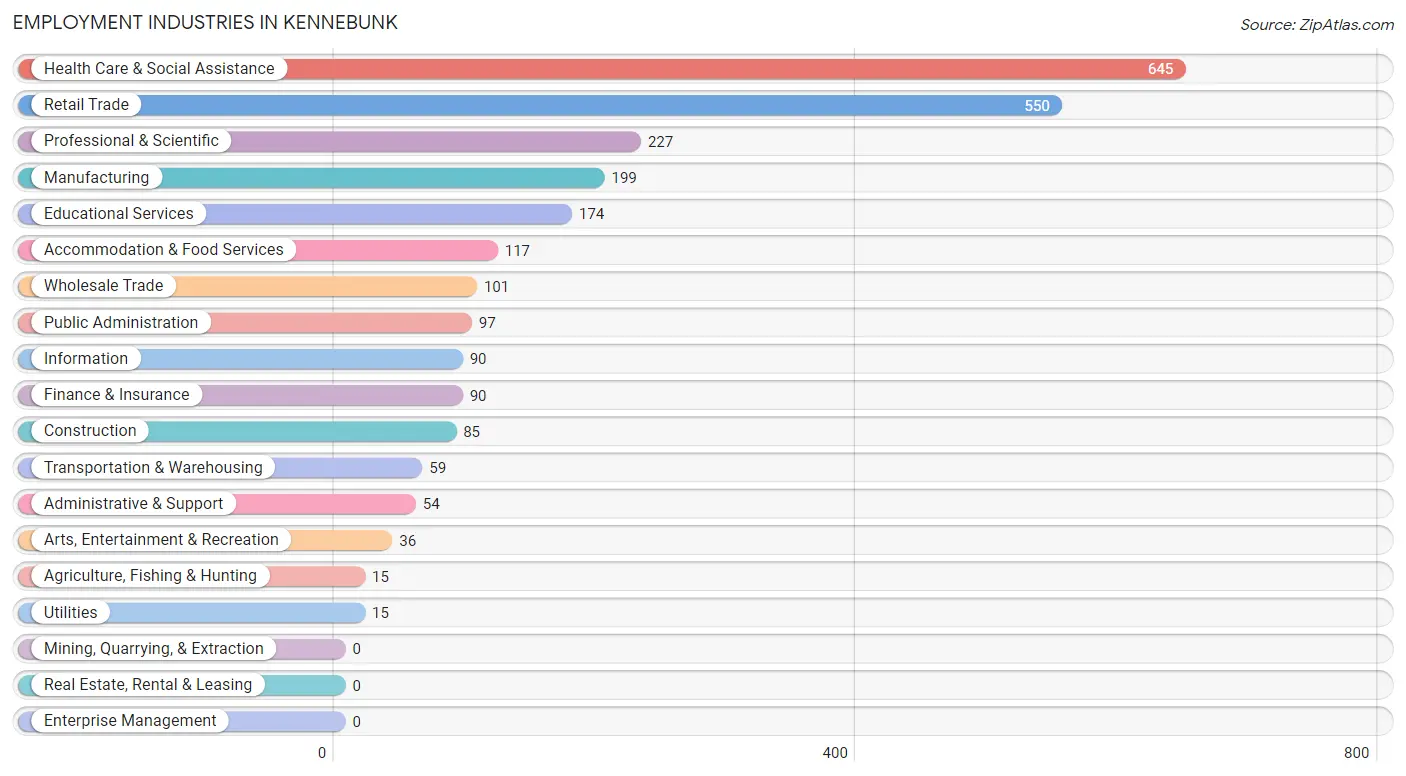
Employment Industries in Kennebunk
The major employment industries in Kennebunk include Health Care & Social Assistance (645 | 23.6%), Retail Trade (550 | 20.1%), Professional & Scientific (227 | 8.3%), Manufacturing (199 | 7.3%), and Educational Services (174 | 6.4%).
Employment Industries by Sex in Kennebunk
The Kennebunk industries that see more men than women are Construction (100.0%), Transportation & Warehousing (100.0%), and Utilities (100.0%), whereas the industries that tend to have a higher number of women are Agriculture, Fishing & Hunting (100.0%), Arts, Entertainment & Recreation (100.0%), and Wholesale Trade (74.3%).
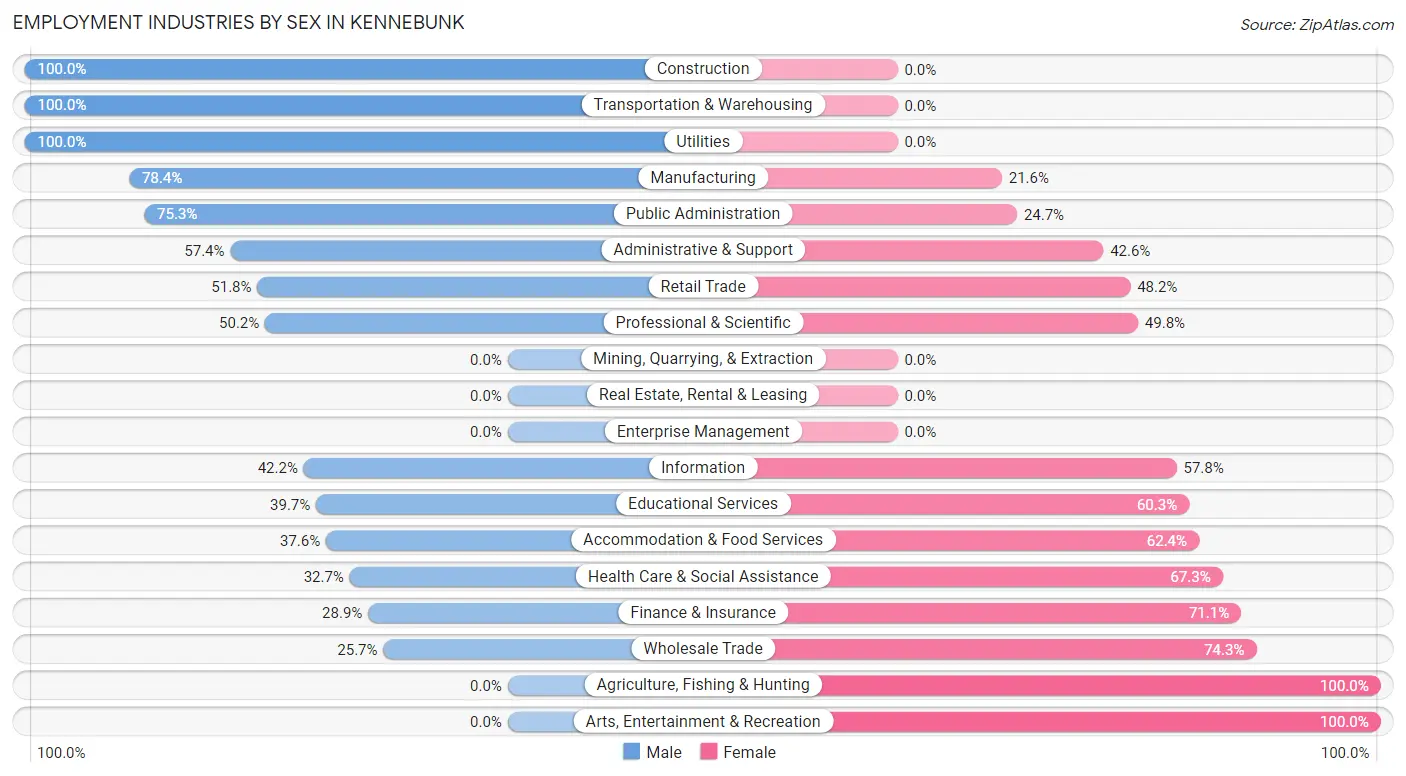
| Industry | Male | Female |
| Agriculture, Fishing & Hunting | 0 (0.0%) | 15 (100.0%) |
| Mining, Quarrying, & Extraction | 0 (0.0%) | 0 (0.0%) |
| Construction | 85 (100.0%) | 0 (0.0%) |
| Manufacturing | 156 (78.4%) | 43 (21.6%) |
| Wholesale Trade | 26 (25.7%) | 75 (74.3%) |
| Retail Trade | 285 (51.8%) | 265 (48.2%) |
| Transportation & Warehousing | 59 (100.0%) | 0 (0.0%) |
| Utilities | 15 (100.0%) | 0 (0.0%) |
| Information | 38 (42.2%) | 52 (57.8%) |
| Finance & Insurance | 26 (28.9%) | 64 (71.1%) |
| Real Estate, Rental & Leasing | 0 (0.0%) | 0 (0.0%) |
| Professional & Scientific | 114 (50.2%) | 113 (49.8%) |
| Enterprise Management | 0 (0.0%) | 0 (0.0%) |
| Administrative & Support | 31 (57.4%) | 23 (42.6%) |
| Educational Services | 69 (39.7%) | 105 (60.3%) |
| Health Care & Social Assistance | 211 (32.7%) | 434 (67.3%) |
| Arts, Entertainment & Recreation | 0 (0.0%) | 36 (100.0%) |
| Accommodation & Food Services | 44 (37.6%) | 73 (62.4%) |
| Public Administration | 73 (75.3%) | 24 (24.7%) |
| Total | 1,271 (46.5%) | 1,460 (53.5%) |
Education in Kennebunk
School Enrollment in Kennebunk
The most common levels of schooling among the 1,026 students in Kennebunk are elementary school (271 | 26.4%), middle school (263 | 25.6%), and college / undergraduate (191 | 18.6%).
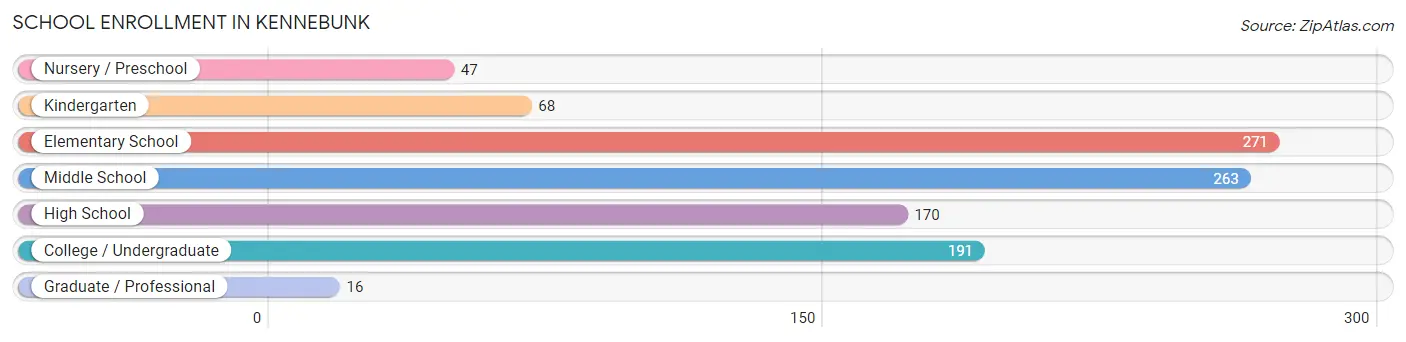
| School Level | # Students | % Students |
| Nursery / Preschool | 47 | 4.6% |
| Kindergarten | 68 | 6.6% |
| Elementary School | 271 | 26.4% |
| Middle School | 263 | 25.6% |
| High School | 170 | 16.6% |
| College / Undergraduate | 191 | 18.6% |
| Graduate / Professional | 16 | 1.6% |
| Total | 1,026 | 100.0% |
School Enrollment by Age by Funding Source in Kennebunk
Out of a total of 1,026 students who are enrolled in schools in Kennebunk, 117 (11.4%) attend a private institution, while the remaining 909 (88.6%) are enrolled in public schools. The age group of 35 years and over has the highest likelihood of being enrolled in private schools, with 59 (42.4% in the age bracket) enrolled. Conversely, the age group of 18 to 19 year olds has the lowest likelihood of being enrolled in a private school, with 18 (100.0% in the age bracket) attending a public institution.
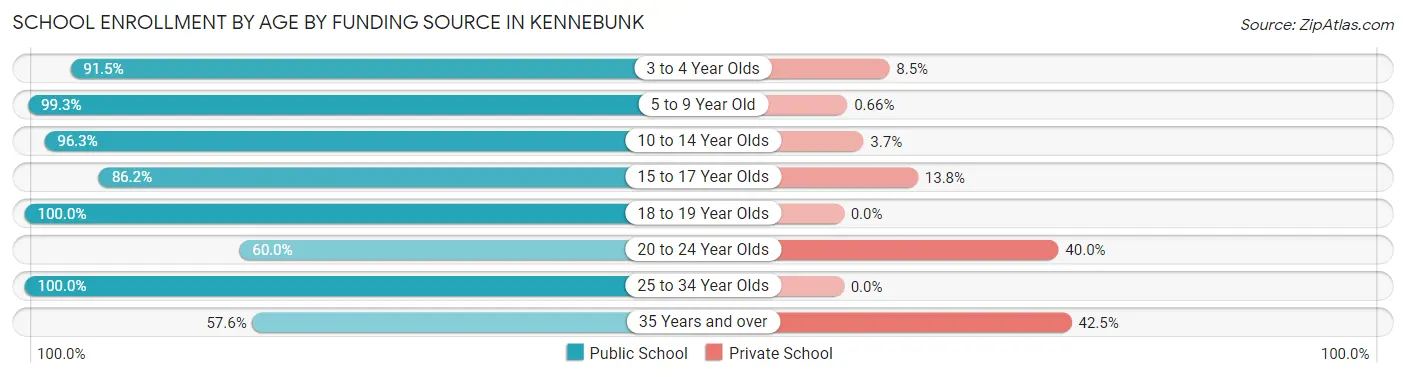
| Age Bracket | Public School | Private School |
| 3 to 4 Year Olds | 43 (91.5%) | 4 (8.5%) |
| 5 to 9 Year Old | 301 (99.3%) | 2 (0.7%) |
| 10 to 14 Year Olds | 288 (96.3%) | 11 (3.7%) |
| 15 to 17 Year Olds | 131 (86.2%) | 21 (13.8%) |
| 18 to 19 Year Olds | 18 (100.0%) | 0 (0.0%) |
| 20 to 24 Year Olds | 30 (60.0%) | 20 (40.0%) |
| 25 to 34 Year Olds | 18 (100.0%) | 0 (0.0%) |
| 35 Years and over | 80 (57.6%) | 59 (42.4%) |
| Total | 909 (88.6%) | 117 (11.4%) |
Educational Attainment by Field of Study in Kennebunk
Business (398 | 16.0%), social sciences (389 | 15.7%), liberal arts & history (294 | 11.8%), education (234 | 9.4%), and psychology (229 | 9.2%) are the most common fields of study among 2,483 individuals in Kennebunk who have obtained a bachelor's degree or higher.
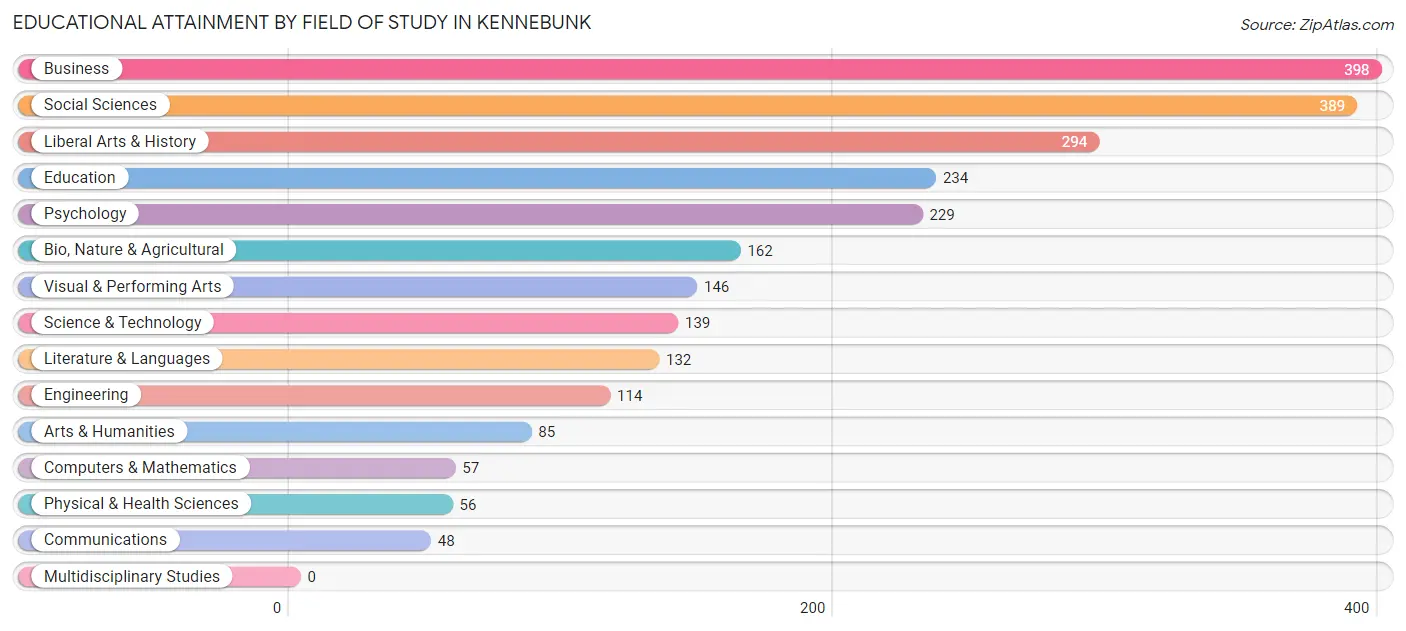
| Field of Study | # Graduates | % Graduates |
| Computers & Mathematics | 57 | 2.3% |
| Bio, Nature & Agricultural | 162 | 6.5% |
| Physical & Health Sciences | 56 | 2.3% |
| Psychology | 229 | 9.2% |
| Social Sciences | 389 | 15.7% |
| Engineering | 114 | 4.6% |
| Multidisciplinary Studies | 0 | 0.0% |
| Science & Technology | 139 | 5.6% |
| Business | 398 | 16.0% |
| Education | 234 | 9.4% |
| Literature & Languages | 132 | 5.3% |
| Liberal Arts & History | 294 | 11.8% |
| Visual & Performing Arts | 146 | 5.9% |
| Communications | 48 | 1.9% |
| Arts & Humanities | 85 | 3.4% |
| Total | 2,483 | 100.0% |
Transportation & Commute in Kennebunk
Vehicle Availability by Sex in Kennebunk
The most prevalent vehicle ownership categories in Kennebunk are males with 2 vehicles (761, accounting for 61.3%) and females with 2 vehicles (967, making up 52.7%).
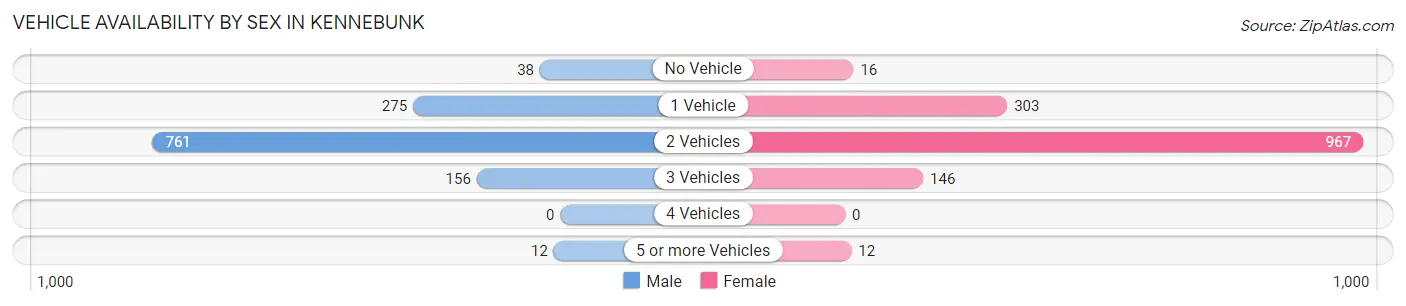
| Vehicles Available | Male | Female |
| No Vehicle | 38 (3.1%) | 16 (1.1%) |
| 1 Vehicle | 275 (22.1%) | 303 (21.0%) |
| 2 Vehicles | 761 (61.3%) | 967 (67.0%) |
| 3 Vehicles | 156 (12.6%) | 146 (10.1%) |
| 4 Vehicles | 0 (0.0%) | 0 (0.0%) |
| 5 or more Vehicles | 12 (1.0%) | 12 (0.8%) |
| Total | 1,242 (100.0%) | 1,444 (100.0%) |
Commute Time in Kennebunk
The most frequently occuring commute durations in Kennebunk are less than 5 minutes (423 commuters, 22.3%), 20 to 24 minutes (227 commuters, 11.9%), and 5 to 9 minutes (226 commuters, 11.9%).
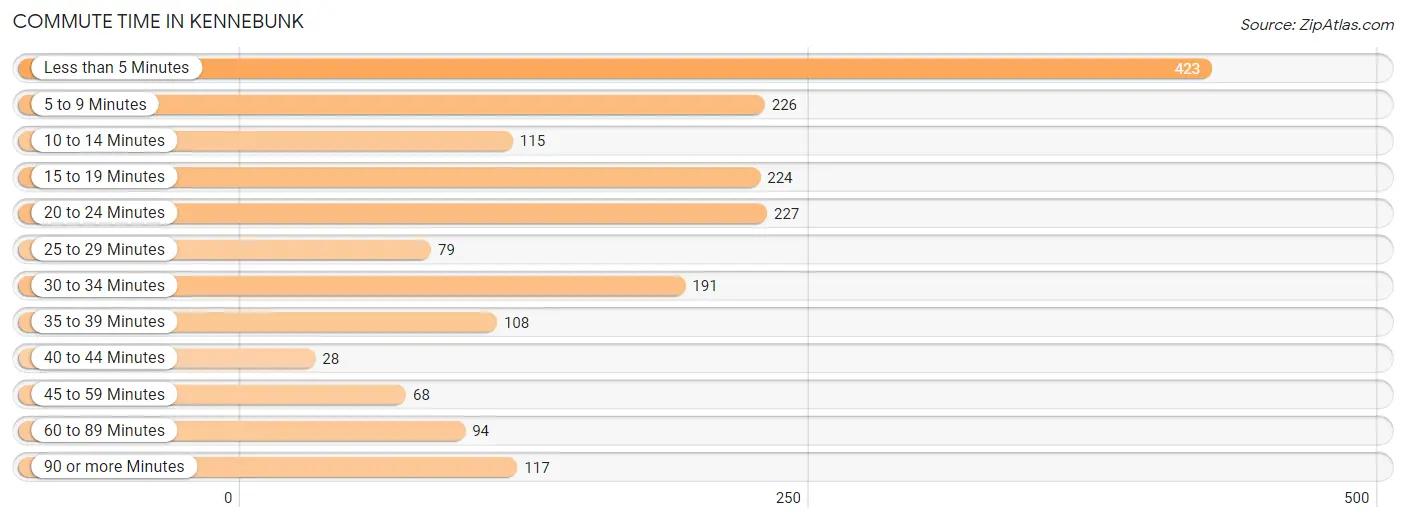
| Commute Time | # Commuters | % Commuters |
| Less than 5 Minutes | 423 | 22.3% |
| 5 to 9 Minutes | 226 | 11.9% |
| 10 to 14 Minutes | 115 | 6.0% |
| 15 to 19 Minutes | 224 | 11.8% |
| 20 to 24 Minutes | 227 | 11.9% |
| 25 to 29 Minutes | 79 | 4.2% |
| 30 to 34 Minutes | 191 | 10.1% |
| 35 to 39 Minutes | 108 | 5.7% |
| 40 to 44 Minutes | 28 | 1.5% |
| 45 to 59 Minutes | 68 | 3.6% |
| 60 to 89 Minutes | 94 | 5.0% |
| 90 or more Minutes | 117 | 6.2% |
Commute Time by Sex in Kennebunk
The most common commute times in Kennebunk are less than 5 minutes (171 commuters, 19.1%) for males and less than 5 minutes (252 commuters, 25.1%) for females.
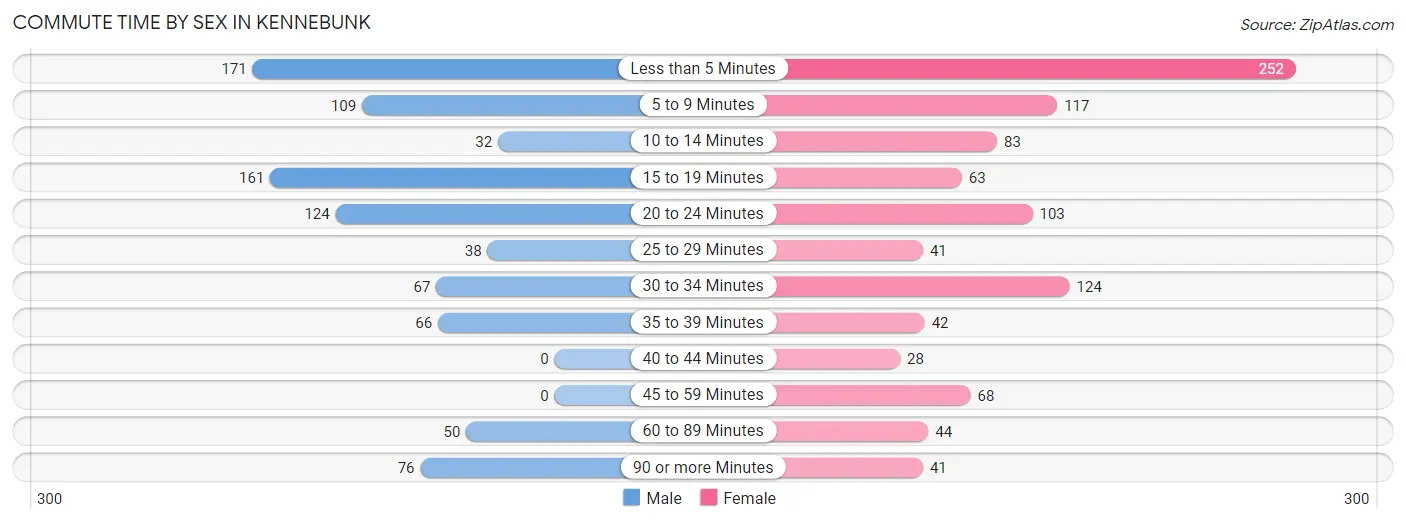
| Commute Time | Male | Female |
| Less than 5 Minutes | 171 (19.1%) | 252 (25.1%) |
| 5 to 9 Minutes | 109 (12.2%) | 117 (11.6%) |
| 10 to 14 Minutes | 32 (3.6%) | 83 (8.3%) |
| 15 to 19 Minutes | 161 (18.0%) | 63 (6.3%) |
| 20 to 24 Minutes | 124 (13.9%) | 103 (10.2%) |
| 25 to 29 Minutes | 38 (4.3%) | 41 (4.1%) |
| 30 to 34 Minutes | 67 (7.5%) | 124 (12.3%) |
| 35 to 39 Minutes | 66 (7.4%) | 42 (4.2%) |
| 40 to 44 Minutes | 0 (0.0%) | 28 (2.8%) |
| 45 to 59 Minutes | 0 (0.0%) | 68 (6.8%) |
| 60 to 89 Minutes | 50 (5.6%) | 44 (4.4%) |
| 90 or more Minutes | 76 (8.5%) | 41 (4.1%) |
Time of Departure to Work by Sex in Kennebunk
The most frequent times of departure to work in Kennebunk are 10:00 AM to 10:59 AM (171, 19.1%) for males and 9:00 AM to 9:59 AM (298, 29.6%) for females.
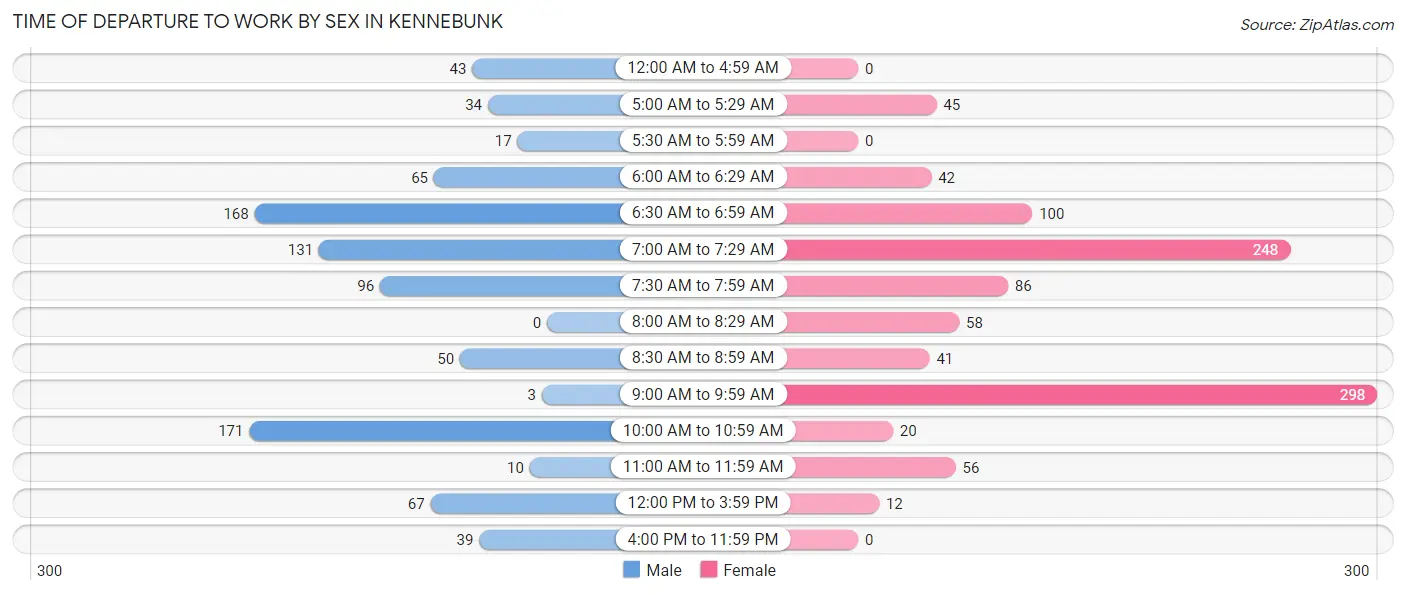
| Time of Departure | Male | Female |
| 12:00 AM to 4:59 AM | 43 (4.8%) | 0 (0.0%) |
| 5:00 AM to 5:29 AM | 34 (3.8%) | 45 (4.5%) |
| 5:30 AM to 5:59 AM | 17 (1.9%) | 0 (0.0%) |
| 6:00 AM to 6:29 AM | 65 (7.3%) | 42 (4.2%) |
| 6:30 AM to 6:59 AM | 168 (18.8%) | 100 (9.9%) |
| 7:00 AM to 7:29 AM | 131 (14.6%) | 248 (24.6%) |
| 7:30 AM to 7:59 AM | 96 (10.7%) | 86 (8.6%) |
| 8:00 AM to 8:29 AM | 0 (0.0%) | 58 (5.8%) |
| 8:30 AM to 8:59 AM | 50 (5.6%) | 41 (4.1%) |
| 9:00 AM to 9:59 AM | 3 (0.3%) | 298 (29.6%) |
| 10:00 AM to 10:59 AM | 171 (19.1%) | 20 (2.0%) |
| 11:00 AM to 11:59 AM | 10 (1.1%) | 56 (5.6%) |
| 12:00 PM to 3:59 PM | 67 (7.5%) | 12 (1.2%) |
| 4:00 PM to 11:59 PM | 39 (4.4%) | 0 (0.0%) |
| Total | 894 (100.0%) | 1,006 (100.0%) |
Housing Occupancy in Kennebunk
Occupancy by Ownership in Kennebunk
Of the total 2,835 dwellings in Kennebunk, owner-occupied units account for 2,012 (71.0%), while renter-occupied units make up 823 (29.0%).
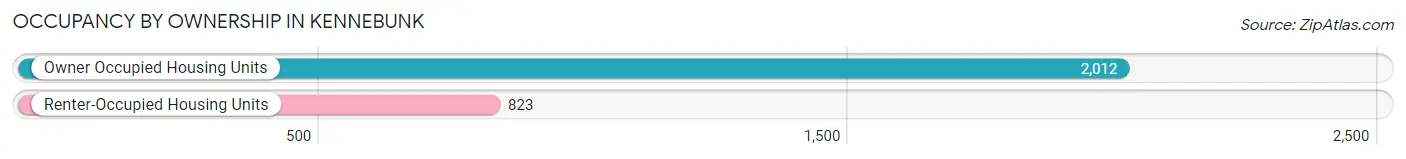
| Occupancy | # Housing Units | % Housing Units |
| Owner Occupied Housing Units | 2,012 | 71.0% |
| Renter-Occupied Housing Units | 823 | 29.0% |
| Total Occupied Housing Units | 2,835 | 100.0% |
Occupancy by Household Size in Kennebunk
| Household Size | # Housing Units | % Housing Units |
| 1-Person Household | 989 | 34.9% |
| 2-Person Household | 1,089 | 38.4% |
| 3-Person Household | 343 | 12.1% |
| 4+ Person Household | 414 | 14.6% |
| Total Housing Units | 2,835 | 100.0% |
Occupancy by Ownership by Household Size in Kennebunk
| Household Size | Owner-occupied | Renter-occupied |
| 1-Person Household | 489 (49.4%) | 500 (50.6%) |
| 2-Person Household | 973 (89.3%) | 116 (10.6%) |
| 3-Person Household | 322 (93.9%) | 21 (6.1%) |
| 4+ Person Household | 228 (55.1%) | 186 (44.9%) |
| Total Housing Units | 2,012 (71.0%) | 823 (29.0%) |
Occupancy by Educational Attainment in Kennebunk
| Household Size | Owner-occupied | Renter-occupied |
| Less than High School | 16 (40.0%) | 24 (60.0%) |
| High School Diploma | 194 (46.5%) | 223 (53.5%) |
| College/Associate Degree | 731 (78.5%) | 200 (21.5%) |
| Bachelor's Degree or higher | 1,071 (74.0%) | 376 (26.0%) |
Occupancy by Age of Householder in Kennebunk
| Age Bracket | # Households | % Households |
| Under 35 Years | 296 | 10.4% |
| 35 to 44 Years | 250 | 8.8% |
| 45 to 54 Years | 333 | 11.7% |
| 55 to 64 Years | 689 | 24.3% |
| 65 to 74 Years | 682 | 24.1% |
| 75 to 84 Years | 318 | 11.2% |
| 85 Years and Over | 267 | 9.4% |
| Total | 2,835 | 100.0% |
Housing Finances in Kennebunk
Median Income by Occupancy in Kennebunk
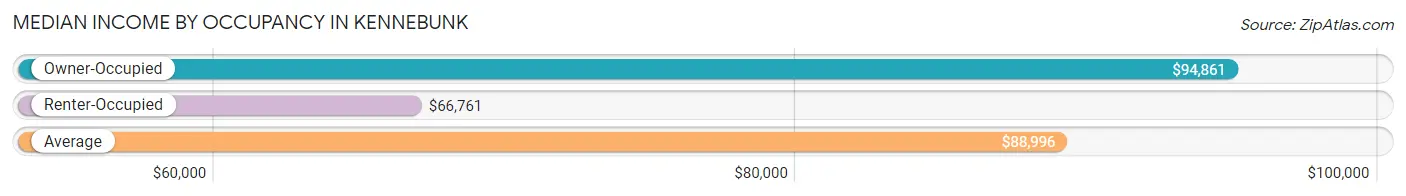
| Occupancy Type | # Households | Median Income |
| Owner-Occupied | 2,012 (71.0%) | $94,861 |
| Renter-Occupied | 823 (29.0%) | $66,761 |
| Average | 2,835 (100.0%) | $88,996 |
Occupancy by Householder Income Bracket in Kennebunk
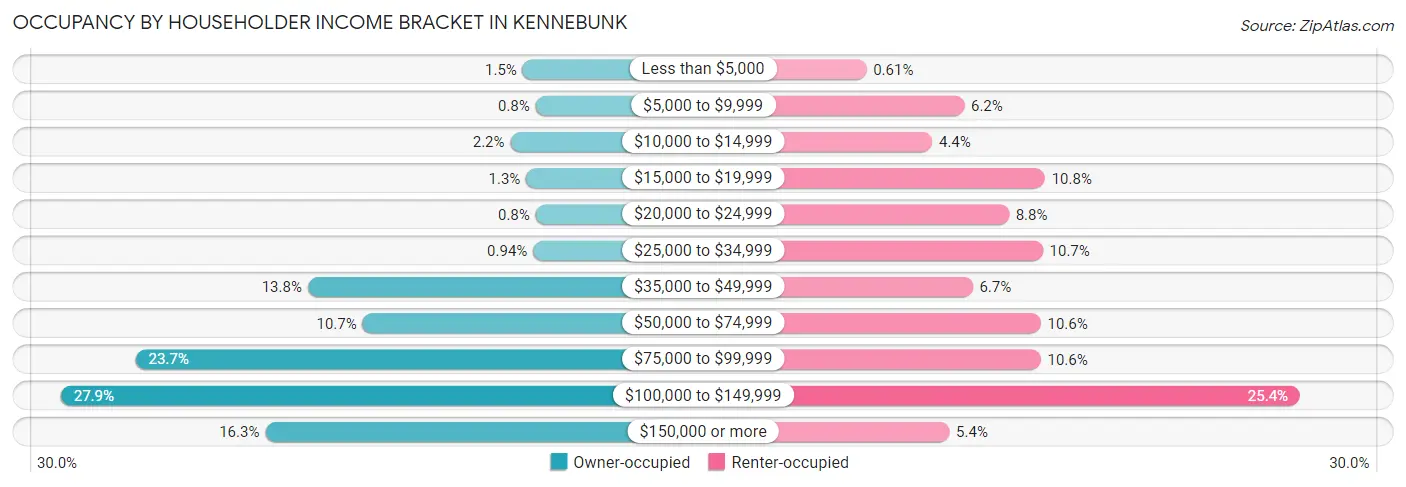
| Income Bracket | Owner-occupied | Renter-occupied |
| Less than $5,000 | 31 (1.5%) | 5 (0.6%) |
| $5,000 to $9,999 | 16 (0.8%) | 51 (6.2%) |
| $10,000 to $14,999 | 45 (2.2%) | 36 (4.4%) |
| $15,000 to $19,999 | 27 (1.3%) | 89 (10.8%) |
| $20,000 to $24,999 | 16 (0.8%) | 72 (8.7%) |
| $25,000 to $34,999 | 19 (0.9%) | 88 (10.7%) |
| $35,000 to $49,999 | 278 (13.8%) | 55 (6.7%) |
| $50,000 to $74,999 | 215 (10.7%) | 87 (10.6%) |
| $75,000 to $99,999 | 476 (23.7%) | 87 (10.6%) |
| $100,000 to $149,999 | 562 (27.9%) | 209 (25.4%) |
| $150,000 or more | 327 (16.3%) | 44 (5.3%) |
| Total | 2,012 (100.0%) | 823 (100.0%) |
Monthly Housing Cost Tiers in Kennebunk
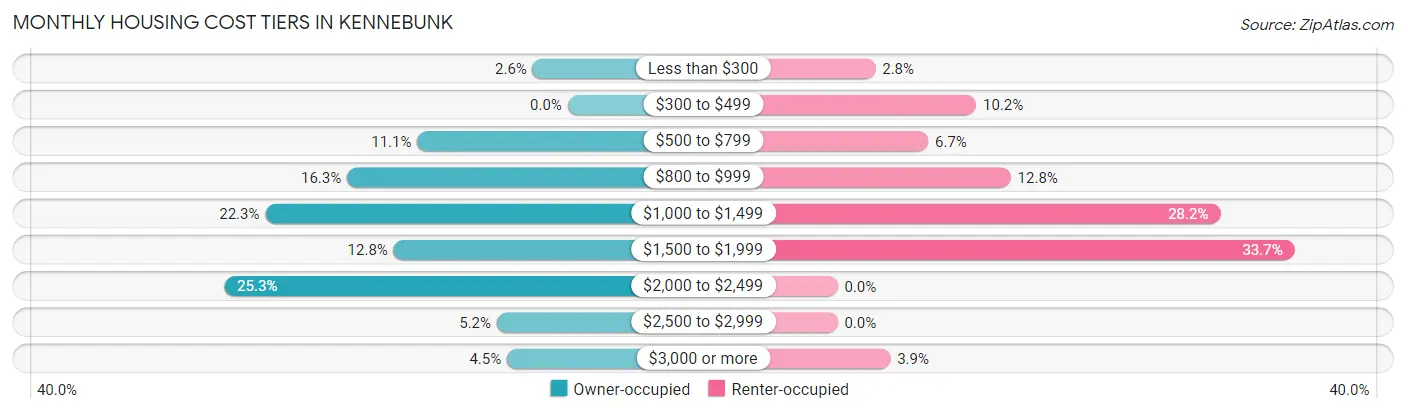
| Monthly Cost | Owner-occupied | Renter-occupied |
| Less than $300 | 52 (2.6%) | 23 (2.8%) |
| $300 to $499 | 0 (0.0%) | 84 (10.2%) |
| $500 to $799 | 223 (11.1%) | 55 (6.7%) |
| $800 to $999 | 327 (16.3%) | 105 (12.8%) |
| $1,000 to $1,499 | 448 (22.3%) | 232 (28.2%) |
| $1,500 to $1,999 | 258 (12.8%) | 277 (33.7%) |
| $2,000 to $2,499 | 509 (25.3%) | 0 (0.0%) |
| $2,500 to $2,999 | 105 (5.2%) | 0 (0.0%) |
| $3,000 or more | 90 (4.5%) | 32 (3.9%) |
| Total | 2,012 (100.0%) | 823 (100.0%) |
Physical Housing Characteristics in Kennebunk
Housing Structures in Kennebunk
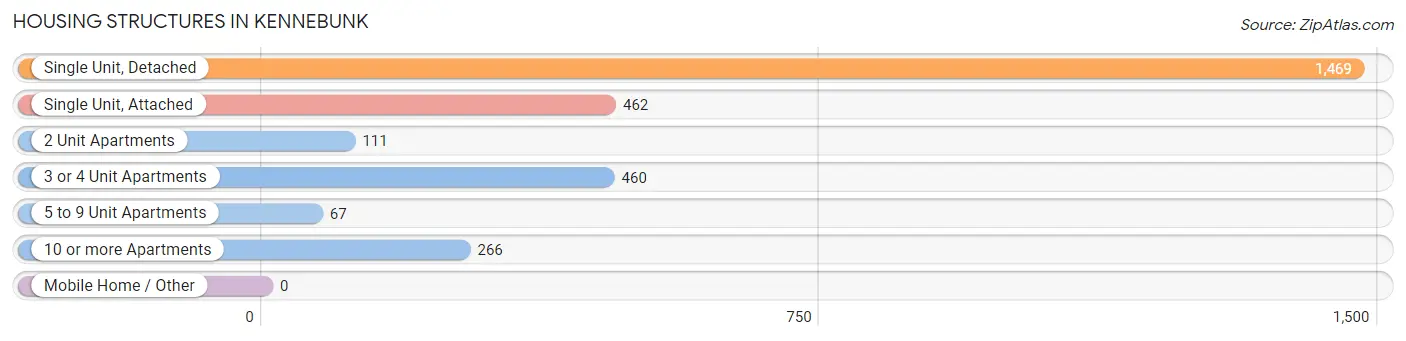
| Structure Type | # Housing Units | % Housing Units |
| Single Unit, Detached | 1,469 | 51.8% |
| Single Unit, Attached | 462 | 16.3% |
| 2 Unit Apartments | 111 | 3.9% |
| 3 or 4 Unit Apartments | 460 | 16.2% |
| 5 to 9 Unit Apartments | 67 | 2.4% |
| 10 or more Apartments | 266 | 9.4% |
| Mobile Home / Other | 0 | 0.0% |
| Total | 2,835 | 100.0% |
Housing Structures by Occupancy in Kennebunk
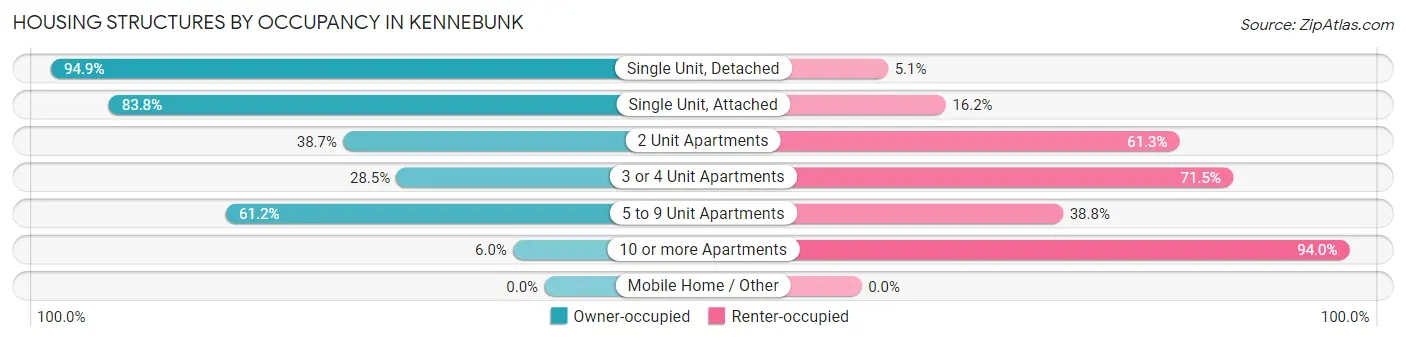
| Structure Type | Owner-occupied | Renter-occupied |
| Single Unit, Detached | 1,394 (94.9%) | 75 (5.1%) |
| Single Unit, Attached | 387 (83.8%) | 75 (16.2%) |
| 2 Unit Apartments | 43 (38.7%) | 68 (61.3%) |
| 3 or 4 Unit Apartments | 131 (28.5%) | 329 (71.5%) |
| 5 to 9 Unit Apartments | 41 (61.2%) | 26 (38.8%) |
| 10 or more Apartments | 16 (6.0%) | 250 (94.0%) |
| Mobile Home / Other | 0 (0.0%) | 0 (0.0%) |
| Total | 2,012 (71.0%) | 823 (29.0%) |
Housing Structures by Number of Rooms in Kennebunk
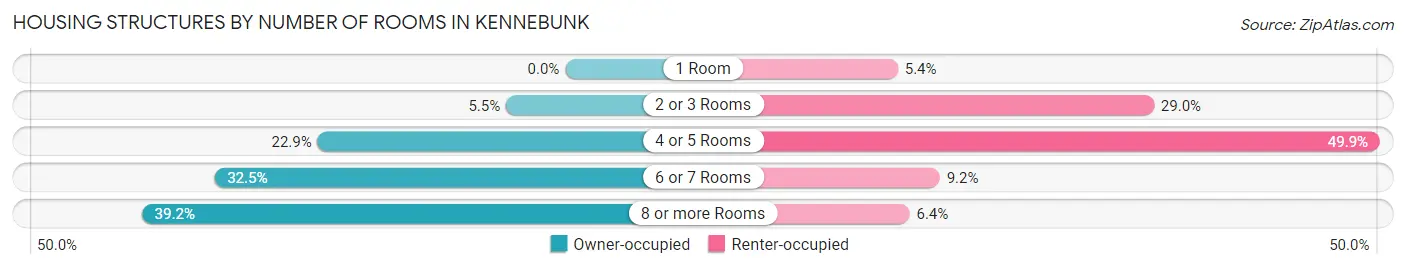
| Number of Rooms | Owner-occupied | Renter-occupied |
| 1 Room | 0 (0.0%) | 44 (5.3%) |
| 2 or 3 Rooms | 110 (5.5%) | 239 (29.0%) |
| 4 or 5 Rooms | 461 (22.9%) | 411 (49.9%) |
| 6 or 7 Rooms | 653 (32.5%) | 76 (9.2%) |
| 8 or more Rooms | 788 (39.2%) | 53 (6.4%) |
| Total | 2,012 (100.0%) | 823 (100.0%) |
Housing Structure by Heating Type in Kennebunk
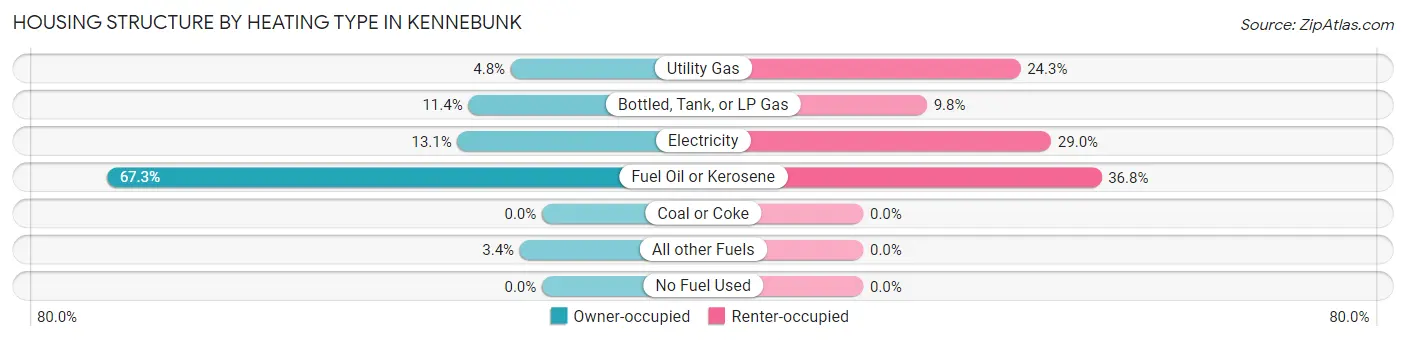
| Heating Type | Owner-occupied | Renter-occupied |
| Utility Gas | 97 (4.8%) | 200 (24.3%) |
| Bottled, Tank, or LP Gas | 229 (11.4%) | 81 (9.8%) |
| Electricity | 263 (13.1%) | 239 (29.0%) |
| Fuel Oil or Kerosene | 1,354 (67.3%) | 303 (36.8%) |
| Coal or Coke | 0 (0.0%) | 0 (0.0%) |
| All other Fuels | 69 (3.4%) | 0 (0.0%) |
| No Fuel Used | 0 (0.0%) | 0 (0.0%) |
| Total | 2,012 (100.0%) | 823 (100.0%) |
Household Vehicle Usage in Kennebunk
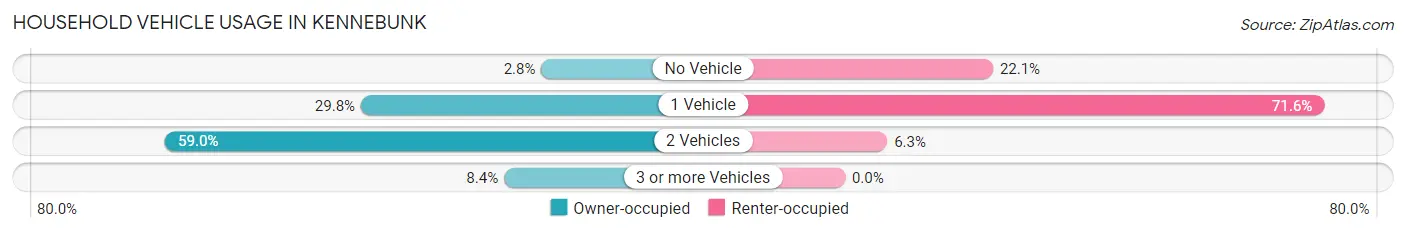
| Vehicles per Household | Owner-occupied | Renter-occupied |
| No Vehicle | 57 (2.8%) | 182 (22.1%) |
| 1 Vehicle | 599 (29.8%) | 589 (71.6%) |
| 2 Vehicles | 1,187 (59.0%) | 52 (6.3%) |
| 3 or more Vehicles | 169 (8.4%) | 0 (0.0%) |
| Total | 2,012 (100.0%) | 823 (100.0%) |
Real Estate & Mortgages in Kennebunk
Real Estate and Mortgage Overview in Kennebunk
| Characteristic | Without Mortgage | With Mortgage |
| Housing Units | 748 | 1,264 |
| Median Property Value | $357,900 | $366,300 |
| Median Household Income | $75,735 | $203 |
| Monthly Housing Costs | $891 | $90 |
| Real Estate Taxes | $4,331 | $14 |
Property Value by Mortgage Status in Kennebunk
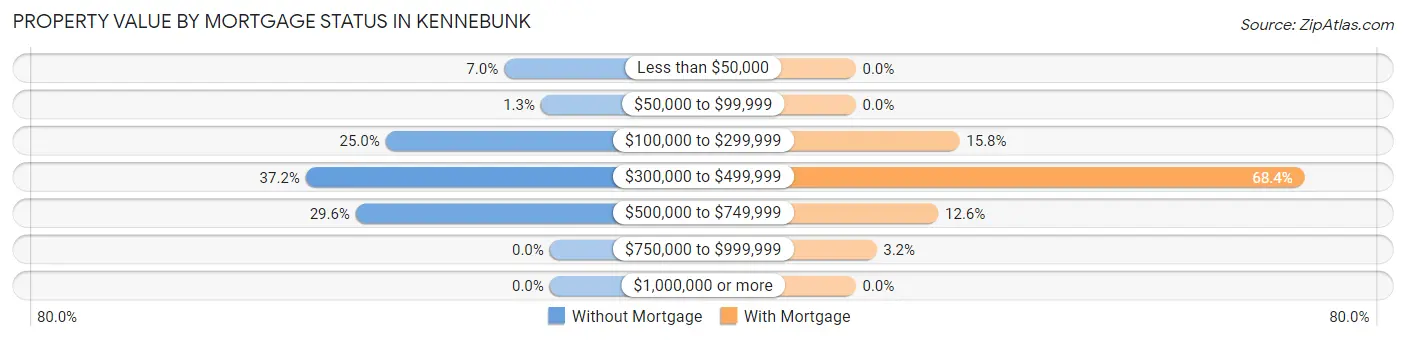
| Property Value | Without Mortgage | With Mortgage |
| Less than $50,000 | 52 (7.0%) | 0 (0.0%) |
| $50,000 to $99,999 | 10 (1.3%) | 0 (0.0%) |
| $100,000 to $299,999 | 187 (25.0%) | 200 (15.8%) |
| $300,000 to $499,999 | 278 (37.2%) | 865 (68.4%) |
| $500,000 to $749,999 | 221 (29.5%) | 159 (12.6%) |
| $750,000 to $999,999 | 0 (0.0%) | 40 (3.2%) |
| $1,000,000 or more | 0 (0.0%) | 0 (0.0%) |
| Total | 748 (100.0%) | 1,264 (100.0%) |
Household Income by Mortgage Status in Kennebunk
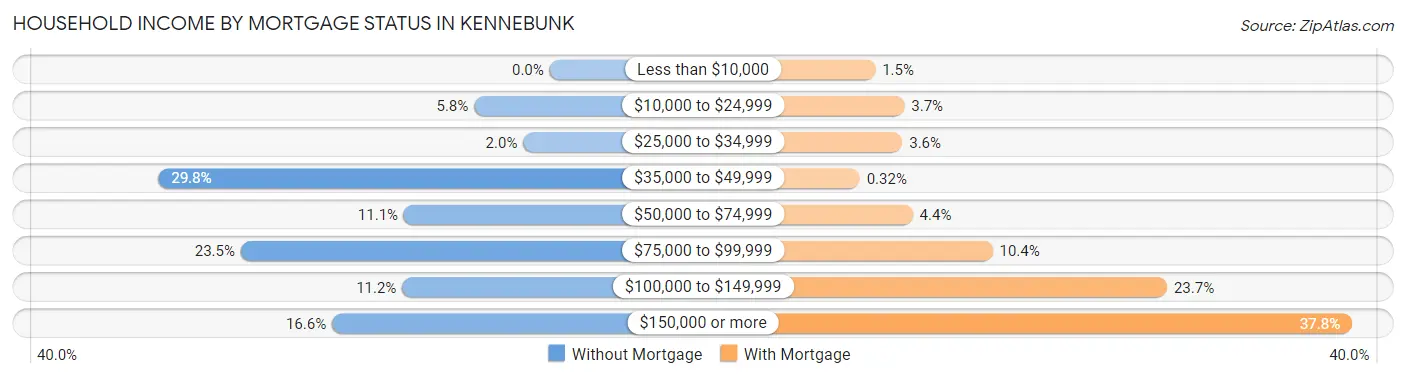
| Household Income | Without Mortgage | With Mortgage |
| Less than $10,000 | 0 (0.0%) | 19 (1.5%) |
| $10,000 to $24,999 | 43 (5.8%) | 47 (3.7%) |
| $25,000 to $34,999 | 15 (2.0%) | 45 (3.6%) |
| $35,000 to $49,999 | 223 (29.8%) | 4 (0.3%) |
| $50,000 to $74,999 | 83 (11.1%) | 55 (4.3%) |
| $75,000 to $99,999 | 176 (23.5%) | 132 (10.4%) |
| $100,000 to $149,999 | 84 (11.2%) | 300 (23.7%) |
| $150,000 or more | 124 (16.6%) | 478 (37.8%) |
| Total | 748 (100.0%) | 1,264 (100.0%) |
Property Value to Household Income Ratio in Kennebunk
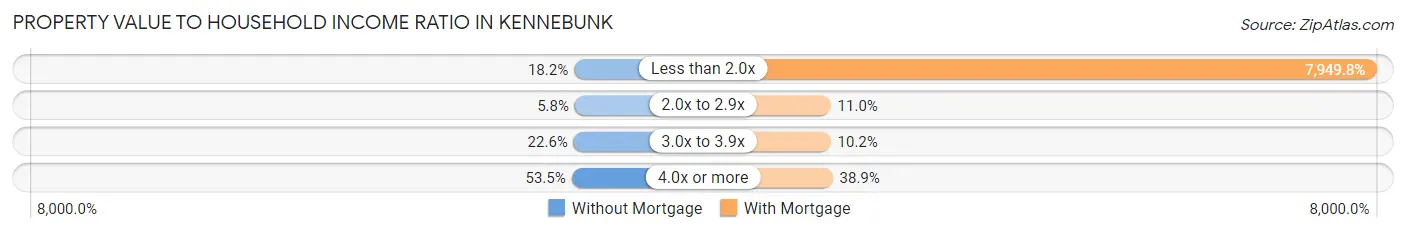
| Value-to-Income Ratio | Without Mortgage | With Mortgage |
| Less than 2.0x | 136 (18.2%) | 100,486 (7,949.8%) |
| 2.0x to 2.9x | 43 (5.8%) | 139 (11.0%) |
| 3.0x to 3.9x | 169 (22.6%) | 129 (10.2%) |
| 4.0x or more | 400 (53.5%) | 492 (38.9%) |
| Total | 748 (100.0%) | 1,264 (100.0%) |
Real Estate Taxes by Mortgage Status in Kennebunk
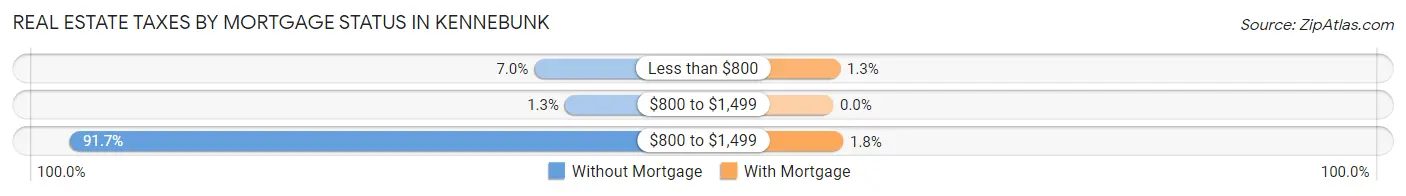
| Property Taxes | Without Mortgage | With Mortgage |
| Less than $800 | 52 (7.0%) | 16 (1.3%) |
| $800 to $1,499 | 10 (1.3%) | 0 (0.0%) |
| $800 to $1,499 | 686 (91.7%) | 23 (1.8%) |
| Total | 748 (100.0%) | 1,264 (100.0%) |
Health & Disability in Kennebunk
Health Insurance Coverage by Age in Kennebunk
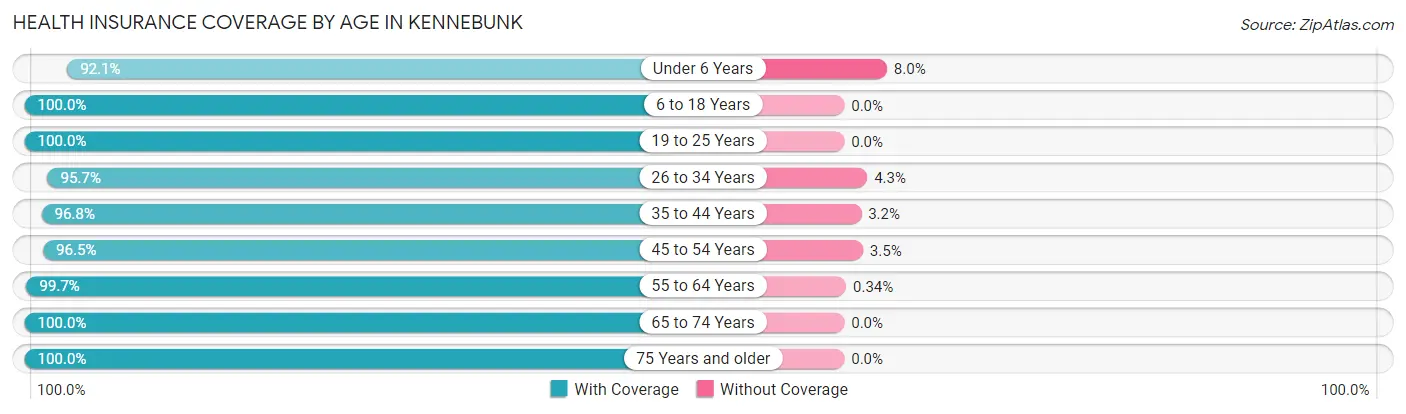
| Age Bracket | With Coverage | Without Coverage |
| Under 6 Years | 220 (92.0%) | 19 (8.0%) |
| 6 to 18 Years | 823 (100.0%) | 0 (0.0%) |
| 19 to 25 Years | 186 (100.0%) | 0 (0.0%) |
| 26 to 34 Years | 537 (95.7%) | 24 (4.3%) |
| 35 to 44 Years | 460 (96.8%) | 15 (3.2%) |
| 45 to 54 Years | 668 (96.5%) | 24 (3.5%) |
| 55 to 64 Years | 875 (99.7%) | 3 (0.3%) |
| 65 to 74 Years | 1,159 (100.0%) | 0 (0.0%) |
| 75 Years and older | 764 (100.0%) | 0 (0.0%) |
| Total | 5,692 (98.5%) | 85 (1.5%) |
Health Insurance Coverage by Citizenship Status in Kennebunk
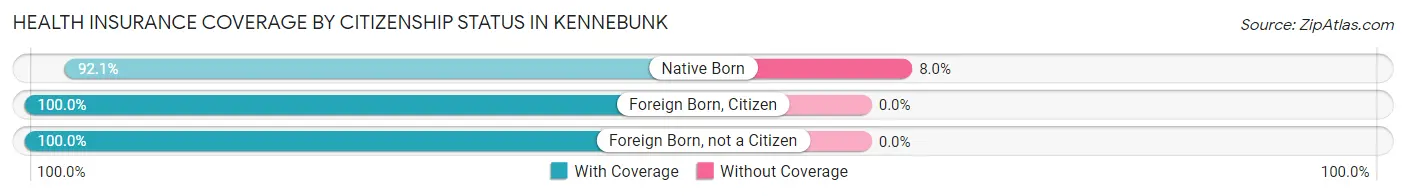
| Citizenship Status | With Coverage | Without Coverage |
| Native Born | 220 (92.0%) | 19 (8.0%) |
| Foreign Born, Citizen | 823 (100.0%) | 0 (0.0%) |
| Foreign Born, not a Citizen | 186 (100.0%) | 0 (0.0%) |
Health Insurance Coverage by Household Income in Kennebunk
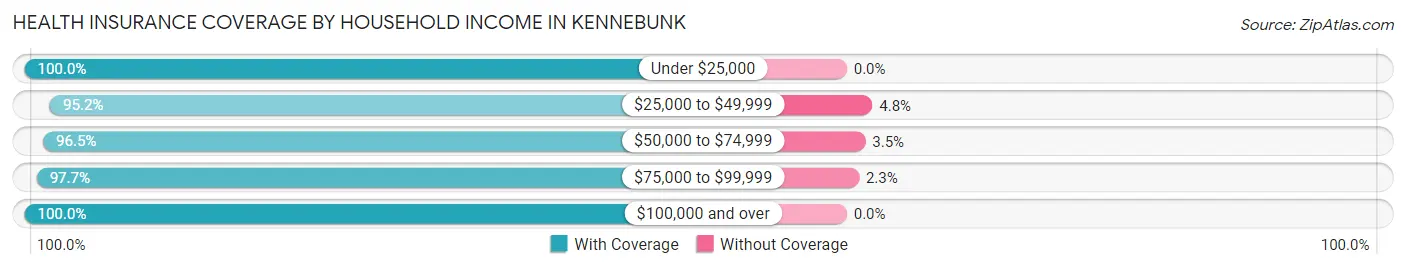
| Household Income | With Coverage | Without Coverage |
| Under $25,000 | 388 (100.0%) | 0 (0.0%) |
| $25,000 to $49,999 | 596 (95.2%) | 30 (4.8%) |
| $50,000 to $74,999 | 527 (96.5%) | 19 (3.5%) |
| $75,000 to $99,999 | 1,331 (97.7%) | 31 (2.3%) |
| $100,000 and over | 2,811 (100.0%) | 0 (0.0%) |
Public vs Private Health Insurance Coverage by Age in Kennebunk
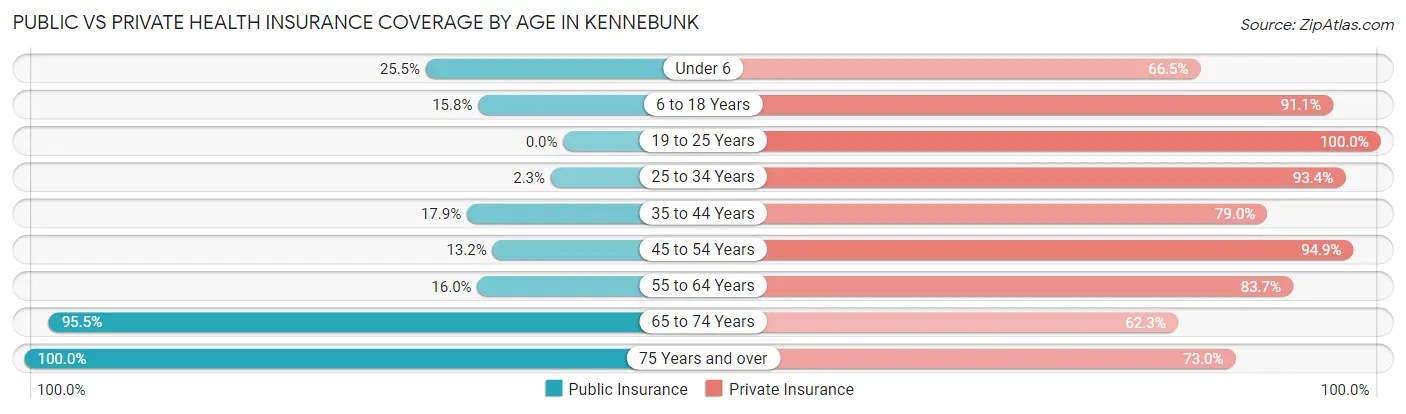
| Age Bracket | Public Insurance | Private Insurance |
| Under 6 | 61 (25.5%) | 159 (66.5%) |
| 6 to 18 Years | 130 (15.8%) | 750 (91.1%) |
| 19 to 25 Years | 0 (0.0%) | 186 (100.0%) |
| 25 to 34 Years | 13 (2.3%) | 524 (93.4%) |
| 35 to 44 Years | 85 (17.9%) | 375 (78.9%) |
| 45 to 54 Years | 91 (13.2%) | 657 (94.9%) |
| 55 to 64 Years | 140 (16.0%) | 735 (83.7%) |
| 65 to 74 Years | 1,107 (95.5%) | 722 (62.3%) |
| 75 Years and over | 764 (100.0%) | 558 (73.0%) |
| Total | 2,391 (41.4%) | 4,666 (80.8%) |
Disability Status by Sex by Age in Kennebunk
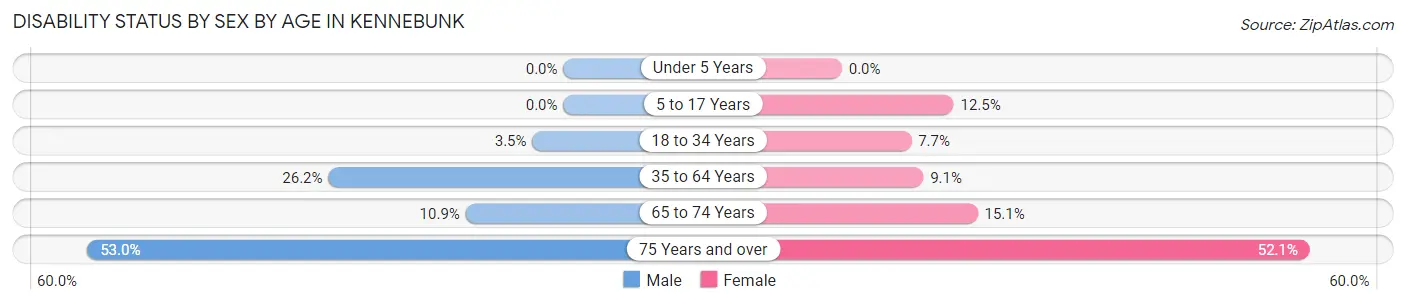
| Age Bracket | Male | Female |
| Under 5 Years | 0 (0.0%) | 0 (0.0%) |
| 5 to 17 Years | 0 (0.0%) | 30 (12.4%) |
| 18 to 34 Years | 13 (3.5%) | 30 (7.7%) |
| 35 to 64 Years | 235 (26.2%) | 104 (9.1%) |
| 65 to 74 Years | 57 (10.9%) | 96 (15.1%) |
| 75 Years and over | 167 (53.0%) | 234 (52.1%) |
Disability Class by Sex by Age in Kennebunk
Disability Class: Hearing Difficulty
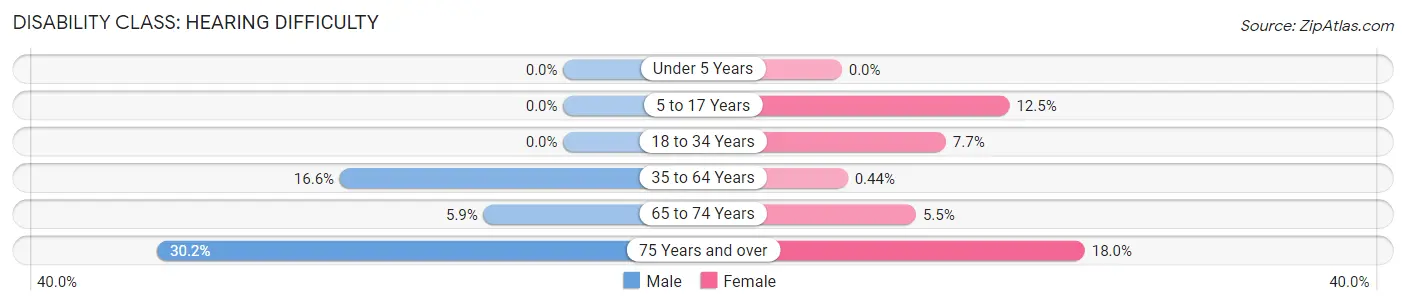
| Age Bracket | Male | Female |
| Under 5 Years | 0 (0.0%) | 0 (0.0%) |
| 5 to 17 Years | 0 (0.0%) | 30 (12.4%) |
| 18 to 34 Years | 0 (0.0%) | 30 (7.7%) |
| 35 to 64 Years | 149 (16.6%) | 5 (0.4%) |
| 65 to 74 Years | 31 (5.9%) | 35 (5.5%) |
| 75 Years and over | 95 (30.2%) | 81 (18.0%) |
Disability Class: Vision Difficulty
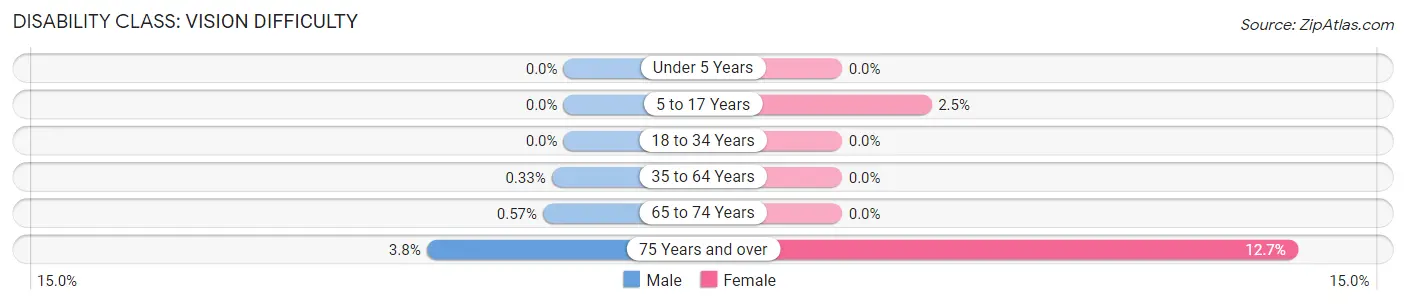
| Age Bracket | Male | Female |
| Under 5 Years | 0 (0.0%) | 0 (0.0%) |
| 5 to 17 Years | 0 (0.0%) | 6 (2.5%) |
| 18 to 34 Years | 0 (0.0%) | 0 (0.0%) |
| 35 to 64 Years | 3 (0.3%) | 0 (0.0%) |
| 65 to 74 Years | 3 (0.6%) | 0 (0.0%) |
| 75 Years and over | 12 (3.8%) | 57 (12.7%) |
Disability Class: Cognitive Difficulty
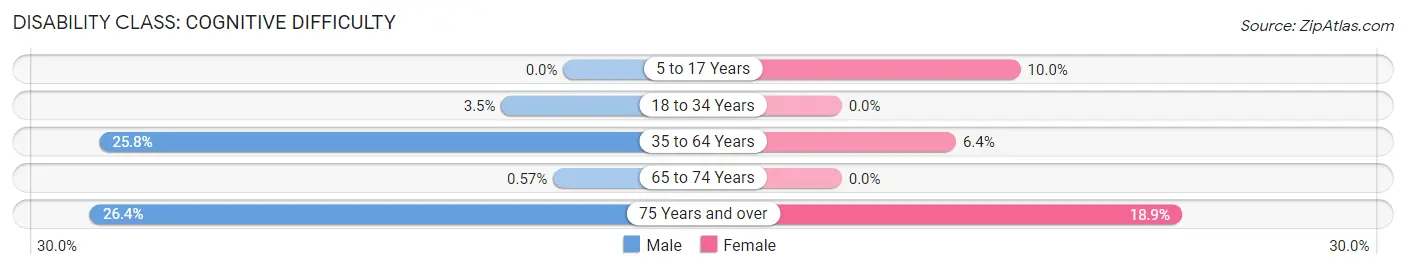
| Age Bracket | Male | Female |
| 5 to 17 Years | 0 (0.0%) | 24 (10.0%) |
| 18 to 34 Years | 13 (3.5%) | 0 (0.0%) |
| 35 to 64 Years | 232 (25.8%) | 73 (6.4%) |
| 65 to 74 Years | 3 (0.6%) | 0 (0.0%) |
| 75 Years and over | 83 (26.4%) | 85 (18.9%) |
Disability Class: Ambulatory Difficulty
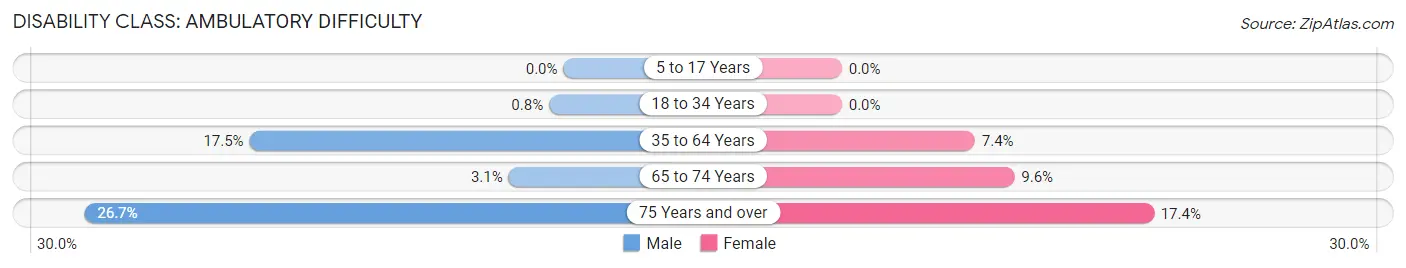
| Age Bracket | Male | Female |
| 5 to 17 Years | 0 (0.0%) | 0 (0.0%) |
| 18 to 34 Years | 3 (0.8%) | 0 (0.0%) |
| 35 to 64 Years | 157 (17.5%) | 85 (7.4%) |
| 65 to 74 Years | 16 (3.0%) | 61 (9.6%) |
| 75 Years and over | 84 (26.7%) | 78 (17.4%) |
Disability Class: Self-Care Difficulty
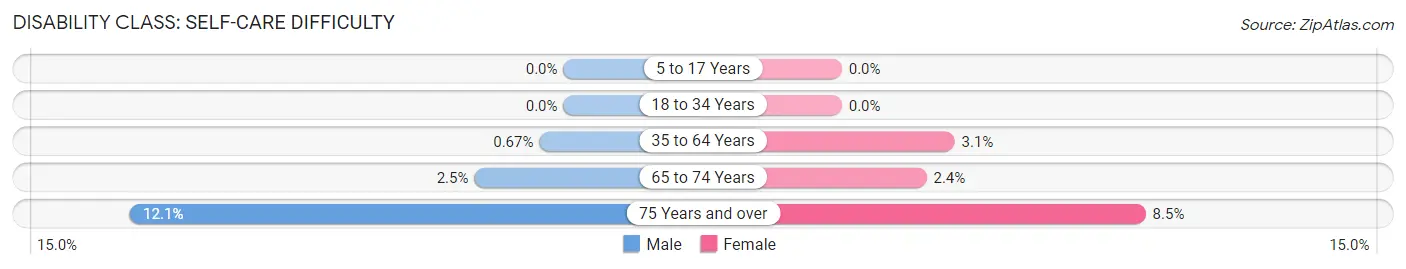
| Age Bracket | Male | Female |
| 5 to 17 Years | 0 (0.0%) | 0 (0.0%) |
| 18 to 34 Years | 0 (0.0%) | 0 (0.0%) |
| 35 to 64 Years | 6 (0.7%) | 36 (3.1%) |
| 65 to 74 Years | 13 (2.5%) | 15 (2.4%) |
| 75 Years and over | 38 (12.1%) | 38 (8.5%) |
Technology Access in Kennebunk
Computing Device Access in Kennebunk
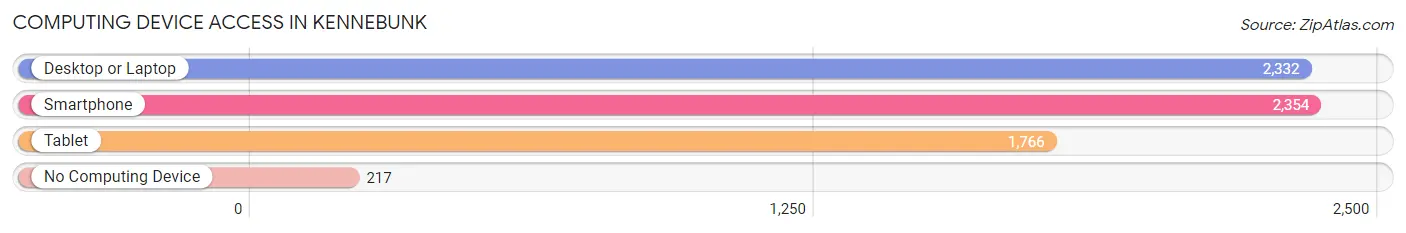
| Device Type | # Households | % Households |
| Desktop or Laptop | 2,332 | 82.3% |
| Smartphone | 2,354 | 83.0% |
| Tablet | 1,766 | 62.3% |
| No Computing Device | 217 | 7.6% |
| Total | 2,835 | 100.0% |
Internet Access in Kennebunk
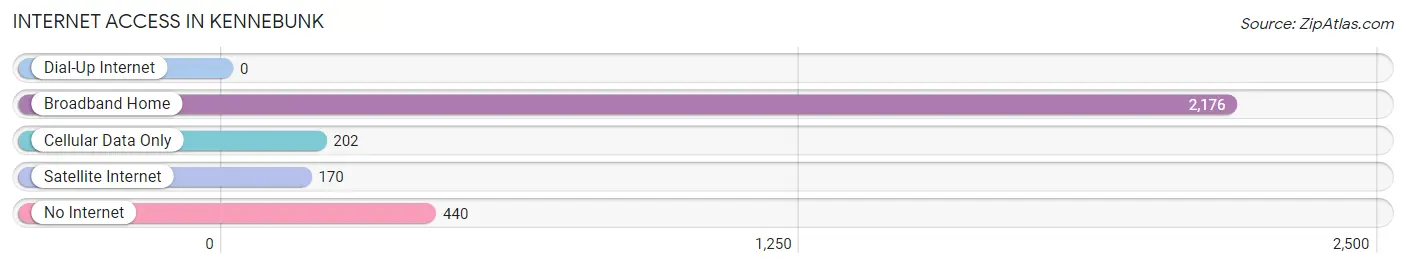
| Internet Type | # Households | % Households |
| Dial-Up Internet | 0 | 0.0% |
| Broadband Home | 2,176 | 76.7% |
| Cellular Data Only | 202 | 7.1% |
| Satellite Internet | 170 | 6.0% |
| No Internet | 440 | 15.5% |
| Total | 2,835 | 100.0% |
Kennebunk Summary
Kennebunk, Maine is a small town located in York County, in the southern part of the state. It is situated on the banks of the Kennebunk River, and is bordered by the towns of Wells, Arundel, and Biddeford. The town has a population of 10,798, according to the 2010 census.
History
Kennebunk was first settled in 1621 by English colonists, who named it Arundel after the town in England. The town was incorporated in 1663, and was renamed Kennebunk in 1718. The name is derived from the Abenaki word for "long cut bank," referring to the river.
Kennebunk was an important port in the 18th and 19th centuries, and was home to several shipbuilding yards. The town was also a center of the lumber industry, and was home to several mills.
Geography
Kennebunk is located in southern Maine, on the banks of the Kennebunk River. The town is bordered by the towns of Wells, Arundel, and Biddeford. The town is located approximately 25 miles south of Portland, and is part of the Portland-South Portland-Biddeford metropolitan area.
The town has a total area of 16.2 square miles, of which 15.7 square miles is land and 0.5 square miles is water. The town is located in a hilly region, with the highest point being the summit of Bald Hill, at an elevation of 437 feet.
Economy
Kennebunk is a largely residential community, and the economy is largely based on tourism. The town is home to several popular beaches, including Gooch's Beach, Middle Beach, and Mother's Beach. The town is also home to several historic sites, including the Kennebunkport Historical Society, the Brick Store Museum, and the Kennebunk Free Library.
The town is also home to several businesses, including restaurants, retail stores, and professional services. The town is also home to several manufacturing companies, including the Kennebunkport Boat Works, which produces wooden boats.
Demographics
According to the 2010 census, Kennebunk has a population of 10,798. The racial makeup of the town is 94.3% White, 1.2% African American, 0.4% Native American, 1.2% Asian, 0.1% Pacific Islander, 1.2% from other races, and 1.6% from two or more races. Hispanic or Latino of any race were 2.3% of the population.
The median income for a household in the town was $50,945, and the median income for a family was $62,917. The per capita income for the town was $30,945. About 5.2% of families and 7.2% of the population were below the poverty line, including 8.3% of those under age 18 and 5.2% of those age 65 or over.
Common Questions
What is Per Capita Income in Kennebunk?
Per Capita income in Kennebunk is $43,741.
What is the Median Family Income in Kennebunk?
Median Family Income in Kennebunk is $101,176.
What is the Median Household income in Kennebunk?
Median Household Income in Kennebunk is $88,996.
What is Income or Wage Gap in Kennebunk?
Income or Wage Gap in Kennebunk is 29.9%.
Women in Kennebunk earn 70.1 cents for every dollar earned by a man.
What is Inequality or Gini Index in Kennebunk?
Inequality or Gini Index in Kennebunk is 0.36.
What is the Total Population of Kennebunk?
Total Population of Kennebunk is 6,000.
What is the Total Male Population of Kennebunk?
Total Male Population of Kennebunk is 2,939.
What is the Total Female Population of Kennebunk?
Total Female Population of Kennebunk is 3,061.
What is the Ratio of Males per 100 Females in Kennebunk?
There are 96.01 Males per 100 Females in Kennebunk.
What is the Ratio of Females per 100 Males in Kennebunk?
There are 104.15 Females per 100 Males in Kennebunk.
What is the Median Population Age in Kennebunk?
Median Population Age in Kennebunk is 55.1 Years.
What is the Average Family Size in Kennebunk
Average Family Size in Kennebunk is 2.4 People.
What is the Average Household Size in Kennebunk
Average Household Size in Kennebunk is 2.0 People.
How Large is the Labor Force in Kennebunk?
There are 2,918 People in the Labor Forcein in Kennebunk.
What is the Percentage of People in the Labor Force in Kennebunk?
57.7% of People are in the Labor Force in Kennebunk.
What is the Unemployment Rate in Kennebunk?
Unemployment Rate in Kennebunk is 6.5%.