Winslow, ME Map & Demographics
Winslow Map
Winslow Overview
$31,626
PER CAPITA INCOME
$77,525
AVG FAMILY INCOME
$53,896
AVG HOUSEHOLD INCOME
32.3%
WAGE / INCOME GAP [ % ]
67.7¢/ $1
WAGE / INCOME GAP [ $ ]
0.38
INEQUALITY / GINI INDEX
5,597
TOTAL POPULATION
2,510
MALE POPULATION
3,087
FEMALE POPULATION
81.31
MALES / 100 FEMALES
122.99
FEMALES / 100 MALES
41.5
MEDIAN AGE
2.9
AVG FAMILY SIZE
2.3
AVG HOUSEHOLD SIZE
2,507
LABOR FORCE [ PEOPLE ]
55.1%
PERCENT IN LABOR FORCE
2.4%
UNEMPLOYMENT RATE
Winslow Area Codes
Income in Winslow
Income Overview in Winslow
Per Capita Income in Winslow is $31,626, while median incomes of families and households are $77,525 and $53,896 respectively.
| Characteristic | Number | Measure |
| Per Capita Income | 5,597 | $31,626 |
| Median Family Income | 1,453 | $77,525 |
| Mean Family Income | 1,453 | $85,176 |
| Median Household Income | 2,445 | $53,896 |
| Mean Household Income | 2,445 | $72,924 |
| Income Deficit | 1,453 | $0 |
| Wage / Income Gap (%) | 5,597 | 32.27% |
| Wage / Income Gap ($) | 5,597 | 67.73¢ per $1 |
| Gini / Inequality Index | 5,597 | 0.38 |
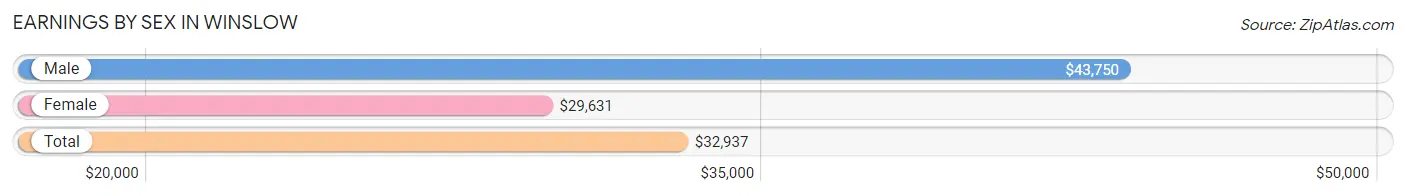
Earnings by Sex in Winslow
Average Earnings in Winslow are $32,937, $43,750 for men and $29,631 for women, a difference of 32.3%.
| Sex | Number | Average Earnings |
| Male | 1,373 (49.7%) | $43,750 |
| Female | 1,387 (50.2%) | $29,631 |
| Total | 2,760 (100.0%) | $32,937 |
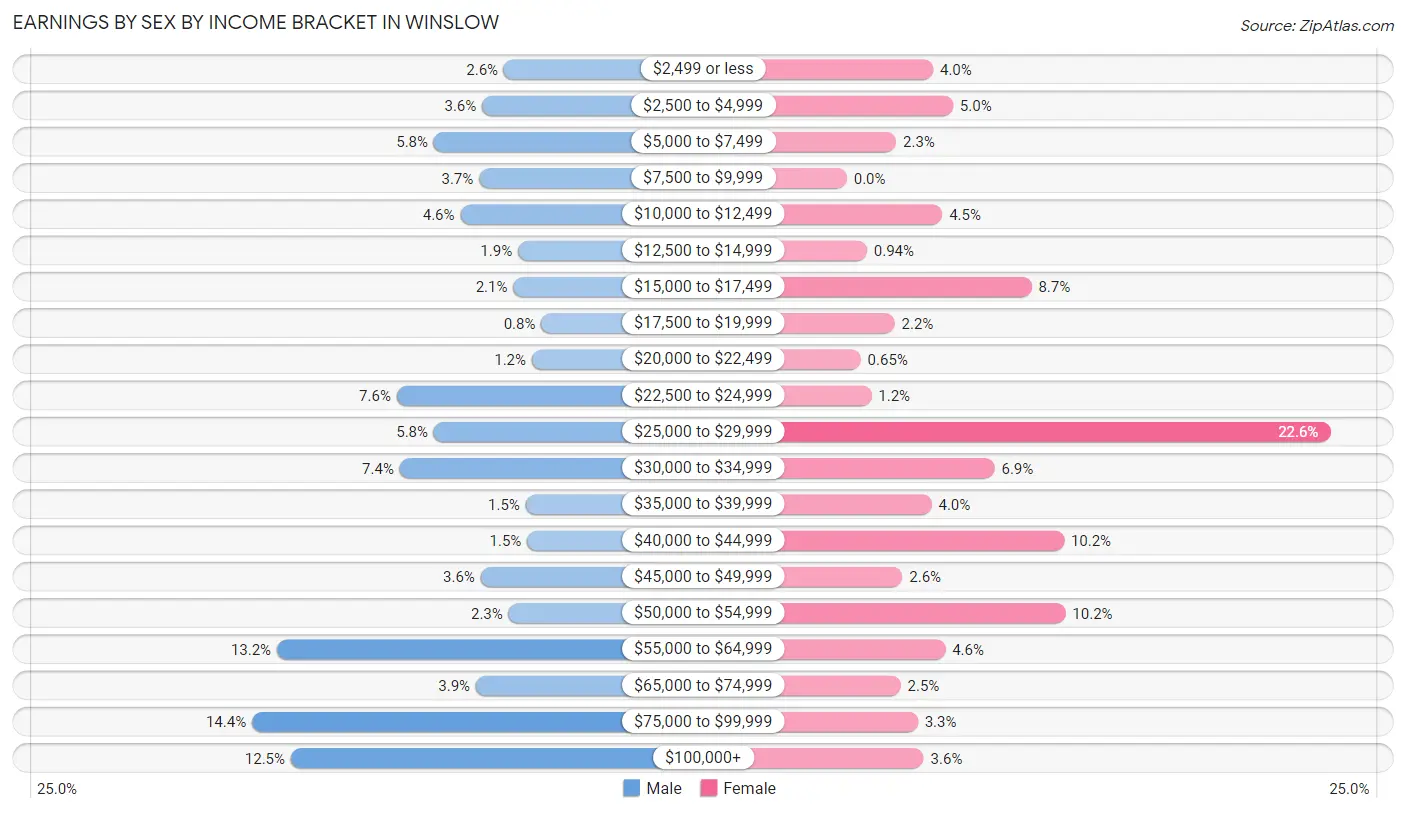
Earnings by Sex by Income Bracket in Winslow
The most common earnings brackets in Winslow are $75,000 to $99,999 for men (197 | 14.3%) and $25,000 to $29,999 for women (314 | 22.6%).
| Income | Male | Female |
| $2,499 or less | 35 (2.5%) | 56 (4.0%) |
| $2,500 to $4,999 | 49 (3.6%) | 69 (5.0%) |
| $5,000 to $7,499 | 80 (5.8%) | 32 (2.3%) |
| $7,500 to $9,999 | 51 (3.7%) | 0 (0.0%) |
| $10,000 to $12,499 | 63 (4.6%) | 62 (4.5%) |
| $12,500 to $14,999 | 26 (1.9%) | 13 (0.9%) |
| $15,000 to $17,499 | 29 (2.1%) | 120 (8.6%) |
| $17,500 to $19,999 | 11 (0.8%) | 31 (2.2%) |
| $20,000 to $22,499 | 17 (1.2%) | 9 (0.6%) |
| $22,500 to $24,999 | 104 (7.6%) | 16 (1.1%) |
| $25,000 to $29,999 | 80 (5.8%) | 314 (22.6%) |
| $30,000 to $34,999 | 102 (7.4%) | 96 (6.9%) |
| $35,000 to $39,999 | 21 (1.5%) | 55 (4.0%) |
| $40,000 to $44,999 | 20 (1.5%) | 141 (10.2%) |
| $45,000 to $49,999 | 50 (3.6%) | 36 (2.6%) |
| $50,000 to $54,999 | 32 (2.3%) | 142 (10.2%) |
| $55,000 to $64,999 | 181 (13.2%) | 64 (4.6%) |
| $65,000 to $74,999 | 53 (3.9%) | 35 (2.5%) |
| $75,000 to $99,999 | 197 (14.3%) | 46 (3.3%) |
| $100,000+ | 172 (12.5%) | 50 (3.6%) |
| Total | 1,373 (100.0%) | 1,387 (100.0%) |
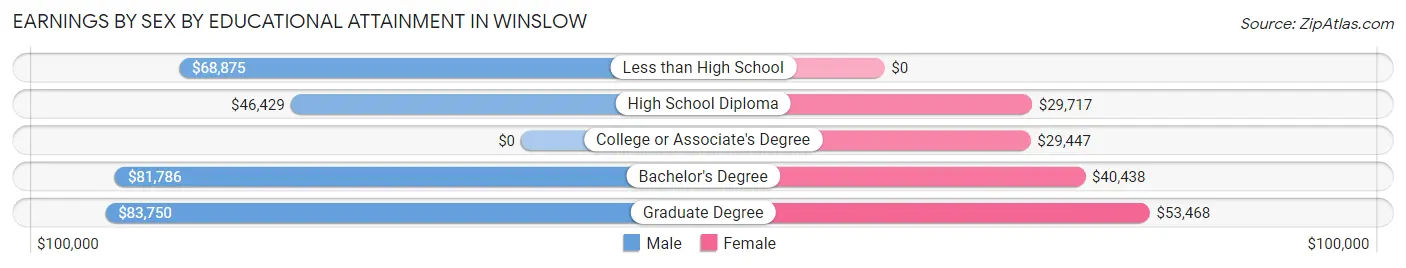
Earnings by Sex by Educational Attainment in Winslow
Average earnings in Winslow are $56,149 for men and $30,726 for women, a difference of 45.3%. Men with an educational attainment of graduate degree enjoy the highest average annual earnings of $83,750, while those with high school diploma education earn the least with $46,429. Women with an educational attainment of graduate degree earn the most with the average annual earnings of $53,468, while those with college or associate's degree education have the smallest earnings of $29,447.
| Educational Attainment | Male Income | Female Income |
| Less than High School | $68,875 | $0 |
| High School Diploma | $46,429 | $29,717 |
| College or Associate's Degree | - | - |
| Bachelor's Degree | $81,786 | $40,438 |
| Graduate Degree | $83,750 | $53,468 |
| Total | $56,149 | $30,726 |
Family Income in Winslow
Family Income Brackets in Winslow
According to the Winslow family income data, there are 334 families falling into the $100,000 to $149,999 income range, which is the most common income bracket and makes up 23.0% of all families. Conversely, the $10,000 to $14,999 income bracket is the least frequent group with only 10 families (0.7%) belonging to this category.
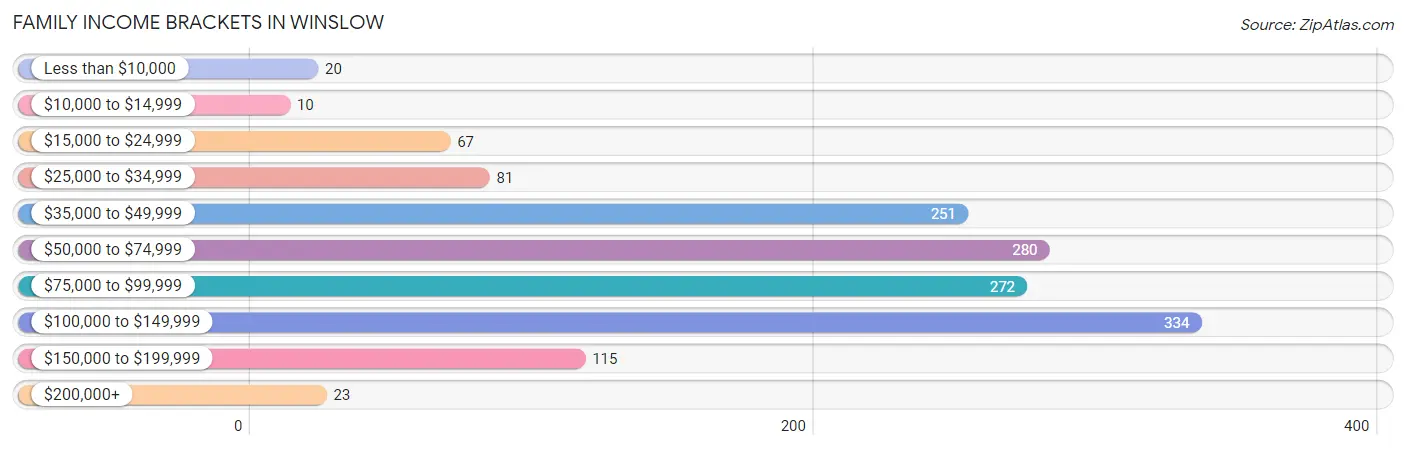
| Income Bracket | # Families | % Families |
| Less than $10,000 | 20 | 1.4% |
| $10,000 to $14,999 | 10 | 0.7% |
| $15,000 to $24,999 | 67 | 4.6% |
| $25,000 to $34,999 | 81 | 5.6% |
| $35,000 to $49,999 | 251 | 17.3% |
| $50,000 to $74,999 | 280 | 19.3% |
| $75,000 to $99,999 | 272 | 18.7% |
| $100,000 to $149,999 | 334 | 23.0% |
| $150,000 to $199,999 | 115 | 7.9% |
| $200,000+ | 23 | 1.6% |
Family Income by Famaliy Size in Winslow
4-person families (230 | 15.8%) account for the highest median family income in Winslow with $129,545 per family, while 2-person families (727 | 50.0%) have the highest median income of $35,246 per family member.
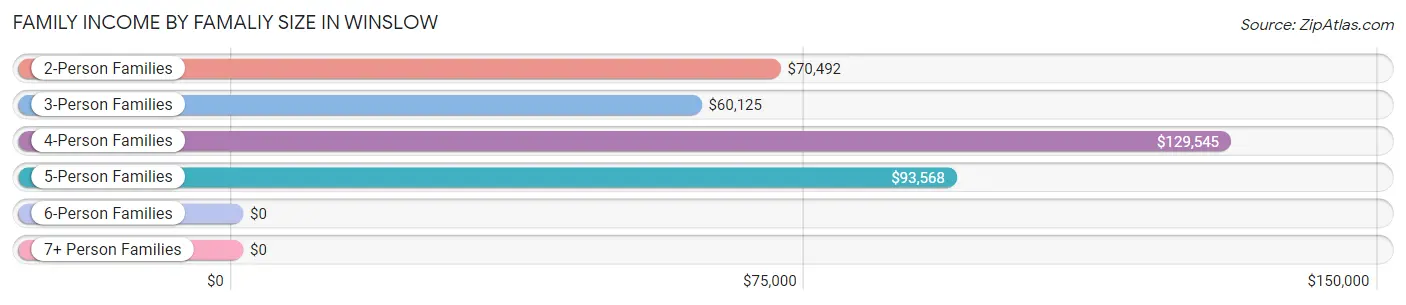
| Income Bracket | # Families | Median Income |
| 2-Person Families | 727 (50.0%) | $70,492 |
| 3-Person Families | 358 (24.6%) | $60,125 |
| 4-Person Families | 230 (15.8%) | $129,545 |
| 5-Person Families | 115 (7.9%) | $93,568 |
| 6-Person Families | 23 (1.6%) | $0 |
| 7+ Person Families | 0 (0.0%) | $0 |
| Total | 1,453 (100.0%) | $77,525 |
Family Income by Number of Earners in Winslow
The median family income in Winslow is $77,525, with families comprising 3+ earners (98) having the highest median family income of $138,780, while families with 1 earner (493) have the lowest median family income of $50,670, accounting for 6.7% and 33.9% of families, respectively.
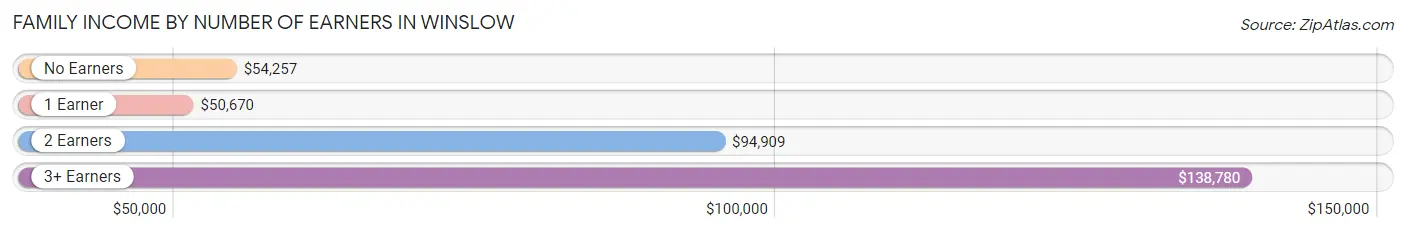
| Number of Earners | # Families | Median Income |
| No Earners | 330 (22.7%) | $54,257 |
| 1 Earner | 493 (33.9%) | $50,670 |
| 2 Earners | 532 (36.6%) | $94,909 |
| 3+ Earners | 98 (6.7%) | $138,780 |
| Total | 1,453 (100.0%) | $77,525 |
Household Income in Winslow
Household Income Brackets in Winslow
With 467 households falling in the category, the $50,000 to $74,999 income range is the most frequent in Winslow, accounting for 19.1% of all households. In contrast, only 44 households (1.8%) fall into the $200,000+ income bracket, making it the least populous group.
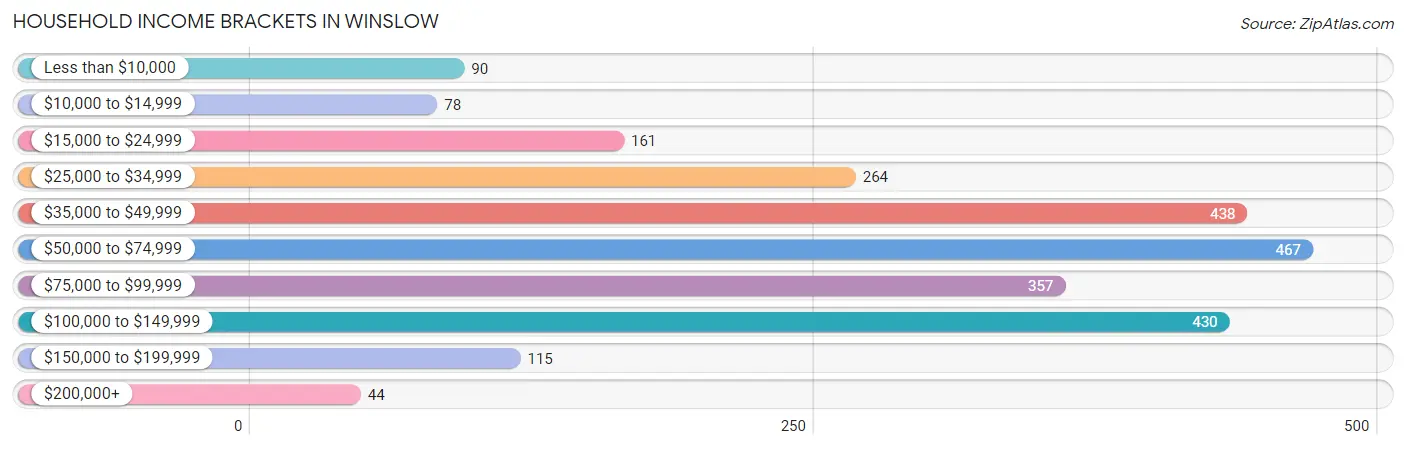
| Income Bracket | # Households | % Households |
| Less than $10,000 | 90 | 3.7% |
| $10,000 to $14,999 | 78 | 3.2% |
| $15,000 to $24,999 | 161 | 6.6% |
| $25,000 to $34,999 | 264 | 10.8% |
| $35,000 to $49,999 | 438 | 17.9% |
| $50,000 to $74,999 | 467 | 19.1% |
| $75,000 to $99,999 | 357 | 14.6% |
| $100,000 to $149,999 | 430 | 17.6% |
| $150,000 to $199,999 | 115 | 4.7% |
| $200,000+ | 44 | 1.8% |
Household Income by Householder Age in Winslow
The median household income in Winslow is $53,896, with the highest median household income of $68,393 found in the 45 to 64 years age bracket for the primary householder. A total of 898 households (36.7%) fall into this category. Meanwhile, the 15 to 24 years age bracket for the primary householder has the lowest median household income of $0, with 82 households (3.4%) in this group.
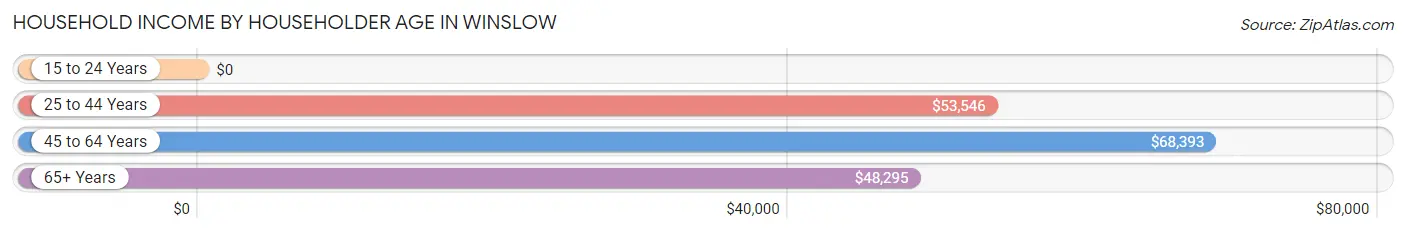
| Income Bracket | # Households | Median Income |
| 15 to 24 Years | 82 (3.4%) | $0 |
| 25 to 44 Years | 721 (29.5%) | $53,546 |
| 45 to 64 Years | 898 (36.7%) | $68,393 |
| 65+ Years | 744 (30.4%) | $48,295 |
| Total | 2,445 (100.0%) | $53,896 |
Poverty in Winslow
Income Below Poverty by Sex and Age in Winslow
With 8.9% poverty level for males and 6.7% for females among the residents of Winslow, 18 to 24 year old males and 55 to 64 year old females are the most vulnerable to poverty, with 109 males (34.6%) and 54 females (17.5%) in their respective age groups living below the poverty level.
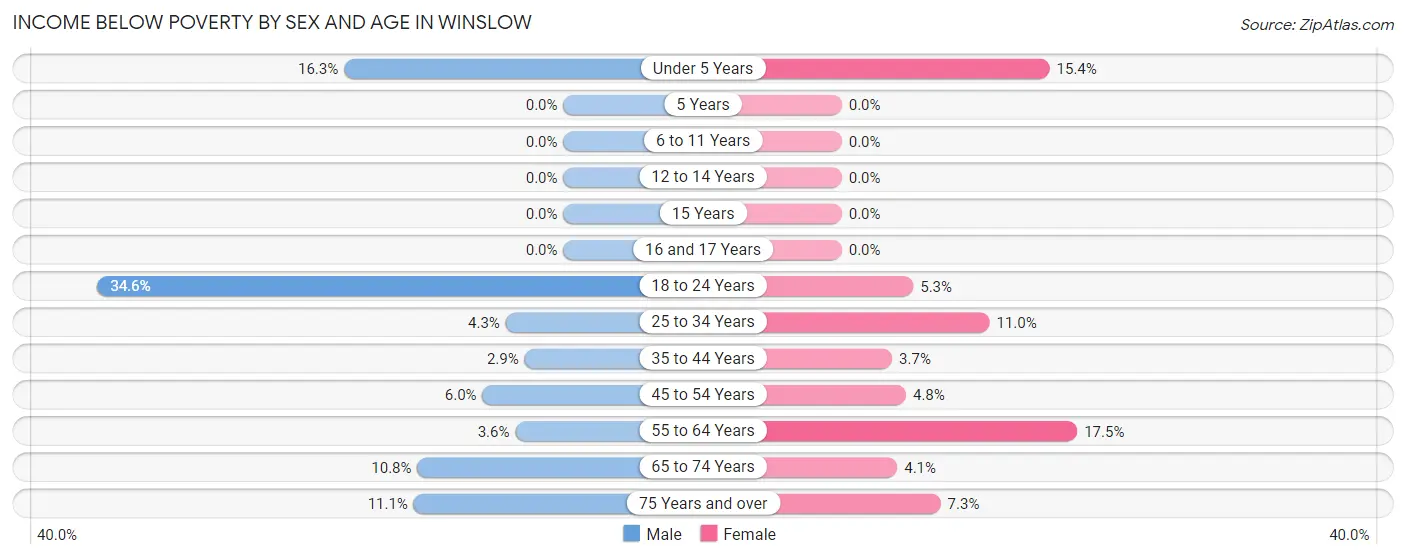
| Age Bracket | Male | Female |
| Under 5 Years | 7 (16.3%) | 27 (15.4%) |
| 5 Years | 0 (0.0%) | 0 (0.0%) |
| 6 to 11 Years | 0 (0.0%) | 0 (0.0%) |
| 12 to 14 Years | 0 (0.0%) | 0 (0.0%) |
| 15 Years | 0 (0.0%) | 0 (0.0%) |
| 16 and 17 Years | 0 (0.0%) | 0 (0.0%) |
| 18 to 24 Years | 109 (34.6%) | 11 (5.3%) |
| 25 to 34 Years | 13 (4.3%) | 43 (11.0%) |
| 35 to 44 Years | 11 (2.9%) | 11 (3.7%) |
| 45 to 54 Years | 17 (6.0%) | 23 (4.8%) |
| 55 to 64 Years | 13 (3.6%) | 54 (17.5%) |
| 65 to 74 Years | 27 (10.8%) | 14 (4.1%) |
| 75 Years and over | 26 (11.1%) | 21 (7.3%) |
| Total | 223 (8.9%) | 204 (6.7%) |
Income Above Poverty by Sex and Age in Winslow
According to the poverty statistics in Winslow, males aged 5 years and females aged 5 years are the age groups that are most secure financially, with 100.0% of males and 100.0% of females in these age groups living above the poverty line.
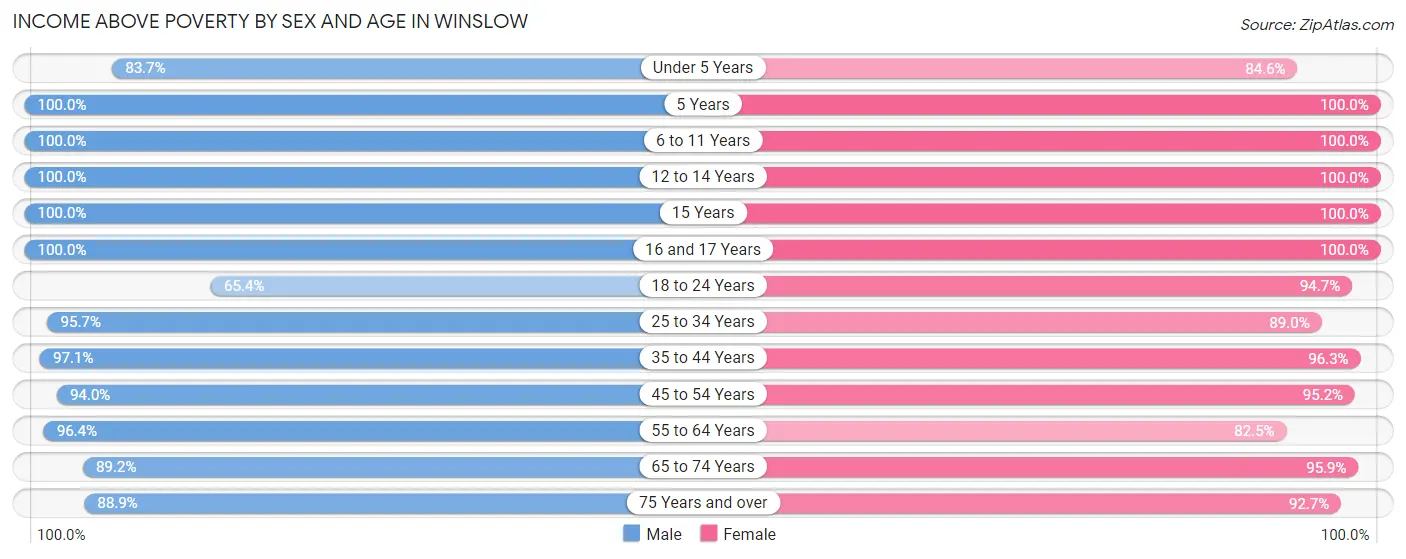
| Age Bracket | Male | Female |
| Under 5 Years | 36 (83.7%) | 148 (84.6%) |
| 5 Years | 28 (100.0%) | 34 (100.0%) |
| 6 to 11 Years | 191 (100.0%) | 281 (100.0%) |
| 12 to 14 Years | 47 (100.0%) | 141 (100.0%) |
| 15 Years | 11 (100.0%) | 72 (100.0%) |
| 16 and 17 Years | 57 (100.0%) | 52 (100.0%) |
| 18 to 24 Years | 206 (65.4%) | 196 (94.7%) |
| 25 to 34 Years | 291 (95.7%) | 349 (89.0%) |
| 35 to 44 Years | 371 (97.1%) | 283 (96.3%) |
| 45 to 54 Years | 266 (94.0%) | 459 (95.2%) |
| 55 to 64 Years | 351 (96.4%) | 255 (82.5%) |
| 65 to 74 Years | 222 (89.2%) | 326 (95.9%) |
| 75 Years and over | 208 (88.9%) | 265 (92.7%) |
| Total | 2,285 (91.1%) | 2,861 (93.3%) |
Income Below Poverty Among Married-Couple Families in Winslow
The poverty statistics for married-couple families in Winslow show that 1.3% or 13 of the total 1,036 families live below the poverty line. Families with 1 or 2 children have the highest poverty rate of 4.6%, comprising of 13 families. On the other hand, families with no children have the lowest poverty rate of 0.0%, which includes 0 families.
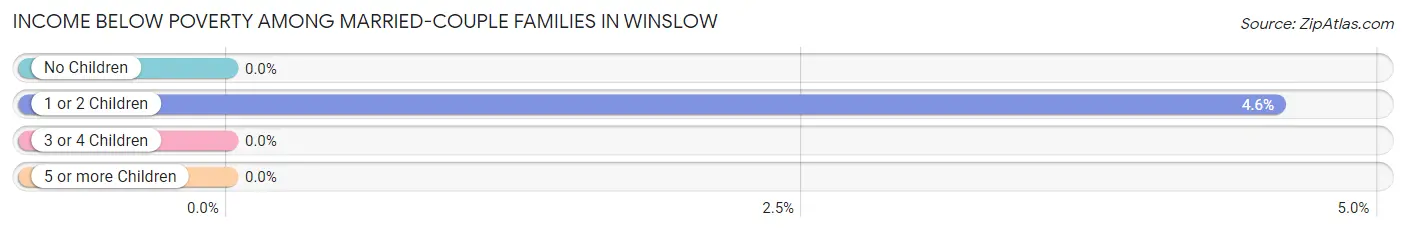
| Children | Above Poverty | Below Poverty |
| No Children | 613 (100.0%) | 0 (0.0%) |
| 1 or 2 Children | 272 (95.4%) | 13 (4.6%) |
| 3 or 4 Children | 138 (100.0%) | 0 (0.0%) |
| 5 or more Children | 0 (0.0%) | 0 (0.0%) |
| Total | 1,023 (98.8%) | 13 (1.3%) |
Income Below Poverty Among Single-Parent Households in Winslow
According to the poverty data in Winslow, 14.9% or 11 single-father households and 5.0% or 17 single-mother households are living below the poverty line. Among single-father households, those with no children have the highest poverty rate, with 11 households (42.3%) experiencing poverty. Likewise, among single-mother households, those with 1 or 2 children have the highest poverty rate, with 17 households (9.6%) falling below the poverty line.
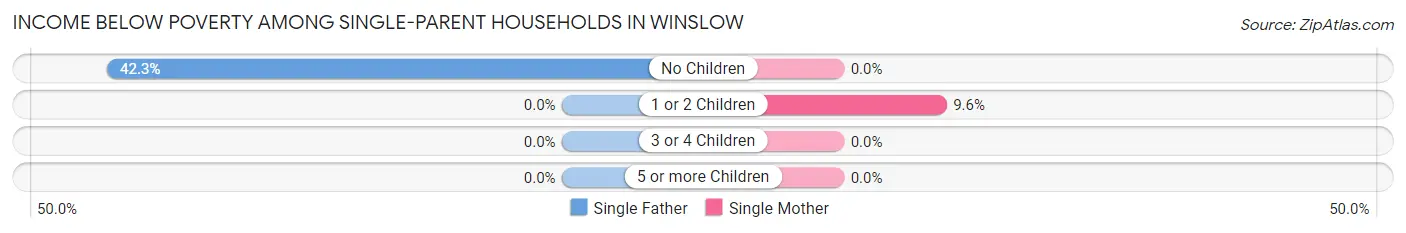
| Children | Single Father | Single Mother |
| No Children | 11 (42.3%) | 0 (0.0%) |
| 1 or 2 Children | 0 (0.0%) | 17 (9.6%) |
| 3 or 4 Children | 0 (0.0%) | 0 (0.0%) |
| 5 or more Children | 0 (0.0%) | 0 (0.0%) |
| Total | 11 (14.9%) | 17 (5.0%) |
Income Below Poverty Among Married-Couple vs Single-Parent Households in Winslow
The poverty data for Winslow shows that 13 of the married-couple family households (1.3%) and 28 of the single-parent households (6.7%) are living below the poverty level. Within the married-couple family households, those with 1 or 2 children have the highest poverty rate, with 13 households (4.6%) falling below the poverty line. Among the single-parent households, those with 1 or 2 children have the highest poverty rate, with 17 household (7.5%) living below poverty.
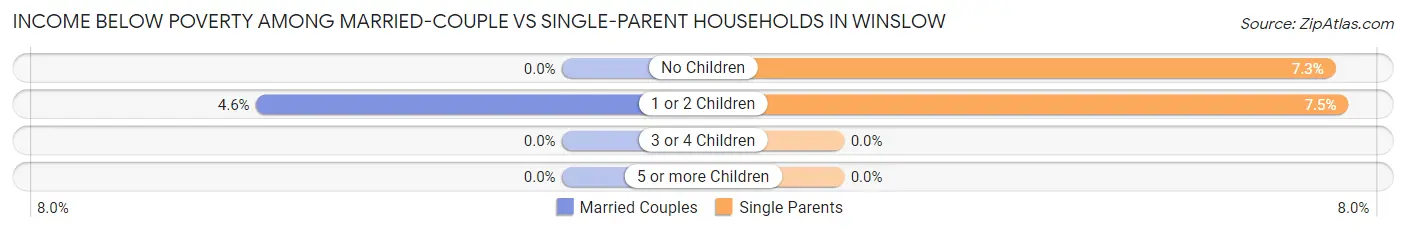
| Children | Married-Couple Families | Single-Parent Households |
| No Children | 0 (0.0%) | 11 (7.3%) |
| 1 or 2 Children | 13 (4.6%) | 17 (7.5%) |
| 3 or 4 Children | 0 (0.0%) | 0 (0.0%) |
| 5 or more Children | 0 (0.0%) | 0 (0.0%) |
| Total | 13 (1.3%) | 28 (6.7%) |
Race in Winslow
The most populous races in Winslow are White / Caucasian (5,228 | 93.4%), Two or more Races (329 | 5.9%), and Hispanic or Latino (108 | 1.9%).
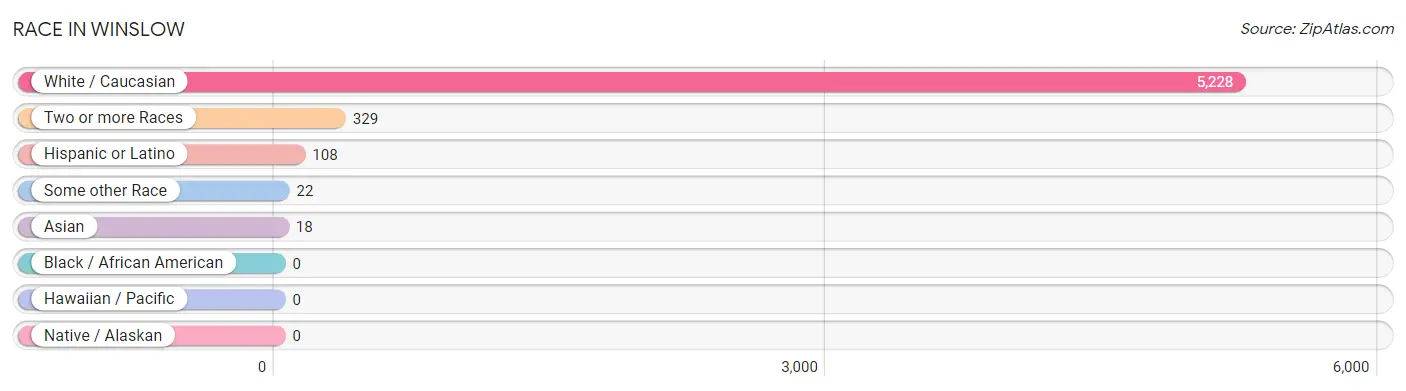
| Race | # Population | % Population |
| Asian | 18 | 0.3% |
| Black / African American | 0 | 0.0% |
| Hawaiian / Pacific | 0 | 0.0% |
| Hispanic or Latino | 108 | 1.9% |
| Native / Alaskan | 0 | 0.0% |
| White / Caucasian | 5,228 | 93.4% |
| Two or more Races | 329 | 5.9% |
| Some other Race | 22 | 0.4% |
| Total | 5,597 | 100.0% |
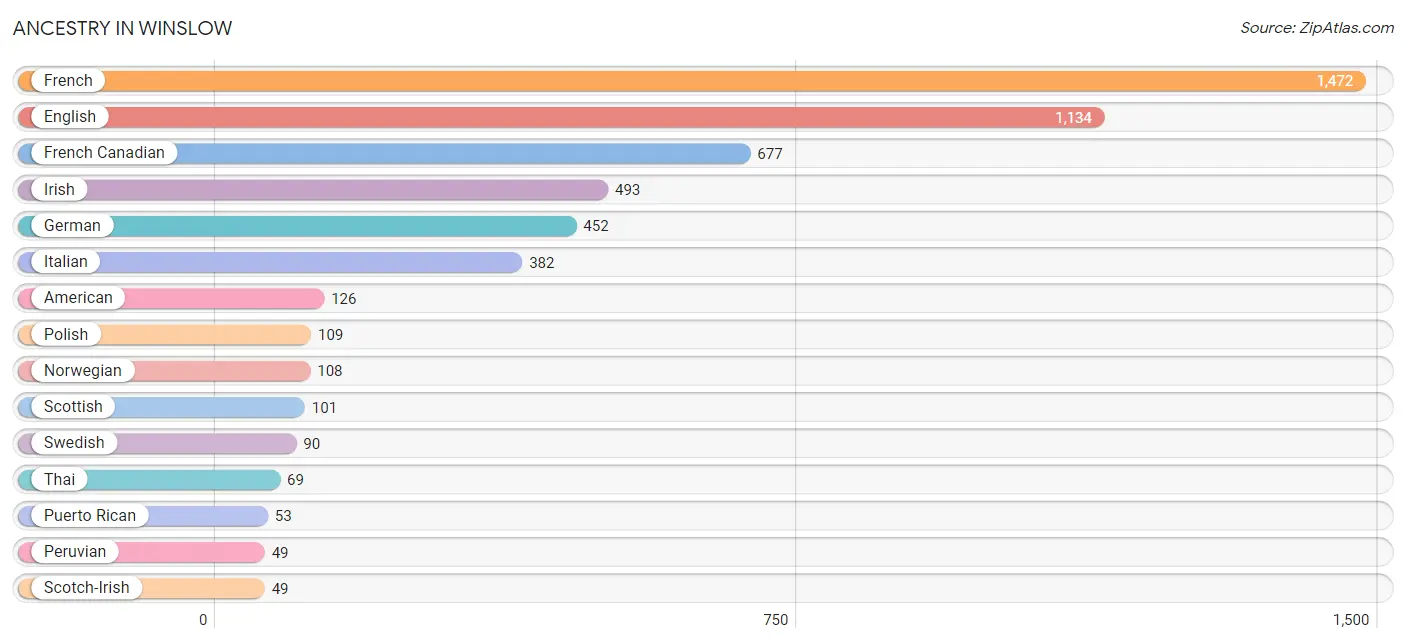
Ancestry in Winslow
The most populous ancestries reported in Winslow are French (1,472 | 26.3%), English (1,134 | 20.3%), French Canadian (677 | 12.1%), Irish (493 | 8.8%), and German (452 | 8.1%), together accounting for 75.5% of all Winslow residents.
| Ancestry | # Population | % Population |
| American | 126 | 2.2% |
| Arab | 13 | 0.2% |
| Bhutanese | 7 | 0.1% |
| British | 1 | 0.0% |
| Burmese | 4 | 0.1% |
| Canadian | 38 | 0.7% |
| Croatian | 8 | 0.1% |
| Czech | 10 | 0.2% |
| Danish | 7 | 0.1% |
| Eastern European | 16 | 0.3% |
| English | 1,134 | 20.3% |
| European | 33 | 0.6% |
| Finnish | 26 | 0.5% |
| French | 1,472 | 26.3% |
| French Canadian | 677 | 12.1% |
| German | 452 | 8.1% |
| Hungarian | 24 | 0.4% |
| Irish | 493 | 8.8% |
| Italian | 382 | 6.8% |
| Latvian | 12 | 0.2% |
| Lebanese | 13 | 0.2% |
| Lithuanian | 45 | 0.8% |
| Mexican | 6 | 0.1% |
| Norwegian | 108 | 1.9% |
| Peruvian | 49 | 0.9% |
| Polish | 109 | 1.9% |
| Puerto Rican | 53 | 0.9% |
| Russian | 23 | 0.4% |
| Scotch-Irish | 49 | 0.9% |
| Scottish | 101 | 1.8% |
| Slovak | 7 | 0.1% |
| South American | 49 | 0.9% |
| Swedish | 90 | 1.6% |
| Thai | 69 | 1.2% |
| Welsh | 32 | 0.6% | View All 35 Rows |
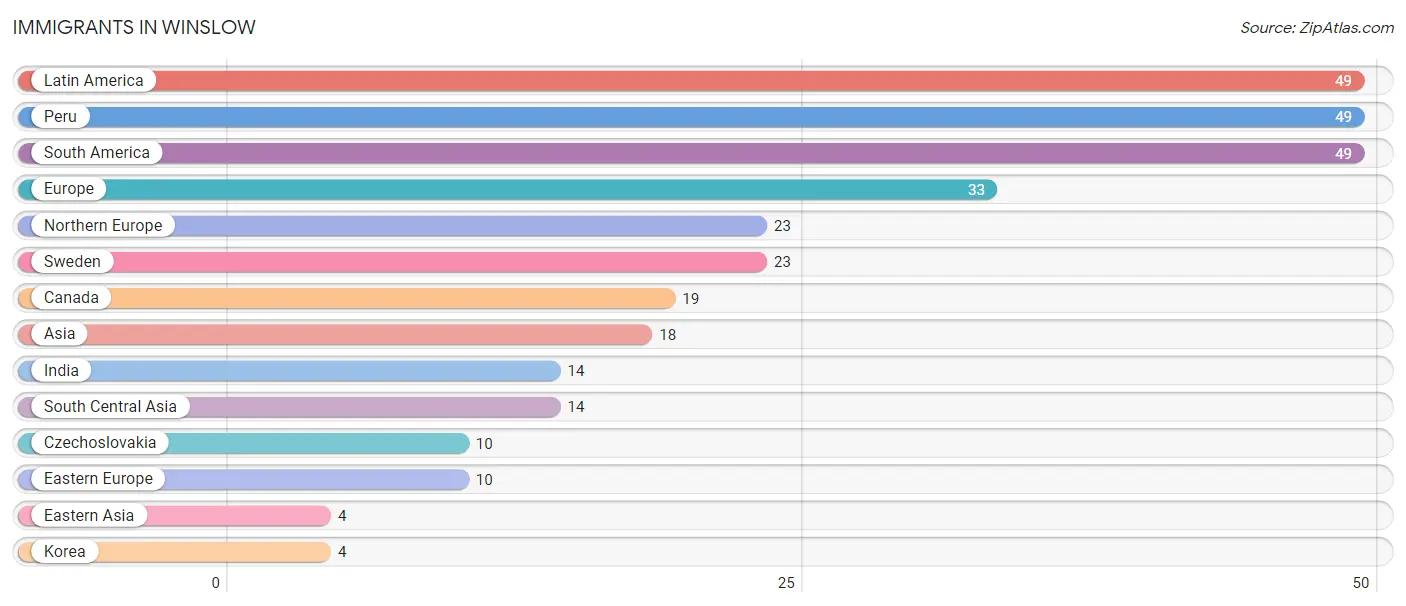
Immigrants in Winslow
The most numerous immigrant groups reported in Winslow came from Latin America (49 | 0.9%), Peru (49 | 0.9%), South America (49 | 0.9%), Europe (33 | 0.6%), and Northern Europe (23 | 0.4%), together accounting for 3.6% of all Winslow residents.
| Immigration Origin | # Population | % Population |
| Asia | 18 | 0.3% |
| Canada | 19 | 0.3% |
| Czechoslovakia | 10 | 0.2% |
| Eastern Asia | 4 | 0.1% |
| Eastern Europe | 10 | 0.2% |
| Europe | 33 | 0.6% |
| India | 14 | 0.3% |
| Korea | 4 | 0.1% |
| Latin America | 49 | 0.9% |
| Northern Europe | 23 | 0.4% |
| Peru | 49 | 0.9% |
| South America | 49 | 0.9% |
| South Central Asia | 14 | 0.3% |
| Sweden | 23 | 0.4% | View All 14 Rows |
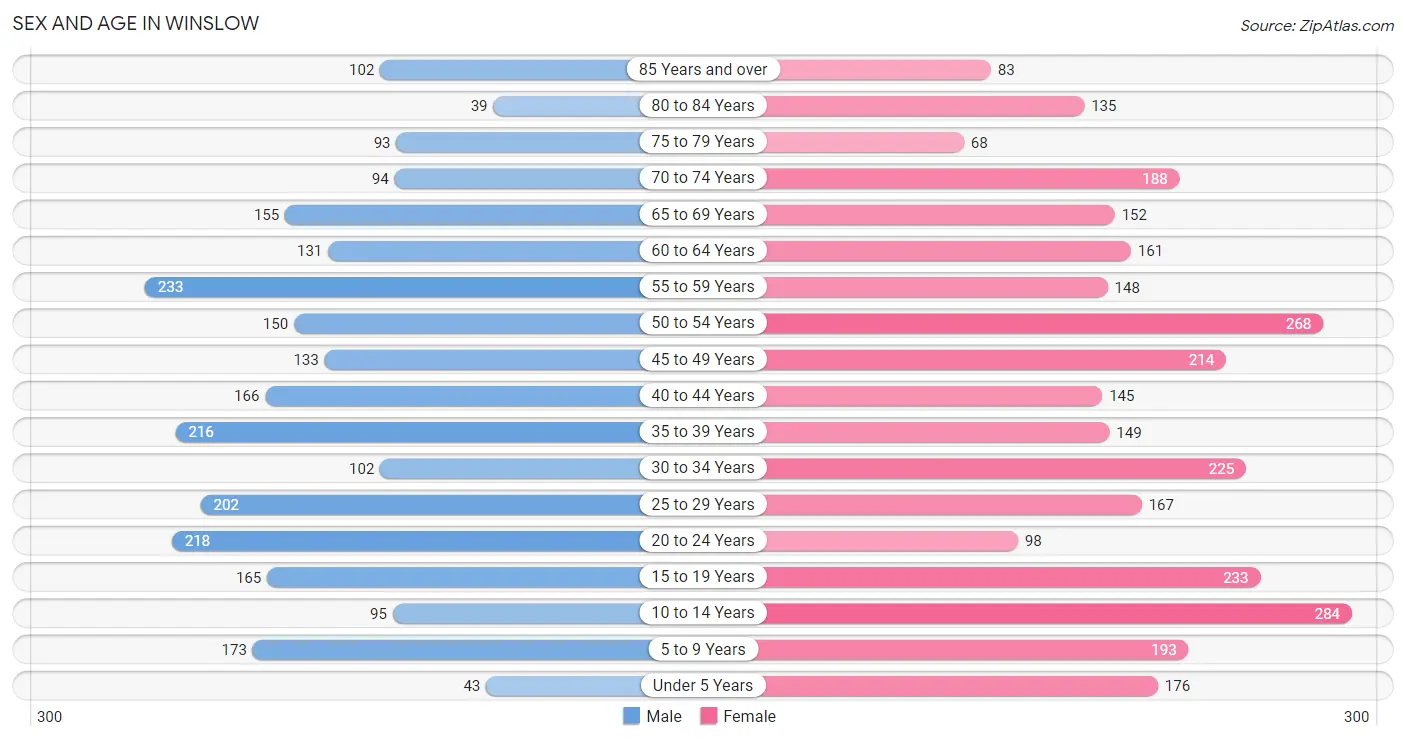
Sex and Age in Winslow
Sex and Age in Winslow
The most populous age groups in Winslow are 55 to 59 Years (233 | 9.3%) for men and 10 to 14 Years (284 | 9.2%) for women.
| Age Bracket | Male | Female |
| Under 5 Years | 43 (1.7%) | 176 (5.7%) |
| 5 to 9 Years | 173 (6.9%) | 193 (6.2%) |
| 10 to 14 Years | 95 (3.8%) | 284 (9.2%) |
| 15 to 19 Years | 165 (6.6%) | 233 (7.5%) |
| 20 to 24 Years | 218 (8.7%) | 98 (3.2%) |
| 25 to 29 Years | 202 (8.1%) | 167 (5.4%) |
| 30 to 34 Years | 102 (4.1%) | 225 (7.3%) |
| 35 to 39 Years | 216 (8.6%) | 149 (4.8%) |
| 40 to 44 Years | 166 (6.6%) | 145 (4.7%) |
| 45 to 49 Years | 133 (5.3%) | 214 (6.9%) |
| 50 to 54 Years | 150 (6.0%) | 268 (8.7%) |
| 55 to 59 Years | 233 (9.3%) | 148 (4.8%) |
| 60 to 64 Years | 131 (5.2%) | 161 (5.2%) |
| 65 to 69 Years | 155 (6.2%) | 152 (4.9%) |
| 70 to 74 Years | 94 (3.7%) | 188 (6.1%) |
| 75 to 79 Years | 93 (3.7%) | 68 (2.2%) |
| 80 to 84 Years | 39 (1.5%) | 135 (4.4%) |
| 85 Years and over | 102 (4.1%) | 83 (2.7%) |
| Total | 2,510 (100.0%) | 3,087 (100.0%) |
Families and Households in Winslow
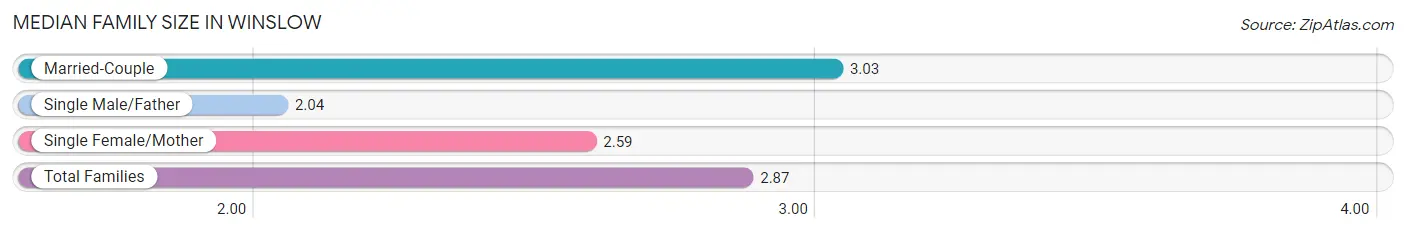
Median Family Size in Winslow
The median family size in Winslow is 2.87 persons per family, with married-couple families (1,036 | 71.3%) accounting for the largest median family size of 3.03 persons per family. On the other hand, single male/father families (74 | 5.1%) represent the smallest median family size with 2.04 persons per family.
| Family Type | # Families | Family Size |
| Married-Couple | 1,036 (71.3%) | 3.03 |
| Single Male/Father | 74 (5.1%) | 2.04 |
| Single Female/Mother | 343 (23.6%) | 2.59 |
| Total Families | 1,453 (100.0%) | 2.87 |
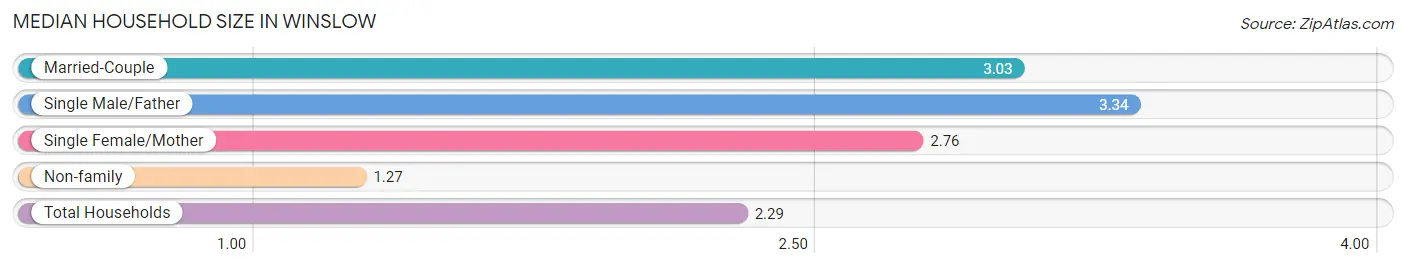
Median Household Size in Winslow
The median household size in Winslow is 2.29 persons per household, with single male/father households (74 | 3.0%) accounting for the largest median household size of 3.34 persons per household. non-family households (992 | 40.6%) represent the smallest median household size with 1.27 persons per household.
| Household Type | # Households | Household Size |
| Married-Couple | 1,036 (42.4%) | 3.03 |
| Single Male/Father | 74 (3.0%) | 3.34 |
| Single Female/Mother | 343 (14.0%) | 2.76 |
| Non-family | 992 (40.6%) | 1.27 |
| Total Households | 2,445 (100.0%) | 2.29 |
Household Size by Marriage Status in Winslow
Out of a total of 2,445 households in Winslow, 1,453 (59.4%) are family households, while 992 (40.6%) are nonfamily households. The most numerous type of family households are 2-person households, comprising 646, and the most common type of nonfamily households are 1-person households, comprising 796.
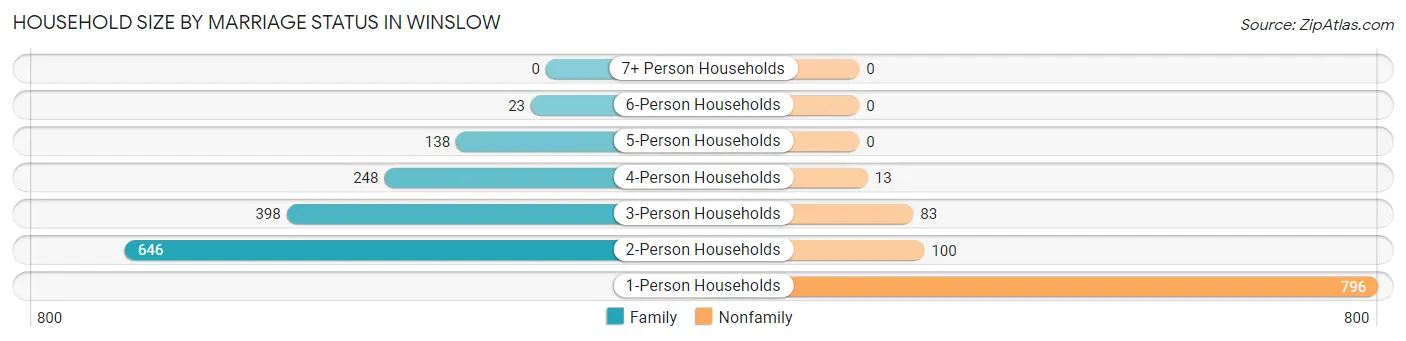
| Household Size | Family Households | Nonfamily Households |
| 1-Person Households | - | 796 (32.6%) |
| 2-Person Households | 646 (26.4%) | 100 (4.1%) |
| 3-Person Households | 398 (16.3%) | 83 (3.4%) |
| 4-Person Households | 248 (10.1%) | 13 (0.5%) |
| 5-Person Households | 138 (5.6%) | 0 (0.0%) |
| 6-Person Households | 23 (0.9%) | 0 (0.0%) |
| 7+ Person Households | 0 (0.0%) | 0 (0.0%) |
| Total | 1,453 (59.4%) | 992 (40.6%) |
Female Fertility in Winslow
Fertility by Age in Winslow
Average fertility rate in Winslow is 32.0 births per 1,000 women. Women in the age bracket of 20 to 34 years have the highest fertility rate with 61.0 births per 1,000 women. Women in the age bracket of 20 to 34 years acount for 71.4% of all women with births.
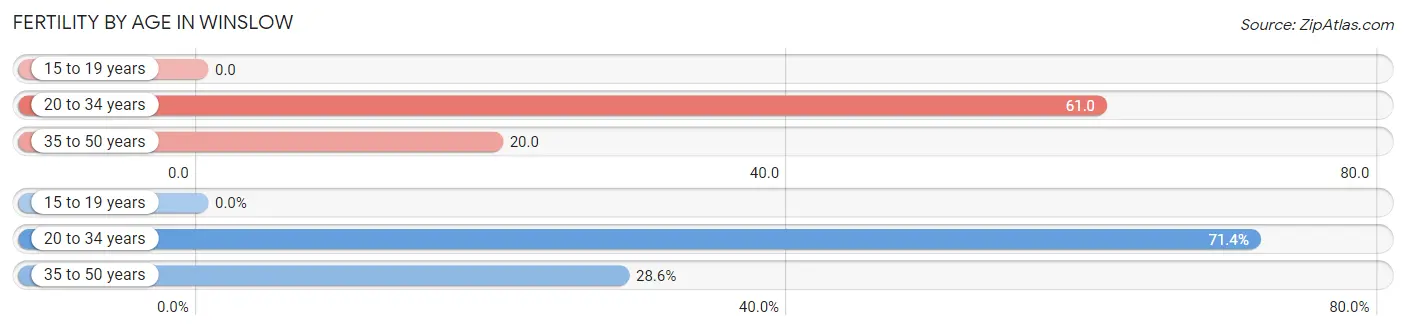
| Age Bracket | Women with Births | Births / 1,000 Women |
| 15 to 19 years | 0 (0.0%) | 0.0 |
| 20 to 34 years | 30 (71.4%) | 61.0 |
| 35 to 50 years | 12 (28.6%) | 20.0 |
| Total | 42 (100.0%) | 32.0 |
Fertility by Age by Marriage Status in Winslow
71.4% of women with births (42) in Winslow are married. The highest percentage of unmarried women with births falls into 35 to 50 years age bracket with 100.0% of them unmarried at the time of birth, while the lowest percentage of unmarried women with births belong to 20 to 34 years age bracket with 0.0% of them unmarried.
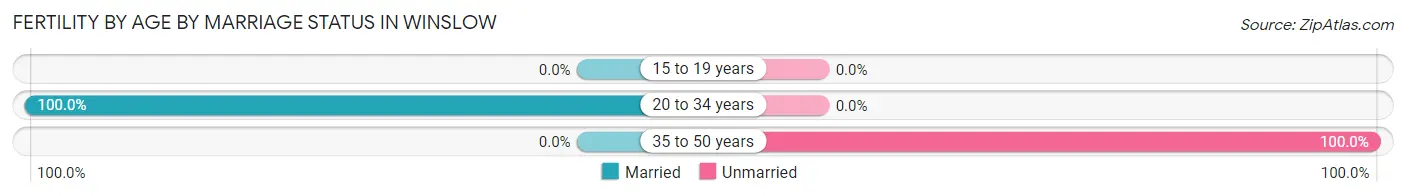
| Age Bracket | Married | Unmarried |
| 15 to 19 years | 0 (0.0%) | 0 (0.0%) |
| 20 to 34 years | 30 (100.0%) | 0 (0.0%) |
| 35 to 50 years | 0 (0.0%) | 12 (100.0%) |
| Total | 30 (71.4%) | 12 (28.6%) |
Fertility by Education in Winslow
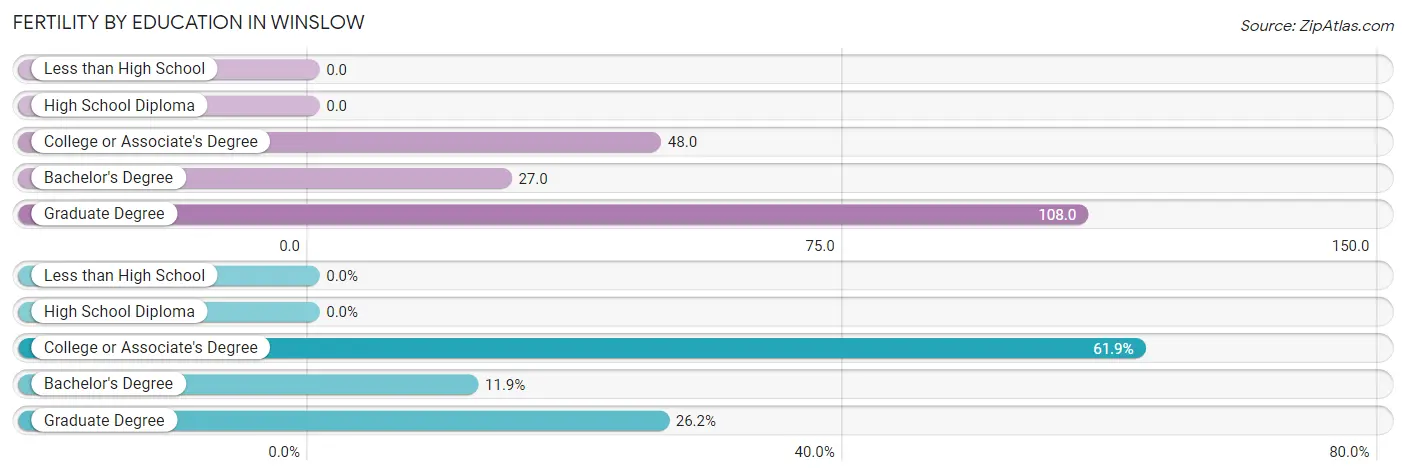
| Educational Attainment | Women with Births | Births / 1,000 Women |
| Less than High School | 0 (0.0%) | 0.0 |
| High School Diploma | 0 (0.0%) | 0.0 |
| College or Associate's Degree | 26 (61.9%) | 48.0 |
| Bachelor's Degree | 5 (11.9%) | 27.0 |
| Graduate Degree | 11 (26.2%) | 108.0 |
| Total | 42 (100.0%) | 32.0 |
Fertility by Education by Marriage Status in Winslow
28.6% of women with births in Winslow are unmarried. Women with the educational attainment of bachelor's degree are most likely to be married with 100.0% of them married at childbirth, while women with the educational attainment of college or associate's degree are least likely to be married with 46.2% of them unmarried at childbirth.
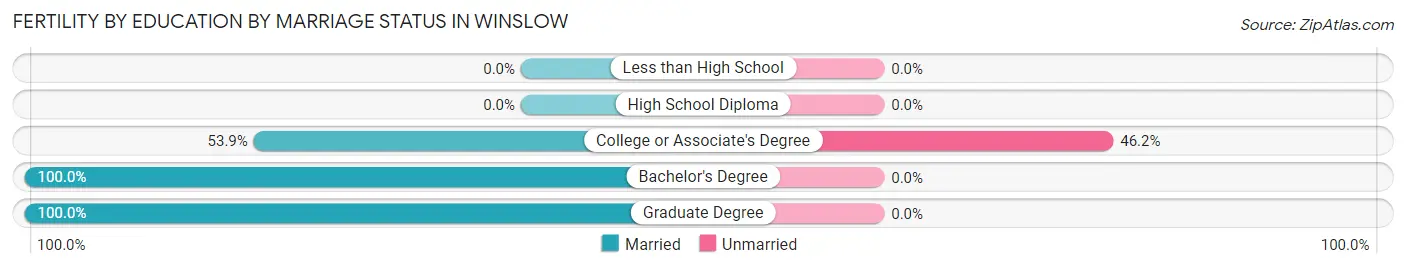
| Educational Attainment | Married | Unmarried |
| Less than High School | 0 (0.0%) | 0 (0.0%) |
| High School Diploma | 0 (0.0%) | 0 (0.0%) |
| College or Associate's Degree | 14 (53.8%) | 12 (46.2%) |
| Bachelor's Degree | 5 (100.0%) | 0 (0.0%) |
| Graduate Degree | 11 (100.0%) | 0 (0.0%) |
| Total | 30 (71.4%) | 12 (28.6%) |
Employment Characteristics in Winslow
Employment by Class of Employer in Winslow
Among the 2,390 employed individuals in Winslow, private company employees (1,581 | 66.1%), not-for-profit organizations (338 | 14.1%), and local government employees (258 | 10.8%) make up the most common classes of employment.
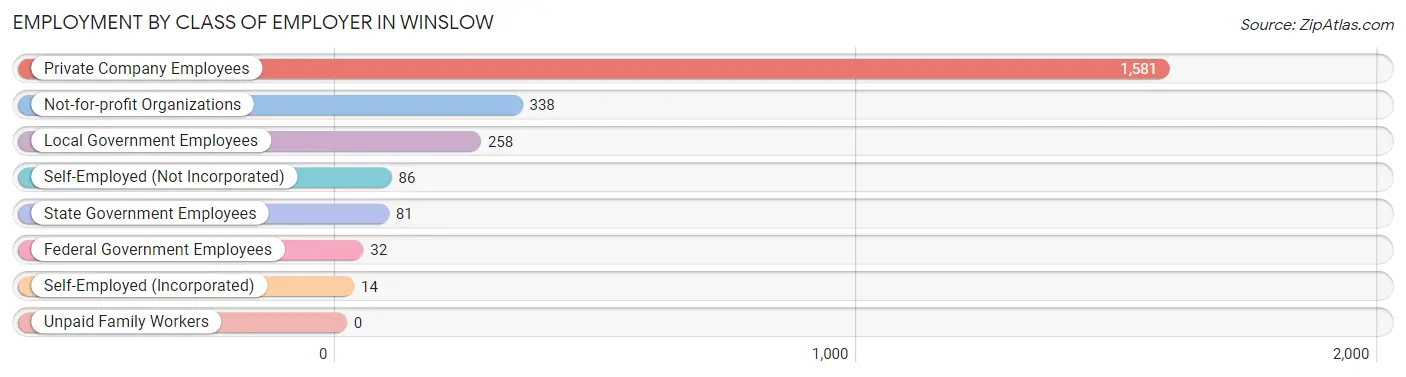
| Employer Class | # Employees | % Employees |
| Private Company Employees | 1,581 | 66.1% |
| Self-Employed (Incorporated) | 14 | 0.6% |
| Self-Employed (Not Incorporated) | 86 | 3.6% |
| Not-for-profit Organizations | 338 | 14.1% |
| Local Government Employees | 258 | 10.8% |
| State Government Employees | 81 | 3.4% |
| Federal Government Employees | 32 | 1.3% |
| Unpaid Family Workers | 0 | 0.0% |
| Total | 2,390 | 100.0% |
Employment Status by Age in Winslow
According to the labor force statistics for Winslow, out of the total population over 16 years of age (4,550), 55.1% or 2,507 individuals are in the labor force, with 2.4% or 60 of them unemployed. The age group with the highest labor force participation rate is 25 to 29 years, with 84.0% or 310 individuals in the labor force. Within the labor force, the 30 to 34 years age range has the highest percentage of unemployed individuals, with 11.1% or 27 of them being unemployed.
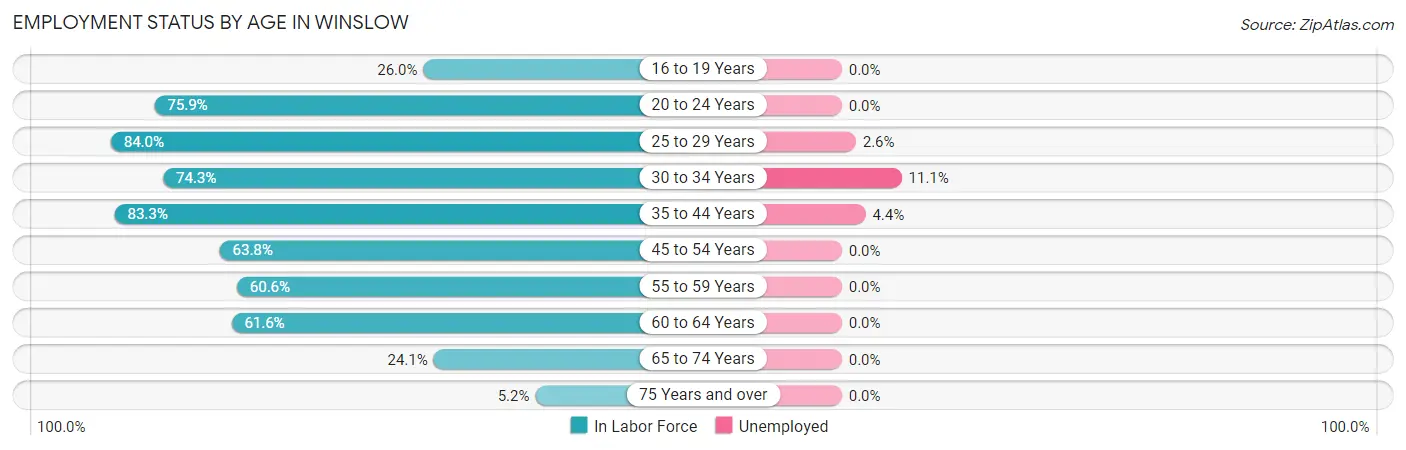
| Age Bracket | In Labor Force | Unemployed |
| 16 to 19 Years | 82 (26.0%) | 0 (0.0%) |
| 20 to 24 Years | 240 (75.9%) | 0 (0.0%) |
| 25 to 29 Years | 310 (84.0%) | 8 (2.6%) |
| 30 to 34 Years | 243 (74.3%) | 27 (11.1%) |
| 35 to 44 Years | 563 (83.3%) | 25 (4.4%) |
| 45 to 54 Years | 488 (63.8%) | 0 (0.0%) |
| 55 to 59 Years | 231 (60.6%) | 0 (0.0%) |
| 60 to 64 Years | 180 (61.6%) | 0 (0.0%) |
| 65 to 74 Years | 142 (24.1%) | 0 (0.0%) |
| 75 Years and over | 27 (5.2%) | 0 (0.0%) |
| Total | 2,507 (55.1%) | 60 (2.4%) |
Employment Status by Educational Attainment in Winslow
According to labor force statistics for Winslow, 71.7% of individuals (2,015) out of the total population between 25 and 64 years of age (2,810) are in the labor force, with 3.0% or 60 of them being unemployed. The group with the highest labor force participation rate are those with the educational attainment of bachelor's degree or higher, with 77.4% or 578 individuals in the labor force. Within the labor force, individuals with college / associate degree education have the highest percentage of unemployment, with 6.3% or 52 of them being unemployed.
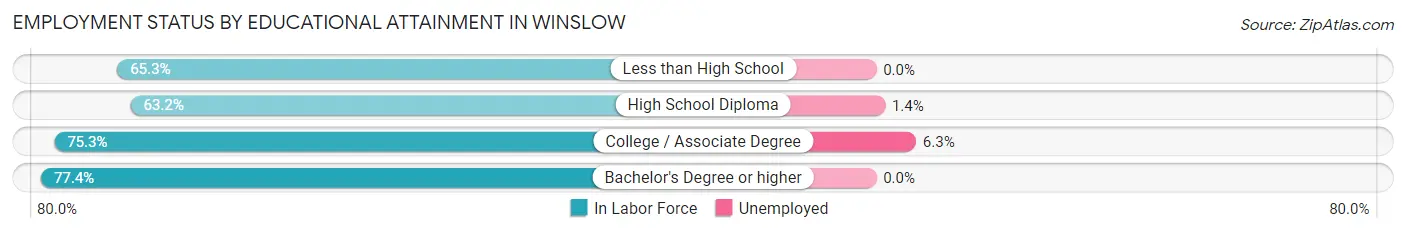
| Educational Attainment | In Labor Force | Unemployed |
| Less than High School | 66 (65.3%) | 0 (0.0%) |
| High School Diploma | 552 (63.2%) | 12 (1.4%) |
| College / Associate Degree | 819 (75.3%) | 69 (6.3%) |
| Bachelor's Degree or higher | 578 (77.4%) | 0 (0.0%) |
| Total | 2,015 (71.7%) | 84 (3.0%) |
Employment Occupations by Sex in Winslow
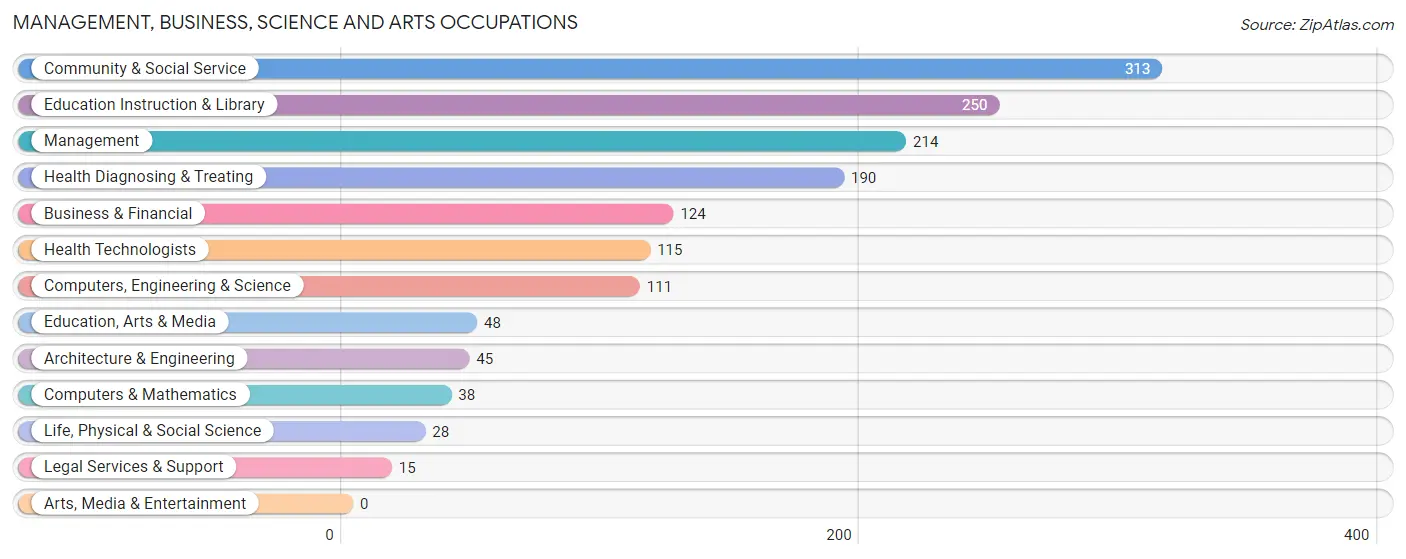
Management, Business, Science and Arts Occupations
The most common Management, Business, Science and Arts occupations in Winslow are Community & Social Service (313 | 12.8%), Education Instruction & Library (250 | 10.2%), Management (214 | 8.7%), Health Diagnosing & Treating (190 | 7.8%), and Business & Financial (124 | 5.1%).
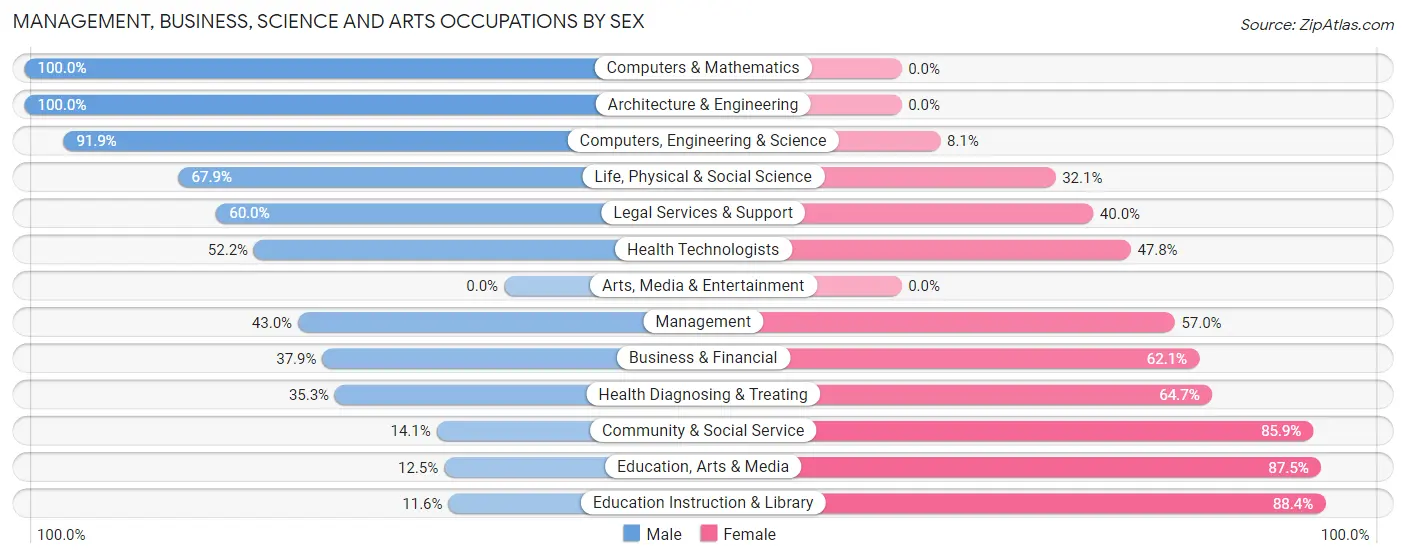
Management, Business, Science and Arts Occupations by Sex
Within the Management, Business, Science and Arts occupations in Winslow, the most male-oriented occupations are Computers & Mathematics (100.0%), Architecture & Engineering (100.0%), and Computers, Engineering & Science (91.9%), while the most female-oriented occupations are Education Instruction & Library (88.4%), Education, Arts & Media (87.5%), and Community & Social Service (85.9%).
| Occupation | Male | Female |
| Management | 92 (43.0%) | 122 (57.0%) |
| Business & Financial | 47 (37.9%) | 77 (62.1%) |
| Computers, Engineering & Science | 102 (91.9%) | 9 (8.1%) |
| Computers & Mathematics | 38 (100.0%) | 0 (0.0%) |
| Architecture & Engineering | 45 (100.0%) | 0 (0.0%) |
| Life, Physical & Social Science | 19 (67.9%) | 9 (32.1%) |
| Community & Social Service | 44 (14.1%) | 269 (85.9%) |
| Education, Arts & Media | 6 (12.5%) | 42 (87.5%) |
| Legal Services & Support | 9 (60.0%) | 6 (40.0%) |
| Education Instruction & Library | 29 (11.6%) | 221 (88.4%) |
| Arts, Media & Entertainment | 0 (0.0%) | 0 (0.0%) |
| Health Diagnosing & Treating | 67 (35.3%) | 123 (64.7%) |
| Health Technologists | 60 (52.2%) | 55 (47.8%) |
| Total (Category) | 352 (37.0%) | 600 (63.0%) |
| Total (Overall) | 1,214 (49.6%) | 1,232 (50.4%) |
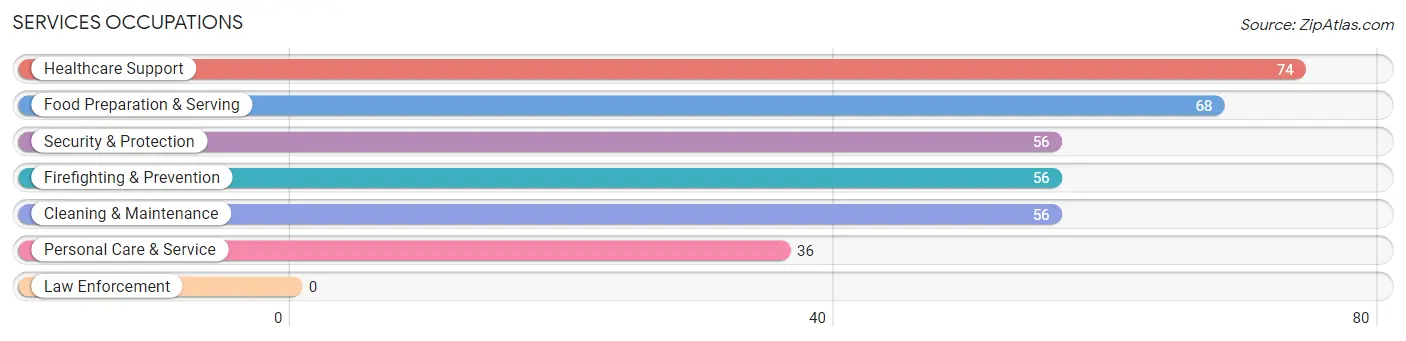
Services Occupations
The most common Services occupations in Winslow are Healthcare Support (74 | 3.0%), Food Preparation & Serving (68 | 2.8%), Security & Protection (56 | 2.3%), Firefighting & Prevention (56 | 2.3%), and Cleaning & Maintenance (56 | 2.3%).
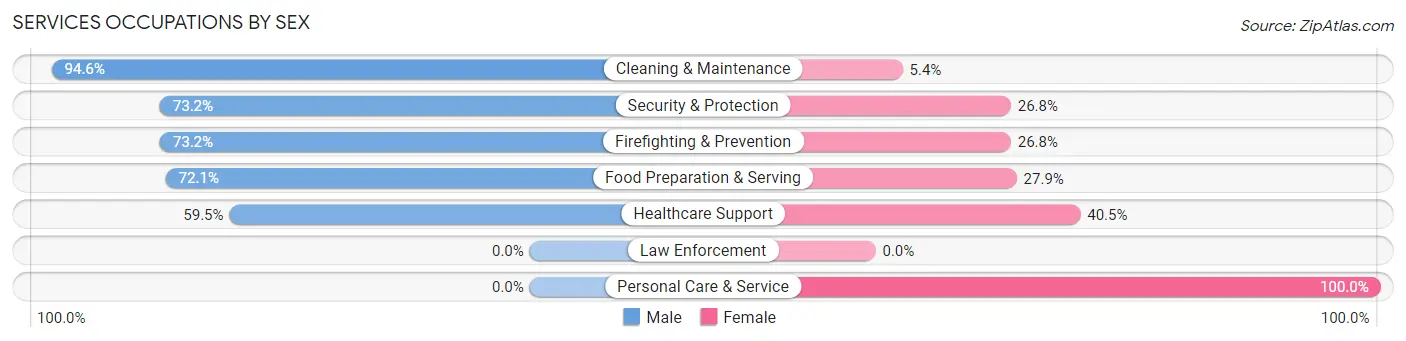
Services Occupations by Sex
Within the Services occupations in Winslow, the most male-oriented occupations are Cleaning & Maintenance (94.6%), Security & Protection (73.2%), and Firefighting & Prevention (73.2%), while the most female-oriented occupations are Personal Care & Service (100.0%), Healthcare Support (40.5%), and Food Preparation & Serving (27.9%).
| Occupation | Male | Female |
| Healthcare Support | 44 (59.5%) | 30 (40.5%) |
| Security & Protection | 41 (73.2%) | 15 (26.8%) |
| Firefighting & Prevention | 41 (73.2%) | 15 (26.8%) |
| Law Enforcement | 0 (0.0%) | 0 (0.0%) |
| Food Preparation & Serving | 49 (72.1%) | 19 (27.9%) |
| Cleaning & Maintenance | 53 (94.6%) | 3 (5.4%) |
| Personal Care & Service | 0 (0.0%) | 36 (100.0%) |
| Total (Category) | 187 (64.5%) | 103 (35.5%) |
| Total (Overall) | 1,214 (49.6%) | 1,232 (50.4%) |
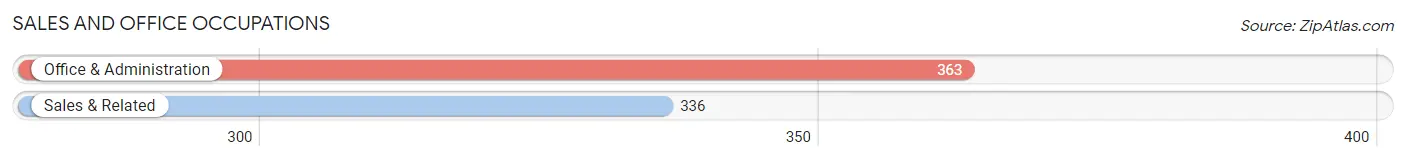
Sales and Office Occupations
The most common Sales and Office occupations in Winslow are Office & Administration (363 | 14.8%), and Sales & Related (336 | 13.7%).
Sales and Office Occupations by Sex
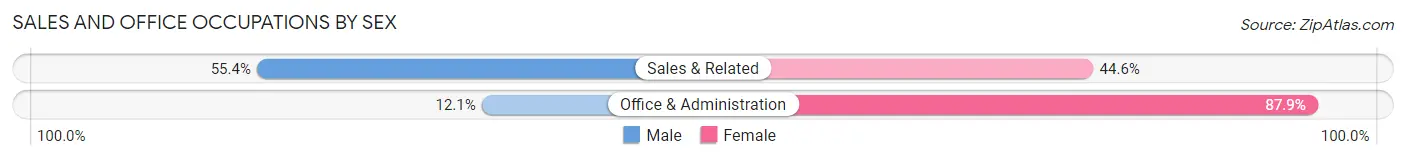
| Occupation | Male | Female |
| Sales & Related | 186 (55.4%) | 150 (44.6%) |
| Office & Administration | 44 (12.1%) | 319 (87.9%) |
| Total (Category) | 230 (32.9%) | 469 (67.1%) |
| Total (Overall) | 1,214 (49.6%) | 1,232 (50.4%) |
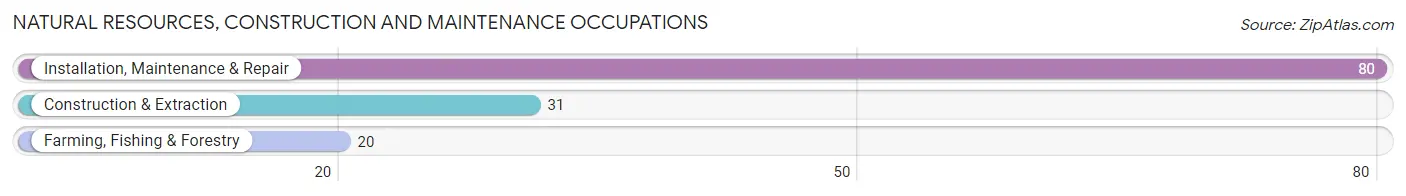
Natural Resources, Construction and Maintenance Occupations
The most common Natural Resources, Construction and Maintenance occupations in Winslow are Installation, Maintenance & Repair (80 | 3.3%), Construction & Extraction (31 | 1.3%), and Farming, Fishing & Forestry (20 | 0.8%).
Natural Resources, Construction and Maintenance Occupations by Sex
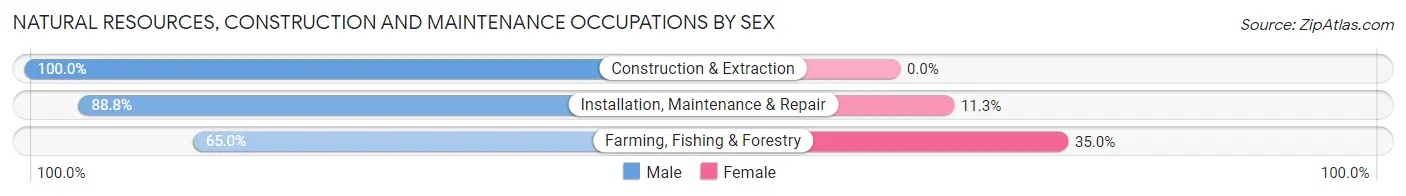
| Occupation | Male | Female |
| Farming, Fishing & Forestry | 13 (65.0%) | 7 (35.0%) |
| Construction & Extraction | 31 (100.0%) | 0 (0.0%) |
| Installation, Maintenance & Repair | 71 (88.7%) | 9 (11.3%) |
| Total (Category) | 115 (87.8%) | 16 (12.2%) |
| Total (Overall) | 1,214 (49.6%) | 1,232 (50.4%) |
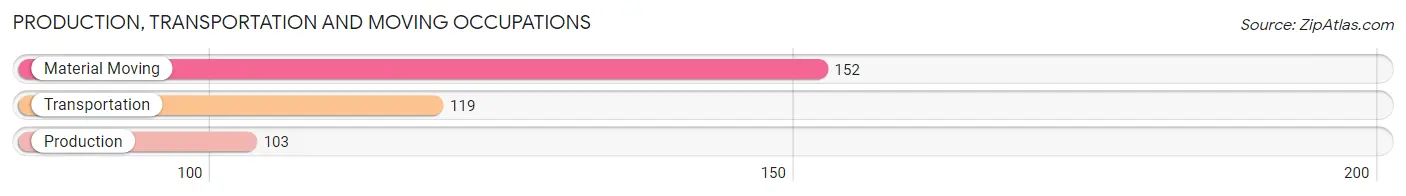
Production, Transportation and Moving Occupations
The most common Production, Transportation and Moving occupations in Winslow are Material Moving (152 | 6.2%), Transportation (119 | 4.9%), and Production (103 | 4.2%).
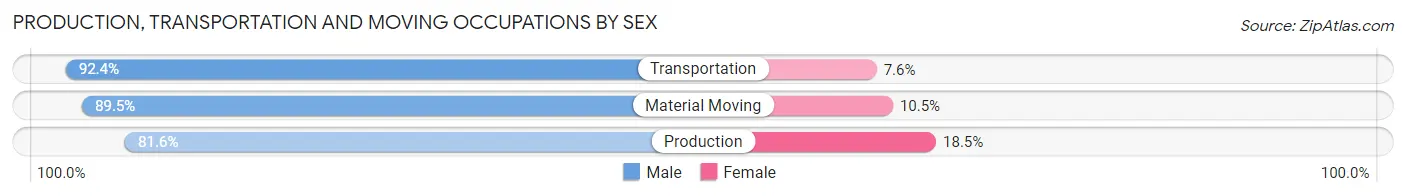
Production, Transportation and Moving Occupations by Sex
| Occupation | Male | Female |
| Production | 84 (81.6%) | 19 (18.4%) |
| Transportation | 110 (92.4%) | 9 (7.6%) |
| Material Moving | 136 (89.5%) | 16 (10.5%) |
| Total (Category) | 330 (88.2%) | 44 (11.8%) |
| Total (Overall) | 1,214 (49.6%) | 1,232 (50.4%) |
Employment Industries by Sex in Winslow
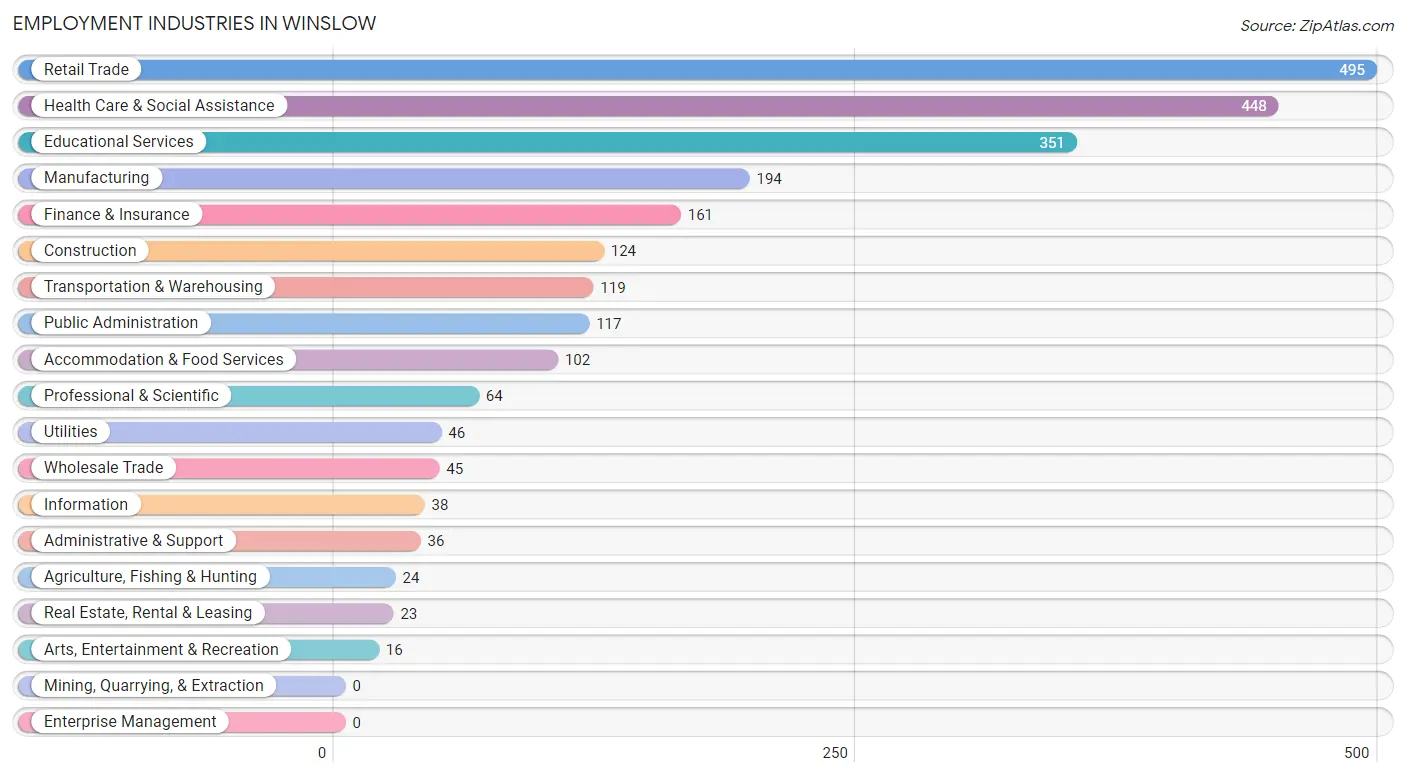
Employment Industries in Winslow
The major employment industries in Winslow include Retail Trade (495 | 20.2%), Health Care & Social Assistance (448 | 18.3%), Educational Services (351 | 14.3%), Manufacturing (194 | 7.9%), and Finance & Insurance (161 | 6.6%).
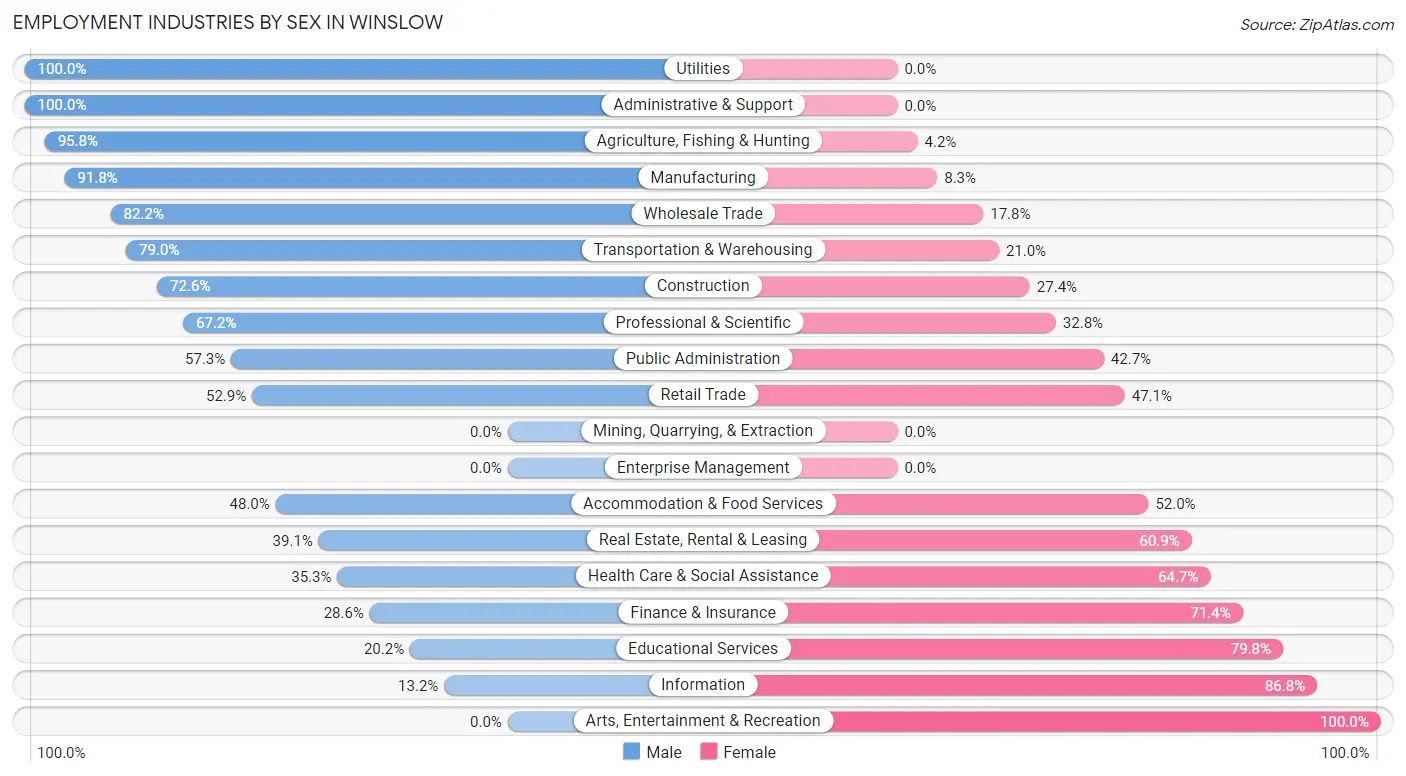
Employment Industries by Sex in Winslow
The Winslow industries that see more men than women are Utilities (100.0%), Administrative & Support (100.0%), and Agriculture, Fishing & Hunting (95.8%), whereas the industries that tend to have a higher number of women are Arts, Entertainment & Recreation (100.0%), Information (86.8%), and Educational Services (79.8%).
| Industry | Male | Female |
| Agriculture, Fishing & Hunting | 23 (95.8%) | 1 (4.2%) |
| Mining, Quarrying, & Extraction | 0 (0.0%) | 0 (0.0%) |
| Construction | 90 (72.6%) | 34 (27.4%) |
| Manufacturing | 178 (91.7%) | 16 (8.3%) |
| Wholesale Trade | 37 (82.2%) | 8 (17.8%) |
| Retail Trade | 262 (52.9%) | 233 (47.1%) |
| Transportation & Warehousing | 94 (79.0%) | 25 (21.0%) |
| Utilities | 46 (100.0%) | 0 (0.0%) |
| Information | 5 (13.2%) | 33 (86.8%) |
| Finance & Insurance | 46 (28.6%) | 115 (71.4%) |
| Real Estate, Rental & Leasing | 9 (39.1%) | 14 (60.9%) |
| Professional & Scientific | 43 (67.2%) | 21 (32.8%) |
| Enterprise Management | 0 (0.0%) | 0 (0.0%) |
| Administrative & Support | 36 (100.0%) | 0 (0.0%) |
| Educational Services | 71 (20.2%) | 280 (79.8%) |
| Health Care & Social Assistance | 158 (35.3%) | 290 (64.7%) |
| Arts, Entertainment & Recreation | 0 (0.0%) | 16 (100.0%) |
| Accommodation & Food Services | 49 (48.0%) | 53 (52.0%) |
| Public Administration | 67 (57.3%) | 50 (42.7%) |
| Total | 1,214 (49.6%) | 1,232 (50.4%) |
Education in Winslow
School Enrollment in Winslow
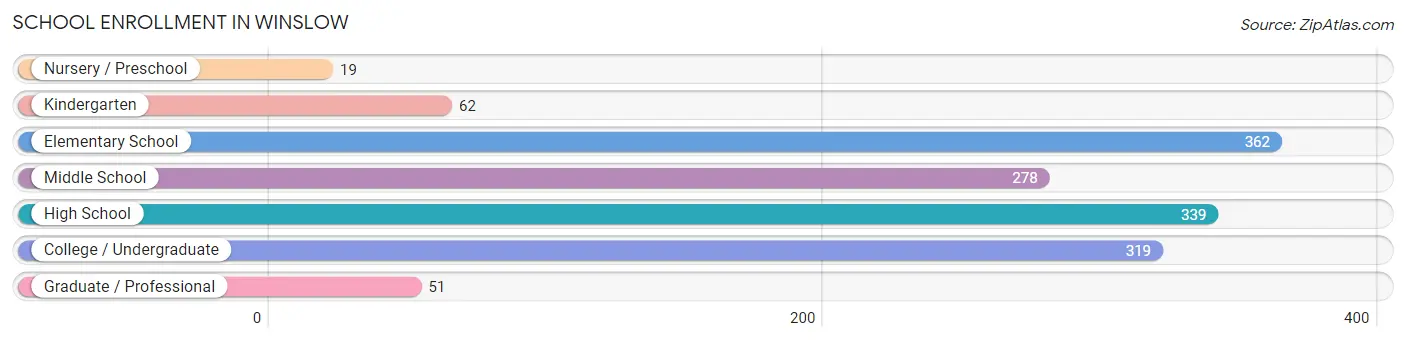
The most common levels of schooling among the 1,430 students in Winslow are elementary school (362 | 25.3%), high school (339 | 23.7%), and college / undergraduate (319 | 22.3%).
| School Level | # Students | % Students |
| Nursery / Preschool | 19 | 1.3% |
| Kindergarten | 62 | 4.3% |
| Elementary School | 362 | 25.3% |
| Middle School | 278 | 19.4% |
| High School | 339 | 23.7% |
| College / Undergraduate | 319 | 22.3% |
| Graduate / Professional | 51 | 3.6% |
| Total | 1,430 | 100.0% |
School Enrollment by Age by Funding Source in Winslow
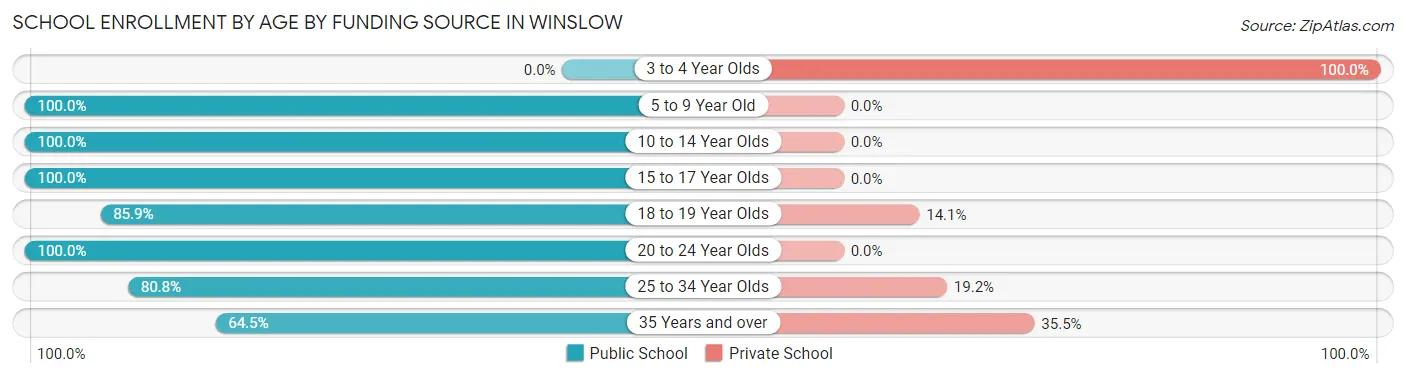
Out of a total of 1,430 students who are enrolled in schools in Winslow, 119 (8.3%) attend a private institution, while the remaining 1,311 (91.7%) are enrolled in public schools. The age group of 3 to 4 year olds has the highest likelihood of being enrolled in private schools, with 19 (100.0% in the age bracket) enrolled. Conversely, the age group of 5 to 9 year old has the lowest likelihood of being enrolled in a private school, with 366 (100.0% in the age bracket) attending a public institution.
| Age Bracket | Public School | Private School |
| 3 to 4 Year Olds | 0 (0.0%) | 19 (100.0%) |
| 5 to 9 Year Old | 366 (100.0%) | 0 (0.0%) |
| 10 to 14 Year Olds | 379 (100.0%) | 0 (0.0%) |
| 15 to 17 Year Olds | 192 (100.0%) | 0 (0.0%) |
| 18 to 19 Year Olds | 128 (85.9%) | 21 (14.1%) |
| 20 to 24 Year Olds | 43 (100.0%) | 0 (0.0%) |
| 25 to 34 Year Olds | 105 (80.8%) | 25 (19.2%) |
| 35 Years and over | 98 (64.5%) | 54 (35.5%) |
| Total | 1,311 (91.7%) | 119 (8.3%) |
Educational Attainment by Field of Study in Winslow
Education (191 | 16.3%), science & technology (183 | 15.6%), psychology (166 | 14.1%), business (162 | 13.8%), and liberal arts & history (91 | 7.7%) are the most common fields of study among 1,175 individuals in Winslow who have obtained a bachelor's degree or higher.
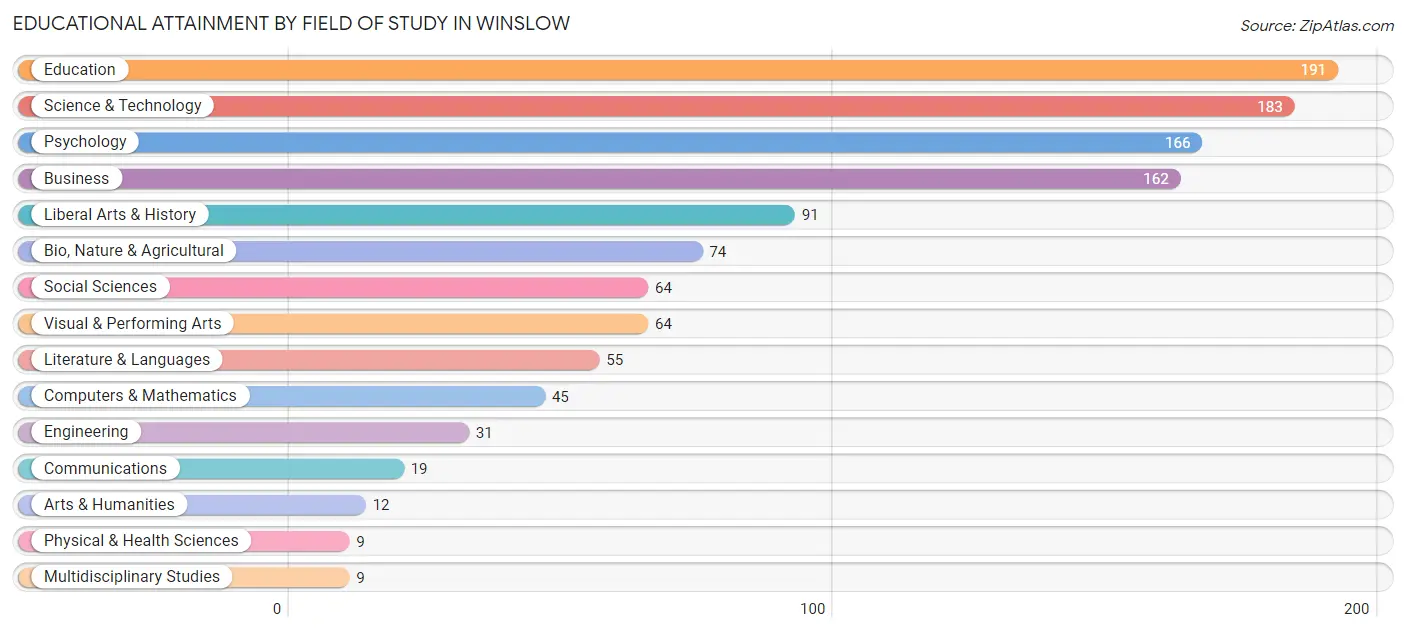
| Field of Study | # Graduates | % Graduates |
| Computers & Mathematics | 45 | 3.8% |
| Bio, Nature & Agricultural | 74 | 6.3% |
| Physical & Health Sciences | 9 | 0.8% |
| Psychology | 166 | 14.1% |
| Social Sciences | 64 | 5.4% |
| Engineering | 31 | 2.6% |
| Multidisciplinary Studies | 9 | 0.8% |
| Science & Technology | 183 | 15.6% |
| Business | 162 | 13.8% |
| Education | 191 | 16.3% |
| Literature & Languages | 55 | 4.7% |
| Liberal Arts & History | 91 | 7.7% |
| Visual & Performing Arts | 64 | 5.4% |
| Communications | 19 | 1.6% |
| Arts & Humanities | 12 | 1.0% |
| Total | 1,175 | 100.0% |
Transportation & Commute in Winslow
Vehicle Availability by Sex in Winslow
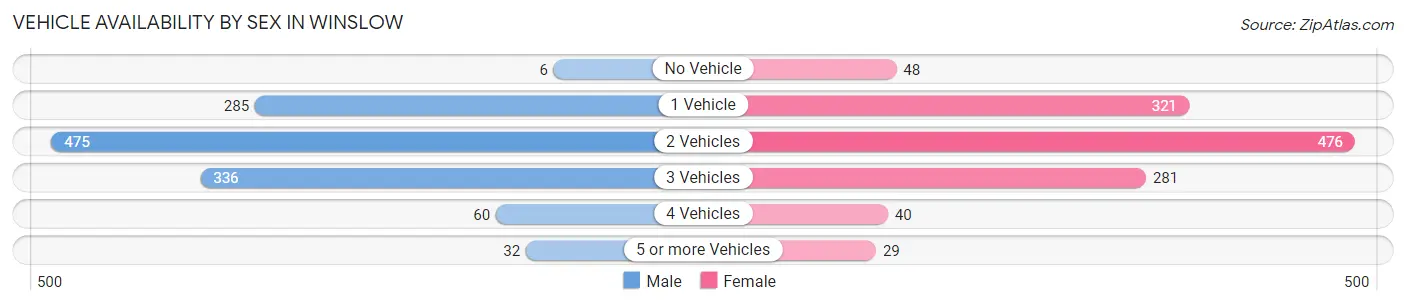
The most prevalent vehicle ownership categories in Winslow are males with 2 vehicles (475, accounting for 39.8%) and females with 2 vehicles (476, making up 39.8%).
| Vehicles Available | Male | Female |
| No Vehicle | 6 (0.5%) | 48 (4.0%) |
| 1 Vehicle | 285 (23.9%) | 321 (26.9%) |
| 2 Vehicles | 475 (39.8%) | 476 (39.8%) |
| 3 Vehicles | 336 (28.1%) | 281 (23.5%) |
| 4 Vehicles | 60 (5.0%) | 40 (3.4%) |
| 5 or more Vehicles | 32 (2.7%) | 29 (2.4%) |
| Total | 1,194 (100.0%) | 1,195 (100.0%) |
Commute Time in Winslow
The most frequently occuring commute durations in Winslow are 5 to 9 minutes (488 commuters, 22.5%), 15 to 19 minutes (410 commuters, 18.9%), and 10 to 14 minutes (358 commuters, 16.5%).
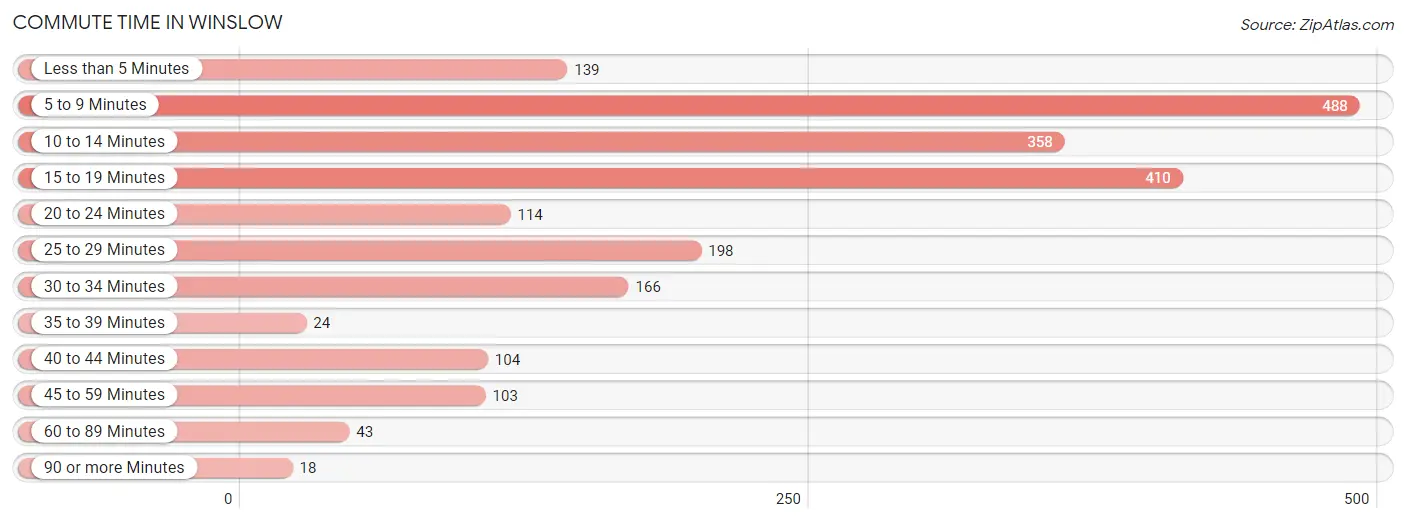
| Commute Time | # Commuters | % Commuters |
| Less than 5 Minutes | 139 | 6.4% |
| 5 to 9 Minutes | 488 | 22.5% |
| 10 to 14 Minutes | 358 | 16.5% |
| 15 to 19 Minutes | 410 | 18.9% |
| 20 to 24 Minutes | 114 | 5.3% |
| 25 to 29 Minutes | 198 | 9.1% |
| 30 to 34 Minutes | 166 | 7.7% |
| 35 to 39 Minutes | 24 | 1.1% |
| 40 to 44 Minutes | 104 | 4.8% |
| 45 to 59 Minutes | 103 | 4.8% |
| 60 to 89 Minutes | 43 | 2.0% |
| 90 or more Minutes | 18 | 0.8% |
Commute Time by Sex in Winslow
The most common commute times in Winslow are 5 to 9 minutes (246 commuters, 22.0%) for males and 5 to 9 minutes (242 commuters, 23.1%) for females.
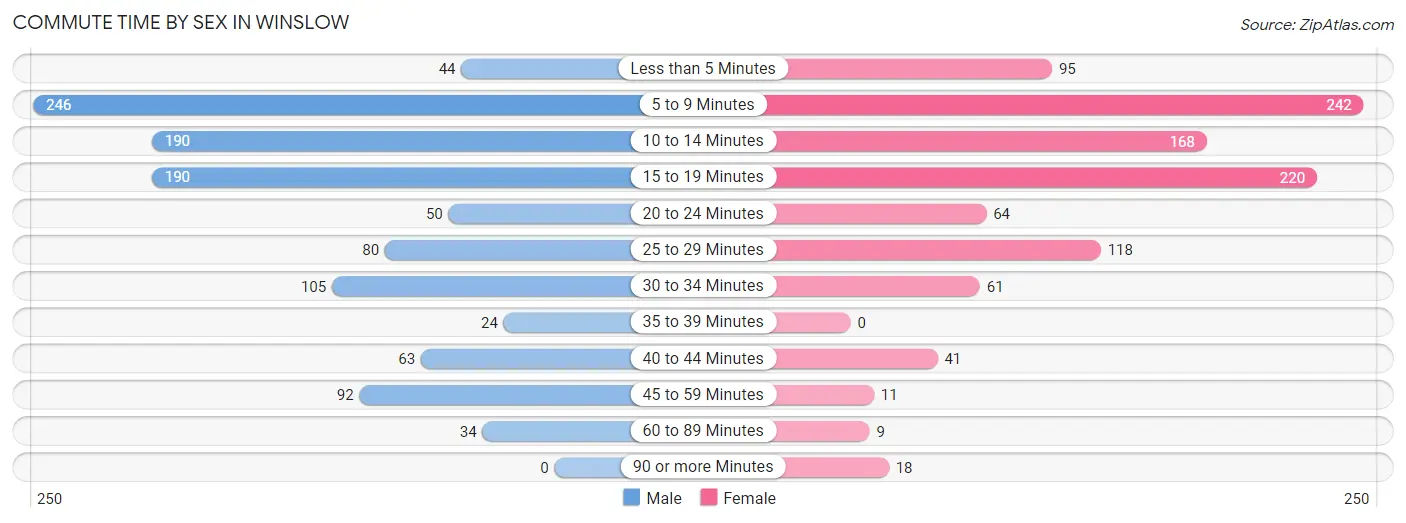
| Commute Time | Male | Female |
| Less than 5 Minutes | 44 (3.9%) | 95 (9.1%) |
| 5 to 9 Minutes | 246 (22.0%) | 242 (23.1%) |
| 10 to 14 Minutes | 190 (17.0%) | 168 (16.1%) |
| 15 to 19 Minutes | 190 (17.0%) | 220 (21.0%) |
| 20 to 24 Minutes | 50 (4.5%) | 64 (6.1%) |
| 25 to 29 Minutes | 80 (7.2%) | 118 (11.3%) |
| 30 to 34 Minutes | 105 (9.4%) | 61 (5.8%) |
| 35 to 39 Minutes | 24 (2.1%) | 0 (0.0%) |
| 40 to 44 Minutes | 63 (5.6%) | 41 (3.9%) |
| 45 to 59 Minutes | 92 (8.2%) | 11 (1.1%) |
| 60 to 89 Minutes | 34 (3.0%) | 9 (0.9%) |
| 90 or more Minutes | 0 (0.0%) | 18 (1.7%) |
Time of Departure to Work by Sex in Winslow
The most frequent times of departure to work in Winslow are 6:30 AM to 6:59 AM (170, 15.2%) for males and 7:00 AM to 7:29 AM (237, 22.6%) for females.
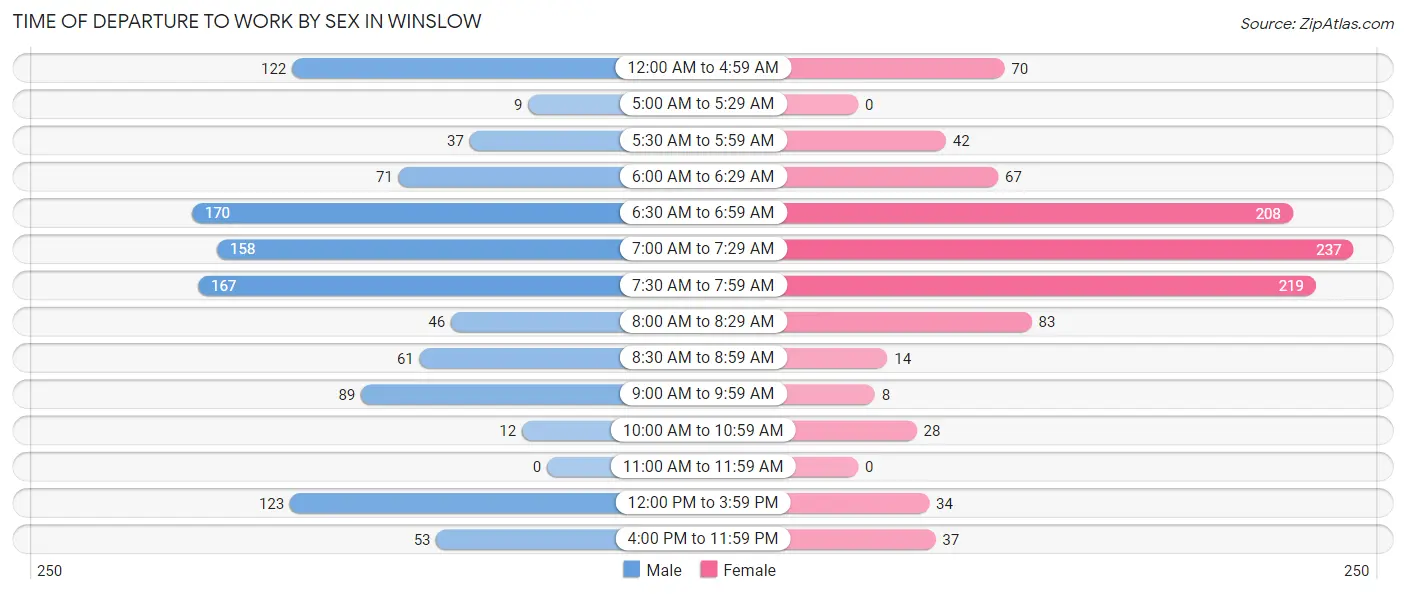
| Time of Departure | Male | Female |
| 12:00 AM to 4:59 AM | 122 (10.9%) | 70 (6.7%) |
| 5:00 AM to 5:29 AM | 9 (0.8%) | 0 (0.0%) |
| 5:30 AM to 5:59 AM | 37 (3.3%) | 42 (4.0%) |
| 6:00 AM to 6:29 AM | 71 (6.4%) | 67 (6.4%) |
| 6:30 AM to 6:59 AM | 170 (15.2%) | 208 (19.9%) |
| 7:00 AM to 7:29 AM | 158 (14.1%) | 237 (22.6%) |
| 7:30 AM to 7:59 AM | 167 (14.9%) | 219 (20.9%) |
| 8:00 AM to 8:29 AM | 46 (4.1%) | 83 (7.9%) |
| 8:30 AM to 8:59 AM | 61 (5.5%) | 14 (1.3%) |
| 9:00 AM to 9:59 AM | 89 (8.0%) | 8 (0.8%) |
| 10:00 AM to 10:59 AM | 12 (1.1%) | 28 (2.7%) |
| 11:00 AM to 11:59 AM | 0 (0.0%) | 0 (0.0%) |
| 12:00 PM to 3:59 PM | 123 (11.0%) | 34 (3.3%) |
| 4:00 PM to 11:59 PM | 53 (4.7%) | 37 (3.5%) |
| Total | 1,118 (100.0%) | 1,047 (100.0%) |
Housing Occupancy in Winslow
Occupancy by Ownership in Winslow
Of the total 2,445 dwellings in Winslow, owner-occupied units account for 1,642 (67.2%), while renter-occupied units make up 803 (32.8%).
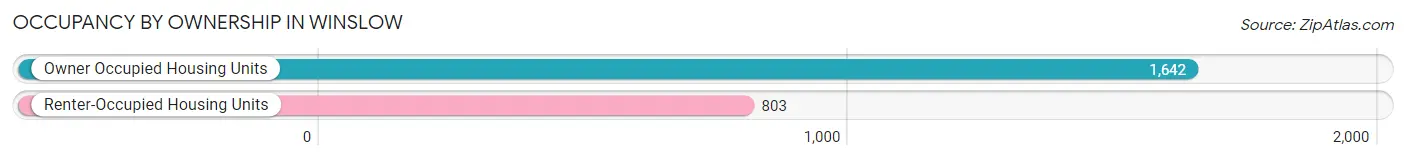
| Occupancy | # Housing Units | % Housing Units |
| Owner Occupied Housing Units | 1,642 | 67.2% |
| Renter-Occupied Housing Units | 803 | 32.8% |
| Total Occupied Housing Units | 2,445 | 100.0% |
Occupancy by Household Size in Winslow
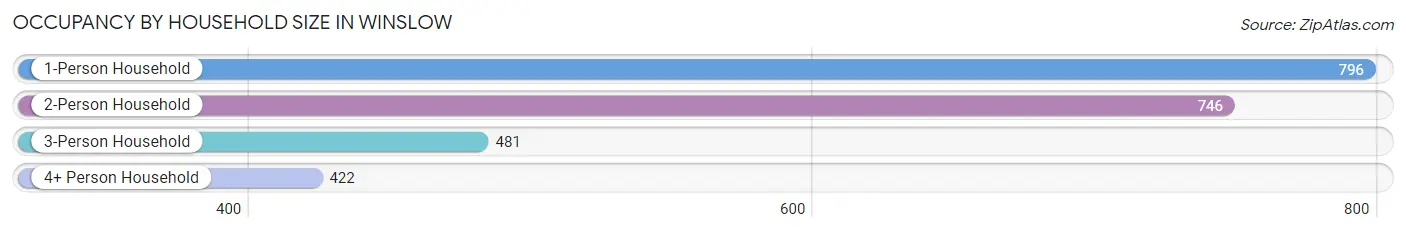
| Household Size | # Housing Units | % Housing Units |
| 1-Person Household | 796 | 32.6% |
| 2-Person Household | 746 | 30.5% |
| 3-Person Household | 481 | 19.7% |
| 4+ Person Household | 422 | 17.3% |
| Total Housing Units | 2,445 | 100.0% |
Occupancy by Ownership by Household Size in Winslow
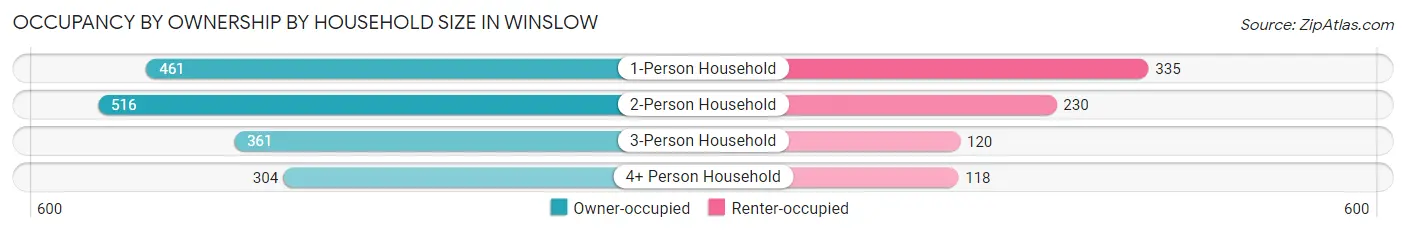
| Household Size | Owner-occupied | Renter-occupied |
| 1-Person Household | 461 (57.9%) | 335 (42.1%) |
| 2-Person Household | 516 (69.2%) | 230 (30.8%) |
| 3-Person Household | 361 (75.0%) | 120 (24.9%) |
| 4+ Person Household | 304 (72.0%) | 118 (28.0%) |
| Total Housing Units | 1,642 (67.2%) | 803 (32.8%) |
Occupancy by Educational Attainment in Winslow
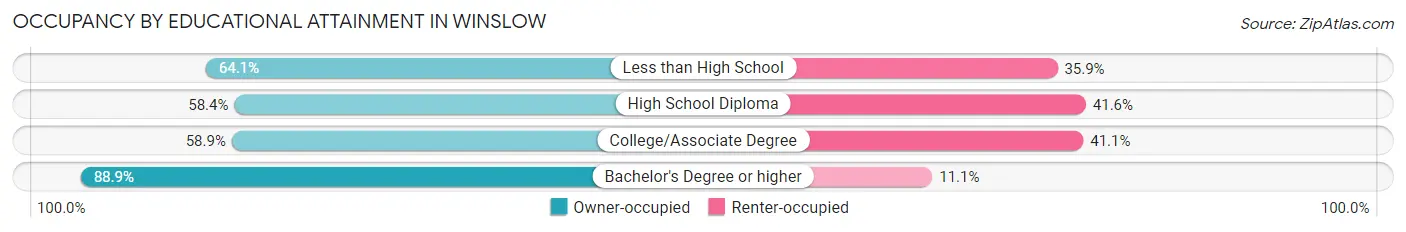
| Household Size | Owner-occupied | Renter-occupied |
| Less than High School | 41 (64.1%) | 23 (35.9%) |
| High School Diploma | 461 (58.4%) | 328 (41.6%) |
| College/Associate Degree | 541 (58.9%) | 377 (41.1%) |
| Bachelor's Degree or higher | 599 (88.9%) | 75 (11.1%) |
Occupancy by Age of Householder in Winslow
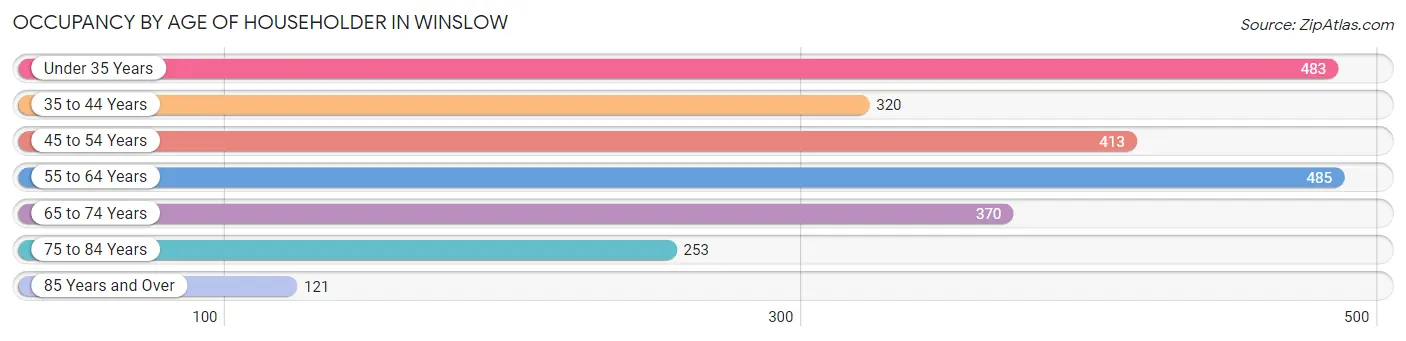
| Age Bracket | # Households | % Households |
| Under 35 Years | 483 | 19.8% |
| 35 to 44 Years | 320 | 13.1% |
| 45 to 54 Years | 413 | 16.9% |
| 55 to 64 Years | 485 | 19.8% |
| 65 to 74 Years | 370 | 15.1% |
| 75 to 84 Years | 253 | 10.3% |
| 85 Years and Over | 121 | 5.0% |
| Total | 2,445 | 100.0% |
Housing Finances in Winslow
Median Income by Occupancy in Winslow
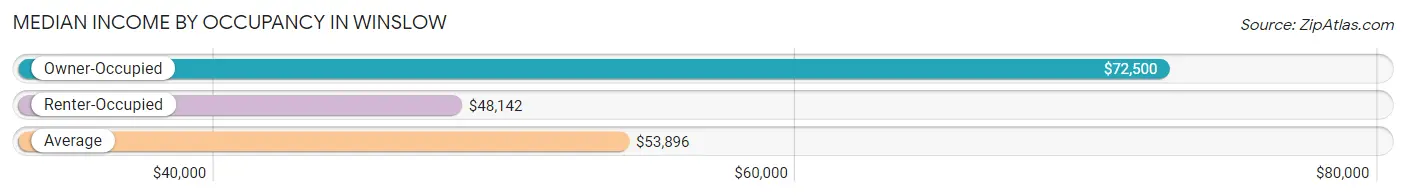
| Occupancy Type | # Households | Median Income |
| Owner-Occupied | 1,642 (67.2%) | $72,500 |
| Renter-Occupied | 803 (32.8%) | $48,142 |
| Average | 2,445 (100.0%) | $53,896 |
Occupancy by Householder Income Bracket in Winslow
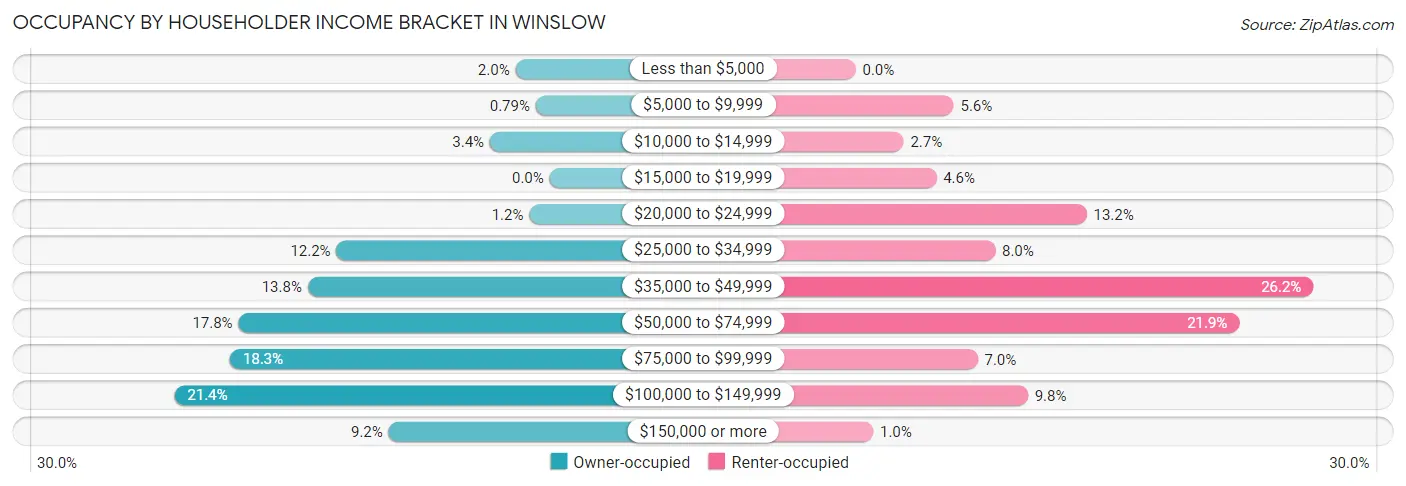
| Income Bracket | Owner-occupied | Renter-occupied |
| Less than $5,000 | 32 (1.9%) | 0 (0.0%) |
| $5,000 to $9,999 | 13 (0.8%) | 45 (5.6%) |
| $10,000 to $14,999 | 56 (3.4%) | 22 (2.7%) |
| $15,000 to $19,999 | 0 (0.0%) | 37 (4.6%) |
| $20,000 to $24,999 | 19 (1.2%) | 106 (13.2%) |
| $25,000 to $34,999 | 200 (12.2%) | 64 (8.0%) |
| $35,000 to $49,999 | 227 (13.8%) | 210 (26.2%) |
| $50,000 to $74,999 | 292 (17.8%) | 176 (21.9%) |
| $75,000 to $99,999 | 300 (18.3%) | 56 (7.0%) |
| $100,000 to $149,999 | 352 (21.4%) | 79 (9.8%) |
| $150,000 or more | 151 (9.2%) | 8 (1.0%) |
| Total | 1,642 (100.0%) | 803 (100.0%) |
Monthly Housing Cost Tiers in Winslow
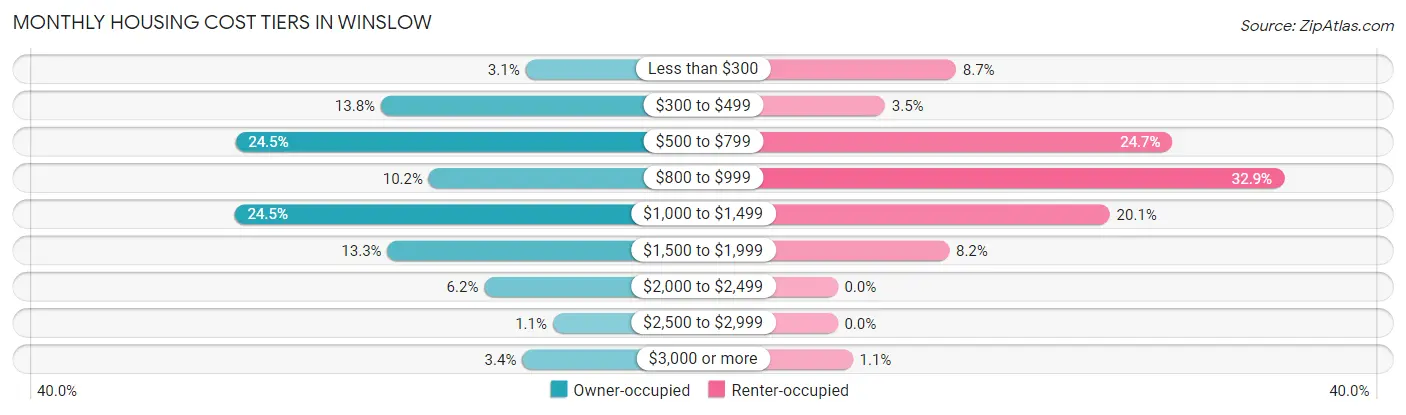
| Monthly Cost | Owner-occupied | Renter-occupied |
| Less than $300 | 51 (3.1%) | 70 (8.7%) |
| $300 to $499 | 226 (13.8%) | 28 (3.5%) |
| $500 to $799 | 402 (24.5%) | 198 (24.7%) |
| $800 to $999 | 168 (10.2%) | 264 (32.9%) |
| $1,000 to $1,499 | 403 (24.5%) | 161 (20.1%) |
| $1,500 to $1,999 | 218 (13.3%) | 66 (8.2%) |
| $2,000 to $2,499 | 101 (6.1%) | 0 (0.0%) |
| $2,500 to $2,999 | 18 (1.1%) | 0 (0.0%) |
| $3,000 or more | 55 (3.4%) | 9 (1.1%) |
| Total | 1,642 (100.0%) | 803 (100.0%) |
Physical Housing Characteristics in Winslow
Housing Structures in Winslow
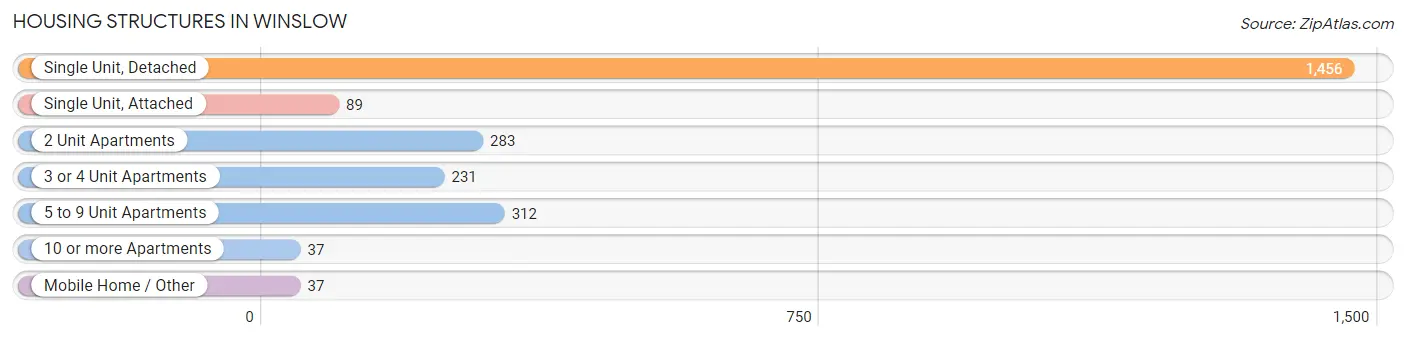
| Structure Type | # Housing Units | % Housing Units |
| Single Unit, Detached | 1,456 | 59.6% |
| Single Unit, Attached | 89 | 3.6% |
| 2 Unit Apartments | 283 | 11.6% |
| 3 or 4 Unit Apartments | 231 | 9.5% |
| 5 to 9 Unit Apartments | 312 | 12.8% |
| 10 or more Apartments | 37 | 1.5% |
| Mobile Home / Other | 37 | 1.5% |
| Total | 2,445 | 100.0% |
Housing Structures by Occupancy in Winslow
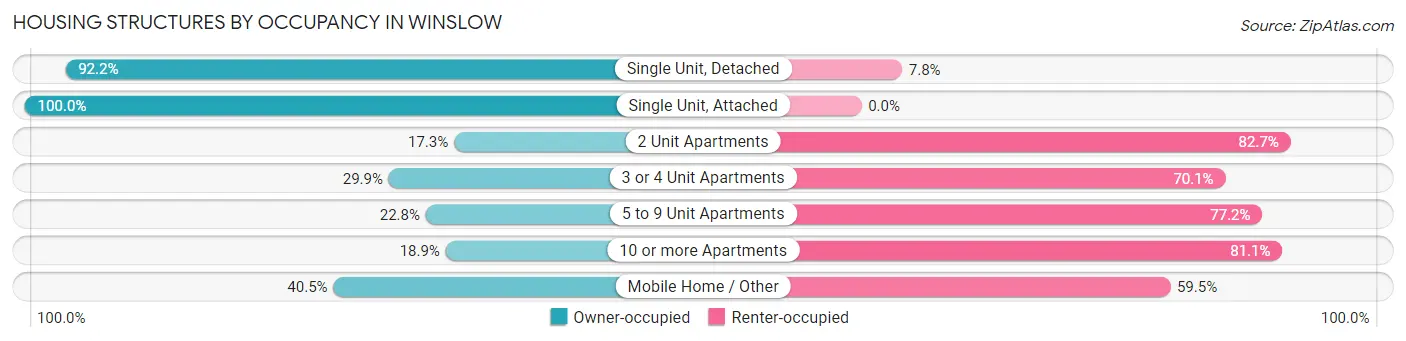
| Structure Type | Owner-occupied | Renter-occupied |
| Single Unit, Detached | 1,342 (92.2%) | 114 (7.8%) |
| Single Unit, Attached | 89 (100.0%) | 0 (0.0%) |
| 2 Unit Apartments | 49 (17.3%) | 234 (82.7%) |
| 3 or 4 Unit Apartments | 69 (29.9%) | 162 (70.1%) |
| 5 to 9 Unit Apartments | 71 (22.8%) | 241 (77.2%) |
| 10 or more Apartments | 7 (18.9%) | 30 (81.1%) |
| Mobile Home / Other | 15 (40.5%) | 22 (59.5%) |
| Total | 1,642 (67.2%) | 803 (32.8%) |
Housing Structures by Number of Rooms in Winslow
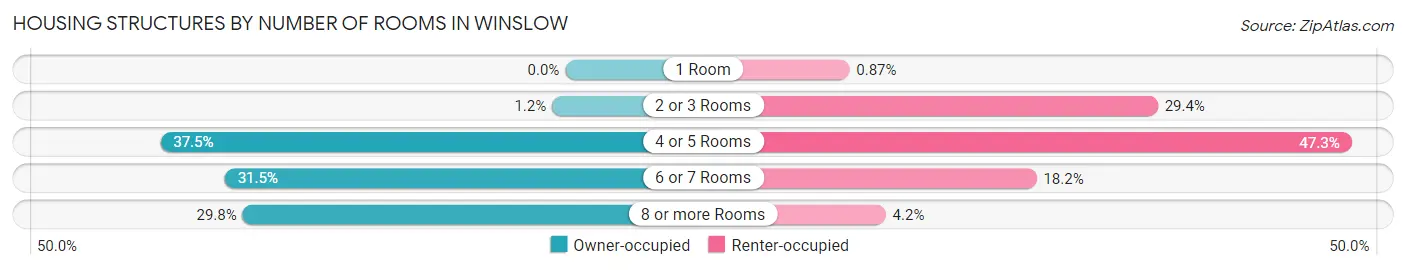
| Number of Rooms | Owner-occupied | Renter-occupied |
| 1 Room | 0 (0.0%) | 7 (0.9%) |
| 2 or 3 Rooms | 20 (1.2%) | 236 (29.4%) |
| 4 or 5 Rooms | 615 (37.4%) | 380 (47.3%) |
| 6 or 7 Rooms | 517 (31.5%) | 146 (18.2%) |
| 8 or more Rooms | 490 (29.8%) | 34 (4.2%) |
| Total | 1,642 (100.0%) | 803 (100.0%) |
Housing Structure by Heating Type in Winslow
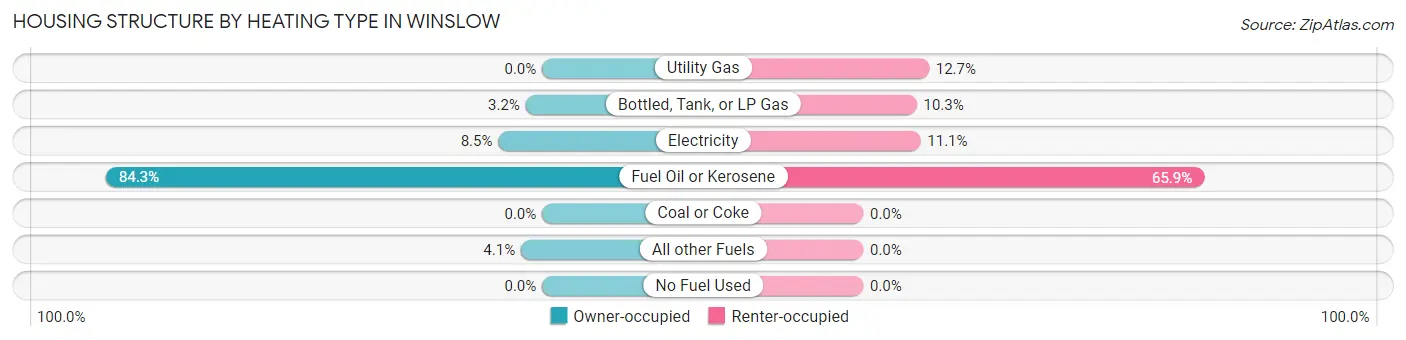
| Heating Type | Owner-occupied | Renter-occupied |
| Utility Gas | 0 (0.0%) | 102 (12.7%) |
| Bottled, Tank, or LP Gas | 52 (3.2%) | 83 (10.3%) |
| Electricity | 139 (8.5%) | 89 (11.1%) |
| Fuel Oil or Kerosene | 1,384 (84.3%) | 529 (65.9%) |
| Coal or Coke | 0 (0.0%) | 0 (0.0%) |
| All other Fuels | 67 (4.1%) | 0 (0.0%) |
| No Fuel Used | 0 (0.0%) | 0 (0.0%) |
| Total | 1,642 (100.0%) | 803 (100.0%) |
Household Vehicle Usage in Winslow
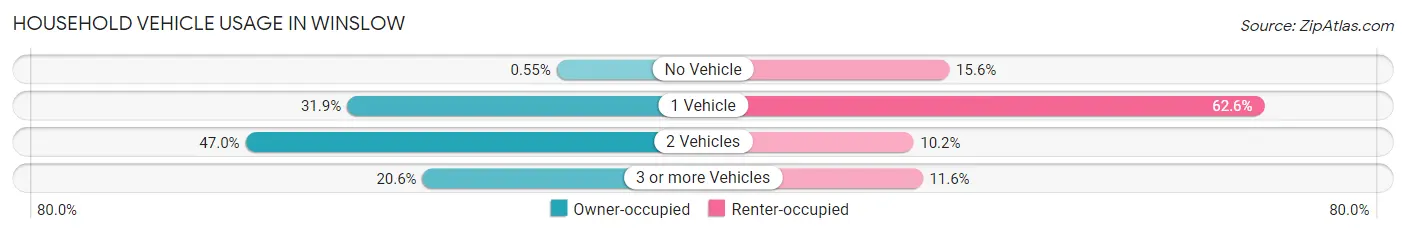
| Vehicles per Household | Owner-occupied | Renter-occupied |
| No Vehicle | 9 (0.5%) | 125 (15.6%) |
| 1 Vehicle | 523 (31.9%) | 503 (62.6%) |
| 2 Vehicles | 772 (47.0%) | 82 (10.2%) |
| 3 or more Vehicles | 338 (20.6%) | 93 (11.6%) |
| Total | 1,642 (100.0%) | 803 (100.0%) |
Real Estate & Mortgages in Winslow
Real Estate and Mortgage Overview in Winslow
| Characteristic | Without Mortgage | With Mortgage |
| Housing Units | 644 | 998 |
| Median Property Value | $184,000 | $174,500 |
| Median Household Income | $55,278 | $134 |
| Monthly Housing Costs | $532 | $55 |
| Real Estate Taxes | $2,172 | $17 |
Property Value by Mortgage Status in Winslow
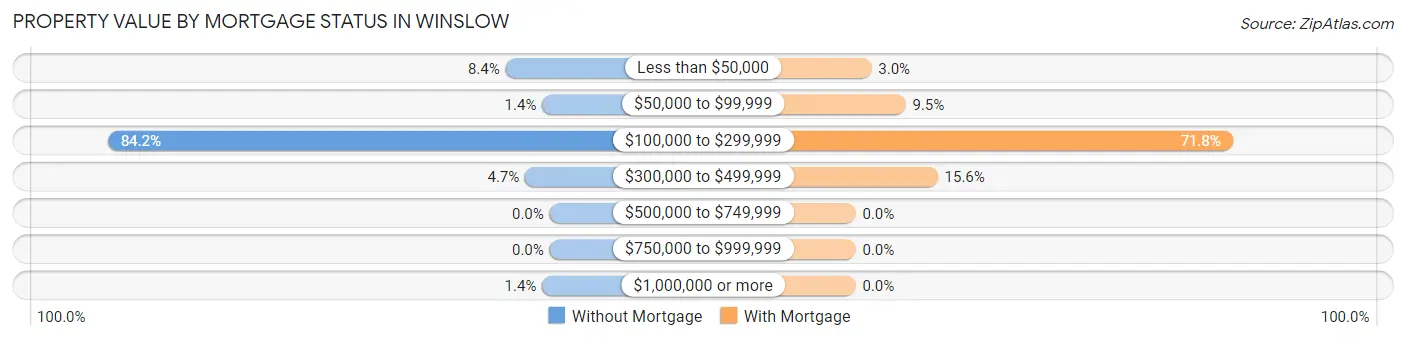
| Property Value | Without Mortgage | With Mortgage |
| Less than $50,000 | 54 (8.4%) | 30 (3.0%) |
| $50,000 to $99,999 | 9 (1.4%) | 95 (9.5%) |
| $100,000 to $299,999 | 542 (84.2%) | 717 (71.8%) |
| $300,000 to $499,999 | 30 (4.7%) | 156 (15.6%) |
| $500,000 to $749,999 | 0 (0.0%) | 0 (0.0%) |
| $750,000 to $999,999 | 0 (0.0%) | 0 (0.0%) |
| $1,000,000 or more | 9 (1.4%) | 0 (0.0%) |
| Total | 644 (100.0%) | 998 (100.0%) |
Household Income by Mortgage Status in Winslow
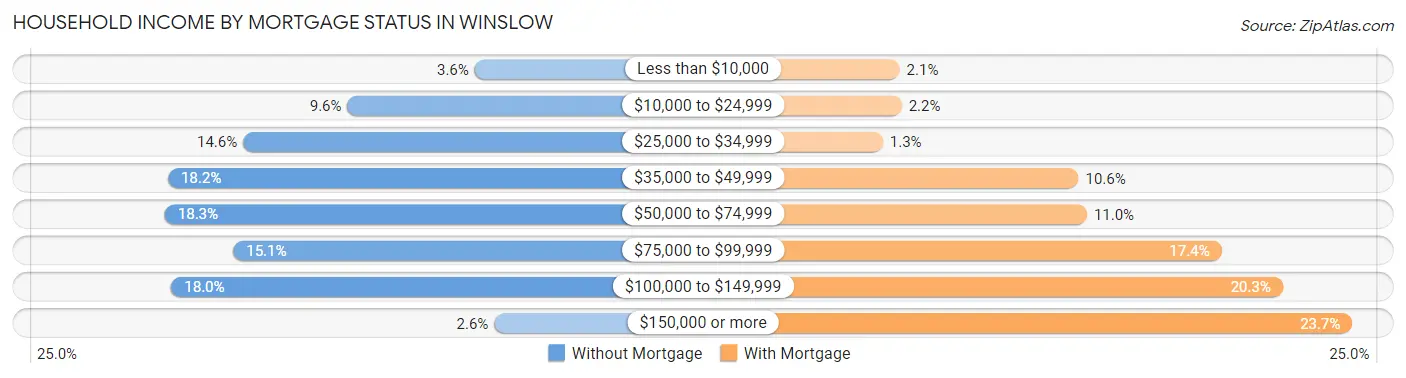
| Household Income | Without Mortgage | With Mortgage |
| Less than $10,000 | 23 (3.6%) | 21 (2.1%) |
| $10,000 to $24,999 | 62 (9.6%) | 22 (2.2%) |
| $25,000 to $34,999 | 94 (14.6%) | 13 (1.3%) |
| $35,000 to $49,999 | 117 (18.2%) | 106 (10.6%) |
| $50,000 to $74,999 | 118 (18.3%) | 110 (11.0%) |
| $75,000 to $99,999 | 97 (15.1%) | 174 (17.4%) |
| $100,000 to $149,999 | 116 (18.0%) | 203 (20.3%) |
| $150,000 or more | 17 (2.6%) | 236 (23.6%) |
| Total | 644 (100.0%) | 998 (100.0%) |
Property Value to Household Income Ratio in Winslow
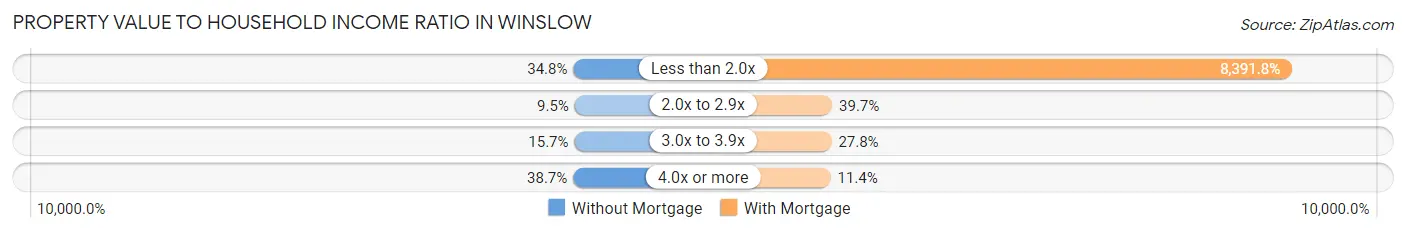
| Value-to-Income Ratio | Without Mortgage | With Mortgage |
| Less than 2.0x | 224 (34.8%) | 83,750 (8,391.8%) |
| 2.0x to 2.9x | 61 (9.5%) | 396 (39.7%) |
| 3.0x to 3.9x | 101 (15.7%) | 277 (27.8%) |
| 4.0x or more | 249 (38.7%) | 114 (11.4%) |
| Total | 644 (100.0%) | 998 (100.0%) |
Real Estate Taxes by Mortgage Status in Winslow
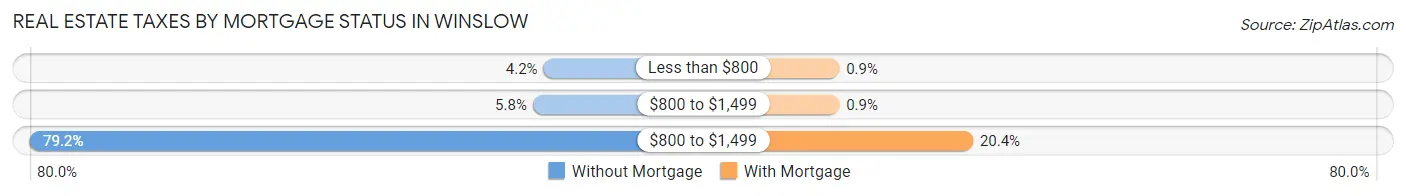
| Property Taxes | Without Mortgage | With Mortgage |
| Less than $800 | 27 (4.2%) | 9 (0.9%) |
| $800 to $1,499 | 37 (5.8%) | 9 (0.9%) |
| $800 to $1,499 | 510 (79.2%) | 204 (20.4%) |
| Total | 644 (100.0%) | 998 (100.0%) |
Health & Disability in Winslow
Health Insurance Coverage by Age in Winslow
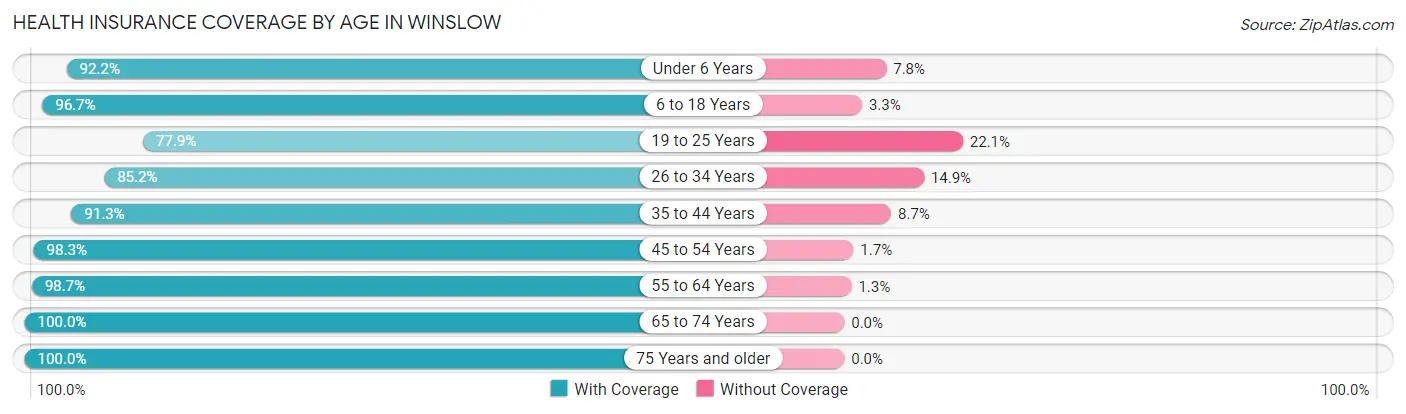
| Age Bracket | With Coverage | Without Coverage |
| Under 6 Years | 259 (92.2%) | 22 (7.8%) |
| 6 to 18 Years | 937 (96.7%) | 32 (3.3%) |
| 19 to 25 Years | 398 (77.9%) | 113 (22.1%) |
| 26 to 34 Years | 522 (85.2%) | 91 (14.8%) |
| 35 to 44 Years | 617 (91.3%) | 59 (8.7%) |
| 45 to 54 Years | 752 (98.3%) | 13 (1.7%) |
| 55 to 64 Years | 664 (98.7%) | 9 (1.3%) |
| 65 to 74 Years | 589 (100.0%) | 0 (0.0%) |
| 75 Years and older | 520 (100.0%) | 0 (0.0%) |
| Total | 5,258 (93.9%) | 339 (6.1%) |
Health Insurance Coverage by Citizenship Status in Winslow
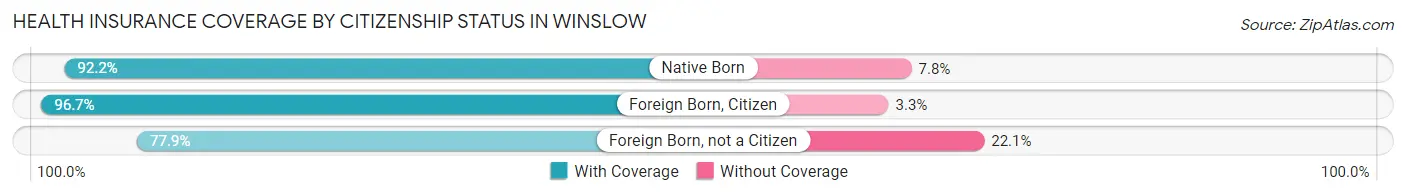
| Citizenship Status | With Coverage | Without Coverage |
| Native Born | 259 (92.2%) | 22 (7.8%) |
| Foreign Born, Citizen | 937 (96.7%) | 32 (3.3%) |
| Foreign Born, not a Citizen | 398 (77.9%) | 113 (22.1%) |
Health Insurance Coverage by Household Income in Winslow
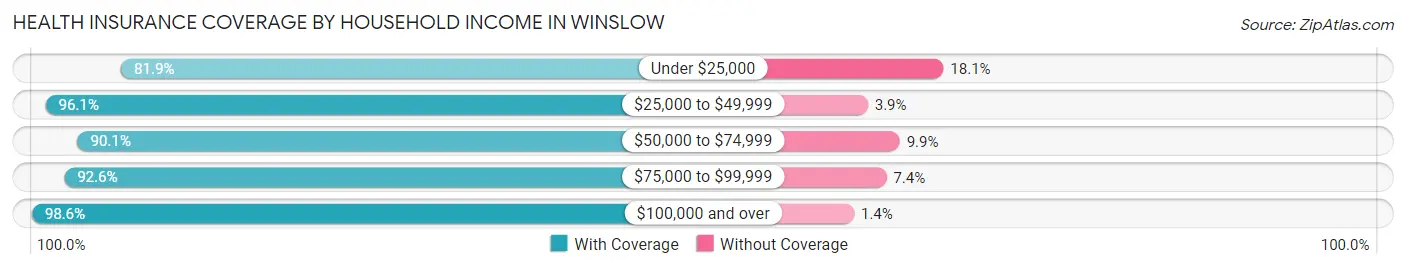
| Household Income | With Coverage | Without Coverage |
| Under $25,000 | 353 (81.9%) | 78 (18.1%) |
| $25,000 to $49,999 | 1,295 (96.1%) | 53 (3.9%) |
| $50,000 to $74,999 | 944 (90.1%) | 104 (9.9%) |
| $75,000 to $99,999 | 997 (92.6%) | 80 (7.4%) |
| $100,000 and over | 1,664 (98.6%) | 23 (1.4%) |
Public vs Private Health Insurance Coverage by Age in Winslow
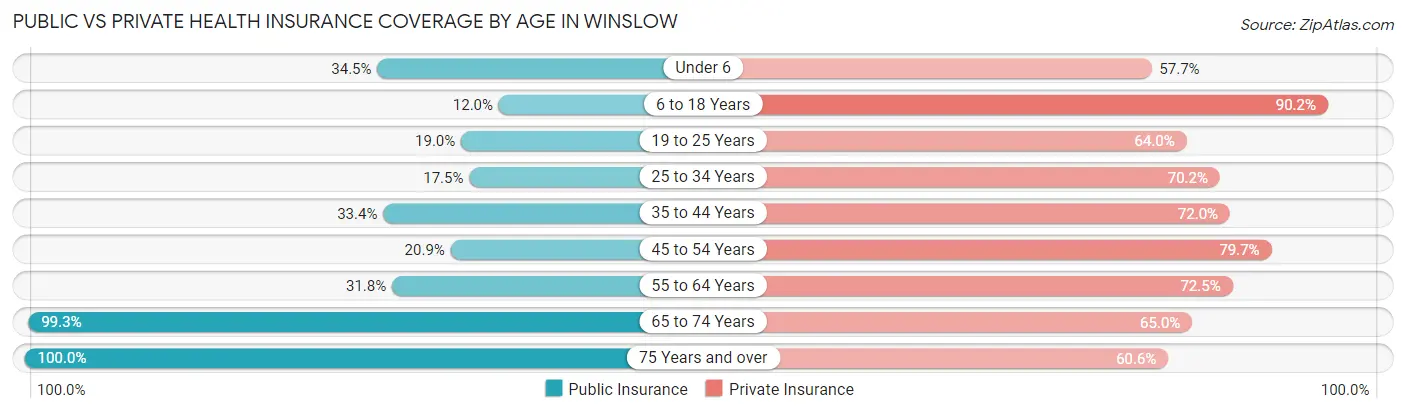
| Age Bracket | Public Insurance | Private Insurance |
| Under 6 | 97 (34.5%) | 162 (57.7%) |
| 6 to 18 Years | 116 (12.0%) | 874 (90.2%) |
| 19 to 25 Years | 97 (19.0%) | 327 (64.0%) |
| 25 to 34 Years | 107 (17.5%) | 430 (70.2%) |
| 35 to 44 Years | 226 (33.4%) | 487 (72.0%) |
| 45 to 54 Years | 160 (20.9%) | 610 (79.7%) |
| 55 to 64 Years | 214 (31.8%) | 488 (72.5%) |
| 65 to 74 Years | 585 (99.3%) | 383 (65.0%) |
| 75 Years and over | 520 (100.0%) | 315 (60.6%) |
| Total | 2,122 (37.9%) | 4,076 (72.8%) |
Disability Status by Sex by Age in Winslow
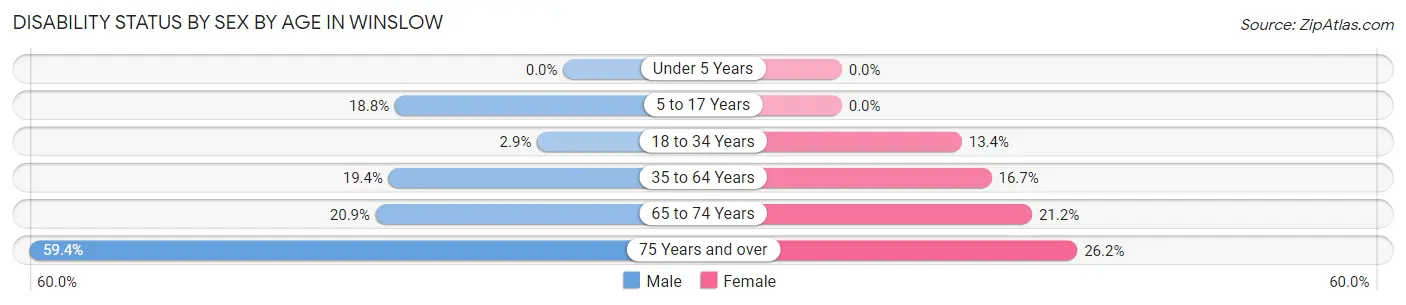
| Age Bracket | Male | Female |
| Under 5 Years | 0 (0.0%) | 0 (0.0%) |
| 5 to 17 Years | 63 (18.8%) | 0 (0.0%) |
| 18 to 34 Years | 18 (2.9%) | 80 (13.4%) |
| 35 to 64 Years | 200 (19.4%) | 181 (16.7%) |
| 65 to 74 Years | 52 (20.9%) | 72 (21.2%) |
| 75 Years and over | 139 (59.4%) | 75 (26.2%) |
Disability Class by Sex by Age in Winslow
Disability Class: Hearing Difficulty
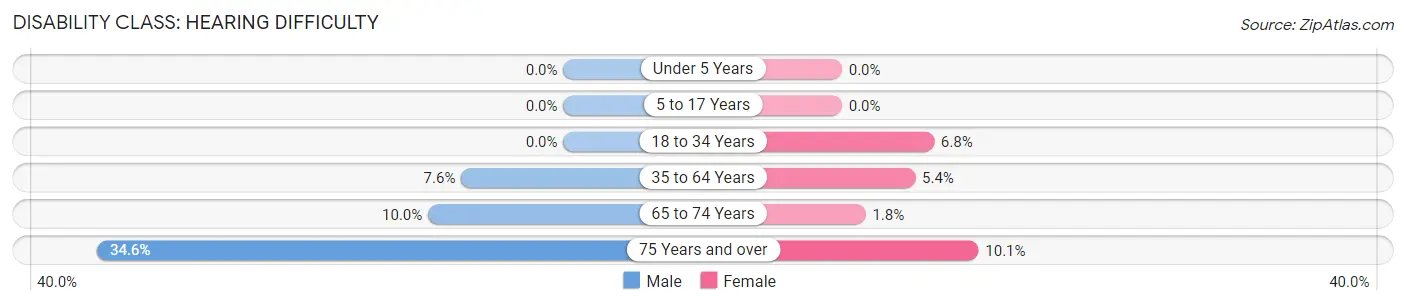
| Age Bracket | Male | Female |
| Under 5 Years | 0 (0.0%) | 0 (0.0%) |
| 5 to 17 Years | 0 (0.0%) | 0 (0.0%) |
| 18 to 34 Years | 0 (0.0%) | 41 (6.8%) |
| 35 to 64 Years | 78 (7.6%) | 59 (5.4%) |
| 65 to 74 Years | 25 (10.0%) | 6 (1.8%) |
| 75 Years and over | 81 (34.6%) | 29 (10.1%) |
Disability Class: Vision Difficulty
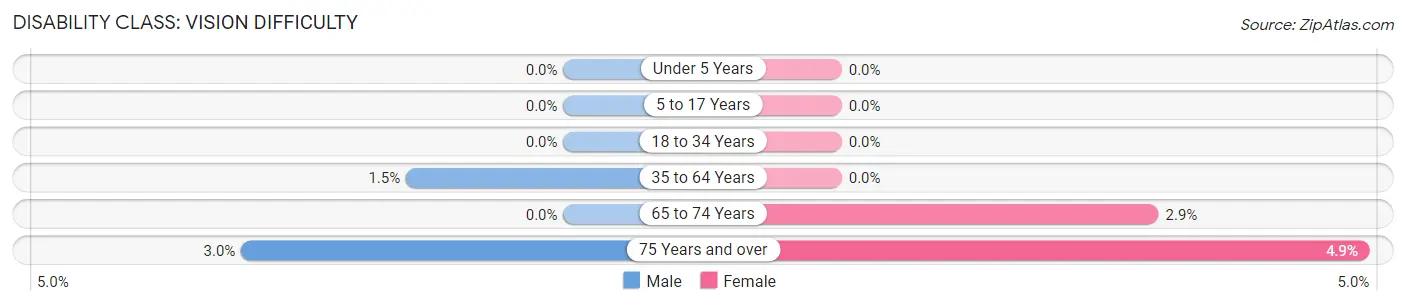
| Age Bracket | Male | Female |
| Under 5 Years | 0 (0.0%) | 0 (0.0%) |
| 5 to 17 Years | 0 (0.0%) | 0 (0.0%) |
| 18 to 34 Years | 0 (0.0%) | 0 (0.0%) |
| 35 to 64 Years | 15 (1.5%) | 0 (0.0%) |
| 65 to 74 Years | 0 (0.0%) | 10 (2.9%) |
| 75 Years and over | 7 (3.0%) | 14 (4.9%) |
Disability Class: Cognitive Difficulty
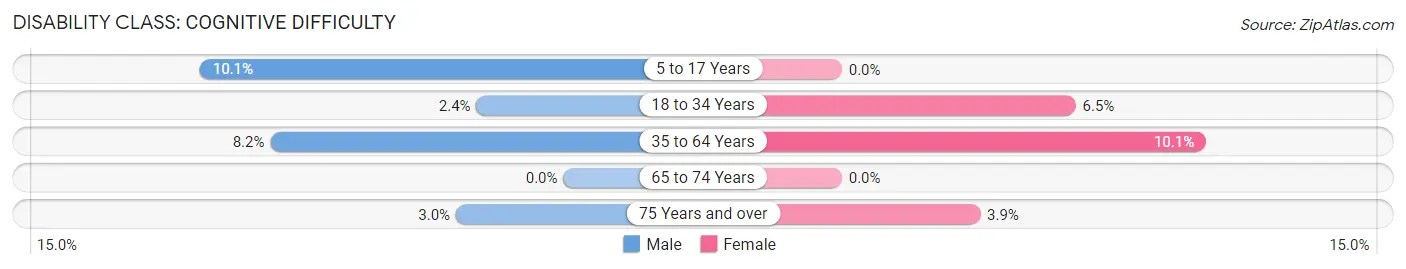
| Age Bracket | Male | Female |
| 5 to 17 Years | 34 (10.1%) | 0 (0.0%) |
| 18 to 34 Years | 15 (2.4%) | 39 (6.5%) |
| 35 to 64 Years | 84 (8.2%) | 110 (10.1%) |
| 65 to 74 Years | 0 (0.0%) | 0 (0.0%) |
| 75 Years and over | 7 (3.0%) | 11 (3.8%) |
Disability Class: Ambulatory Difficulty
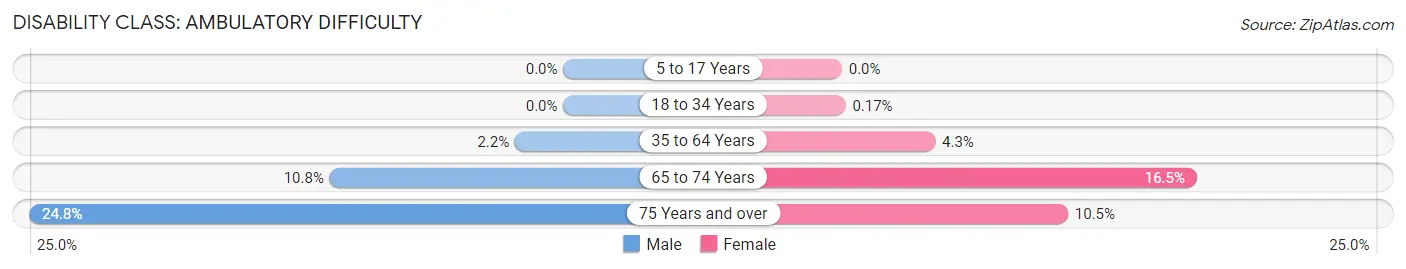
| Age Bracket | Male | Female |
| 5 to 17 Years | 0 (0.0%) | 0 (0.0%) |
| 18 to 34 Years | 0 (0.0%) | 1 (0.2%) |
| 35 to 64 Years | 23 (2.2%) | 47 (4.3%) |
| 65 to 74 Years | 27 (10.8%) | 56 (16.5%) |
| 75 Years and over | 58 (24.8%) | 30 (10.5%) |
Disability Class: Self-Care Difficulty
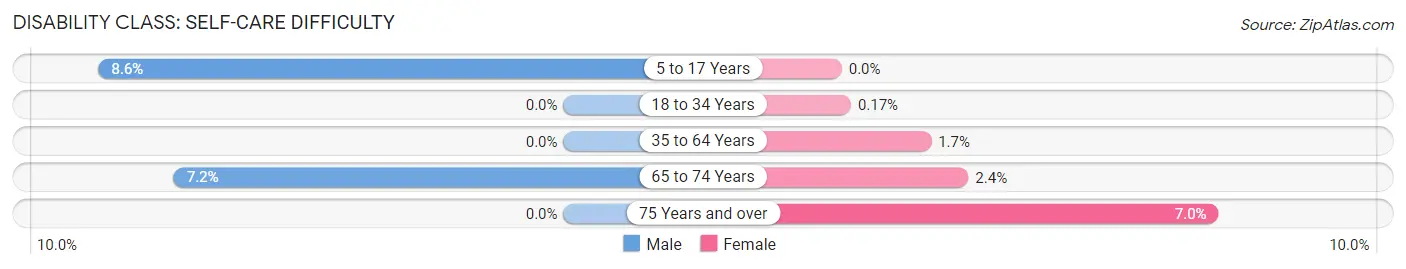
| Age Bracket | Male | Female |
| 5 to 17 Years | 29 (8.6%) | 0 (0.0%) |
| 18 to 34 Years | 0 (0.0%) | 1 (0.2%) |
| 35 to 64 Years | 0 (0.0%) | 18 (1.7%) |
| 65 to 74 Years | 18 (7.2%) | 8 (2.4%) |
| 75 Years and over | 0 (0.0%) | 20 (7.0%) |
Technology Access in Winslow
Computing Device Access in Winslow
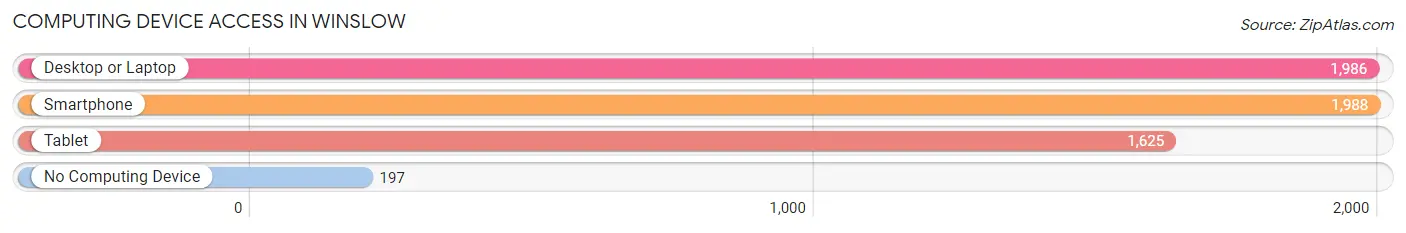
| Device Type | # Households | % Households |
| Desktop or Laptop | 1,986 | 81.2% |
| Smartphone | 1,988 | 81.3% |
| Tablet | 1,625 | 66.5% |
| No Computing Device | 197 | 8.1% |
| Total | 2,445 | 100.0% |
Internet Access in Winslow
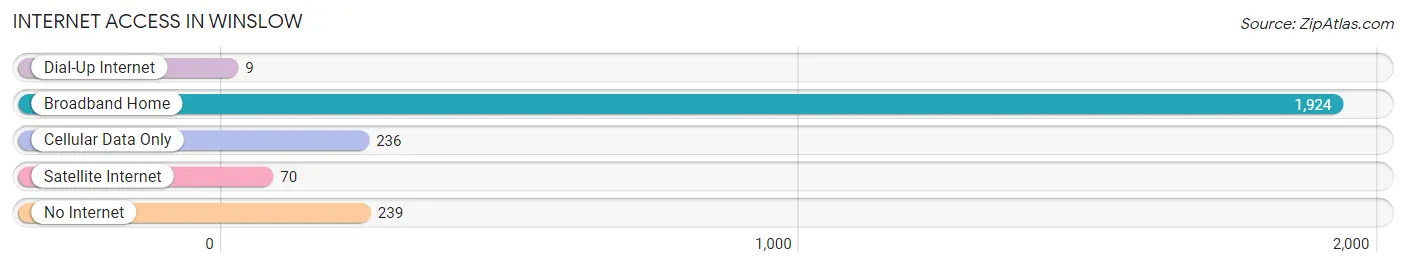
| Internet Type | # Households | % Households |
| Dial-Up Internet | 9 | 0.4% |
| Broadband Home | 1,924 | 78.7% |
| Cellular Data Only | 236 | 9.7% |
| Satellite Internet | 70 | 2.9% |
| No Internet | 239 | 9.8% |
| Total | 2,445 | 100.0% |
Winslow Summary
Winslow, Maine is a small town located in Kennebec County, in the central part of the state. It is situated on the banks of the Kennebec River, and is part of the Augusta-Waterville metropolitan area. The town has a population of approximately 6,000 people, and is home to a variety of businesses, including a paper mill, a lumber mill, and a number of small businesses.
History
Winslow was first settled in 1771 by a group of settlers from Massachusetts. The town was named after General John Winslow, who was a hero of the Revolutionary War. The town was incorporated in 1802, and the first town meeting was held in 1803.
In the early 19th century, Winslow was a thriving agricultural community, with a variety of crops being grown, including potatoes, corn, and hay. The town also had a number of sawmills, gristmills, and other small businesses.
In the late 19th century, Winslow began to experience a period of industrialization. The first paper mill was built in 1872, and the first lumber mill was built in 1876. These industries provided employment for many of the town’s residents, and helped to spur economic growth.
Geography
Winslow is located in the central part of Maine, in Kennebec County. The town is situated on the banks of the Kennebec River, and is part of the Augusta-Waterville metropolitan area. The town is bordered by the towns of Waterville to the north, Oakland to the east, and Fairfield to the south.
The town has a total area of 8.3 square miles, of which 8.2 square miles is land and 0.1 square miles is water. The town is located in a hilly region, with the highest point being the summit of Mount Pisgah, which has an elevation of 1,068 feet.
Economy
Winslow’s economy is largely based on the paper and lumber industries. The town is home to a paper mill, which produces paper products for a variety of industries, including printing, packaging, and paper products. The town also has a lumber mill, which produces lumber for construction and other uses.
In addition to these industries, Winslow is home to a variety of small businesses, including restaurants, retail stores, and service providers. The town also has a number of manufacturing companies, which produce a variety of products, including furniture, clothing, and electronics.
Demographics
As of the 2010 census, the population of Winslow was 6,072. The racial makeup of the town was 94.3% White, 1.2% African American, 0.5% Native American, 0.7% Asian, 0.1% Pacific Islander, 0.7% from other races, and 2.5% from two or more races. Hispanic or Latino of any race were 1.7% of the population.
The median household income in Winslow was $41,944, and the median family income was $50,917. The per capita income for the town was $20,945. About 11.2% of families and 14.2% of the population were below the poverty line, including 19.2% of those under age 18 and 8.2% of those age 65 or over.
Common Questions
What is Per Capita Income in Winslow?
Per Capita income in Winslow is $31,626.
What is the Median Family Income in Winslow?
Median Family Income in Winslow is $77,525.
What is the Median Household income in Winslow?
Median Household Income in Winslow is $53,896.
What is Income or Wage Gap in Winslow?
Income or Wage Gap in Winslow is 32.3%.
Women in Winslow earn 67.7 cents for every dollar earned by a man.
What is Inequality or Gini Index in Winslow?
Inequality or Gini Index in Winslow is 0.38.
What is the Total Population of Winslow?
Total Population of Winslow is 5,597.
What is the Total Male Population of Winslow?
Total Male Population of Winslow is 2,510.
What is the Total Female Population of Winslow?
Total Female Population of Winslow is 3,087.
What is the Ratio of Males per 100 Females in Winslow?
There are 81.31 Males per 100 Females in Winslow.
What is the Ratio of Females per 100 Males in Winslow?
There are 122.99 Females per 100 Males in Winslow.
What is the Median Population Age in Winslow?
Median Population Age in Winslow is 41.5 Years.
What is the Average Family Size in Winslow
Average Family Size in Winslow is 2.9 People.
What is the Average Household Size in Winslow
Average Household Size in Winslow is 2.3 People.
How Large is the Labor Force in Winslow?
There are 2,507 People in the Labor Forcein in Winslow.
What is the Percentage of People in the Labor Force in Winslow?
55.1% of People are in the Labor Force in Winslow.
What is the Unemployment Rate in Winslow?
Unemployment Rate in Winslow is 2.4%.