Cecilia, LA Map & Demographics
Cecilia Map
Cecilia Overview
$41,382
PER CAPITA INCOME
$86,061
AVG FAMILY INCOME
$70,259
AVG HOUSEHOLD INCOME
33.1%
WAGE / INCOME GAP [ % ]
66.9¢/ $1
WAGE / INCOME GAP [ $ ]
0.48
INEQUALITY / GINI INDEX
1,375
TOTAL POPULATION
781
MALE POPULATION
594
FEMALE POPULATION
131.48
MALES / 100 FEMALES
76.06
FEMALES / 100 MALES
33.7
MEDIAN AGE
3.1
AVG FAMILY SIZE
2.6
AVG HOUSEHOLD SIZE
730
LABOR FORCE [ PEOPLE ]
65.3%
PERCENT IN LABOR FORCE
3.2%
UNEMPLOYMENT RATE
Cecilia Area Codes
Income in Cecilia
Income Overview in Cecilia
Per Capita Income in Cecilia is $41,382, while median incomes of families and households are $86,061 and $70,259 respectively.
| Characteristic | Number | Measure |
| Per Capita Income | 1,375 | $41,382 |
| Median Family Income | 360 | $86,061 |
| Mean Family Income | 360 | $111,805 |
| Median Household Income | 536 | $70,259 |
| Mean Household Income | 536 | $94,708 |
| Income Deficit | 360 | $0 |
| Wage / Income Gap (%) | 1,375 | 33.07% |
| Wage / Income Gap ($) | 1,375 | 66.93¢ per $1 |
| Gini / Inequality Index | 1,375 | 0.48 |
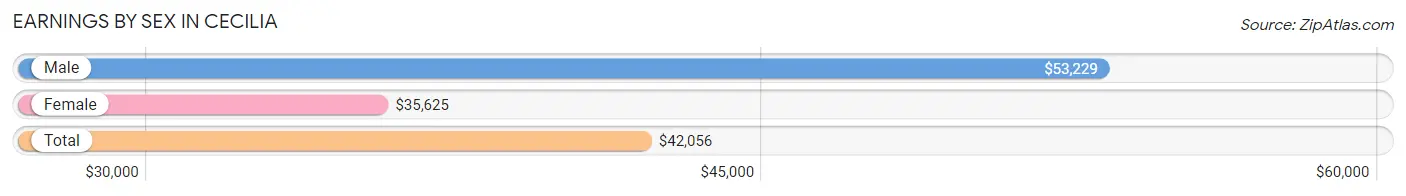
Earnings by Sex in Cecilia
Average Earnings in Cecilia are $42,056, $53,229 for men and $35,625 for women, a difference of 33.1%.
| Sex | Number | Average Earnings |
| Male | 395 (54.1%) | $53,229 |
| Female | 335 (45.9%) | $35,625 |
| Total | 730 (100.0%) | $42,056 |
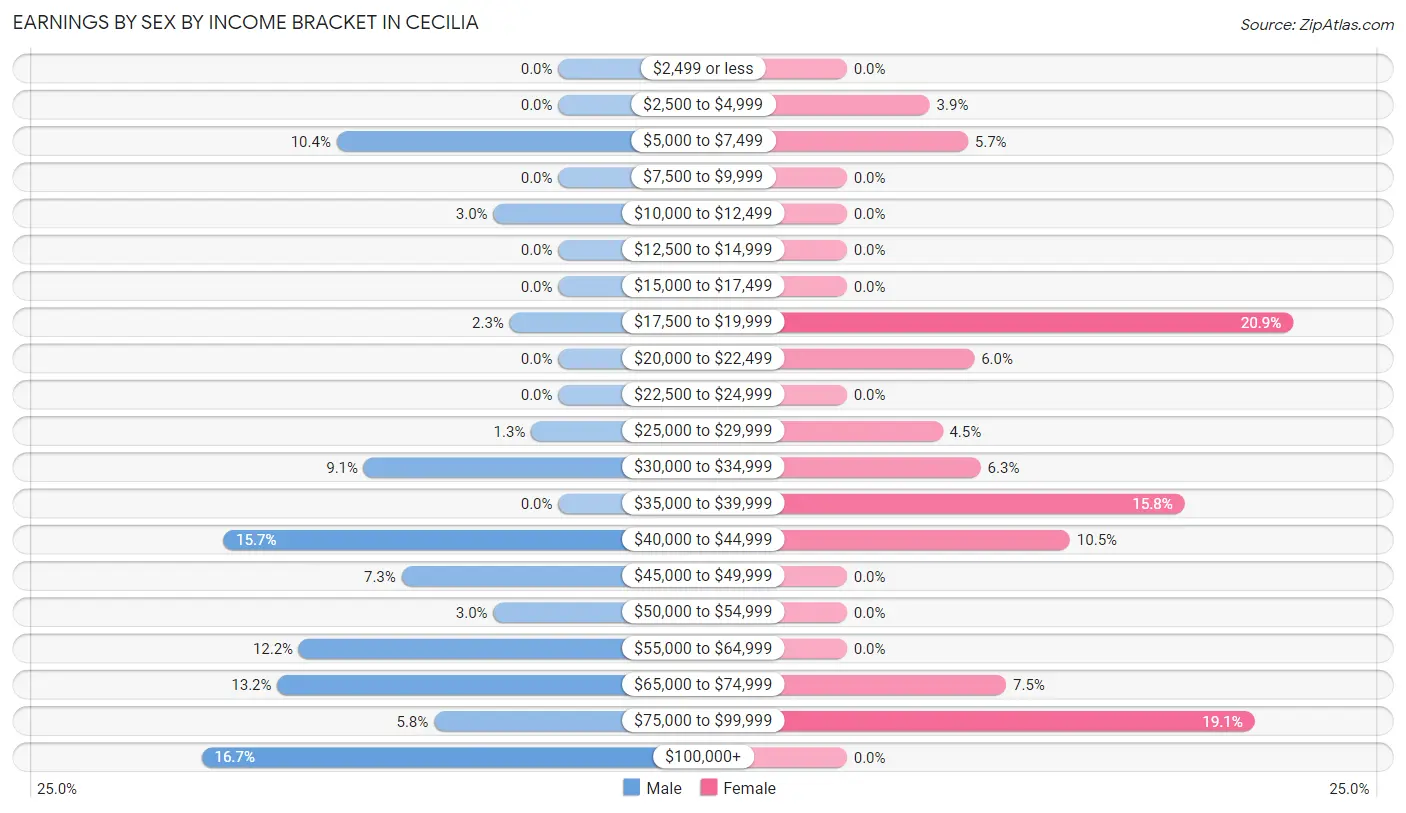
Earnings by Sex by Income Bracket in Cecilia
The most common earnings brackets in Cecilia are $100,000+ for men (66 | 16.7%) and $17,500 to $19,999 for women (70 | 20.9%).
| Income | Male | Female |
| $2,499 or less | 0 (0.0%) | 0 (0.0%) |
| $2,500 to $4,999 | 0 (0.0%) | 13 (3.9%) |
| $5,000 to $7,499 | 41 (10.4%) | 19 (5.7%) |
| $7,500 to $9,999 | 0 (0.0%) | 0 (0.0%) |
| $10,000 to $12,499 | 12 (3.0%) | 0 (0.0%) |
| $12,500 to $14,999 | 0 (0.0%) | 0 (0.0%) |
| $15,000 to $17,499 | 0 (0.0%) | 0 (0.0%) |
| $17,500 to $19,999 | 9 (2.3%) | 70 (20.9%) |
| $20,000 to $22,499 | 0 (0.0%) | 20 (6.0%) |
| $22,500 to $24,999 | 0 (0.0%) | 0 (0.0%) |
| $25,000 to $29,999 | 5 (1.3%) | 15 (4.5%) |
| $30,000 to $34,999 | 36 (9.1%) | 21 (6.3%) |
| $35,000 to $39,999 | 0 (0.0%) | 53 (15.8%) |
| $40,000 to $44,999 | 62 (15.7%) | 35 (10.4%) |
| $45,000 to $49,999 | 29 (7.3%) | 0 (0.0%) |
| $50,000 to $54,999 | 12 (3.0%) | 0 (0.0%) |
| $55,000 to $64,999 | 48 (12.1%) | 0 (0.0%) |
| $65,000 to $74,999 | 52 (13.2%) | 25 (7.5%) |
| $75,000 to $99,999 | 23 (5.8%) | 64 (19.1%) |
| $100,000+ | 66 (16.7%) | 0 (0.0%) |
| Total | 395 (100.0%) | 335 (100.0%) |
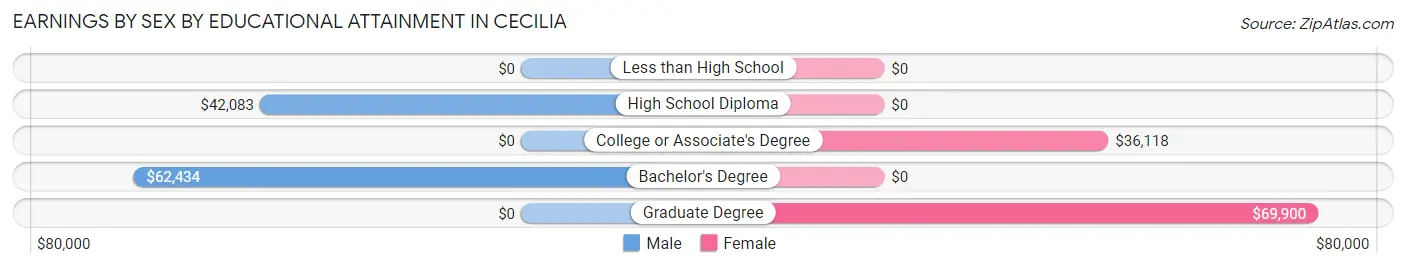
Earnings by Sex by Educational Attainment in Cecilia
Average earnings in Cecilia are $60,428 for men and $36,842 for women, a difference of 39.0%. Men with an educational attainment of bachelor's degree enjoy the highest average annual earnings of $62,434, while those with high school diploma education earn the least with $42,083. Women with an educational attainment of graduate degree earn the most with the average annual earnings of $69,900, while those with college or associate's degree education have the smallest earnings of $36,118.
| Educational Attainment | Male Income | Female Income |
| Less than High School | - | - |
| High School Diploma | $42,083 | $0 |
| College or Associate's Degree | - | - |
| Bachelor's Degree | $62,434 | $0 |
| Graduate Degree | - | - |
| Total | $60,428 | $36,842 |
Family Income in Cecilia
Family Income Brackets in Cecilia
According to the Cecilia family income data, there are 97 families falling into the $75,000 to $99,999 income range, which is the most common income bracket and makes up 26.9% of all families.
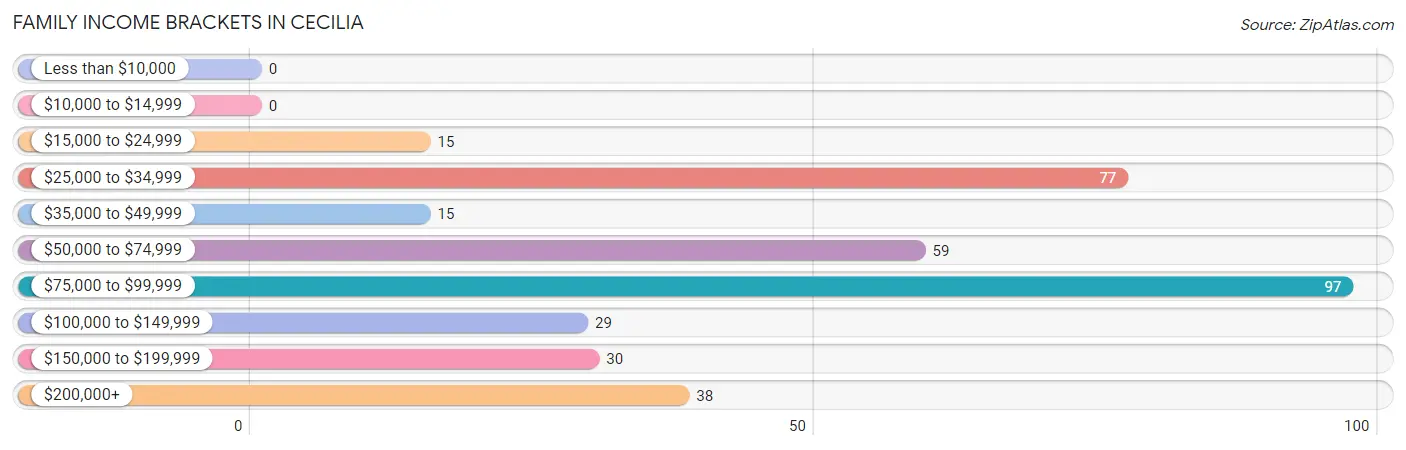
| Income Bracket | # Families | % Families |
| Less than $10,000 | 0 | 0.0% |
| $10,000 to $14,999 | 0 | 0.0% |
| $15,000 to $24,999 | 15 | 4.2% |
| $25,000 to $34,999 | 77 | 21.4% |
| $35,000 to $49,999 | 15 | 4.2% |
| $50,000 to $74,999 | 59 | 16.4% |
| $75,000 to $99,999 | 97 | 26.9% |
| $100,000 to $149,999 | 29 | 8.1% |
| $150,000 to $199,999 | 30 | 8.3% |
| $200,000+ | 38 | 10.6% |
Family Income by Famaliy Size in Cecilia
3-person families (183 | 50.8%) account for the highest median family income in Cecilia with $68,950 per family, while 3-person families (183 | 50.8%) have the highest median income of $22,983 per family member.
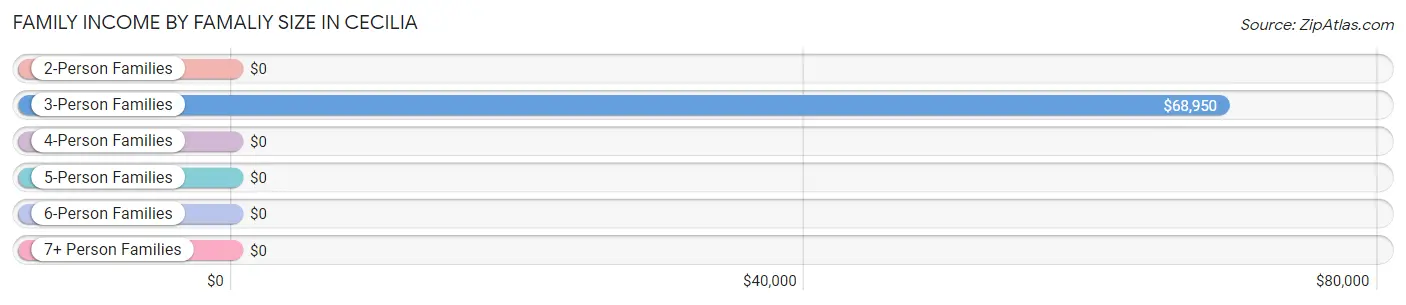
| Income Bracket | # Families | Median Income |
| 2-Person Families | 125 (34.7%) | $0 |
| 3-Person Families | 183 (50.8%) | $68,950 |
| 4-Person Families | 40 (11.1%) | $0 |
| 5-Person Families | 12 (3.3%) | $0 |
| 6-Person Families | 0 (0.0%) | $0 |
| 7+ Person Families | 0 (0.0%) | $0 |
| Total | 360 (100.0%) | $86,061 |
Family Income by Number of Earners in Cecilia
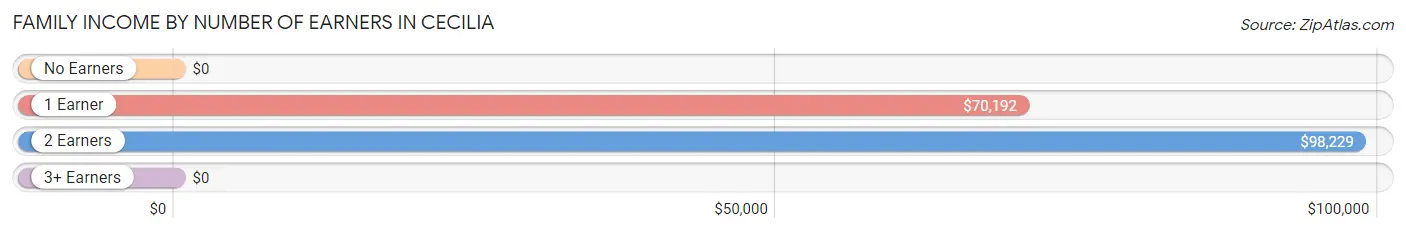
| Number of Earners | # Families | Median Income |
| No Earners | 42 (11.7%) | $0 |
| 1 Earner | 112 (31.1%) | $70,192 |
| 2 Earners | 199 (55.3%) | $98,229 |
| 3+ Earners | 7 (1.9%) | $0 |
| Total | 360 (100.0%) | $86,061 |
Household Income in Cecilia
Household Income Brackets in Cecilia
With 94 households falling in the category, the $75,000 to $99,999 income range is the most frequent in Cecilia, accounting for 17.5% of all households. In contrast, only 15 households (2.8%) fall into the $10,000 to $14,999 income bracket, making it the least populous group.
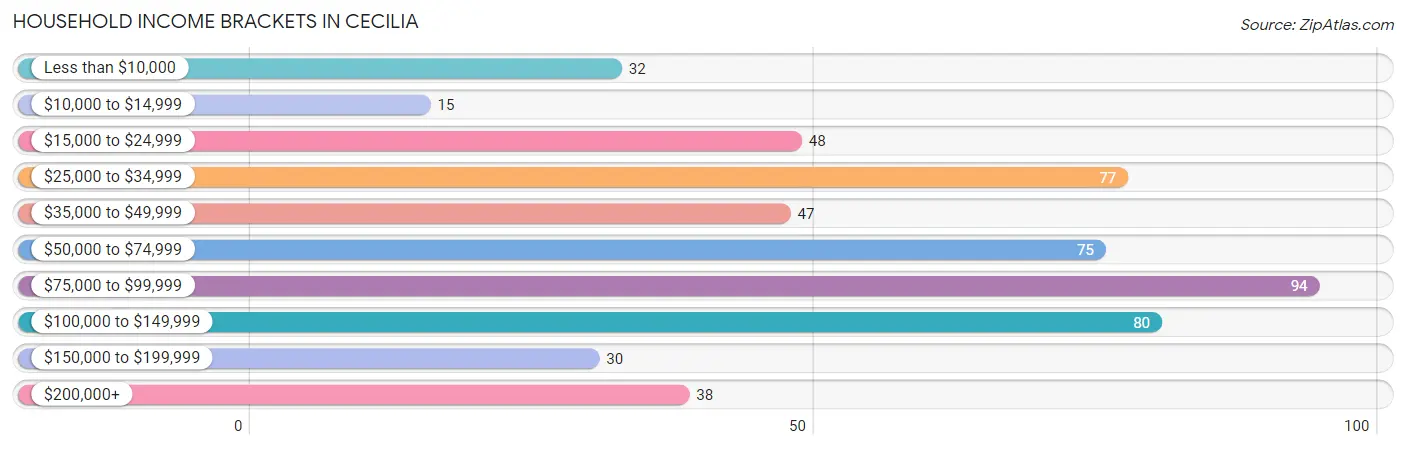
| Income Bracket | # Households | % Households |
| Less than $10,000 | 32 | 6.0% |
| $10,000 to $14,999 | 15 | 2.8% |
| $15,000 to $24,999 | 48 | 9.0% |
| $25,000 to $34,999 | 77 | 14.4% |
| $35,000 to $49,999 | 47 | 8.8% |
| $50,000 to $74,999 | 75 | 14.0% |
| $75,000 to $99,999 | 94 | 17.5% |
| $100,000 to $149,999 | 80 | 14.9% |
| $150,000 to $199,999 | 30 | 5.6% |
| $200,000+ | 38 | 7.1% |
Household Income by Householder Age in Cecilia
The median household income in Cecilia is $70,259, with the highest median household income of $80,650 found in the 25 to 44 years age bracket for the primary householder. A total of 231 households (43.1%) fall into this category.
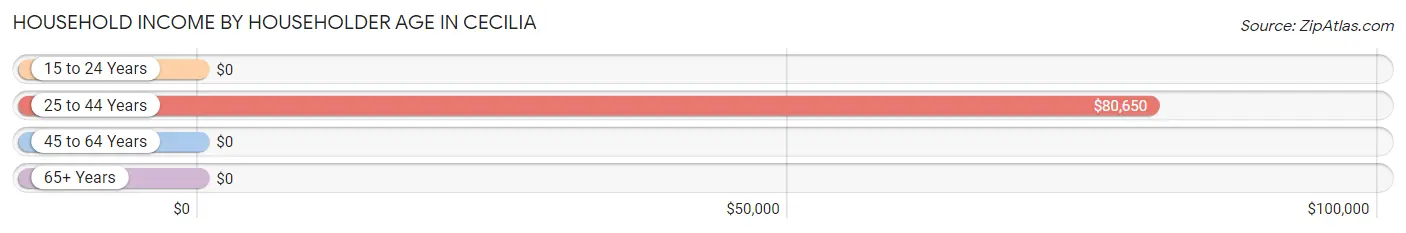
| Income Bracket | # Households | Median Income |
| 15 to 24 Years | 0 (0.0%) | $0 |
| 25 to 44 Years | 231 (43.1%) | $80,650 |
| 45 to 64 Years | 134 (25.0%) | $0 |
| 65+ Years | 171 (31.9%) | $0 |
| Total | 536 (100.0%) | $70,259 |
Poverty in Cecilia
Income Below Poverty by Sex and Age in Cecilia
With 3.5% poverty level for males and 11.5% for females among the residents of Cecilia, 75 year old and over males and 55 to 64 year old females are the most vulnerable to poverty, with 15 males (100.0%) and 15 females (100.0%) in their respective age groups living below the poverty level.
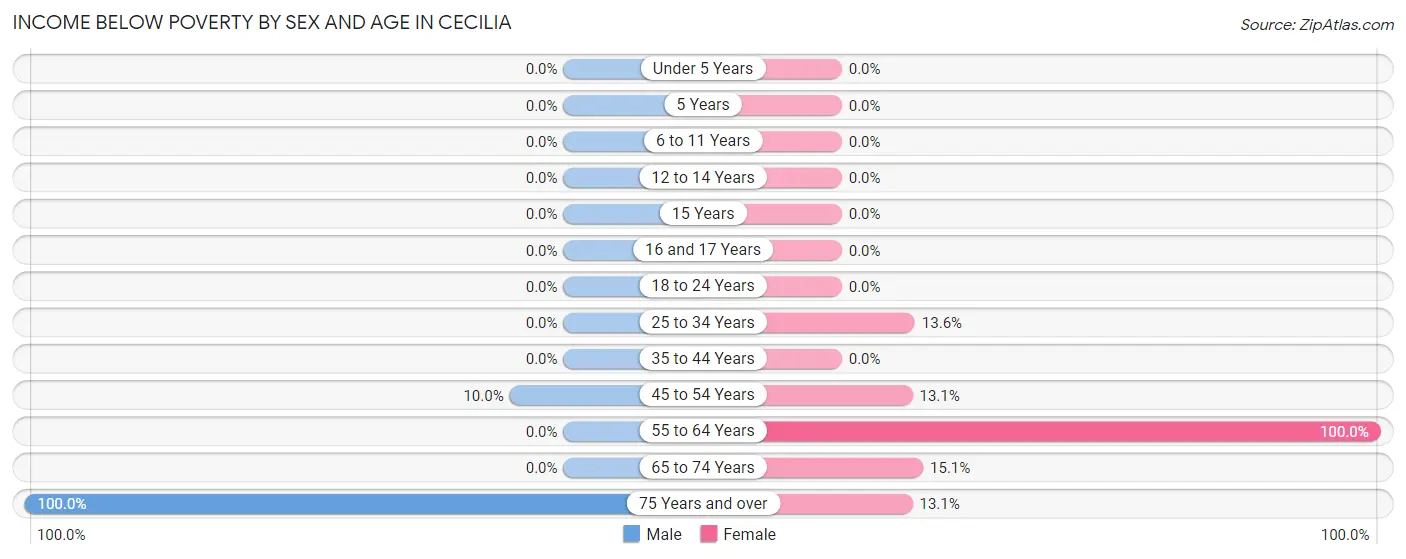
| Age Bracket | Male | Female |
| Under 5 Years | 0 (0.0%) | 0 (0.0%) |
| 5 Years | 0 (0.0%) | 0 (0.0%) |
| 6 to 11 Years | 0 (0.0%) | 0 (0.0%) |
| 12 to 14 Years | 0 (0.0%) | 0 (0.0%) |
| 15 Years | 0 (0.0%) | 0 (0.0%) |
| 16 and 17 Years | 0 (0.0%) | 0 (0.0%) |
| 18 to 24 Years | 0 (0.0%) | 0 (0.0%) |
| 25 to 34 Years | 0 (0.0%) | 19 (13.6%) |
| 35 to 44 Years | 0 (0.0%) | 0 (0.0%) |
| 45 to 54 Years | 12 (10.0%) | 13 (13.1%) |
| 55 to 64 Years | 0 (0.0%) | 15 (100.0%) |
| 65 to 74 Years | 0 (0.0%) | 8 (15.1%) |
| 75 Years and over | 15 (100.0%) | 13 (13.1%) |
| Total | 27 (3.5%) | 68 (11.5%) |
Income Above Poverty by Sex and Age in Cecilia
According to the poverty statistics in Cecilia, males aged under 5 years and females aged under 5 years are the age groups that are most secure financially, with 100.0% of males and 100.0% of females in these age groups living above the poverty line.
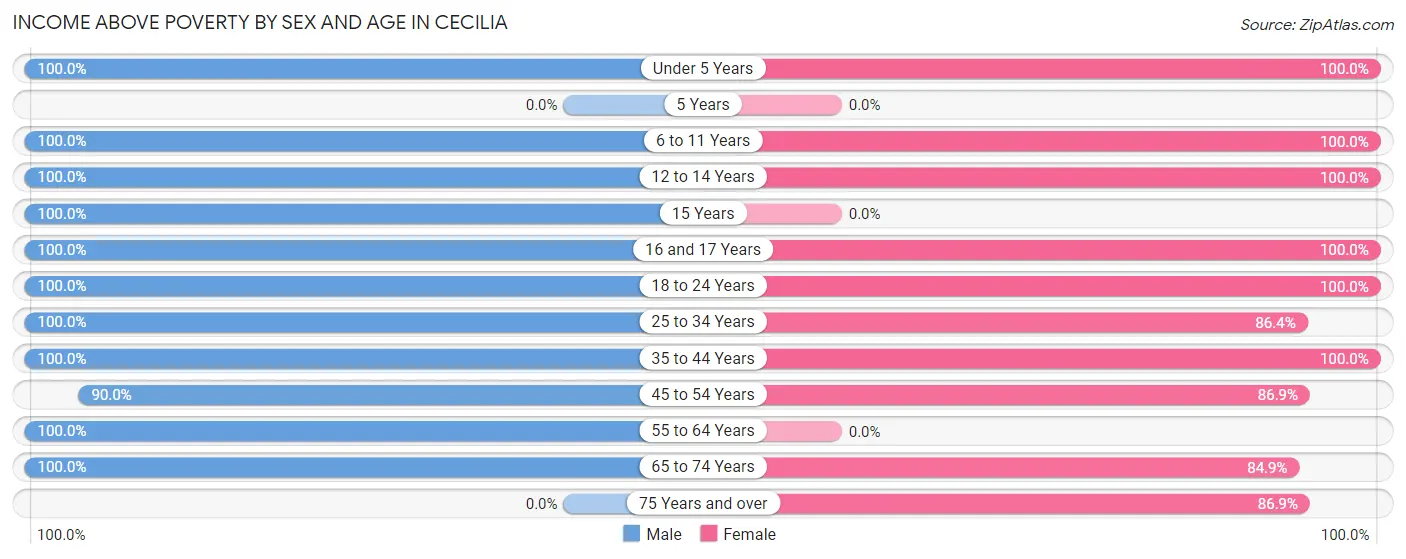
| Age Bracket | Male | Female |
| Under 5 Years | 31 (100.0%) | 16 (100.0%) |
| 5 Years | 0 (0.0%) | 0 (0.0%) |
| 6 to 11 Years | 74 (100.0%) | 33 (100.0%) |
| 12 to 14 Years | 18 (100.0%) | 58 (100.0%) |
| 15 Years | 27 (100.0%) | 0 (0.0%) |
| 16 and 17 Years | 26 (100.0%) | 7 (100.0%) |
| 18 to 24 Years | 50 (100.0%) | 37 (100.0%) |
| 25 to 34 Years | 189 (100.0%) | 121 (86.4%) |
| 35 to 44 Years | 74 (100.0%) | 37 (100.0%) |
| 45 to 54 Years | 108 (90.0%) | 86 (86.9%) |
| 55 to 64 Years | 84 (100.0%) | 0 (0.0%) |
| 65 to 74 Years | 73 (100.0%) | 45 (84.9%) |
| 75 Years and over | 0 (0.0%) | 86 (86.9%) |
| Total | 754 (96.5%) | 526 (88.5%) |
Income Below Poverty Among Married-Couple Families in Cecilia
The poverty statistics for married-couple families in Cecilia show that 7.7% or 15 of the total 195 families live below the poverty line. Families with no children have the highest poverty rate of 14.3%, comprising of 15 families. On the other hand, families with 1 or 2 children have the lowest poverty rate of 0.0%, which includes 0 families.
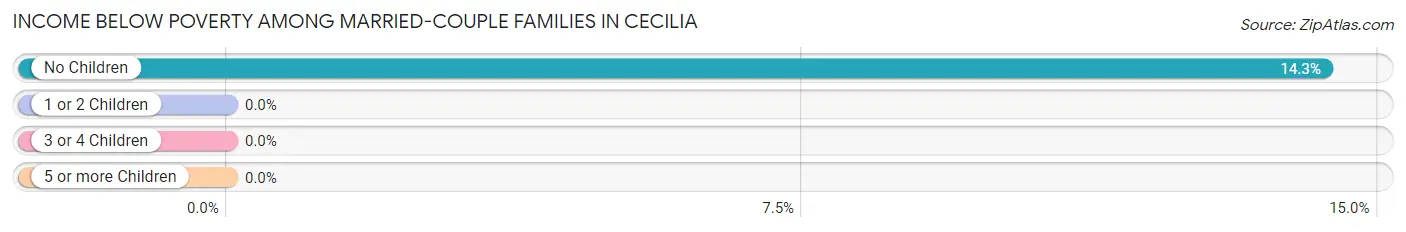
| Children | Above Poverty | Below Poverty |
| No Children | 90 (85.7%) | 15 (14.3%) |
| 1 or 2 Children | 85 (100.0%) | 0 (0.0%) |
| 3 or 4 Children | 5 (100.0%) | 0 (0.0%) |
| 5 or more Children | 0 (0.0%) | 0 (0.0%) |
| Total | 180 (92.3%) | 15 (7.7%) |
Income Below Poverty Among Single-Parent Households in Cecilia
| Children | Single Father | Single Mother |
| No Children | 0 (0.0%) | 0 (0.0%) |
| 1 or 2 Children | 0 (0.0%) | 0 (0.0%) |
| 3 or 4 Children | 0 (0.0%) | 0 (0.0%) |
| 5 or more Children | 0 (0.0%) | 0 (0.0%) |
| Total | 0 (0.0%) | 0 (0.0%) |
Income Below Poverty Among Married-Couple vs Single-Parent Households in Cecilia
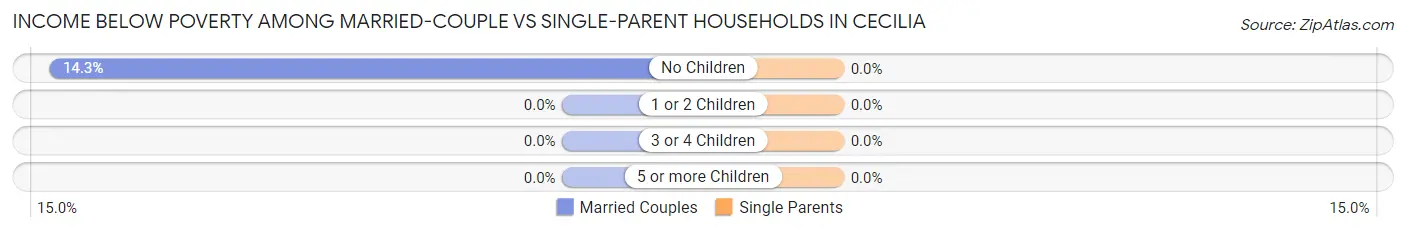
| Children | Married-Couple Families | Single-Parent Households |
| No Children | 15 (14.3%) | 0 (0.0%) |
| 1 or 2 Children | 0 (0.0%) | 0 (0.0%) |
| 3 or 4 Children | 0 (0.0%) | 0 (0.0%) |
| 5 or more Children | 0 (0.0%) | 0 (0.0%) |
| Total | 15 (7.7%) | 0 (0.0%) |
Race in Cecilia
The most populous races in Cecilia are Black / African American (735 | 53.4%), and White / Caucasian (640 | 46.6%).
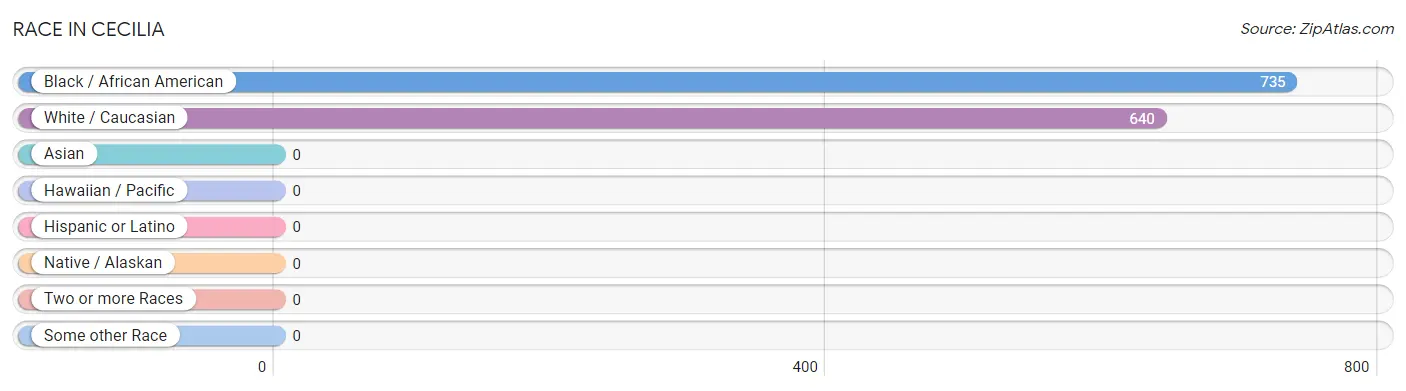
| Race | # Population | % Population |
| Asian | 0 | 0.0% |
| Black / African American | 735 | 53.4% |
| Hawaiian / Pacific | 0 | 0.0% |
| Hispanic or Latino | 0 | 0.0% |
| Native / Alaskan | 0 | 0.0% |
| White / Caucasian | 640 | 46.6% |
| Two or more Races | 0 | 0.0% |
| Some other Race | 0 | 0.0% |
| Total | 1,375 | 100.0% |
Ancestry in Cecilia
The most populous ancestries reported in Cecilia are American (116 | 8.4%), French (114 | 8.3%), French Canadian (56 | 4.1%), Italian (40 | 2.9%), and Cajun (23 | 1.7%), together accounting for 25.4% of all Cecilia residents.
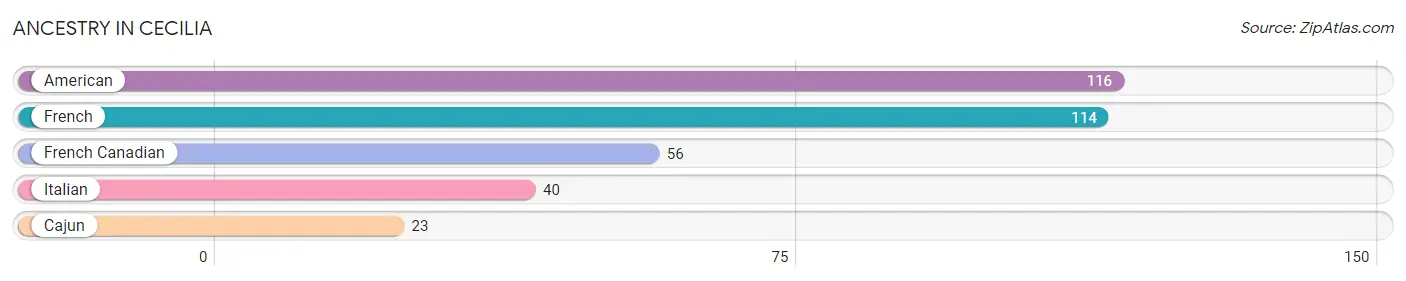
| Ancestry | # Population | % Population |
| American | 116 | 8.4% |
| Cajun | 23 | 1.7% |
| French | 114 | 8.3% |
| French Canadian | 56 | 4.1% |
| Italian | 40 | 2.9% | View All 5 Rows |
Immigrants in Cecilia

| Immigration Origin | # Population | % Population | View All 0 Rows |
Sex and Age in Cecilia
Sex and Age in Cecilia
The most populous age groups in Cecilia are 30 to 34 Years (148 | 19.0%) for men and 30 to 34 Years (90 | 15.1%) for women.
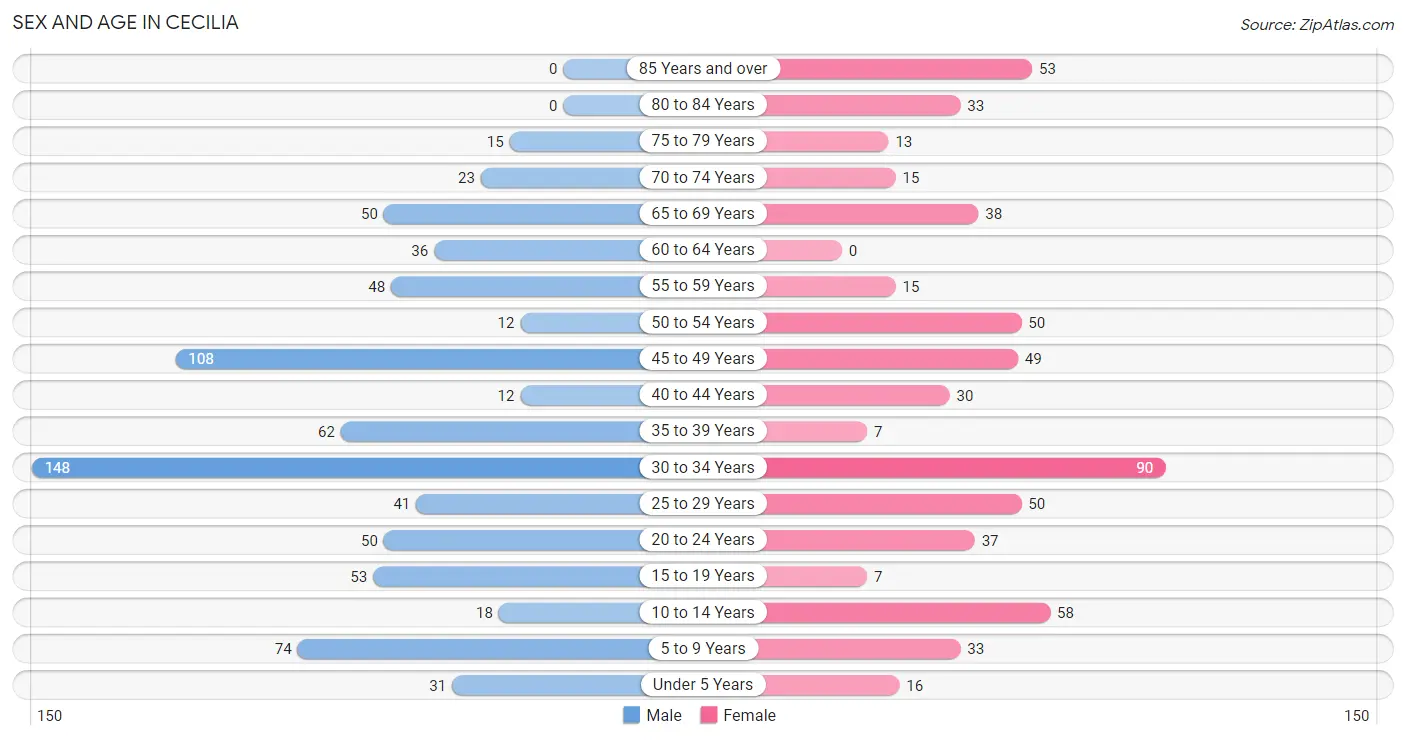
| Age Bracket | Male | Female |
| Under 5 Years | 31 (4.0%) | 16 (2.7%) |
| 5 to 9 Years | 74 (9.5%) | 33 (5.6%) |
| 10 to 14 Years | 18 (2.3%) | 58 (9.8%) |
| 15 to 19 Years | 53 (6.8%) | 7 (1.2%) |
| 20 to 24 Years | 50 (6.4%) | 37 (6.2%) |
| 25 to 29 Years | 41 (5.2%) | 50 (8.4%) |
| 30 to 34 Years | 148 (19.0%) | 90 (15.1%) |
| 35 to 39 Years | 62 (7.9%) | 7 (1.2%) |
| 40 to 44 Years | 12 (1.5%) | 30 (5.1%) |
| 45 to 49 Years | 108 (13.8%) | 49 (8.3%) |
| 50 to 54 Years | 12 (1.5%) | 50 (8.4%) |
| 55 to 59 Years | 48 (6.1%) | 15 (2.5%) |
| 60 to 64 Years | 36 (4.6%) | 0 (0.0%) |
| 65 to 69 Years | 50 (6.4%) | 38 (6.4%) |
| 70 to 74 Years | 23 (2.9%) | 15 (2.5%) |
| 75 to 79 Years | 15 (1.9%) | 13 (2.2%) |
| 80 to 84 Years | 0 (0.0%) | 33 (5.6%) |
| 85 Years and over | 0 (0.0%) | 53 (8.9%) |
| Total | 781 (100.0%) | 594 (100.0%) |
Families and Households in Cecilia
Median Family Size in Cecilia
The median family size in Cecilia is 3.09 persons per family, with married-couple families (195 | 54.2%) accounting for the largest median family size of 3.39 persons per family. On the other hand, single male/father families (13 | 3.6%) represent the smallest median family size with 1.77 persons per family.
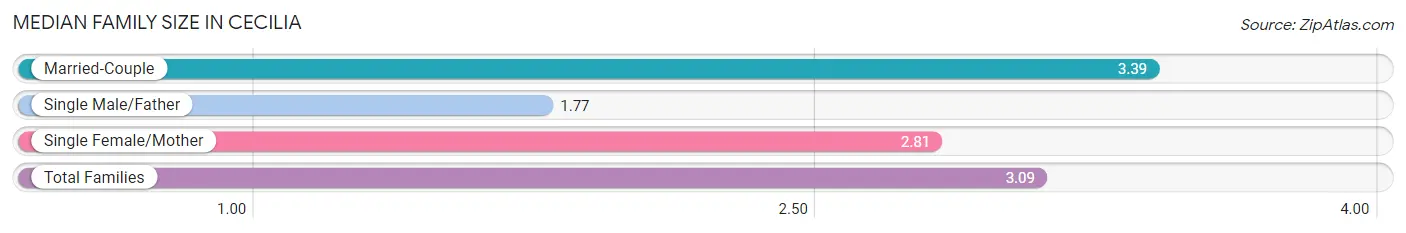
| Family Type | # Families | Family Size |
| Married-Couple | 195 (54.2%) | 3.39 |
| Single Male/Father | 13 (3.6%) | 1.77 |
| Single Female/Mother | 152 (42.2%) | 2.81 |
| Total Families | 360 (100.0%) | 3.09 |
Median Household Size in Cecilia
The median household size in Cecilia is 2.57 persons per household, with married-couple households (195 | 36.4%) accounting for the largest median household size of 3.39 persons per household. non-family households (176 | 32.8%) represent the smallest median household size with 1.21 persons per household.
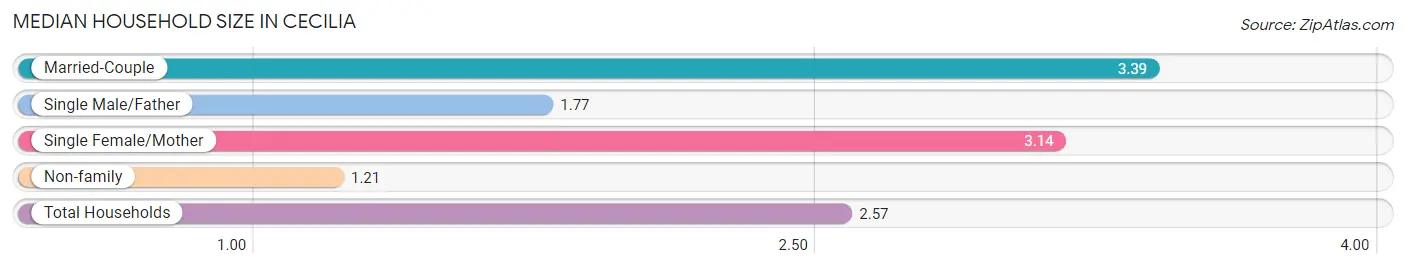
| Household Type | # Households | Household Size |
| Married-Couple | 195 (36.4%) | 3.39 |
| Single Male/Father | 13 (2.4%) | 1.77 |
| Single Female/Mother | 152 (28.4%) | 3.14 |
| Non-family | 176 (32.8%) | 1.21 |
| Total Households | 536 (100.0%) | 2.57 |
Household Size by Marriage Status in Cecilia
Out of a total of 536 households in Cecilia, 360 (67.2%) are family households, while 176 (32.8%) are nonfamily households. The most numerous type of family households are 3-person households, comprising 186, and the most common type of nonfamily households are 1-person households, comprising 135.
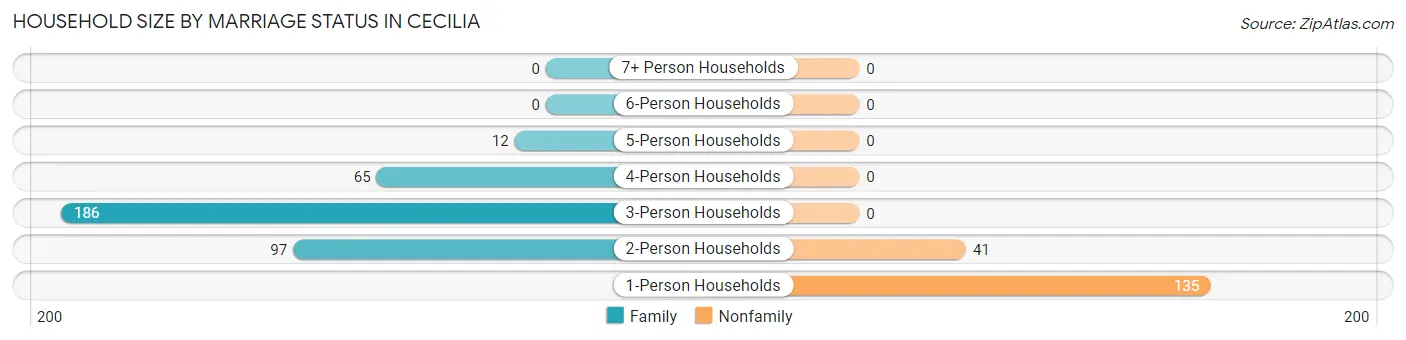
| Household Size | Family Households | Nonfamily Households |
| 1-Person Households | - | 135 (25.2%) |
| 2-Person Households | 97 (18.1%) | 41 (7.6%) |
| 3-Person Households | 186 (34.7%) | 0 (0.0%) |
| 4-Person Households | 65 (12.1%) | 0 (0.0%) |
| 5-Person Households | 12 (2.2%) | 0 (0.0%) |
| 6-Person Households | 0 (0.0%) | 0 (0.0%) |
| 7+ Person Households | 0 (0.0%) | 0 (0.0%) |
| Total | 360 (67.2%) | 176 (32.8%) |
Female Fertility in Cecilia
Fertility by Age in Cecilia
| Age Bracket | Women with Births | Births / 1,000 Women |
| 15 to 19 years | 0 (0.0%) | 0.0 |
| 20 to 34 years | 0 (0.0%) | 0.0 |
| 35 to 50 years | 0 (0.0%) | 0.0 |
| Total | 0 (0.0%) | 0.0 |
Fertility by Age by Marriage Status in Cecilia
| Age Bracket | Married | Unmarried |
| 15 to 19 years | 0 (0.0%) | 0 (0.0%) |
| 20 to 34 years | 0 (0.0%) | 0 (0.0%) |
| 35 to 50 years | 0 (0.0%) | 0 (0.0%) |
| Total | 0 (0.0%) | 0 (0.0%) |
Fertility by Education in Cecilia
| Educational Attainment | Women with Births | Births / 1,000 Women |
| Less than High School | 0 (0.0%) | 0.0 |
| High School Diploma | 0 (0.0%) | 0.0 |
| College or Associate's Degree | 0 (0.0%) | 0.0 |
| Bachelor's Degree | 0 (0.0%) | 0.0 |
| Graduate Degree | 0 (0.0%) | 0.0 |
| Total | 0 (0.0%) | 0.0 |
Fertility by Education by Marriage Status in Cecilia
| Educational Attainment | Married | Unmarried |
| Less than High School | 0 (0.0%) | 0 (0.0%) |
| High School Diploma | 0 (0.0%) | 0 (0.0%) |
| College or Associate's Degree | 0 (0.0%) | 0 (0.0%) |
| Bachelor's Degree | 0 (0.0%) | 0 (0.0%) |
| Graduate Degree | 0 (0.0%) | 0 (0.0%) |
| Total | 0 (0.0%) | 0 (0.0%) |
Employment Characteristics in Cecilia
Employment by Class of Employer in Cecilia
Among the 682 employed individuals in Cecilia, private company employees (418 | 61.3%), local government employees (164 | 24.0%), and self-employed (incorporated) (50 | 7.3%) make up the most common classes of employment.
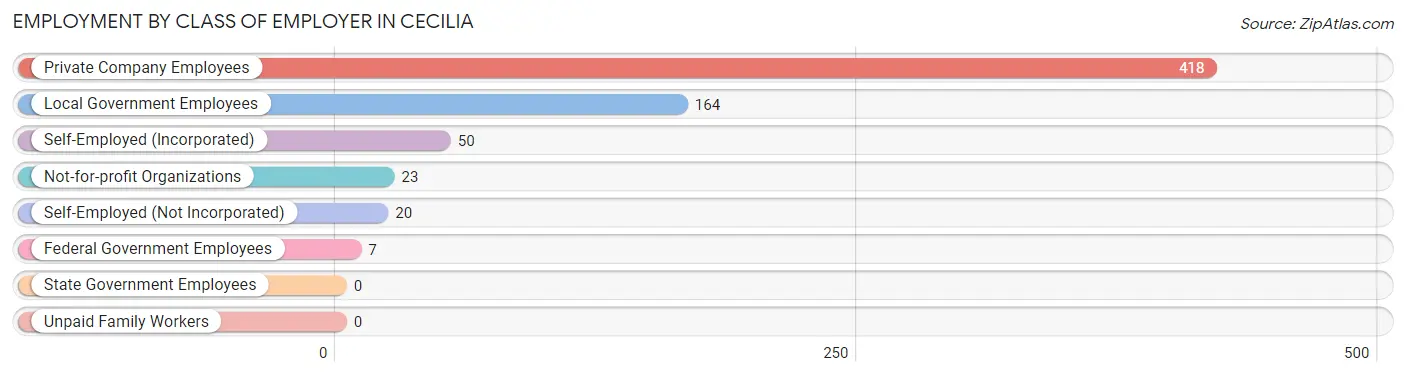
| Employer Class | # Employees | % Employees |
| Private Company Employees | 418 | 61.3% |
| Self-Employed (Incorporated) | 50 | 7.3% |
| Self-Employed (Not Incorporated) | 20 | 2.9% |
| Not-for-profit Organizations | 23 | 3.4% |
| Local Government Employees | 164 | 24.0% |
| State Government Employees | 0 | 0.0% |
| Federal Government Employees | 7 | 1.0% |
| Unpaid Family Workers | 0 | 0.0% |
| Total | 682 | 100.0% |
Employment Status by Age in Cecilia
According to the labor force statistics for Cecilia, out of the total population over 16 years of age (1,118), 65.3% or 730 individuals are in the labor force, with 3.2% or 23 of them unemployed. The age group with the highest labor force participation rate is 20 to 24 years, with 100.0% or 87 individuals in the labor force. Within the labor force, the 20 to 24 years age range has the highest percentage of unemployed individuals, with 26.4% or 23 of them being unemployed.
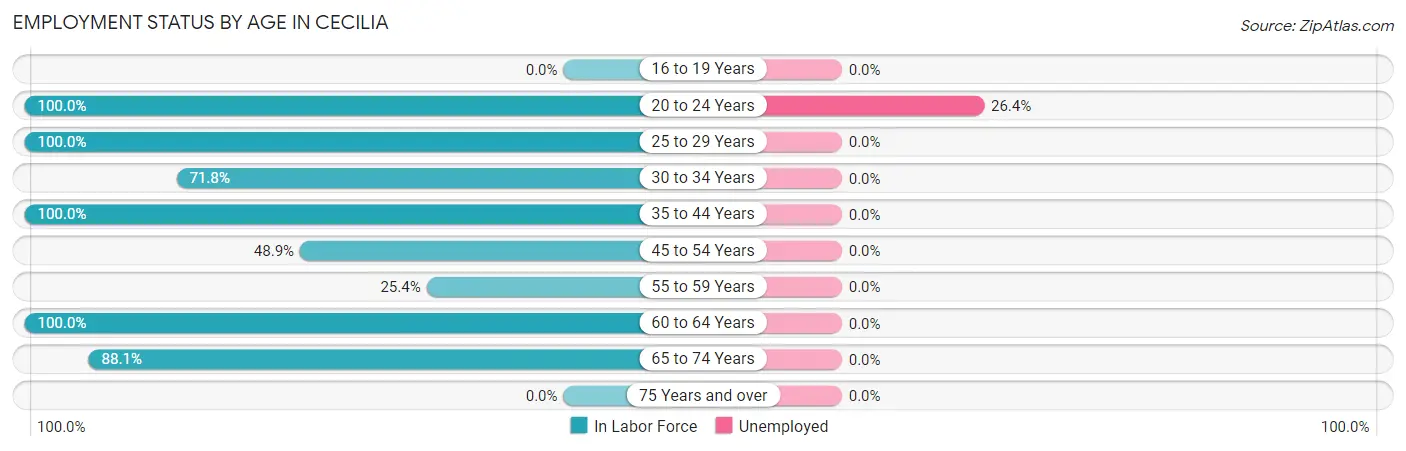
| Age Bracket | In Labor Force | Unemployed |
| 16 to 19 Years | 0 (0.0%) | 0 (0.0%) |
| 20 to 24 Years | 87 (100.0%) | 23 (26.4%) |
| 25 to 29 Years | 91 (100.0%) | 0 (0.0%) |
| 30 to 34 Years | 171 (71.8%) | 0 (0.0%) |
| 35 to 44 Years | 111 (100.0%) | 0 (0.0%) |
| 45 to 54 Years | 107 (48.9%) | 0 (0.0%) |
| 55 to 59 Years | 16 (25.4%) | 0 (0.0%) |
| 60 to 64 Years | 36 (100.0%) | 0 (0.0%) |
| 65 to 74 Years | 111 (88.1%) | 0 (0.0%) |
| 75 Years and over | 0 (0.0%) | 0 (0.0%) |
| Total | 730 (65.3%) | 23 (3.2%) |
Employment Status by Educational Attainment in Cecilia
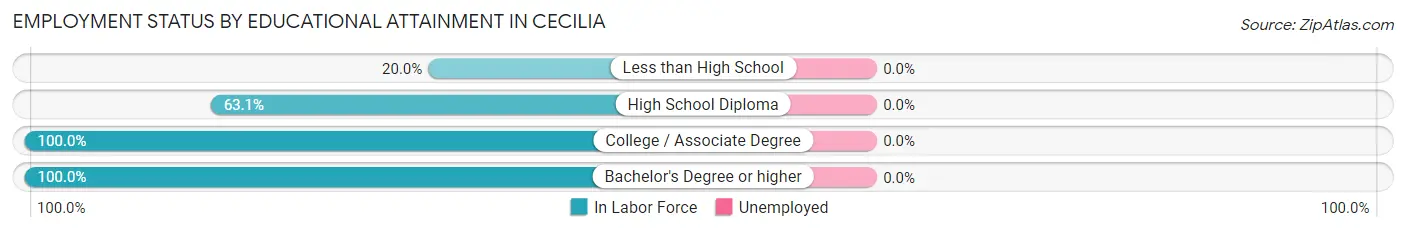
| Educational Attainment | In Labor Force | Unemployed |
| Less than High School | 12 (20.0%) | 0 (0.0%) |
| High School Diploma | 304 (63.1%) | 0 (0.0%) |
| College / Associate Degree | 91 (100.0%) | 0 (0.0%) |
| Bachelor's Degree or higher | 125 (100.0%) | 0 (0.0%) |
| Total | 532 (70.2%) | 0 (0.0%) |
Employment Occupations by Sex in Cecilia
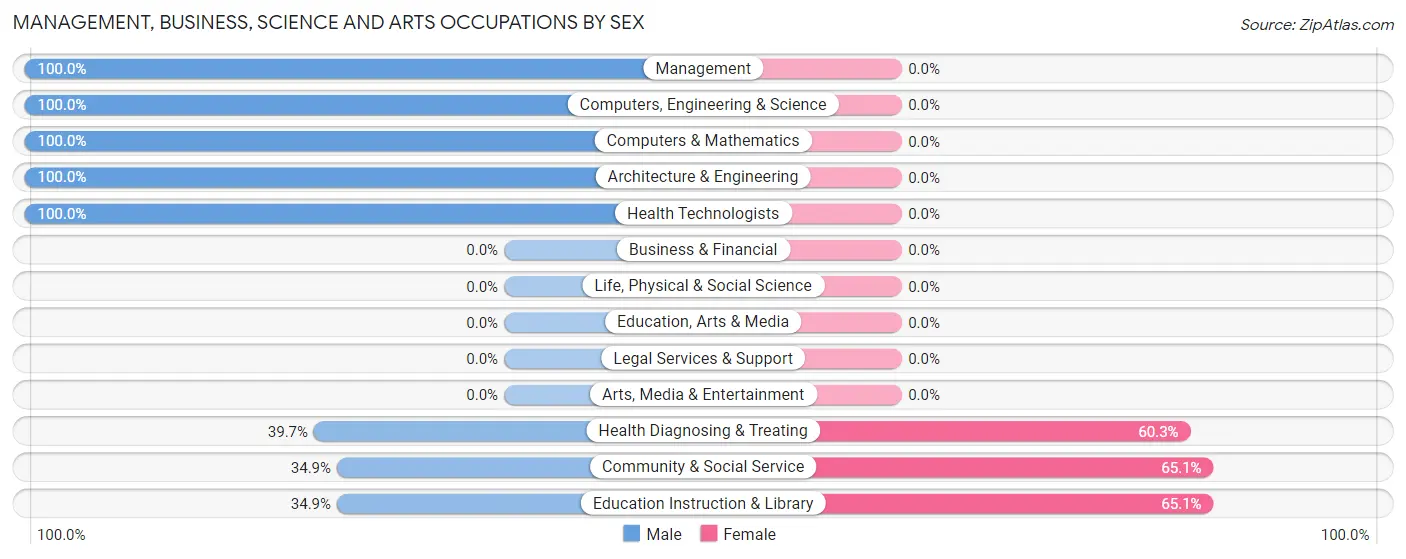
Management, Business, Science and Arts Occupations
The most common Management, Business, Science and Arts occupations in Cecilia are Community & Social Service (109 | 15.4%), Education Instruction & Library (109 | 15.4%), Computers, Engineering & Science (64 | 9.0%), Health Diagnosing & Treating (58 | 8.2%), and Architecture & Engineering (54 | 7.6%).
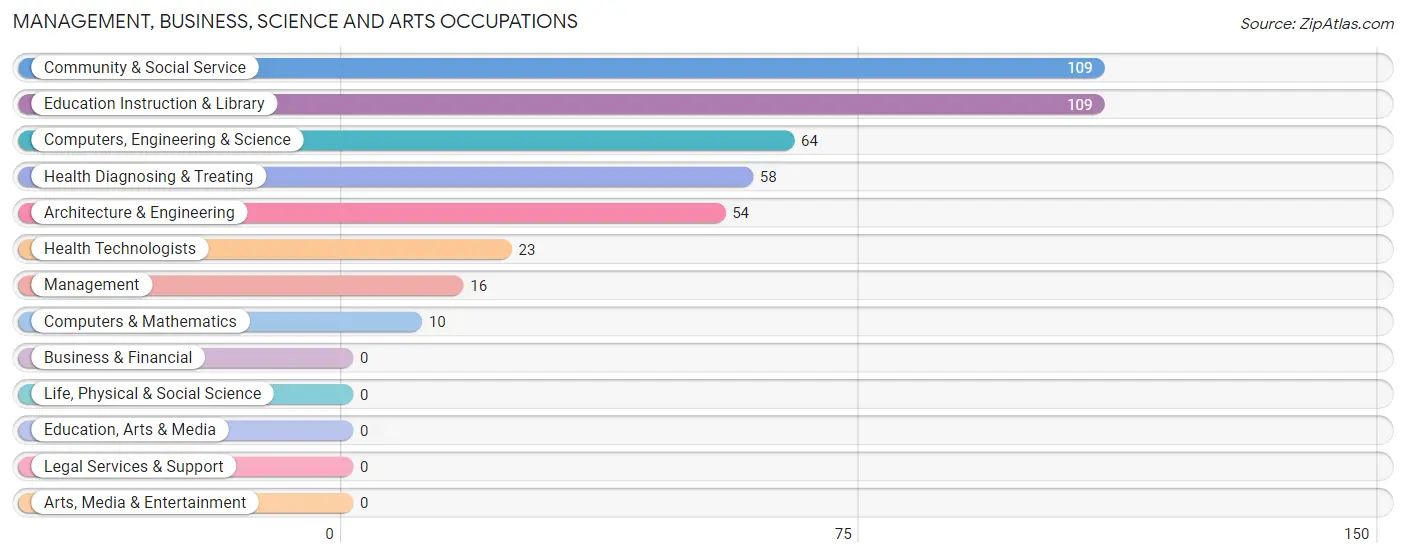
Management, Business, Science and Arts Occupations by Sex
Within the Management, Business, Science and Arts occupations in Cecilia, the most male-oriented occupations are Management (100.0%), Computers, Engineering & Science (100.0%), and Computers & Mathematics (100.0%), while the most female-oriented occupations are Community & Social Service (65.1%), Education Instruction & Library (65.1%), and Health Diagnosing & Treating (60.3%).
| Occupation | Male | Female |
| Management | 16 (100.0%) | 0 (0.0%) |
| Business & Financial | 0 (0.0%) | 0 (0.0%) |
| Computers, Engineering & Science | 64 (100.0%) | 0 (0.0%) |
| Computers & Mathematics | 10 (100.0%) | 0 (0.0%) |
| Architecture & Engineering | 54 (100.0%) | 0 (0.0%) |
| Life, Physical & Social Science | 0 (0.0%) | 0 (0.0%) |
| Community & Social Service | 38 (34.9%) | 71 (65.1%) |
| Education, Arts & Media | 0 (0.0%) | 0 (0.0%) |
| Legal Services & Support | 0 (0.0%) | 0 (0.0%) |
| Education Instruction & Library | 38 (34.9%) | 71 (65.1%) |
| Arts, Media & Entertainment | 0 (0.0%) | 0 (0.0%) |
| Health Diagnosing & Treating | 23 (39.7%) | 35 (60.3%) |
| Health Technologists | 23 (100.0%) | 0 (0.0%) |
| Total (Category) | 141 (57.1%) | 106 (42.9%) |
| Total (Overall) | 372 (52.6%) | 335 (47.4%) |
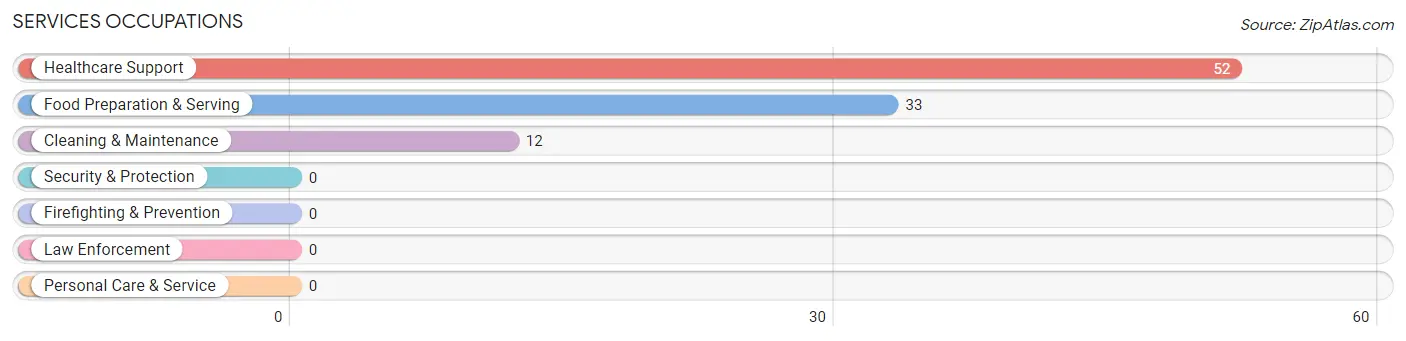
Services Occupations
The most common Services occupations in Cecilia are Healthcare Support (52 | 7.4%), Food Preparation & Serving (33 | 4.7%), and Cleaning & Maintenance (12 | 1.7%).
Services Occupations by Sex
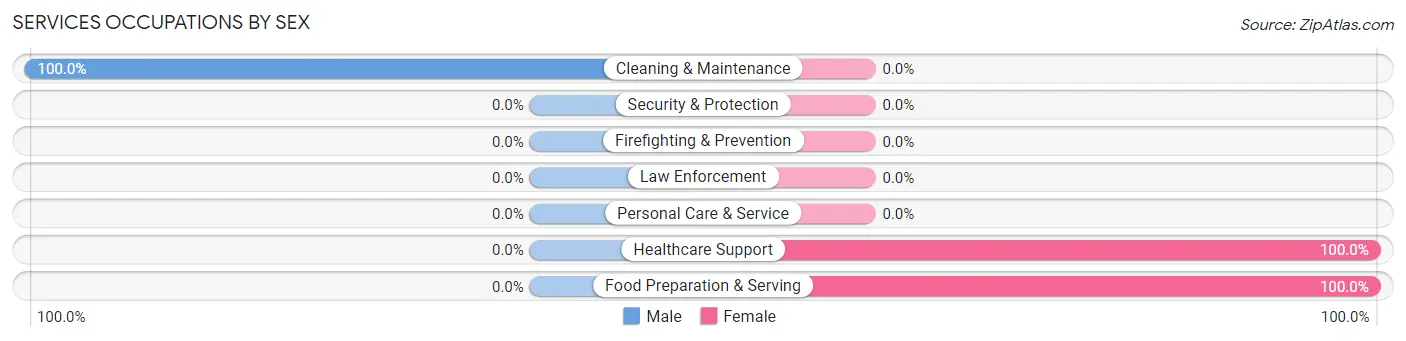
| Occupation | Male | Female |
| Healthcare Support | 0 (0.0%) | 52 (100.0%) |
| Security & Protection | 0 (0.0%) | 0 (0.0%) |
| Firefighting & Prevention | 0 (0.0%) | 0 (0.0%) |
| Law Enforcement | 0 (0.0%) | 0 (0.0%) |
| Food Preparation & Serving | 0 (0.0%) | 33 (100.0%) |
| Cleaning & Maintenance | 12 (100.0%) | 0 (0.0%) |
| Personal Care & Service | 0 (0.0%) | 0 (0.0%) |
| Total (Category) | 12 (12.4%) | 85 (87.6%) |
| Total (Overall) | 372 (52.6%) | 335 (47.4%) |
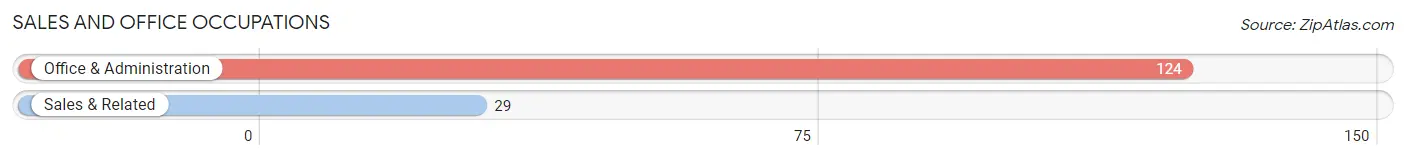
Sales and Office Occupations
The most common Sales and Office occupations in Cecilia are Office & Administration (124 | 17.5%), and Sales & Related (29 | 4.1%).
Sales and Office Occupations by Sex
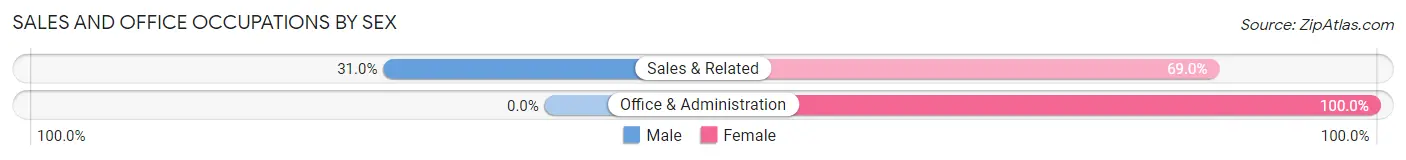
| Occupation | Male | Female |
| Sales & Related | 9 (31.0%) | 20 (69.0%) |
| Office & Administration | 0 (0.0%) | 124 (100.0%) |
| Total (Category) | 9 (5.9%) | 144 (94.1%) |
| Total (Overall) | 372 (52.6%) | 335 (47.4%) |
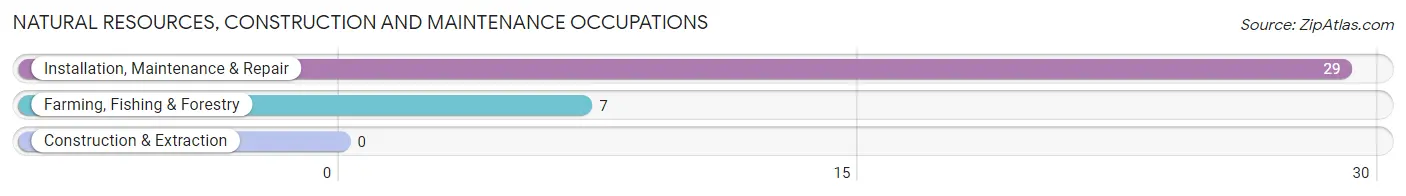
Natural Resources, Construction and Maintenance Occupations
The most common Natural Resources, Construction and Maintenance occupations in Cecilia are Installation, Maintenance & Repair (29 | 4.1%), and Farming, Fishing & Forestry (7 | 1.0%).
Natural Resources, Construction and Maintenance Occupations by Sex
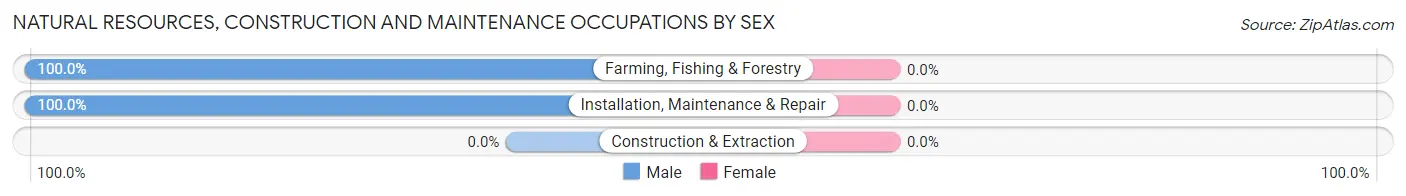
| Occupation | Male | Female |
| Farming, Fishing & Forestry | 7 (100.0%) | 0 (0.0%) |
| Construction & Extraction | 0 (0.0%) | 0 (0.0%) |
| Installation, Maintenance & Repair | 29 (100.0%) | 0 (0.0%) |
| Total (Category) | 36 (100.0%) | 0 (0.0%) |
| Total (Overall) | 372 (52.6%) | 335 (47.4%) |
Production, Transportation and Moving Occupations
The most common Production, Transportation and Moving occupations in Cecilia are Transportation (101 | 14.3%), Production (55 | 7.8%), and Material Moving (18 | 2.5%).
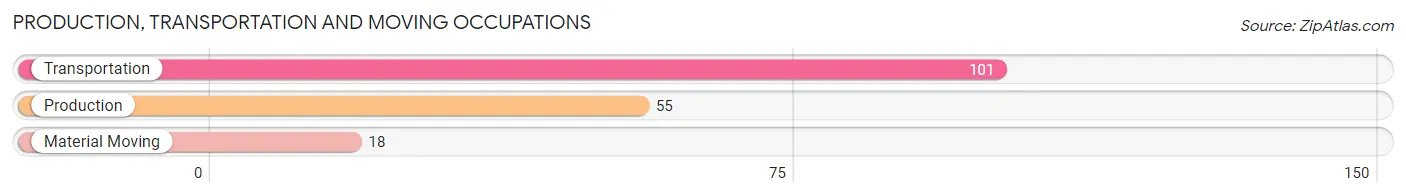
Production, Transportation and Moving Occupations by Sex
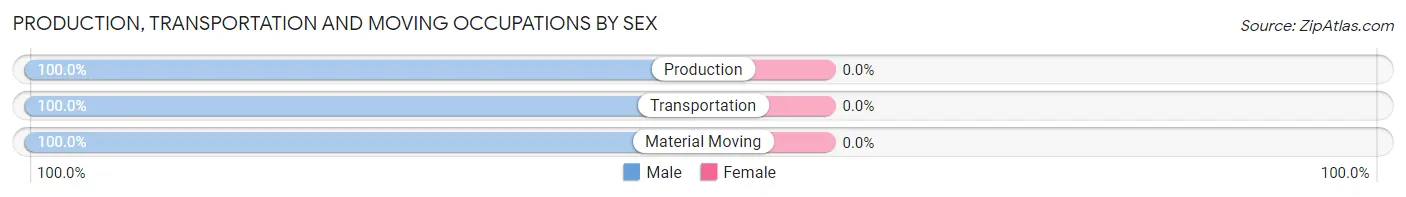
| Occupation | Male | Female |
| Production | 55 (100.0%) | 0 (0.0%) |
| Transportation | 101 (100.0%) | 0 (0.0%) |
| Material Moving | 18 (100.0%) | 0 (0.0%) |
| Total (Category) | 174 (100.0%) | 0 (0.0%) |
| Total (Overall) | 372 (52.6%) | 335 (47.4%) |
Employment Industries by Sex in Cecilia
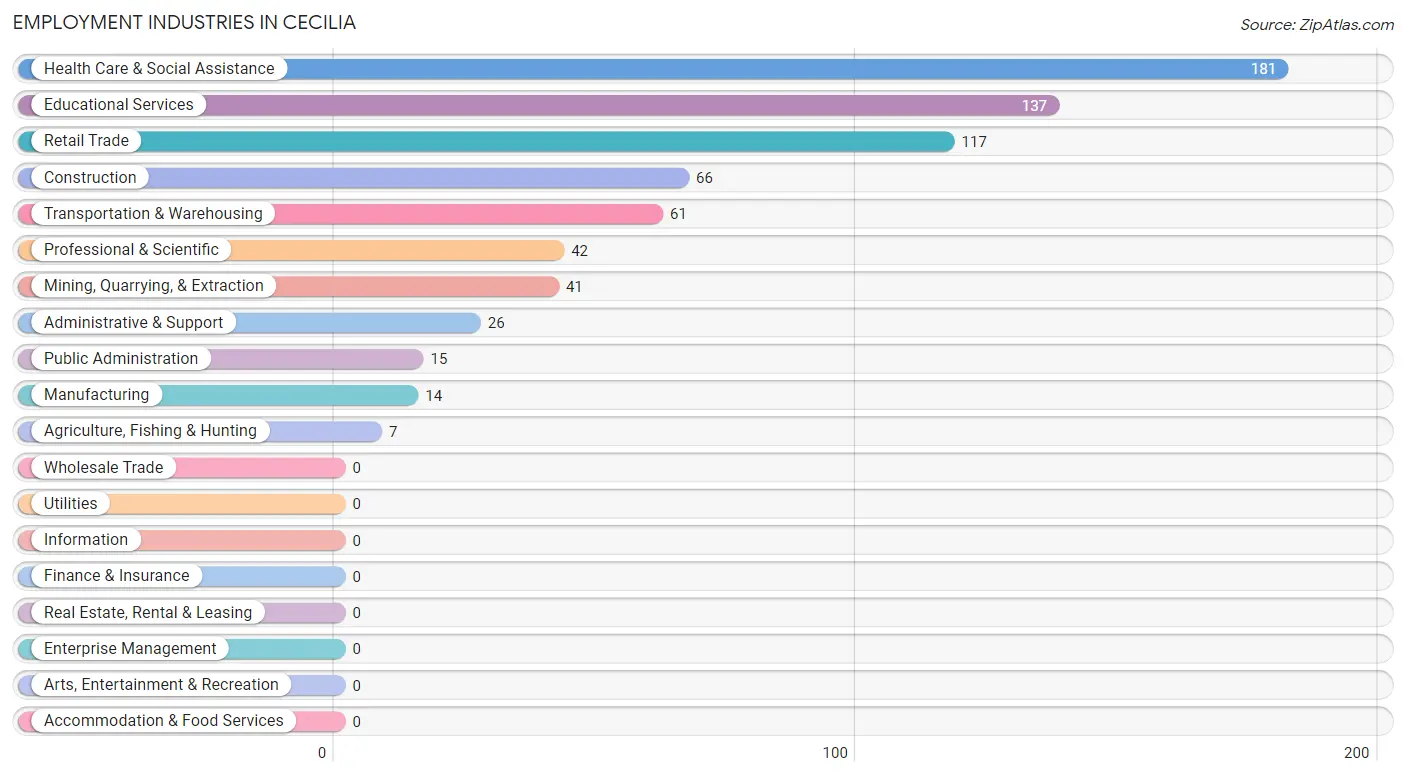
Employment Industries in Cecilia
The major employment industries in Cecilia include Health Care & Social Assistance (181 | 25.6%), Educational Services (137 | 19.4%), Retail Trade (117 | 16.6%), Construction (66 | 9.3%), and Transportation & Warehousing (61 | 8.6%).
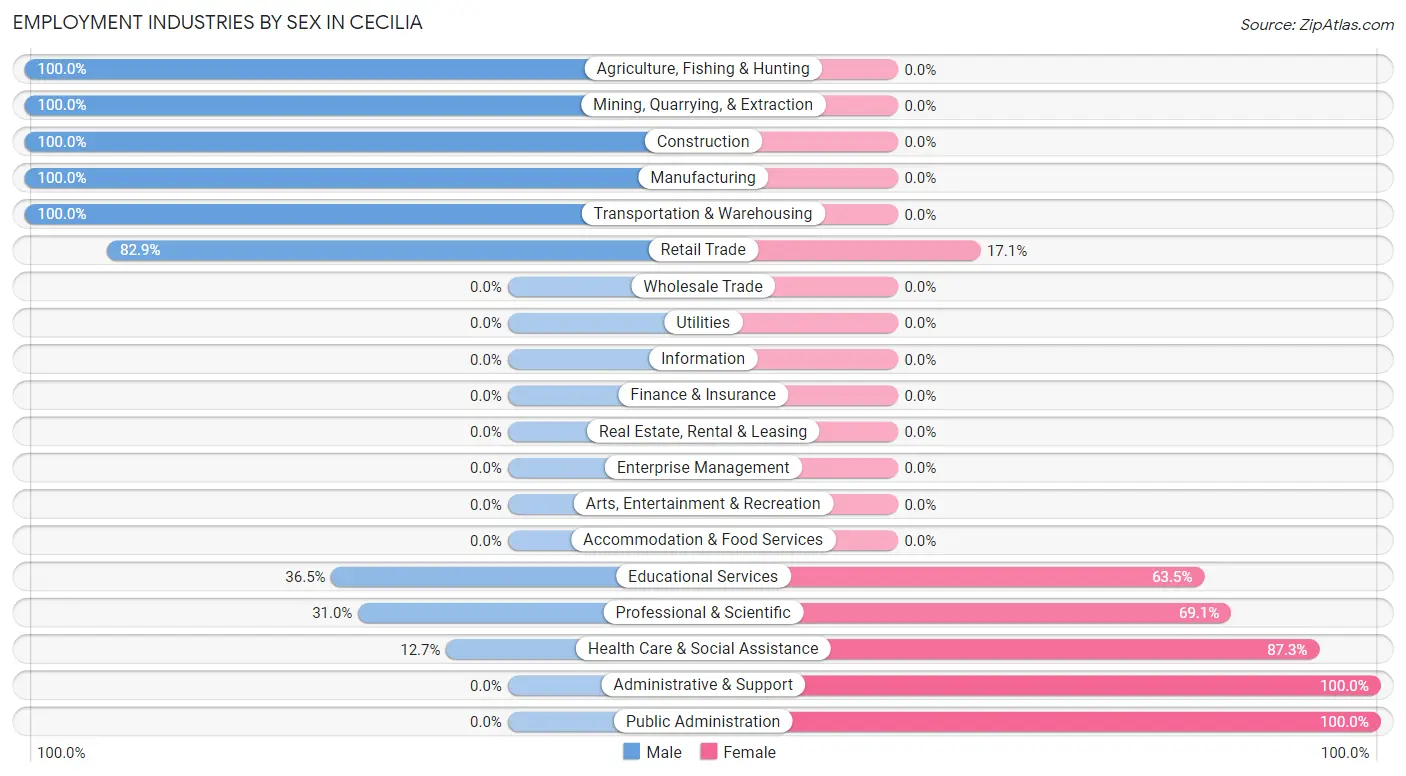
Employment Industries by Sex in Cecilia
The Cecilia industries that see more men than women are Agriculture, Fishing & Hunting (100.0%), Mining, Quarrying, & Extraction (100.0%), and Construction (100.0%), whereas the industries that tend to have a higher number of women are Administrative & Support (100.0%), Public Administration (100.0%), and Health Care & Social Assistance (87.3%).
| Industry | Male | Female |
| Agriculture, Fishing & Hunting | 7 (100.0%) | 0 (0.0%) |
| Mining, Quarrying, & Extraction | 41 (100.0%) | 0 (0.0%) |
| Construction | 66 (100.0%) | 0 (0.0%) |
| Manufacturing | 14 (100.0%) | 0 (0.0%) |
| Wholesale Trade | 0 (0.0%) | 0 (0.0%) |
| Retail Trade | 97 (82.9%) | 20 (17.1%) |
| Transportation & Warehousing | 61 (100.0%) | 0 (0.0%) |
| Utilities | 0 (0.0%) | 0 (0.0%) |
| Information | 0 (0.0%) | 0 (0.0%) |
| Finance & Insurance | 0 (0.0%) | 0 (0.0%) |
| Real Estate, Rental & Leasing | 0 (0.0%) | 0 (0.0%) |
| Professional & Scientific | 13 (30.9%) | 29 (69.1%) |
| Enterprise Management | 0 (0.0%) | 0 (0.0%) |
| Administrative & Support | 0 (0.0%) | 26 (100.0%) |
| Educational Services | 50 (36.5%) | 87 (63.5%) |
| Health Care & Social Assistance | 23 (12.7%) | 158 (87.3%) |
| Arts, Entertainment & Recreation | 0 (0.0%) | 0 (0.0%) |
| Accommodation & Food Services | 0 (0.0%) | 0 (0.0%) |
| Public Administration | 0 (0.0%) | 15 (100.0%) |
| Total | 372 (52.6%) | 335 (47.4%) |
Education in Cecilia
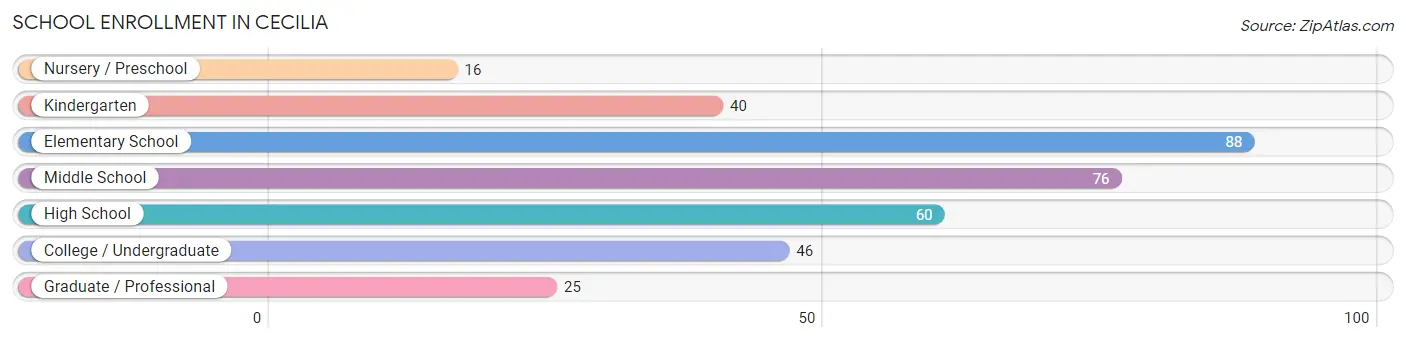
School Enrollment in Cecilia
The most common levels of schooling among the 351 students in Cecilia are elementary school (88 | 25.1%), middle school (76 | 21.6%), and high school (60 | 17.1%).
| School Level | # Students | % Students |
| Nursery / Preschool | 16 | 4.6% |
| Kindergarten | 40 | 11.4% |
| Elementary School | 88 | 25.1% |
| Middle School | 76 | 21.6% |
| High School | 60 | 17.1% |
| College / Undergraduate | 46 | 13.1% |
| Graduate / Professional | 25 | 7.1% |
| Total | 351 | 100.0% |
School Enrollment by Age by Funding Source in Cecilia
Out of a total of 351 students who are enrolled in schools in Cecilia, 6 (1.7%) attend a private institution, while the remaining 345 (98.3%) are enrolled in public schools. The age group of 15 to 17 year olds has the highest likelihood of being enrolled in private schools, with 6 (10.0% in the age bracket) enrolled. Conversely, the age group of 3 to 4 year olds has the lowest likelihood of being enrolled in a private school, with 37 (100.0% in the age bracket) attending a public institution.
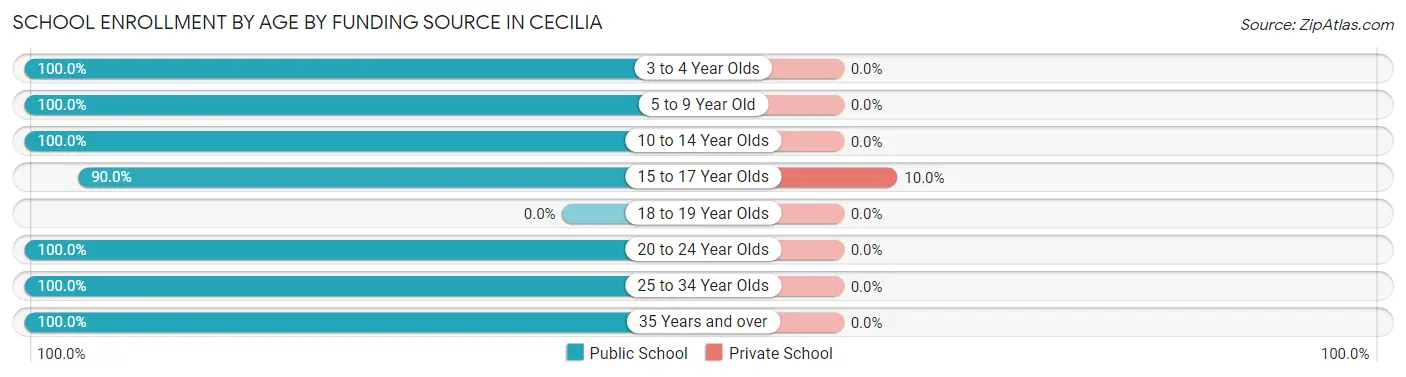
| Age Bracket | Public School | Private School |
| 3 to 4 Year Olds | 37 (100.0%) | 0 (0.0%) |
| 5 to 9 Year Old | 107 (100.0%) | 0 (0.0%) |
| 10 to 14 Year Olds | 76 (100.0%) | 0 (0.0%) |
| 15 to 17 Year Olds | 54 (90.0%) | 6 (10.0%) |
| 18 to 19 Year Olds | 0 (0.0%) | 0 (0.0%) |
| 20 to 24 Year Olds | 27 (100.0%) | 0 (0.0%) |
| 25 to 34 Year Olds | 19 (100.0%) | 0 (0.0%) |
| 35 Years and over | 25 (100.0%) | 0 (0.0%) |
| Total | 345 (98.3%) | 6 (1.7%) |
Educational Attainment by Field of Study in Cecilia
Liberal arts & history (63 | 36.4%), education (33 | 19.1%), literature & languages (25 | 14.4%), science & technology (23 | 13.3%), and physical & health sciences (16 | 9.2%) are the most common fields of study among 173 individuals in Cecilia who have obtained a bachelor's degree or higher.
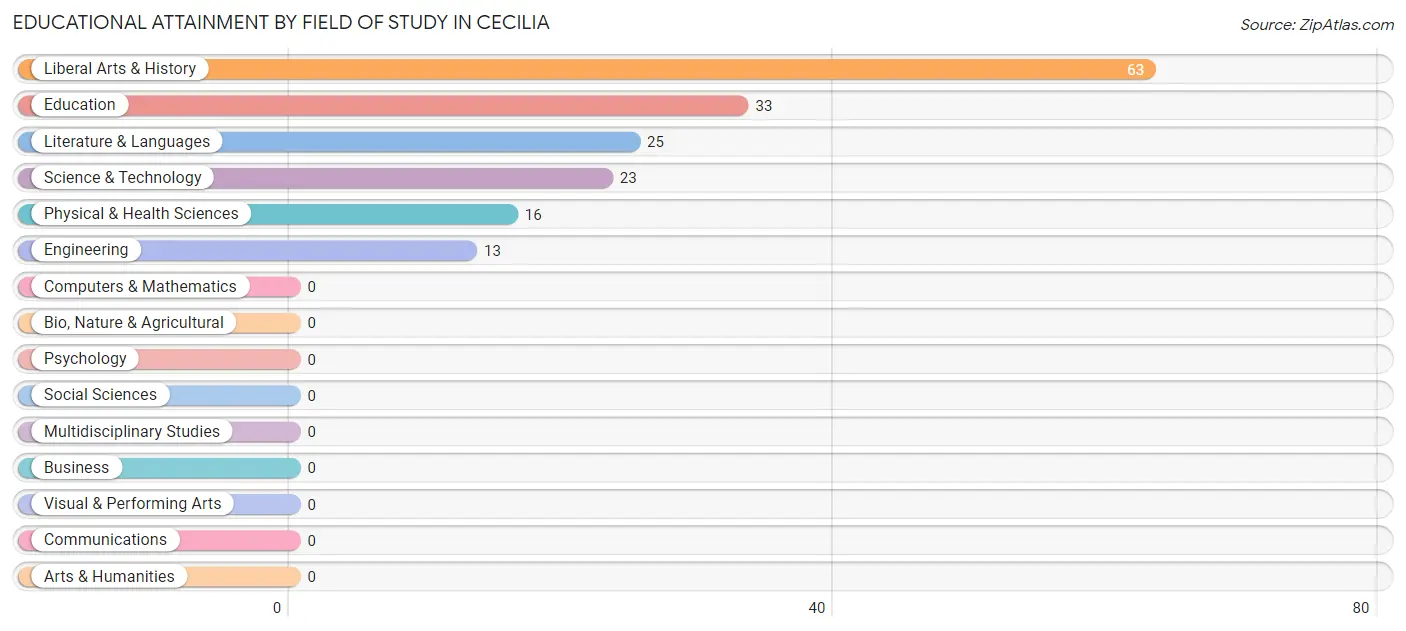
| Field of Study | # Graduates | % Graduates |
| Computers & Mathematics | 0 | 0.0% |
| Bio, Nature & Agricultural | 0 | 0.0% |
| Physical & Health Sciences | 16 | 9.2% |
| Psychology | 0 | 0.0% |
| Social Sciences | 0 | 0.0% |
| Engineering | 13 | 7.5% |
| Multidisciplinary Studies | 0 | 0.0% |
| Science & Technology | 23 | 13.3% |
| Business | 0 | 0.0% |
| Education | 33 | 19.1% |
| Literature & Languages | 25 | 14.4% |
| Liberal Arts & History | 63 | 36.4% |
| Visual & Performing Arts | 0 | 0.0% |
| Communications | 0 | 0.0% |
| Arts & Humanities | 0 | 0.0% |
| Total | 173 | 100.0% |
Transportation & Commute in Cecilia
Vehicle Availability by Sex in Cecilia
The most prevalent vehicle ownership categories in Cecilia are males with 2 vehicles (174, accounting for 46.8%) and females with 2 vehicles (155, making up 56.1%).
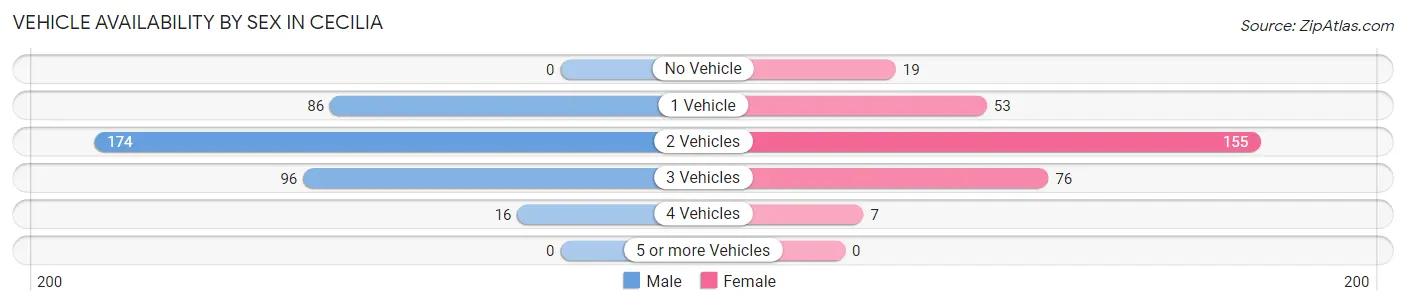
| Vehicles Available | Male | Female |
| No Vehicle | 0 (0.0%) | 19 (6.1%) |
| 1 Vehicle | 86 (23.1%) | 53 (17.1%) |
| 2 Vehicles | 174 (46.8%) | 155 (50.0%) |
| 3 Vehicles | 96 (25.8%) | 76 (24.5%) |
| 4 Vehicles | 16 (4.3%) | 7 (2.3%) |
| 5 or more Vehicles | 0 (0.0%) | 0 (0.0%) |
| Total | 372 (100.0%) | 310 (100.0%) |
Commute Time in Cecilia
The most frequently occuring commute durations in Cecilia are 30 to 34 minutes (160 commuters, 24.4%), 25 to 29 minutes (112 commuters, 17.1%), and 20 to 24 minutes (99 commuters, 15.1%).
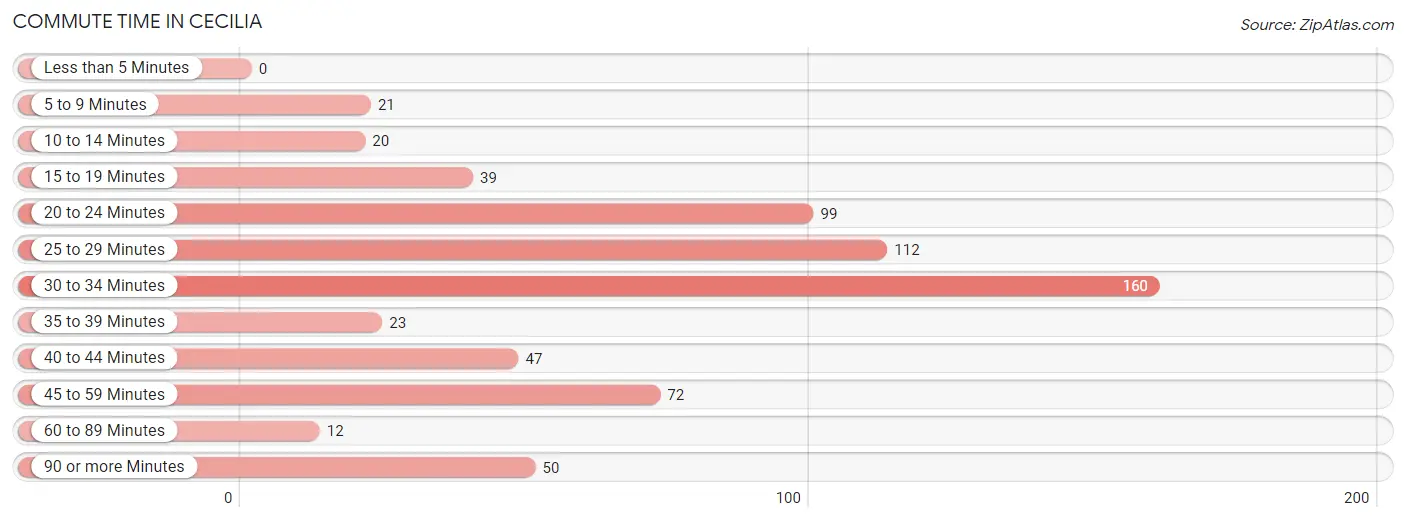
| Commute Time | # Commuters | % Commuters |
| Less than 5 Minutes | 0 | 0.0% |
| 5 to 9 Minutes | 21 | 3.2% |
| 10 to 14 Minutes | 20 | 3.0% |
| 15 to 19 Minutes | 39 | 5.9% |
| 20 to 24 Minutes | 99 | 15.1% |
| 25 to 29 Minutes | 112 | 17.1% |
| 30 to 34 Minutes | 160 | 24.4% |
| 35 to 39 Minutes | 23 | 3.5% |
| 40 to 44 Minutes | 47 | 7.2% |
| 45 to 59 Minutes | 72 | 11.0% |
| 60 to 89 Minutes | 12 | 1.8% |
| 90 or more Minutes | 50 | 7.6% |
Commute Time by Sex in Cecilia
The most common commute times in Cecilia are 30 to 34 minutes (99 commuters, 28.1%) for males and 25 to 29 minutes (83 commuters, 27.4%) for females.
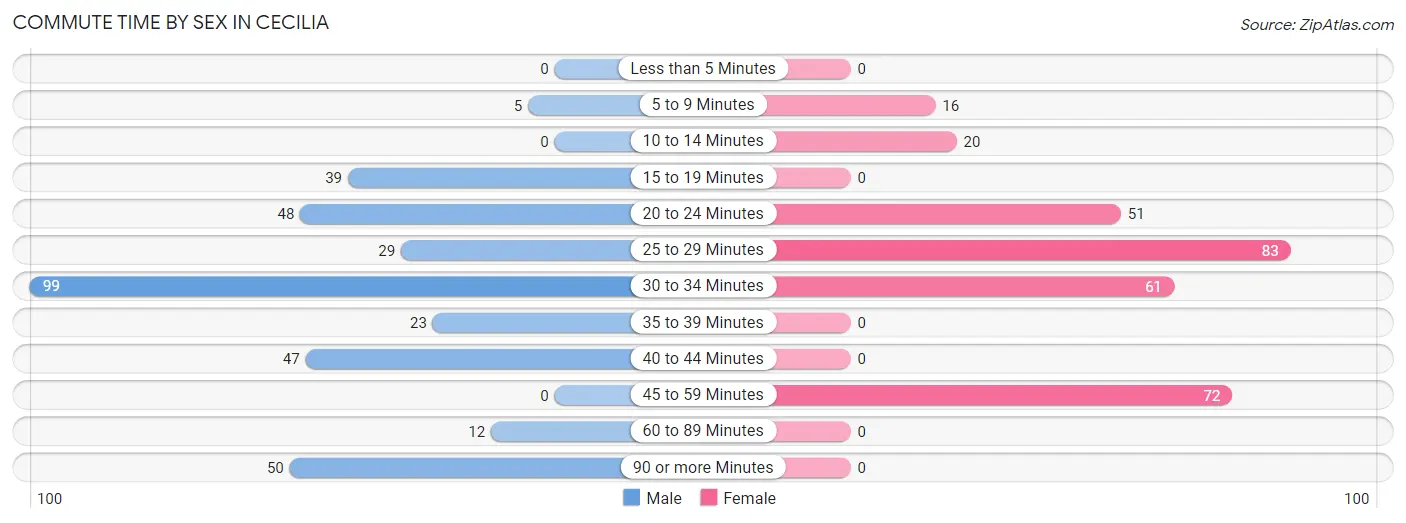
| Commute Time | Male | Female |
| Less than 5 Minutes | 0 (0.0%) | 0 (0.0%) |
| 5 to 9 Minutes | 5 (1.4%) | 16 (5.3%) |
| 10 to 14 Minutes | 0 (0.0%) | 20 (6.6%) |
| 15 to 19 Minutes | 39 (11.1%) | 0 (0.0%) |
| 20 to 24 Minutes | 48 (13.6%) | 51 (16.8%) |
| 25 to 29 Minutes | 29 (8.2%) | 83 (27.4%) |
| 30 to 34 Minutes | 99 (28.1%) | 61 (20.1%) |
| 35 to 39 Minutes | 23 (6.5%) | 0 (0.0%) |
| 40 to 44 Minutes | 47 (13.4%) | 0 (0.0%) |
| 45 to 59 Minutes | 0 (0.0%) | 72 (23.8%) |
| 60 to 89 Minutes | 12 (3.4%) | 0 (0.0%) |
| 90 or more Minutes | 50 (14.2%) | 0 (0.0%) |
Time of Departure to Work by Sex in Cecilia
The most frequent times of departure to work in Cecilia are 5:30 AM to 5:59 AM (93, 26.4%) for males and 7:00 AM to 7:29 AM (115, 38.0%) for females.
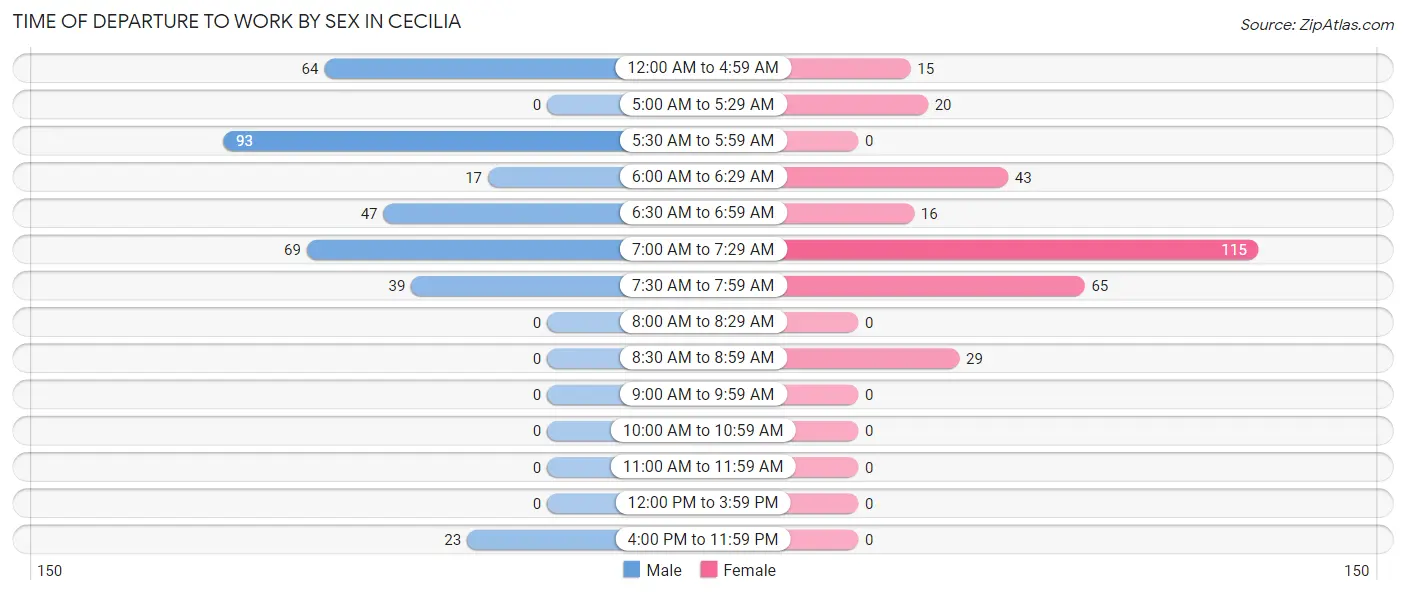
| Time of Departure | Male | Female |
| 12:00 AM to 4:59 AM | 64 (18.2%) | 15 (5.0%) |
| 5:00 AM to 5:29 AM | 0 (0.0%) | 20 (6.6%) |
| 5:30 AM to 5:59 AM | 93 (26.4%) | 0 (0.0%) |
| 6:00 AM to 6:29 AM | 17 (4.8%) | 43 (14.2%) |
| 6:30 AM to 6:59 AM | 47 (13.4%) | 16 (5.3%) |
| 7:00 AM to 7:29 AM | 69 (19.6%) | 115 (38.0%) |
| 7:30 AM to 7:59 AM | 39 (11.1%) | 65 (21.4%) |
| 8:00 AM to 8:29 AM | 0 (0.0%) | 0 (0.0%) |
| 8:30 AM to 8:59 AM | 0 (0.0%) | 29 (9.6%) |
| 9:00 AM to 9:59 AM | 0 (0.0%) | 0 (0.0%) |
| 10:00 AM to 10:59 AM | 0 (0.0%) | 0 (0.0%) |
| 11:00 AM to 11:59 AM | 0 (0.0%) | 0 (0.0%) |
| 12:00 PM to 3:59 PM | 0 (0.0%) | 0 (0.0%) |
| 4:00 PM to 11:59 PM | 23 (6.5%) | 0 (0.0%) |
| Total | 352 (100.0%) | 303 (100.0%) |
Housing Occupancy in Cecilia
Occupancy by Ownership in Cecilia
Of the total 536 dwellings in Cecilia, owner-occupied units account for 418 (78.0%), while renter-occupied units make up 118 (22.0%).
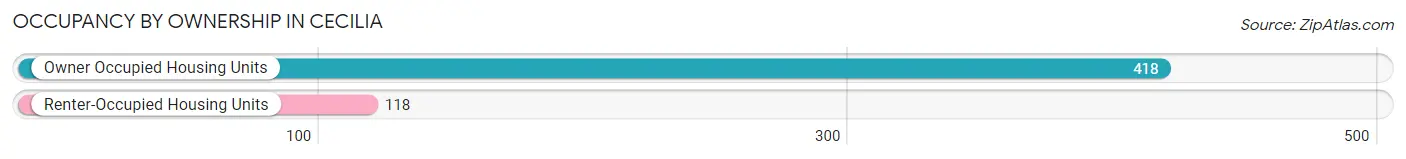
| Occupancy | # Housing Units | % Housing Units |
| Owner Occupied Housing Units | 418 | 78.0% |
| Renter-Occupied Housing Units | 118 | 22.0% |
| Total Occupied Housing Units | 536 | 100.0% |
Occupancy by Household Size in Cecilia
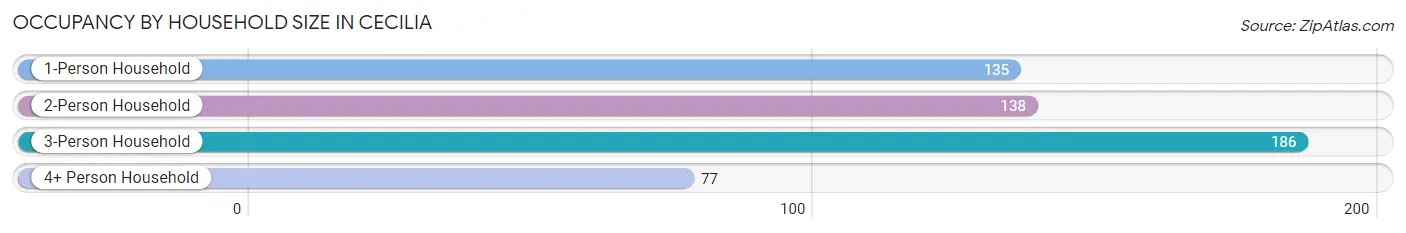
| Household Size | # Housing Units | % Housing Units |
| 1-Person Household | 135 | 25.2% |
| 2-Person Household | 138 | 25.8% |
| 3-Person Household | 186 | 34.7% |
| 4+ Person Household | 77 | 14.4% |
| Total Housing Units | 536 | 100.0% |
Occupancy by Ownership by Household Size in Cecilia
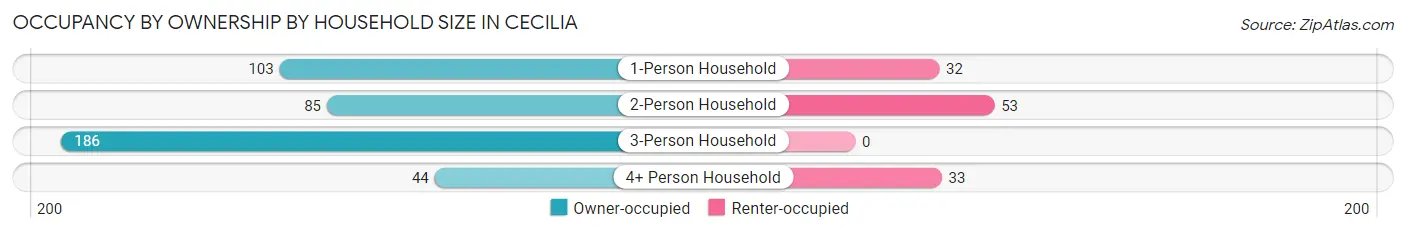
| Household Size | Owner-occupied | Renter-occupied |
| 1-Person Household | 103 (76.3%) | 32 (23.7%) |
| 2-Person Household | 85 (61.6%) | 53 (38.4%) |
| 3-Person Household | 186 (100.0%) | 0 (0.0%) |
| 4+ Person Household | 44 (57.1%) | 33 (42.9%) |
| Total Housing Units | 418 (78.0%) | 118 (22.0%) |
Occupancy by Educational Attainment in Cecilia
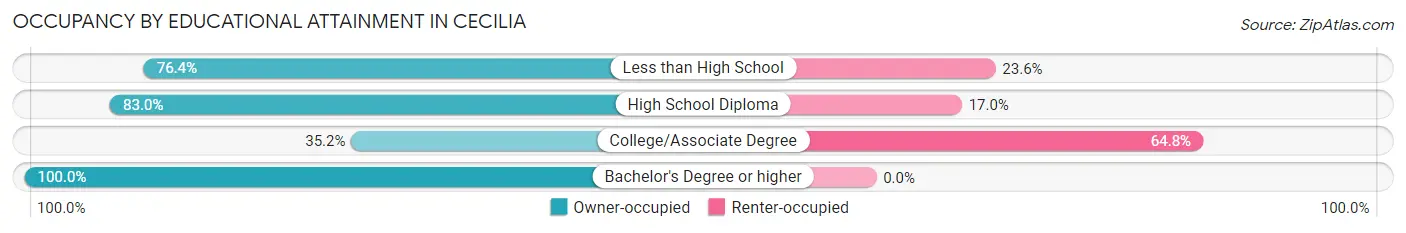
| Household Size | Owner-occupied | Renter-occupied |
| Less than High School | 42 (76.4%) | 13 (23.6%) |
| High School Diploma | 235 (83.0%) | 48 (17.0%) |
| College/Associate Degree | 31 (35.2%) | 57 (64.8%) |
| Bachelor's Degree or higher | 110 (100.0%) | 0 (0.0%) |
Occupancy by Age of Householder in Cecilia
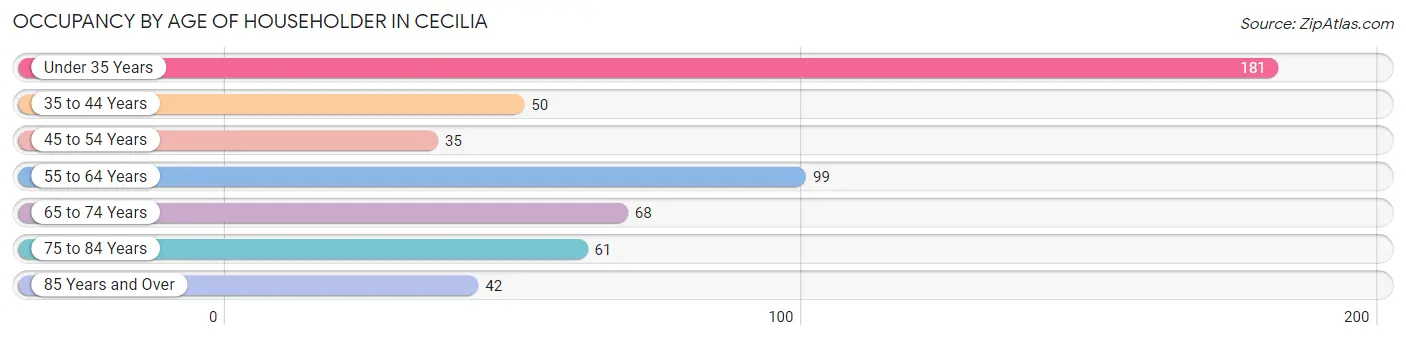
| Age Bracket | # Households | % Households |
| Under 35 Years | 181 | 33.8% |
| 35 to 44 Years | 50 | 9.3% |
| 45 to 54 Years | 35 | 6.5% |
| 55 to 64 Years | 99 | 18.5% |
| 65 to 74 Years | 68 | 12.7% |
| 75 to 84 Years | 61 | 11.4% |
| 85 Years and Over | 42 | 7.8% |
| Total | 536 | 100.0% |
Housing Finances in Cecilia
Median Income by Occupancy in Cecilia
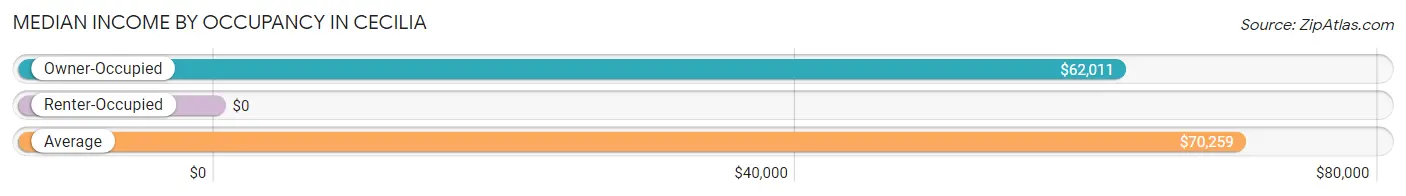
| Occupancy Type | # Households | Median Income |
| Owner-Occupied | 418 (78.0%) | $62,011 |
| Renter-Occupied | 118 (22.0%) | $0 |
| Average | 536 (100.0%) | $70,259 |
Occupancy by Householder Income Bracket in Cecilia
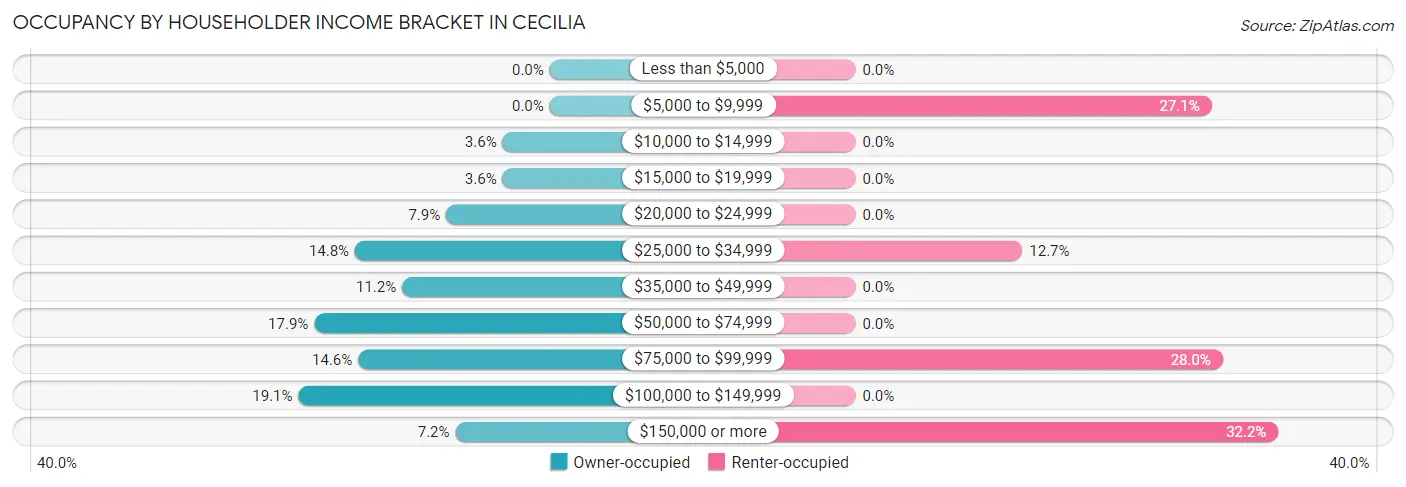
| Income Bracket | Owner-occupied | Renter-occupied |
| Less than $5,000 | 0 (0.0%) | 0 (0.0%) |
| $5,000 to $9,999 | 0 (0.0%) | 32 (27.1%) |
| $10,000 to $14,999 | 15 (3.6%) | 0 (0.0%) |
| $15,000 to $19,999 | 15 (3.6%) | 0 (0.0%) |
| $20,000 to $24,999 | 33 (7.9%) | 0 (0.0%) |
| $25,000 to $34,999 | 62 (14.8%) | 15 (12.7%) |
| $35,000 to $49,999 | 47 (11.2%) | 0 (0.0%) |
| $50,000 to $74,999 | 75 (17.9%) | 0 (0.0%) |
| $75,000 to $99,999 | 61 (14.6%) | 33 (28.0%) |
| $100,000 to $149,999 | 80 (19.1%) | 0 (0.0%) |
| $150,000 or more | 30 (7.2%) | 38 (32.2%) |
| Total | 418 (100.0%) | 118 (100.0%) |
Monthly Housing Cost Tiers in Cecilia
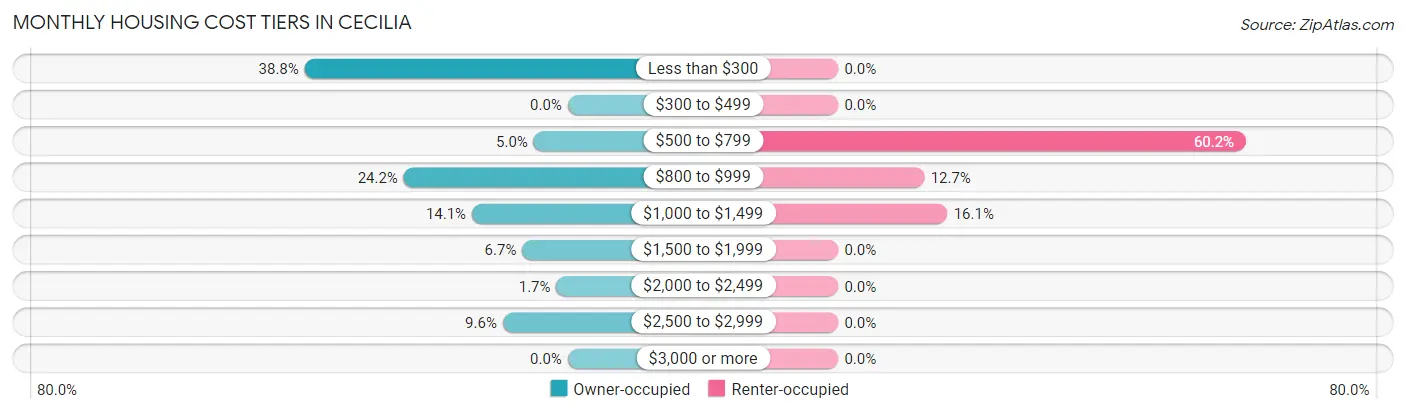
| Monthly Cost | Owner-occupied | Renter-occupied |
| Less than $300 | 162 (38.8%) | 0 (0.0%) |
| $300 to $499 | 0 (0.0%) | 0 (0.0%) |
| $500 to $799 | 21 (5.0%) | 71 (60.2%) |
| $800 to $999 | 101 (24.2%) | 15 (12.7%) |
| $1,000 to $1,499 | 59 (14.1%) | 19 (16.1%) |
| $1,500 to $1,999 | 28 (6.7%) | 0 (0.0%) |
| $2,000 to $2,499 | 7 (1.7%) | 0 (0.0%) |
| $2,500 to $2,999 | 40 (9.6%) | 0 (0.0%) |
| $3,000 or more | 0 (0.0%) | 0 (0.0%) |
| Total | 418 (100.0%) | 118 (100.0%) |
Physical Housing Characteristics in Cecilia
Housing Structures in Cecilia
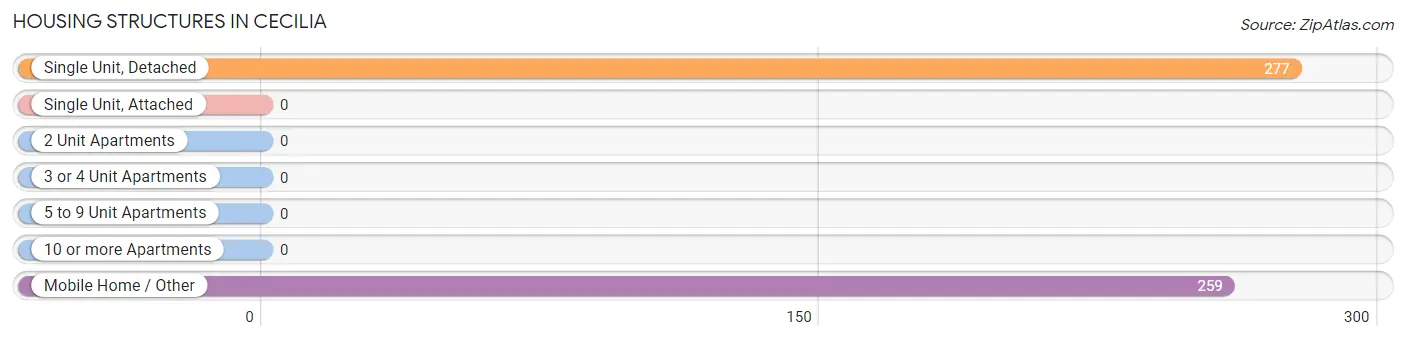
| Structure Type | # Housing Units | % Housing Units |
| Single Unit, Detached | 277 | 51.7% |
| Single Unit, Attached | 0 | 0.0% |
| 2 Unit Apartments | 0 | 0.0% |
| 3 or 4 Unit Apartments | 0 | 0.0% |
| 5 to 9 Unit Apartments | 0 | 0.0% |
| 10 or more Apartments | 0 | 0.0% |
| Mobile Home / Other | 259 | 48.3% |
| Total | 536 | 100.0% |
Housing Structures by Occupancy in Cecilia
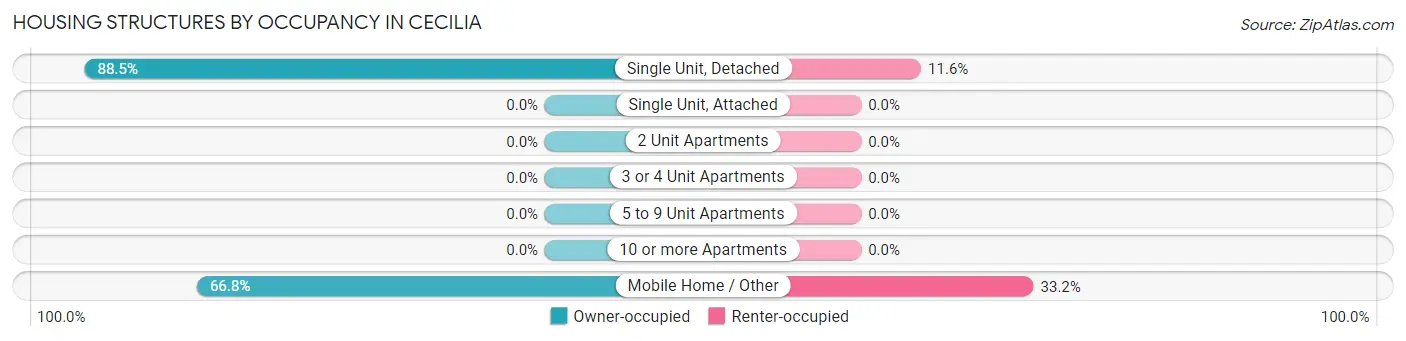
| Structure Type | Owner-occupied | Renter-occupied |
| Single Unit, Detached | 245 (88.4%) | 32 (11.6%) |
| Single Unit, Attached | 0 (0.0%) | 0 (0.0%) |
| 2 Unit Apartments | 0 (0.0%) | 0 (0.0%) |
| 3 or 4 Unit Apartments | 0 (0.0%) | 0 (0.0%) |
| 5 to 9 Unit Apartments | 0 (0.0%) | 0 (0.0%) |
| 10 or more Apartments | 0 (0.0%) | 0 (0.0%) |
| Mobile Home / Other | 173 (66.8%) | 86 (33.2%) |
| Total | 418 (78.0%) | 118 (22.0%) |
Housing Structures by Number of Rooms in Cecilia
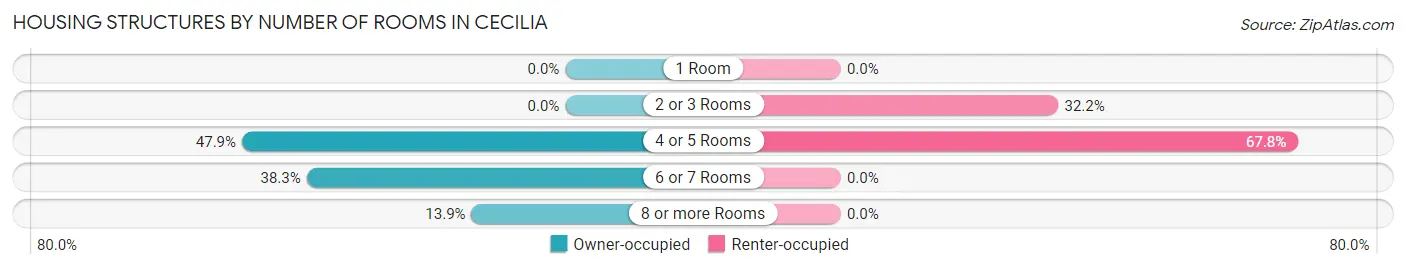
| Number of Rooms | Owner-occupied | Renter-occupied |
| 1 Room | 0 (0.0%) | 0 (0.0%) |
| 2 or 3 Rooms | 0 (0.0%) | 38 (32.2%) |
| 4 or 5 Rooms | 200 (47.8%) | 80 (67.8%) |
| 6 or 7 Rooms | 160 (38.3%) | 0 (0.0%) |
| 8 or more Rooms | 58 (13.9%) | 0 (0.0%) |
| Total | 418 (100.0%) | 118 (100.0%) |
Housing Structure by Heating Type in Cecilia
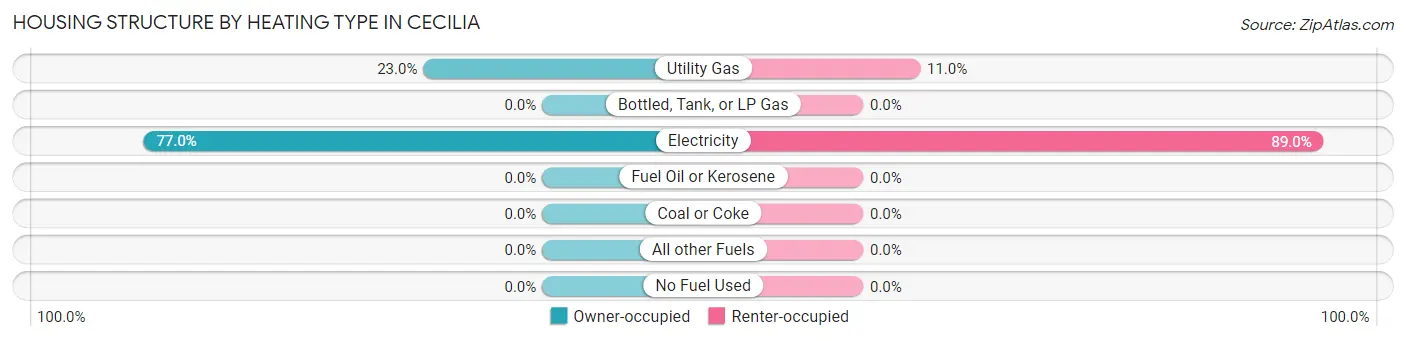
| Heating Type | Owner-occupied | Renter-occupied |
| Utility Gas | 96 (23.0%) | 13 (11.0%) |
| Bottled, Tank, or LP Gas | 0 (0.0%) | 0 (0.0%) |
| Electricity | 322 (77.0%) | 105 (89.0%) |
| Fuel Oil or Kerosene | 0 (0.0%) | 0 (0.0%) |
| Coal or Coke | 0 (0.0%) | 0 (0.0%) |
| All other Fuels | 0 (0.0%) | 0 (0.0%) |
| No Fuel Used | 0 (0.0%) | 0 (0.0%) |
| Total | 418 (100.0%) | 118 (100.0%) |
Household Vehicle Usage in Cecilia
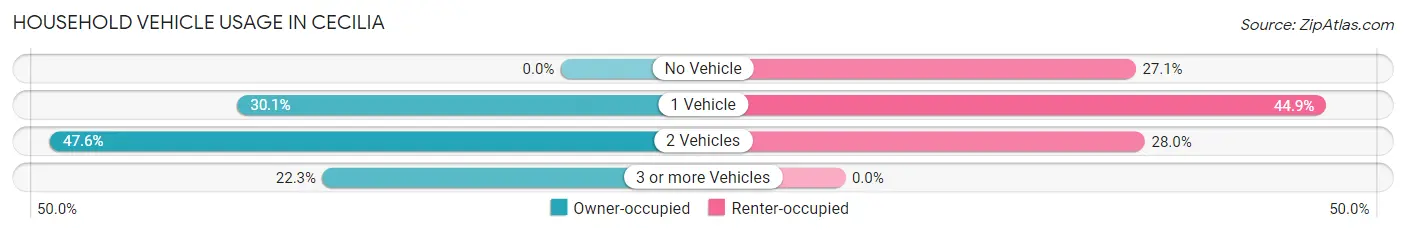
| Vehicles per Household | Owner-occupied | Renter-occupied |
| No Vehicle | 0 (0.0%) | 32 (27.1%) |
| 1 Vehicle | 126 (30.1%) | 53 (44.9%) |
| 2 Vehicles | 199 (47.6%) | 33 (28.0%) |
| 3 or more Vehicles | 93 (22.3%) | 0 (0.0%) |
| Total | 418 (100.0%) | 118 (100.0%) |
Real Estate & Mortgages in Cecilia
Real Estate and Mortgage Overview in Cecilia
| Characteristic | Without Mortgage | With Mortgage |
| Housing Units | 223 | 195 |
| Median Property Value | $51,800 | $101,600 |
| Median Household Income | $60,245 | $14 |
| Monthly Housing Costs | $256 | $0 |
| Real Estate Taxes | - | - |
Property Value by Mortgage Status in Cecilia
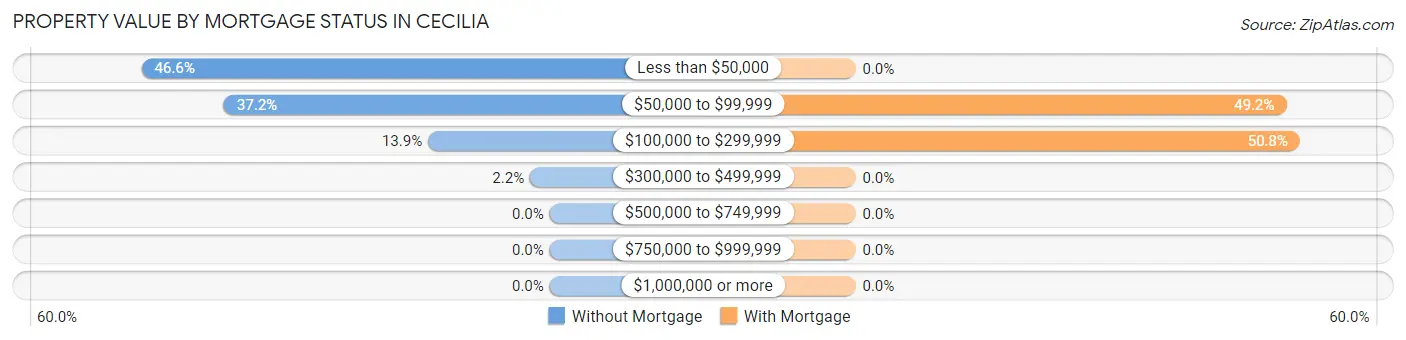
| Property Value | Without Mortgage | With Mortgage |
| Less than $50,000 | 104 (46.6%) | 0 (0.0%) |
| $50,000 to $99,999 | 83 (37.2%) | 96 (49.2%) |
| $100,000 to $299,999 | 31 (13.9%) | 99 (50.8%) |
| $300,000 to $499,999 | 5 (2.2%) | 0 (0.0%) |
| $500,000 to $749,999 | 0 (0.0%) | 0 (0.0%) |
| $750,000 to $999,999 | 0 (0.0%) | 0 (0.0%) |
| $1,000,000 or more | 0 (0.0%) | 0 (0.0%) |
| Total | 223 (100.0%) | 195 (100.0%) |
Household Income by Mortgage Status in Cecilia
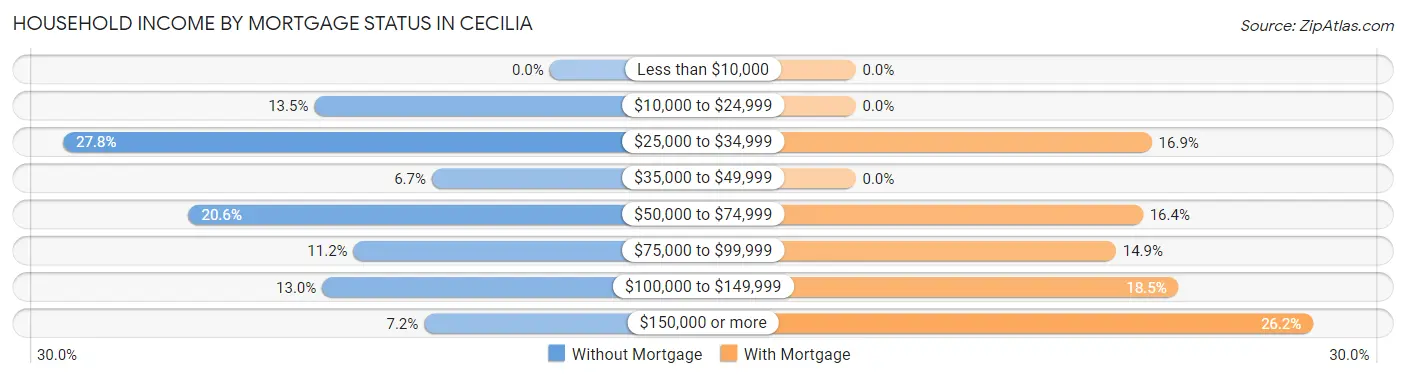
| Household Income | Without Mortgage | With Mortgage |
| Less than $10,000 | 0 (0.0%) | 0 (0.0%) |
| $10,000 to $24,999 | 30 (13.5%) | 0 (0.0%) |
| $25,000 to $34,999 | 62 (27.8%) | 33 (16.9%) |
| $35,000 to $49,999 | 15 (6.7%) | 0 (0.0%) |
| $50,000 to $74,999 | 46 (20.6%) | 32 (16.4%) |
| $75,000 to $99,999 | 25 (11.2%) | 29 (14.9%) |
| $100,000 to $149,999 | 29 (13.0%) | 36 (18.5%) |
| $150,000 or more | 16 (7.2%) | 51 (26.2%) |
| Total | 223 (100.0%) | 195 (100.0%) |
Property Value to Household Income Ratio in Cecilia
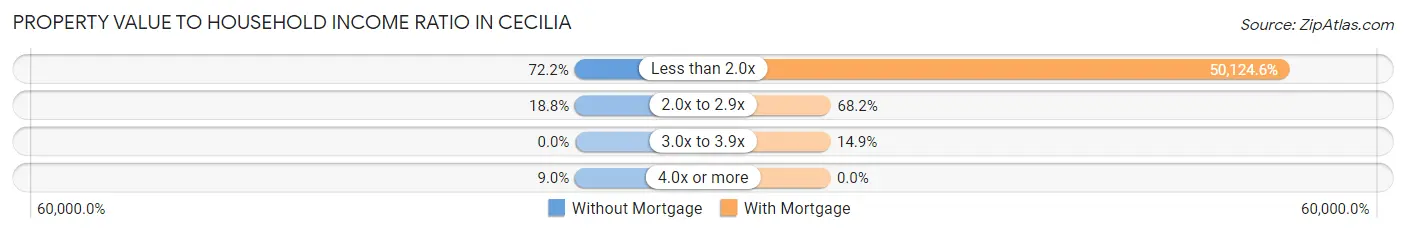
| Value-to-Income Ratio | Without Mortgage | With Mortgage |
| Less than 2.0x | 161 (72.2%) | 97,743 (50,124.6%) |
| 2.0x to 2.9x | 42 (18.8%) | 133 (68.2%) |
| 3.0x to 3.9x | 0 (0.0%) | 29 (14.9%) |
| 4.0x or more | 20 (9.0%) | 0 (0.0%) |
| Total | 223 (100.0%) | 195 (100.0%) |
Real Estate Taxes by Mortgage Status in Cecilia
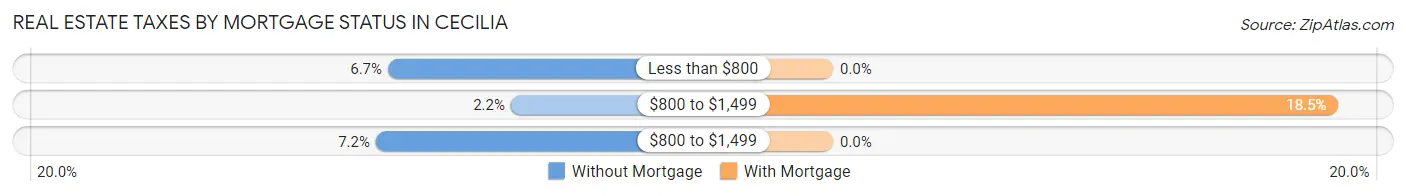
| Property Taxes | Without Mortgage | With Mortgage |
| Less than $800 | 15 (6.7%) | 0 (0.0%) |
| $800 to $1,499 | 5 (2.2%) | 36 (18.5%) |
| $800 to $1,499 | 16 (7.2%) | 0 (0.0%) |
| Total | 223 (100.0%) | 195 (100.0%) |
Health & Disability in Cecilia
Health Insurance Coverage by Age in Cecilia
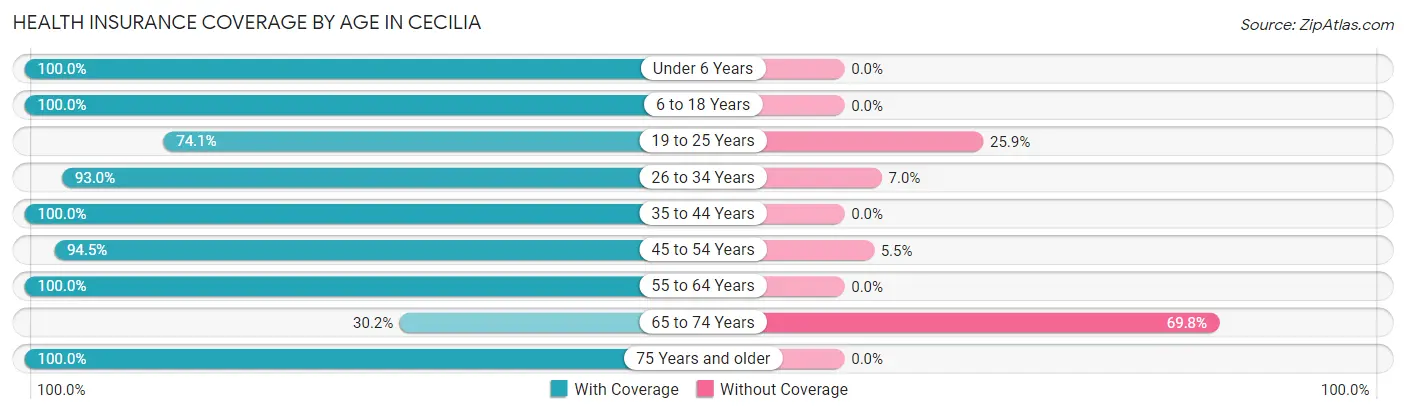
| Age Bracket | With Coverage | Without Coverage |
| Under 6 Years | 47 (100.0%) | 0 (0.0%) |
| 6 to 18 Years | 243 (100.0%) | 0 (0.0%) |
| 19 to 25 Years | 106 (74.1%) | 37 (25.9%) |
| 26 to 34 Years | 254 (93.0%) | 19 (7.0%) |
| 35 to 44 Years | 111 (100.0%) | 0 (0.0%) |
| 45 to 54 Years | 207 (94.5%) | 12 (5.5%) |
| 55 to 64 Years | 99 (100.0%) | 0 (0.0%) |
| 65 to 74 Years | 38 (30.2%) | 88 (69.8%) |
| 75 Years and older | 114 (100.0%) | 0 (0.0%) |
| Total | 1,219 (88.6%) | 156 (11.4%) |
Health Insurance Coverage by Citizenship Status in Cecilia
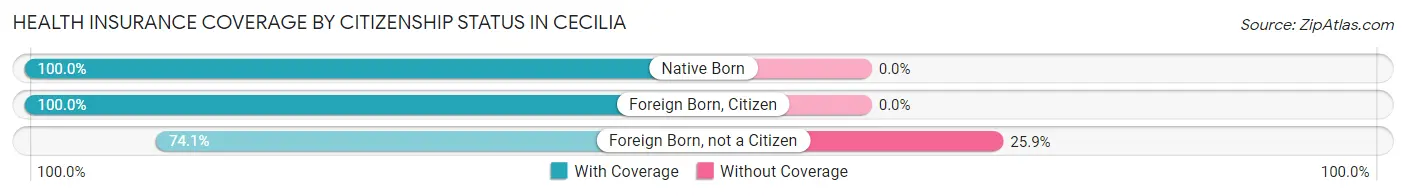
| Citizenship Status | With Coverage | Without Coverage |
| Native Born | 47 (100.0%) | 0 (0.0%) |
| Foreign Born, Citizen | 243 (100.0%) | 0 (0.0%) |
| Foreign Born, not a Citizen | 106 (74.1%) | 37 (25.9%) |
Health Insurance Coverage by Household Income in Cecilia
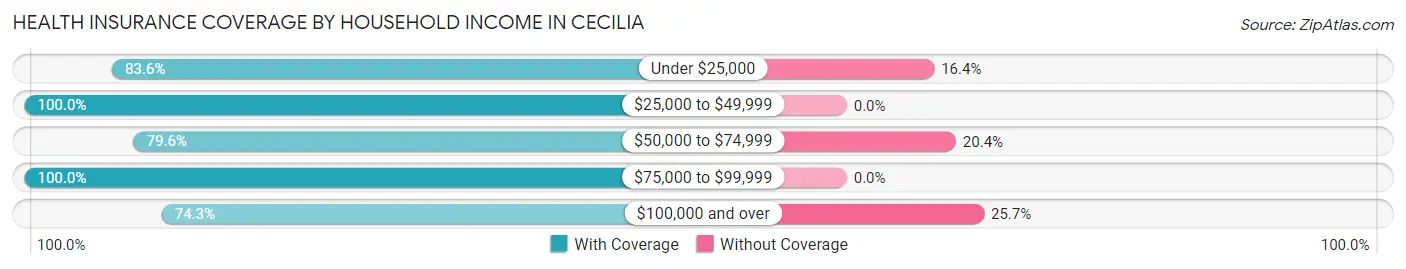
| Household Income | With Coverage | Without Coverage |
| Under $25,000 | 97 (83.6%) | 19 (16.4%) |
| $25,000 to $49,999 | 295 (100.0%) | 0 (0.0%) |
| $50,000 to $74,999 | 144 (79.6%) | 37 (20.4%) |
| $75,000 to $99,999 | 394 (100.0%) | 0 (0.0%) |
| $100,000 and over | 289 (74.3%) | 100 (25.7%) |
Public vs Private Health Insurance Coverage by Age in Cecilia
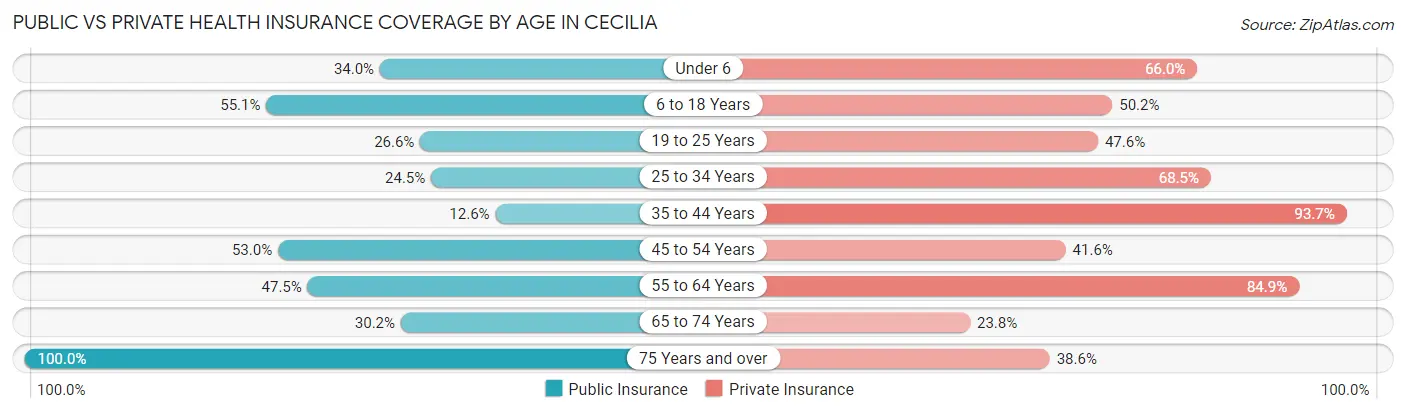
| Age Bracket | Public Insurance | Private Insurance |
| Under 6 | 16 (34.0%) | 31 (66.0%) |
| 6 to 18 Years | 134 (55.1%) | 122 (50.2%) |
| 19 to 25 Years | 38 (26.6%) | 68 (47.5%) |
| 25 to 34 Years | 67 (24.5%) | 187 (68.5%) |
| 35 to 44 Years | 14 (12.6%) | 104 (93.7%) |
| 45 to 54 Years | 116 (53.0%) | 91 (41.5%) |
| 55 to 64 Years | 47 (47.5%) | 84 (84.9%) |
| 65 to 74 Years | 38 (30.2%) | 30 (23.8%) |
| 75 Years and over | 114 (100.0%) | 44 (38.6%) |
| Total | 584 (42.5%) | 761 (55.3%) |
Disability Status by Sex by Age in Cecilia
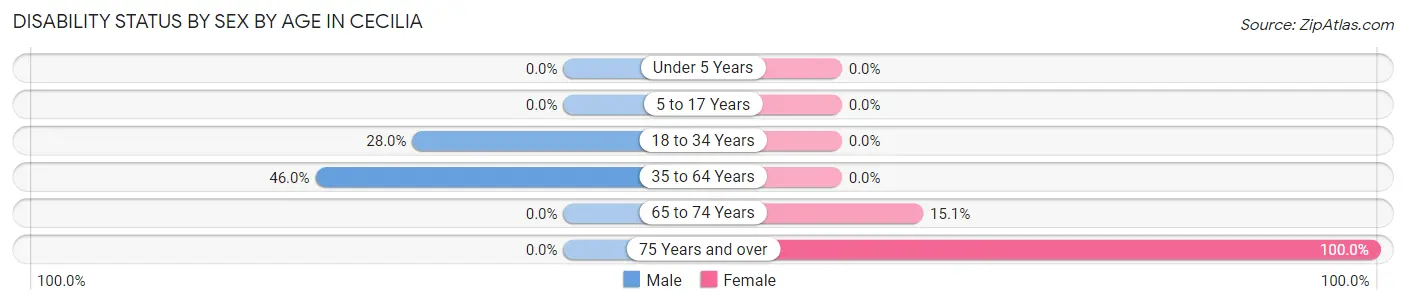
| Age Bracket | Male | Female |
| Under 5 Years | 0 (0.0%) | 0 (0.0%) |
| 5 to 17 Years | 0 (0.0%) | 0 (0.0%) |
| 18 to 34 Years | 67 (28.0%) | 0 (0.0%) |
| 35 to 64 Years | 128 (46.0%) | 0 (0.0%) |
| 65 to 74 Years | 0 (0.0%) | 8 (15.1%) |
| 75 Years and over | 0 (0.0%) | 99 (100.0%) |
Disability Class by Sex by Age in Cecilia
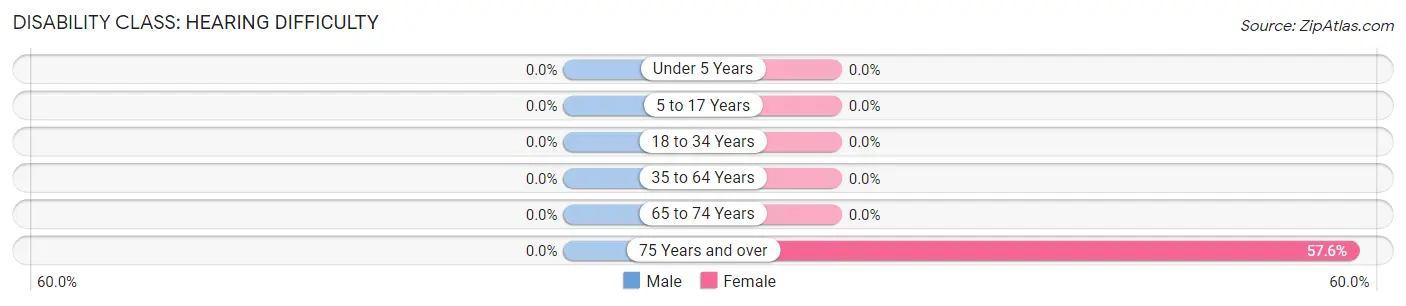
Disability Class: Hearing Difficulty
| Age Bracket | Male | Female |
| Under 5 Years | 0 (0.0%) | 0 (0.0%) |
| 5 to 17 Years | 0 (0.0%) | 0 (0.0%) |
| 18 to 34 Years | 0 (0.0%) | 0 (0.0%) |
| 35 to 64 Years | 0 (0.0%) | 0 (0.0%) |
| 65 to 74 Years | 0 (0.0%) | 0 (0.0%) |
| 75 Years and over | 0 (0.0%) | 57 (57.6%) |
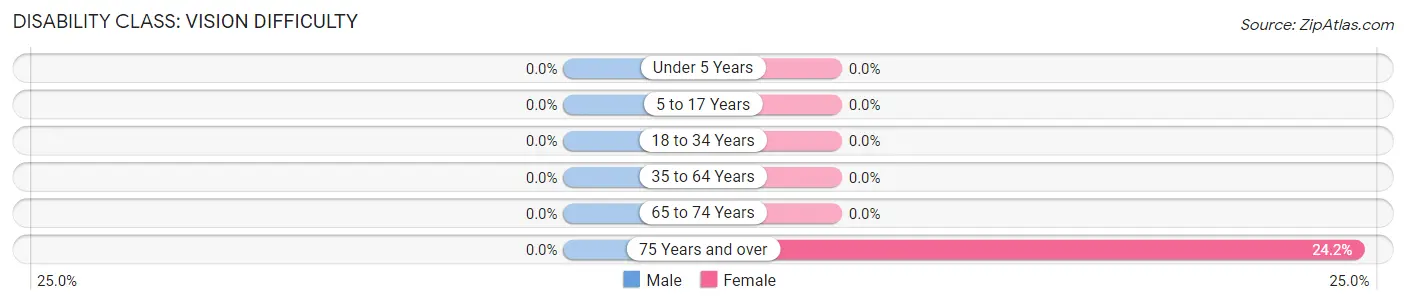
Disability Class: Vision Difficulty
| Age Bracket | Male | Female |
| Under 5 Years | 0 (0.0%) | 0 (0.0%) |
| 5 to 17 Years | 0 (0.0%) | 0 (0.0%) |
| 18 to 34 Years | 0 (0.0%) | 0 (0.0%) |
| 35 to 64 Years | 0 (0.0%) | 0 (0.0%) |
| 65 to 74 Years | 0 (0.0%) | 0 (0.0%) |
| 75 Years and over | 0 (0.0%) | 24 (24.2%) |
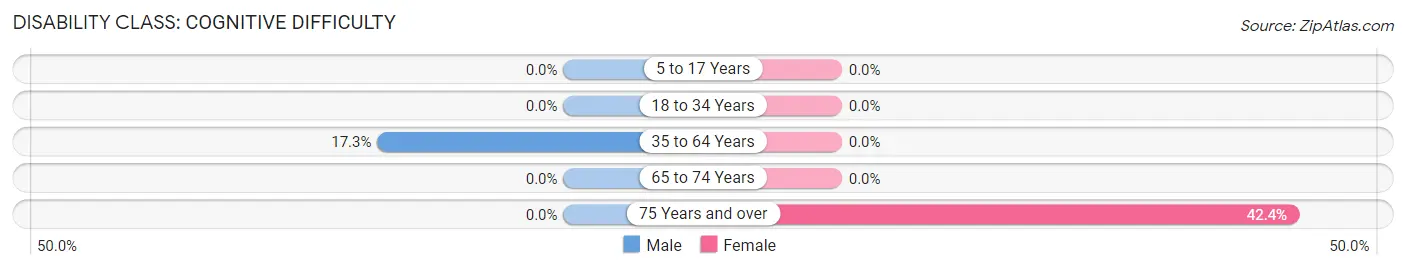
Disability Class: Cognitive Difficulty
| Age Bracket | Male | Female |
| 5 to 17 Years | 0 (0.0%) | 0 (0.0%) |
| 18 to 34 Years | 0 (0.0%) | 0 (0.0%) |
| 35 to 64 Years | 48 (17.3%) | 0 (0.0%) |
| 65 to 74 Years | 0 (0.0%) | 0 (0.0%) |
| 75 Years and over | 0 (0.0%) | 42 (42.4%) |
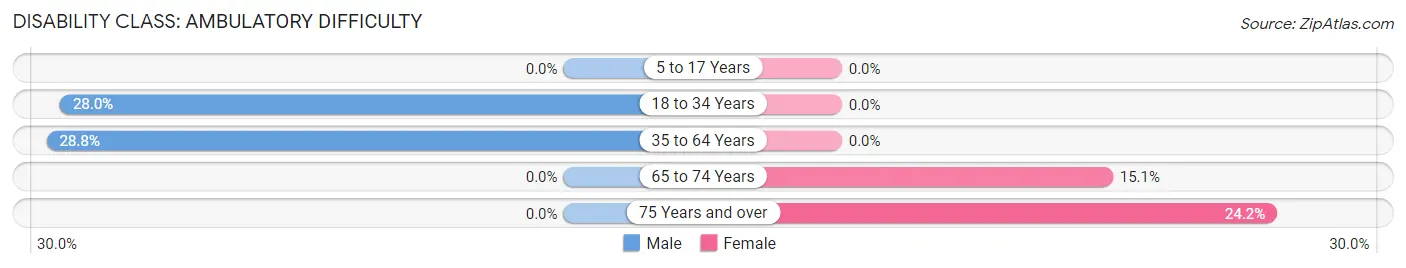
Disability Class: Ambulatory Difficulty
| Age Bracket | Male | Female |
| 5 to 17 Years | 0 (0.0%) | 0 (0.0%) |
| 18 to 34 Years | 67 (28.0%) | 0 (0.0%) |
| 35 to 64 Years | 80 (28.8%) | 0 (0.0%) |
| 65 to 74 Years | 0 (0.0%) | 8 (15.1%) |
| 75 Years and over | 0 (0.0%) | 24 (24.2%) |
Disability Class: Self-Care Difficulty
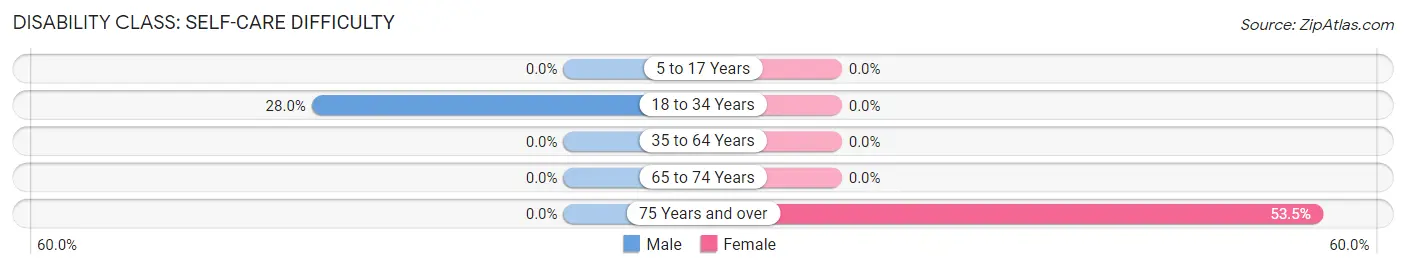
| Age Bracket | Male | Female |
| 5 to 17 Years | 0 (0.0%) | 0 (0.0%) |
| 18 to 34 Years | 67 (28.0%) | 0 (0.0%) |
| 35 to 64 Years | 0 (0.0%) | 0 (0.0%) |
| 65 to 74 Years | 0 (0.0%) | 0 (0.0%) |
| 75 Years and over | 0 (0.0%) | 53 (53.5%) |
Technology Access in Cecilia
Computing Device Access in Cecilia
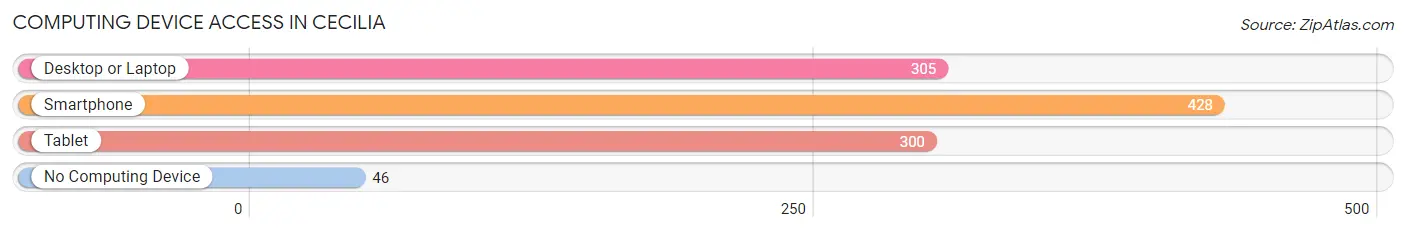
| Device Type | # Households | % Households |
| Desktop or Laptop | 305 | 56.9% |
| Smartphone | 428 | 79.8% |
| Tablet | 300 | 56.0% |
| No Computing Device | 46 | 8.6% |
| Total | 536 | 100.0% |
Internet Access in Cecilia
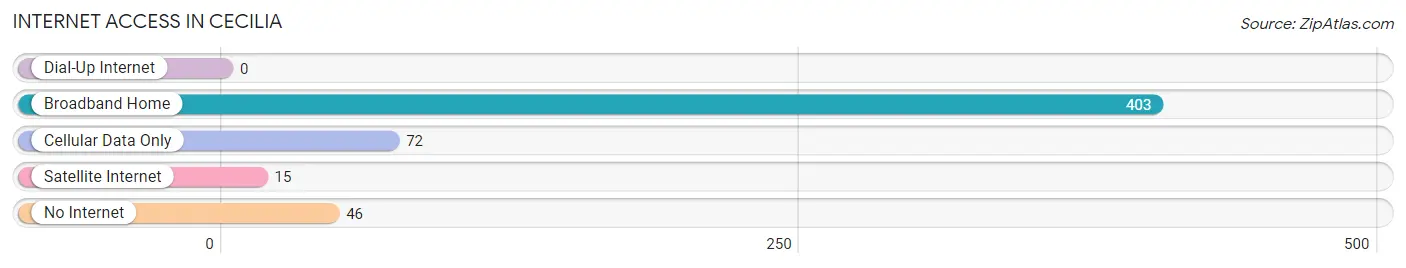
| Internet Type | # Households | % Households |
| Dial-Up Internet | 0 | 0.0% |
| Broadband Home | 403 | 75.2% |
| Cellular Data Only | 72 | 13.4% |
| Satellite Internet | 15 | 2.8% |
| No Internet | 46 | 8.6% |
| Total | 536 | 100.0% |
Cecilia Summary
Cecilia, Louisiana is a small town located in St. Martin Parish in the south-central part of the state. It is situated on the banks of Bayou Teche, a tributary of the Atchafalaya River. The town was founded in 1845 and named after the daughter of a local landowner. It is located about 20 miles south of Lafayette and has a population of approximately 1,500 people.
Geography
Cecilia is located in the heart of Cajun Country, an area of south-central Louisiana known for its unique culture and cuisine. The town is situated on the banks of Bayou Teche, a tributary of the Atchafalaya River. The town is surrounded by swamps and marshes, and is home to a variety of wildlife, including alligators, turtles, and birds. The town is located about 20 miles south of Lafayette and is accessible by car via US Highway 90.
History
Cecilia was founded in 1845 and named after the daughter of a local landowner. The town was originally a small farming community, but in the late 19th century, it became a popular destination for Cajun and Creole immigrants. The town was also home to a large number of Acadian refugees who had been expelled from Canada in the late 1700s. The town was incorporated in 1891 and has remained relatively unchanged since then.
Economy
Cecilia’s economy is largely based on agriculture and tourism. The town is home to several small farms, which produce a variety of crops, including corn, soybeans, and sugarcane. The town is also home to several restaurants and bars, which attract tourists from all over the state. In addition, the town is home to several small businesses, including a grocery store, a hardware store, and a gas station.
Demographics
As of the 2010 census, the population of Cecilia was 1,500 people. The town is predominantly white, with a small African American population. The median household income is $37,000, and the median age is 38. The town is home to a variety of religious denominations, including Catholic, Baptist, and Methodist.
Conclusion
Cecilia, Louisiana is a small town located in St. Martin Parish in the south-central part of the state. It is situated on the banks of Bayou Teche, a tributary of the Atchafalaya River. The town was founded in 1845 and named after the daughter of a local landowner. It is located about 20 miles south of Lafayette and has a population of approximately 1,500 people. The town’s economy is largely based on agriculture and tourism, and it is home to a variety of religious denominations. The town is predominantly white, with a small African American population.
Common Questions
What is Per Capita Income in Cecilia?
Per Capita income in Cecilia is $41,382.
What is the Median Family Income in Cecilia?
Median Family Income in Cecilia is $86,061.
What is the Median Household income in Cecilia?
Median Household Income in Cecilia is $70,259.
What is Income or Wage Gap in Cecilia?
Income or Wage Gap in Cecilia is 33.1%.
Women in Cecilia earn 66.9 cents for every dollar earned by a man.
What is Inequality or Gini Index in Cecilia?
Inequality or Gini Index in Cecilia is 0.48.
What is the Total Population of Cecilia?
Total Population of Cecilia is 1,375.
What is the Total Male Population of Cecilia?
Total Male Population of Cecilia is 781.
What is the Total Female Population of Cecilia?
Total Female Population of Cecilia is 594.
What is the Ratio of Males per 100 Females in Cecilia?
There are 131.48 Males per 100 Females in Cecilia.
What is the Ratio of Females per 100 Males in Cecilia?
There are 76.06 Females per 100 Males in Cecilia.
What is the Median Population Age in Cecilia?
Median Population Age in Cecilia is 33.7 Years.
What is the Average Family Size in Cecilia
Average Family Size in Cecilia is 3.1 People.
What is the Average Household Size in Cecilia
Average Household Size in Cecilia is 2.6 People.
How Large is the Labor Force in Cecilia?
There are 730 People in the Labor Forcein in Cecilia.
What is the Percentage of People in the Labor Force in Cecilia?
65.3% of People are in the Labor Force in Cecilia.
What is the Unemployment Rate in Cecilia?
Unemployment Rate in Cecilia is 3.2%.