Swartz, LA Map & Demographics
Swartz Map
Swartz Overview
$32,113
PER CAPITA INCOME
$82,847
AVG FAMILY INCOME
$68,925
AVG HOUSEHOLD INCOME
9.2%
WAGE / INCOME GAP [ % ]
90.8¢/ $1
WAGE / INCOME GAP [ $ ]
0.46
INEQUALITY / GINI INDEX
4,803
TOTAL POPULATION
2,270
MALE POPULATION
2,533
FEMALE POPULATION
89.62
MALES / 100 FEMALES
111.59
FEMALES / 100 MALES
33.4
MEDIAN AGE
3.6
AVG FAMILY SIZE
3.0
AVG HOUSEHOLD SIZE
2,300
LABOR FORCE [ PEOPLE ]
59.8%
PERCENT IN LABOR FORCE
0.4%
UNEMPLOYMENT RATE
Swartz Area Codes
Income in Swartz
Income Overview in Swartz
Per Capita Income in Swartz is $32,113, while median incomes of families and households are $82,847 and $68,925 respectively.
| Characteristic | Number | Measure |
| Per Capita Income | 4,803 | $32,113 |
| Median Family Income | 1,130 | $82,847 |
| Mean Family Income | 1,130 | $100,990 |
| Median Household Income | 1,615 | $68,925 |
| Mean Household Income | 1,615 | $90,709 |
| Income Deficit | 1,130 | $0 |
| Wage / Income Gap (%) | 4,803 | 9.17% |
| Wage / Income Gap ($) | 4,803 | 90.83¢ per $1 |
| Gini / Inequality Index | 4,803 | 0.46 |
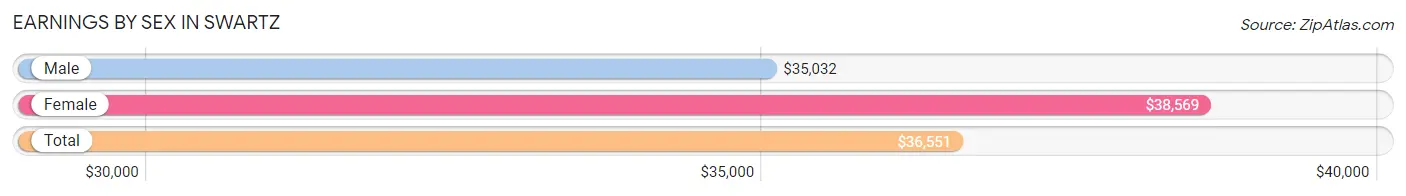
Earnings by Sex in Swartz
Average Earnings in Swartz are $36,551, $35,032 for men and $38,569 for women, a difference of 9.2%.
| Sex | Number | Average Earnings |
| Male | 1,255 (52.1%) | $35,032 |
| Female | 1,154 (47.9%) | $38,569 |
| Total | 2,409 (100.0%) | $36,551 |
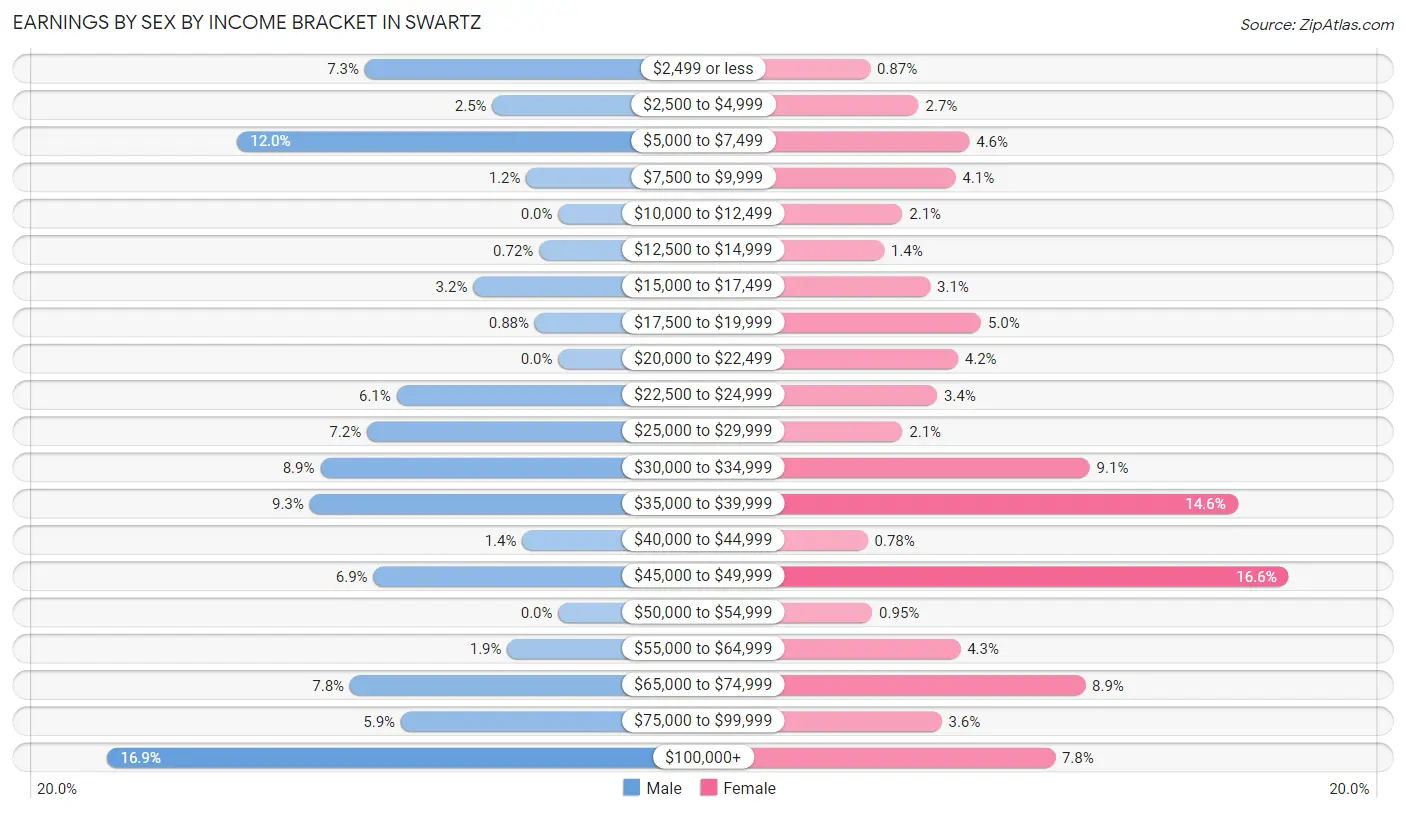
Earnings by Sex by Income Bracket in Swartz
The most common earnings brackets in Swartz are $100,000+ for men (212 | 16.9%) and $45,000 to $49,999 for women (191 | 16.6%).
| Income | Male | Female |
| $2,499 or less | 91 (7.2%) | 10 (0.9%) |
| $2,500 to $4,999 | 31 (2.5%) | 31 (2.7%) |
| $5,000 to $7,499 | 151 (12.0%) | 53 (4.6%) |
| $7,500 to $9,999 | 15 (1.2%) | 47 (4.1%) |
| $10,000 to $12,499 | 0 (0.0%) | 24 (2.1%) |
| $12,500 to $14,999 | 9 (0.7%) | 16 (1.4%) |
| $15,000 to $17,499 | 40 (3.2%) | 36 (3.1%) |
| $17,500 to $19,999 | 11 (0.9%) | 58 (5.0%) |
| $20,000 to $22,499 | 0 (0.0%) | 48 (4.2%) |
| $22,500 to $24,999 | 76 (6.1%) | 39 (3.4%) |
| $25,000 to $29,999 | 90 (7.2%) | 24 (2.1%) |
| $30,000 to $34,999 | 112 (8.9%) | 105 (9.1%) |
| $35,000 to $39,999 | 117 (9.3%) | 169 (14.6%) |
| $40,000 to $44,999 | 17 (1.3%) | 9 (0.8%) |
| $45,000 to $49,999 | 87 (6.9%) | 191 (16.6%) |
| $50,000 to $54,999 | 0 (0.0%) | 11 (0.9%) |
| $55,000 to $64,999 | 24 (1.9%) | 49 (4.3%) |
| $65,000 to $74,999 | 98 (7.8%) | 103 (8.9%) |
| $75,000 to $99,999 | 74 (5.9%) | 41 (3.5%) |
| $100,000+ | 212 (16.9%) | 90 (7.8%) |
| Total | 1,255 (100.0%) | 1,154 (100.0%) |
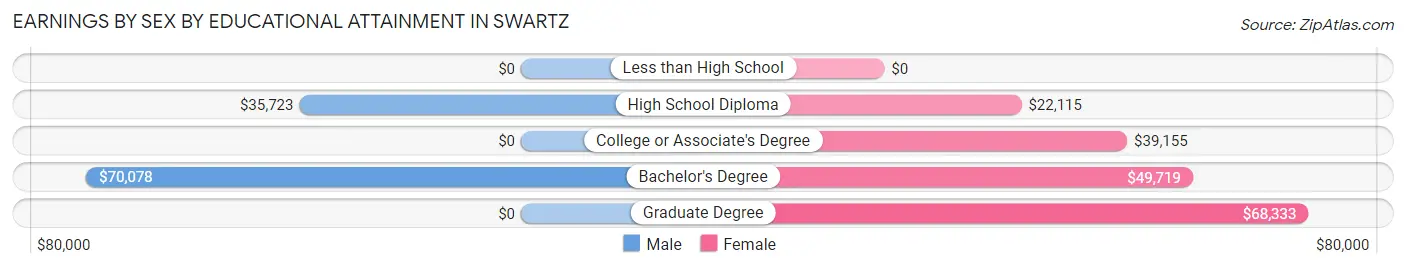
Earnings by Sex by Educational Attainment in Swartz
Average earnings in Swartz are $45,359 for men and $39,121 for women, a difference of 13.8%. Men with an educational attainment of bachelor's degree enjoy the highest average annual earnings of $70,078, while those with high school diploma education earn the least with $35,723. Women with an educational attainment of graduate degree earn the most with the average annual earnings of $68,333, while those with high school diploma education have the smallest earnings of $22,115.
| Educational Attainment | Male Income | Female Income |
| Less than High School | - | - |
| High School Diploma | $35,723 | $22,115 |
| College or Associate's Degree | - | - |
| Bachelor's Degree | $70,078 | $49,719 |
| Graduate Degree | - | - |
| Total | $45,359 | $39,121 |
Family Income in Swartz
Family Income Brackets in Swartz
According to the Swartz family income data, there are 243 families falling into the $75,000 to $99,999 income range, which is the most common income bracket and makes up 21.5% of all families. Conversely, the $10,000 to $14,999 income bracket is the least frequent group with only 9 families (0.8%) belonging to this category.
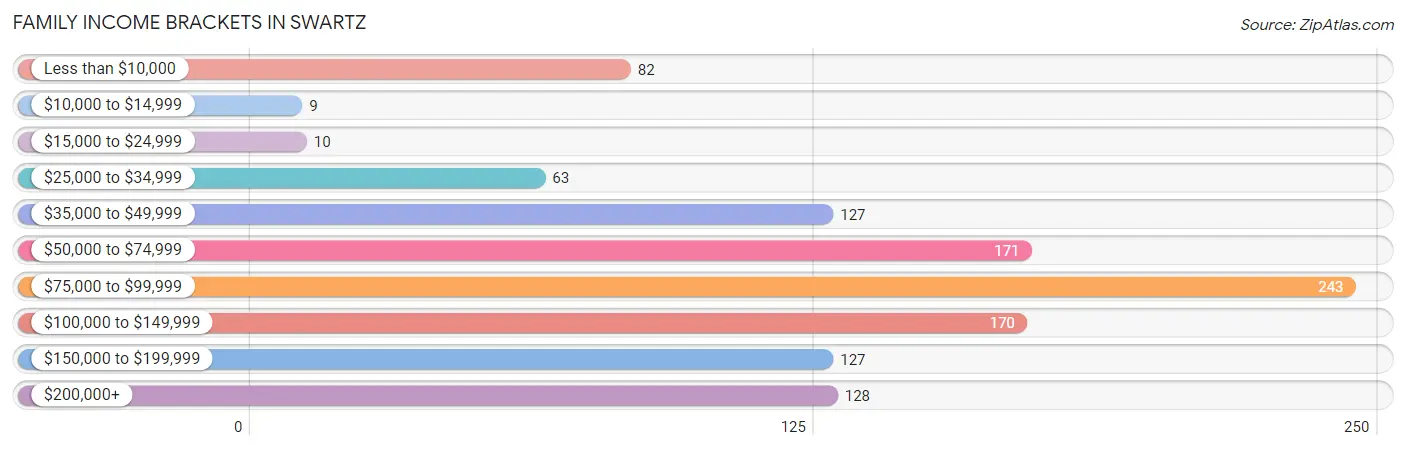
| Income Bracket | # Families | % Families |
| Less than $10,000 | 82 | 7.3% |
| $10,000 to $14,999 | 9 | 0.8% |
| $15,000 to $24,999 | 10 | 0.9% |
| $25,000 to $34,999 | 63 | 5.6% |
| $35,000 to $49,999 | 127 | 11.2% |
| $50,000 to $74,999 | 171 | 15.1% |
| $75,000 to $99,999 | 243 | 21.5% |
| $100,000 to $149,999 | 170 | 15.0% |
| $150,000 to $199,999 | 127 | 11.2% |
| $200,000+ | 128 | 11.3% |
Family Income by Famaliy Size in Swartz
4-person families (299 | 26.5%) account for the highest median family income in Swartz with $146,875 per family, while 2-person families (431 | 38.1%) have the highest median income of $41,423 per family member.
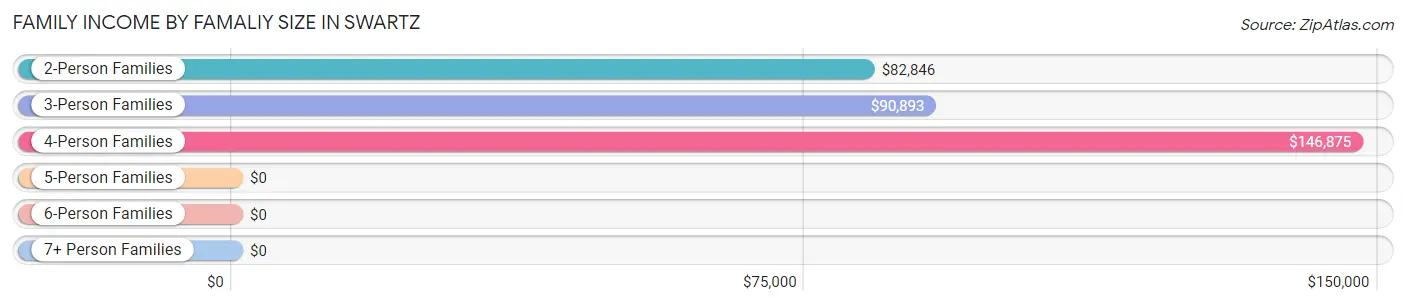
| Income Bracket | # Families | Median Income |
| 2-Person Families | 431 (38.1%) | $82,846 |
| 3-Person Families | 291 (25.8%) | $90,893 |
| 4-Person Families | 299 (26.5%) | $146,875 |
| 5-Person Families | 109 (9.7%) | $0 |
| 6-Person Families | 0 (0.0%) | $0 |
| 7+ Person Families | 0 (0.0%) | $0 |
| Total | 1,130 (100.0%) | $82,847 |
Family Income by Number of Earners in Swartz
The median family income in Swartz is $82,847, with families comprising 3+ earners (65) having the highest median family income of $152,574, while families with no earners (111) have the lowest median family income of $45,156, accounting for 5.8% and 9.8% of families, respectively.
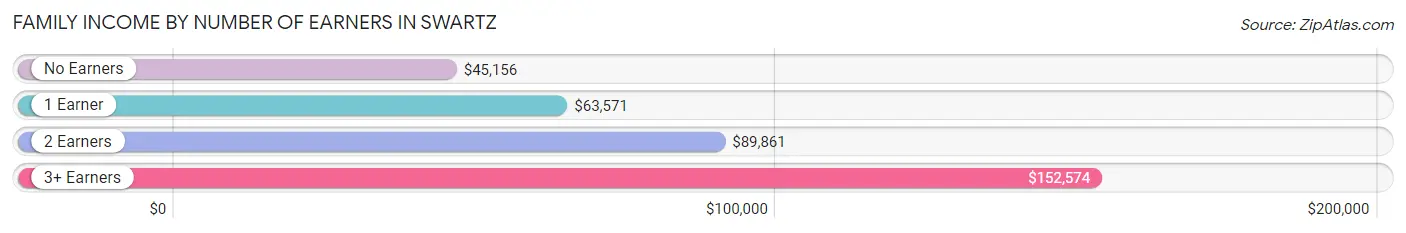
| Number of Earners | # Families | Median Income |
| No Earners | 111 (9.8%) | $45,156 |
| 1 Earner | 306 (27.1%) | $63,571 |
| 2 Earners | 648 (57.4%) | $89,861 |
| 3+ Earners | 65 (5.8%) | $152,574 |
| Total | 1,130 (100.0%) | $82,847 |
Household Income in Swartz
Household Income Brackets in Swartz
With 292 households falling in the category, the $50,000 to $74,999 income range is the most frequent in Swartz, accounting for 18.1% of all households. In contrast, only 24 households (1.5%) fall into the $10,000 to $14,999 income bracket, making it the least populous group.
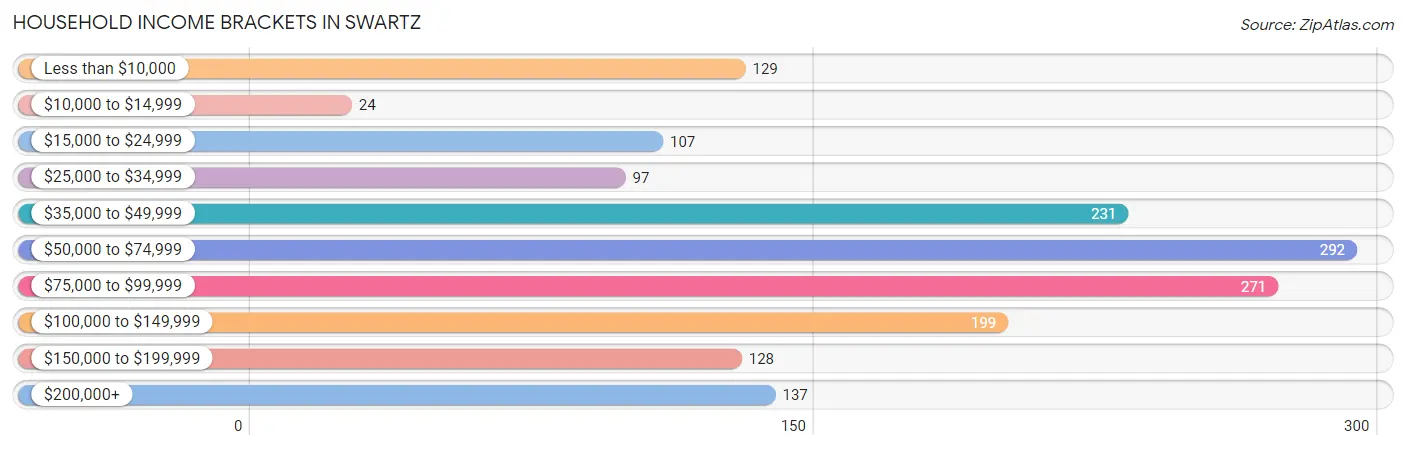
| Income Bracket | # Households | % Households |
| Less than $10,000 | 129 | 8.0% |
| $10,000 to $14,999 | 24 | 1.5% |
| $15,000 to $24,999 | 107 | 6.6% |
| $25,000 to $34,999 | 97 | 6.0% |
| $35,000 to $49,999 | 231 | 14.3% |
| $50,000 to $74,999 | 292 | 18.1% |
| $75,000 to $99,999 | 271 | 16.8% |
| $100,000 to $149,999 | 199 | 12.3% |
| $150,000 to $199,999 | 128 | 7.9% |
| $200,000+ | 137 | 8.5% |
Household Income by Householder Age in Swartz
The median household income in Swartz is $68,925, with the highest median household income of $82,745 found in the 25 to 44 years age bracket for the primary householder. A total of 505 households (31.3%) fall into this category. Meanwhile, the 15 to 24 years age bracket for the primary householder has the lowest median household income of $0, with 16 households (1.0%) in this group.
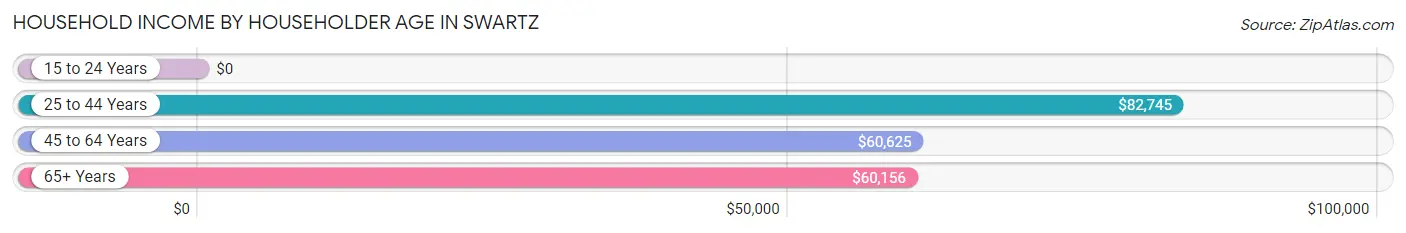
| Income Bracket | # Households | Median Income |
| 15 to 24 Years | 16 (1.0%) | $0 |
| 25 to 44 Years | 505 (31.3%) | $82,745 |
| 45 to 64 Years | 657 (40.7%) | $60,625 |
| 65+ Years | 437 (27.1%) | $60,156 |
| Total | 1,615 (100.0%) | $68,925 |
Poverty in Swartz
Income Below Poverty by Sex and Age in Swartz
With 11.9% poverty level for males and 13.3% for females among the residents of Swartz, under 5 year old males and 6 to 11 year old females are the most vulnerable to poverty, with 76 males (82.6%) and 67 females (31.5%) in their respective age groups living below the poverty level.
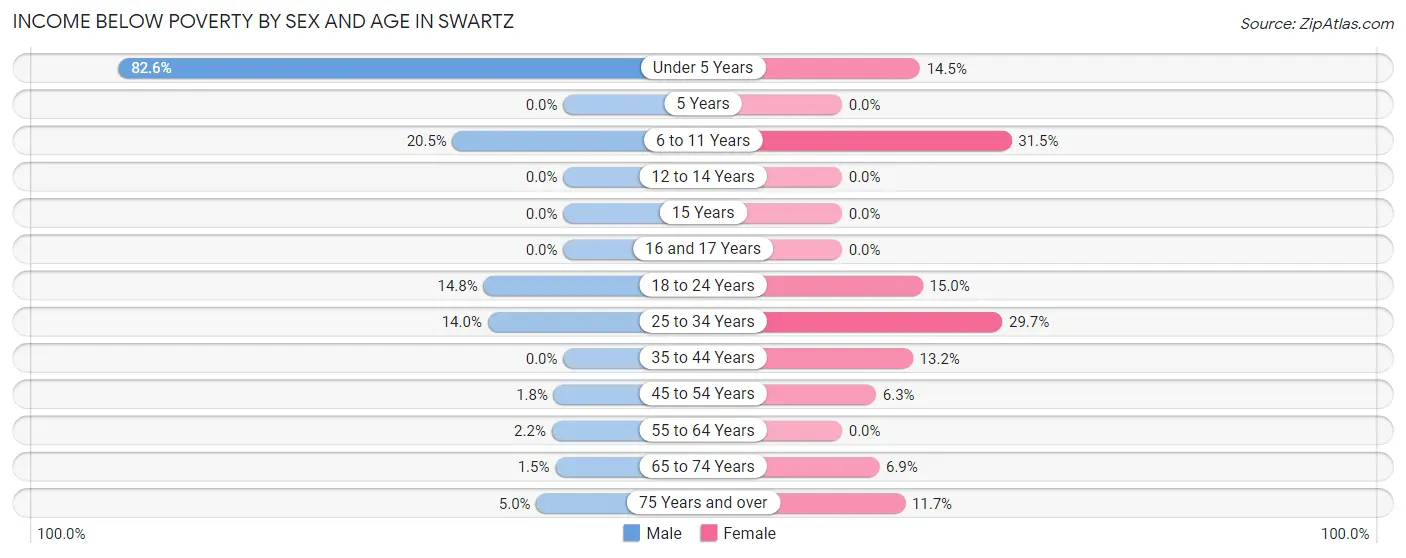
| Age Bracket | Male | Female |
| Under 5 Years | 76 (82.6%) | 23 (14.5%) |
| 5 Years | 0 (0.0%) | 0 (0.0%) |
| 6 to 11 Years | 53 (20.5%) | 67 (31.5%) |
| 12 to 14 Years | 0 (0.0%) | 0 (0.0%) |
| 15 Years | 0 (0.0%) | 0 (0.0%) |
| 16 and 17 Years | 0 (0.0%) | 0 (0.0%) |
| 18 to 24 Years | 52 (14.8%) | 12 (15.0%) |
| 25 to 34 Years | 72 (14.0%) | 138 (29.7%) |
| 35 to 44 Years | 0 (0.0%) | 43 (13.2%) |
| 45 to 54 Years | 4 (1.8%) | 23 (6.3%) |
| 55 to 64 Years | 5 (2.1%) | 0 (0.0%) |
| 65 to 74 Years | 2 (1.5%) | 15 (6.9%) |
| 75 Years and over | 7 (5.0%) | 17 (11.7%) |
| Total | 271 (11.9%) | 338 (13.3%) |
Income Above Poverty by Sex and Age in Swartz
According to the poverty statistics in Swartz, males aged 12 to 14 years and females aged 12 to 14 years are the age groups that are most secure financially, with 100.0% of males and 100.0% of females in these age groups living above the poverty line.
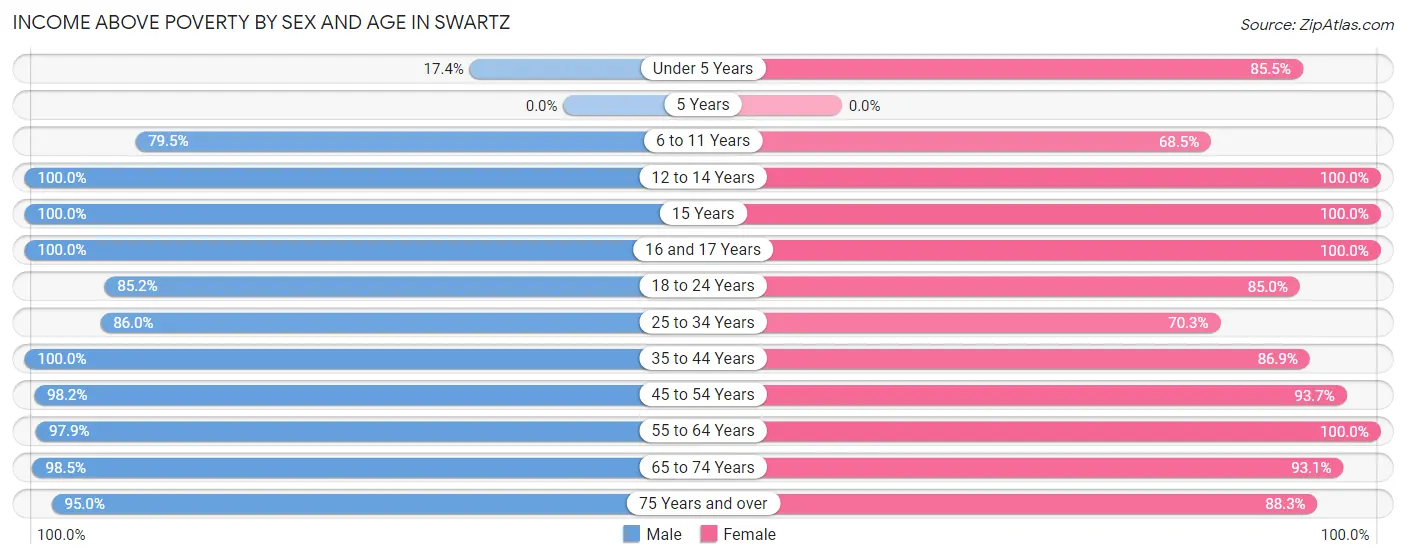
| Age Bracket | Male | Female |
| Under 5 Years | 16 (17.4%) | 136 (85.5%) |
| 5 Years | 0 (0.0%) | 0 (0.0%) |
| 6 to 11 Years | 205 (79.5%) | 146 (68.5%) |
| 12 to 14 Years | 84 (100.0%) | 105 (100.0%) |
| 15 Years | 16 (100.0%) | 30 (100.0%) |
| 16 and 17 Years | 35 (100.0%) | 93 (100.0%) |
| 18 to 24 Years | 299 (85.2%) | 68 (85.0%) |
| 25 to 34 Years | 441 (86.0%) | 326 (70.3%) |
| 35 to 44 Years | 189 (100.0%) | 284 (86.9%) |
| 45 to 54 Years | 222 (98.2%) | 341 (93.7%) |
| 55 to 64 Years | 228 (97.9%) | 336 (100.0%) |
| 65 to 74 Years | 131 (98.5%) | 202 (93.1%) |
| 75 Years and over | 133 (95.0%) | 128 (88.3%) |
| Total | 1,999 (88.1%) | 2,195 (86.7%) |
Income Below Poverty Among Married-Couple Families in Swartz
The poverty statistics for married-couple families in Swartz show that 6.3% or 55 of the total 872 families live below the poverty line. Families with 3 or 4 children have the highest poverty rate of 58.2%, comprising of 39 families. On the other hand, families with no children have the lowest poverty rate of 1.9%, which includes 9 families.
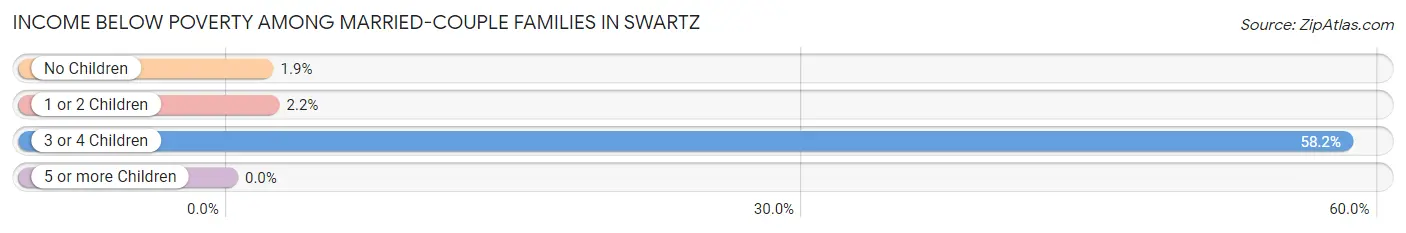
| Children | Above Poverty | Below Poverty |
| No Children | 474 (98.1%) | 9 (1.9%) |
| 1 or 2 Children | 315 (97.8%) | 7 (2.2%) |
| 3 or 4 Children | 28 (41.8%) | 39 (58.2%) |
| 5 or more Children | 0 (0.0%) | 0 (0.0%) |
| Total | 817 (93.7%) | 55 (6.3%) |
Income Below Poverty Among Single-Parent Households in Swartz
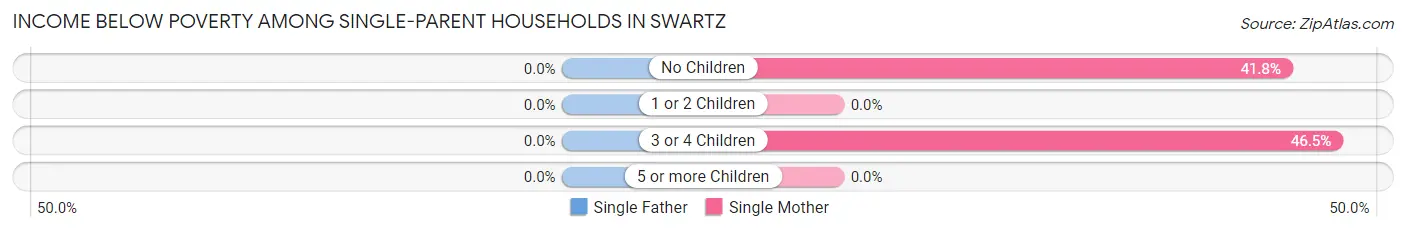
| Children | Single Father | Single Mother |
| No Children | 0 (0.0%) | 23 (41.8%) |
| 1 or 2 Children | 0 (0.0%) | 0 (0.0%) |
| 3 or 4 Children | 0 (0.0%) | 20 (46.5%) |
| 5 or more Children | 0 (0.0%) | 0 (0.0%) |
| Total | 0 (0.0%) | 43 (29.2%) |
Income Below Poverty Among Married-Couple vs Single-Parent Households in Swartz
The poverty data for Swartz shows that 55 of the married-couple family households (6.3%) and 43 of the single-parent households (16.7%) are living below the poverty level. Within the married-couple family households, those with 3 or 4 children have the highest poverty rate, with 39 households (58.2%) falling below the poverty line. Among the single-parent households, those with 3 or 4 children have the highest poverty rate, with 20 household (46.5%) living below poverty.
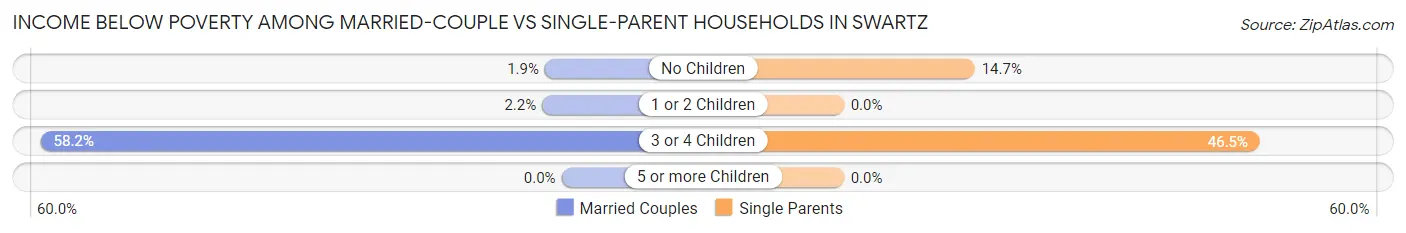
| Children | Married-Couple Families | Single-Parent Households |
| No Children | 9 (1.9%) | 23 (14.6%) |
| 1 or 2 Children | 7 (2.2%) | 0 (0.0%) |
| 3 or 4 Children | 39 (58.2%) | 20 (46.5%) |
| 5 or more Children | 0 (0.0%) | 0 (0.0%) |
| Total | 55 (6.3%) | 43 (16.7%) |
Race in Swartz
The most populous races in Swartz are White / Caucasian (3,652 | 76.0%), Black / African American (1,014 | 21.1%), and Two or more Races (125 | 2.6%).
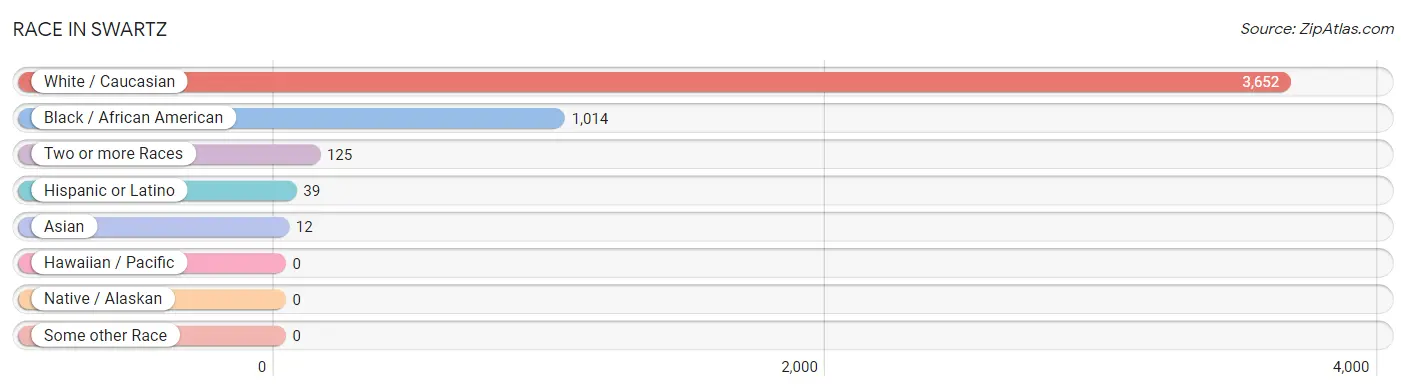
| Race | # Population | % Population |
| Asian | 12 | 0.3% |
| Black / African American | 1,014 | 21.1% |
| Hawaiian / Pacific | 0 | 0.0% |
| Hispanic or Latino | 39 | 0.8% |
| Native / Alaskan | 0 | 0.0% |
| White / Caucasian | 3,652 | 76.0% |
| Two or more Races | 125 | 2.6% |
| Some other Race | 0 | 0.0% |
| Total | 4,803 | 100.0% |
Ancestry in Swartz
The most populous ancestries reported in Swartz are English (977 | 20.3%), Irish (653 | 13.6%), American (398 | 8.3%), Italian (165 | 3.4%), and Scottish (163 | 3.4%), together accounting for 49.1% of all Swartz residents.
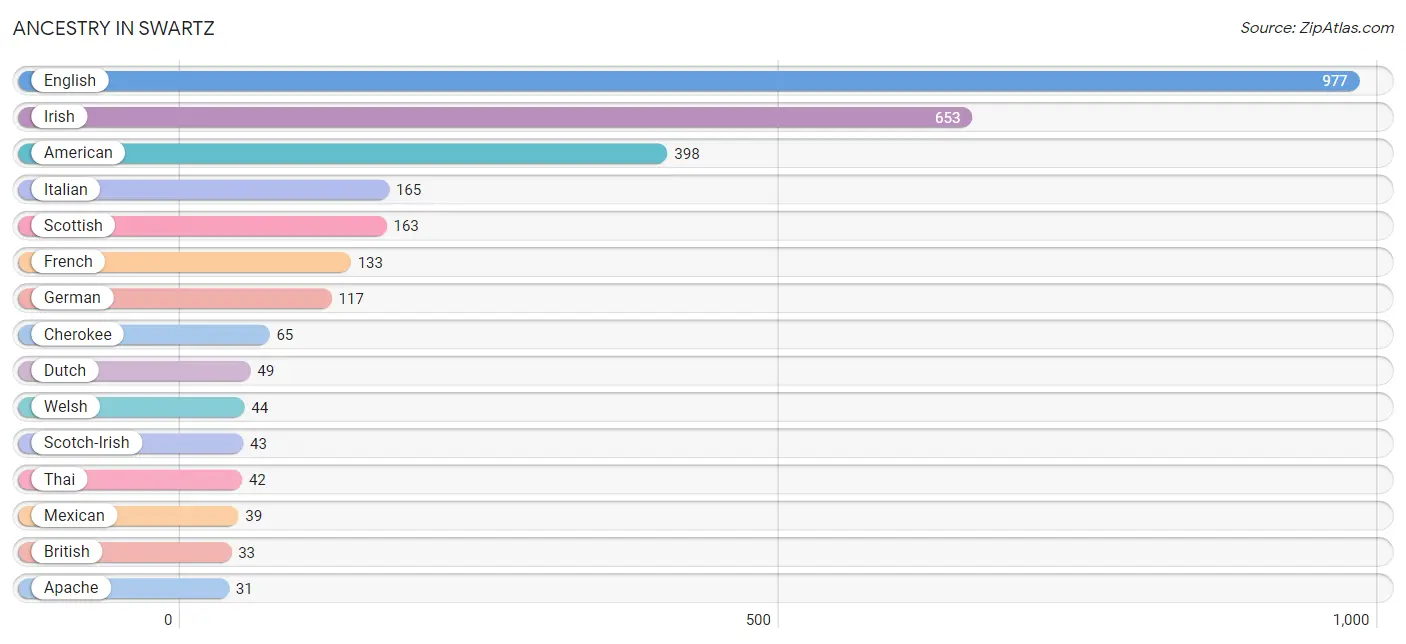
| Ancestry | # Population | % Population |
| American | 398 | 8.3% |
| Apache | 31 | 0.6% |
| British | 33 | 0.7% |
| Cherokee | 65 | 1.3% |
| Dutch | 49 | 1.0% |
| English | 977 | 20.3% |
| European | 24 | 0.5% |
| French | 133 | 2.8% |
| French Canadian | 13 | 0.3% |
| German | 117 | 2.4% |
| Greek | 23 | 0.5% |
| Indian (Asian) | 6 | 0.1% |
| Irish | 653 | 13.6% |
| Italian | 165 | 3.4% |
| Korean | 6 | 0.1% |
| Mexican | 39 | 0.8% |
| Pakistani | 18 | 0.4% |
| Scotch-Irish | 43 | 0.9% |
| Scottish | 163 | 3.4% |
| Sioux | 31 | 0.6% |
| Thai | 42 | 0.9% |
| Welsh | 44 | 0.9% | View All 22 Rows |
Immigrants in Swartz
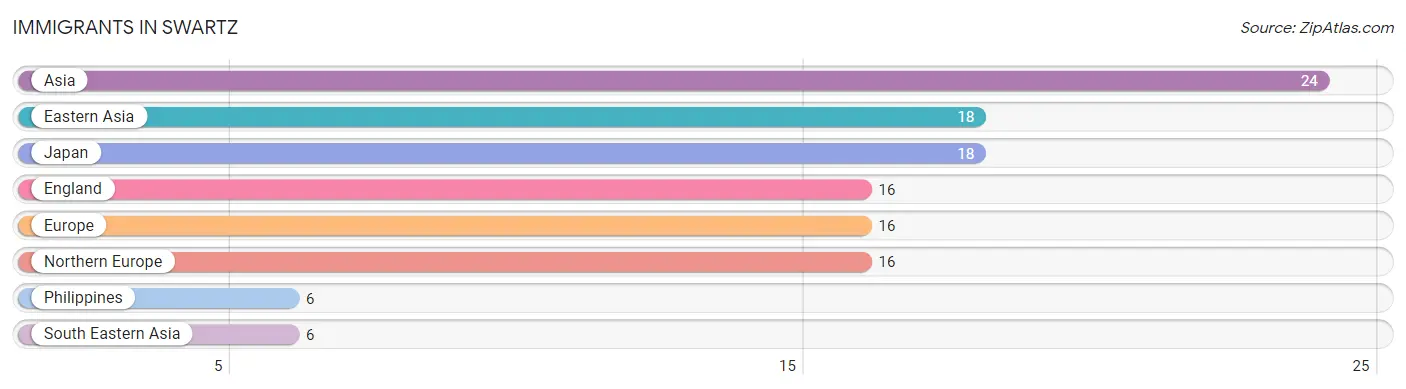
The most numerous immigrant groups reported in Swartz came from Asia (24 | 0.5%), Eastern Asia (18 | 0.4%), Japan (18 | 0.4%), England (16 | 0.3%), and Europe (16 | 0.3%), together accounting for 1.9% of all Swartz residents.
| Immigration Origin | # Population | % Population |
| Asia | 24 | 0.5% |
| Eastern Asia | 18 | 0.4% |
| England | 16 | 0.3% |
| Europe | 16 | 0.3% |
| Japan | 18 | 0.4% |
| Northern Europe | 16 | 0.3% |
| Philippines | 6 | 0.1% |
| South Eastern Asia | 6 | 0.1% | View All 8 Rows |
Sex and Age in Swartz
Sex and Age in Swartz
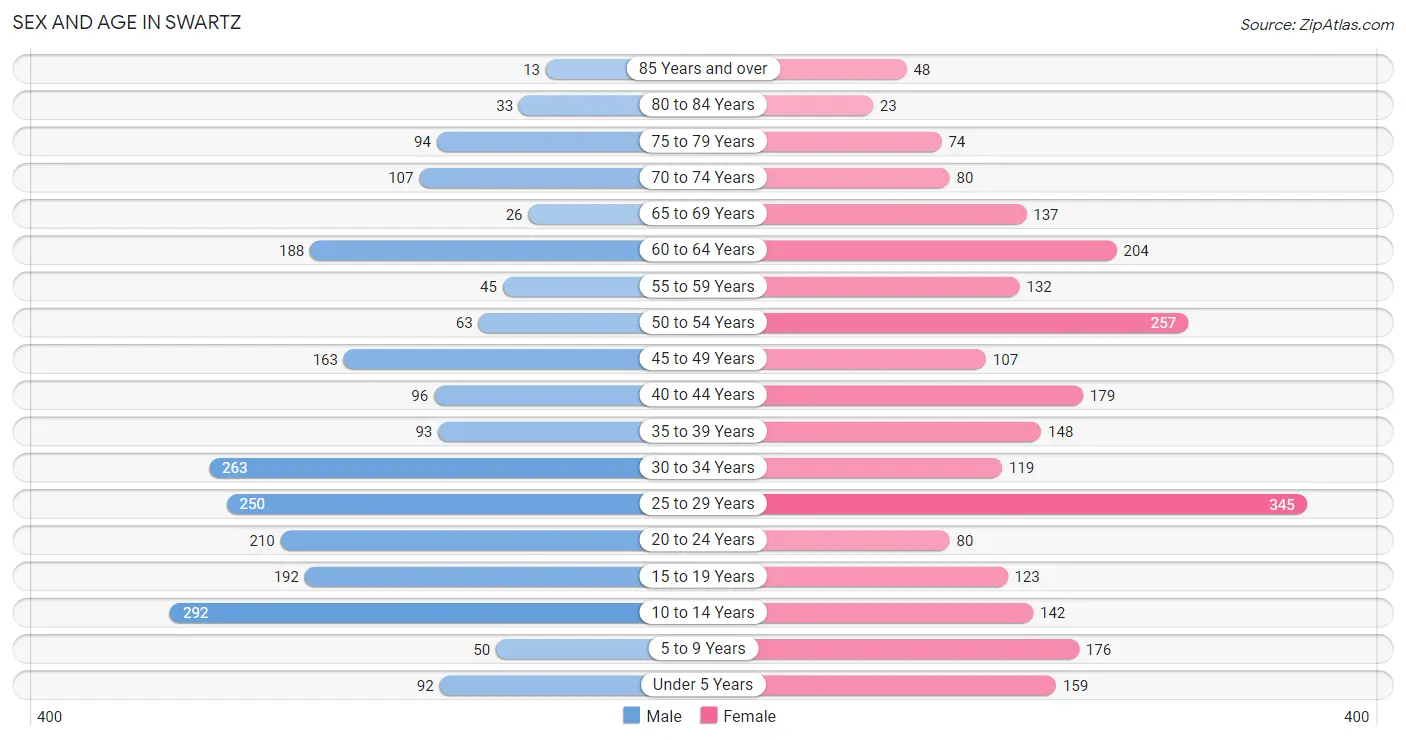
The most populous age groups in Swartz are 10 to 14 Years (292 | 12.9%) for men and 25 to 29 Years (345 | 13.6%) for women.
| Age Bracket | Male | Female |
| Under 5 Years | 92 (4.1%) | 159 (6.3%) |
| 5 to 9 Years | 50 (2.2%) | 176 (7.0%) |
| 10 to 14 Years | 292 (12.9%) | 142 (5.6%) |
| 15 to 19 Years | 192 (8.5%) | 123 (4.9%) |
| 20 to 24 Years | 210 (9.2%) | 80 (3.2%) |
| 25 to 29 Years | 250 (11.0%) | 345 (13.6%) |
| 30 to 34 Years | 263 (11.6%) | 119 (4.7%) |
| 35 to 39 Years | 93 (4.1%) | 148 (5.8%) |
| 40 to 44 Years | 96 (4.2%) | 179 (7.1%) |
| 45 to 49 Years | 163 (7.2%) | 107 (4.2%) |
| 50 to 54 Years | 63 (2.8%) | 257 (10.2%) |
| 55 to 59 Years | 45 (2.0%) | 132 (5.2%) |
| 60 to 64 Years | 188 (8.3%) | 204 (8.1%) |
| 65 to 69 Years | 26 (1.1%) | 137 (5.4%) |
| 70 to 74 Years | 107 (4.7%) | 80 (3.2%) |
| 75 to 79 Years | 94 (4.1%) | 74 (2.9%) |
| 80 to 84 Years | 33 (1.5%) | 23 (0.9%) |
| 85 Years and over | 13 (0.6%) | 48 (1.9%) |
| Total | 2,270 (100.0%) | 2,533 (100.0%) |
Families and Households in Swartz
Median Family Size in Swartz
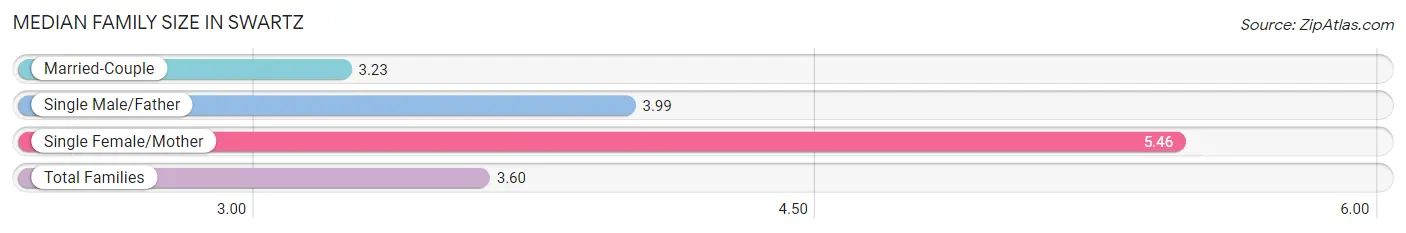
The median family size in Swartz is 3.60 persons per family, with single female/mother families (147 | 13.0%) accounting for the largest median family size of 5.46 persons per family. On the other hand, married-couple families (872 | 77.2%) represent the smallest median family size with 3.23 persons per family.
| Family Type | # Families | Family Size |
| Married-Couple | 872 (77.2%) | 3.23 |
| Single Male/Father | 111 (9.8%) | 3.99 |
| Single Female/Mother | 147 (13.0%) | 5.46 |
| Total Families | 1,130 (100.0%) | 3.60 |
Median Household Size in Swartz
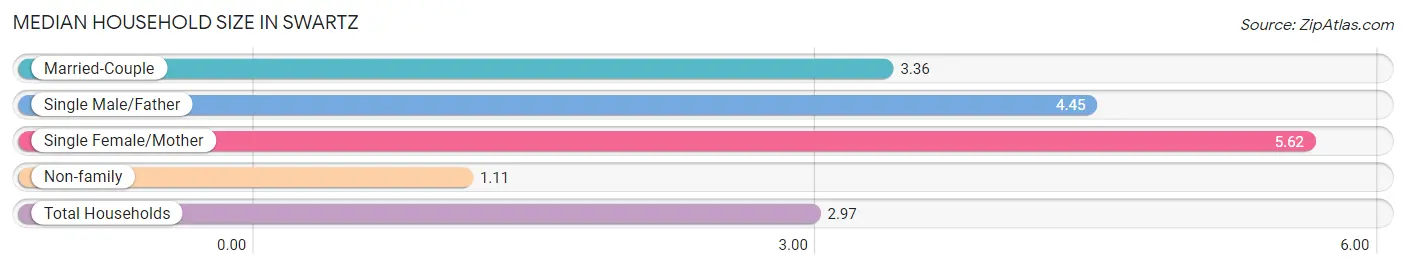
The median household size in Swartz is 2.97 persons per household, with single female/mother households (147 | 9.1%) accounting for the largest median household size of 5.62 persons per household. non-family households (485 | 30.0%) represent the smallest median household size with 1.11 persons per household.
| Household Type | # Households | Household Size |
| Married-Couple | 872 (54.0%) | 3.36 |
| Single Male/Father | 111 (6.9%) | 4.45 |
| Single Female/Mother | 147 (9.1%) | 5.62 |
| Non-family | 485 (30.0%) | 1.11 |
| Total Households | 1,615 (100.0%) | 2.97 |
Household Size by Marriage Status in Swartz
Out of a total of 1,615 households in Swartz, 1,130 (70.0%) are family households, while 485 (30.0%) are nonfamily households. The most numerous type of family households are 2-person households, comprising 404, and the most common type of nonfamily households are 1-person households, comprising 436.
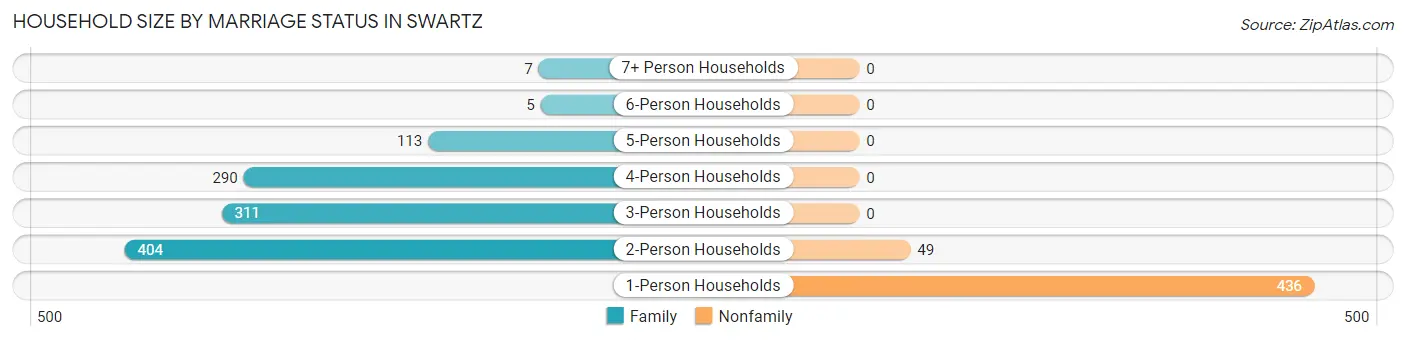
| Household Size | Family Households | Nonfamily Households |
| 1-Person Households | - | 436 (27.0%) |
| 2-Person Households | 404 (25.0%) | 49 (3.0%) |
| 3-Person Households | 311 (19.3%) | 0 (0.0%) |
| 4-Person Households | 290 (18.0%) | 0 (0.0%) |
| 5-Person Households | 113 (7.0%) | 0 (0.0%) |
| 6-Person Households | 5 (0.3%) | 0 (0.0%) |
| 7+ Person Households | 7 (0.4%) | 0 (0.0%) |
| Total | 1,130 (70.0%) | 485 (30.0%) |
Female Fertility in Swartz
Fertility by Age in Swartz
Average fertility rate in Swartz is 14.0 births per 1,000 women. Women in the age bracket of 20 to 34 years have the highest fertility rate with 28.0 births per 1,000 women. Women in the age bracket of 20 to 34 years acount for 100.0% of all women with births.
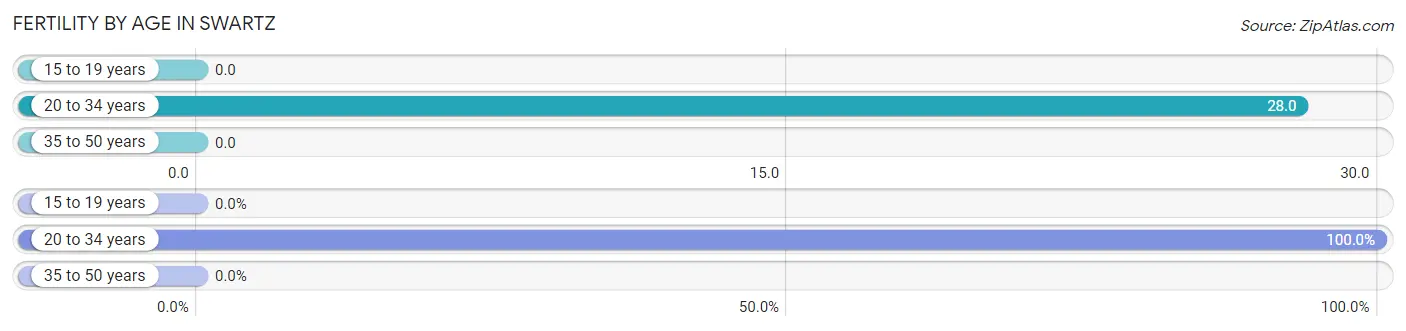
| Age Bracket | Women with Births | Births / 1,000 Women |
| 15 to 19 years | 0 (0.0%) | 0.0 |
| 20 to 34 years | 15 (100.0%) | 28.0 |
| 35 to 50 years | 0 (0.0%) | 0.0 |
| Total | 15 (100.0%) | 14.0 |
Fertility by Age by Marriage Status in Swartz
66.7% of women with births (15) in Swartz are married. The highest percentage of unmarried women with births falls into 20 to 34 years age bracket with 33.3% of them unmarried at the time of birth, while the lowest percentage of unmarried women with births belong to 20 to 34 years age bracket with 33.3% of them unmarried.
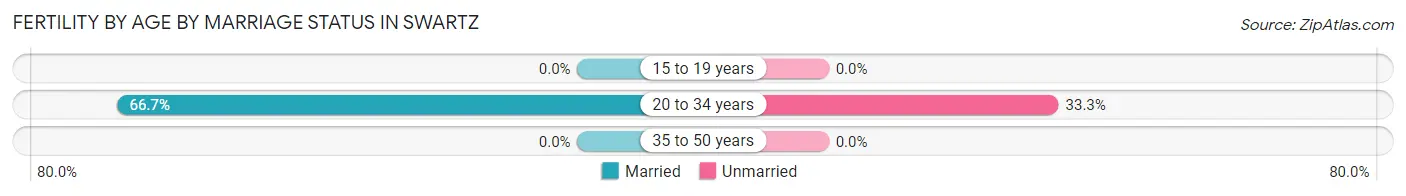
| Age Bracket | Married | Unmarried |
| 15 to 19 years | 0 (0.0%) | 0 (0.0%) |
| 20 to 34 years | 10 (66.7%) | 5 (33.3%) |
| 35 to 50 years | 0 (0.0%) | 0 (0.0%) |
| Total | 10 (66.7%) | 5 (33.3%) |
Fertility by Education in Swartz
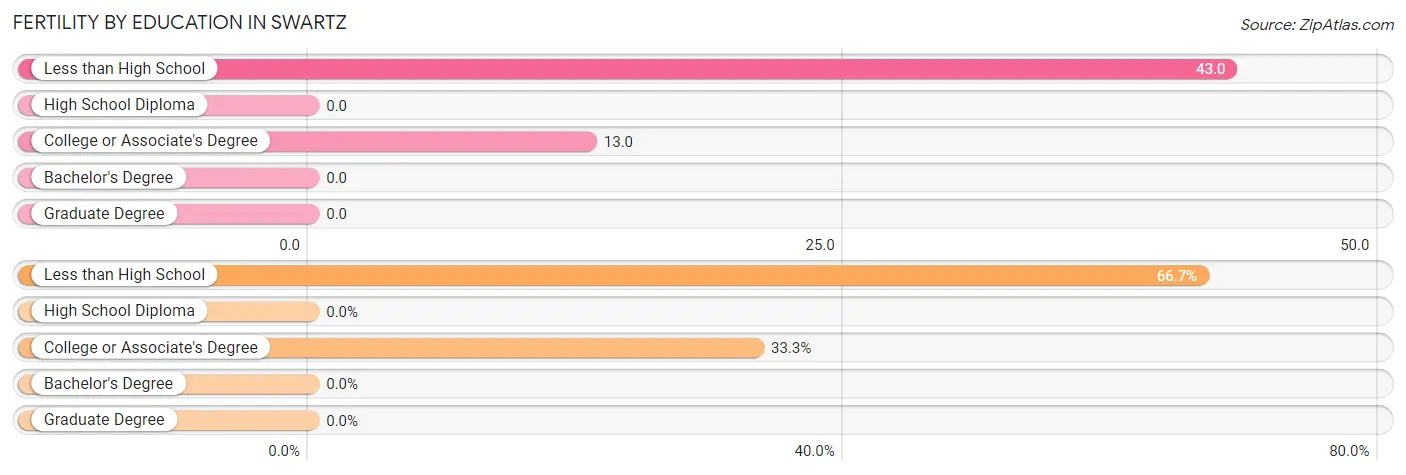
| Educational Attainment | Women with Births | Births / 1,000 Women |
| Less than High School | 10 (66.7%) | 43.0 |
| High School Diploma | 0 (0.0%) | 0.0 |
| College or Associate's Degree | 5 (33.3%) | 13.0 |
| Bachelor's Degree | 0 (0.0%) | 0.0 |
| Graduate Degree | 0 (0.0%) | 0.0 |
| Total | 15 (100.0%) | 14.0 |
Fertility by Education by Marriage Status in Swartz
33.3% of women with births in Swartz are unmarried. Women with the educational attainment of less than high school are most likely to be married with 100.0% of them married at childbirth, while women with the educational attainment of college or associate's degree are least likely to be married with 100.0% of them unmarried at childbirth.
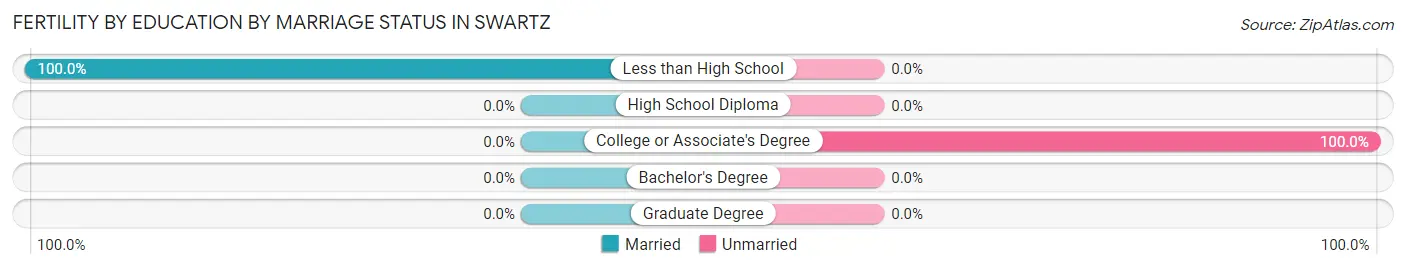
| Educational Attainment | Married | Unmarried |
| Less than High School | 10 (100.0%) | 0 (0.0%) |
| High School Diploma | 0 (0.0%) | 0 (0.0%) |
| College or Associate's Degree | 0 (0.0%) | 5 (100.0%) |
| Bachelor's Degree | 0 (0.0%) | 0 (0.0%) |
| Graduate Degree | 0 (0.0%) | 0 (0.0%) |
| Total | 10 (66.7%) | 5 (33.3%) |
Employment Characteristics in Swartz
Employment by Class of Employer in Swartz
Among the 2,240 employed individuals in Swartz, private company employees (1,638 | 73.1%), state government employees (217 | 9.7%), and not-for-profit organizations (200 | 8.9%) make up the most common classes of employment.
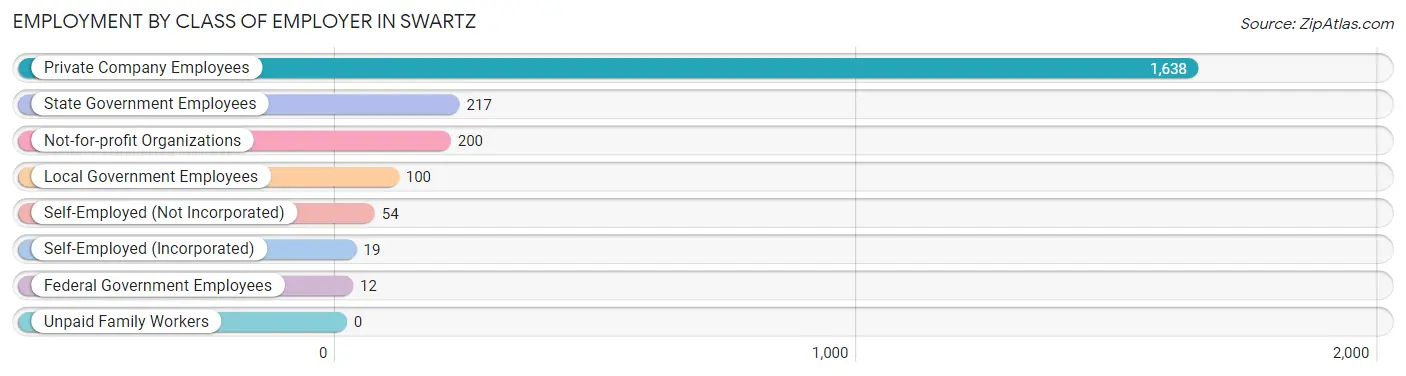
| Employer Class | # Employees | % Employees |
| Private Company Employees | 1,638 | 73.1% |
| Self-Employed (Incorporated) | 19 | 0.9% |
| Self-Employed (Not Incorporated) | 54 | 2.4% |
| Not-for-profit Organizations | 200 | 8.9% |
| Local Government Employees | 100 | 4.5% |
| State Government Employees | 217 | 9.7% |
| Federal Government Employees | 12 | 0.5% |
| Unpaid Family Workers | 0 | 0.0% |
| Total | 2,240 | 100.0% |
Employment Status by Age in Swartz
According to the labor force statistics for Swartz, out of the total population over 16 years of age (3,846), 59.8% or 2,300 individuals are in the labor force, with 0.4% or 9 of them unemployed. The age group with the highest labor force participation rate is 55 to 59 years, with 97.7% or 173 individuals in the labor force. Within the labor force, the 65 to 74 years age range has the highest percentage of unemployed individuals, with 5.8% or 9 of them being unemployed.
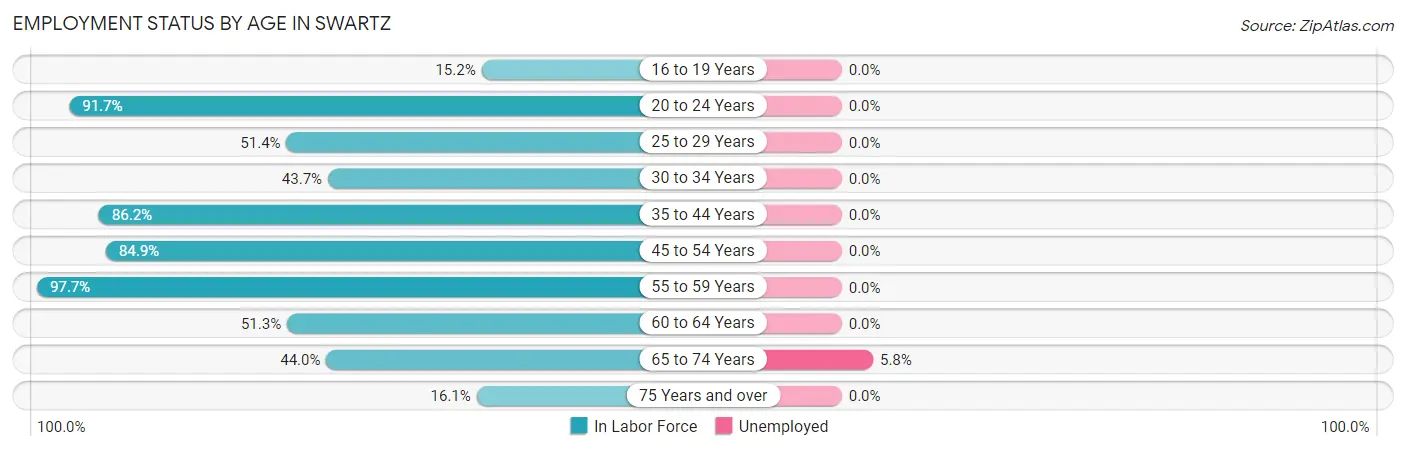
| Age Bracket | In Labor Force | Unemployed |
| 16 to 19 Years | 41 (15.2%) | 0 (0.0%) |
| 20 to 24 Years | 266 (91.7%) | 0 (0.0%) |
| 25 to 29 Years | 306 (51.4%) | 0 (0.0%) |
| 30 to 34 Years | 167 (43.7%) | 0 (0.0%) |
| 35 to 44 Years | 445 (86.2%) | 0 (0.0%) |
| 45 to 54 Years | 501 (84.9%) | 0 (0.0%) |
| 55 to 59 Years | 173 (97.7%) | 0 (0.0%) |
| 60 to 64 Years | 201 (51.3%) | 0 (0.0%) |
| 65 to 74 Years | 154 (44.0%) | 9 (5.8%) |
| 75 Years and over | 46 (16.1%) | 0 (0.0%) |
| Total | 2,300 (59.8%) | 9 (0.4%) |
Employment Status by Educational Attainment in Swartz
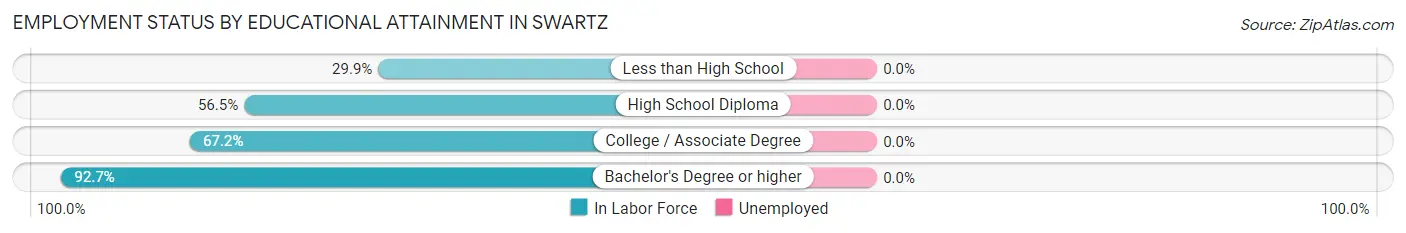
| Educational Attainment | In Labor Force | Unemployed |
| Less than High School | 58 (29.9%) | 0 (0.0%) |
| High School Diploma | 458 (56.5%) | 0 (0.0%) |
| College / Associate Degree | 657 (67.2%) | 0 (0.0%) |
| Bachelor's Degree or higher | 620 (92.7%) | 0 (0.0%) |
| Total | 1,793 (67.6%) | 0 (0.0%) |
Employment Occupations by Sex in Swartz
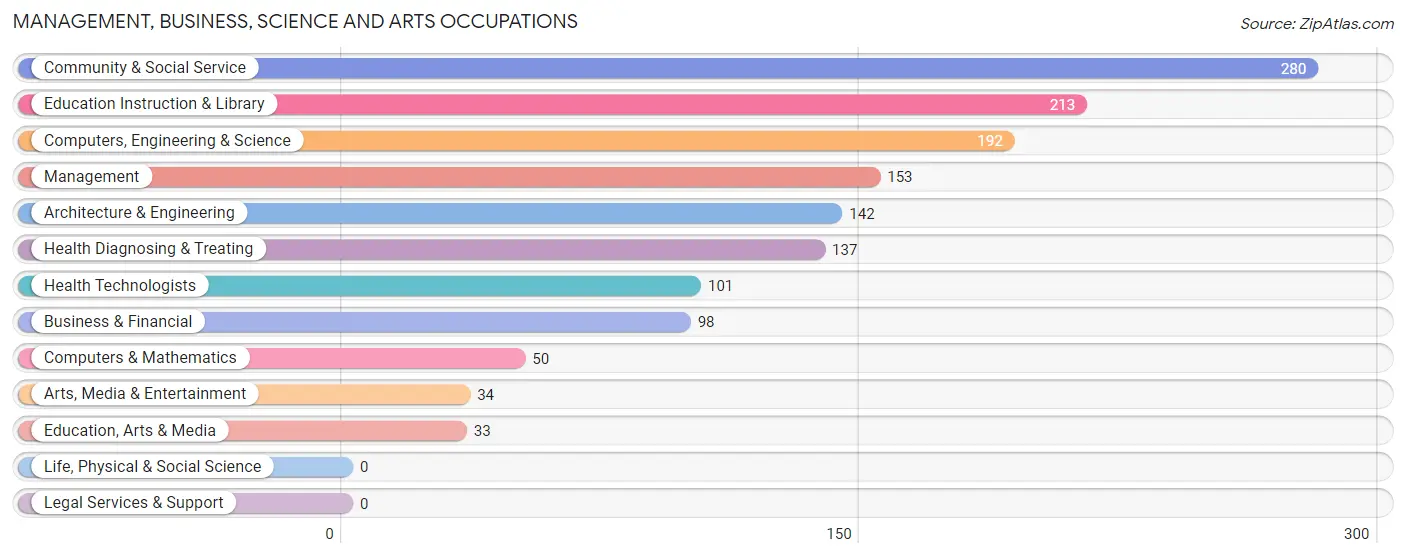
Management, Business, Science and Arts Occupations
The most common Management, Business, Science and Arts occupations in Swartz are Community & Social Service (280 | 12.2%), Education Instruction & Library (213 | 9.3%), Computers, Engineering & Science (192 | 8.4%), Management (153 | 6.7%), and Architecture & Engineering (142 | 6.2%).
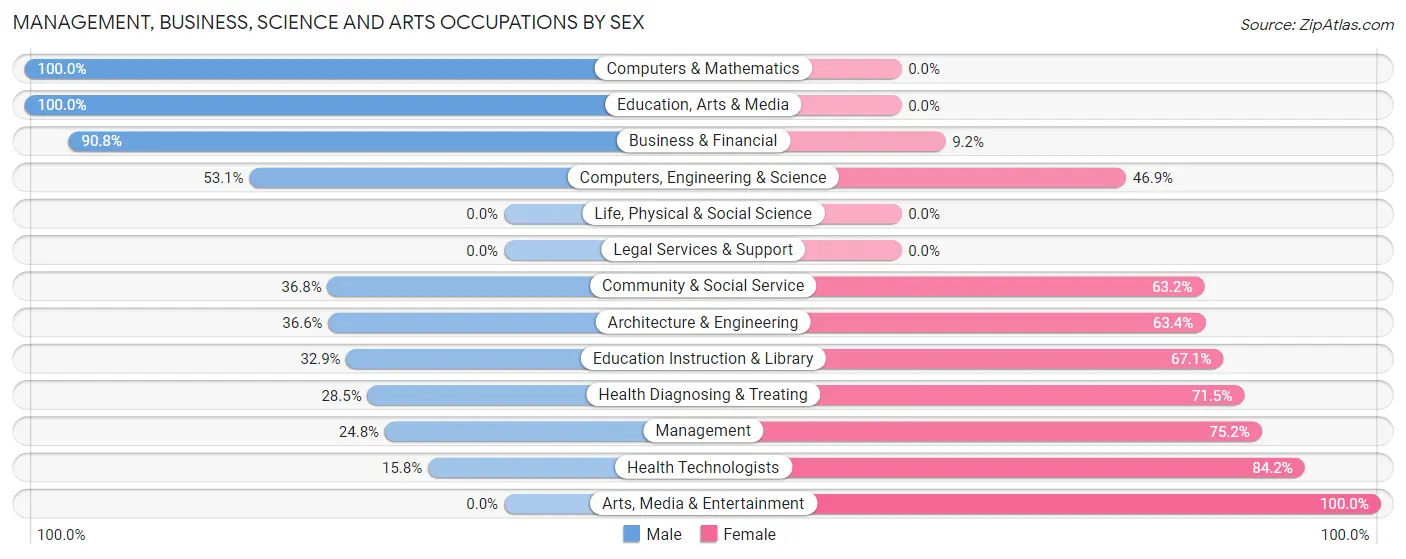
Management, Business, Science and Arts Occupations by Sex
Within the Management, Business, Science and Arts occupations in Swartz, the most male-oriented occupations are Computers & Mathematics (100.0%), Education, Arts & Media (100.0%), and Business & Financial (90.8%), while the most female-oriented occupations are Arts, Media & Entertainment (100.0%), Health Technologists (84.2%), and Management (75.2%).
| Occupation | Male | Female |
| Management | 38 (24.8%) | 115 (75.2%) |
| Business & Financial | 89 (90.8%) | 9 (9.2%) |
| Computers, Engineering & Science | 102 (53.1%) | 90 (46.9%) |
| Computers & Mathematics | 50 (100.0%) | 0 (0.0%) |
| Architecture & Engineering | 52 (36.6%) | 90 (63.4%) |
| Life, Physical & Social Science | 0 (0.0%) | 0 (0.0%) |
| Community & Social Service | 103 (36.8%) | 177 (63.2%) |
| Education, Arts & Media | 33 (100.0%) | 0 (0.0%) |
| Legal Services & Support | 0 (0.0%) | 0 (0.0%) |
| Education Instruction & Library | 70 (32.9%) | 143 (67.1%) |
| Arts, Media & Entertainment | 0 (0.0%) | 34 (100.0%) |
| Health Diagnosing & Treating | 39 (28.5%) | 98 (71.5%) |
| Health Technologists | 16 (15.8%) | 85 (84.2%) |
| Total (Category) | 371 (43.1%) | 489 (56.9%) |
| Total (Overall) | 1,164 (50.8%) | 1,127 (49.2%) |
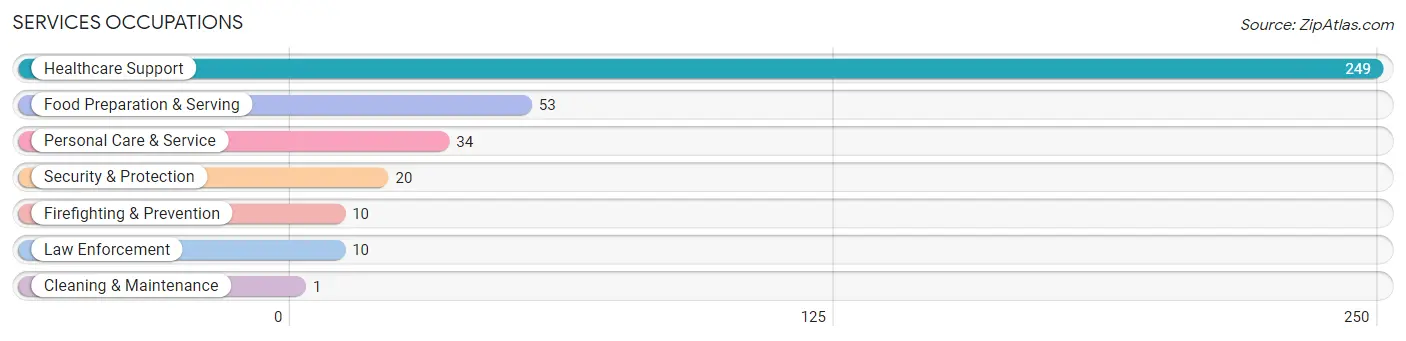
Services Occupations
The most common Services occupations in Swartz are Healthcare Support (249 | 10.9%), Food Preparation & Serving (53 | 2.3%), Personal Care & Service (34 | 1.5%), Security & Protection (20 | 0.9%), and Firefighting & Prevention (10 | 0.4%).
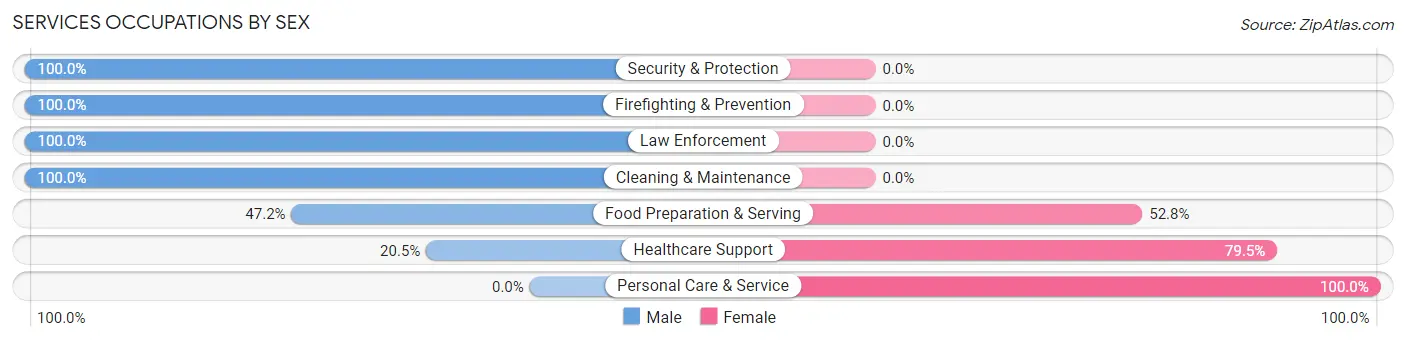
Services Occupations by Sex
Within the Services occupations in Swartz, the most male-oriented occupations are Security & Protection (100.0%), Firefighting & Prevention (100.0%), and Law Enforcement (100.0%), while the most female-oriented occupations are Personal Care & Service (100.0%), Healthcare Support (79.5%), and Food Preparation & Serving (52.8%).
| Occupation | Male | Female |
| Healthcare Support | 51 (20.5%) | 198 (79.5%) |
| Security & Protection | 20 (100.0%) | 0 (0.0%) |
| Firefighting & Prevention | 10 (100.0%) | 0 (0.0%) |
| Law Enforcement | 10 (100.0%) | 0 (0.0%) |
| Food Preparation & Serving | 25 (47.2%) | 28 (52.8%) |
| Cleaning & Maintenance | 1 (100.0%) | 0 (0.0%) |
| Personal Care & Service | 0 (0.0%) | 34 (100.0%) |
| Total (Category) | 97 (27.2%) | 260 (72.8%) |
| Total (Overall) | 1,164 (50.8%) | 1,127 (49.2%) |
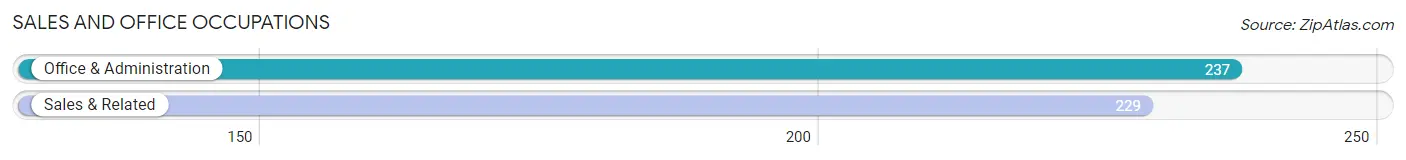
Sales and Office Occupations
The most common Sales and Office occupations in Swartz are Office & Administration (237 | 10.3%), and Sales & Related (229 | 10.0%).
Sales and Office Occupations by Sex
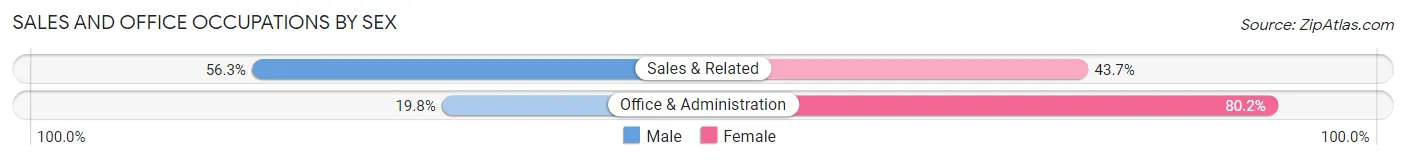
| Occupation | Male | Female |
| Sales & Related | 129 (56.3%) | 100 (43.7%) |
| Office & Administration | 47 (19.8%) | 190 (80.2%) |
| Total (Category) | 176 (37.8%) | 290 (62.2%) |
| Total (Overall) | 1,164 (50.8%) | 1,127 (49.2%) |
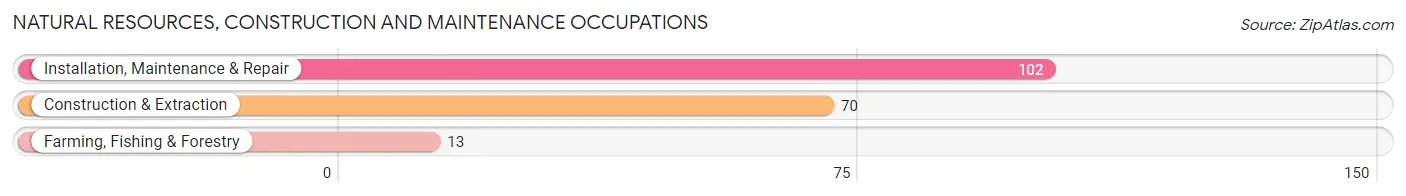
Natural Resources, Construction and Maintenance Occupations
The most common Natural Resources, Construction and Maintenance occupations in Swartz are Installation, Maintenance & Repair (102 | 4.4%), Construction & Extraction (70 | 3.1%), and Farming, Fishing & Forestry (13 | 0.6%).
Natural Resources, Construction and Maintenance Occupations by Sex
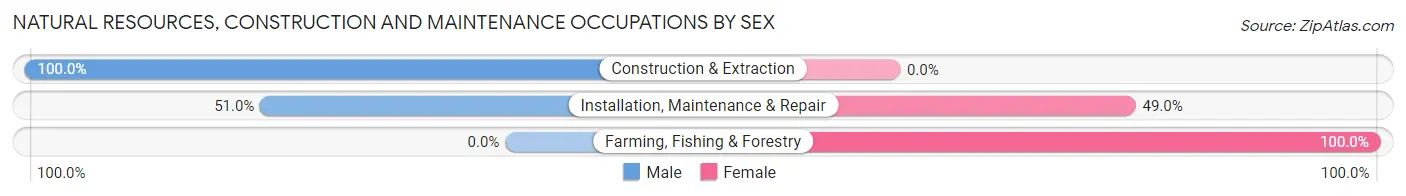
| Occupation | Male | Female |
| Farming, Fishing & Forestry | 0 (0.0%) | 13 (100.0%) |
| Construction & Extraction | 70 (100.0%) | 0 (0.0%) |
| Installation, Maintenance & Repair | 52 (51.0%) | 50 (49.0%) |
| Total (Category) | 122 (65.9%) | 63 (34.1%) |
| Total (Overall) | 1,164 (50.8%) | 1,127 (49.2%) |
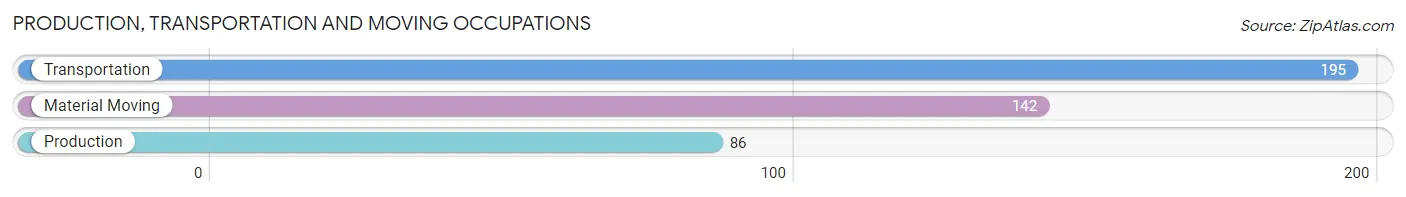
Production, Transportation and Moving Occupations
The most common Production, Transportation and Moving occupations in Swartz are Transportation (195 | 8.5%), Material Moving (142 | 6.2%), and Production (86 | 3.7%).
Production, Transportation and Moving Occupations by Sex
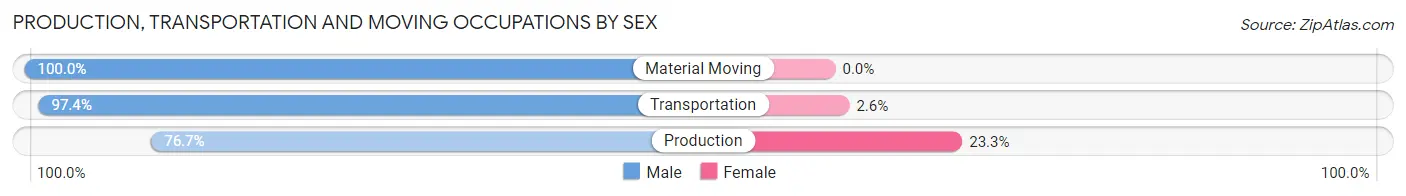
| Occupation | Male | Female |
| Production | 66 (76.7%) | 20 (23.3%) |
| Transportation | 190 (97.4%) | 5 (2.6%) |
| Material Moving | 142 (100.0%) | 0 (0.0%) |
| Total (Category) | 398 (94.1%) | 25 (5.9%) |
| Total (Overall) | 1,164 (50.8%) | 1,127 (49.2%) |
Employment Industries by Sex in Swartz
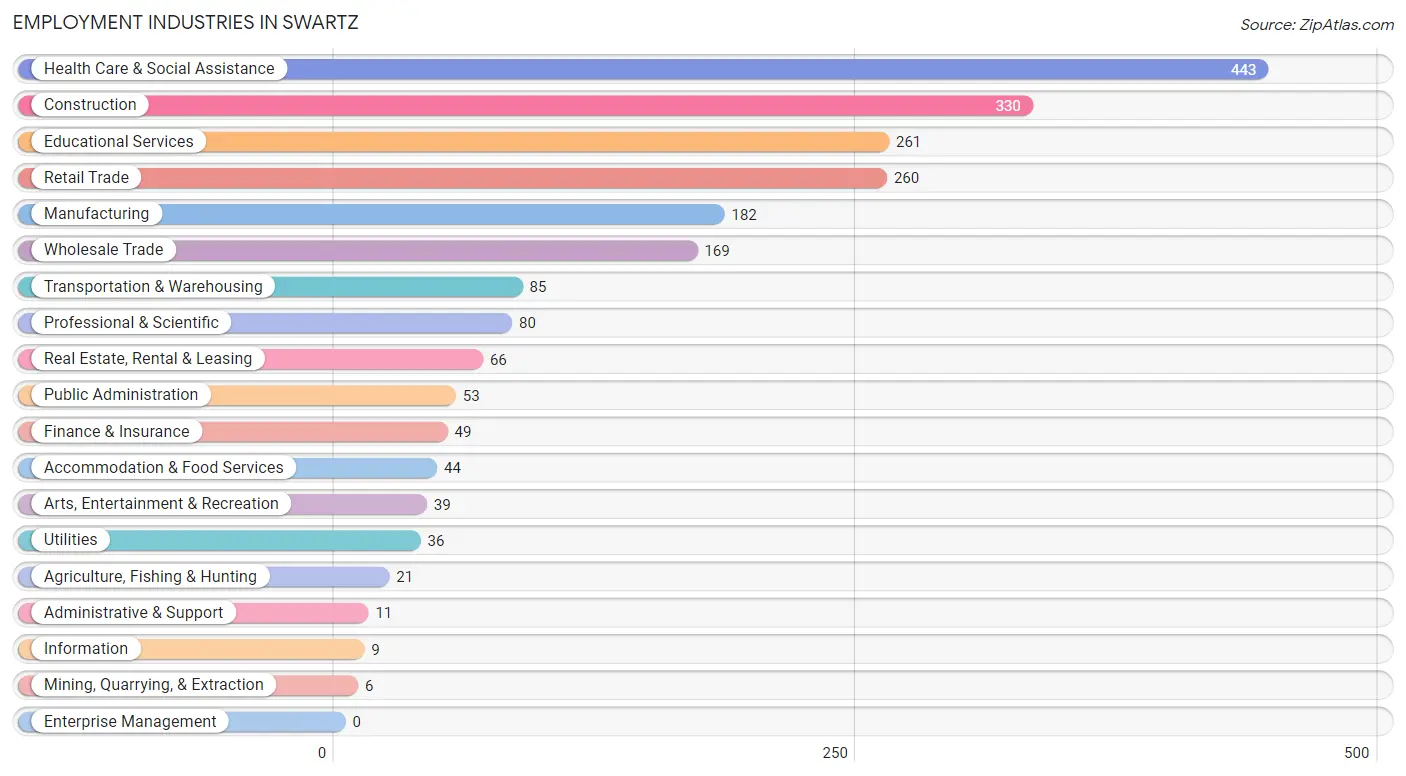
Employment Industries in Swartz
The major employment industries in Swartz include Health Care & Social Assistance (443 | 19.3%), Construction (330 | 14.4%), Educational Services (261 | 11.4%), Retail Trade (260 | 11.4%), and Manufacturing (182 | 7.9%).
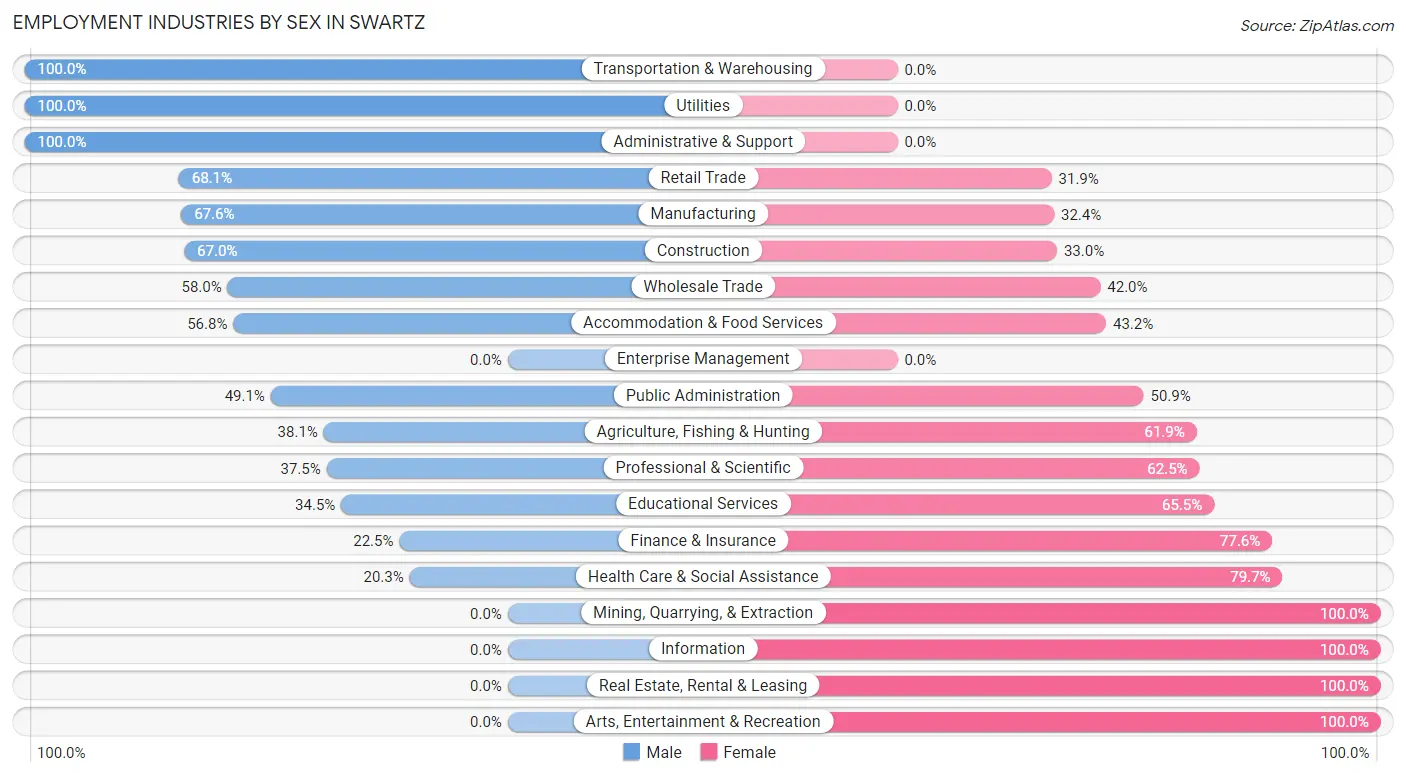
Employment Industries by Sex in Swartz
The Swartz industries that see more men than women are Transportation & Warehousing (100.0%), Utilities (100.0%), and Administrative & Support (100.0%), whereas the industries that tend to have a higher number of women are Mining, Quarrying, & Extraction (100.0%), Information (100.0%), and Real Estate, Rental & Leasing (100.0%).
| Industry | Male | Female |
| Agriculture, Fishing & Hunting | 8 (38.1%) | 13 (61.9%) |
| Mining, Quarrying, & Extraction | 0 (0.0%) | 6 (100.0%) |
| Construction | 221 (67.0%) | 109 (33.0%) |
| Manufacturing | 123 (67.6%) | 59 (32.4%) |
| Wholesale Trade | 98 (58.0%) | 71 (42.0%) |
| Retail Trade | 177 (68.1%) | 83 (31.9%) |
| Transportation & Warehousing | 85 (100.0%) | 0 (0.0%) |
| Utilities | 36 (100.0%) | 0 (0.0%) |
| Information | 0 (0.0%) | 9 (100.0%) |
| Finance & Insurance | 11 (22.5%) | 38 (77.5%) |
| Real Estate, Rental & Leasing | 0 (0.0%) | 66 (100.0%) |
| Professional & Scientific | 30 (37.5%) | 50 (62.5%) |
| Enterprise Management | 0 (0.0%) | 0 (0.0%) |
| Administrative & Support | 11 (100.0%) | 0 (0.0%) |
| Educational Services | 90 (34.5%) | 171 (65.5%) |
| Health Care & Social Assistance | 90 (20.3%) | 353 (79.7%) |
| Arts, Entertainment & Recreation | 0 (0.0%) | 39 (100.0%) |
| Accommodation & Food Services | 25 (56.8%) | 19 (43.2%) |
| Public Administration | 26 (49.1%) | 27 (50.9%) |
| Total | 1,164 (50.8%) | 1,127 (49.2%) |
Education in Swartz
School Enrollment in Swartz
The most common levels of schooling among the 1,124 students in Swartz are elementary school (322 | 28.6%), middle school (282 | 25.1%), and high school (265 | 23.6%).
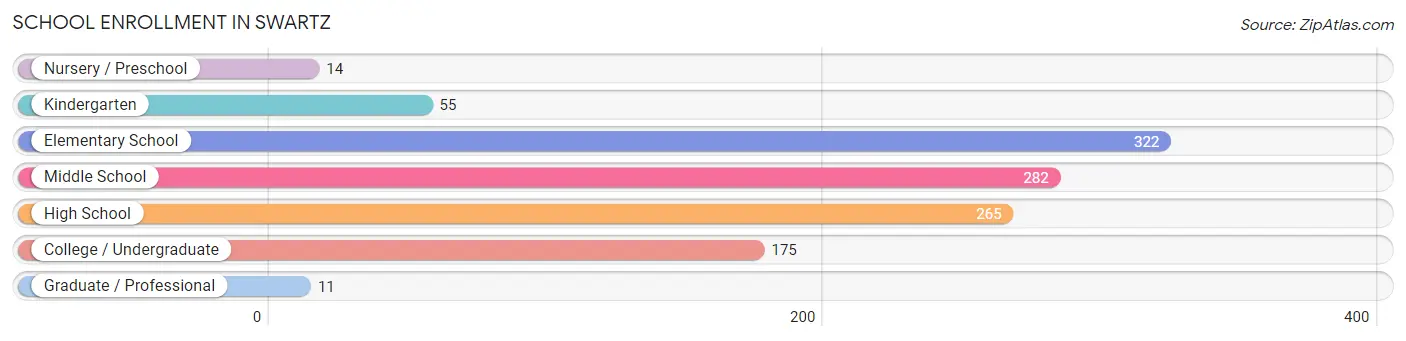
| School Level | # Students | % Students |
| Nursery / Preschool | 14 | 1.3% |
| Kindergarten | 55 | 4.9% |
| Elementary School | 322 | 28.6% |
| Middle School | 282 | 25.1% |
| High School | 265 | 23.6% |
| College / Undergraduate | 175 | 15.6% |
| Graduate / Professional | 11 | 1.0% |
| Total | 1,124 | 100.0% |
School Enrollment by Age by Funding Source in Swartz
Out of a total of 1,124 students who are enrolled in schools in Swartz, 193 (17.2%) attend a private institution, while the remaining 931 (82.8%) are enrolled in public schools. The age group of 15 to 17 year olds has the highest likelihood of being enrolled in private schools, with 49 (28.2% in the age bracket) enrolled. Conversely, the age group of 3 to 4 year olds has the lowest likelihood of being enrolled in a private school, with 14 (100.0% in the age bracket) attending a public institution.
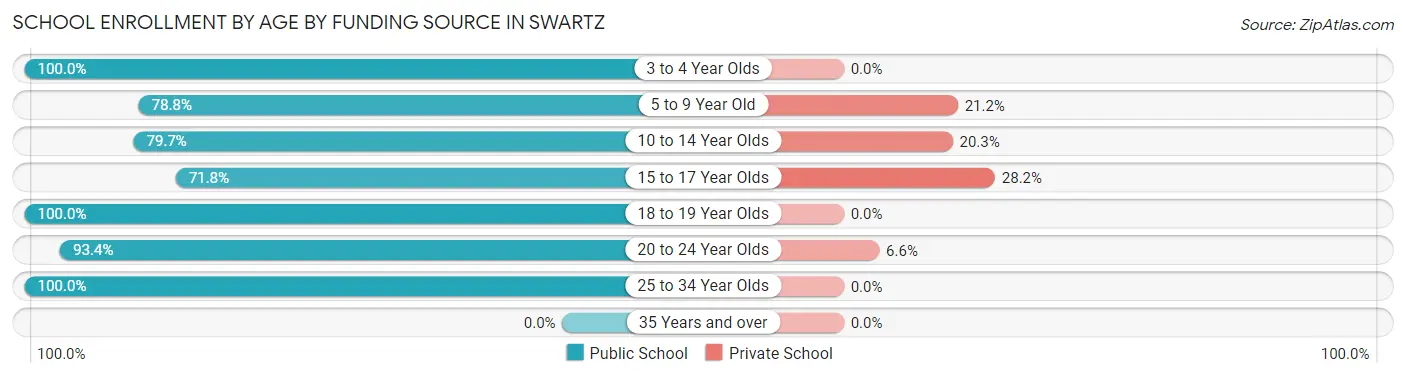
| Age Bracket | Public School | Private School |
| 3 to 4 Year Olds | 14 (100.0%) | 0 (0.0%) |
| 5 to 9 Year Old | 178 (78.8%) | 48 (21.2%) |
| 10 to 14 Year Olds | 346 (79.7%) | 88 (20.3%) |
| 15 to 17 Year Olds | 125 (71.8%) | 49 (28.2%) |
| 18 to 19 Year Olds | 124 (100.0%) | 0 (0.0%) |
| 20 to 24 Year Olds | 113 (93.4%) | 8 (6.6%) |
| 25 to 34 Year Olds | 31 (100.0%) | 0 (0.0%) |
| 35 Years and over | 0 (0.0%) | 0 (0.0%) |
| Total | 931 (82.8%) | 193 (17.2%) |
Educational Attainment by Field of Study in Swartz
Education (309 | 30.1%), business (160 | 15.6%), science & technology (145 | 14.1%), arts & humanities (117 | 11.4%), and liberal arts & history (92 | 9.0%) are the most common fields of study among 1,025 individuals in Swartz who have obtained a bachelor's degree or higher.
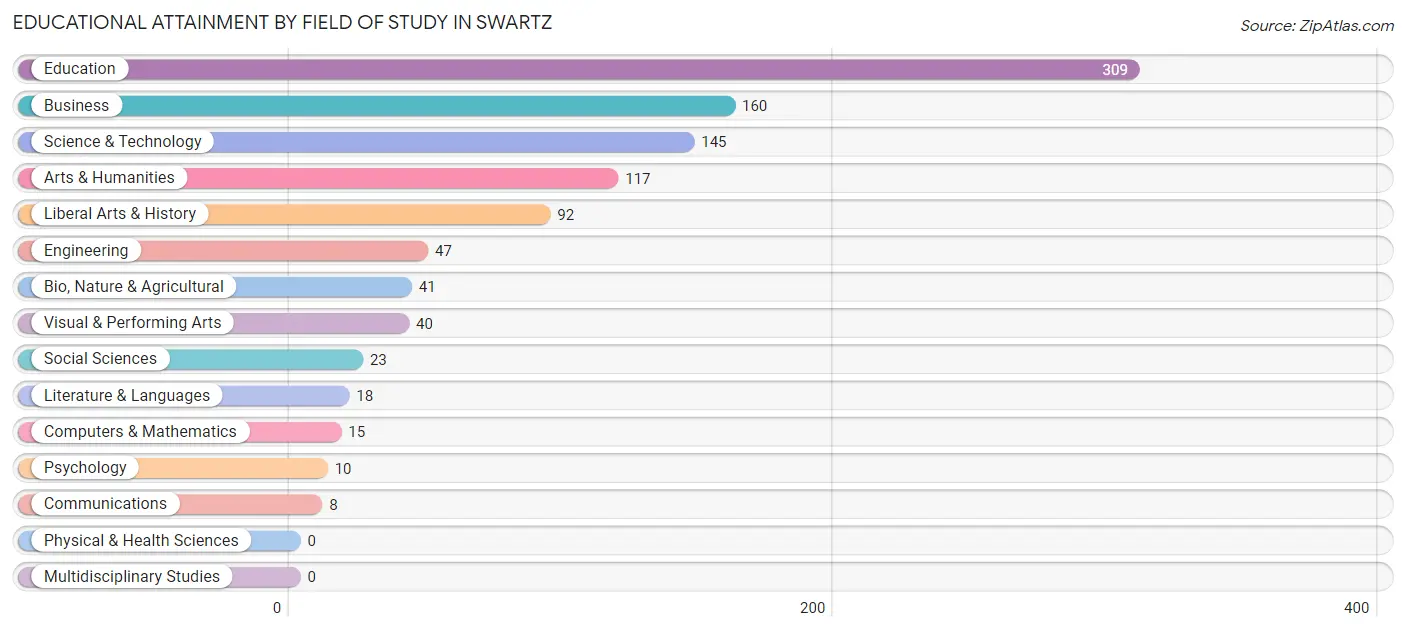
| Field of Study | # Graduates | % Graduates |
| Computers & Mathematics | 15 | 1.5% |
| Bio, Nature & Agricultural | 41 | 4.0% |
| Physical & Health Sciences | 0 | 0.0% |
| Psychology | 10 | 1.0% |
| Social Sciences | 23 | 2.2% |
| Engineering | 47 | 4.6% |
| Multidisciplinary Studies | 0 | 0.0% |
| Science & Technology | 145 | 14.1% |
| Business | 160 | 15.6% |
| Education | 309 | 30.1% |
| Literature & Languages | 18 | 1.8% |
| Liberal Arts & History | 92 | 9.0% |
| Visual & Performing Arts | 40 | 3.9% |
| Communications | 8 | 0.8% |
| Arts & Humanities | 117 | 11.4% |
| Total | 1,025 | 100.0% |
Transportation & Commute in Swartz
Vehicle Availability by Sex in Swartz
The most prevalent vehicle ownership categories in Swartz are males with 2 vehicles (373, accounting for 33.4%) and females with 2 vehicles (357, making up 33.3%).
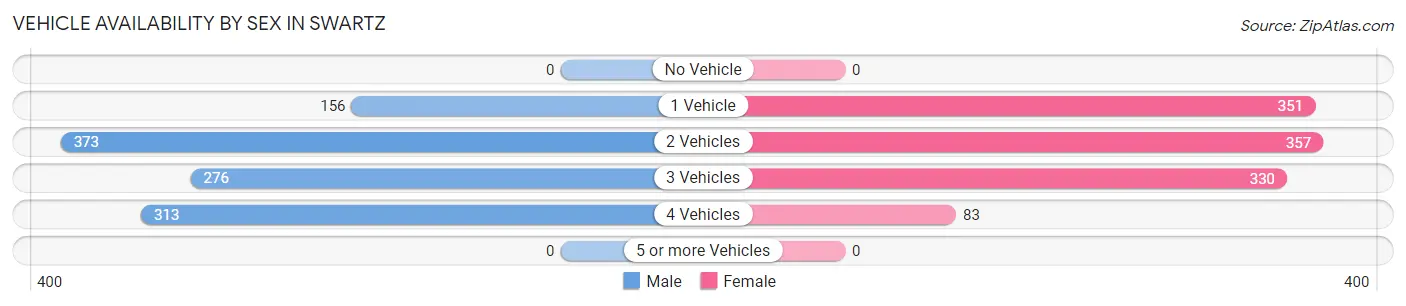
| Vehicles Available | Male | Female |
| No Vehicle | 0 (0.0%) | 0 (0.0%) |
| 1 Vehicle | 156 (14.0%) | 351 (31.3%) |
| 2 Vehicles | 373 (33.4%) | 357 (31.9%) |
| 3 Vehicles | 276 (24.7%) | 330 (29.4%) |
| 4 Vehicles | 313 (28.0%) | 83 (7.4%) |
| 5 or more Vehicles | 0 (0.0%) | 0 (0.0%) |
| Total | 1,118 (100.0%) | 1,121 (100.0%) |
Commute Time in Swartz
The most frequently occuring commute durations in Swartz are 20 to 24 minutes (612 commuters, 28.1%), 25 to 29 minutes (346 commuters, 15.9%), and 15 to 19 minutes (341 commuters, 15.6%).
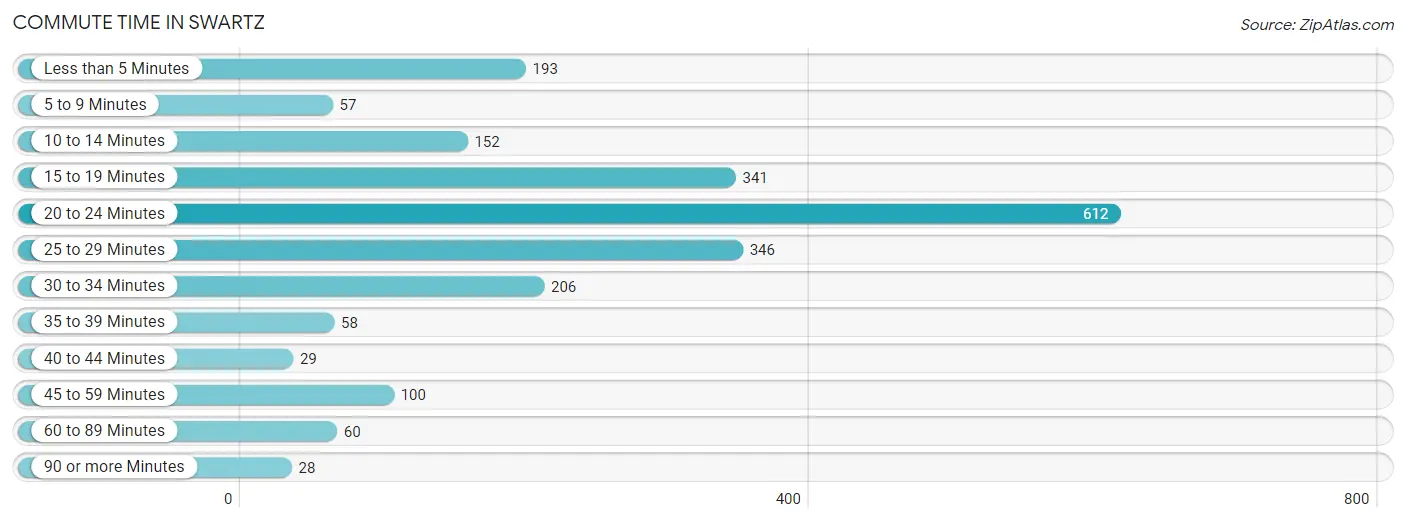
| Commute Time | # Commuters | % Commuters |
| Less than 5 Minutes | 193 | 8.8% |
| 5 to 9 Minutes | 57 | 2.6% |
| 10 to 14 Minutes | 152 | 7.0% |
| 15 to 19 Minutes | 341 | 15.6% |
| 20 to 24 Minutes | 612 | 28.1% |
| 25 to 29 Minutes | 346 | 15.9% |
| 30 to 34 Minutes | 206 | 9.4% |
| 35 to 39 Minutes | 58 | 2.7% |
| 40 to 44 Minutes | 29 | 1.3% |
| 45 to 59 Minutes | 100 | 4.6% |
| 60 to 89 Minutes | 60 | 2.8% |
| 90 or more Minutes | 28 | 1.3% |
Commute Time by Sex in Swartz
The most common commute times in Swartz are 20 to 24 minutes (327 commuters, 29.2%) for males and 20 to 24 minutes (285 commuters, 26.8%) for females.
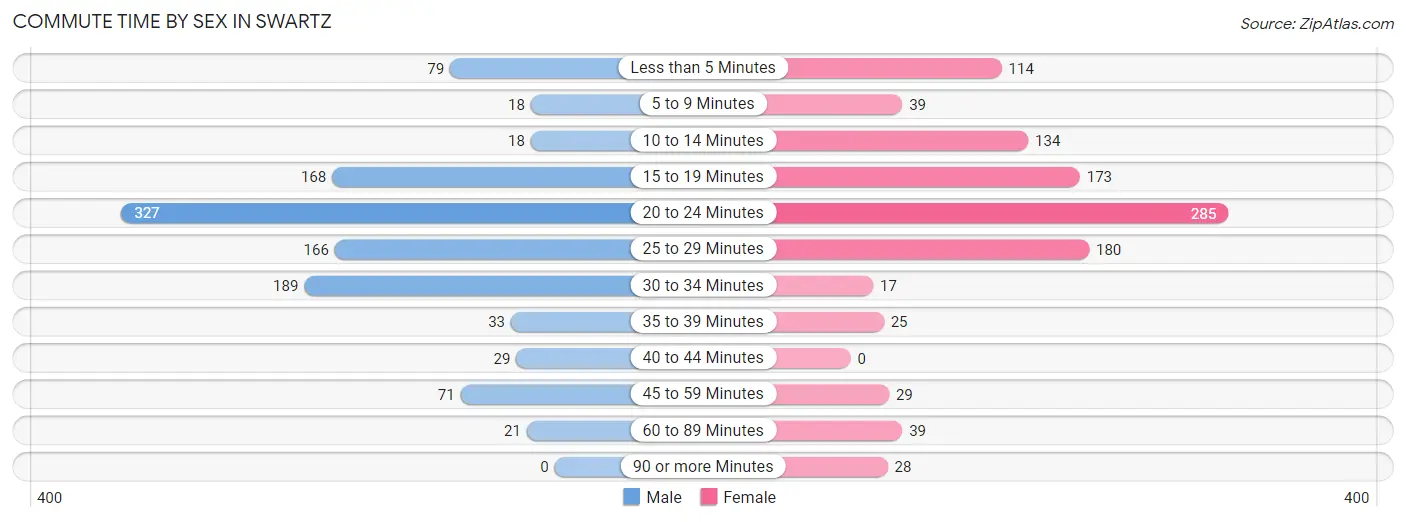
| Commute Time | Male | Female |
| Less than 5 Minutes | 79 (7.1%) | 114 (10.7%) |
| 5 to 9 Minutes | 18 (1.6%) | 39 (3.7%) |
| 10 to 14 Minutes | 18 (1.6%) | 134 (12.6%) |
| 15 to 19 Minutes | 168 (15.0%) | 173 (16.3%) |
| 20 to 24 Minutes | 327 (29.2%) | 285 (26.8%) |
| 25 to 29 Minutes | 166 (14.8%) | 180 (16.9%) |
| 30 to 34 Minutes | 189 (16.9%) | 17 (1.6%) |
| 35 to 39 Minutes | 33 (2.9%) | 25 (2.4%) |
| 40 to 44 Minutes | 29 (2.6%) | 0 (0.0%) |
| 45 to 59 Minutes | 71 (6.3%) | 29 (2.7%) |
| 60 to 89 Minutes | 21 (1.9%) | 39 (3.7%) |
| 90 or more Minutes | 0 (0.0%) | 28 (2.6%) |
Time of Departure to Work by Sex in Swartz
The most frequent times of departure to work in Swartz are 6:00 AM to 6:29 AM (252, 22.5%) for males and 7:00 AM to 7:29 AM (336, 31.6%) for females.
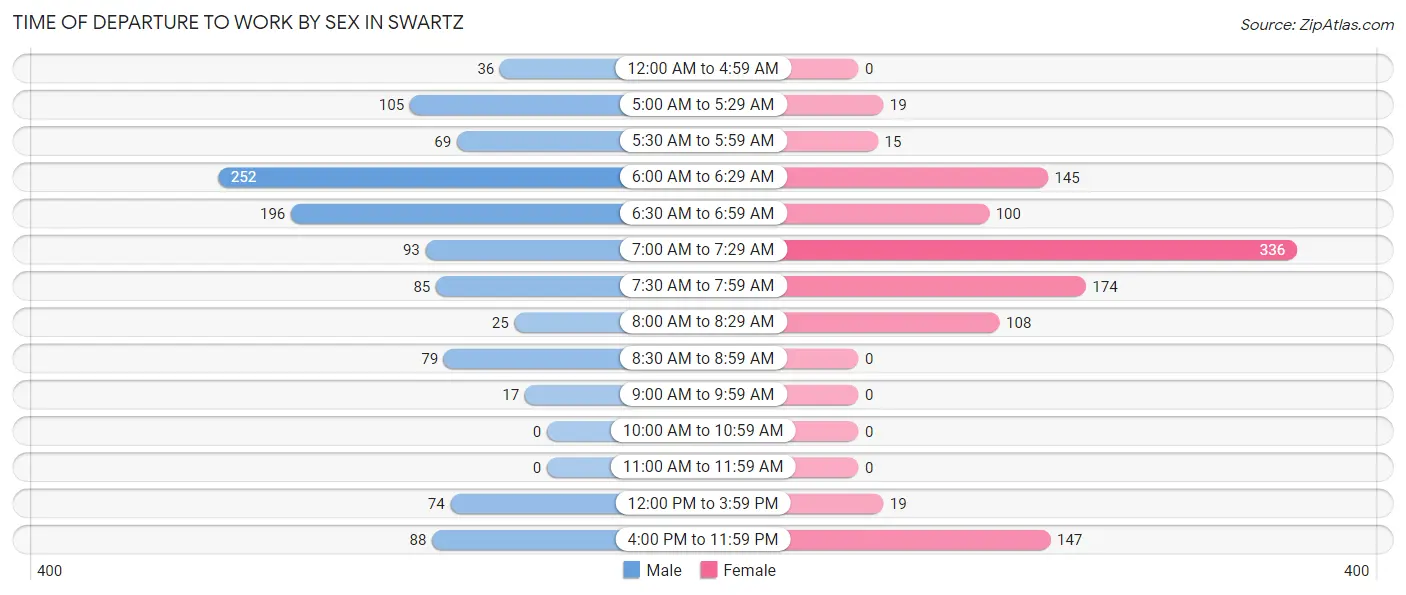
| Time of Departure | Male | Female |
| 12:00 AM to 4:59 AM | 36 (3.2%) | 0 (0.0%) |
| 5:00 AM to 5:29 AM | 105 (9.4%) | 19 (1.8%) |
| 5:30 AM to 5:59 AM | 69 (6.2%) | 15 (1.4%) |
| 6:00 AM to 6:29 AM | 252 (22.5%) | 145 (13.6%) |
| 6:30 AM to 6:59 AM | 196 (17.5%) | 100 (9.4%) |
| 7:00 AM to 7:29 AM | 93 (8.3%) | 336 (31.6%) |
| 7:30 AM to 7:59 AM | 85 (7.6%) | 174 (16.4%) |
| 8:00 AM to 8:29 AM | 25 (2.2%) | 108 (10.2%) |
| 8:30 AM to 8:59 AM | 79 (7.1%) | 0 (0.0%) |
| 9:00 AM to 9:59 AM | 17 (1.5%) | 0 (0.0%) |
| 10:00 AM to 10:59 AM | 0 (0.0%) | 0 (0.0%) |
| 11:00 AM to 11:59 AM | 0 (0.0%) | 0 (0.0%) |
| 12:00 PM to 3:59 PM | 74 (6.6%) | 19 (1.8%) |
| 4:00 PM to 11:59 PM | 88 (7.9%) | 147 (13.8%) |
| Total | 1,119 (100.0%) | 1,063 (100.0%) |
Housing Occupancy in Swartz
Occupancy by Ownership in Swartz
Of the total 1,615 dwellings in Swartz, owner-occupied units account for 1,298 (80.4%), while renter-occupied units make up 317 (19.6%).
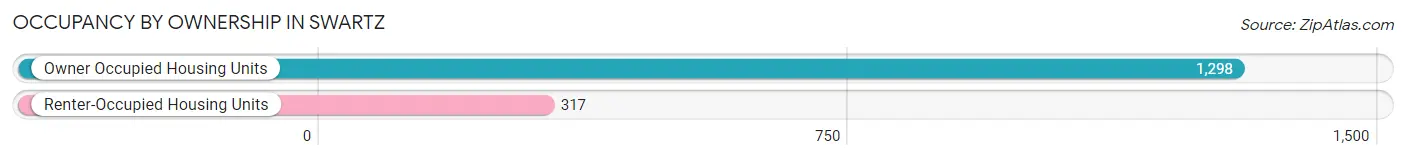
| Occupancy | # Housing Units | % Housing Units |
| Owner Occupied Housing Units | 1,298 | 80.4% |
| Renter-Occupied Housing Units | 317 | 19.6% |
| Total Occupied Housing Units | 1,615 | 100.0% |
Occupancy by Household Size in Swartz
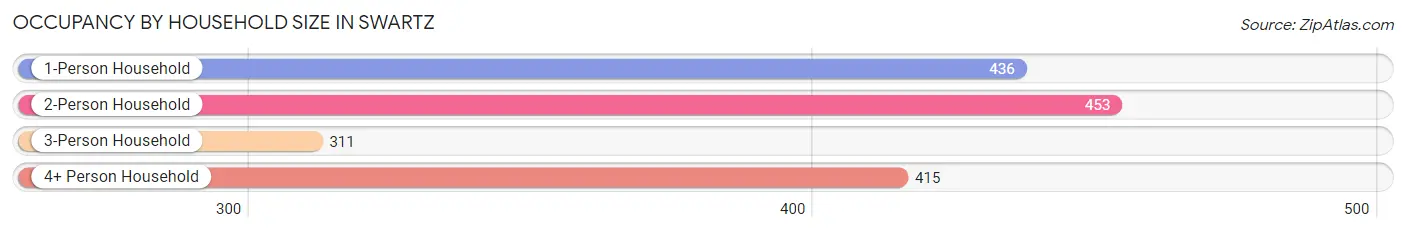
| Household Size | # Housing Units | % Housing Units |
| 1-Person Household | 436 | 27.0% |
| 2-Person Household | 453 | 28.1% |
| 3-Person Household | 311 | 19.3% |
| 4+ Person Household | 415 | 25.7% |
| Total Housing Units | 1,615 | 100.0% |
Occupancy by Ownership by Household Size in Swartz
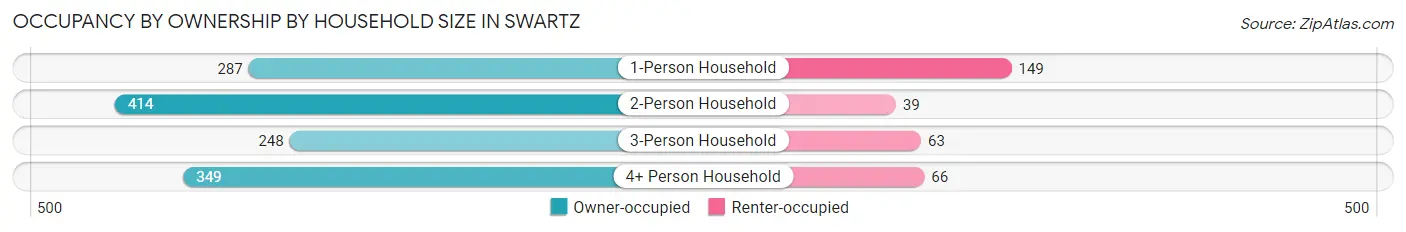
| Household Size | Owner-occupied | Renter-occupied |
| 1-Person Household | 287 (65.8%) | 149 (34.2%) |
| 2-Person Household | 414 (91.4%) | 39 (8.6%) |
| 3-Person Household | 248 (79.7%) | 63 (20.3%) |
| 4+ Person Household | 349 (84.1%) | 66 (15.9%) |
| Total Housing Units | 1,298 (80.4%) | 317 (19.6%) |
Occupancy by Educational Attainment in Swartz
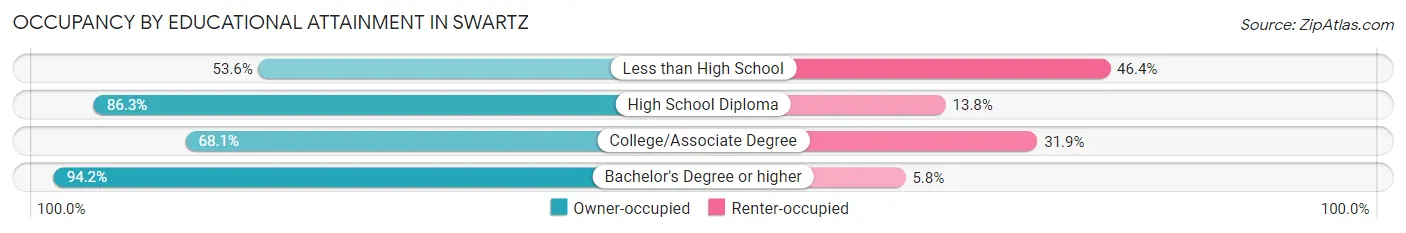
| Household Size | Owner-occupied | Renter-occupied |
| Less than High School | 52 (53.6%) | 45 (46.4%) |
| High School Diploma | 370 (86.3%) | 59 (13.8%) |
| College/Associate Degree | 390 (68.1%) | 183 (31.9%) |
| Bachelor's Degree or higher | 486 (94.2%) | 30 (5.8%) |
Occupancy by Age of Householder in Swartz
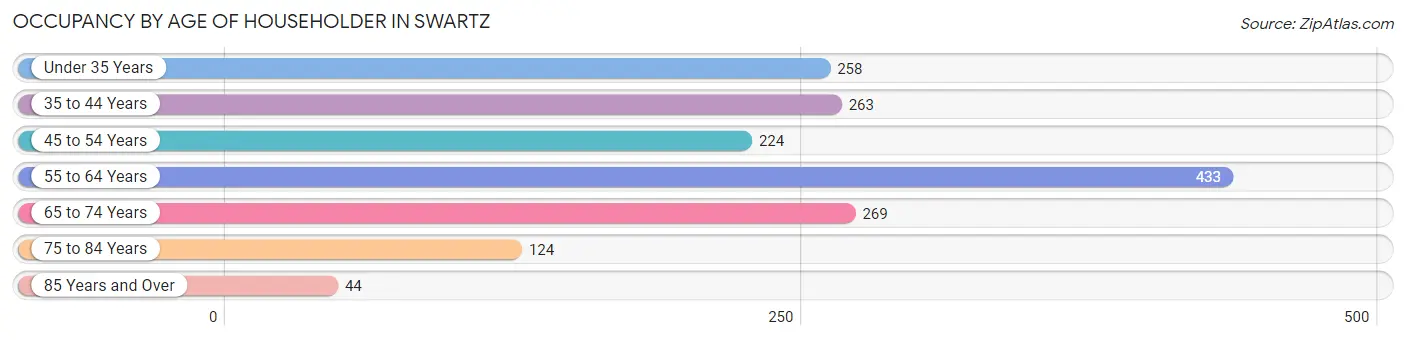
| Age Bracket | # Households | % Households |
| Under 35 Years | 258 | 16.0% |
| 35 to 44 Years | 263 | 16.3% |
| 45 to 54 Years | 224 | 13.9% |
| 55 to 64 Years | 433 | 26.8% |
| 65 to 74 Years | 269 | 16.7% |
| 75 to 84 Years | 124 | 7.7% |
| 85 Years and Over | 44 | 2.7% |
| Total | 1,615 | 100.0% |
Housing Finances in Swartz
Median Income by Occupancy in Swartz
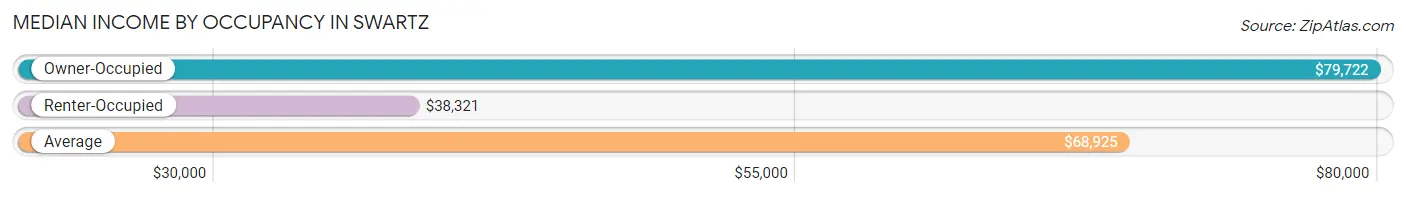
| Occupancy Type | # Households | Median Income |
| Owner-Occupied | 1,298 (80.4%) | $79,722 |
| Renter-Occupied | 317 (19.6%) | $38,321 |
| Average | 1,615 (100.0%) | $68,925 |
Occupancy by Householder Income Bracket in Swartz
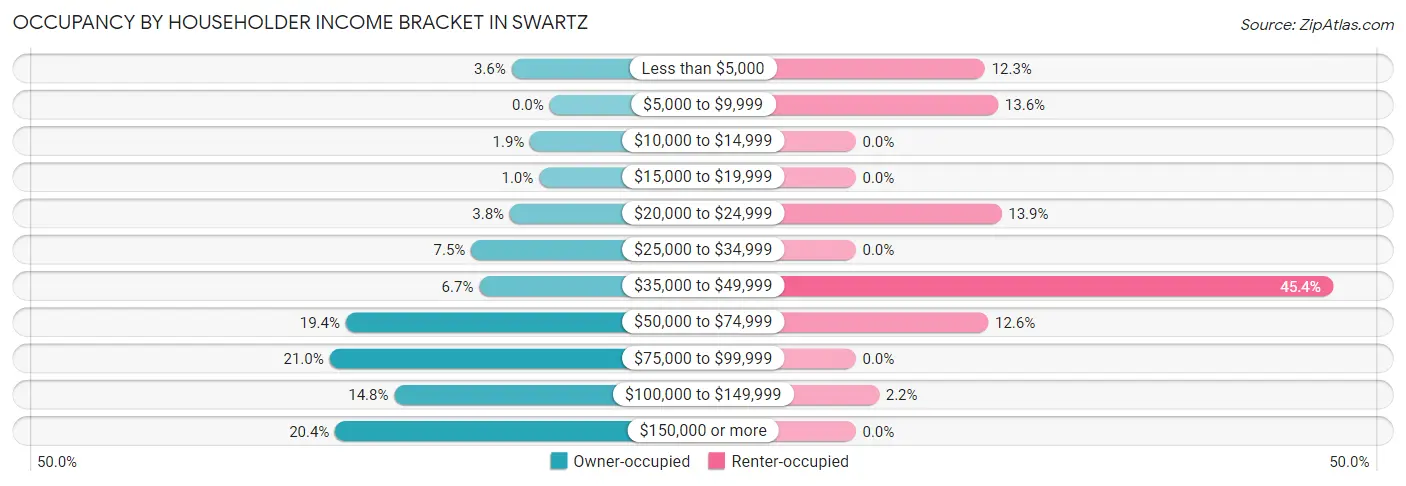
| Income Bracket | Owner-occupied | Renter-occupied |
| Less than $5,000 | 47 (3.6%) | 39 (12.3%) |
| $5,000 to $9,999 | 0 (0.0%) | 43 (13.6%) |
| $10,000 to $14,999 | 24 (1.8%) | 0 (0.0%) |
| $15,000 to $19,999 | 13 (1.0%) | 0 (0.0%) |
| $20,000 to $24,999 | 49 (3.8%) | 44 (13.9%) |
| $25,000 to $34,999 | 97 (7.5%) | 0 (0.0%) |
| $35,000 to $49,999 | 87 (6.7%) | 144 (45.4%) |
| $50,000 to $74,999 | 252 (19.4%) | 40 (12.6%) |
| $75,000 to $99,999 | 272 (21.0%) | 0 (0.0%) |
| $100,000 to $149,999 | 192 (14.8%) | 7 (2.2%) |
| $150,000 or more | 265 (20.4%) | 0 (0.0%) |
| Total | 1,298 (100.0%) | 317 (100.0%) |
Monthly Housing Cost Tiers in Swartz
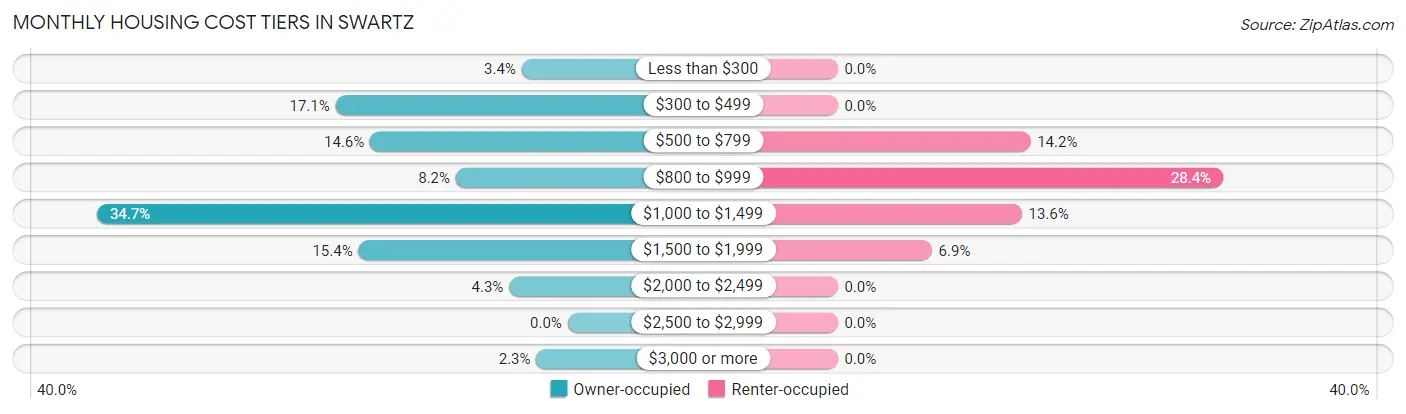
| Monthly Cost | Owner-occupied | Renter-occupied |
| Less than $300 | 44 (3.4%) | 0 (0.0%) |
| $300 to $499 | 222 (17.1%) | 0 (0.0%) |
| $500 to $799 | 189 (14.6%) | 45 (14.2%) |
| $800 to $999 | 107 (8.2%) | 90 (28.4%) |
| $1,000 to $1,499 | 450 (34.7%) | 43 (13.6%) |
| $1,500 to $1,999 | 200 (15.4%) | 22 (6.9%) |
| $2,000 to $2,499 | 56 (4.3%) | 0 (0.0%) |
| $2,500 to $2,999 | 0 (0.0%) | 0 (0.0%) |
| $3,000 or more | 30 (2.3%) | 0 (0.0%) |
| Total | 1,298 (100.0%) | 317 (100.0%) |
Physical Housing Characteristics in Swartz
Housing Structures in Swartz
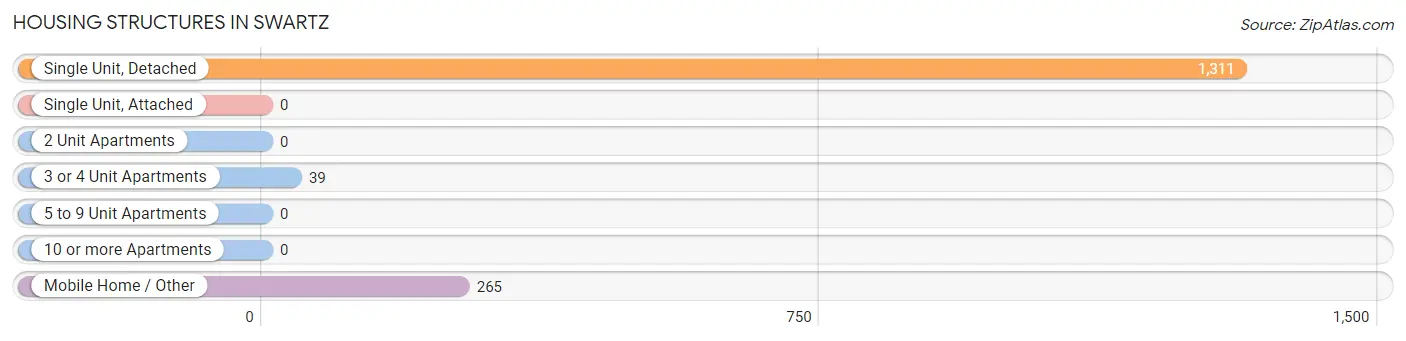
| Structure Type | # Housing Units | % Housing Units |
| Single Unit, Detached | 1,311 | 81.2% |
| Single Unit, Attached | 0 | 0.0% |
| 2 Unit Apartments | 0 | 0.0% |
| 3 or 4 Unit Apartments | 39 | 2.4% |
| 5 to 9 Unit Apartments | 0 | 0.0% |
| 10 or more Apartments | 0 | 0.0% |
| Mobile Home / Other | 265 | 16.4% |
| Total | 1,615 | 100.0% |
Housing Structures by Occupancy in Swartz
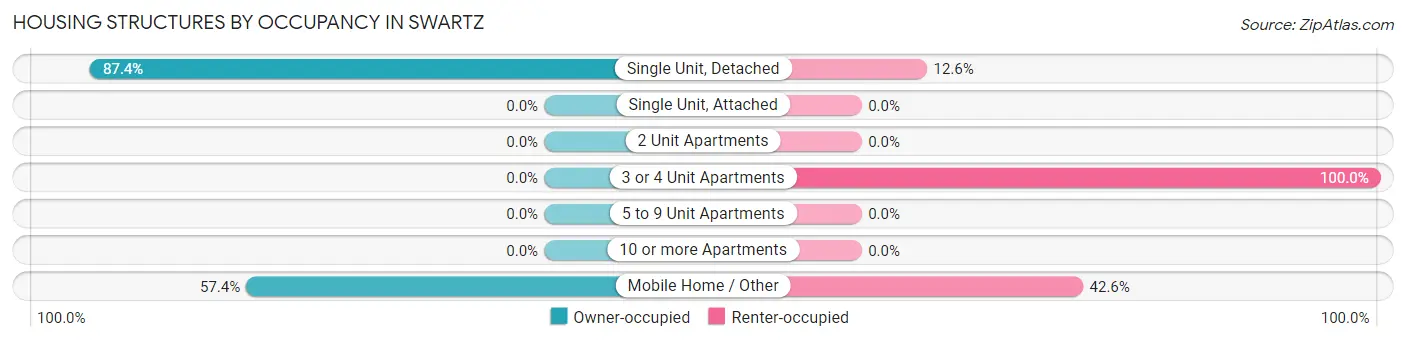
| Structure Type | Owner-occupied | Renter-occupied |
| Single Unit, Detached | 1,146 (87.4%) | 165 (12.6%) |
| Single Unit, Attached | 0 (0.0%) | 0 (0.0%) |
| 2 Unit Apartments | 0 (0.0%) | 0 (0.0%) |
| 3 or 4 Unit Apartments | 0 (0.0%) | 39 (100.0%) |
| 5 to 9 Unit Apartments | 0 (0.0%) | 0 (0.0%) |
| 10 or more Apartments | 0 (0.0%) | 0 (0.0%) |
| Mobile Home / Other | 152 (57.4%) | 113 (42.6%) |
| Total | 1,298 (80.4%) | 317 (19.6%) |
Housing Structures by Number of Rooms in Swartz
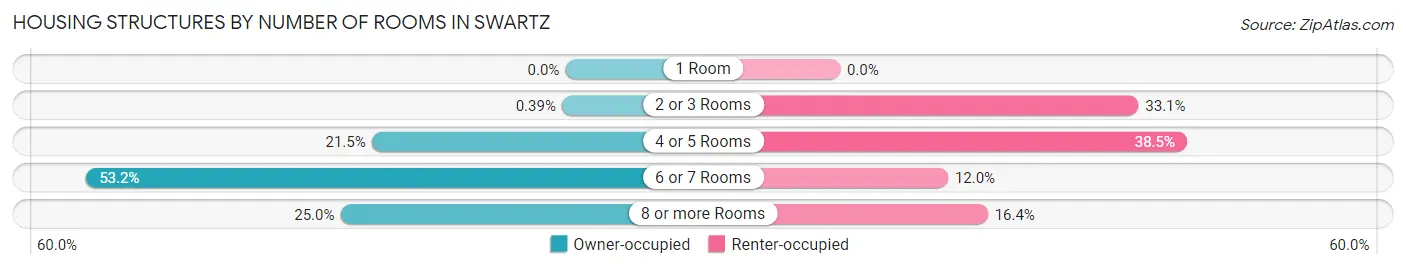
| Number of Rooms | Owner-occupied | Renter-occupied |
| 1 Room | 0 (0.0%) | 0 (0.0%) |
| 2 or 3 Rooms | 5 (0.4%) | 105 (33.1%) |
| 4 or 5 Rooms | 279 (21.5%) | 122 (38.5%) |
| 6 or 7 Rooms | 690 (53.2%) | 38 (12.0%) |
| 8 or more Rooms | 324 (25.0%) | 52 (16.4%) |
| Total | 1,298 (100.0%) | 317 (100.0%) |
Housing Structure by Heating Type in Swartz
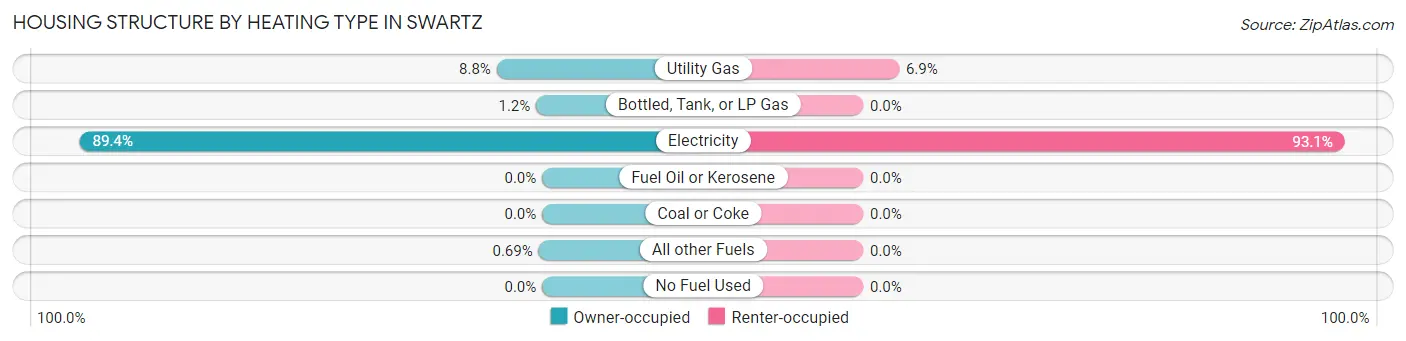
| Heating Type | Owner-occupied | Renter-occupied |
| Utility Gas | 114 (8.8%) | 22 (6.9%) |
| Bottled, Tank, or LP Gas | 15 (1.2%) | 0 (0.0%) |
| Electricity | 1,160 (89.4%) | 295 (93.1%) |
| Fuel Oil or Kerosene | 0 (0.0%) | 0 (0.0%) |
| Coal or Coke | 0 (0.0%) | 0 (0.0%) |
| All other Fuels | 9 (0.7%) | 0 (0.0%) |
| No Fuel Used | 0 (0.0%) | 0 (0.0%) |
| Total | 1,298 (100.0%) | 317 (100.0%) |
Household Vehicle Usage in Swartz
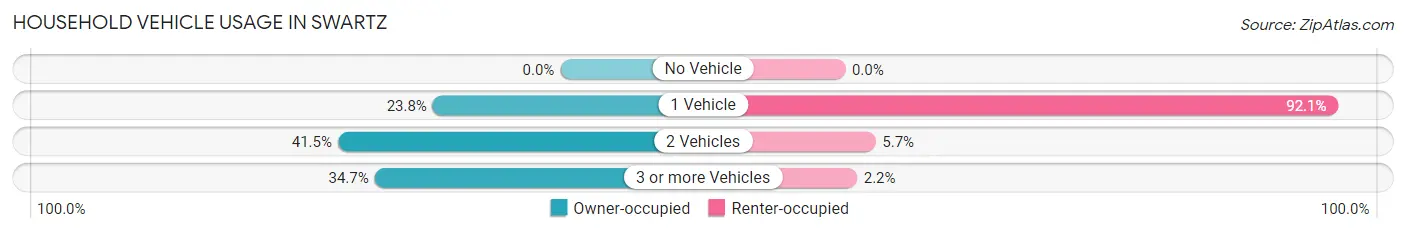
| Vehicles per Household | Owner-occupied | Renter-occupied |
| No Vehicle | 0 (0.0%) | 0 (0.0%) |
| 1 Vehicle | 309 (23.8%) | 292 (92.1%) |
| 2 Vehicles | 539 (41.5%) | 18 (5.7%) |
| 3 or more Vehicles | 450 (34.7%) | 7 (2.2%) |
| Total | 1,298 (100.0%) | 317 (100.0%) |
Real Estate & Mortgages in Swartz
Real Estate and Mortgage Overview in Swartz
| Characteristic | Without Mortgage | With Mortgage |
| Housing Units | 427 | 871 |
| Median Property Value | $169,900 | $184,000 |
| Median Household Income | $57,321 | $214 |
| Monthly Housing Costs | $465 | $30 |
| Real Estate Taxes | $800 | $105 |
Property Value by Mortgage Status in Swartz
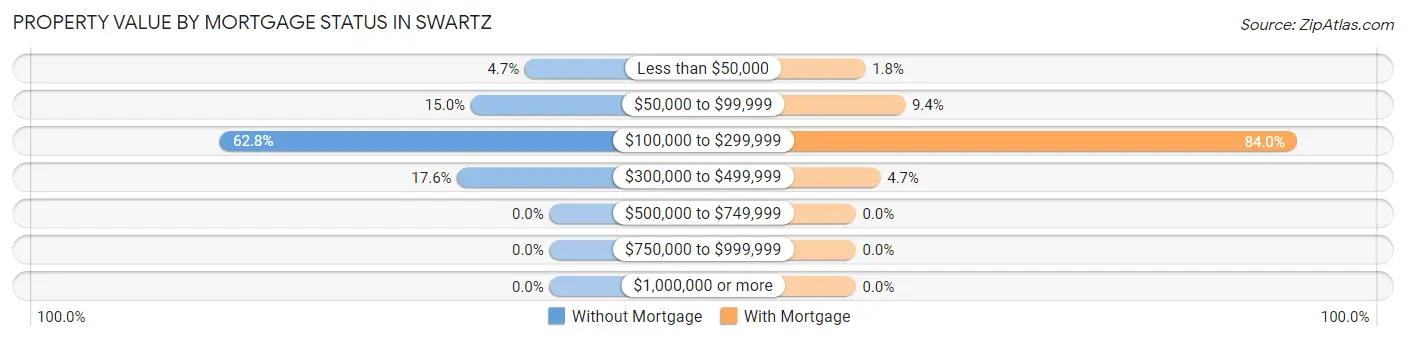
| Property Value | Without Mortgage | With Mortgage |
| Less than $50,000 | 20 (4.7%) | 16 (1.8%) |
| $50,000 to $99,999 | 64 (15.0%) | 82 (9.4%) |
| $100,000 to $299,999 | 268 (62.8%) | 732 (84.0%) |
| $300,000 to $499,999 | 75 (17.6%) | 41 (4.7%) |
| $500,000 to $749,999 | 0 (0.0%) | 0 (0.0%) |
| $750,000 to $999,999 | 0 (0.0%) | 0 (0.0%) |
| $1,000,000 or more | 0 (0.0%) | 0 (0.0%) |
| Total | 427 (100.0%) | 871 (100.0%) |
Household Income by Mortgage Status in Swartz
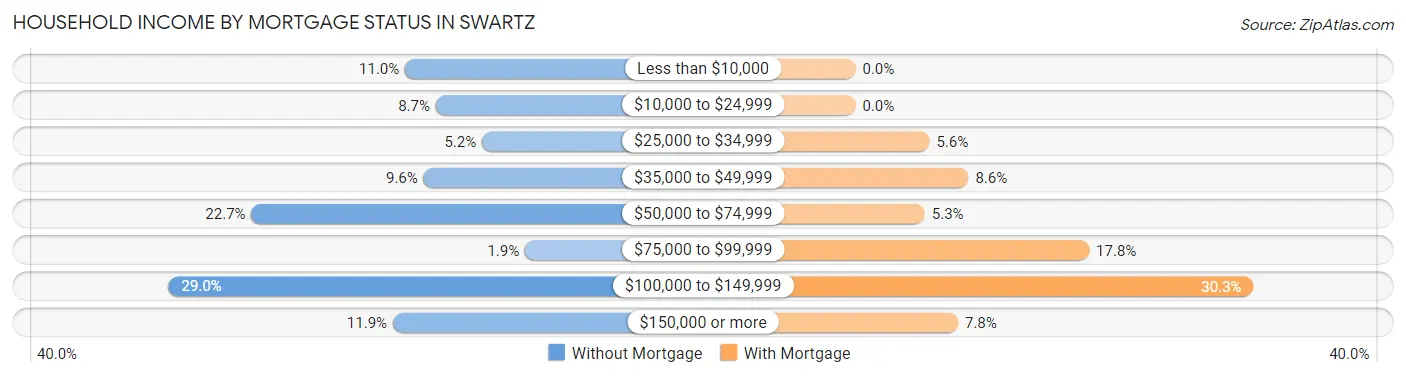
| Household Income | Without Mortgage | With Mortgage |
| Less than $10,000 | 47 (11.0%) | 0 (0.0%) |
| $10,000 to $24,999 | 37 (8.7%) | 0 (0.0%) |
| $25,000 to $34,999 | 22 (5.1%) | 49 (5.6%) |
| $35,000 to $49,999 | 41 (9.6%) | 75 (8.6%) |
| $50,000 to $74,999 | 97 (22.7%) | 46 (5.3%) |
| $75,000 to $99,999 | 8 (1.9%) | 155 (17.8%) |
| $100,000 to $149,999 | 124 (29.0%) | 264 (30.3%) |
| $150,000 or more | 51 (11.9%) | 68 (7.8%) |
| Total | 427 (100.0%) | 871 (100.0%) |
Property Value to Household Income Ratio in Swartz
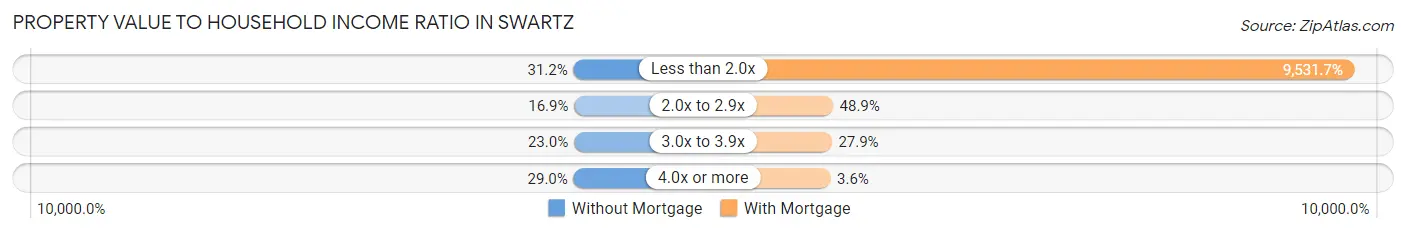
| Value-to-Income Ratio | Without Mortgage | With Mortgage |
| Less than 2.0x | 133 (31.1%) | 83,021 (9,531.7%) |
| 2.0x to 2.9x | 72 (16.9%) | 426 (48.9%) |
| 3.0x to 3.9x | 98 (23.0%) | 243 (27.9%) |
| 4.0x or more | 124 (29.0%) | 31 (3.6%) |
| Total | 427 (100.0%) | 871 (100.0%) |
Real Estate Taxes by Mortgage Status in Swartz
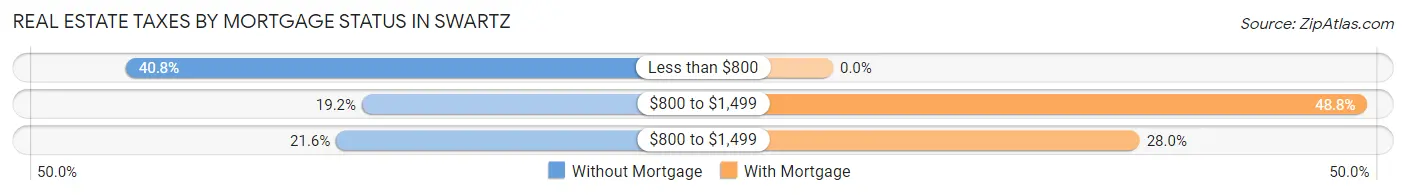
| Property Taxes | Without Mortgage | With Mortgage |
| Less than $800 | 174 (40.7%) | 0 (0.0%) |
| $800 to $1,499 | 82 (19.2%) | 425 (48.8%) |
| $800 to $1,499 | 92 (21.5%) | 244 (28.0%) |
| Total | 427 (100.0%) | 871 (100.0%) |
Health & Disability in Swartz
Health Insurance Coverage by Age in Swartz
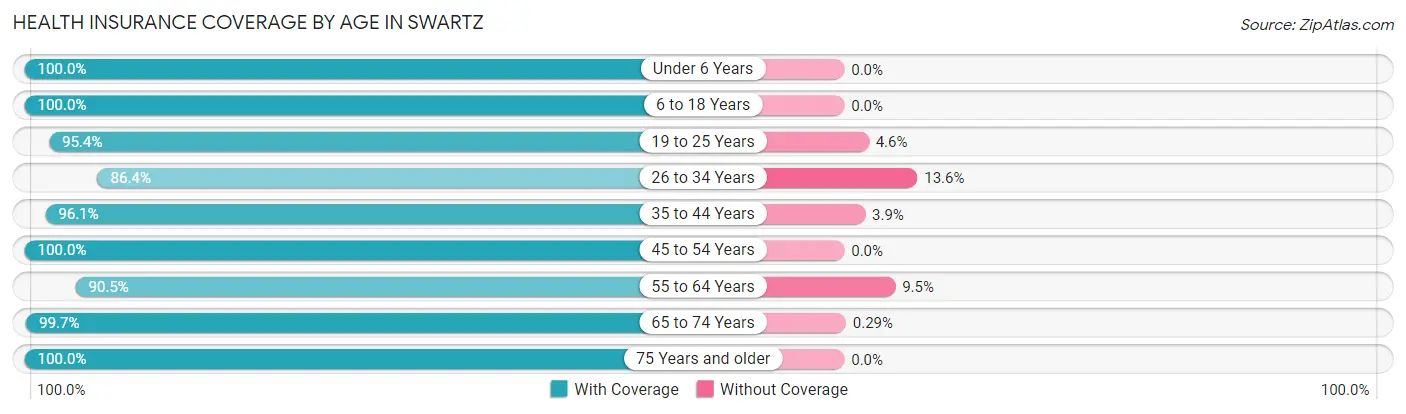
| Age Bracket | With Coverage | Without Coverage |
| Under 6 Years | 251 (100.0%) | 0 (0.0%) |
| 6 to 18 Years | 879 (100.0%) | 0 (0.0%) |
| 19 to 25 Years | 481 (95.4%) | 23 (4.6%) |
| 26 to 34 Years | 742 (86.4%) | 117 (13.6%) |
| 35 to 44 Years | 496 (96.1%) | 20 (3.9%) |
| 45 to 54 Years | 590 (100.0%) | 0 (0.0%) |
| 55 to 64 Years | 515 (90.5%) | 54 (9.5%) |
| 65 to 74 Years | 349 (99.7%) | 1 (0.3%) |
| 75 Years and older | 285 (100.0%) | 0 (0.0%) |
| Total | 4,588 (95.5%) | 215 (4.5%) |
Health Insurance Coverage by Citizenship Status in Swartz
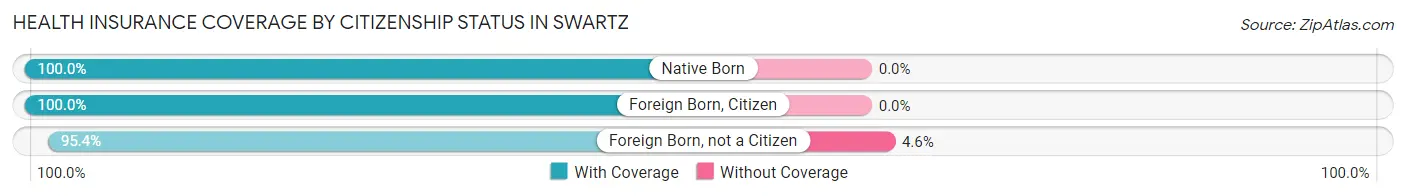
| Citizenship Status | With Coverage | Without Coverage |
| Native Born | 251 (100.0%) | 0 (0.0%) |
| Foreign Born, Citizen | 879 (100.0%) | 0 (0.0%) |
| Foreign Born, not a Citizen | 481 (95.4%) | 23 (4.6%) |
Health Insurance Coverage by Household Income in Swartz
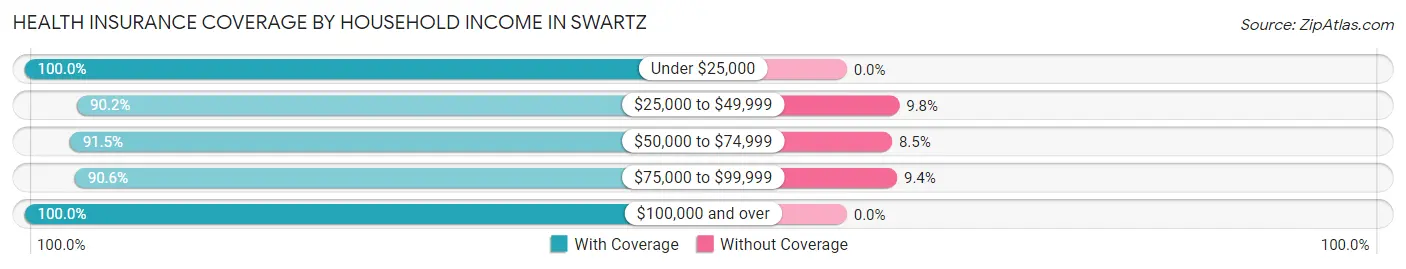
| Household Income | With Coverage | Without Coverage |
| Under $25,000 | 595 (100.0%) | 0 (0.0%) |
| $25,000 to $49,999 | 596 (90.2%) | 65 (9.8%) |
| $50,000 to $74,999 | 887 (91.5%) | 82 (8.5%) |
| $75,000 to $99,999 | 645 (90.6%) | 67 (9.4%) |
| $100,000 and over | 1,854 (100.0%) | 0 (0.0%) |
Public vs Private Health Insurance Coverage by Age in Swartz
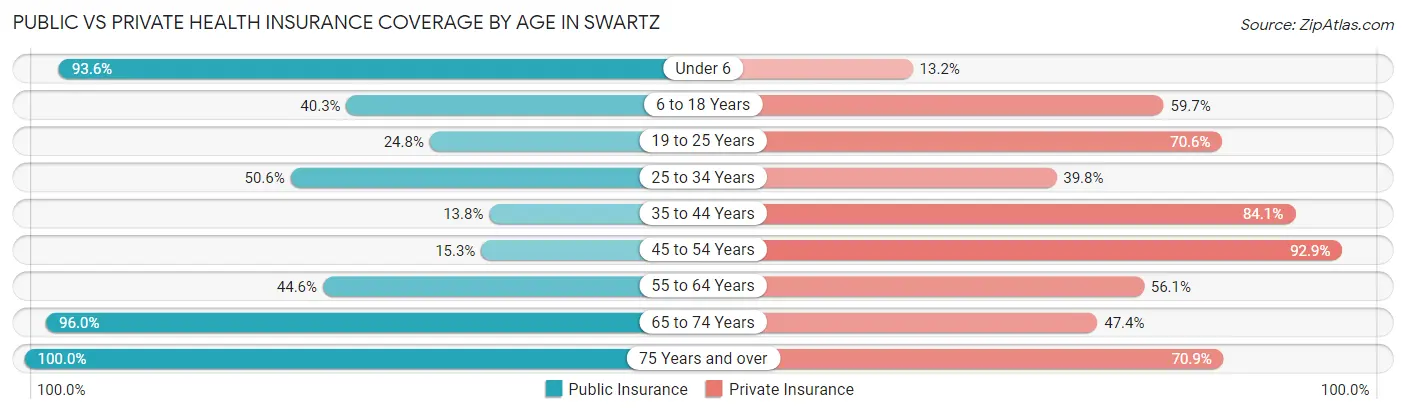
| Age Bracket | Public Insurance | Private Insurance |
| Under 6 | 235 (93.6%) | 33 (13.2%) |
| 6 to 18 Years | 354 (40.3%) | 525 (59.7%) |
| 19 to 25 Years | 125 (24.8%) | 356 (70.6%) |
| 25 to 34 Years | 435 (50.6%) | 342 (39.8%) |
| 35 to 44 Years | 71 (13.8%) | 434 (84.1%) |
| 45 to 54 Years | 90 (15.2%) | 548 (92.9%) |
| 55 to 64 Years | 254 (44.6%) | 319 (56.1%) |
| 65 to 74 Years | 336 (96.0%) | 166 (47.4%) |
| 75 Years and over | 285 (100.0%) | 202 (70.9%) |
| Total | 2,185 (45.5%) | 2,925 (60.9%) |
Disability Status by Sex by Age in Swartz
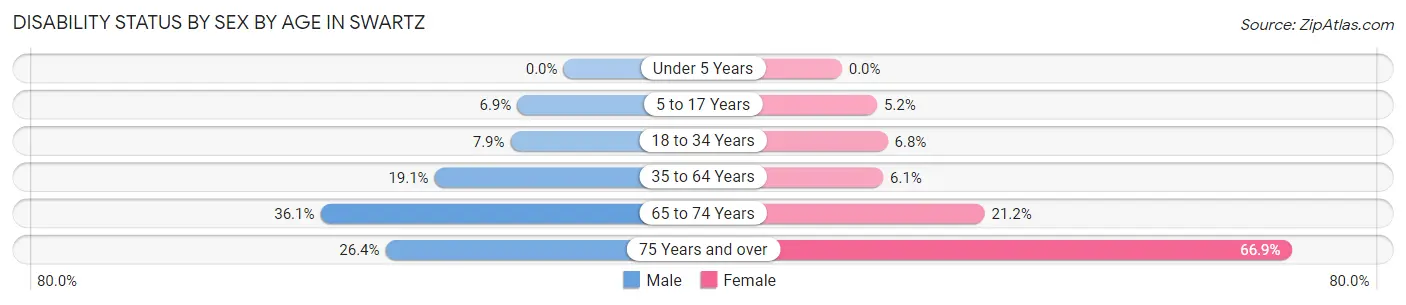
| Age Bracket | Male | Female |
| Under 5 Years | 0 (0.0%) | 0 (0.0%) |
| 5 to 17 Years | 27 (6.9%) | 23 (5.2%) |
| 18 to 34 Years | 68 (7.9%) | 37 (6.8%) |
| 35 to 64 Years | 124 (19.1%) | 63 (6.1%) |
| 65 to 74 Years | 48 (36.1%) | 46 (21.2%) |
| 75 Years and over | 37 (26.4%) | 97 (66.9%) |
Disability Class by Sex by Age in Swartz
Disability Class: Hearing Difficulty
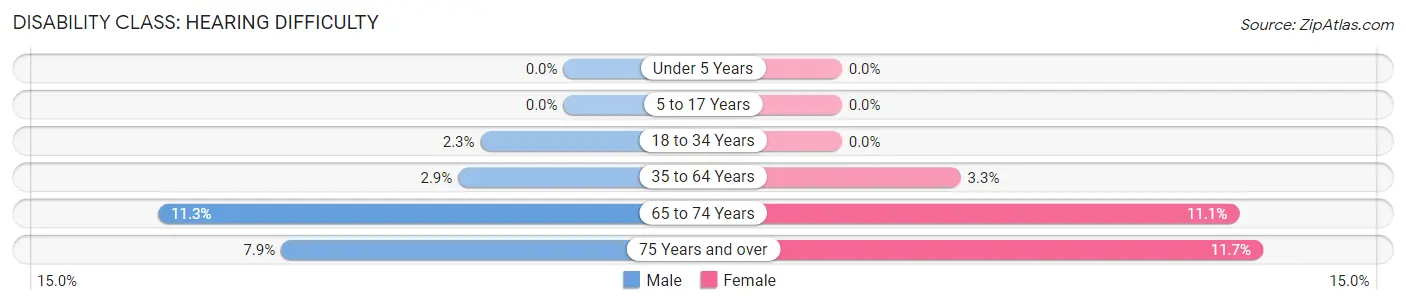
| Age Bracket | Male | Female |
| Under 5 Years | 0 (0.0%) | 0 (0.0%) |
| 5 to 17 Years | 0 (0.0%) | 0 (0.0%) |
| 18 to 34 Years | 20 (2.3%) | 0 (0.0%) |
| 35 to 64 Years | 19 (2.9%) | 34 (3.3%) |
| 65 to 74 Years | 15 (11.3%) | 24 (11.1%) |
| 75 Years and over | 11 (7.9%) | 17 (11.7%) |
Disability Class: Vision Difficulty
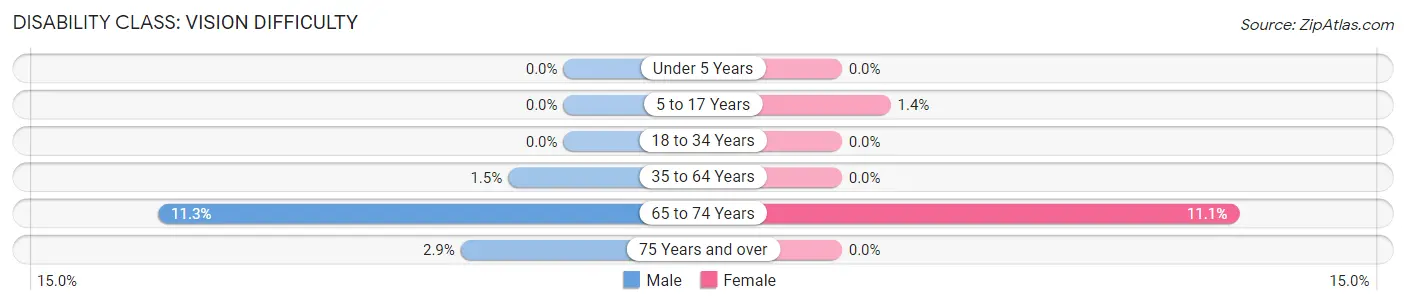
| Age Bracket | Male | Female |
| Under 5 Years | 0 (0.0%) | 0 (0.0%) |
| 5 to 17 Years | 0 (0.0%) | 6 (1.4%) |
| 18 to 34 Years | 0 (0.0%) | 0 (0.0%) |
| 35 to 64 Years | 10 (1.5%) | 0 (0.0%) |
| 65 to 74 Years | 15 (11.3%) | 24 (11.1%) |
| 75 Years and over | 4 (2.9%) | 0 (0.0%) |
Disability Class: Cognitive Difficulty
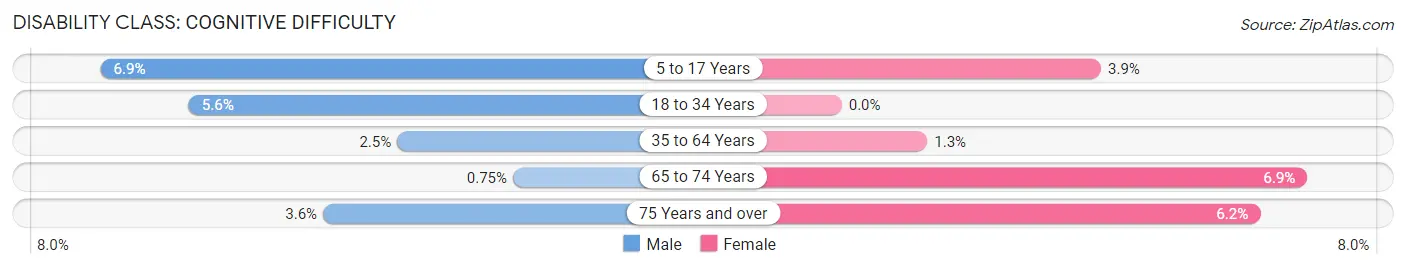
| Age Bracket | Male | Female |
| 5 to 17 Years | 27 (6.9%) | 17 (3.8%) |
| 18 to 34 Years | 48 (5.6%) | 0 (0.0%) |
| 35 to 64 Years | 16 (2.5%) | 13 (1.3%) |
| 65 to 74 Years | 1 (0.7%) | 15 (6.9%) |
| 75 Years and over | 5 (3.6%) | 9 (6.2%) |
Disability Class: Ambulatory Difficulty
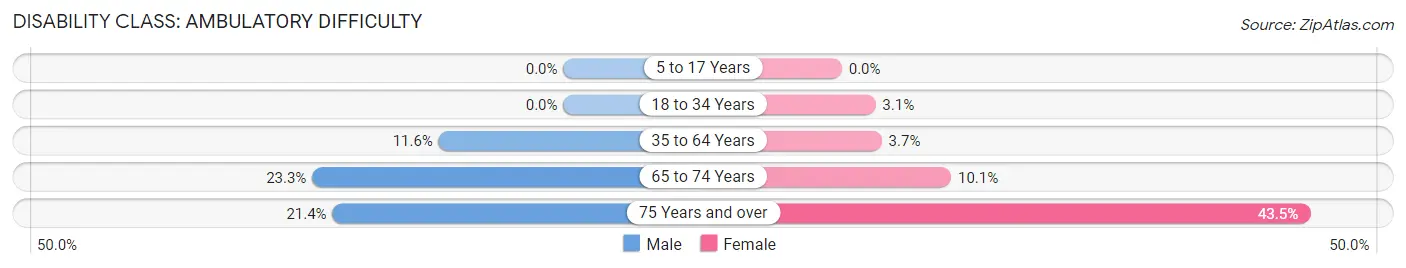
| Age Bracket | Male | Female |
| 5 to 17 Years | 0 (0.0%) | 0 (0.0%) |
| 18 to 34 Years | 0 (0.0%) | 17 (3.1%) |
| 35 to 64 Years | 75 (11.6%) | 38 (3.7%) |
| 65 to 74 Years | 31 (23.3%) | 22 (10.1%) |
| 75 Years and over | 30 (21.4%) | 63 (43.4%) |
Disability Class: Self-Care Difficulty
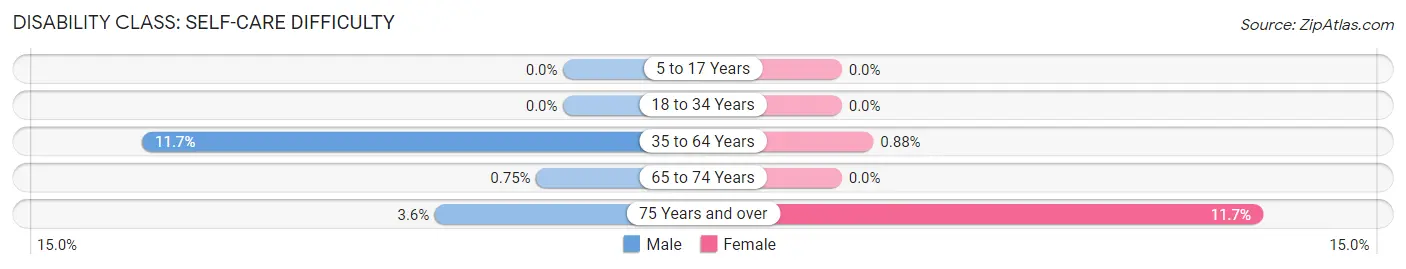
| Age Bracket | Male | Female |
| 5 to 17 Years | 0 (0.0%) | 0 (0.0%) |
| 18 to 34 Years | 0 (0.0%) | 0 (0.0%) |
| 35 to 64 Years | 76 (11.7%) | 9 (0.9%) |
| 65 to 74 Years | 1 (0.7%) | 0 (0.0%) |
| 75 Years and over | 5 (3.6%) | 17 (11.7%) |
Technology Access in Swartz
Computing Device Access in Swartz
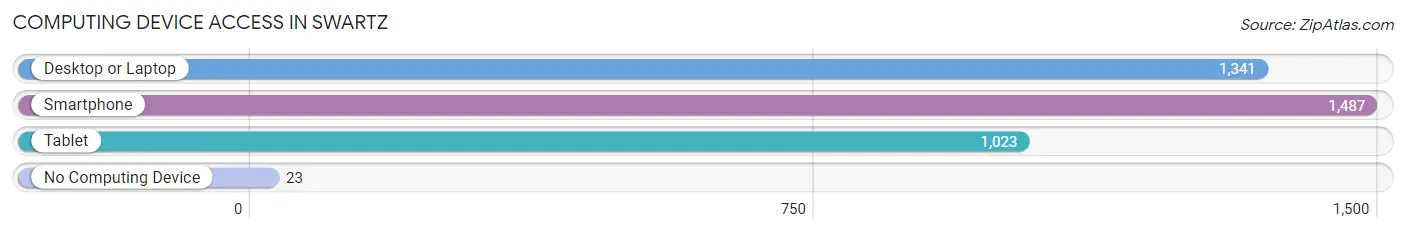
| Device Type | # Households | % Households |
| Desktop or Laptop | 1,341 | 83.0% |
| Smartphone | 1,487 | 92.1% |
| Tablet | 1,023 | 63.3% |
| No Computing Device | 23 | 1.4% |
| Total | 1,615 | 100.0% |
Internet Access in Swartz
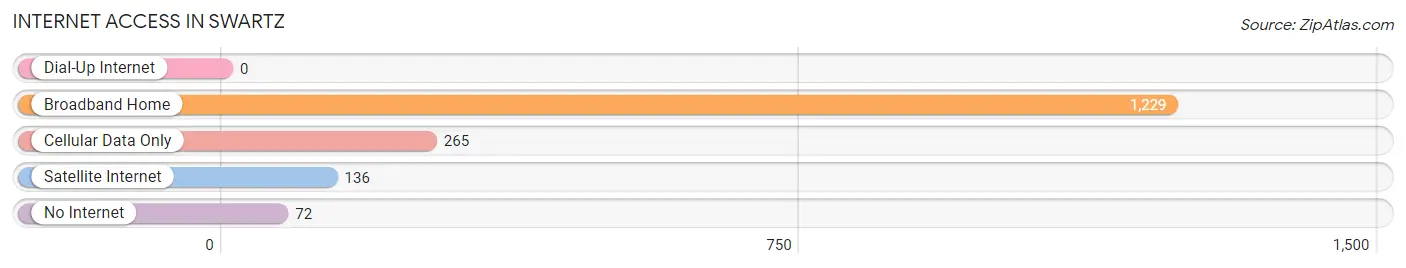
| Internet Type | # Households | % Households |
| Dial-Up Internet | 0 | 0.0% |
| Broadband Home | 1,229 | 76.1% |
| Cellular Data Only | 265 | 16.4% |
| Satellite Internet | 136 | 8.4% |
| No Internet | 72 | 4.5% |
| Total | 1,615 | 100.0% |
Swartz Summary
Los Angeles, California, is the second largest city in the United States and the largest city in the state of California. It is located in the southern part of the state, along the Pacific Ocean. Los Angeles is a major cultural, economic, and transportation hub in the United States. It is home to many famous landmarks, including the Hollywood Sign, the Griffith Observatory, and the Walt Disney Concert Hall.
The history of Los Angeles dates back to the early 1700s, when Spanish explorers first arrived in the area. The city was founded in 1781 by Spanish governor Felipe de Neve, and it was named El Pueblo de Nuestra Señora la Reina de los Angeles de Porciuncula. The city grew rapidly in the 19th century, becoming a major port and railroad hub. In the early 20th century, Los Angeles became a major center of the film industry, and it is now home to many of the world’s largest movie studios.
Los Angeles is located in the southwestern part of the United States, in the state of California. It is bordered by the Pacific Ocean to the west, the San Gabriel Mountains to the north, and the Mojave Desert to the east. The city covers an area of 469 square miles, making it the second largest city in the United States.
The climate of Los Angeles is classified as a Mediterranean climate, with warm, dry summers and mild, wet winters. The average temperature in the city ranges from the mid-50s to the mid-80s Fahrenheit. The city receives an average of 15 inches of rain per year.
Los Angeles is a major economic center in the United States. The city is home to many large corporations, including the Walt Disney Company, Warner Bros., and Universal Pictures. The city is also a major center for the entertainment industry, with many television and film studios located in the city. The Port of Los Angeles is one of the busiest ports in the world, and it is a major hub for international trade.
The population of Los Angeles is estimated to be over four million people. The city is home to a diverse population, with people from all over the world. The largest ethnic groups in the city are Hispanic or Latino, followed by White, Asian, and African American. The city is also home to many immigrants, with over one million foreign-born residents.
Los Angeles is a major cultural center in the United States. The city is home to many museums, theaters, and other cultural institutions. The city is also home to many professional sports teams, including the Los Angeles Lakers, Los Angeles Dodgers, and Los Angeles Angels. The city is also home to many universities, including the University of California, Los Angeles, and the University of Southern California.
Los Angeles is a major transportation hub in the United States. The city is served by two major airports, Los Angeles International Airport and Bob Hope Airport. The city is also served by an extensive network of highways and public transportation systems, including the Los Angeles Metro Rail and the Los Angeles County Metropolitan Transportation Authority.
Common Questions
What is Per Capita Income in Swartz?
Per Capita income in Swartz is $32,113.
What is the Median Family Income in Swartz?
Median Family Income in Swartz is $82,847.
What is the Median Household income in Swartz?
Median Household Income in Swartz is $68,925.
What is Income or Wage Gap in Swartz?
Income or Wage Gap in Swartz is 9.2%.
Women in Swartz earn 90.8 cents for every dollar earned by a man.
What is Inequality or Gini Index in Swartz?
Inequality or Gini Index in Swartz is 0.46.
What is the Total Population of Swartz?
Total Population of Swartz is 4,803.
What is the Total Male Population of Swartz?
Total Male Population of Swartz is 2,270.
What is the Total Female Population of Swartz?
Total Female Population of Swartz is 2,533.
What is the Ratio of Males per 100 Females in Swartz?
There are 89.62 Males per 100 Females in Swartz.
What is the Ratio of Females per 100 Males in Swartz?
There are 111.59 Females per 100 Males in Swartz.
What is the Median Population Age in Swartz?
Median Population Age in Swartz is 33.4 Years.
What is the Average Family Size in Swartz
Average Family Size in Swartz is 3.6 People.
What is the Average Household Size in Swartz
Average Household Size in Swartz is 3.0 People.
How Large is the Labor Force in Swartz?
There are 2,300 People in the Labor Forcein in Swartz.
What is the Percentage of People in the Labor Force in Swartz?
59.8% of People are in the Labor Force in Swartz.
What is the Unemployment Rate in Swartz?
Unemployment Rate in Swartz is 0.4%.