Broussard, LA Map & Demographics
Broussard Map
Broussard Overview
$39,800
PER CAPITA INCOME
$106,713
AVG FAMILY INCOME
$94,912
AVG HOUSEHOLD INCOME
44.2%
WAGE / INCOME GAP [ % ]
55.8¢/ $1
WAGE / INCOME GAP [ $ ]
0.42
INEQUALITY / GINI INDEX
13,322
TOTAL POPULATION
6,887
MALE POPULATION
6,435
FEMALE POPULATION
107.02
MALES / 100 FEMALES
93.44
FEMALES / 100 MALES
32.9
MEDIAN AGE
3.4
AVG FAMILY SIZE
3.0
AVG HOUSEHOLD SIZE
7,414
LABOR FORCE [ PEOPLE ]
76.0%
PERCENT IN LABOR FORCE
3.7%
UNEMPLOYMENT RATE
Broussard Zip Codes
Broussard Area Codes
Income in Broussard
Income Overview in Broussard
Per Capita Income in Broussard is $39,800, while median incomes of families and households are $106,713 and $94,912 respectively.
| Characteristic | Number | Measure |
| Per Capita Income | 13,322 | $39,800 |
| Median Family Income | 3,220 | $106,713 |
| Mean Family Income | 3,220 | $134,020 |
| Median Household Income | 4,396 | $94,912 |
| Mean Household Income | 4,396 | $117,478 |
| Income Deficit | 3,220 | $0 |
| Wage / Income Gap (%) | 13,322 | 44.25% |
| Wage / Income Gap ($) | 13,322 | 55.75¢ per $1 |
| Gini / Inequality Index | 13,322 | 0.42 |
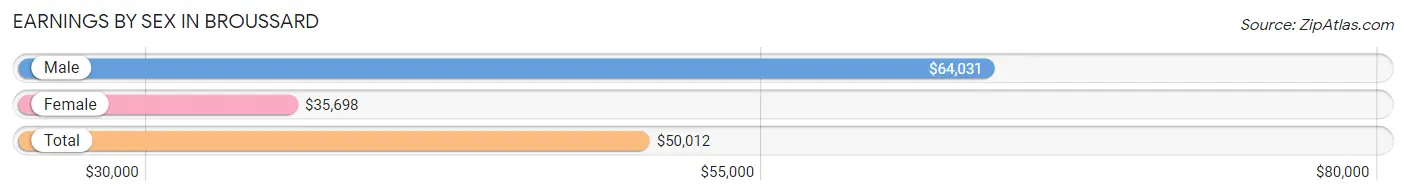
Earnings by Sex in Broussard
Average Earnings in Broussard are $50,012, $64,031 for men and $35,698 for women, a difference of 44.3%.
| Sex | Number | Average Earnings |
| Male | 3,731 (49.6%) | $64,031 |
| Female | 3,795 (50.4%) | $35,698 |
| Total | 7,526 (100.0%) | $50,012 |
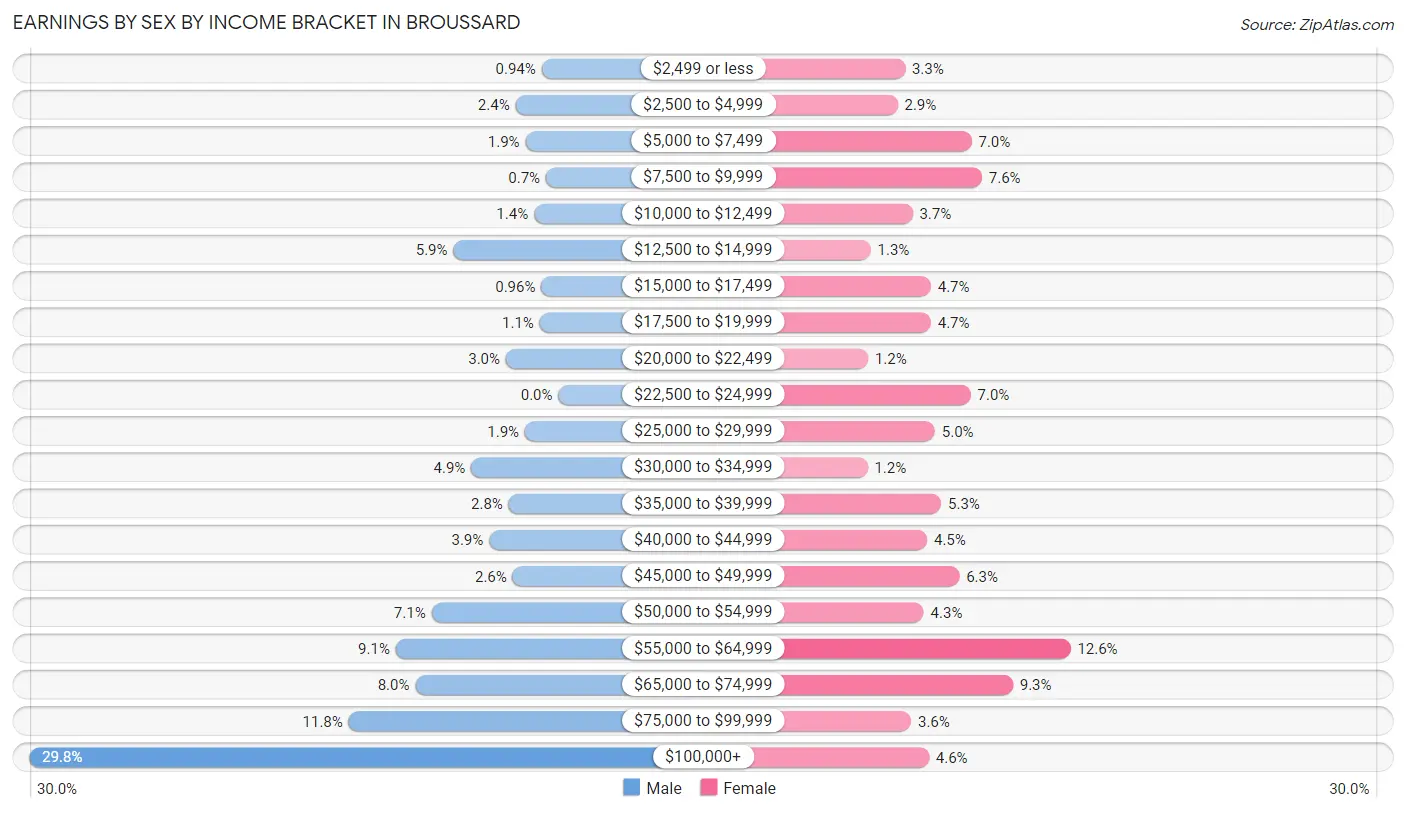
Earnings by Sex by Income Bracket in Broussard
The most common earnings brackets in Broussard are $100,000+ for men (1,110 | 29.7%) and $55,000 to $64,999 for women (477 | 12.6%).
| Income | Male | Female |
| $2,499 or less | 35 (0.9%) | 124 (3.3%) |
| $2,500 to $4,999 | 90 (2.4%) | 108 (2.9%) |
| $5,000 to $7,499 | 69 (1.8%) | 266 (7.0%) |
| $7,500 to $9,999 | 26 (0.7%) | 288 (7.6%) |
| $10,000 to $12,499 | 51 (1.4%) | 140 (3.7%) |
| $12,500 to $14,999 | 220 (5.9%) | 51 (1.3%) |
| $15,000 to $17,499 | 36 (1.0%) | 179 (4.7%) |
| $17,500 to $19,999 | 39 (1.1%) | 179 (4.7%) |
| $20,000 to $22,499 | 110 (2.9%) | 45 (1.2%) |
| $22,500 to $24,999 | 0 (0.0%) | 264 (7.0%) |
| $25,000 to $29,999 | 70 (1.9%) | 188 (5.0%) |
| $30,000 to $34,999 | 183 (4.9%) | 44 (1.2%) |
| $35,000 to $39,999 | 104 (2.8%) | 201 (5.3%) |
| $40,000 to $44,999 | 145 (3.9%) | 171 (4.5%) |
| $45,000 to $49,999 | 96 (2.6%) | 240 (6.3%) |
| $50,000 to $54,999 | 266 (7.1%) | 164 (4.3%) |
| $55,000 to $64,999 | 341 (9.1%) | 477 (12.6%) |
| $65,000 to $74,999 | 300 (8.0%) | 354 (9.3%) |
| $75,000 to $99,999 | 440 (11.8%) | 137 (3.6%) |
| $100,000+ | 1,110 (29.7%) | 175 (4.6%) |
| Total | 3,731 (100.0%) | 3,795 (100.0%) |
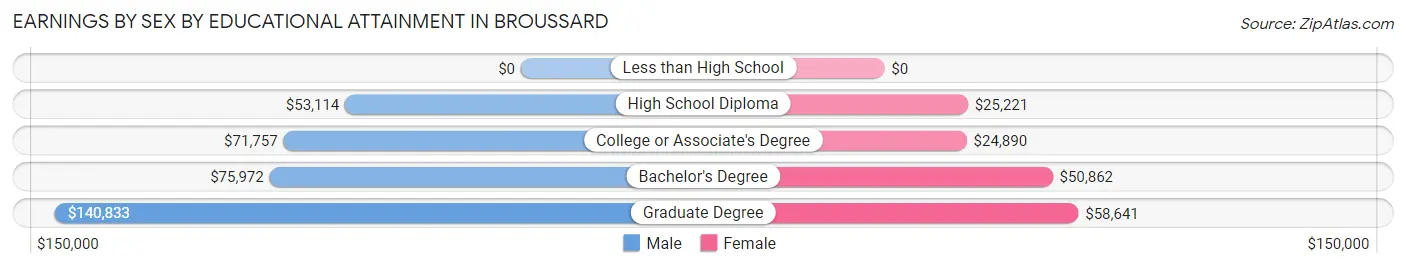
Earnings by Sex by Educational Attainment in Broussard
Average earnings in Broussard are $70,123 for men and $41,765 for women, a difference of 40.4%. Men with an educational attainment of graduate degree enjoy the highest average annual earnings of $140,833, while those with high school diploma education earn the least with $53,114. Women with an educational attainment of graduate degree earn the most with the average annual earnings of $58,641, while those with college or associate's degree education have the smallest earnings of $24,890.
| Educational Attainment | Male Income | Female Income |
| Less than High School | - | - |
| High School Diploma | $53,114 | $25,221 |
| College or Associate's Degree | $71,757 | $24,890 |
| Bachelor's Degree | $75,972 | $50,862 |
| Graduate Degree | $140,833 | $58,641 |
| Total | $70,123 | $41,765 |
Family Income in Broussard
Family Income Brackets in Broussard
According to the Broussard family income data, there are 763 families falling into the $100,000 to $149,999 income range, which is the most common income bracket and makes up 23.7% of all families.
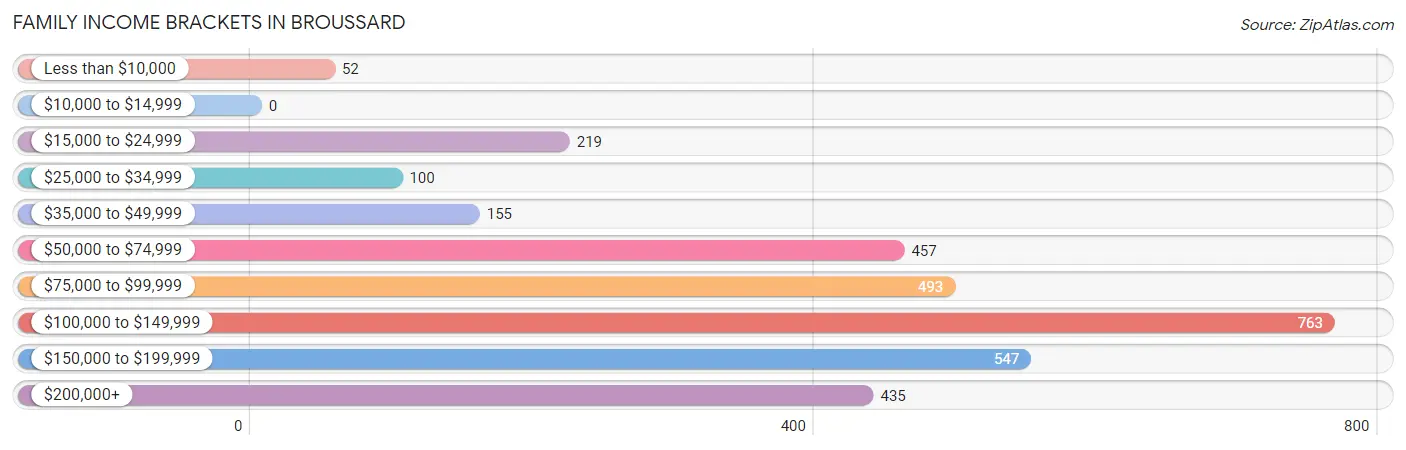
| Income Bracket | # Families | % Families |
| Less than $10,000 | 52 | 1.6% |
| $10,000 to $14,999 | 0 | 0.0% |
| $15,000 to $24,999 | 219 | 6.8% |
| $25,000 to $34,999 | 100 | 3.1% |
| $35,000 to $49,999 | 155 | 4.8% |
| $50,000 to $74,999 | 457 | 14.2% |
| $75,000 to $99,999 | 493 | 15.3% |
| $100,000 to $149,999 | 763 | 23.7% |
| $150,000 to $199,999 | 547 | 17.0% |
| $200,000+ | 435 | 13.5% |
Family Income by Famaliy Size in Broussard
4-person families (853 | 26.5%) account for the highest median family income in Broussard with $175,155 per family, while 2-person families (1,085 | 33.7%) have the highest median income of $53,455 per family member.
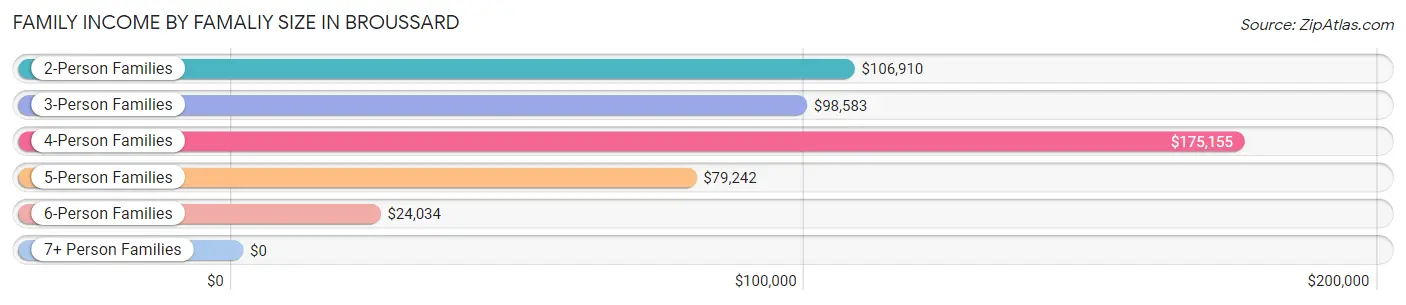
| Income Bracket | # Families | Median Income |
| 2-Person Families | 1,085 (33.7%) | $106,910 |
| 3-Person Families | 896 (27.8%) | $98,583 |
| 4-Person Families | 853 (26.5%) | $175,155 |
| 5-Person Families | 169 (5.2%) | $79,242 |
| 6-Person Families | 189 (5.9%) | $24,034 |
| 7+ Person Families | 28 (0.9%) | $0 |
| Total | 3,220 (100.0%) | $106,713 |
Family Income by Number of Earners in Broussard
The median family income in Broussard is $106,713, with families comprising 3+ earners (459) having the highest median family income of $176,932, while families with no earners (231) have the lowest median family income of $50,525, accounting for 14.2% and 7.2% of families, respectively.
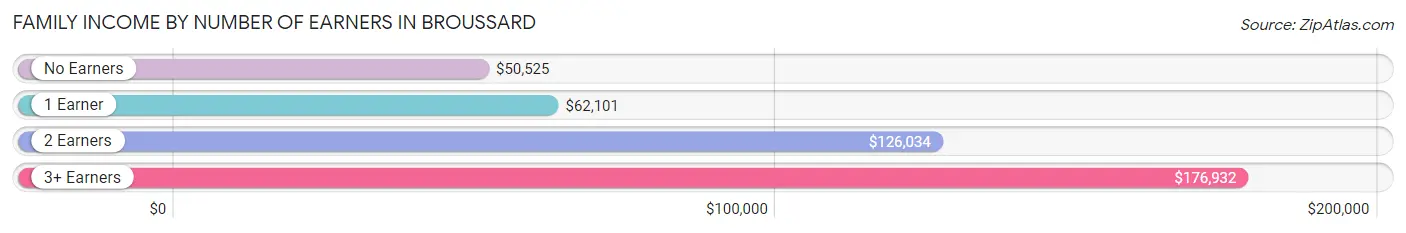
| Number of Earners | # Families | Median Income |
| No Earners | 231 (7.2%) | $50,525 |
| 1 Earner | 752 (23.4%) | $62,101 |
| 2 Earners | 1,778 (55.2%) | $126,034 |
| 3+ Earners | 459 (14.2%) | $176,932 |
| Total | 3,220 (100.0%) | $106,713 |
Household Income in Broussard
Household Income Brackets in Broussard
With 892 households falling in the category, the $100,000 to $149,999 income range is the most frequent in Broussard, accounting for 20.3% of all households. In contrast, only 18 households (0.4%) fall into the $10,000 to $14,999 income bracket, making it the least populous group.
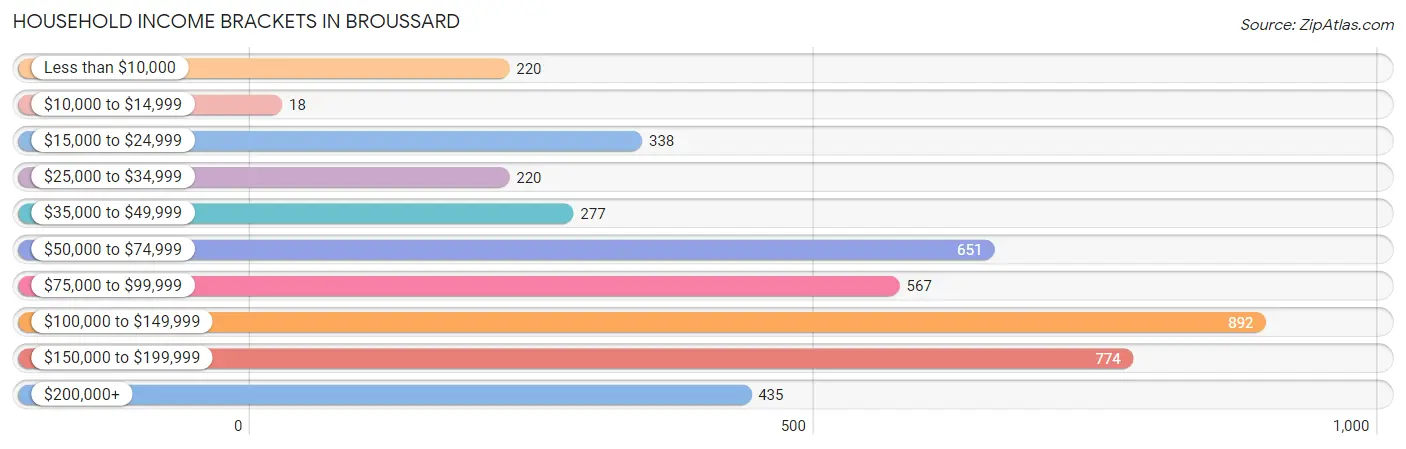
| Income Bracket | # Households | % Households |
| Less than $10,000 | 220 | 5.0% |
| $10,000 to $14,999 | 18 | 0.4% |
| $15,000 to $24,999 | 338 | 7.7% |
| $25,000 to $34,999 | 220 | 5.0% |
| $35,000 to $49,999 | 277 | 6.3% |
| $50,000 to $74,999 | 651 | 14.8% |
| $75,000 to $99,999 | 567 | 12.9% |
| $100,000 to $149,999 | 892 | 20.3% |
| $150,000 to $199,999 | 774 | 17.6% |
| $200,000+ | 435 | 9.9% |
Household Income by Householder Age in Broussard
The median household income in Broussard is $94,912, with the highest median household income of $113,909 found in the 45 to 64 years age bracket for the primary householder. A total of 1,471 households (33.5%) fall into this category. Meanwhile, the 65+ years age bracket for the primary householder has the lowest median household income of $40,781, with 687 households (15.6%) in this group.
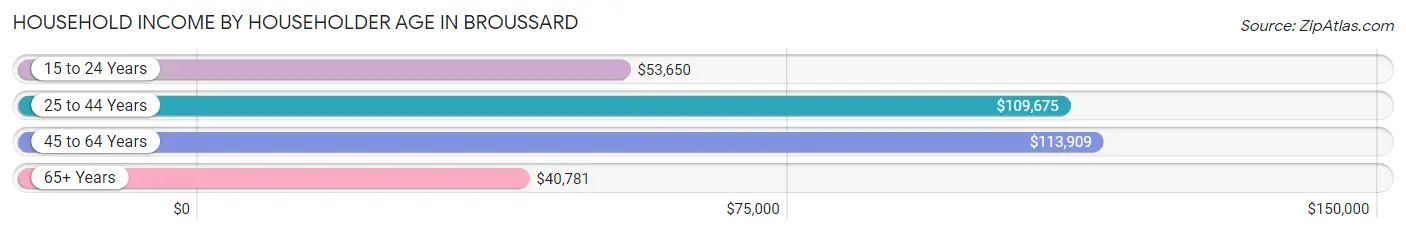
| Income Bracket | # Households | Median Income |
| 15 to 24 Years | 127 (2.9%) | $53,650 |
| 25 to 44 Years | 2,111 (48.0%) | $109,675 |
| 45 to 64 Years | 1,471 (33.5%) | $113,909 |
| 65+ Years | 687 (15.6%) | $40,781 |
| Total | 4,396 (100.0%) | $94,912 |
Poverty in Broussard
Income Below Poverty by Sex and Age in Broussard
With 13.9% poverty level for males and 18.5% for females among the residents of Broussard, 16 and 17 year old males and 12 to 14 year old females are the most vulnerable to poverty, with 144 males (63.7%) and 324 females (77.5%) in their respective age groups living below the poverty level.
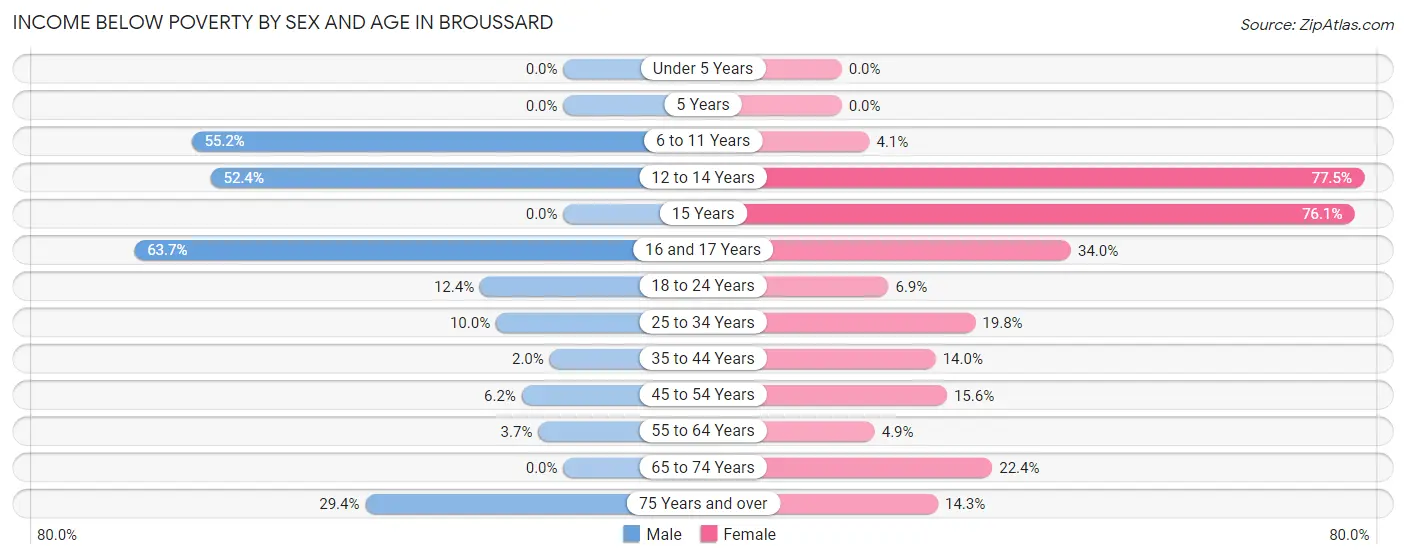
| Age Bracket | Male | Female |
| Under 5 Years | 0 (0.0%) | 0 (0.0%) |
| 5 Years | 0 (0.0%) | 0 (0.0%) |
| 6 to 11 Years | 296 (55.2%) | 15 (4.1%) |
| 12 to 14 Years | 198 (52.4%) | 324 (77.5%) |
| 15 Years | 0 (0.0%) | 140 (76.1%) |
| 16 and 17 Years | 144 (63.7%) | 32 (34.0%) |
| 18 to 24 Years | 52 (12.4%) | 45 (6.9%) |
| 25 to 34 Years | 93 (10.0%) | 246 (19.8%) |
| 35 to 44 Years | 23 (2.0%) | 147 (14.0%) |
| 45 to 54 Years | 48 (6.2%) | 85 (15.6%) |
| 55 to 64 Years | 24 (3.7%) | 46 (4.9%) |
| 65 to 74 Years | 0 (0.0%) | 76 (22.4%) |
| 75 Years and over | 20 (29.4%) | 23 (14.3%) |
| Total | 898 (13.9%) | 1,179 (18.5%) |
Income Above Poverty by Sex and Age in Broussard
According to the poverty statistics in Broussard, males aged under 5 years and females aged under 5 years are the age groups that are most secure financially, with 100.0% of males and 100.0% of females in these age groups living above the poverty line.
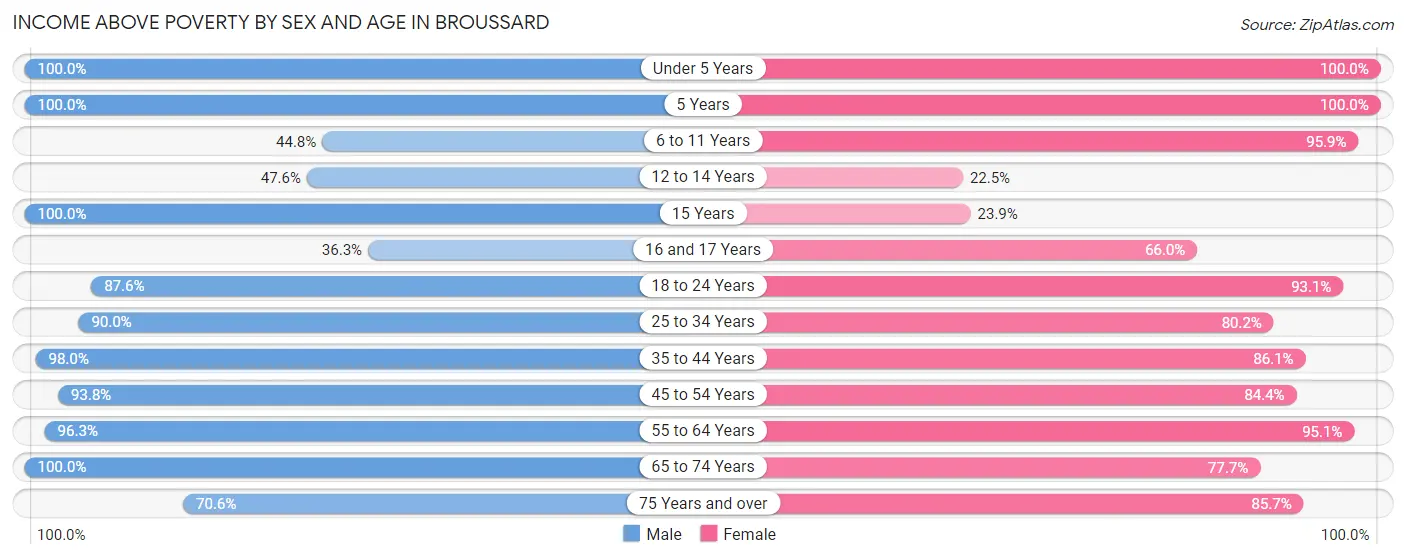
| Age Bracket | Male | Female |
| Under 5 Years | 757 (100.0%) | 324 (100.0%) |
| 5 Years | 85 (100.0%) | 61 (100.0%) |
| 6 to 11 Years | 240 (44.8%) | 349 (95.9%) |
| 12 to 14 Years | 180 (47.6%) | 94 (22.5%) |
| 15 Years | 124 (100.0%) | 44 (23.9%) |
| 16 and 17 Years | 82 (36.3%) | 62 (66.0%) |
| 18 to 24 Years | 368 (87.6%) | 603 (93.1%) |
| 25 to 34 Years | 837 (90.0%) | 994 (80.2%) |
| 35 to 44 Years | 1,106 (98.0%) | 907 (86.1%) |
| 45 to 54 Years | 728 (93.8%) | 459 (84.4%) |
| 55 to 64 Years | 620 (96.3%) | 892 (95.1%) |
| 65 to 74 Years | 405 (100.0%) | 264 (77.6%) |
| 75 Years and over | 48 (70.6%) | 138 (85.7%) |
| Total | 5,580 (86.1%) | 5,191 (81.5%) |
Income Below Poverty Among Married-Couple Families in Broussard
The poverty statistics for married-couple families in Broussard show that 2.5% or 67 of the total 2,734 families live below the poverty line. Families with 3 or 4 children have the highest poverty rate of 16.9%, comprising of 23 families. On the other hand, families with 5 or more children have the lowest poverty rate of 0.0%, which includes 0 families.
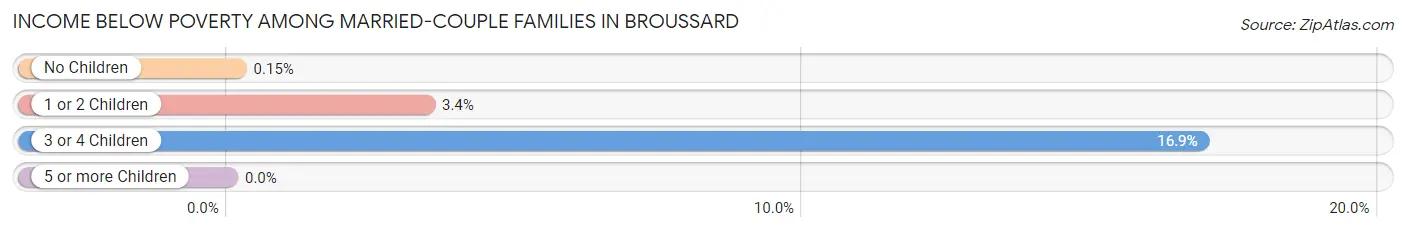
| Children | Above Poverty | Below Poverty |
| No Children | 1,345 (99.9%) | 2 (0.2%) |
| 1 or 2 Children | 1,181 (96.6%) | 42 (3.4%) |
| 3 or 4 Children | 113 (83.1%) | 23 (16.9%) |
| 5 or more Children | 28 (100.0%) | 0 (0.0%) |
| Total | 2,667 (97.6%) | 67 (2.5%) |
Income Below Poverty Among Single-Parent Households in Broussard
According to the poverty data in Broussard, 23.9% or 49 single-father households and 55.5% or 156 single-mother households are living below the poverty line. Among single-father households, those with 1 or 2 children have the highest poverty rate, with 49 households (36.3%) experiencing poverty. Likewise, among single-mother households, those with 5 or more children have the highest poverty rate, with 149 households (100.0%) falling below the poverty line.
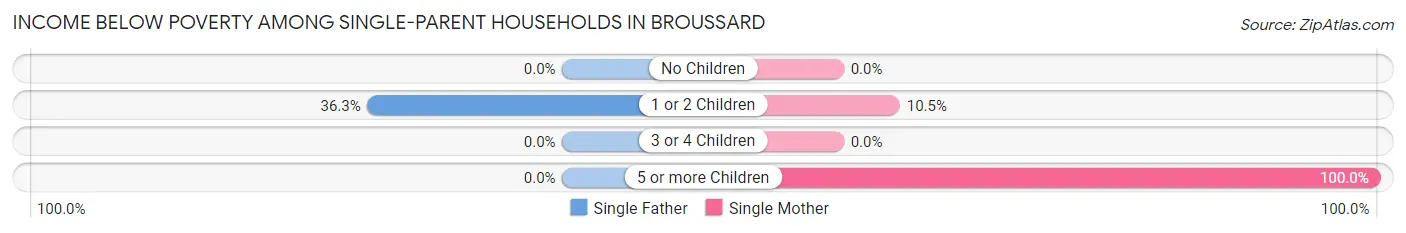
| Children | Single Father | Single Mother |
| No Children | 0 (0.0%) | 0 (0.0%) |
| 1 or 2 Children | 49 (36.3%) | 7 (10.4%) |
| 3 or 4 Children | 0 (0.0%) | 0 (0.0%) |
| 5 or more Children | 0 (0.0%) | 149 (100.0%) |
| Total | 49 (23.9%) | 156 (55.5%) |
Income Below Poverty Among Married-Couple vs Single-Parent Households in Broussard
The poverty data for Broussard shows that 67 of the married-couple family households (2.5%) and 205 of the single-parent households (42.2%) are living below the poverty level. Within the married-couple family households, those with 3 or 4 children have the highest poverty rate, with 23 households (16.9%) falling below the poverty line. Among the single-parent households, those with 5 or more children have the highest poverty rate, with 149 household (100.0%) living below poverty.
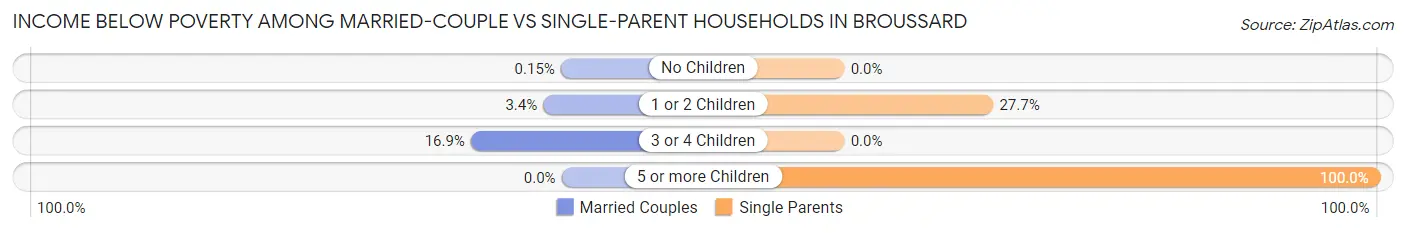
| Children | Married-Couple Families | Single-Parent Households |
| No Children | 2 (0.2%) | 0 (0.0%) |
| 1 or 2 Children | 42 (3.4%) | 56 (27.7%) |
| 3 or 4 Children | 23 (16.9%) | 0 (0.0%) |
| 5 or more Children | 0 (0.0%) | 149 (100.0%) |
| Total | 67 (2.5%) | 205 (42.2%) |
Race in Broussard
The most populous races in Broussard are White / Caucasian (10,040 | 75.4%), Black / African American (2,710 | 20.3%), and Two or more Races (481 | 3.6%).
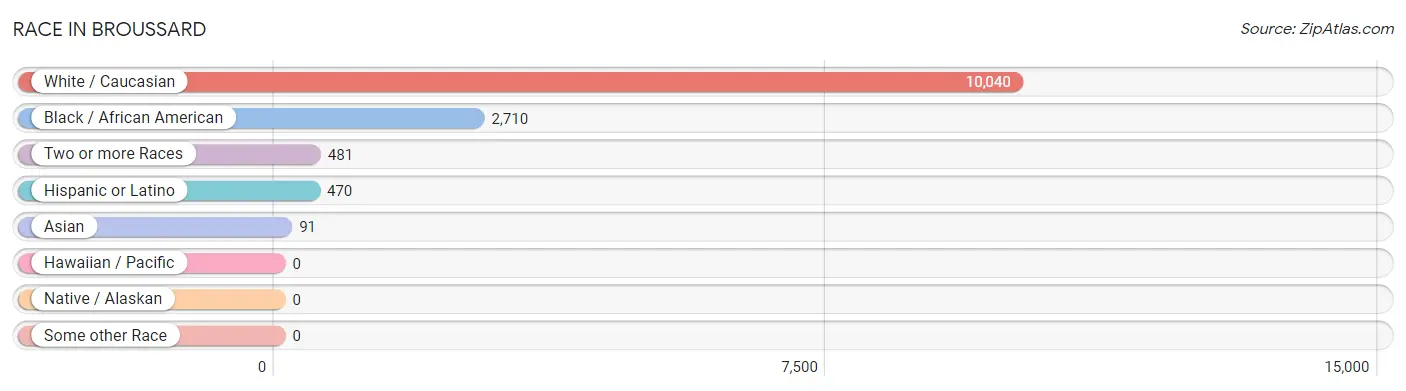
| Race | # Population | % Population |
| Asian | 91 | 0.7% |
| Black / African American | 2,710 | 20.3% |
| Hawaiian / Pacific | 0 | 0.0% |
| Hispanic or Latino | 470 | 3.5% |
| Native / Alaskan | 0 | 0.0% |
| White / Caucasian | 10,040 | 75.4% |
| Two or more Races | 481 | 3.6% |
| Some other Race | 0 | 0.0% |
| Total | 13,322 | 100.0% |
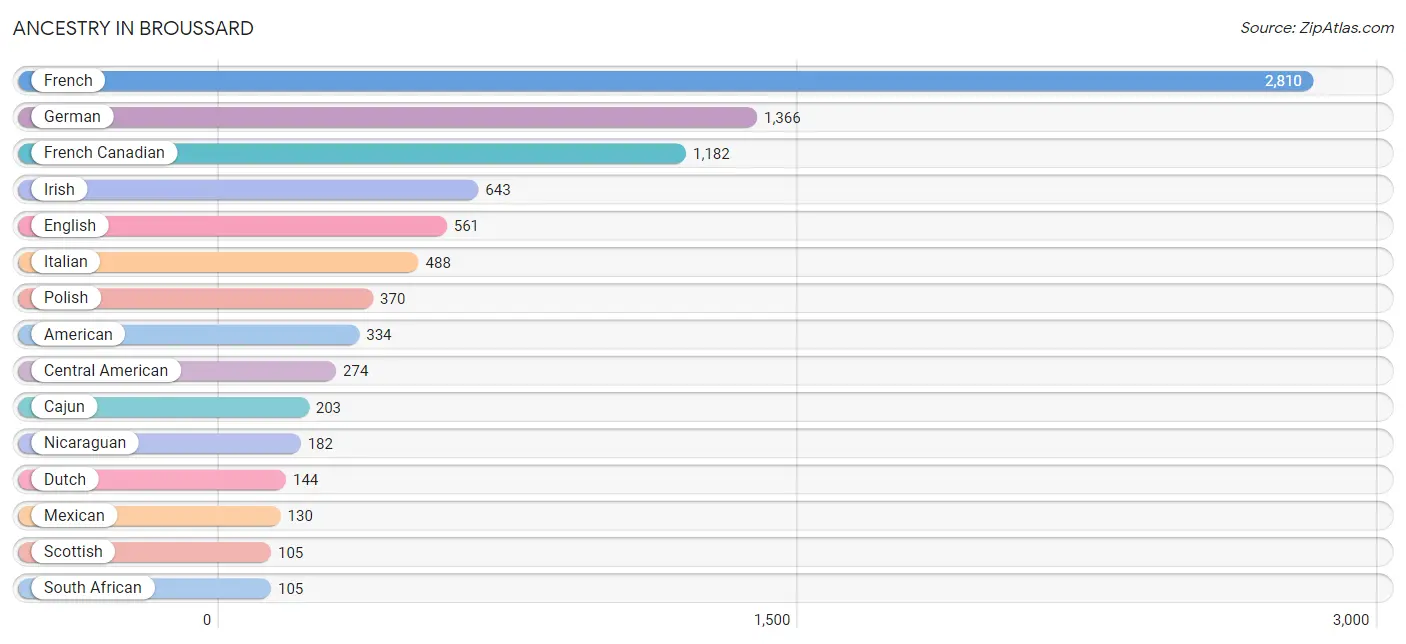
Ancestry in Broussard
The most populous ancestries reported in Broussard are French (2,810 | 21.1%), German (1,366 | 10.2%), French Canadian (1,182 | 8.9%), Irish (643 | 4.8%), and English (561 | 4.2%), together accounting for 49.3% of all Broussard residents.
| Ancestry | # Population | % Population |
| American | 334 | 2.5% |
| Argentinean | 29 | 0.2% |
| Armenian | 20 | 0.2% |
| Austrian | 19 | 0.1% |
| Belgian | 16 | 0.1% |
| British | 20 | 0.2% |
| Burmese | 12 | 0.1% |
| Cajun | 203 | 1.5% |
| Central American | 274 | 2.1% |
| Cherokee | 33 | 0.3% |
| Dutch | 144 | 1.1% |
| English | 561 | 4.2% |
| European | 29 | 0.2% |
| French | 2,810 | 21.1% |
| French Canadian | 1,182 | 8.9% |
| German | 1,366 | 10.2% |
| Honduran | 92 | 0.7% |
| Indian (Asian) | 31 | 0.2% |
| Iranian | 2 | 0.0% |
| Irish | 643 | 4.8% |
| Italian | 488 | 3.7% |
| Korean | 44 | 0.3% |
| Malaysian | 21 | 0.2% |
| Mexican | 130 | 1.0% |
| Nicaraguan | 182 | 1.4% |
| Norwegian | 50 | 0.4% |
| Polish | 370 | 2.8% |
| Puerto Rican | 23 | 0.2% |
| Scandinavian | 44 | 0.3% |
| Scotch-Irish | 13 | 0.1% |
| Scottish | 105 | 0.8% |
| Serbian | 21 | 0.2% |
| South African | 105 | 0.8% |
| South American | 29 | 0.2% |
| Spanish | 14 | 0.1% |
| Subsaharan African | 105 | 0.8% |
| Swedish | 60 | 0.4% |
| Welsh | 40 | 0.3% | View All 38 Rows |
Immigrants in Broussard
The most numerous immigrant groups reported in Broussard came from Latin America (265 | 2.0%), Bolivia (173 | 1.3%), South America (173 | 1.3%), Europe (102 | 0.8%), and Central America (92 | 0.7%), together accounting for 6.0% of all Broussard residents.
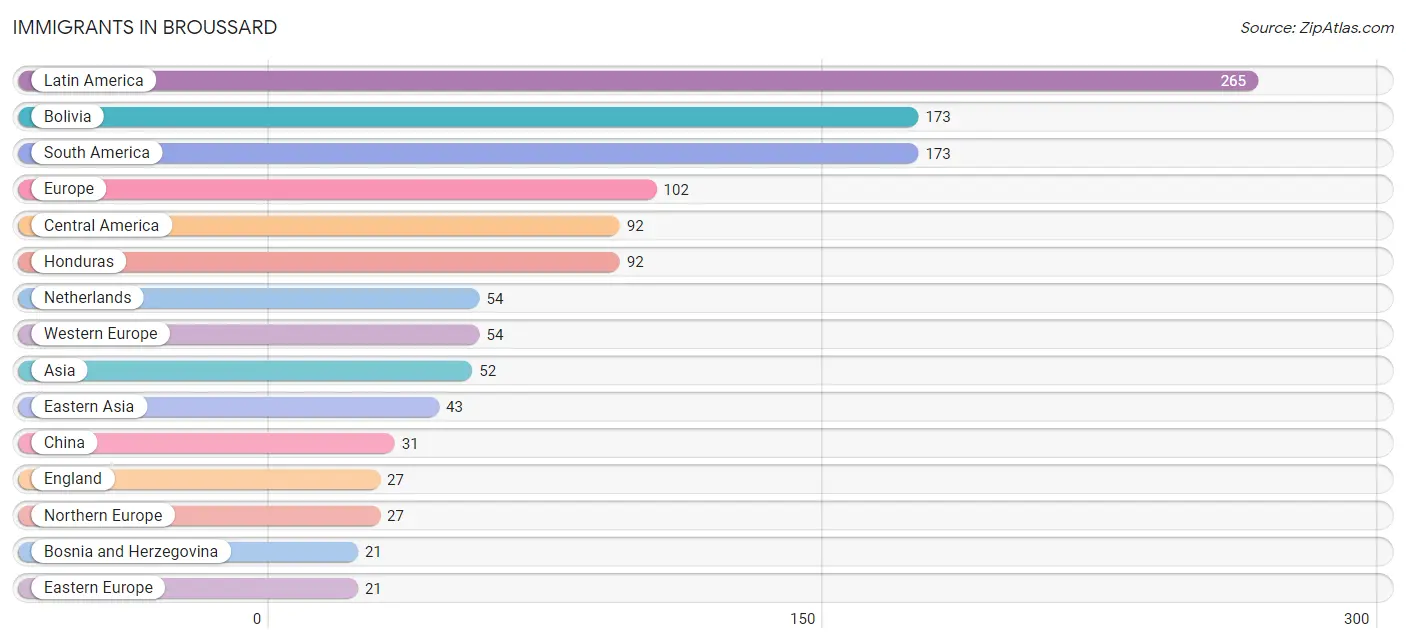
| Immigration Origin | # Population | % Population |
| Asia | 52 | 0.4% |
| Bolivia | 173 | 1.3% |
| Bosnia and Herzegovina | 21 | 0.2% |
| Central America | 92 | 0.7% |
| China | 31 | 0.2% |
| Eastern Asia | 43 | 0.3% |
| Eastern Europe | 21 | 0.2% |
| England | 27 | 0.2% |
| Europe | 102 | 0.8% |
| Honduras | 92 | 0.7% |
| Iran | 2 | 0.0% |
| Korea | 12 | 0.1% |
| Latin America | 265 | 2.0% |
| Netherlands | 54 | 0.4% |
| Northern Europe | 27 | 0.2% |
| Philippines | 7 | 0.1% |
| South America | 173 | 1.3% |
| South Central Asia | 2 | 0.0% |
| South Eastern Asia | 7 | 0.1% |
| Taiwan | 19 | 0.1% |
| Western Europe | 54 | 0.4% | View All 21 Rows |
Sex and Age in Broussard
Sex and Age in Broussard
The most populous age groups in Broussard are 10 to 14 Years (917 | 13.3%) for men and 35 to 39 Years (763 | 11.9%) for women.
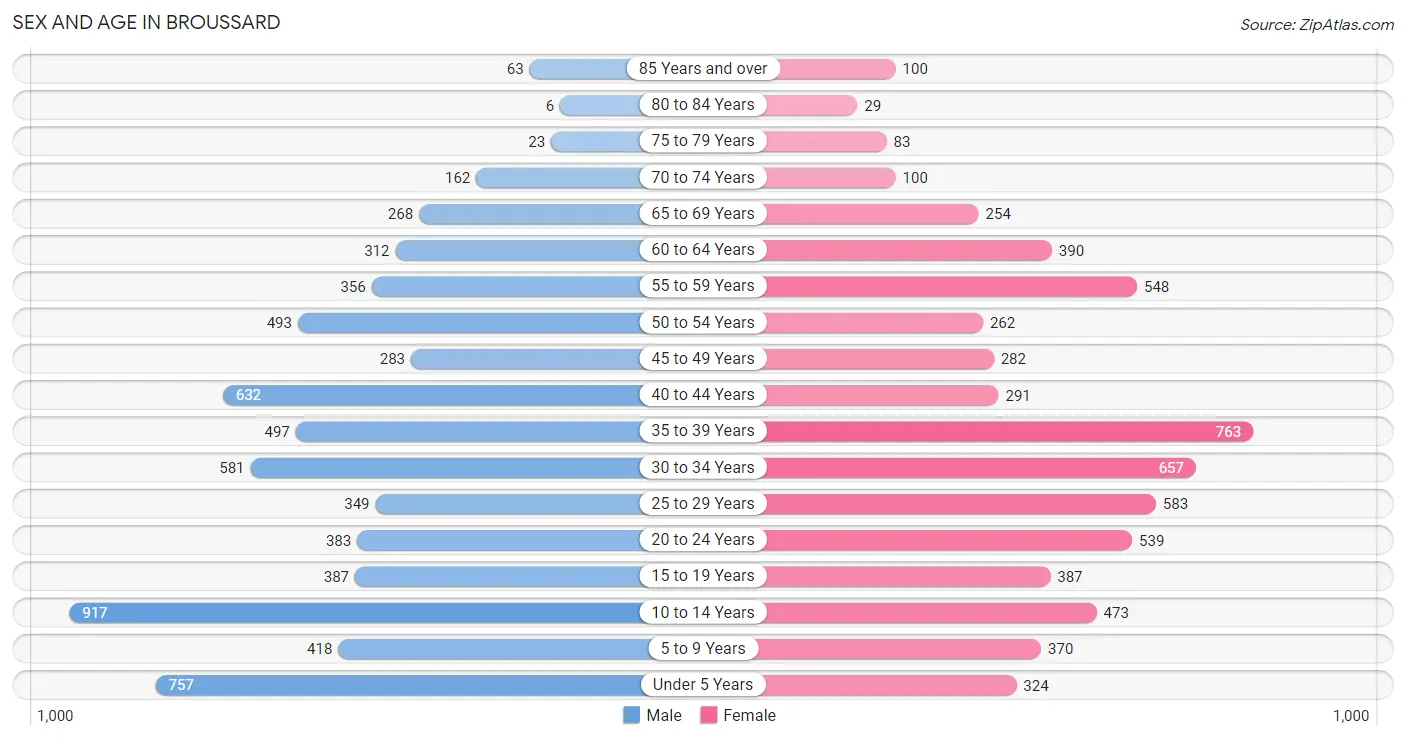
| Age Bracket | Male | Female |
| Under 5 Years | 757 (11.0%) | 324 (5.0%) |
| 5 to 9 Years | 418 (6.1%) | 370 (5.8%) |
| 10 to 14 Years | 917 (13.3%) | 473 (7.3%) |
| 15 to 19 Years | 387 (5.6%) | 387 (6.0%) |
| 20 to 24 Years | 383 (5.6%) | 539 (8.4%) |
| 25 to 29 Years | 349 (5.1%) | 583 (9.1%) |
| 30 to 34 Years | 581 (8.4%) | 657 (10.2%) |
| 35 to 39 Years | 497 (7.2%) | 763 (11.9%) |
| 40 to 44 Years | 632 (9.2%) | 291 (4.5%) |
| 45 to 49 Years | 283 (4.1%) | 282 (4.4%) |
| 50 to 54 Years | 493 (7.2%) | 262 (4.1%) |
| 55 to 59 Years | 356 (5.2%) | 548 (8.5%) |
| 60 to 64 Years | 312 (4.5%) | 390 (6.1%) |
| 65 to 69 Years | 268 (3.9%) | 254 (4.0%) |
| 70 to 74 Years | 162 (2.4%) | 100 (1.5%) |
| 75 to 79 Years | 23 (0.3%) | 83 (1.3%) |
| 80 to 84 Years | 6 (0.1%) | 29 (0.4%) |
| 85 Years and over | 63 (0.9%) | 100 (1.5%) |
| Total | 6,887 (100.0%) | 6,435 (100.0%) |
Families and Households in Broussard
Median Family Size in Broussard
The median family size in Broussard is 3.41 persons per family, with single female/mother families (281 | 8.7%) accounting for the largest median family size of 5.32 persons per family. On the other hand, single male/father families (205 | 6.4%) represent the smallest median family size with 2.86 persons per family.
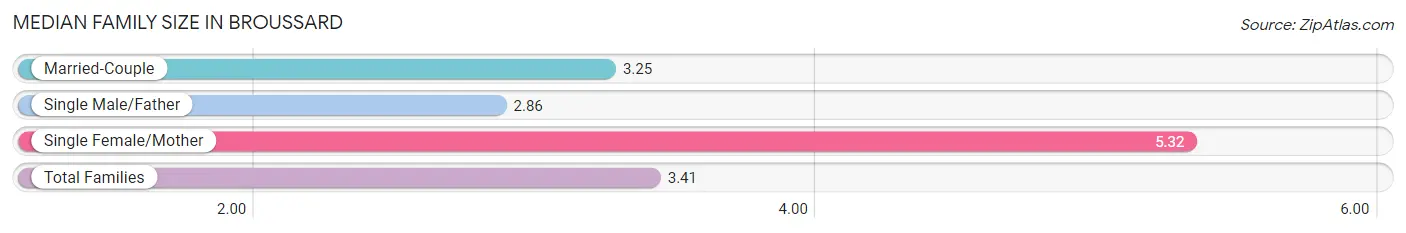
| Family Type | # Families | Family Size |
| Married-Couple | 2,734 (84.9%) | 3.25 |
| Single Male/Father | 205 (6.4%) | 2.86 |
| Single Female/Mother | 281 (8.7%) | 5.32 |
| Total Families | 3,220 (100.0%) | 3.41 |
Median Household Size in Broussard
The median household size in Broussard is 2.99 persons per household, with single female/mother households (281 | 6.4%) accounting for the largest median household size of 5.58 persons per household. non-family households (1,176 | 26.8%) represent the smallest median household size with 1.66 persons per household.
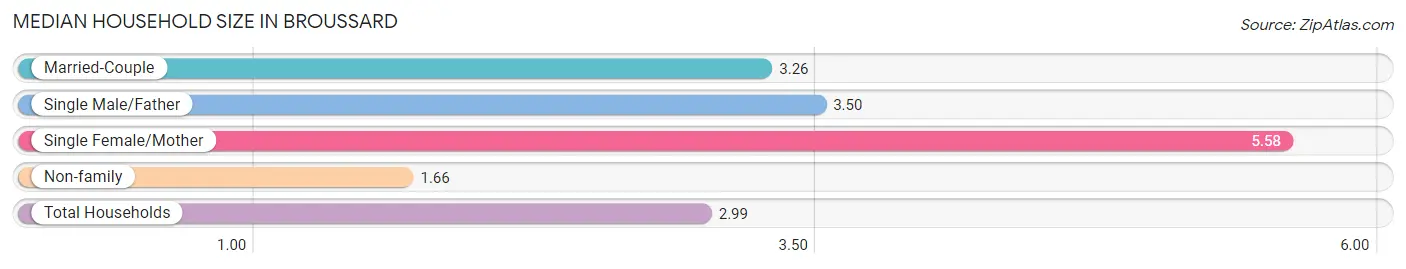
| Household Type | # Households | Household Size |
| Married-Couple | 2,734 (62.2%) | 3.26 |
| Single Male/Father | 205 (4.7%) | 3.50 |
| Single Female/Mother | 281 (6.4%) | 5.58 |
| Non-family | 1,176 (26.8%) | 1.66 |
| Total Households | 4,396 (100.0%) | 2.99 |
Household Size by Marriage Status in Broussard
Out of a total of 4,396 households in Broussard, 3,220 (73.3%) are family households, while 1,176 (26.8%) are nonfamily households. The most numerous type of family households are 2-person households, comprising 1,036, and the most common type of nonfamily households are 1-person households, comprising 782.
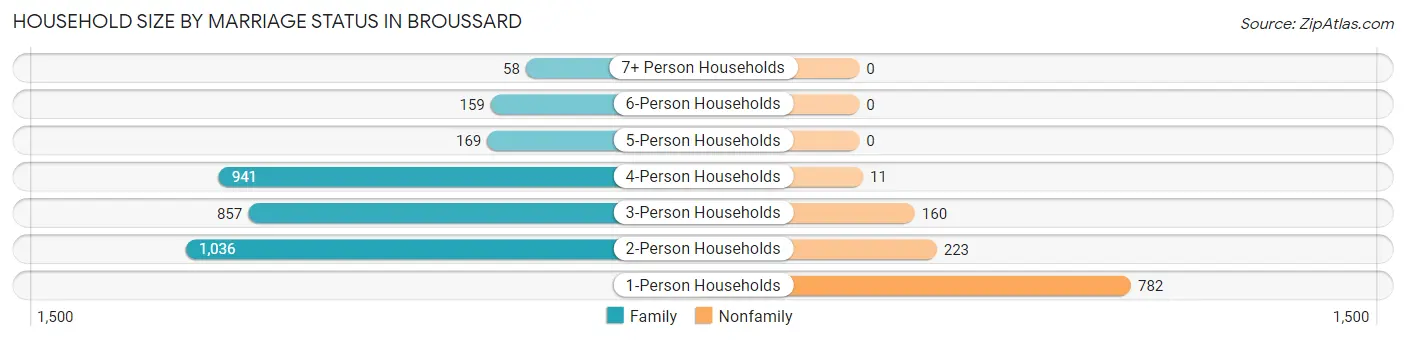
| Household Size | Family Households | Nonfamily Households |
| 1-Person Households | - | 782 (17.8%) |
| 2-Person Households | 1,036 (23.6%) | 223 (5.1%) |
| 3-Person Households | 857 (19.5%) | 160 (3.6%) |
| 4-Person Households | 941 (21.4%) | 11 (0.3%) |
| 5-Person Households | 169 (3.8%) | 0 (0.0%) |
| 6-Person Households | 159 (3.6%) | 0 (0.0%) |
| 7+ Person Households | 58 (1.3%) | 0 (0.0%) |
| Total | 3,220 (73.3%) | 1,176 (26.8%) |
Female Fertility in Broussard
Fertility by Age in Broussard
Average fertility rate in Broussard is 75.0 births per 1,000 women. Women in the age bracket of 20 to 34 years have the highest fertility rate with 121.0 births per 1,000 women. Women in the age bracket of 20 to 34 years acount for 80.2% of all women with births.
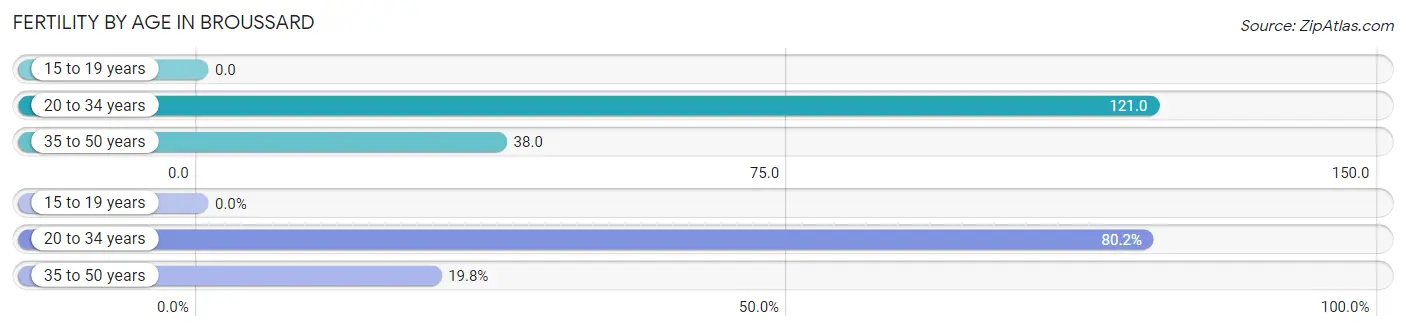
| Age Bracket | Women with Births | Births / 1,000 Women |
| 15 to 19 years | 0 (0.0%) | 0.0 |
| 20 to 34 years | 215 (80.2%) | 121.0 |
| 35 to 50 years | 53 (19.8%) | 38.0 |
| Total | 268 (100.0%) | 75.0 |
Fertility by Age by Marriage Status in Broussard
84.0% of women with births (268) in Broussard are married. The highest percentage of unmarried women with births falls into 20 to 34 years age bracket with 20.0% of them unmarried at the time of birth, while the lowest percentage of unmarried women with births belong to 35 to 50 years age bracket with 0.0% of them unmarried.
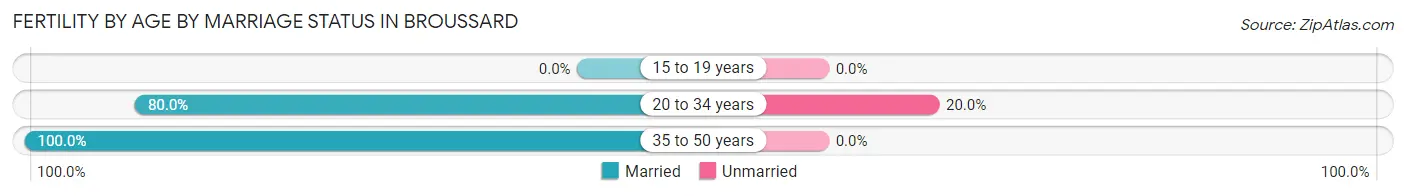
| Age Bracket | Married | Unmarried |
| 15 to 19 years | 0 (0.0%) | 0 (0.0%) |
| 20 to 34 years | 172 (80.0%) | 43 (20.0%) |
| 35 to 50 years | 53 (100.0%) | 0 (0.0%) |
| Total | 225 (84.0%) | 43 (16.0%) |
Fertility by Education in Broussard
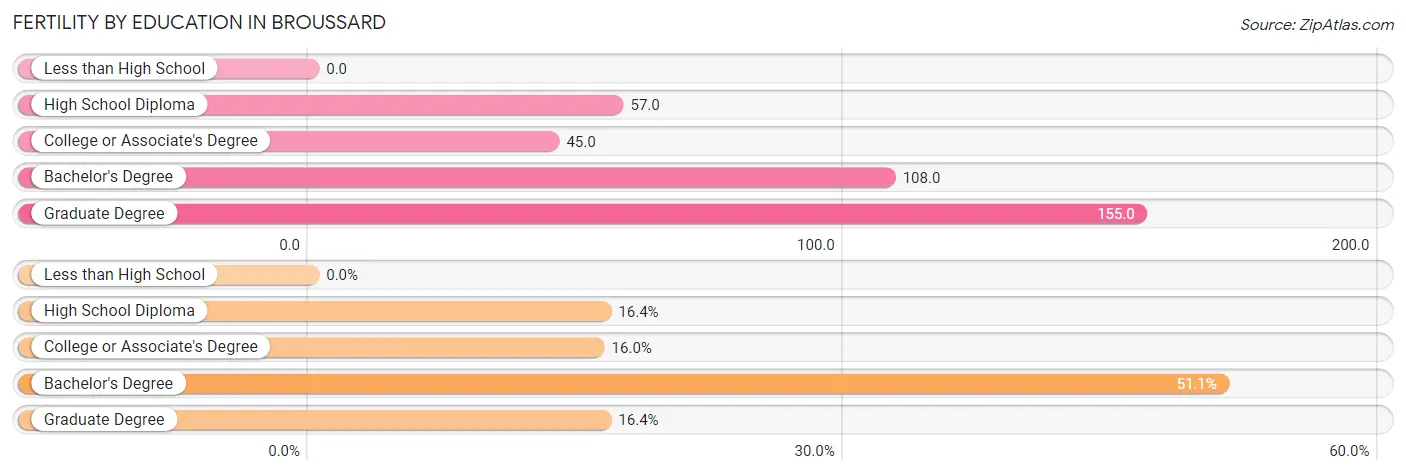
| Educational Attainment | Women with Births | Births / 1,000 Women |
| Less than High School | 0 (0.0%) | 0.0 |
| High School Diploma | 44 (16.4%) | 57.0 |
| College or Associate's Degree | 43 (16.0%) | 45.0 |
| Bachelor's Degree | 137 (51.1%) | 108.0 |
| Graduate Degree | 44 (16.4%) | 155.0 |
| Total | 268 (100.0%) | 75.0 |
Fertility by Education by Marriage Status in Broussard
16.0% of women with births in Broussard are unmarried. Women with the educational attainment of college or associate's degree are most likely to be married with 100.0% of them married at childbirth, while women with the educational attainment of high school diploma are least likely to be married with 31.8% of them unmarried at childbirth.
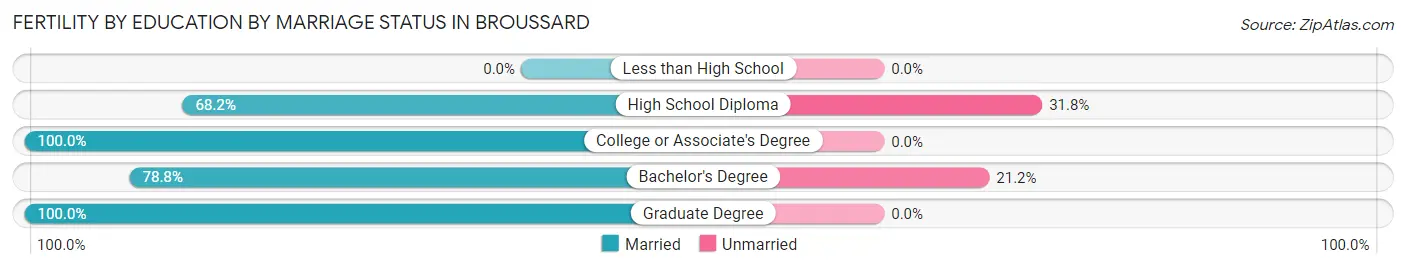
| Educational Attainment | Married | Unmarried |
| Less than High School | 0 (0.0%) | 0 (0.0%) |
| High School Diploma | 30 (68.2%) | 14 (31.8%) |
| College or Associate's Degree | 43 (100.0%) | 0 (0.0%) |
| Bachelor's Degree | 108 (78.8%) | 29 (21.2%) |
| Graduate Degree | 44 (100.0%) | 0 (0.0%) |
| Total | 225 (84.0%) | 43 (16.0%) |
Employment Characteristics in Broussard
Employment by Class of Employer in Broussard
Among the 7,045 employed individuals in Broussard, private company employees (4,323 | 61.4%), local government employees (737 | 10.5%), and not-for-profit organizations (594 | 8.4%) make up the most common classes of employment.
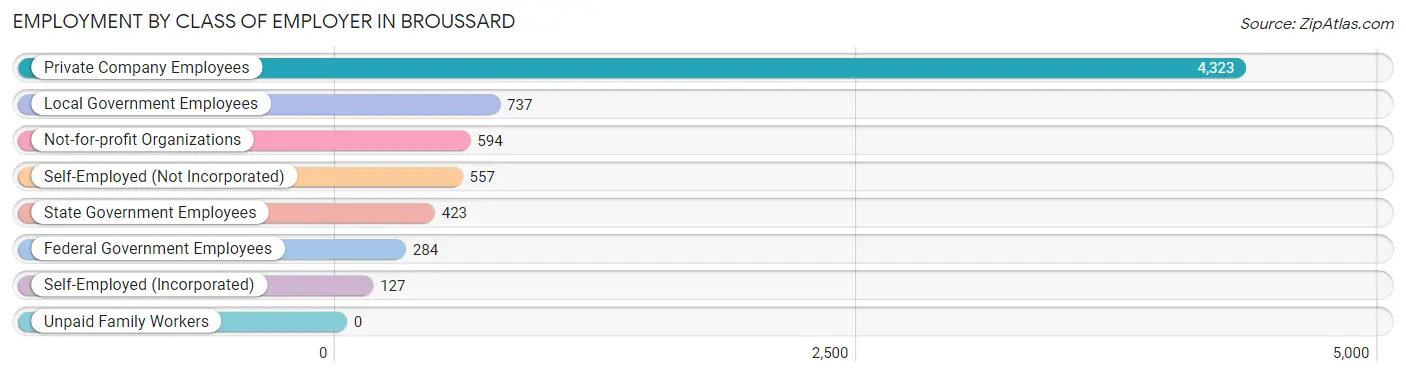
| Employer Class | # Employees | % Employees |
| Private Company Employees | 4,323 | 61.4% |
| Self-Employed (Incorporated) | 127 | 1.8% |
| Self-Employed (Not Incorporated) | 557 | 7.9% |
| Not-for-profit Organizations | 594 | 8.4% |
| Local Government Employees | 737 | 10.5% |
| State Government Employees | 423 | 6.0% |
| Federal Government Employees | 284 | 4.0% |
| Unpaid Family Workers | 0 | 0.0% |
| Total | 7,045 | 100.0% |
Employment Status by Age in Broussard
According to the labor force statistics for Broussard, out of the total population over 16 years of age (9,755), 76.0% or 7,414 individuals are in the labor force, with 3.7% or 274 of them unemployed. The age group with the highest labor force participation rate is 35 to 44 years, with 94.0% or 2,052 individuals in the labor force. Within the labor force, the 35 to 44 years age range has the highest percentage of unemployed individuals, with 7.8% or 160 of them being unemployed.
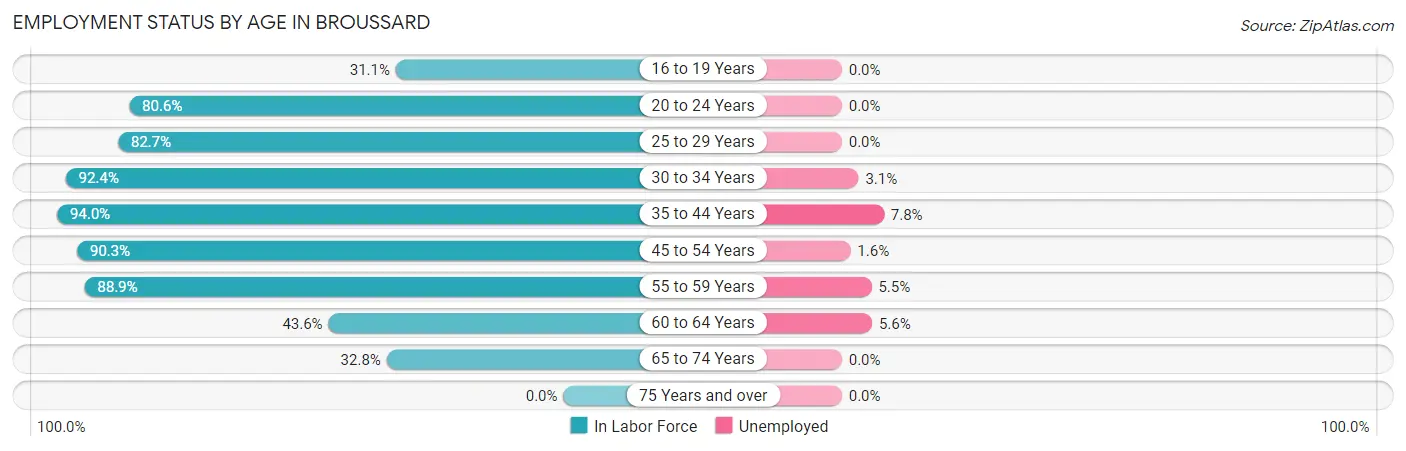
| Age Bracket | In Labor Force | Unemployed |
| 16 to 19 Years | 145 (31.1%) | 0 (0.0%) |
| 20 to 24 Years | 743 (80.6%) | 0 (0.0%) |
| 25 to 29 Years | 771 (82.7%) | 0 (0.0%) |
| 30 to 34 Years | 1,144 (92.4%) | 35 (3.1%) |
| 35 to 44 Years | 2,052 (94.0%) | 160 (7.8%) |
| 45 to 54 Years | 1,192 (90.3%) | 19 (1.6%) |
| 55 to 59 Years | 804 (88.9%) | 44 (5.5%) |
| 60 to 64 Years | 306 (43.6%) | 17 (5.6%) |
| 65 to 74 Years | 257 (32.8%) | 0 (0.0%) |
| 75 Years and over | 0 (0.0%) | 0 (0.0%) |
| Total | 7,414 (76.0%) | 274 (3.7%) |
Employment Status by Educational Attainment in Broussard
According to labor force statistics for Broussard, 86.1% of individuals (6,267) out of the total population between 25 and 64 years of age (7,279) are in the labor force, with 4.4% or 276 of them being unemployed. The group with the highest labor force participation rate are those with the educational attainment of bachelor's degree or higher, with 87.4% or 2,416 individuals in the labor force. Within the labor force, individuals with less than high school education have the highest percentage of unemployment, with 11.6% or 56 of them being unemployed.
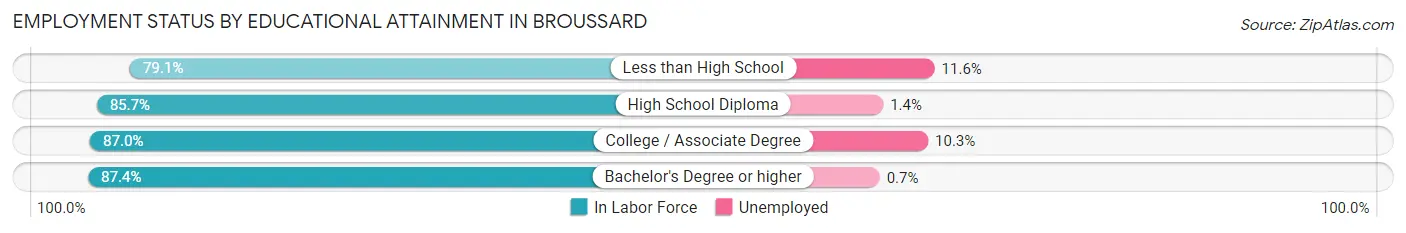
| Educational Attainment | In Labor Force | Unemployed |
| Less than High School | 484 (79.1%) | 71 (11.6%) |
| High School Diploma | 1,628 (85.7%) | 27 (1.4%) |
| College / Associate Degree | 1,743 (87.0%) | 206 (10.3%) |
| Bachelor's Degree or higher | 2,416 (87.4%) | 19 (0.7%) |
| Total | 6,267 (86.1%) | 320 (4.4%) |
Employment Occupations by Sex in Broussard
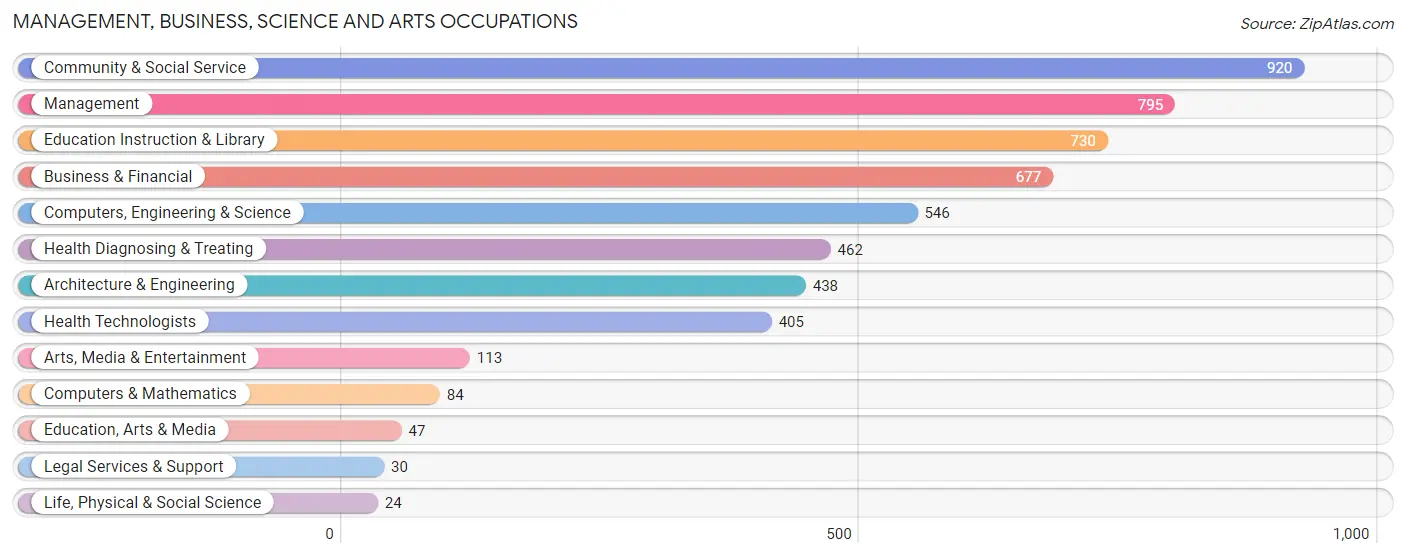
Management, Business, Science and Arts Occupations
The most common Management, Business, Science and Arts occupations in Broussard are Community & Social Service (920 | 12.9%), Management (795 | 11.1%), Education Instruction & Library (730 | 10.2%), Business & Financial (677 | 9.5%), and Computers, Engineering & Science (546 | 7.6%).
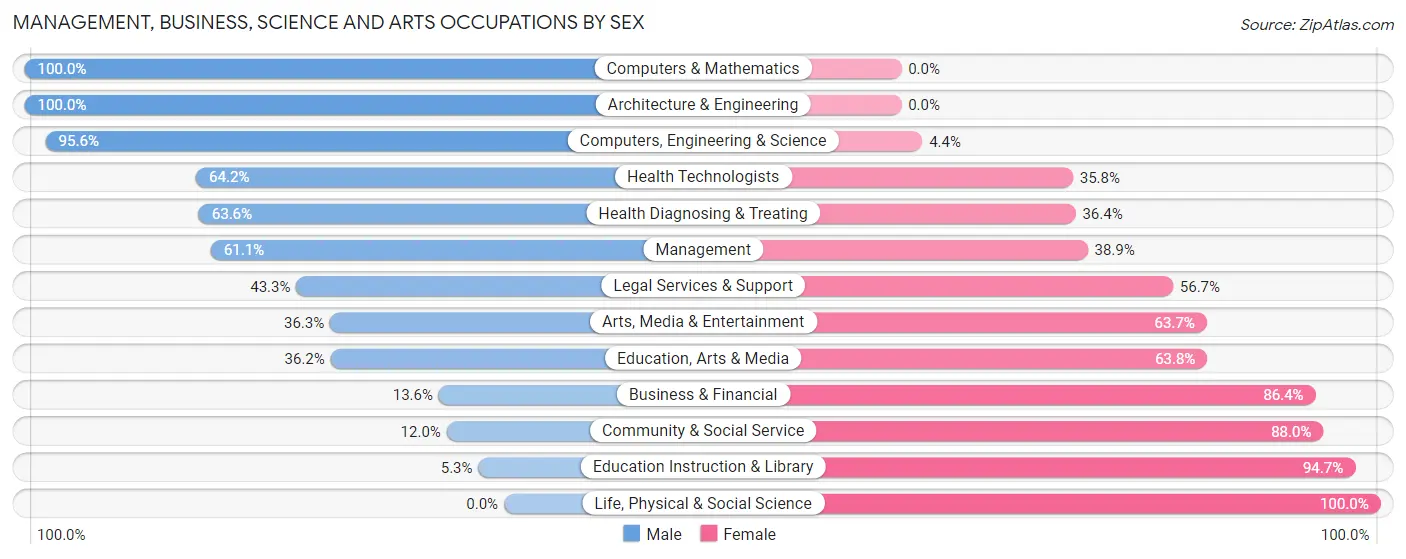
Management, Business, Science and Arts Occupations by Sex
Within the Management, Business, Science and Arts occupations in Broussard, the most male-oriented occupations are Computers & Mathematics (100.0%), Architecture & Engineering (100.0%), and Computers, Engineering & Science (95.6%), while the most female-oriented occupations are Life, Physical & Social Science (100.0%), Education Instruction & Library (94.7%), and Community & Social Service (88.0%).
| Occupation | Male | Female |
| Management | 486 (61.1%) | 309 (38.9%) |
| Business & Financial | 92 (13.6%) | 585 (86.4%) |
| Computers, Engineering & Science | 522 (95.6%) | 24 (4.4%) |
| Computers & Mathematics | 84 (100.0%) | 0 (0.0%) |
| Architecture & Engineering | 438 (100.0%) | 0 (0.0%) |
| Life, Physical & Social Science | 0 (0.0%) | 24 (100.0%) |
| Community & Social Service | 110 (12.0%) | 810 (88.0%) |
| Education, Arts & Media | 17 (36.2%) | 30 (63.8%) |
| Legal Services & Support | 13 (43.3%) | 17 (56.7%) |
| Education Instruction & Library | 39 (5.3%) | 691 (94.7%) |
| Arts, Media & Entertainment | 41 (36.3%) | 72 (63.7%) |
| Health Diagnosing & Treating | 294 (63.6%) | 168 (36.4%) |
| Health Technologists | 260 (64.2%) | 145 (35.8%) |
| Total (Category) | 1,504 (44.2%) | 1,896 (55.8%) |
| Total (Overall) | 3,470 (48.6%) | 3,670 (51.4%) |
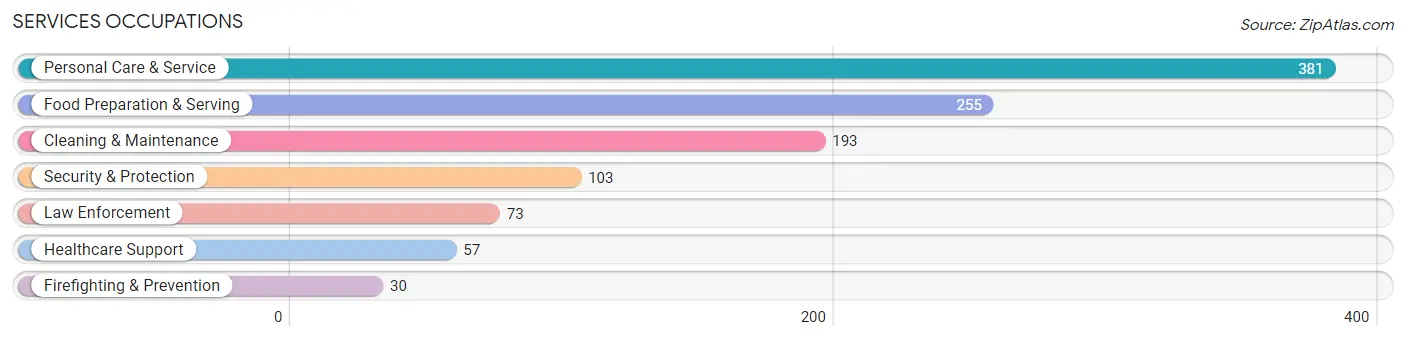
Services Occupations
The most common Services occupations in Broussard are Personal Care & Service (381 | 5.3%), Food Preparation & Serving (255 | 3.6%), Cleaning & Maintenance (193 | 2.7%), Security & Protection (103 | 1.4%), and Law Enforcement (73 | 1.0%).
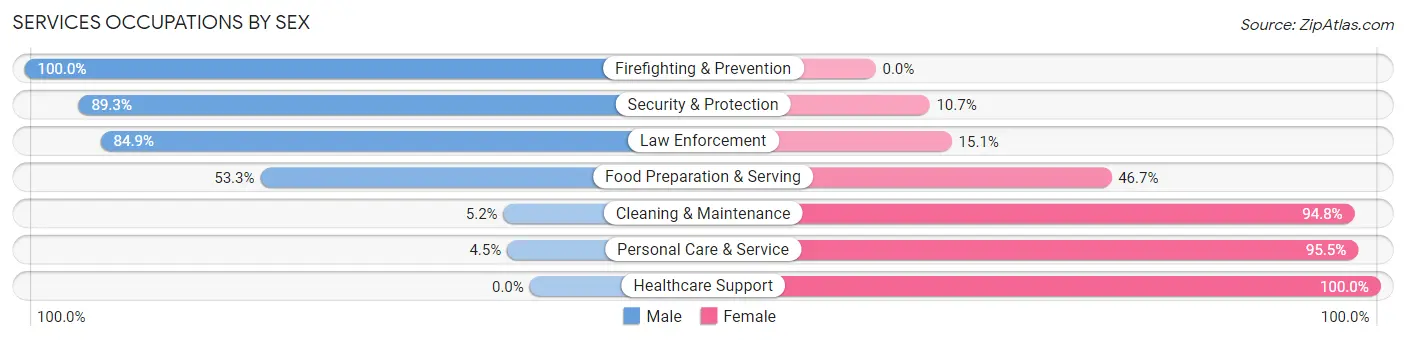
Services Occupations by Sex
Within the Services occupations in Broussard, the most male-oriented occupations are Firefighting & Prevention (100.0%), Security & Protection (89.3%), and Law Enforcement (84.9%), while the most female-oriented occupations are Healthcare Support (100.0%), Personal Care & Service (95.5%), and Cleaning & Maintenance (94.8%).
| Occupation | Male | Female |
| Healthcare Support | 0 (0.0%) | 57 (100.0%) |
| Security & Protection | 92 (89.3%) | 11 (10.7%) |
| Firefighting & Prevention | 30 (100.0%) | 0 (0.0%) |
| Law Enforcement | 62 (84.9%) | 11 (15.1%) |
| Food Preparation & Serving | 136 (53.3%) | 119 (46.7%) |
| Cleaning & Maintenance | 10 (5.2%) | 183 (94.8%) |
| Personal Care & Service | 17 (4.5%) | 364 (95.5%) |
| Total (Category) | 255 (25.8%) | 734 (74.2%) |
| Total (Overall) | 3,470 (48.6%) | 3,670 (51.4%) |
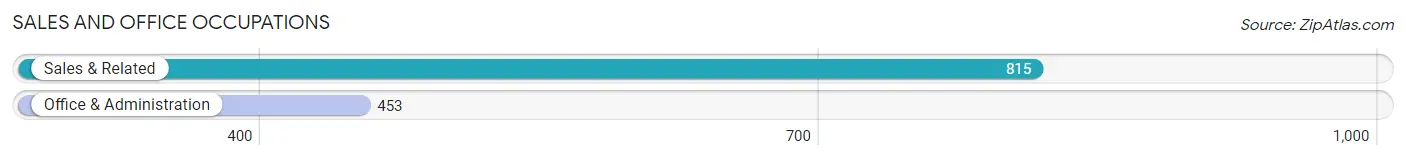
Sales and Office Occupations
The most common Sales and Office occupations in Broussard are Sales & Related (815 | 11.4%), and Office & Administration (453 | 6.3%).
Sales and Office Occupations by Sex
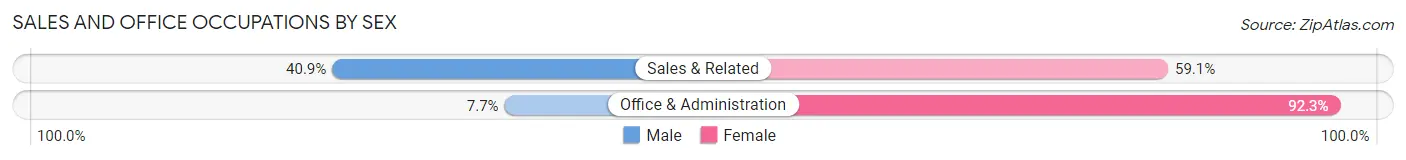
| Occupation | Male | Female |
| Sales & Related | 333 (40.9%) | 482 (59.1%) |
| Office & Administration | 35 (7.7%) | 418 (92.3%) |
| Total (Category) | 368 (29.0%) | 900 (71.0%) |
| Total (Overall) | 3,470 (48.6%) | 3,670 (51.4%) |
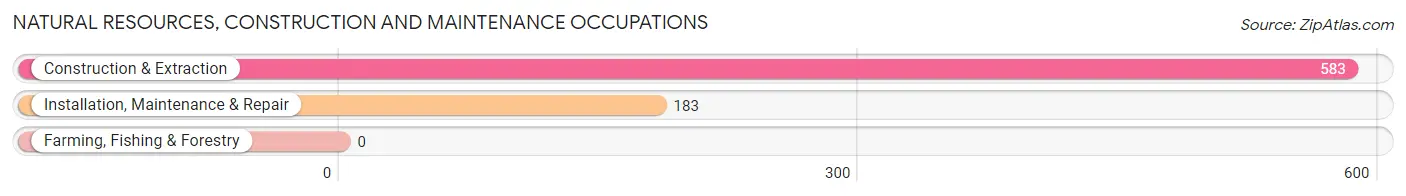
Natural Resources, Construction and Maintenance Occupations
The most common Natural Resources, Construction and Maintenance occupations in Broussard are Construction & Extraction (583 | 8.2%), and Installation, Maintenance & Repair (183 | 2.6%).
Natural Resources, Construction and Maintenance Occupations by Sex
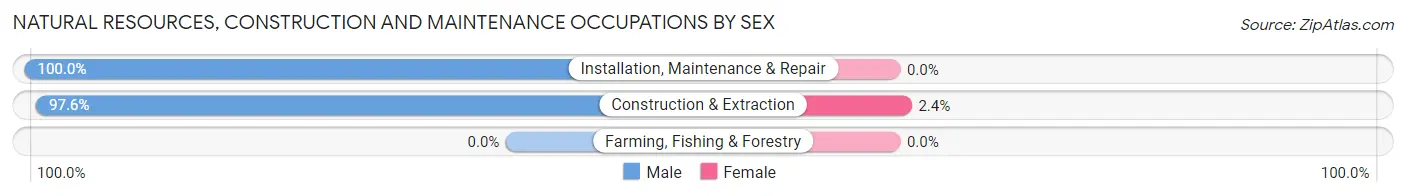
| Occupation | Male | Female |
| Farming, Fishing & Forestry | 0 (0.0%) | 0 (0.0%) |
| Construction & Extraction | 569 (97.6%) | 14 (2.4%) |
| Installation, Maintenance & Repair | 183 (100.0%) | 0 (0.0%) |
| Total (Category) | 752 (98.2%) | 14 (1.8%) |
| Total (Overall) | 3,470 (48.6%) | 3,670 (51.4%) |
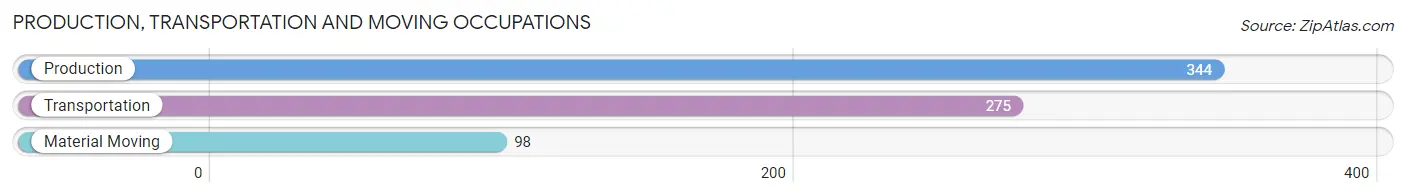
Production, Transportation and Moving Occupations
The most common Production, Transportation and Moving occupations in Broussard are Production (344 | 4.8%), Transportation (275 | 3.8%), and Material Moving (98 | 1.4%).
Production, Transportation and Moving Occupations by Sex
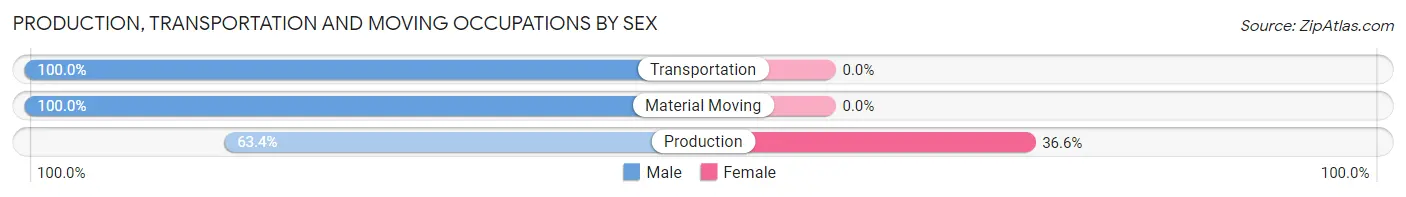
| Occupation | Male | Female |
| Production | 218 (63.4%) | 126 (36.6%) |
| Transportation | 275 (100.0%) | 0 (0.0%) |
| Material Moving | 98 (100.0%) | 0 (0.0%) |
| Total (Category) | 591 (82.4%) | 126 (17.6%) |
| Total (Overall) | 3,470 (48.6%) | 3,670 (51.4%) |
Employment Industries by Sex in Broussard
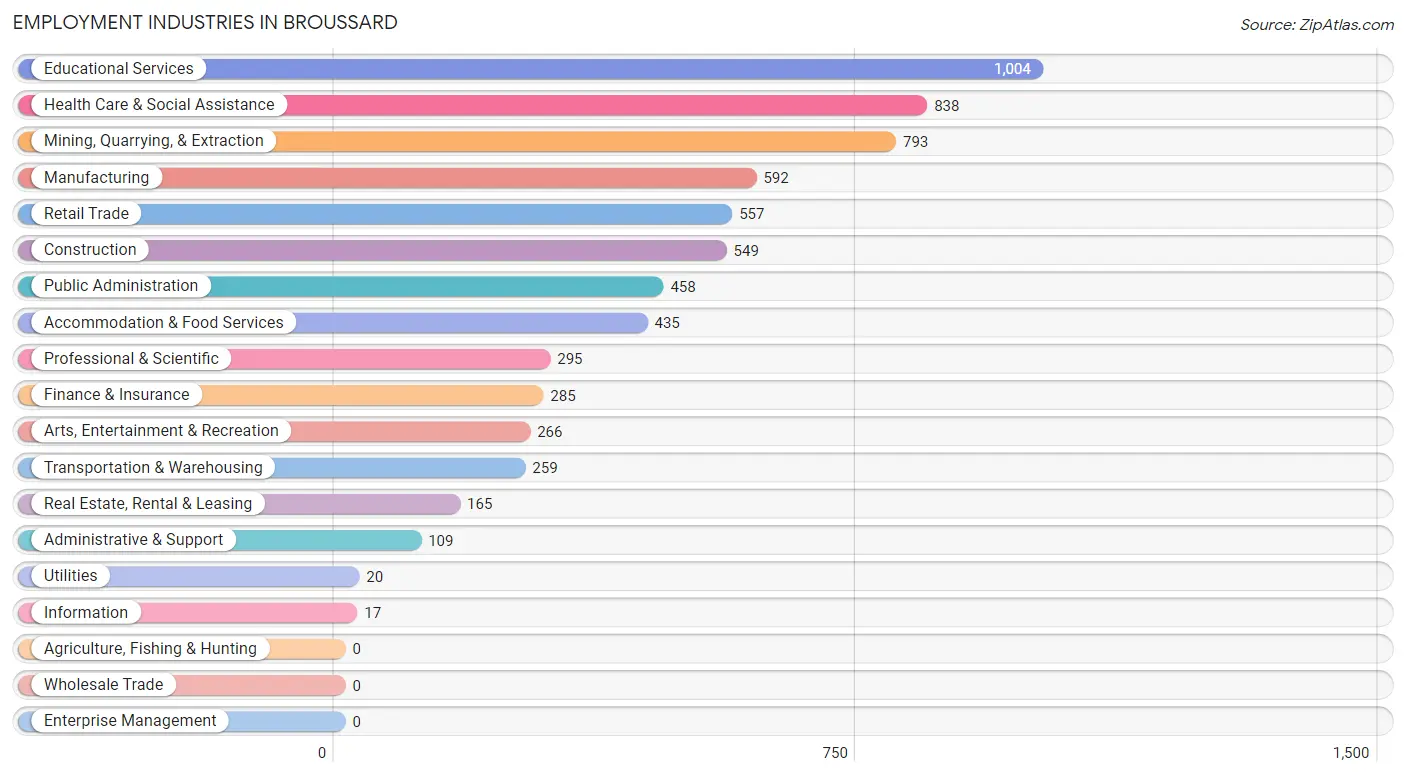
Employment Industries in Broussard
The major employment industries in Broussard include Educational Services (1,004 | 14.1%), Health Care & Social Assistance (838 | 11.7%), Mining, Quarrying, & Extraction (793 | 11.1%), Manufacturing (592 | 8.3%), and Retail Trade (557 | 7.8%).
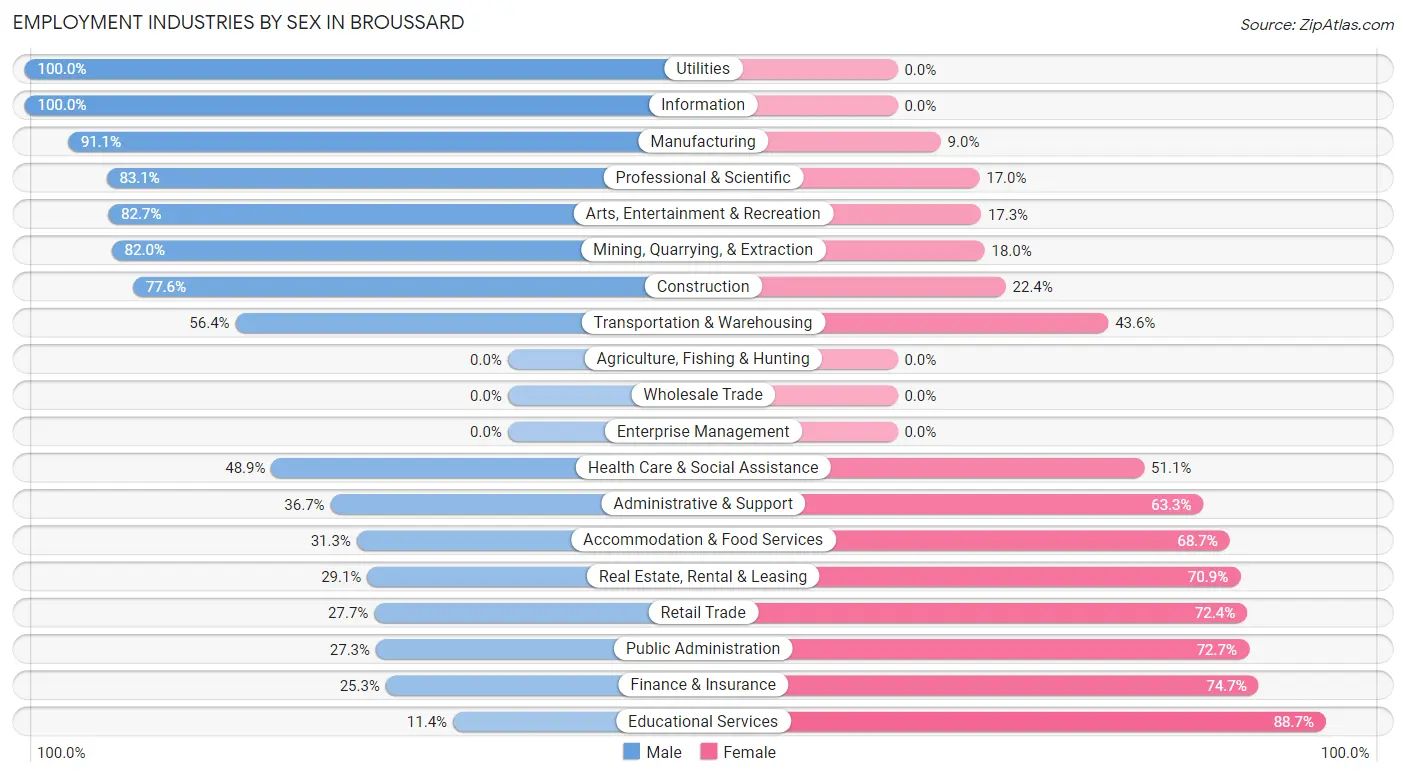
Employment Industries by Sex in Broussard
The Broussard industries that see more men than women are Utilities (100.0%), Information (100.0%), and Manufacturing (91.0%), whereas the industries that tend to have a higher number of women are Educational Services (88.6%), Finance & Insurance (74.7%), and Public Administration (72.7%).
| Industry | Male | Female |
| Agriculture, Fishing & Hunting | 0 (0.0%) | 0 (0.0%) |
| Mining, Quarrying, & Extraction | 650 (82.0%) | 143 (18.0%) |
| Construction | 426 (77.6%) | 123 (22.4%) |
| Manufacturing | 539 (91.0%) | 53 (8.9%) |
| Wholesale Trade | 0 (0.0%) | 0 (0.0%) |
| Retail Trade | 154 (27.7%) | 403 (72.4%) |
| Transportation & Warehousing | 146 (56.4%) | 113 (43.6%) |
| Utilities | 20 (100.0%) | 0 (0.0%) |
| Information | 17 (100.0%) | 0 (0.0%) |
| Finance & Insurance | 72 (25.3%) | 213 (74.7%) |
| Real Estate, Rental & Leasing | 48 (29.1%) | 117 (70.9%) |
| Professional & Scientific | 245 (83.1%) | 50 (17.0%) |
| Enterprise Management | 0 (0.0%) | 0 (0.0%) |
| Administrative & Support | 40 (36.7%) | 69 (63.3%) |
| Educational Services | 114 (11.4%) | 890 (88.6%) |
| Health Care & Social Assistance | 410 (48.9%) | 428 (51.1%) |
| Arts, Entertainment & Recreation | 220 (82.7%) | 46 (17.3%) |
| Accommodation & Food Services | 136 (31.3%) | 299 (68.7%) |
| Public Administration | 125 (27.3%) | 333 (72.7%) |
| Total | 3,470 (48.6%) | 3,670 (51.4%) |
Education in Broussard
School Enrollment in Broussard
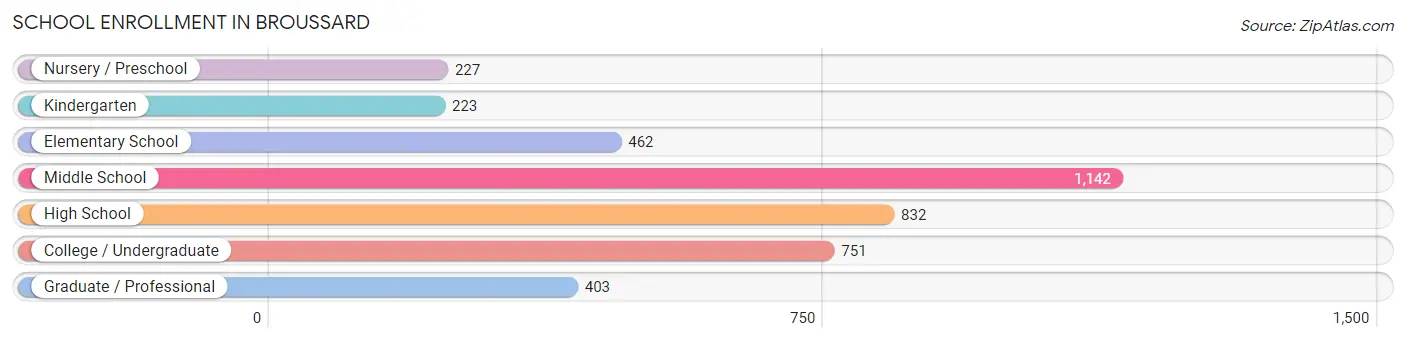
The most common levels of schooling among the 4,040 students in Broussard are middle school (1,142 | 28.3%), high school (832 | 20.6%), and college / undergraduate (751 | 18.6%).
| School Level | # Students | % Students |
| Nursery / Preschool | 227 | 5.6% |
| Kindergarten | 223 | 5.5% |
| Elementary School | 462 | 11.4% |
| Middle School | 1,142 | 28.3% |
| High School | 832 | 20.6% |
| College / Undergraduate | 751 | 18.6% |
| Graduate / Professional | 403 | 10.0% |
| Total | 4,040 | 100.0% |
School Enrollment by Age by Funding Source in Broussard
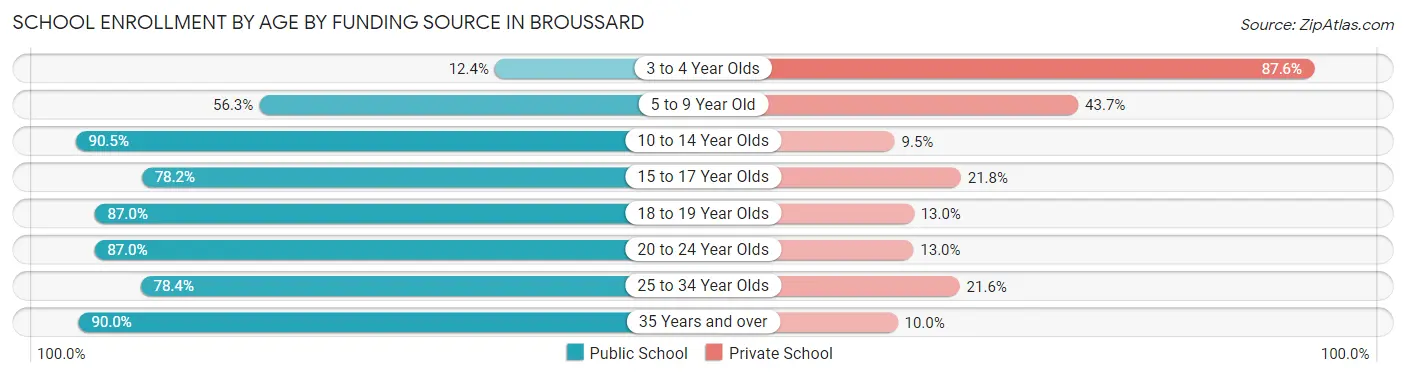
Out of a total of 4,040 students who are enrolled in schools in Broussard, 897 (22.2%) attend a private institution, while the remaining 3,143 (77.8%) are enrolled in public schools. The age group of 3 to 4 year olds has the highest likelihood of being enrolled in private schools, with 162 (87.6% in the age bracket) enrolled. Conversely, the age group of 10 to 14 year olds has the lowest likelihood of being enrolled in a private school, with 1,240 (90.5% in the age bracket) attending a public institution.
| Age Bracket | Public School | Private School |
| 3 to 4 Year Olds | 23 (12.4%) | 162 (87.6%) |
| 5 to 9 Year Old | 379 (56.3%) | 294 (43.7%) |
| 10 to 14 Year Olds | 1,240 (90.5%) | 130 (9.5%) |
| 15 to 17 Year Olds | 491 (78.2%) | 137 (21.8%) |
| 18 to 19 Year Olds | 100 (87.0%) | 15 (13.0%) |
| 20 to 24 Year Olds | 449 (87.0%) | 67 (13.0%) |
| 25 to 34 Year Olds | 254 (78.4%) | 70 (21.6%) |
| 35 Years and over | 206 (90.0%) | 23 (10.0%) |
| Total | 3,143 (77.8%) | 897 (22.2%) |
Educational Attainment by Field of Study in Broussard
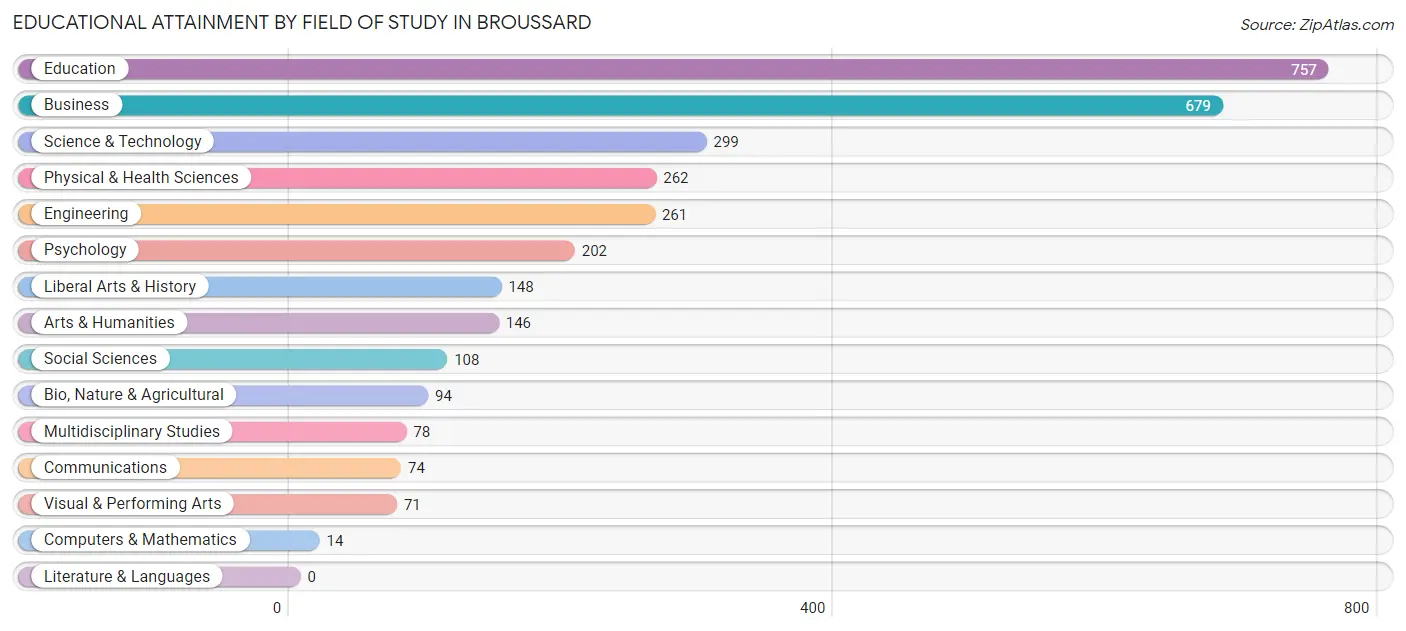
Education (757 | 23.7%), business (679 | 21.3%), science & technology (299 | 9.4%), physical & health sciences (262 | 8.2%), and engineering (261 | 8.2%) are the most common fields of study among 3,193 individuals in Broussard who have obtained a bachelor's degree or higher.
| Field of Study | # Graduates | % Graduates |
| Computers & Mathematics | 14 | 0.4% |
| Bio, Nature & Agricultural | 94 | 2.9% |
| Physical & Health Sciences | 262 | 8.2% |
| Psychology | 202 | 6.3% |
| Social Sciences | 108 | 3.4% |
| Engineering | 261 | 8.2% |
| Multidisciplinary Studies | 78 | 2.4% |
| Science & Technology | 299 | 9.4% |
| Business | 679 | 21.3% |
| Education | 757 | 23.7% |
| Literature & Languages | 0 | 0.0% |
| Liberal Arts & History | 148 | 4.6% |
| Visual & Performing Arts | 71 | 2.2% |
| Communications | 74 | 2.3% |
| Arts & Humanities | 146 | 4.6% |
| Total | 3,193 | 100.0% |
Transportation & Commute in Broussard
Vehicle Availability by Sex in Broussard
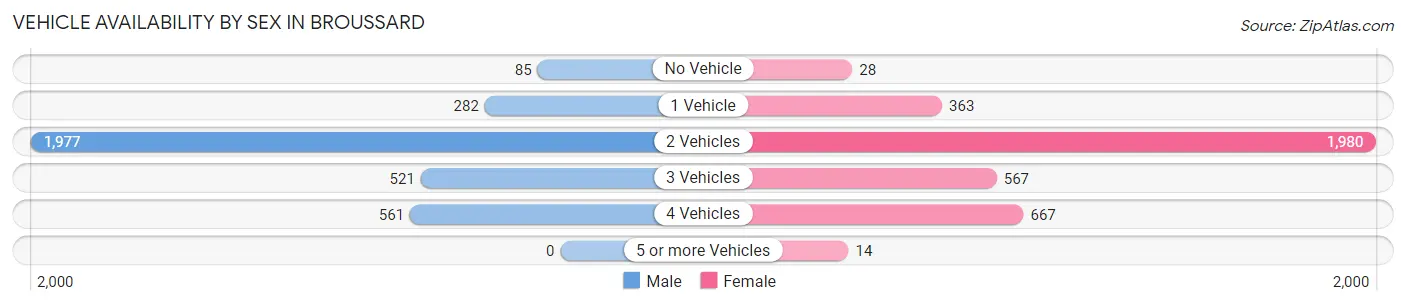
The most prevalent vehicle ownership categories in Broussard are males with 2 vehicles (1,977, accounting for 57.7%) and females with 2 vehicles (1,980, making up 54.6%).
| Vehicles Available | Male | Female |
| No Vehicle | 85 (2.5%) | 28 (0.8%) |
| 1 Vehicle | 282 (8.2%) | 363 (10.0%) |
| 2 Vehicles | 1,977 (57.7%) | 1,980 (54.7%) |
| 3 Vehicles | 521 (15.2%) | 567 (15.7%) |
| 4 Vehicles | 561 (16.4%) | 667 (18.4%) |
| 5 or more Vehicles | 0 (0.0%) | 14 (0.4%) |
| Total | 3,426 (100.0%) | 3,619 (100.0%) |
Commute Time in Broussard
The most frequently occuring commute durations in Broussard are 15 to 19 minutes (1,957 commuters, 28.6%), 30 to 34 minutes (1,113 commuters, 16.3%), and 20 to 24 minutes (993 commuters, 14.5%).
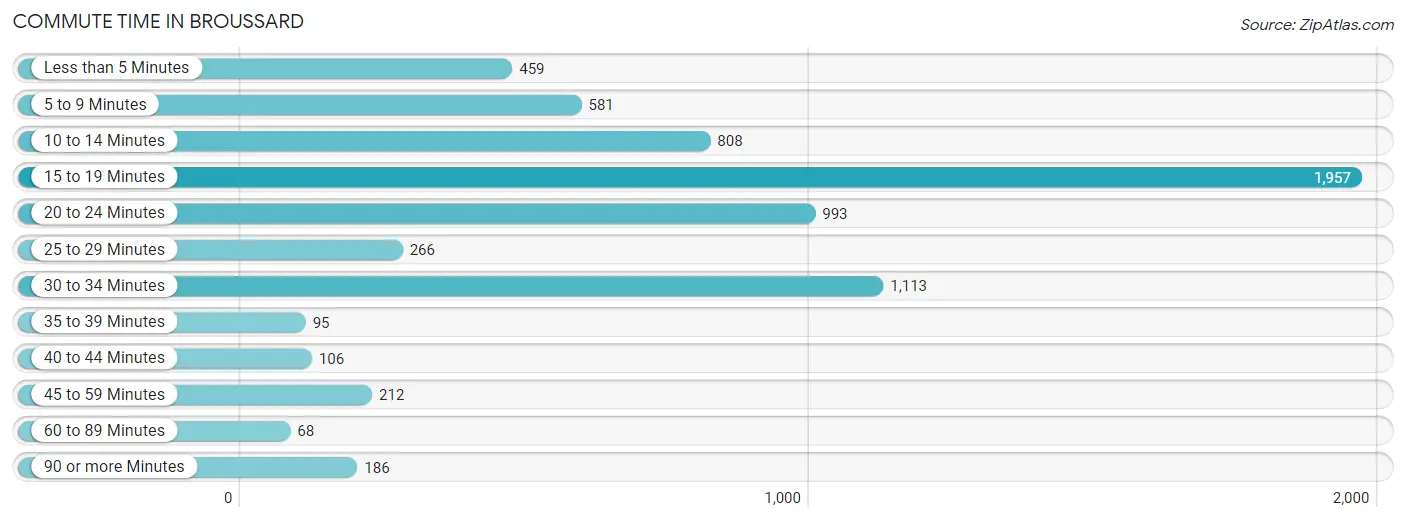
| Commute Time | # Commuters | % Commuters |
| Less than 5 Minutes | 459 | 6.7% |
| 5 to 9 Minutes | 581 | 8.5% |
| 10 to 14 Minutes | 808 | 11.8% |
| 15 to 19 Minutes | 1,957 | 28.6% |
| 20 to 24 Minutes | 993 | 14.5% |
| 25 to 29 Minutes | 266 | 3.9% |
| 30 to 34 Minutes | 1,113 | 16.3% |
| 35 to 39 Minutes | 95 | 1.4% |
| 40 to 44 Minutes | 106 | 1.5% |
| 45 to 59 Minutes | 212 | 3.1% |
| 60 to 89 Minutes | 68 | 1.0% |
| 90 or more Minutes | 186 | 2.7% |
Commute Time by Sex in Broussard
The most common commute times in Broussard are 15 to 19 minutes (873 commuters, 26.2%) for males and 15 to 19 minutes (1,084 commuters, 30.8%) for females.
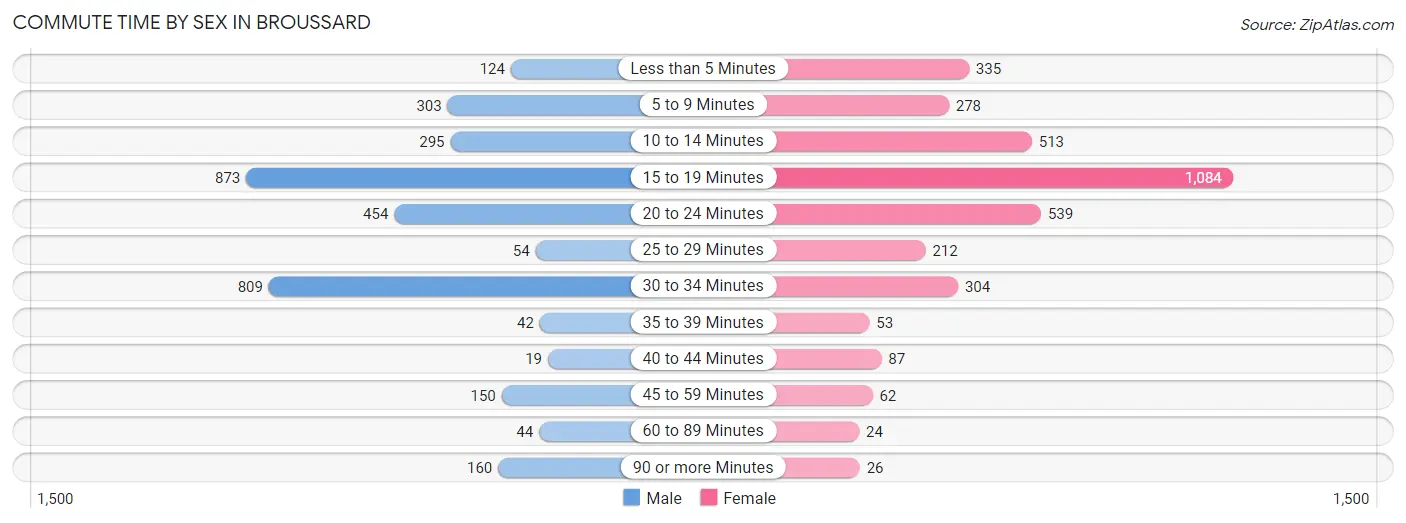
| Commute Time | Male | Female |
| Less than 5 Minutes | 124 (3.7%) | 335 (9.5%) |
| 5 to 9 Minutes | 303 (9.1%) | 278 (7.9%) |
| 10 to 14 Minutes | 295 (8.9%) | 513 (14.6%) |
| 15 to 19 Minutes | 873 (26.2%) | 1,084 (30.8%) |
| 20 to 24 Minutes | 454 (13.7%) | 539 (15.3%) |
| 25 to 29 Minutes | 54 (1.6%) | 212 (6.0%) |
| 30 to 34 Minutes | 809 (24.3%) | 304 (8.6%) |
| 35 to 39 Minutes | 42 (1.3%) | 53 (1.5%) |
| 40 to 44 Minutes | 19 (0.6%) | 87 (2.5%) |
| 45 to 59 Minutes | 150 (4.5%) | 62 (1.8%) |
| 60 to 89 Minutes | 44 (1.3%) | 24 (0.7%) |
| 90 or more Minutes | 160 (4.8%) | 26 (0.7%) |
Time of Departure to Work by Sex in Broussard
The most frequent times of departure to work in Broussard are 7:30 AM to 7:59 AM (609, 18.3%) for males and 7:00 AM to 7:29 AM (845, 24.0%) for females.
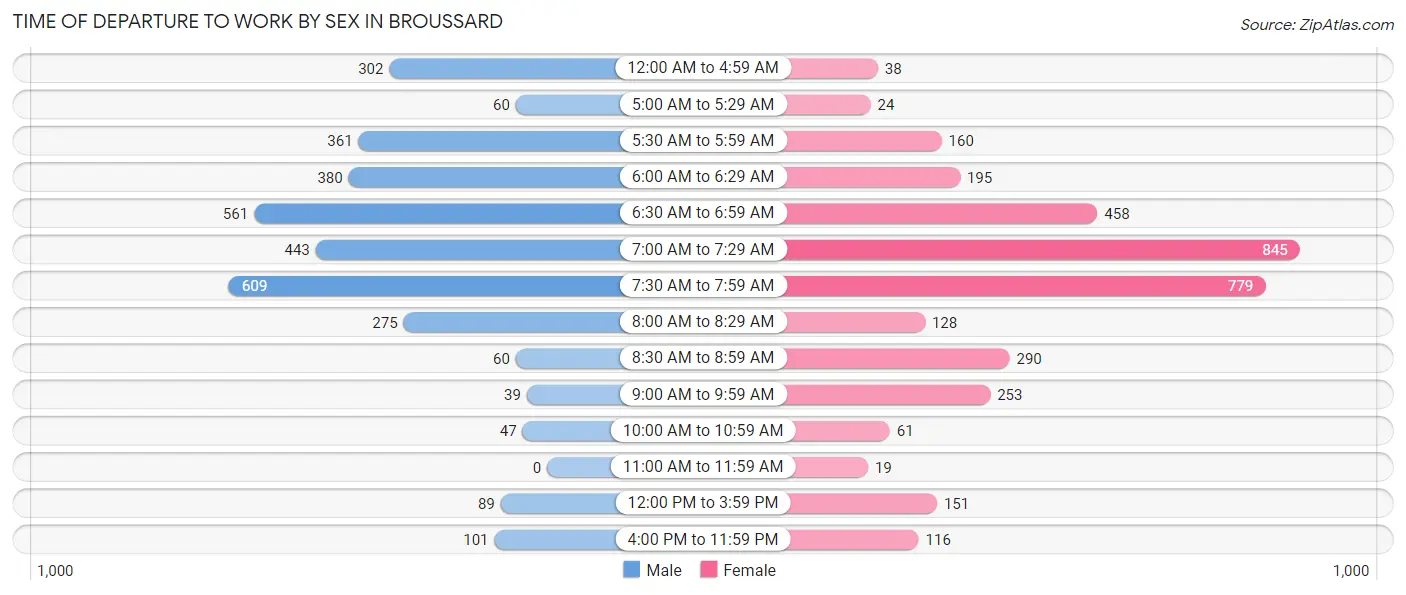
| Time of Departure | Male | Female |
| 12:00 AM to 4:59 AM | 302 (9.1%) | 38 (1.1%) |
| 5:00 AM to 5:29 AM | 60 (1.8%) | 24 (0.7%) |
| 5:30 AM to 5:59 AM | 361 (10.8%) | 160 (4.5%) |
| 6:00 AM to 6:29 AM | 380 (11.4%) | 195 (5.5%) |
| 6:30 AM to 6:59 AM | 561 (16.9%) | 458 (13.0%) |
| 7:00 AM to 7:29 AM | 443 (13.3%) | 845 (24.0%) |
| 7:30 AM to 7:59 AM | 609 (18.3%) | 779 (22.2%) |
| 8:00 AM to 8:29 AM | 275 (8.3%) | 128 (3.6%) |
| 8:30 AM to 8:59 AM | 60 (1.8%) | 290 (8.3%) |
| 9:00 AM to 9:59 AM | 39 (1.2%) | 253 (7.2%) |
| 10:00 AM to 10:59 AM | 47 (1.4%) | 61 (1.7%) |
| 11:00 AM to 11:59 AM | 0 (0.0%) | 19 (0.5%) |
| 12:00 PM to 3:59 PM | 89 (2.7%) | 151 (4.3%) |
| 4:00 PM to 11:59 PM | 101 (3.0%) | 116 (3.3%) |
| Total | 3,327 (100.0%) | 3,517 (100.0%) |
Housing Occupancy in Broussard
Occupancy by Ownership in Broussard
Of the total 4,396 dwellings in Broussard, owner-occupied units account for 3,517 (80.0%), while renter-occupied units make up 879 (20.0%).
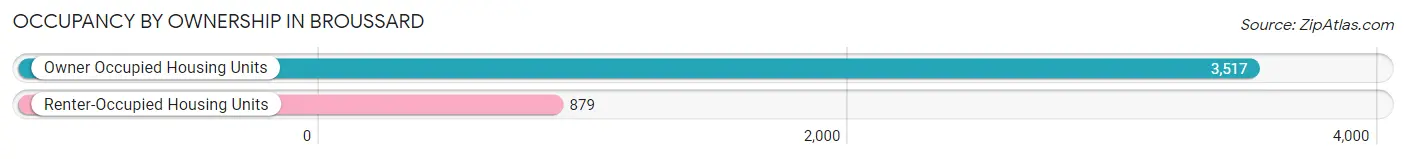
| Occupancy | # Housing Units | % Housing Units |
| Owner Occupied Housing Units | 3,517 | 80.0% |
| Renter-Occupied Housing Units | 879 | 20.0% |
| Total Occupied Housing Units | 4,396 | 100.0% |
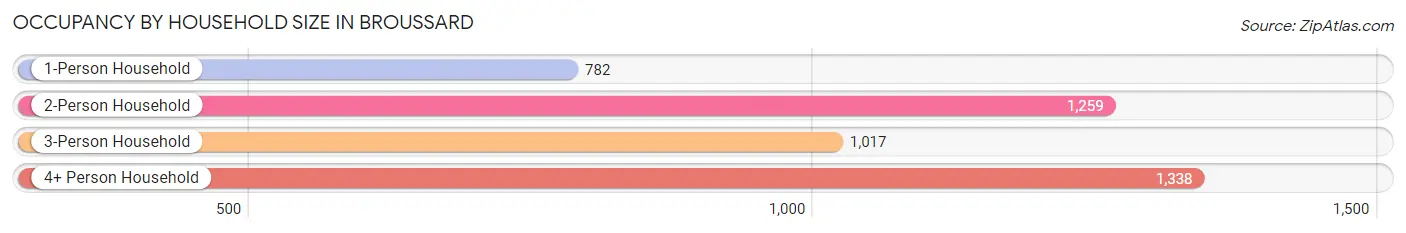
Occupancy by Household Size in Broussard
| Household Size | # Housing Units | % Housing Units |
| 1-Person Household | 782 | 17.8% |
| 2-Person Household | 1,259 | 28.6% |
| 3-Person Household | 1,017 | 23.1% |
| 4+ Person Household | 1,338 | 30.4% |
| Total Housing Units | 4,396 | 100.0% |
Occupancy by Ownership by Household Size in Broussard
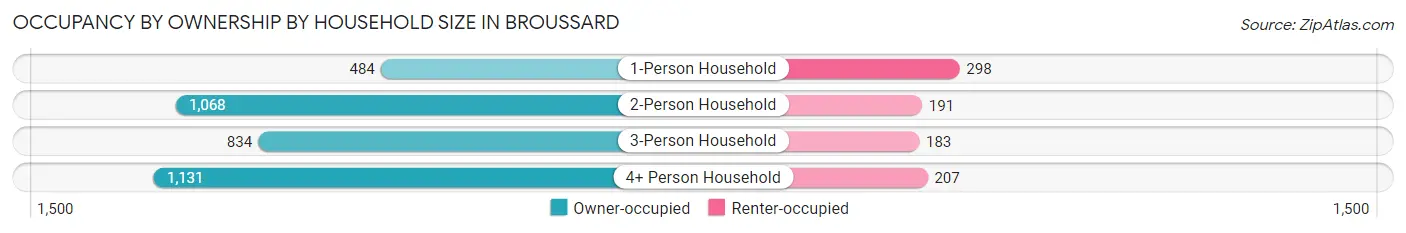
| Household Size | Owner-occupied | Renter-occupied |
| 1-Person Household | 484 (61.9%) | 298 (38.1%) |
| 2-Person Household | 1,068 (84.8%) | 191 (15.2%) |
| 3-Person Household | 834 (82.0%) | 183 (18.0%) |
| 4+ Person Household | 1,131 (84.5%) | 207 (15.5%) |
| Total Housing Units | 3,517 (80.0%) | 879 (20.0%) |
Occupancy by Educational Attainment in Broussard
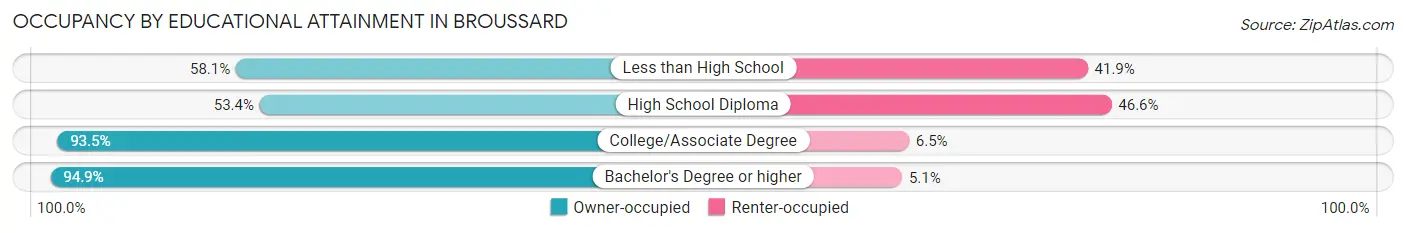
| Household Size | Owner-occupied | Renter-occupied |
| Less than High School | 230 (58.1%) | 166 (41.9%) |
| High School Diploma | 633 (53.4%) | 553 (46.6%) |
| College/Associate Degree | 1,112 (93.5%) | 77 (6.5%) |
| Bachelor's Degree or higher | 1,542 (94.9%) | 83 (5.1%) |
Occupancy by Age of Householder in Broussard
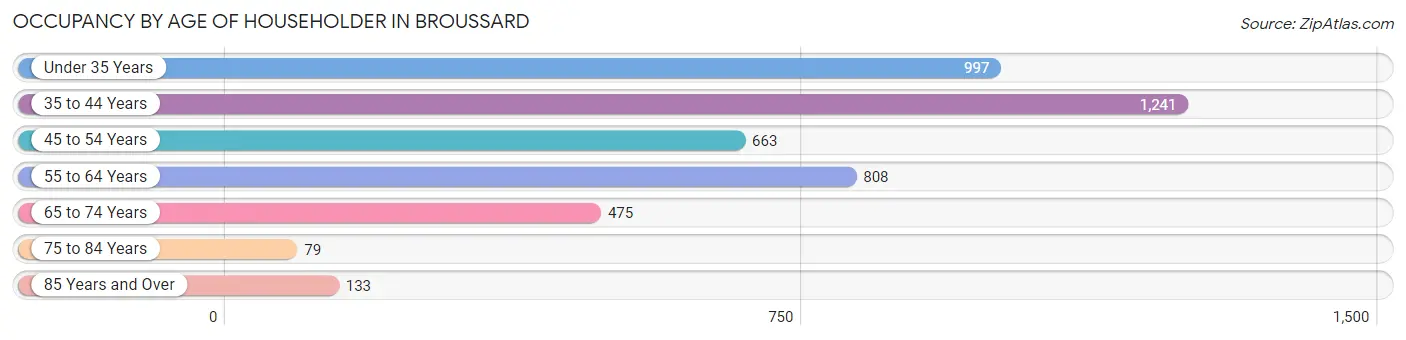
| Age Bracket | # Households | % Households |
| Under 35 Years | 997 | 22.7% |
| 35 to 44 Years | 1,241 | 28.2% |
| 45 to 54 Years | 663 | 15.1% |
| 55 to 64 Years | 808 | 18.4% |
| 65 to 74 Years | 475 | 10.8% |
| 75 to 84 Years | 79 | 1.8% |
| 85 Years and Over | 133 | 3.0% |
| Total | 4,396 | 100.0% |
Housing Finances in Broussard
Median Income by Occupancy in Broussard
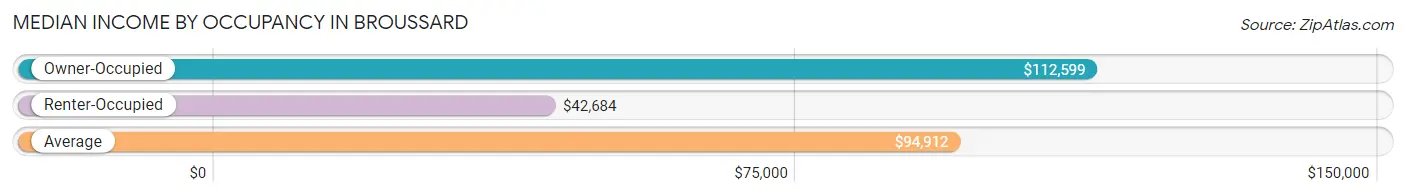
| Occupancy Type | # Households | Median Income |
| Owner-Occupied | 3,517 (80.0%) | $112,599 |
| Renter-Occupied | 879 (20.0%) | $42,684 |
| Average | 4,396 (100.0%) | $94,912 |
Occupancy by Householder Income Bracket in Broussard
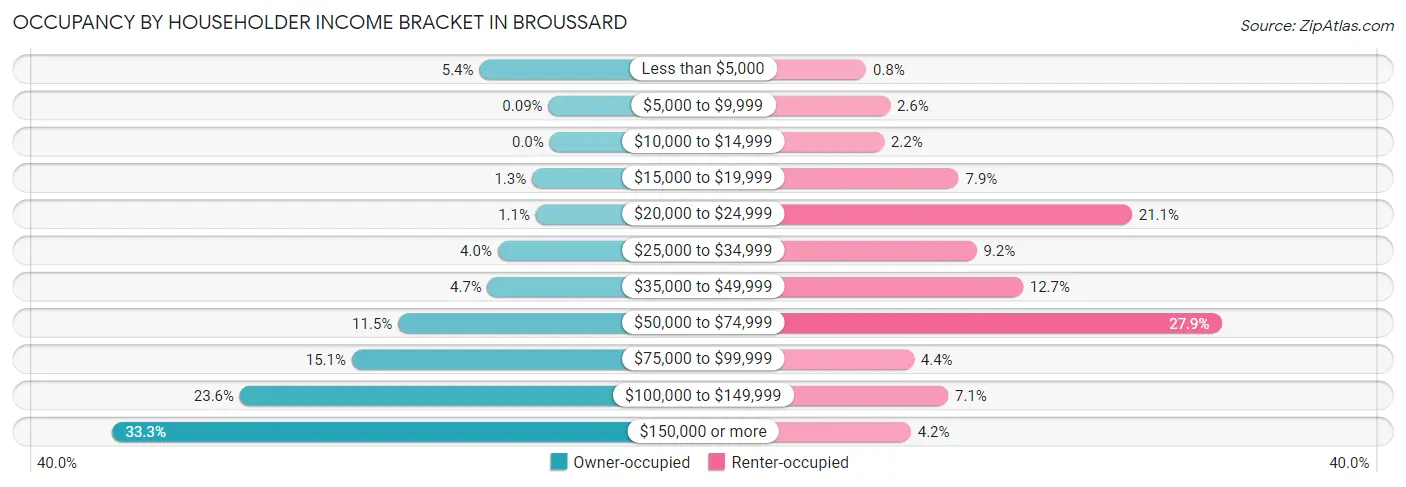
| Income Bracket | Owner-occupied | Renter-occupied |
| Less than $5,000 | 188 (5.3%) | 7 (0.8%) |
| $5,000 to $9,999 | 3 (0.1%) | 23 (2.6%) |
| $10,000 to $14,999 | 0 (0.0%) | 19 (2.2%) |
| $15,000 to $19,999 | 47 (1.3%) | 69 (7.9%) |
| $20,000 to $24,999 | 37 (1.1%) | 185 (21.0%) |
| $25,000 to $34,999 | 139 (4.0%) | 81 (9.2%) |
| $35,000 to $49,999 | 166 (4.7%) | 112 (12.7%) |
| $50,000 to $74,999 | 406 (11.5%) | 245 (27.9%) |
| $75,000 to $99,999 | 530 (15.1%) | 39 (4.4%) |
| $100,000 to $149,999 | 830 (23.6%) | 62 (7.0%) |
| $150,000 or more | 1,171 (33.3%) | 37 (4.2%) |
| Total | 3,517 (100.0%) | 879 (100.0%) |
Monthly Housing Cost Tiers in Broussard
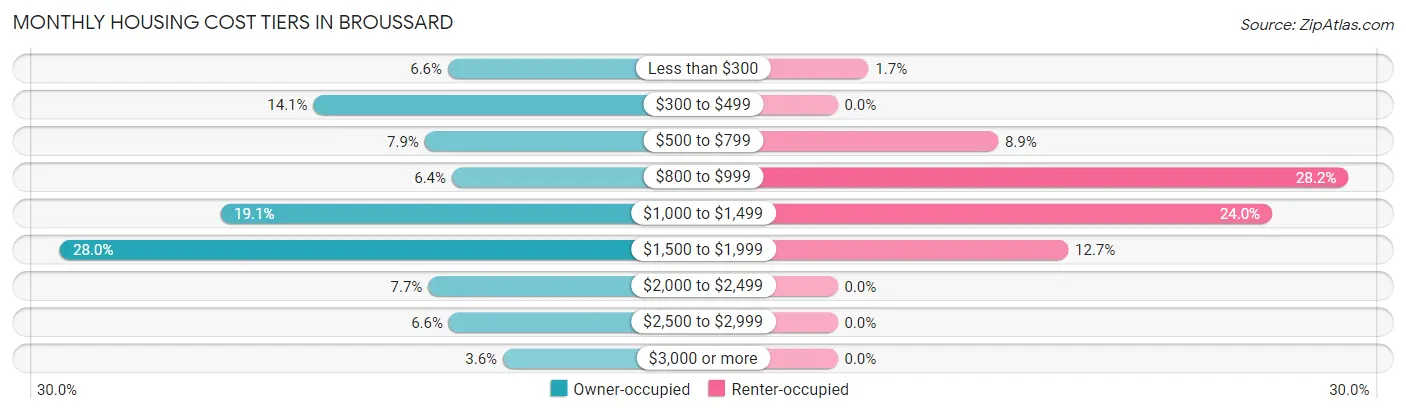
| Monthly Cost | Owner-occupied | Renter-occupied |
| Less than $300 | 233 (6.6%) | 15 (1.7%) |
| $300 to $499 | 494 (14.1%) | 0 (0.0%) |
| $500 to $799 | 278 (7.9%) | 78 (8.9%) |
| $800 to $999 | 225 (6.4%) | 248 (28.2%) |
| $1,000 to $1,499 | 673 (19.1%) | 211 (24.0%) |
| $1,500 to $1,999 | 986 (28.0%) | 112 (12.7%) |
| $2,000 to $2,499 | 271 (7.7%) | 0 (0.0%) |
| $2,500 to $2,999 | 231 (6.6%) | 0 (0.0%) |
| $3,000 or more | 126 (3.6%) | 0 (0.0%) |
| Total | 3,517 (100.0%) | 879 (100.0%) |
Physical Housing Characteristics in Broussard
Housing Structures in Broussard
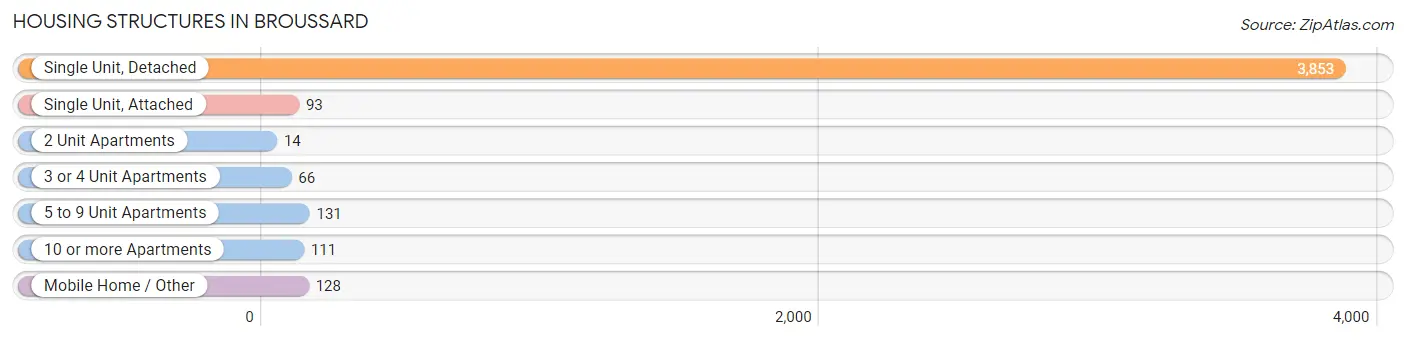
| Structure Type | # Housing Units | % Housing Units |
| Single Unit, Detached | 3,853 | 87.6% |
| Single Unit, Attached | 93 | 2.1% |
| 2 Unit Apartments | 14 | 0.3% |
| 3 or 4 Unit Apartments | 66 | 1.5% |
| 5 to 9 Unit Apartments | 131 | 3.0% |
| 10 or more Apartments | 111 | 2.5% |
| Mobile Home / Other | 128 | 2.9% |
| Total | 4,396 | 100.0% |
Housing Structures by Occupancy in Broussard
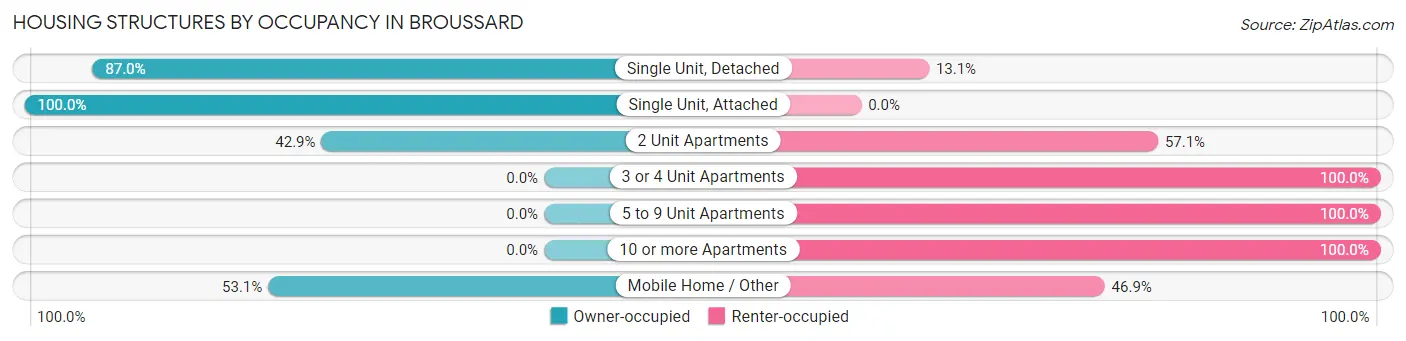
| Structure Type | Owner-occupied | Renter-occupied |
| Single Unit, Detached | 3,350 (87.0%) | 503 (13.1%) |
| Single Unit, Attached | 93 (100.0%) | 0 (0.0%) |
| 2 Unit Apartments | 6 (42.9%) | 8 (57.1%) |
| 3 or 4 Unit Apartments | 0 (0.0%) | 66 (100.0%) |
| 5 to 9 Unit Apartments | 0 (0.0%) | 131 (100.0%) |
| 10 or more Apartments | 0 (0.0%) | 111 (100.0%) |
| Mobile Home / Other | 68 (53.1%) | 60 (46.9%) |
| Total | 3,517 (80.0%) | 879 (20.0%) |
Housing Structures by Number of Rooms in Broussard
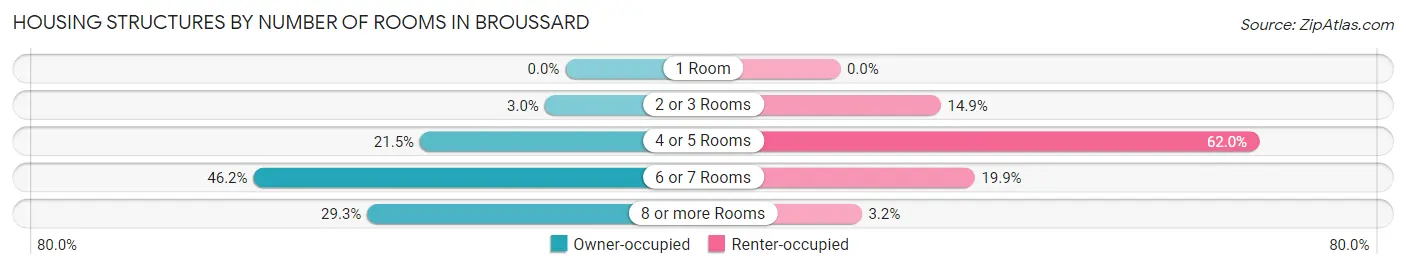
| Number of Rooms | Owner-occupied | Renter-occupied |
| 1 Room | 0 (0.0%) | 0 (0.0%) |
| 2 or 3 Rooms | 107 (3.0%) | 131 (14.9%) |
| 4 or 5 Rooms | 756 (21.5%) | 545 (62.0%) |
| 6 or 7 Rooms | 1,623 (46.2%) | 175 (19.9%) |
| 8 or more Rooms | 1,031 (29.3%) | 28 (3.2%) |
| Total | 3,517 (100.0%) | 879 (100.0%) |
Housing Structure by Heating Type in Broussard
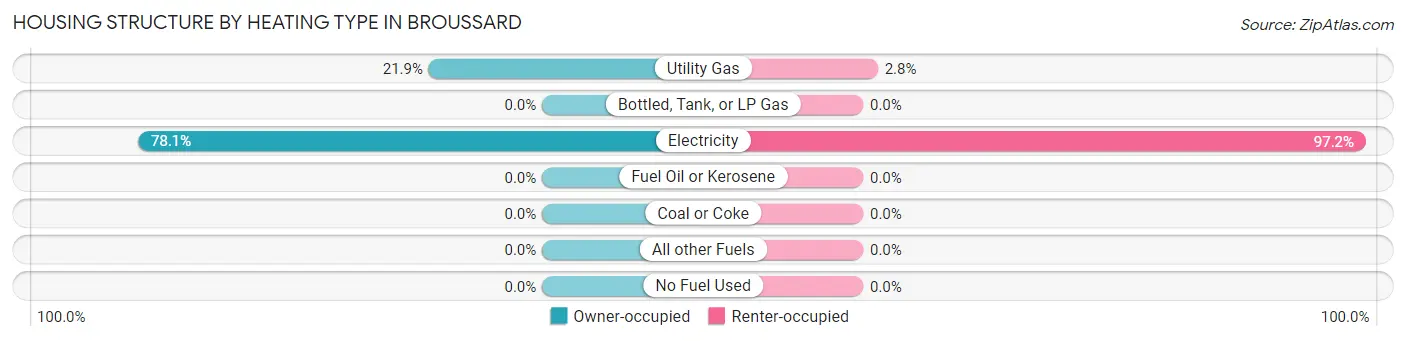
| Heating Type | Owner-occupied | Renter-occupied |
| Utility Gas | 770 (21.9%) | 25 (2.8%) |
| Bottled, Tank, or LP Gas | 0 (0.0%) | 0 (0.0%) |
| Electricity | 2,747 (78.1%) | 854 (97.2%) |
| Fuel Oil or Kerosene | 0 (0.0%) | 0 (0.0%) |
| Coal or Coke | 0 (0.0%) | 0 (0.0%) |
| All other Fuels | 0 (0.0%) | 0 (0.0%) |
| No Fuel Used | 0 (0.0%) | 0 (0.0%) |
| Total | 3,517 (100.0%) | 879 (100.0%) |
Household Vehicle Usage in Broussard
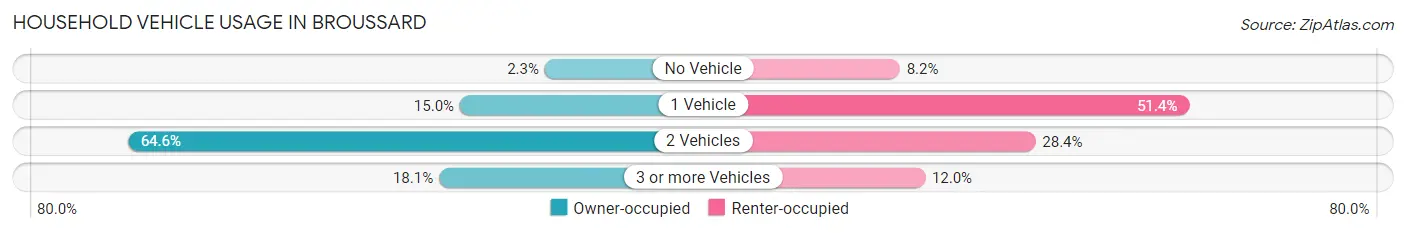
| Vehicles per Household | Owner-occupied | Renter-occupied |
| No Vehicle | 81 (2.3%) | 72 (8.2%) |
| 1 Vehicle | 527 (15.0%) | 452 (51.4%) |
| 2 Vehicles | 2,272 (64.6%) | 250 (28.4%) |
| 3 or more Vehicles | 637 (18.1%) | 105 (11.9%) |
| Total | 3,517 (100.0%) | 879 (100.0%) |
Real Estate & Mortgages in Broussard
Real Estate and Mortgage Overview in Broussard
| Characteristic | Without Mortgage | With Mortgage |
| Housing Units | 1,005 | 2,512 |
| Median Property Value | $283,800 | $277,700 |
| Median Household Income | $89,766 | $911 |
| Monthly Housing Costs | $432 | $126 |
| Real Estate Taxes | $1,285 | $106 |
Property Value by Mortgage Status in Broussard
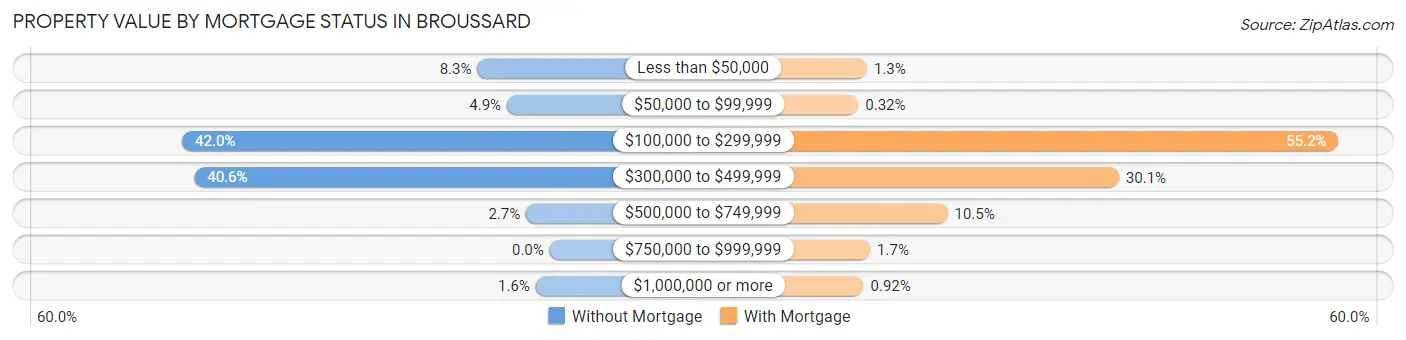
| Property Value | Without Mortgage | With Mortgage |
| Less than $50,000 | 83 (8.3%) | 33 (1.3%) |
| $50,000 to $99,999 | 49 (4.9%) | 8 (0.3%) |
| $100,000 to $299,999 | 422 (42.0%) | 1,386 (55.2%) |
| $300,000 to $499,999 | 408 (40.6%) | 756 (30.1%) |
| $500,000 to $749,999 | 27 (2.7%) | 264 (10.5%) |
| $750,000 to $999,999 | 0 (0.0%) | 42 (1.7%) |
| $1,000,000 or more | 16 (1.6%) | 23 (0.9%) |
| Total | 1,005 (100.0%) | 2,512 (100.0%) |
Household Income by Mortgage Status in Broussard
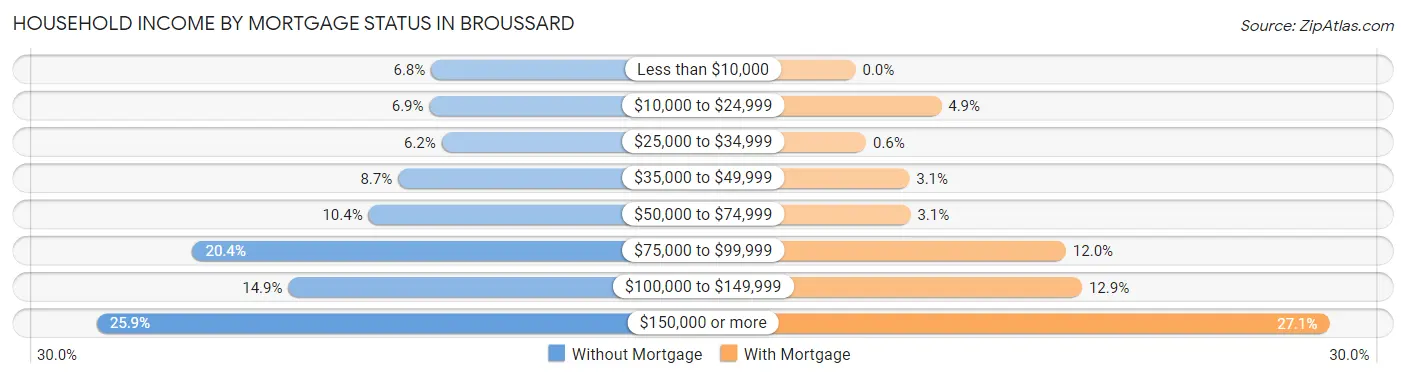
| Household Income | Without Mortgage | With Mortgage |
| Less than $10,000 | 68 (6.8%) | 0 (0.0%) |
| $10,000 to $24,999 | 69 (6.9%) | 123 (4.9%) |
| $25,000 to $34,999 | 62 (6.2%) | 15 (0.6%) |
| $35,000 to $49,999 | 87 (8.7%) | 77 (3.1%) |
| $50,000 to $74,999 | 104 (10.3%) | 79 (3.1%) |
| $75,000 to $99,999 | 205 (20.4%) | 302 (12.0%) |
| $100,000 to $149,999 | 150 (14.9%) | 325 (12.9%) |
| $150,000 or more | 260 (25.9%) | 680 (27.1%) |
| Total | 1,005 (100.0%) | 2,512 (100.0%) |
Property Value to Household Income Ratio in Broussard
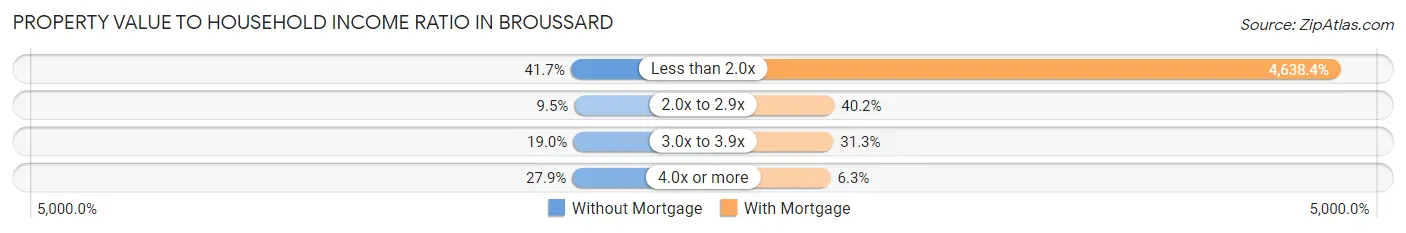
| Value-to-Income Ratio | Without Mortgage | With Mortgage |
| Less than 2.0x | 419 (41.7%) | 116,516 (4,638.4%) |
| 2.0x to 2.9x | 95 (9.5%) | 1,009 (40.2%) |
| 3.0x to 3.9x | 191 (19.0%) | 785 (31.2%) |
| 4.0x or more | 280 (27.9%) | 158 (6.3%) |
| Total | 1,005 (100.0%) | 2,512 (100.0%) |
Real Estate Taxes by Mortgage Status in Broussard
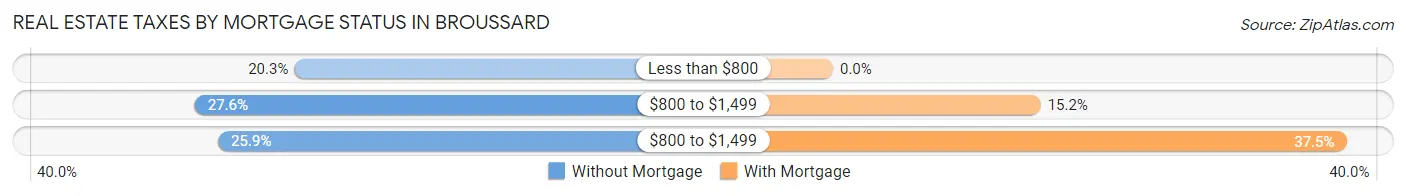
| Property Taxes | Without Mortgage | With Mortgage |
| Less than $800 | 204 (20.3%) | 0 (0.0%) |
| $800 to $1,499 | 277 (27.6%) | 381 (15.2%) |
| $800 to $1,499 | 260 (25.9%) | 942 (37.5%) |
| Total | 1,005 (100.0%) | 2,512 (100.0%) |
Health & Disability in Broussard
Health Insurance Coverage by Age in Broussard
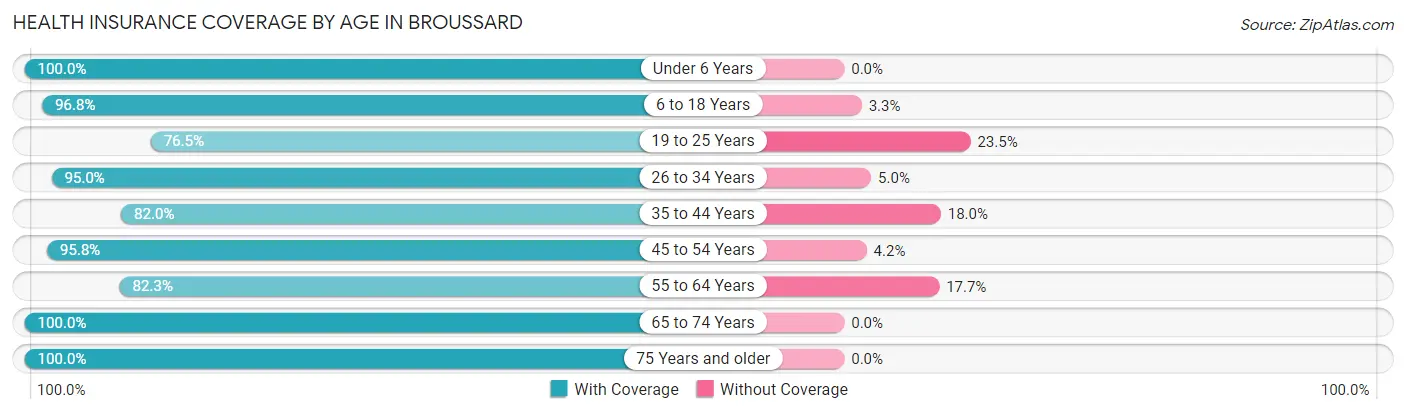
| Age Bracket | With Coverage | Without Coverage |
| Under 6 Years | 1,227 (100.0%) | 0 (0.0%) |
| 6 to 18 Years | 2,621 (96.8%) | 88 (3.3%) |
| 19 to 25 Years | 1,050 (76.5%) | 323 (23.5%) |
| 26 to 34 Years | 1,725 (95.0%) | 91 (5.0%) |
| 35 to 44 Years | 1,790 (82.0%) | 393 (18.0%) |
| 45 to 54 Years | 1,265 (95.8%) | 55 (4.2%) |
| 55 to 64 Years | 1,302 (82.3%) | 280 (17.7%) |
| 65 to 74 Years | 745 (100.0%) | 0 (0.0%) |
| 75 Years and older | 229 (100.0%) | 0 (0.0%) |
| Total | 11,954 (90.7%) | 1,230 (9.3%) |
Health Insurance Coverage by Citizenship Status in Broussard
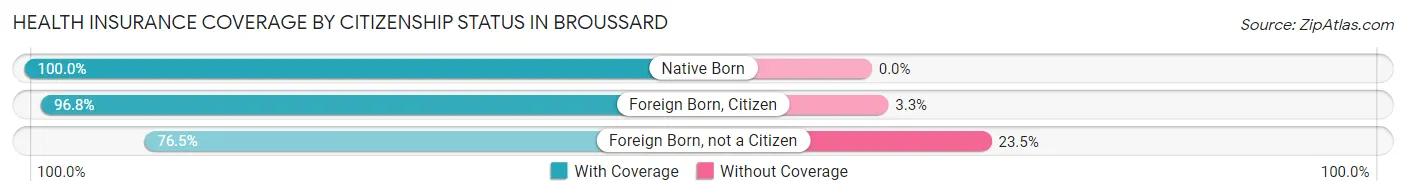
| Citizenship Status | With Coverage | Without Coverage |
| Native Born | 1,227 (100.0%) | 0 (0.0%) |
| Foreign Born, Citizen | 2,621 (96.8%) | 88 (3.3%) |
| Foreign Born, not a Citizen | 1,050 (76.5%) | 323 (23.5%) |
Health Insurance Coverage by Household Income in Broussard
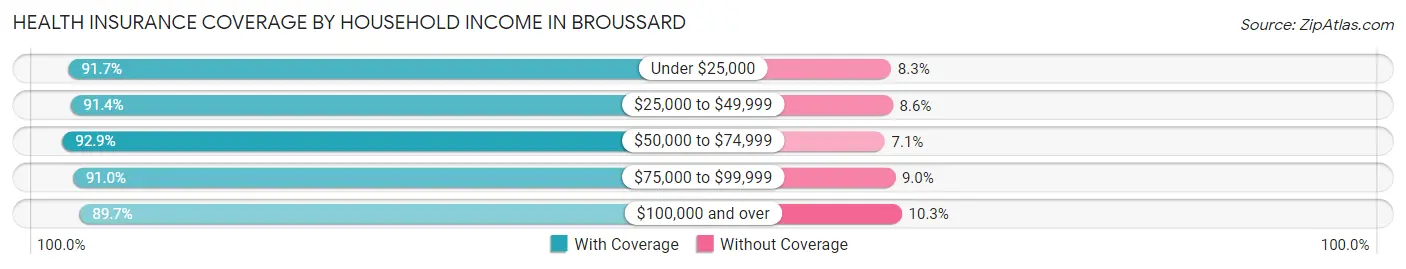
| Household Income | With Coverage | Without Coverage |
| Under $25,000 | 1,544 (91.7%) | 139 (8.3%) |
| $25,000 to $49,999 | 938 (91.4%) | 88 (8.6%) |
| $50,000 to $74,999 | 1,444 (92.9%) | 110 (7.1%) |
| $75,000 to $99,999 | 1,574 (91.0%) | 156 (9.0%) |
| $100,000 and over | 6,431 (89.7%) | 736 (10.3%) |
Public vs Private Health Insurance Coverage by Age in Broussard
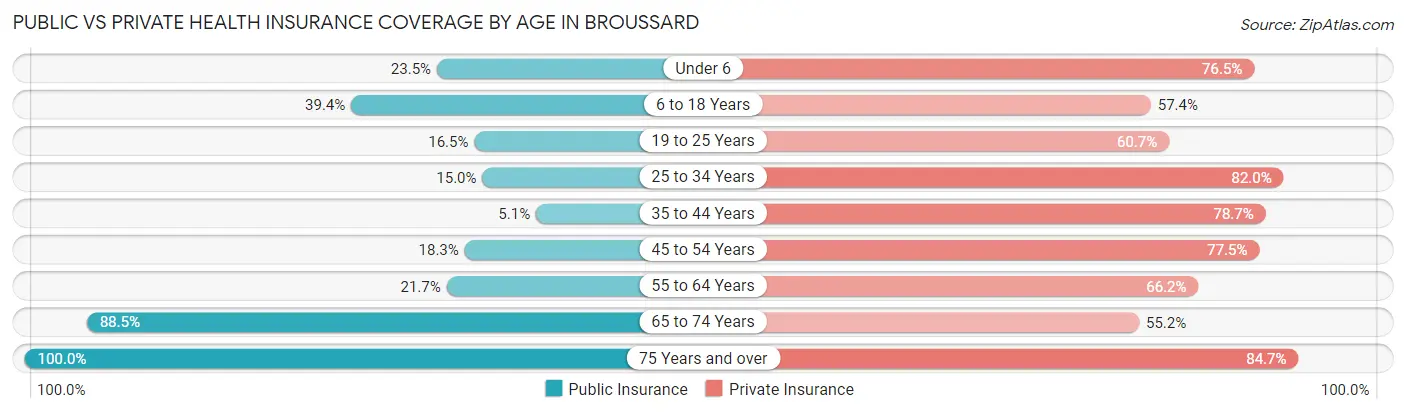
| Age Bracket | Public Insurance | Private Insurance |
| Under 6 | 288 (23.5%) | 939 (76.5%) |
| 6 to 18 Years | 1,067 (39.4%) | 1,554 (57.4%) |
| 19 to 25 Years | 227 (16.5%) | 834 (60.7%) |
| 25 to 34 Years | 273 (15.0%) | 1,489 (82.0%) |
| 35 to 44 Years | 111 (5.1%) | 1,717 (78.6%) |
| 45 to 54 Years | 242 (18.3%) | 1,023 (77.5%) |
| 55 to 64 Years | 343 (21.7%) | 1,047 (66.2%) |
| 65 to 74 Years | 659 (88.5%) | 411 (55.2%) |
| 75 Years and over | 229 (100.0%) | 194 (84.7%) |
| Total | 3,439 (26.1%) | 9,208 (69.8%) |
Disability Status by Sex by Age in Broussard
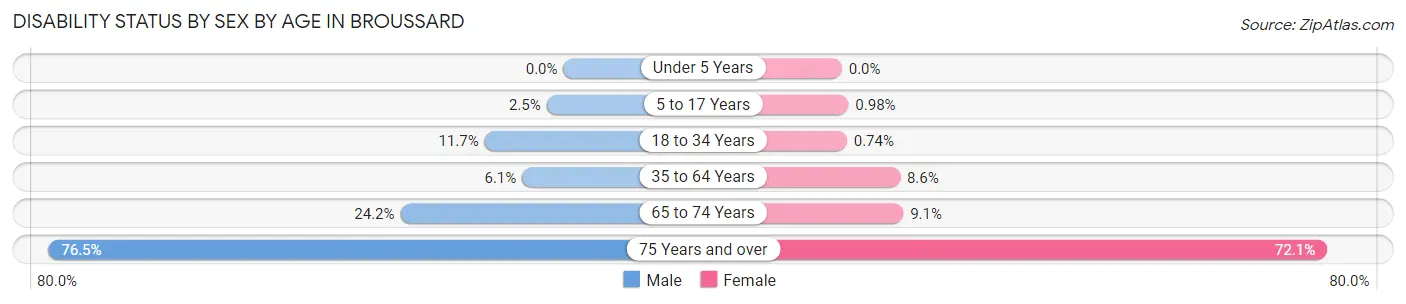
| Age Bracket | Male | Female |
| Under 5 Years | 0 (0.0%) | 0 (0.0%) |
| 5 to 17 Years | 42 (2.5%) | 11 (1.0%) |
| 18 to 34 Years | 158 (11.7%) | 14 (0.7%) |
| 35 to 64 Years | 156 (6.1%) | 219 (8.6%) |
| 65 to 74 Years | 98 (24.2%) | 31 (9.1%) |
| 75 Years and over | 52 (76.5%) | 116 (72.1%) |
Disability Class by Sex by Age in Broussard
Disability Class: Hearing Difficulty
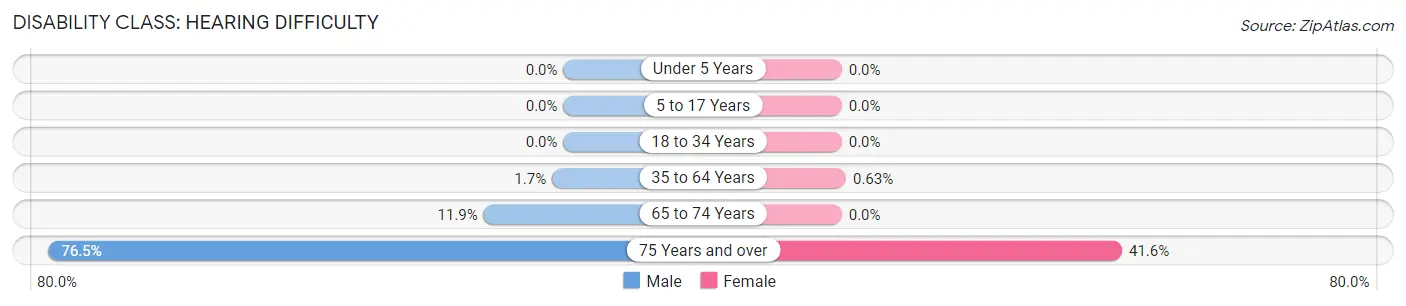
| Age Bracket | Male | Female |
| Under 5 Years | 0 (0.0%) | 0 (0.0%) |
| 5 to 17 Years | 0 (0.0%) | 0 (0.0%) |
| 18 to 34 Years | 0 (0.0%) | 0 (0.0%) |
| 35 to 64 Years | 43 (1.7%) | 16 (0.6%) |
| 65 to 74 Years | 48 (11.8%) | 0 (0.0%) |
| 75 Years and over | 52 (76.5%) | 67 (41.6%) |
Disability Class: Vision Difficulty
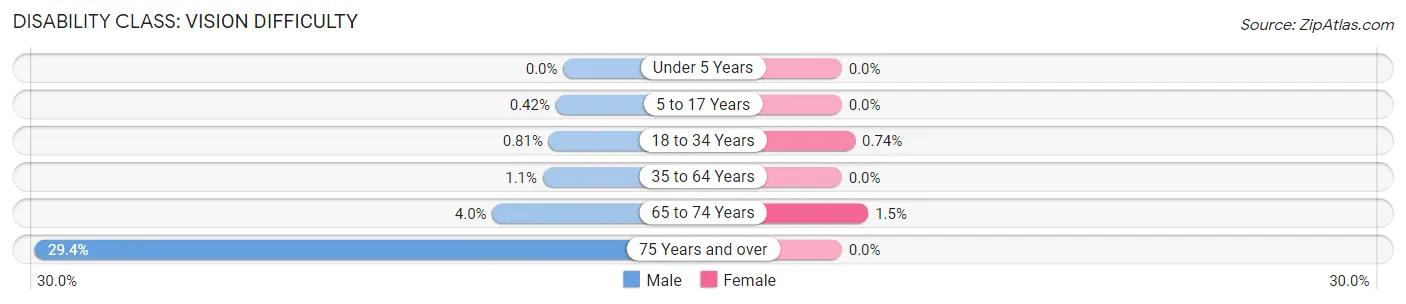
| Age Bracket | Male | Female |
| Under 5 Years | 0 (0.0%) | 0 (0.0%) |
| 5 to 17 Years | 7 (0.4%) | 0 (0.0%) |
| 18 to 34 Years | 11 (0.8%) | 14 (0.7%) |
| 35 to 64 Years | 29 (1.1%) | 0 (0.0%) |
| 65 to 74 Years | 16 (4.0%) | 5 (1.5%) |
| 75 Years and over | 20 (29.4%) | 0 (0.0%) |
Disability Class: Cognitive Difficulty
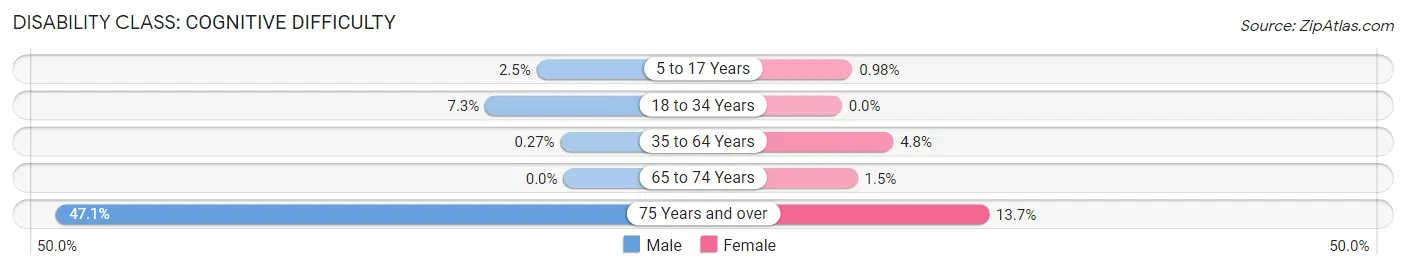
| Age Bracket | Male | Female |
| 5 to 17 Years | 42 (2.5%) | 11 (1.0%) |
| 18 to 34 Years | 98 (7.3%) | 0 (0.0%) |
| 35 to 64 Years | 7 (0.3%) | 121 (4.8%) |
| 65 to 74 Years | 0 (0.0%) | 5 (1.5%) |
| 75 Years and over | 32 (47.1%) | 22 (13.7%) |
Disability Class: Ambulatory Difficulty
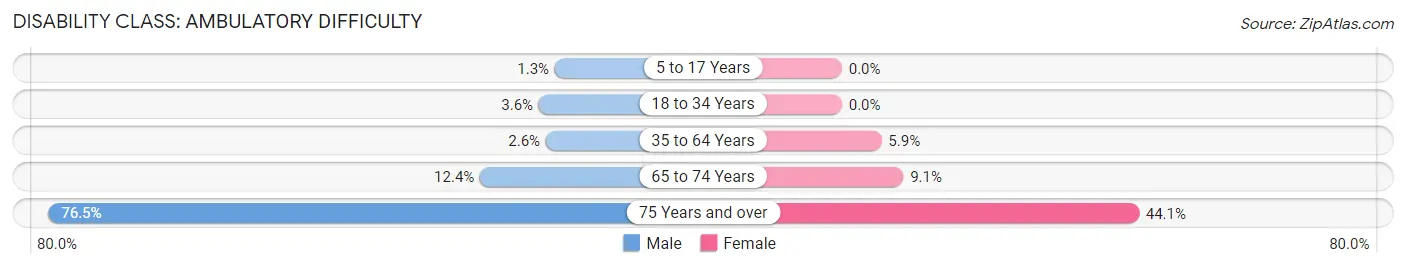
| Age Bracket | Male | Female |
| 5 to 17 Years | 21 (1.3%) | 0 (0.0%) |
| 18 to 34 Years | 49 (3.6%) | 0 (0.0%) |
| 35 to 64 Years | 66 (2.6%) | 149 (5.9%) |
| 65 to 74 Years | 50 (12.3%) | 31 (9.1%) |
| 75 Years and over | 52 (76.5%) | 71 (44.1%) |
Disability Class: Self-Care Difficulty
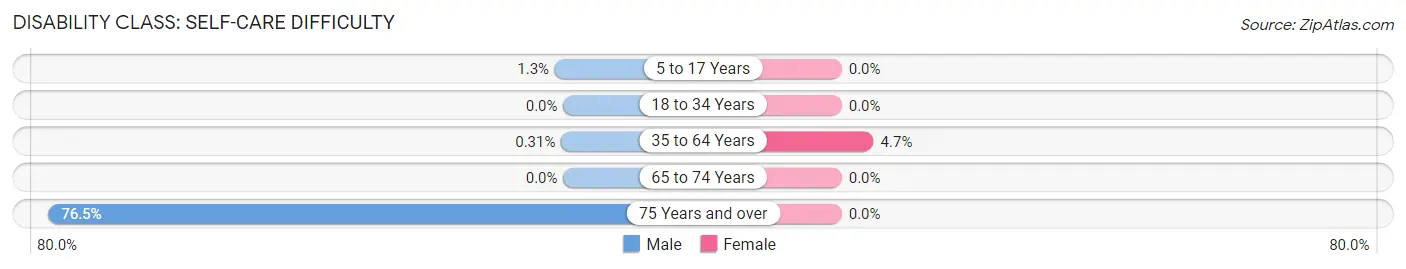
| Age Bracket | Male | Female |
| 5 to 17 Years | 21 (1.3%) | 0 (0.0%) |
| 18 to 34 Years | 0 (0.0%) | 0 (0.0%) |
| 35 to 64 Years | 8 (0.3%) | 120 (4.7%) |
| 65 to 74 Years | 0 (0.0%) | 0 (0.0%) |
| 75 Years and over | 52 (76.5%) | 0 (0.0%) |
Technology Access in Broussard
Computing Device Access in Broussard
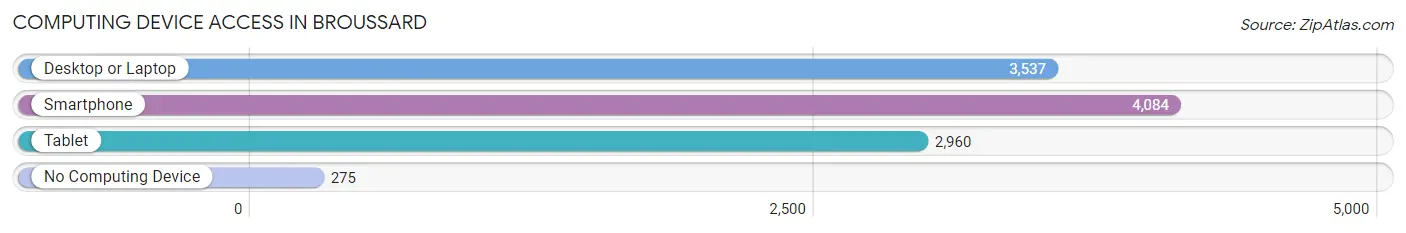
| Device Type | # Households | % Households |
| Desktop or Laptop | 3,537 | 80.5% |
| Smartphone | 4,084 | 92.9% |
| Tablet | 2,960 | 67.3% |
| No Computing Device | 275 | 6.3% |
| Total | 4,396 | 100.0% |
Internet Access in Broussard
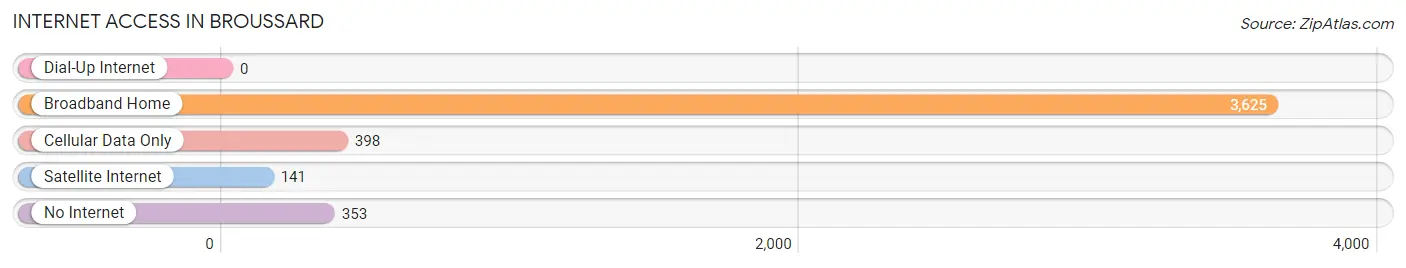
| Internet Type | # Households | % Households |
| Dial-Up Internet | 0 | 0.0% |
| Broadband Home | 3,625 | 82.5% |
| Cellular Data Only | 398 | 9.0% |
| Satellite Internet | 141 | 3.2% |
| No Internet | 353 | 8.0% |
| Total | 4,396 | 100.0% |
Broussard Summary
Broussard, Louisiana is a small city located in the heart of Acadiana, the Cajun and Creole cultural region of the state. It is situated in the southern part of Lafayette Parish, approximately 10 miles south of the city of Lafayette. The city is known for its rich cultural heritage, its vibrant economy, and its friendly people.
History
Broussard was founded in 1884 by Joseph Broussard, a French-speaking Acadian who had emigrated from Nova Scotia. He purchased a large tract of land in the area and began to develop it into a small farming community. The town was named after him and grew steadily over the years. By the early 1900s, Broussard had become a thriving agricultural center, with a population of around 500 people.
In the 1920s, the town began to experience a period of rapid growth. The oil and gas industry had recently been discovered in the area, and Broussard quickly became a hub for the industry. This led to an influx of new residents and businesses, and the population of the town grew to over 1,000 by the end of the decade.
In the 1950s, Broussard began to experience a period of decline. The oil and gas industry had moved on to other areas, and the town’s population began to decline. However, in the late 1970s, the town began to experience a resurgence. The oil and gas industry had returned to the area, and the town’s population began to grow again. By the end of the decade, the population had reached over 2,000.
Today, Broussard is a thriving community with a population of over 8,000 people. The town is home to a variety of businesses, including oil and gas companies, retail stores, restaurants, and more. The town is also home to several festivals and events throughout the year, including the Broussard Mardi Gras Festival and the Broussard Crawfish Festival.
Geography
Broussard is located in the southern part of Lafayette Parish, approximately 10 miles south of the city of Lafayette. The town is situated on the banks of the Vermilion River, which flows through the area. The town is surrounded by a variety of natural features, including swamps, bayous, and woodlands. The town is also located near several major highways, including Interstate 10 and US Highway 90.
Economy
Broussard’s economy is largely based on the oil and gas industry. The town is home to several oil and gas companies, as well as a variety of related businesses. The town is also home to a variety of retail stores, restaurants, and other businesses. The town is also home to several festivals and events throughout the year, which attract visitors from all over the region.
Demographics
As of the 2010 census, Broussard had a population of 8,323 people. The racial makeup of the town was 79.3% White, 15.2% African American, 0.7% Native American, 0.7% Asian, 0.1% Pacific Islander, and 3.9% from other races. The median household income in the town was $45,945, and the median family income was $54,945. The town’s population is largely Catholic, with over 70% of the population identifying as Catholic.
Common Questions
What is Per Capita Income in Broussard?
Per Capita income in Broussard is $39,800.
What is the Median Family Income in Broussard?
Median Family Income in Broussard is $106,713.
What is the Median Household income in Broussard?
Median Household Income in Broussard is $94,912.
What is Income or Wage Gap in Broussard?
Income or Wage Gap in Broussard is 44.2%.
Women in Broussard earn 55.8 cents for every dollar earned by a man.
What is Inequality or Gini Index in Broussard?
Inequality or Gini Index in Broussard is 0.42.
What is the Total Population of Broussard?
Total Population of Broussard is 13,322.
What is the Total Male Population of Broussard?
Total Male Population of Broussard is 6,887.
What is the Total Female Population of Broussard?
Total Female Population of Broussard is 6,435.
What is the Ratio of Males per 100 Females in Broussard?
There are 107.02 Males per 100 Females in Broussard.
What is the Ratio of Females per 100 Males in Broussard?
There are 93.44 Females per 100 Males in Broussard.
What is the Median Population Age in Broussard?
Median Population Age in Broussard is 32.9 Years.
What is the Average Family Size in Broussard
Average Family Size in Broussard is 3.4 People.
What is the Average Household Size in Broussard
Average Household Size in Broussard is 3.0 People.
How Large is the Labor Force in Broussard?
There are 7,414 People in the Labor Forcein in Broussard.
What is the Percentage of People in the Labor Force in Broussard?
76.0% of People are in the Labor Force in Broussard.
What is the Unemployment Rate in Broussard?
Unemployment Rate in Broussard is 3.7%.