Leonville, LA Map & Demographics
Leonville Map
Leonville Overview
$14,710
PER CAPITA INCOME
$41,466
AVG FAMILY INCOME
$15,530
FAMILY INCOME DEFICIT
0.55
INEQUALITY / GINI INDEX
1,442
TOTAL POPULATION
565
MALE POPULATION
877
FEMALE POPULATION
64.42
MALES / 100 FEMALES
155.22
FEMALES / 100 MALES
29.9
MEDIAN AGE
4.3
AVG FAMILY SIZE
2.5
AVG HOUSEHOLD SIZE
350
LABOR FORCE [ PEOPLE ]
35.5%
PERCENT IN LABOR FORCE
Leonville Zip Codes
Income in Leonville
Income Overview in Leonville
| Characteristic | Number | Measure |
| Per Capita Income | 1,442 | $14,710 |
| Median Family Income | 256 | $41,466 |
| Mean Family Income | 256 | $60,930 |
| Median Household Income | 566 | $0 |
| Mean Household Income | 566 | $34,358 |
| Income Deficit | 256 | $15,530 |
| Wage / Income Gap (%) | 1,442 | 0.00% |
| Wage / Income Gap ($) | 1,442 | 100.00¢ per $1 |
| Gini / Inequality Index | 1,442 | 0.55 |
Earnings by Sex in Leonville
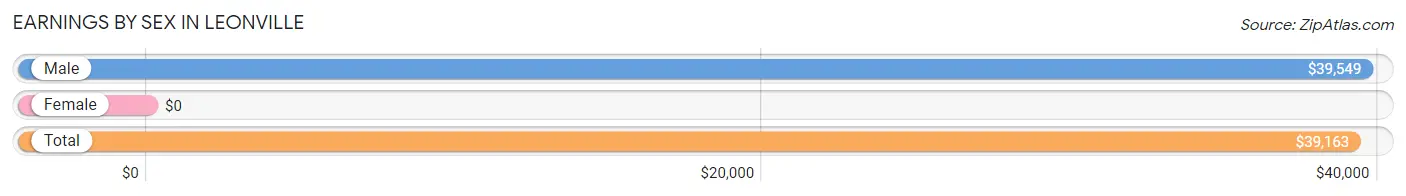
| Sex | Number | Average Earnings |
| Male | 231 (63.3%) | $39,549 |
| Female | 134 (36.7%) | $0 |
| Total | 365 (100.0%) | $39,163 |
Earnings by Sex by Income Bracket in Leonville
The most common earnings brackets in Leonville are $35,000 to $39,999 for men (97 | 42.0%) and $45,000 to $49,999 for women (41 | 30.6%).
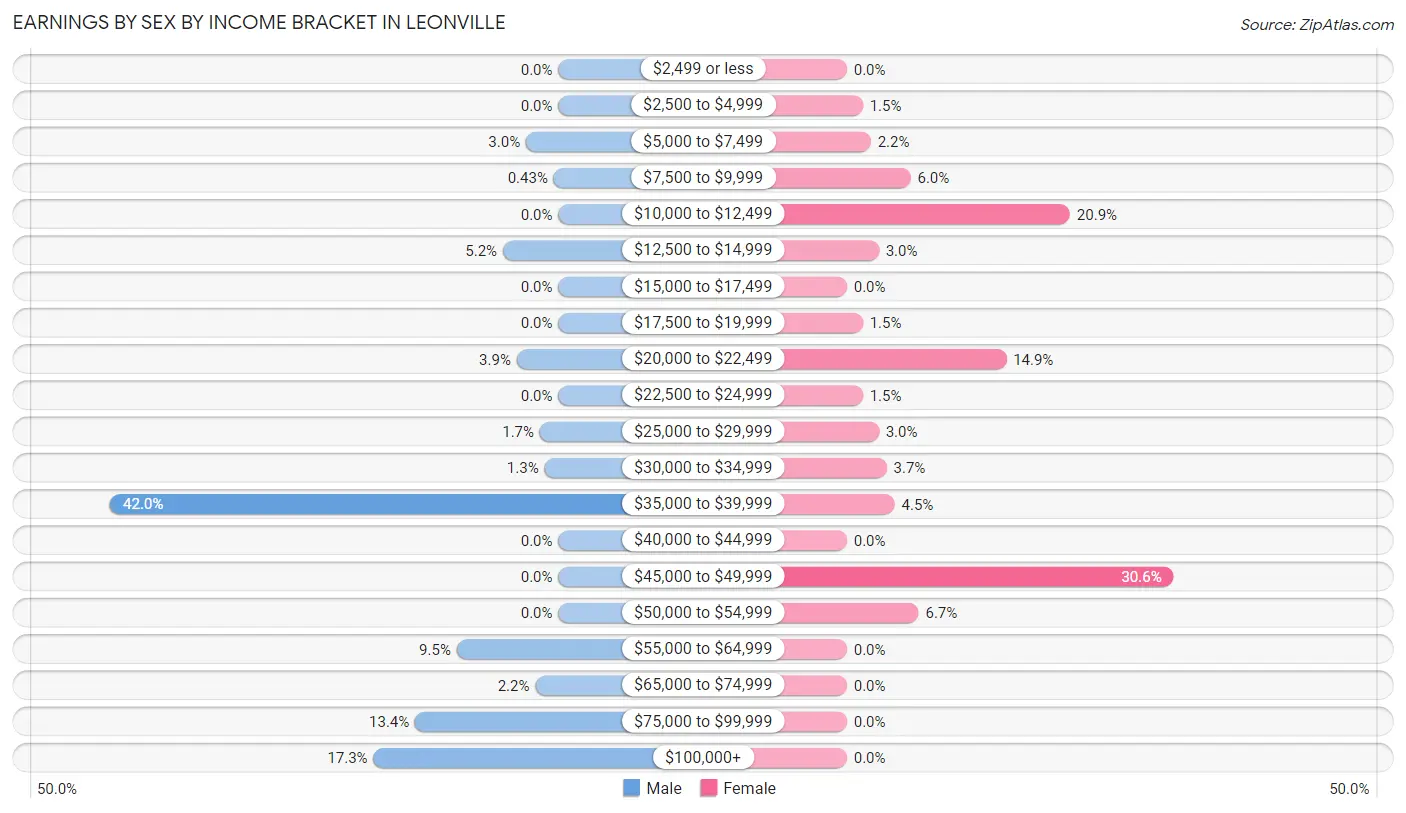
| Income | Male | Female |
| $2,499 or less | 0 (0.0%) | 0 (0.0%) |
| $2,500 to $4,999 | 0 (0.0%) | 2 (1.5%) |
| $5,000 to $7,499 | 7 (3.0%) | 3 (2.2%) |
| $7,500 to $9,999 | 1 (0.4%) | 8 (6.0%) |
| $10,000 to $12,499 | 0 (0.0%) | 28 (20.9%) |
| $12,500 to $14,999 | 12 (5.2%) | 4 (3.0%) |
| $15,000 to $17,499 | 0 (0.0%) | 0 (0.0%) |
| $17,500 to $19,999 | 0 (0.0%) | 2 (1.5%) |
| $20,000 to $22,499 | 9 (3.9%) | 20 (14.9%) |
| $22,500 to $24,999 | 0 (0.0%) | 2 (1.5%) |
| $25,000 to $29,999 | 4 (1.7%) | 4 (3.0%) |
| $30,000 to $34,999 | 3 (1.3%) | 5 (3.7%) |
| $35,000 to $39,999 | 97 (42.0%) | 6 (4.5%) |
| $40,000 to $44,999 | 0 (0.0%) | 0 (0.0%) |
| $45,000 to $49,999 | 0 (0.0%) | 41 (30.6%) |
| $50,000 to $54,999 | 0 (0.0%) | 9 (6.7%) |
| $55,000 to $64,999 | 22 (9.5%) | 0 (0.0%) |
| $65,000 to $74,999 | 5 (2.2%) | 0 (0.0%) |
| $75,000 to $99,999 | 31 (13.4%) | 0 (0.0%) |
| $100,000+ | 40 (17.3%) | 0 (0.0%) |
| Total | 231 (100.0%) | 134 (100.0%) |
Earnings by Sex by Educational Attainment in Leonville
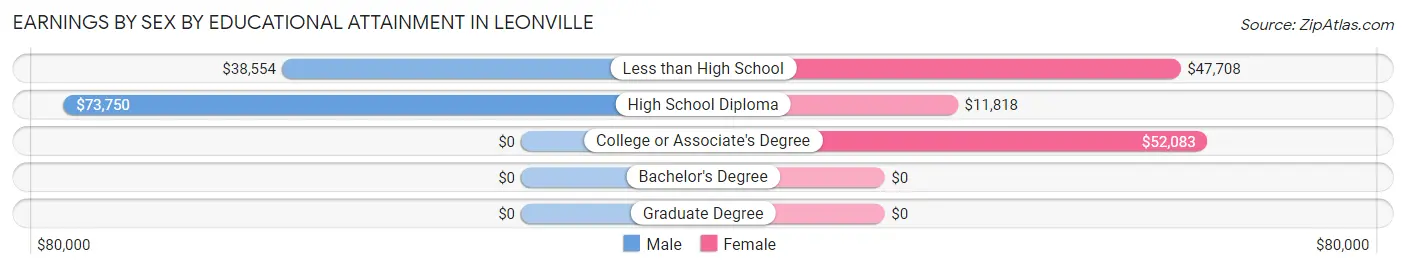
| Educational Attainment | Male Income | Female Income |
| Less than High School | $38,554 | $47,708 |
| High School Diploma | $73,750 | $11,818 |
| College or Associate's Degree | - | - |
| Bachelor's Degree | - | - |
| Graduate Degree | - | - |
| Total | - | - |
Family Income in Leonville
Family Income Brackets in Leonville
According to the Leonville family income data, there are 140 families falling into the $35,000 to $49,999 income range, which is the most common income bracket and makes up 54.7% of all families.
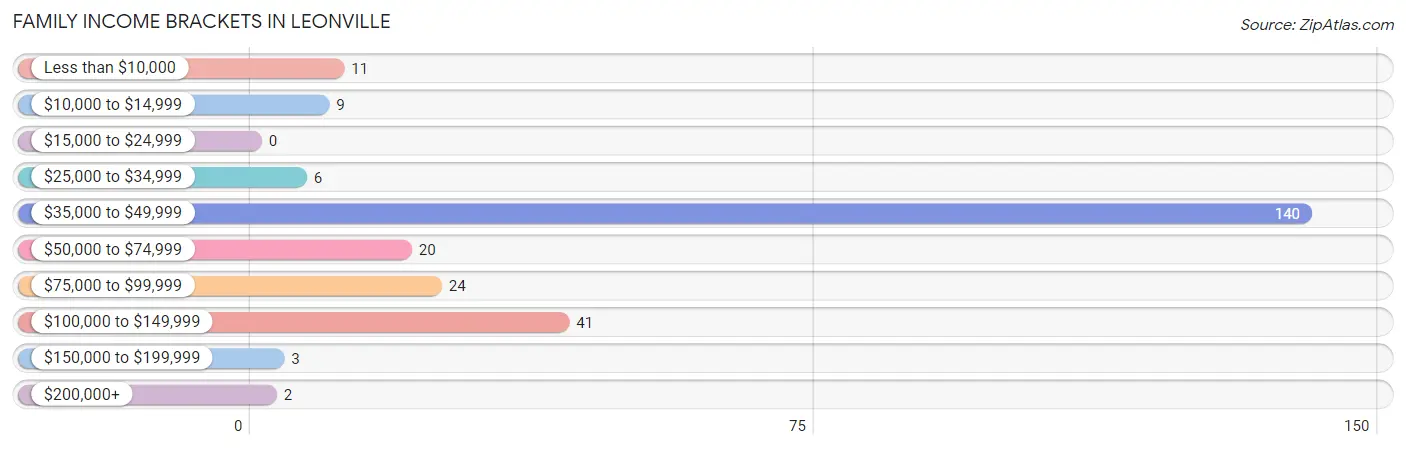
| Income Bracket | # Families | % Families |
| Less than $10,000 | 11 | 4.3% |
| $10,000 to $14,999 | 9 | 3.5% |
| $15,000 to $24,999 | 0 | 0.0% |
| $25,000 to $34,999 | 6 | 2.3% |
| $35,000 to $49,999 | 140 | 54.7% |
| $50,000 to $74,999 | 20 | 7.8% |
| $75,000 to $99,999 | 24 | 9.4% |
| $100,000 to $149,999 | 41 | 16.0% |
| $150,000 to $199,999 | 3 | 1.2% |
| $200,000+ | 2 | 0.8% |
Family Income by Famaliy Size in Leonville
4-person families (36 | 14.1%) account for the highest median family income in Leonville with $85,875 per family, while 2-person families (40 | 15.6%) have the highest median income of $21,875 per family member.
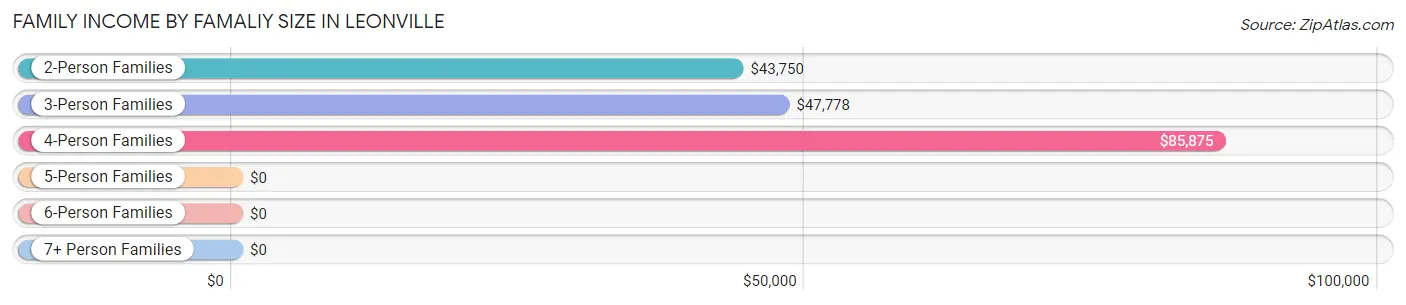
| Income Bracket | # Families | Median Income |
| 2-Person Families | 40 (15.6%) | $43,750 |
| 3-Person Families | 62 (24.2%) | $47,778 |
| 4-Person Families | 36 (14.1%) | $85,875 |
| 5-Person Families | 91 (35.5%) | $0 |
| 6-Person Families | 27 (10.5%) | $0 |
| 7+ Person Families | 0 (0.0%) | $0 |
| Total | 256 (100.0%) | $41,466 |
Family Income by Number of Earners in Leonville
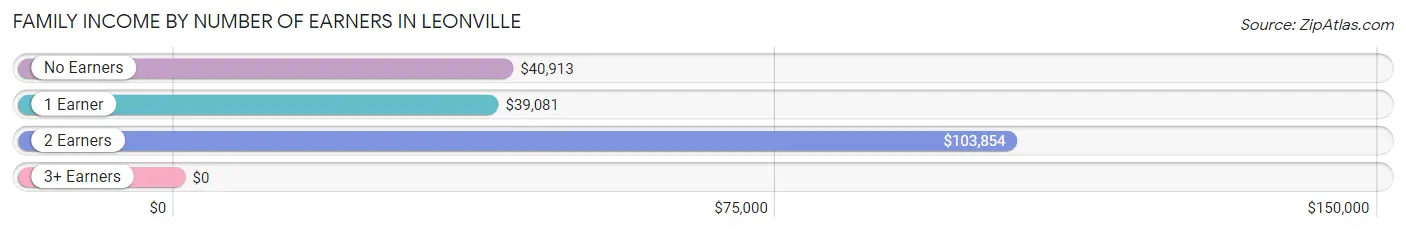
| Number of Earners | # Families | Median Income |
| No Earners | 59 (23.1%) | $40,913 |
| 1 Earner | 121 (47.3%) | $39,081 |
| 2 Earners | 73 (28.5%) | $103,854 |
| 3+ Earners | 3 (1.2%) | $0 |
| Total | 256 (100.0%) | $41,466 |
Household Income in Leonville
Household Income Brackets in Leonville
With 225 households falling in the category, the less than $10,000 income range is the most frequent in Leonville, accounting for 39.8% of all households. In contrast, only 2 households (0.4%) fall into the $200,000+ income bracket, making it the least populous group.
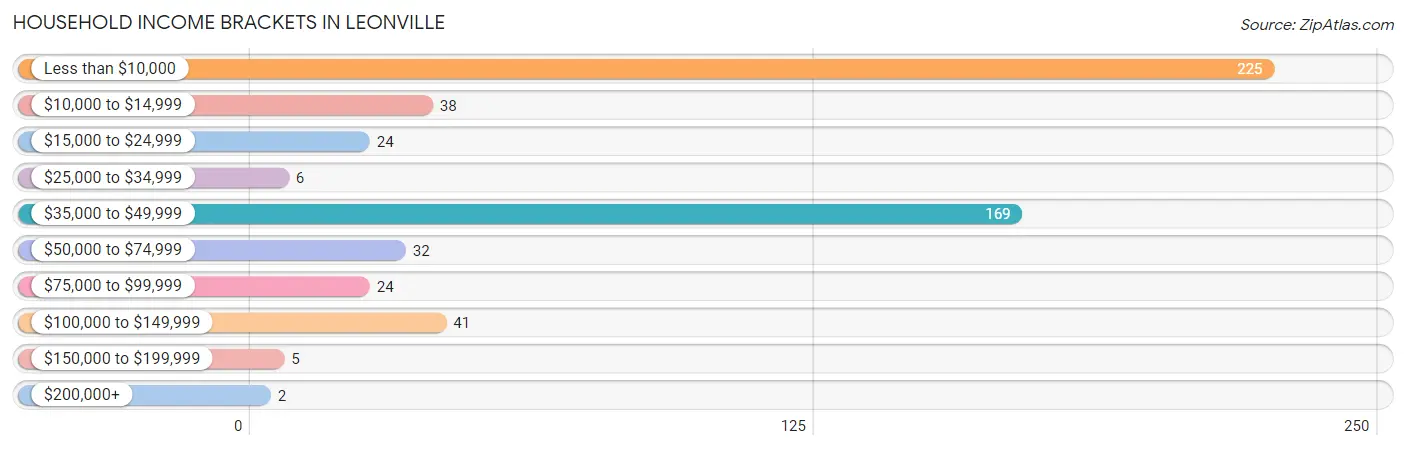
| Income Bracket | # Households | % Households |
| Less than $10,000 | 225 | 39.8% |
| $10,000 to $14,999 | 38 | 6.7% |
| $15,000 to $24,999 | 24 | 4.2% |
| $25,000 to $34,999 | 6 | 1.1% |
| $35,000 to $49,999 | 169 | 29.9% |
| $50,000 to $74,999 | 32 | 5.7% |
| $75,000 to $99,999 | 24 | 4.2% |
| $100,000 to $149,999 | 41 | 7.2% |
| $150,000 to $199,999 | 5 | 0.9% |
| $200,000+ | 2 | 0.4% |
Household Income by Householder Age in Leonville
The median household income in Leonville is $0, with the highest median household income of $42,308 found in the 45 to 64 years age bracket for the primary householder. A total of 130 households (23.0%) fall into this category. Meanwhile, the 15 to 24 years age bracket for the primary householder has the lowest median household income of $0, with 8 households (1.4%) in this group.
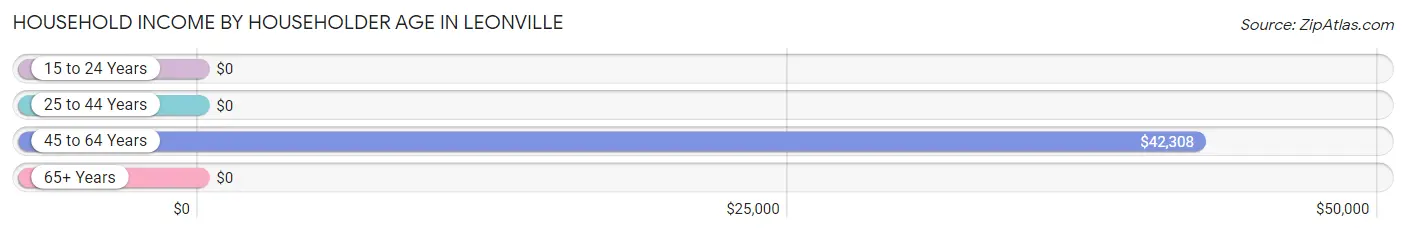
| Income Bracket | # Households | Median Income |
| 15 to 24 Years | 8 (1.4%) | $0 |
| 25 to 44 Years | 146 (25.8%) | $0 |
| 45 to 64 Years | 130 (23.0%) | $42,308 |
| 65+ Years | 282 (49.8%) | $0 |
| Total | 566 (100.0%) | $0 |
Poverty in Leonville
Income Below Poverty by Sex and Age in Leonville
With 9.4% poverty level for males and 30.7% for females among the residents of Leonville, 65 to 74 year old males and 65 to 74 year old females are the most vulnerable to poverty, with 9 males (23.1%) and 203 females (90.2%) in their respective age groups living below the poverty level.
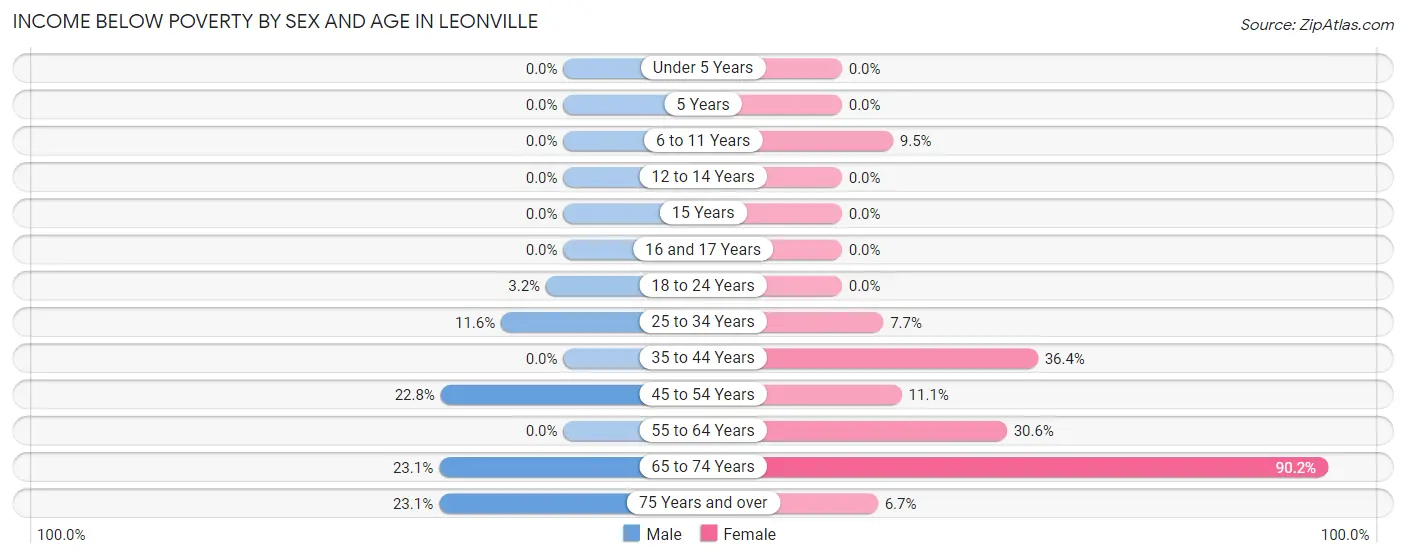
| Age Bracket | Male | Female |
| Under 5 Years | 0 (0.0%) | 0 (0.0%) |
| 5 Years | 0 (0.0%) | 0 (0.0%) |
| 6 to 11 Years | 0 (0.0%) | 18 (9.5%) |
| 12 to 14 Years | 0 (0.0%) | 0 (0.0%) |
| 15 Years | 0 (0.0%) | 0 (0.0%) |
| 16 and 17 Years | 0 (0.0%) | 0 (0.0%) |
| 18 to 24 Years | 1 (3.2%) | 0 (0.0%) |
| 25 to 34 Years | 17 (11.6%) | 11 (7.7%) |
| 35 to 44 Years | 0 (0.0%) | 8 (36.4%) |
| 45 to 54 Years | 23 (22.8%) | 11 (11.1%) |
| 55 to 64 Years | 0 (0.0%) | 15 (30.6%) |
| 65 to 74 Years | 9 (23.1%) | 203 (90.2%) |
| 75 Years and over | 3 (23.1%) | 3 (6.7%) |
| Total | 53 (9.4%) | 269 (30.7%) |
Income Above Poverty by Sex and Age in Leonville
According to the poverty statistics in Leonville, males aged under 5 years and females aged under 5 years are the age groups that are most secure financially, with 100.0% of males and 100.0% of females in these age groups living above the poverty line.
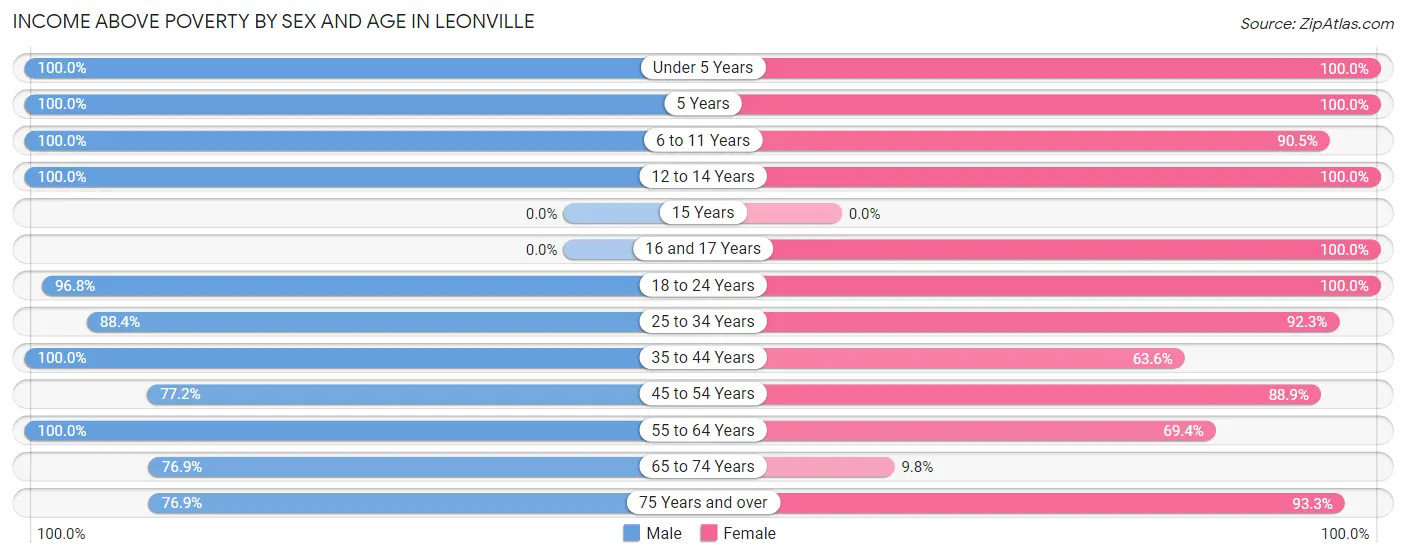
| Age Bracket | Male | Female |
| Under 5 Years | 29 (100.0%) | 75 (100.0%) |
| 5 Years | 18 (100.0%) | 4 (100.0%) |
| 6 to 11 Years | 58 (100.0%) | 172 (90.5%) |
| 12 to 14 Years | 79 (100.0%) | 3 (100.0%) |
| 15 Years | 0 (0.0%) | 0 (0.0%) |
| 16 and 17 Years | 0 (0.0%) | 15 (100.0%) |
| 18 to 24 Years | 30 (96.8%) | 7 (100.0%) |
| 25 to 34 Years | 130 (88.4%) | 132 (92.3%) |
| 35 to 44 Years | 28 (100.0%) | 14 (63.6%) |
| 45 to 54 Years | 78 (77.2%) | 88 (88.9%) |
| 55 to 64 Years | 22 (100.0%) | 34 (69.4%) |
| 65 to 74 Years | 30 (76.9%) | 22 (9.8%) |
| 75 Years and over | 10 (76.9%) | 42 (93.3%) |
| Total | 512 (90.6%) | 608 (69.3%) |
Income Below Poverty Among Married-Couple Families in Leonville
The poverty statistics for married-couple families in Leonville show that 8.6% or 20 of the total 233 families live below the poverty line. Families with 1 or 2 children have the highest poverty rate of 17.8%, comprising of 8 families. On the other hand, families with 3 or 4 children have the lowest poverty rate of 0.0%, which includes 0 families.
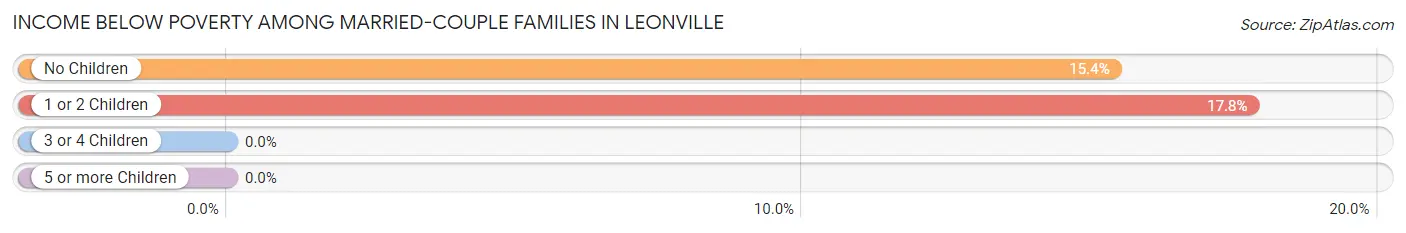
| Children | Above Poverty | Below Poverty |
| No Children | 66 (84.6%) | 12 (15.4%) |
| 1 or 2 Children | 37 (82.2%) | 8 (17.8%) |
| 3 or 4 Children | 110 (100.0%) | 0 (0.0%) |
| 5 or more Children | 0 (0.0%) | 0 (0.0%) |
| Total | 213 (91.4%) | 20 (8.6%) |
Income Below Poverty Among Single-Parent Households in Leonville
| Children | Single Father | Single Mother |
| No Children | 0 (0.0%) | 0 (0.0%) |
| 1 or 2 Children | 0 (0.0%) | 0 (0.0%) |
| 3 or 4 Children | 0 (0.0%) | 0 (0.0%) |
| 5 or more Children | 0 (0.0%) | 0 (0.0%) |
| Total | 0 (0.0%) | 0 (0.0%) |
Income Below Poverty Among Married-Couple vs Single-Parent Households in Leonville
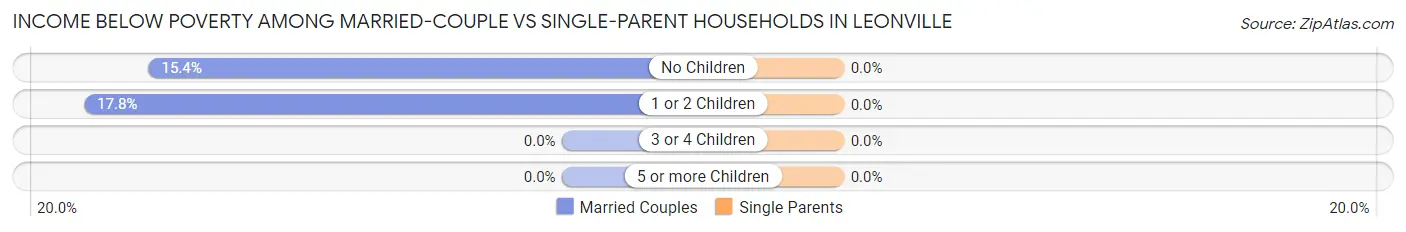
| Children | Married-Couple Families | Single-Parent Households |
| No Children | 12 (15.4%) | 0 (0.0%) |
| 1 or 2 Children | 8 (17.8%) | 0 (0.0%) |
| 3 or 4 Children | 0 (0.0%) | 0 (0.0%) |
| 5 or more Children | 0 (0.0%) | 0 (0.0%) |
| Total | 20 (8.6%) | 0 (0.0%) |
Race in Leonville
The most populous races in Leonville are White / Caucasian (980 | 68.0%), Black / African American (247 | 17.1%), and Two or more Races (213 | 14.8%).
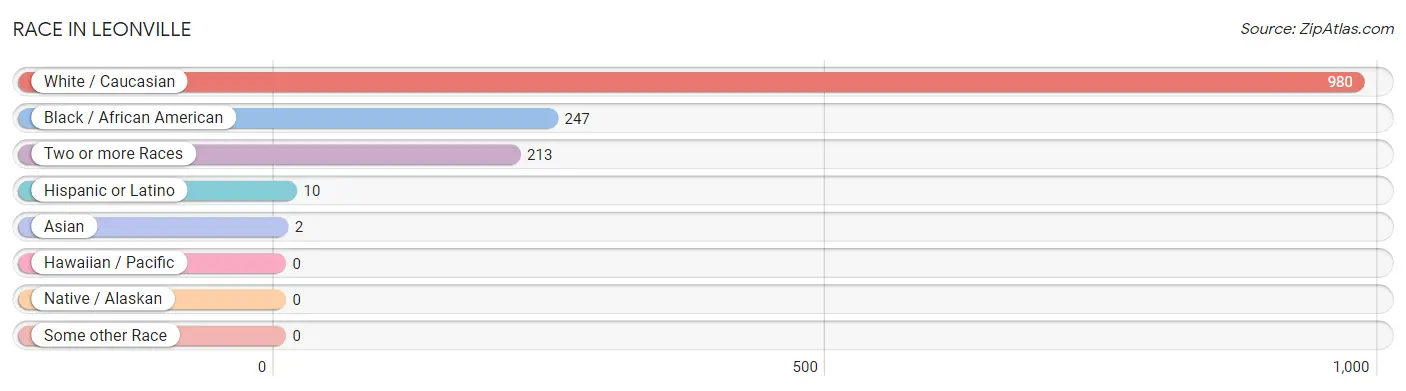
| Race | # Population | % Population |
| Asian | 2 | 0.1% |
| Black / African American | 247 | 17.1% |
| Hawaiian / Pacific | 0 | 0.0% |
| Hispanic or Latino | 10 | 0.7% |
| Native / Alaskan | 0 | 0.0% |
| White / Caucasian | 980 | 68.0% |
| Two or more Races | 213 | 14.8% |
| Some other Race | 0 | 0.0% |
| Total | 1,442 | 100.0% |
Ancestry in Leonville
The most populous ancestries reported in Leonville are French Canadian (567 | 39.3%), French (254 | 17.6%), Irish (194 | 13.5%), Italian (160 | 11.1%), and German (26 | 1.8%), together accounting for 83.3% of all Leonville residents.
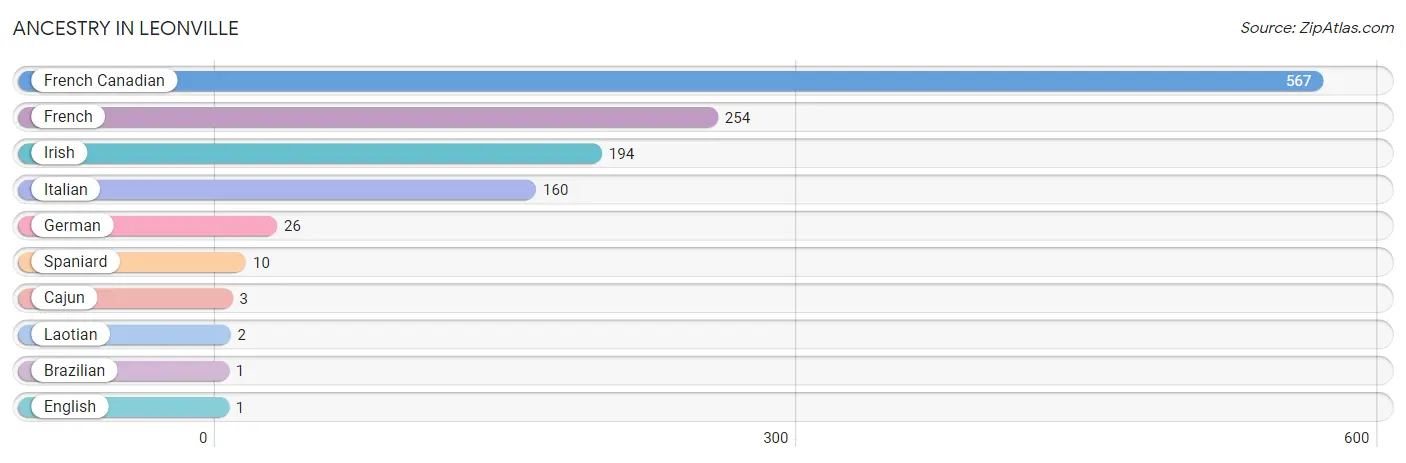
| Ancestry | # Population | % Population |
| Brazilian | 1 | 0.1% |
| Cajun | 3 | 0.2% |
| English | 1 | 0.1% |
| French | 254 | 17.6% |
| French Canadian | 567 | 39.3% |
| German | 26 | 1.8% |
| Irish | 194 | 13.5% |
| Italian | 160 | 11.1% |
| Laotian | 2 | 0.1% |
| Spaniard | 10 | 0.7% | View All 10 Rows |
Immigrants in Leonville
The most numerous immigrant groups reported in Leonville came from Asia (2 | 0.1%), Indonesia (2 | 0.1%), South Eastern Asia (2 | 0.1%), Brazil (1 | 0.1%), and Latin America (1 | 0.1%), together accounting for 0.6% of all Leonville residents.
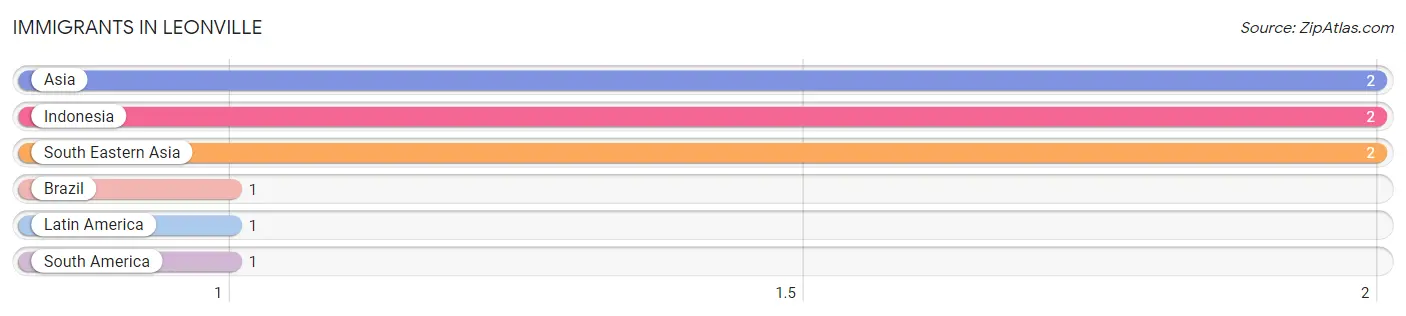
| Immigration Origin | # Population | % Population |
| Asia | 2 | 0.1% |
| Brazil | 1 | 0.1% |
| Indonesia | 2 | 0.1% |
| Latin America | 1 | 0.1% |
| South America | 1 | 0.1% |
| South Eastern Asia | 2 | 0.1% | View All 6 Rows |
Sex and Age in Leonville
Sex and Age in Leonville
The most populous age groups in Leonville are 25 to 29 Years (107 | 18.9%) for men and 70 to 74 Years (215 | 24.5%) for women.
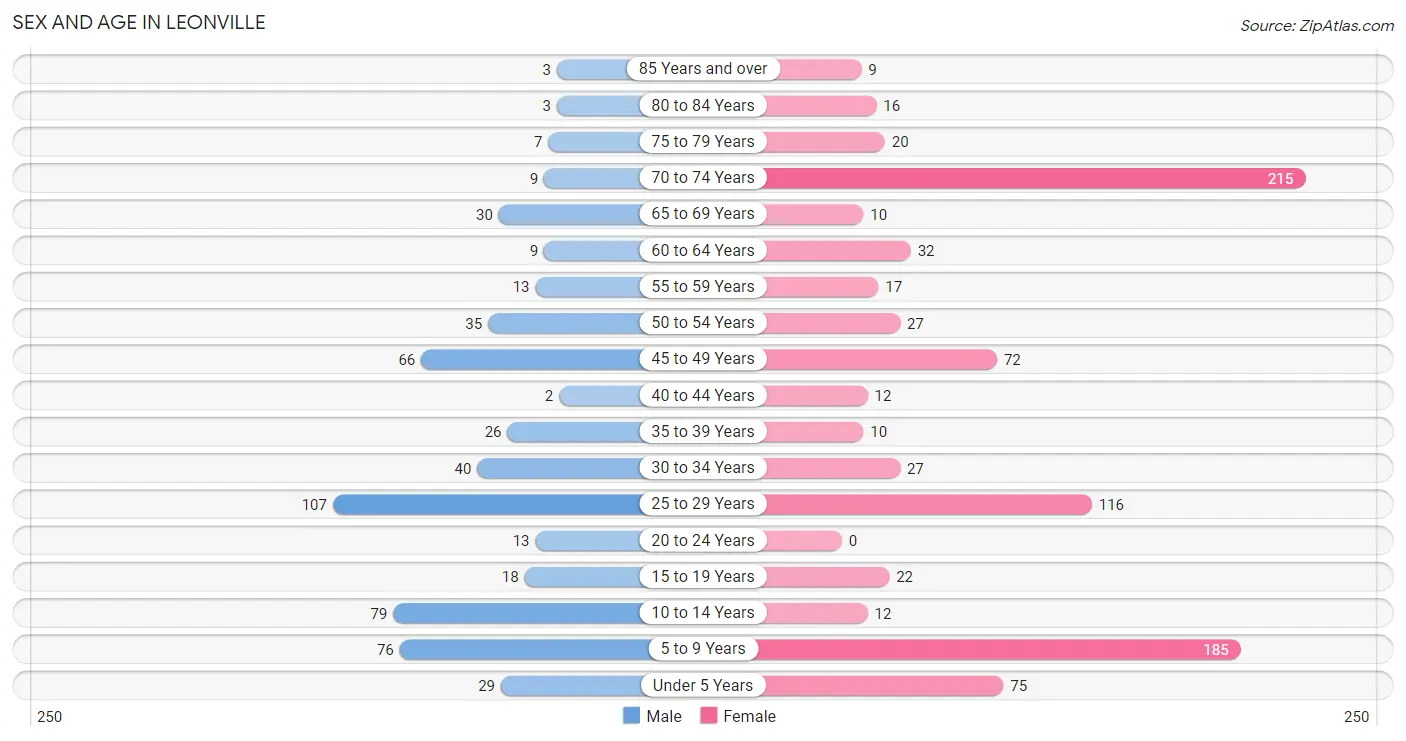
| Age Bracket | Male | Female |
| Under 5 Years | 29 (5.1%) | 75 (8.6%) |
| 5 to 9 Years | 76 (13.5%) | 185 (21.1%) |
| 10 to 14 Years | 79 (14.0%) | 12 (1.4%) |
| 15 to 19 Years | 18 (3.2%) | 22 (2.5%) |
| 20 to 24 Years | 13 (2.3%) | 0 (0.0%) |
| 25 to 29 Years | 107 (18.9%) | 116 (13.2%) |
| 30 to 34 Years | 40 (7.1%) | 27 (3.1%) |
| 35 to 39 Years | 26 (4.6%) | 10 (1.1%) |
| 40 to 44 Years | 2 (0.4%) | 12 (1.4%) |
| 45 to 49 Years | 66 (11.7%) | 72 (8.2%) |
| 50 to 54 Years | 35 (6.2%) | 27 (3.1%) |
| 55 to 59 Years | 13 (2.3%) | 17 (1.9%) |
| 60 to 64 Years | 9 (1.6%) | 32 (3.6%) |
| 65 to 69 Years | 30 (5.3%) | 10 (1.1%) |
| 70 to 74 Years | 9 (1.6%) | 215 (24.5%) |
| 75 to 79 Years | 7 (1.2%) | 20 (2.3%) |
| 80 to 84 Years | 3 (0.5%) | 16 (1.8%) |
| 85 Years and over | 3 (0.5%) | 9 (1.0%) |
| Total | 565 (100.0%) | 877 (100.0%) |
Families and Households in Leonville
Median Family Size in Leonville
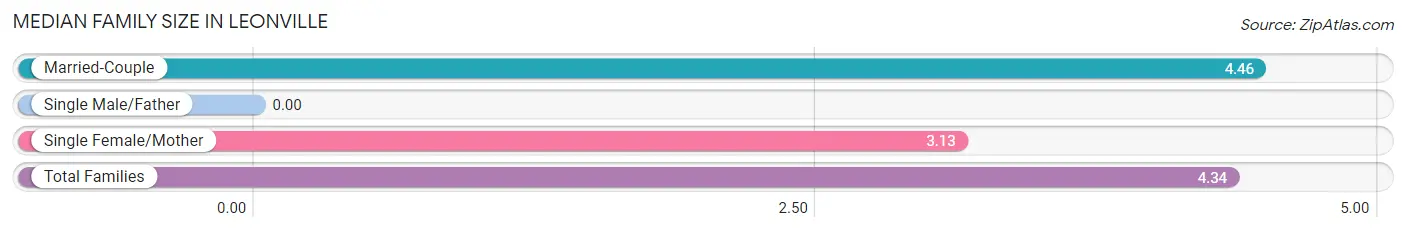
| Family Type | # Families | Family Size |
| Married-Couple | 233 (91.0%) | 4.46 |
| Single Male/Father | 0 (0.0%) | - |
| Single Female/Mother | 23 (9.0%) | 3.13 |
| Total Families | 256 (100.0%) | 4.34 |
Median Household Size in Leonville
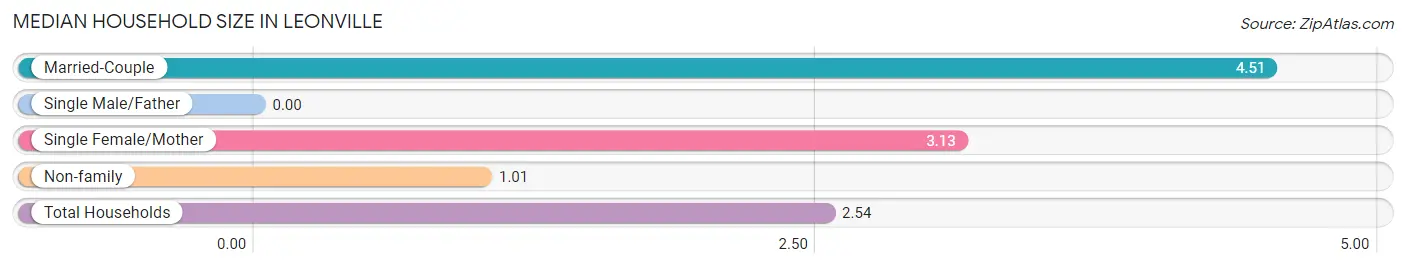
| Household Type | # Households | Household Size |
| Married-Couple | 233 (41.2%) | 4.51 |
| Single Male/Father | 0 (0.0%) | - |
| Single Female/Mother | 23 (4.1%) | 3.13 |
| Non-family | 310 (54.8%) | 1.01 |
| Total Households | 566 (100.0%) | 2.54 |
Household Size by Marriage Status in Leonville
Out of a total of 566 households in Leonville, 256 (45.2%) are family households, while 310 (54.8%) are nonfamily households. The most numerous type of family households are 5-person households, comprising 83, and the most common type of nonfamily households are 1-person households, comprising 305.
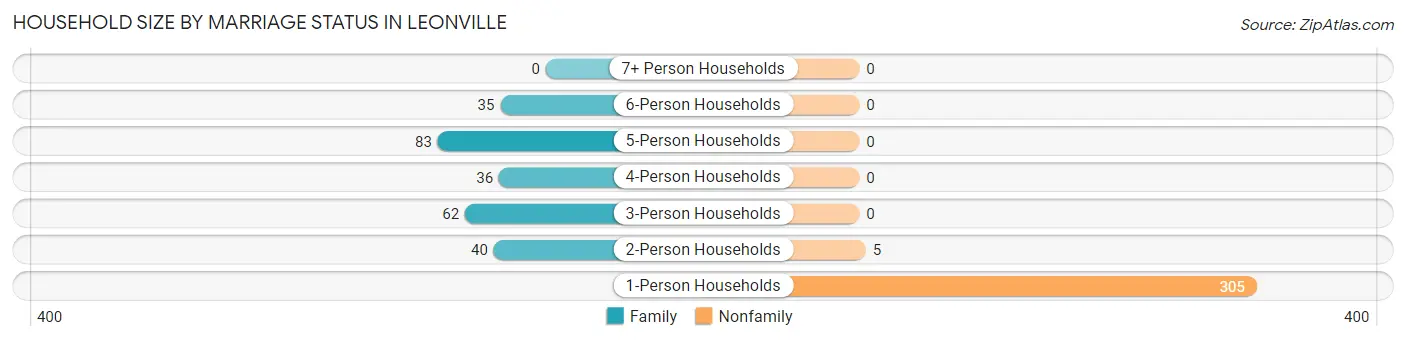
| Household Size | Family Households | Nonfamily Households |
| 1-Person Households | - | 305 (53.9%) |
| 2-Person Households | 40 (7.1%) | 5 (0.9%) |
| 3-Person Households | 62 (11.0%) | 0 (0.0%) |
| 4-Person Households | 36 (6.4%) | 0 (0.0%) |
| 5-Person Households | 83 (14.7%) | 0 (0.0%) |
| 6-Person Households | 35 (6.2%) | 0 (0.0%) |
| 7+ Person Households | 0 (0.0%) | 0 (0.0%) |
| Total | 256 (45.2%) | 310 (54.8%) |
Female Fertility in Leonville
Fertility by Age in Leonville
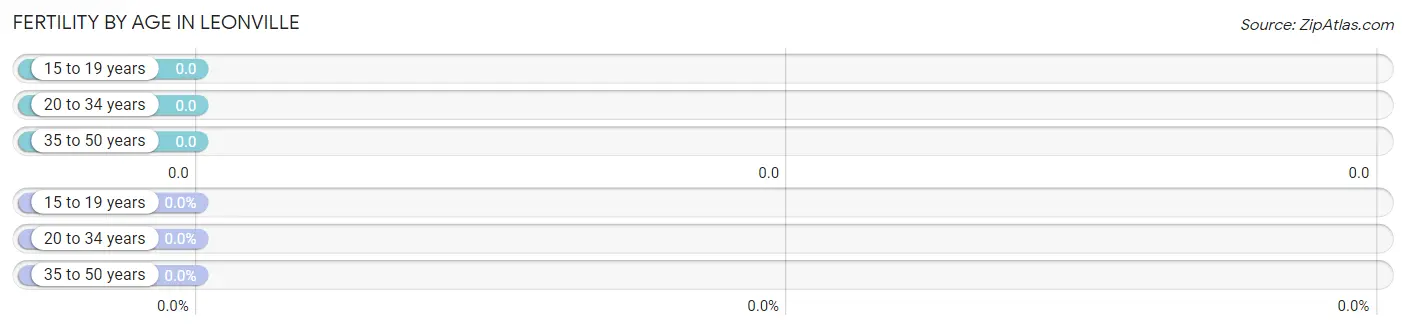
| Age Bracket | Women with Births | Births / 1,000 Women |
| 15 to 19 years | 0 (0.0%) | 0.0 |
| 20 to 34 years | 0 (0.0%) | 0.0 |
| 35 to 50 years | 0 (0.0%) | 0.0 |
| Total | 0 (0.0%) | 0.0 |
Fertility by Age by Marriage Status in Leonville
| Age Bracket | Married | Unmarried |
| 15 to 19 years | 0 (0.0%) | 0 (0.0%) |
| 20 to 34 years | 0 (0.0%) | 0 (0.0%) |
| 35 to 50 years | 0 (0.0%) | 0 (0.0%) |
| Total | 0 (0.0%) | 0 (0.0%) |
Fertility by Education in Leonville
| Educational Attainment | Women with Births | Births / 1,000 Women |
| Less than High School | 0 (0.0%) | 0.0 |
| High School Diploma | 0 (0.0%) | 0.0 |
| College or Associate's Degree | 0 (0.0%) | 0.0 |
| Bachelor's Degree | 0 (0.0%) | 0.0 |
| Graduate Degree | 0 (0.0%) | 0.0 |
| Total | 0 (0.0%) | 0.0 |
Fertility by Education by Marriage Status in Leonville
| Educational Attainment | Married | Unmarried |
| Less than High School | 0 (0.0%) | 0 (0.0%) |
| High School Diploma | 0 (0.0%) | 0 (0.0%) |
| College or Associate's Degree | 0 (0.0%) | 0 (0.0%) |
| Bachelor's Degree | 0 (0.0%) | 0 (0.0%) |
| Graduate Degree | 0 (0.0%) | 0 (0.0%) |
| Total | 0 (0.0%) | 0 (0.0%) |
Employment Characteristics in Leonville
Employment by Class of Employer in Leonville
Among the 329 employed individuals in Leonville, private company employees (204 | 62.0%), self-employed (not incorporated) (45 | 13.7%), and local government employees (40 | 12.2%) make up the most common classes of employment.
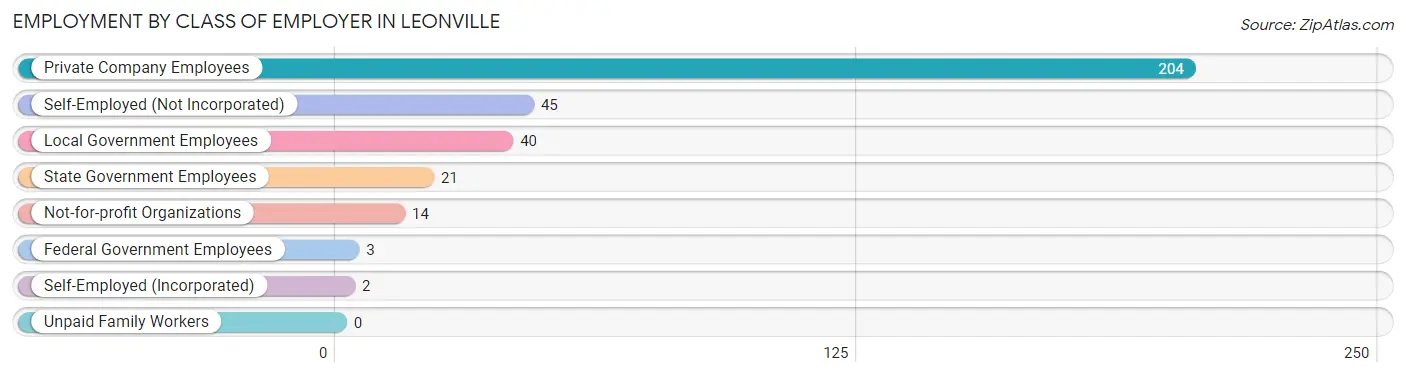
| Employer Class | # Employees | % Employees |
| Private Company Employees | 204 | 62.0% |
| Self-Employed (Incorporated) | 2 | 0.6% |
| Self-Employed (Not Incorporated) | 45 | 13.7% |
| Not-for-profit Organizations | 14 | 4.3% |
| Local Government Employees | 40 | 12.2% |
| State Government Employees | 21 | 6.4% |
| Federal Government Employees | 3 | 0.9% |
| Unpaid Family Workers | 0 | 0.0% |
| Total | 329 | 100.0% |
Employment Status by Age in Leonville
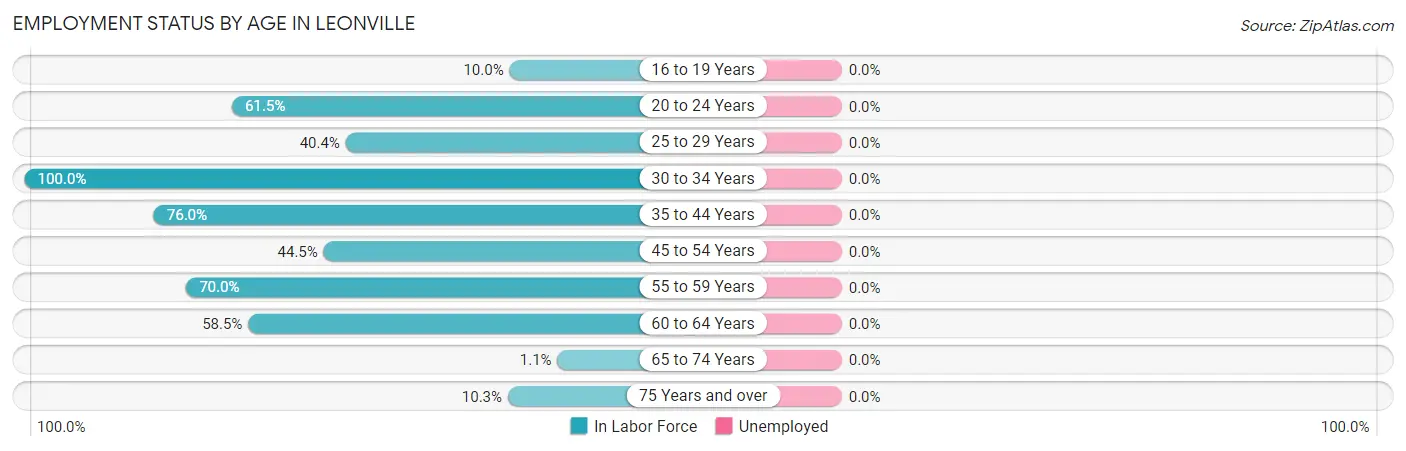
| Age Bracket | In Labor Force | Unemployed |
| 16 to 19 Years | 4 (10.0%) | 0 (0.0%) |
| 20 to 24 Years | 8 (61.5%) | 0 (0.0%) |
| 25 to 29 Years | 90 (40.4%) | 0 (0.0%) |
| 30 to 34 Years | 67 (100.0%) | 0 (0.0%) |
| 35 to 44 Years | 38 (76.0%) | 0 (0.0%) |
| 45 to 54 Years | 89 (44.5%) | 0 (0.0%) |
| 55 to 59 Years | 21 (70.0%) | 0 (0.0%) |
| 60 to 64 Years | 24 (58.5%) | 0 (0.0%) |
| 65 to 74 Years | 3 (1.1%) | 0 (0.0%) |
| 75 Years and over | 6 (10.3%) | 0 (0.0%) |
| Total | 350 (35.5%) | 0 (0.0%) |
Employment Status by Educational Attainment in Leonville
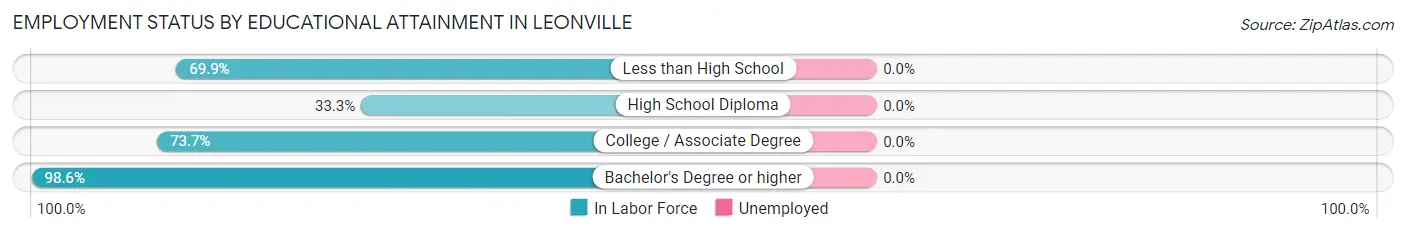
| Educational Attainment | In Labor Force | Unemployed |
| Less than High School | 123 (69.9%) | 0 (0.0%) |
| High School Diploma | 109 (33.3%) | 0 (0.0%) |
| College / Associate Degree | 28 (73.7%) | 0 (0.0%) |
| Bachelor's Degree or higher | 69 (98.6%) | 0 (0.0%) |
| Total | 329 (53.8%) | 0 (0.0%) |
Employment Occupations by Sex in Leonville
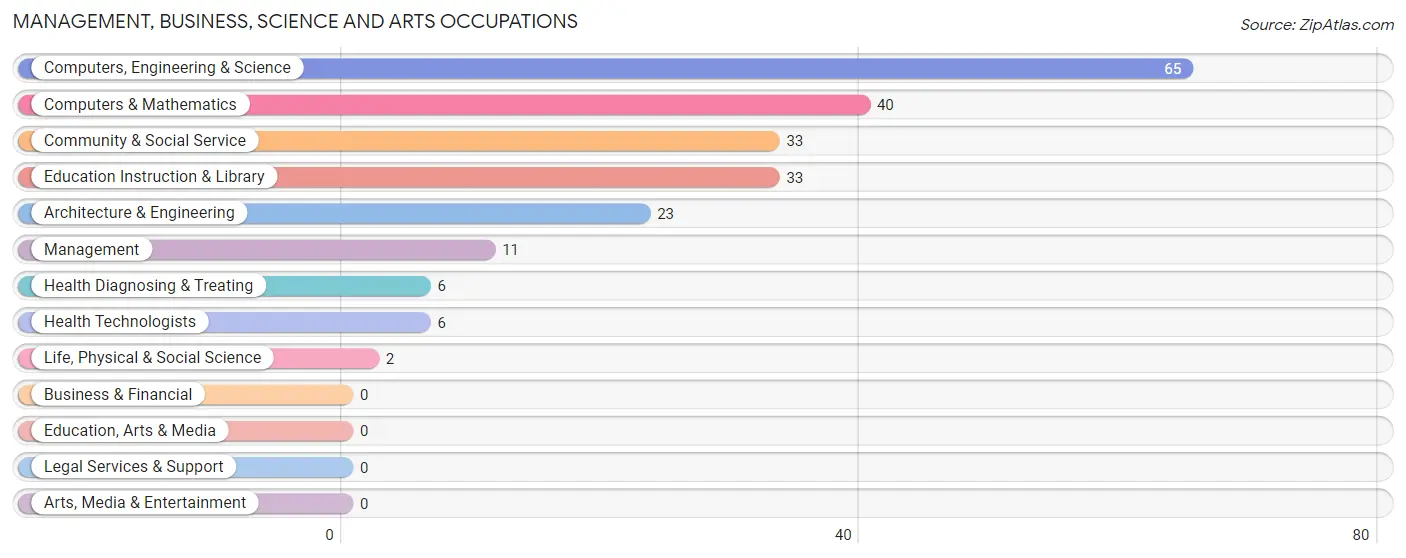
Management, Business, Science and Arts Occupations
The most common Management, Business, Science and Arts occupations in Leonville are Computers, Engineering & Science (65 | 18.7%), Computers & Mathematics (40 | 11.5%), Community & Social Service (33 | 9.5%), Education Instruction & Library (33 | 9.5%), and Architecture & Engineering (23 | 6.6%).
Management, Business, Science and Arts Occupations by Sex
Within the Management, Business, Science and Arts occupations in Leonville, the most male-oriented occupations are Management (100.0%), Computers, Engineering & Science (100.0%), and Computers & Mathematics (100.0%), while the most female-oriented occupations are Health Diagnosing & Treating (100.0%), Health Technologists (100.0%), and Community & Social Service (63.6%).
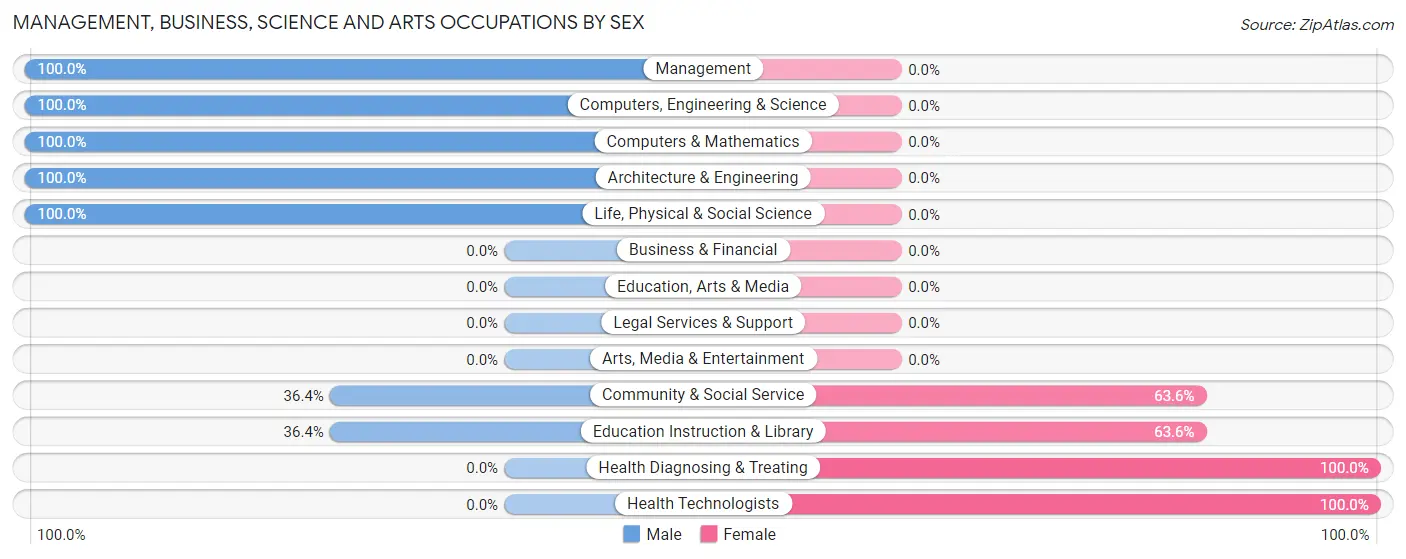
| Occupation | Male | Female |
| Management | 11 (100.0%) | 0 (0.0%) |
| Business & Financial | 0 (0.0%) | 0 (0.0%) |
| Computers, Engineering & Science | 65 (100.0%) | 0 (0.0%) |
| Computers & Mathematics | 40 (100.0%) | 0 (0.0%) |
| Architecture & Engineering | 23 (100.0%) | 0 (0.0%) |
| Life, Physical & Social Science | 2 (100.0%) | 0 (0.0%) |
| Community & Social Service | 12 (36.4%) | 21 (63.6%) |
| Education, Arts & Media | 0 (0.0%) | 0 (0.0%) |
| Legal Services & Support | 0 (0.0%) | 0 (0.0%) |
| Education Instruction & Library | 12 (36.4%) | 21 (63.6%) |
| Arts, Media & Entertainment | 0 (0.0%) | 0 (0.0%) |
| Health Diagnosing & Treating | 0 (0.0%) | 6 (100.0%) |
| Health Technologists | 0 (0.0%) | 6 (100.0%) |
| Total (Category) | 88 (76.5%) | 27 (23.5%) |
| Total (Overall) | 218 (62.8%) | 129 (37.2%) |
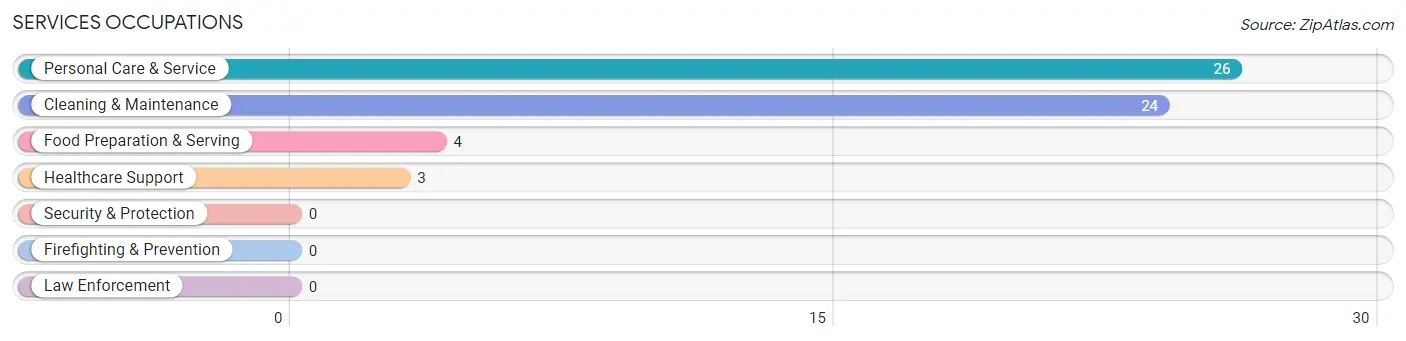
Services Occupations
The most common Services occupations in Leonville are Personal Care & Service (26 | 7.5%), Cleaning & Maintenance (24 | 6.9%), Food Preparation & Serving (4 | 1.1%), and Healthcare Support (3 | 0.9%).
Services Occupations by Sex
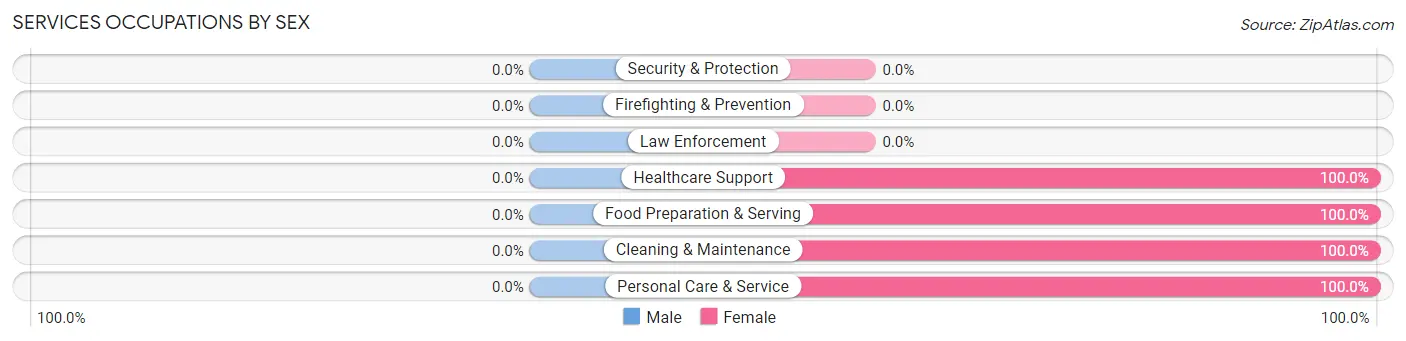
| Occupation | Male | Female |
| Healthcare Support | 0 (0.0%) | 3 (100.0%) |
| Security & Protection | 0 (0.0%) | 0 (0.0%) |
| Firefighting & Prevention | 0 (0.0%) | 0 (0.0%) |
| Law Enforcement | 0 (0.0%) | 0 (0.0%) |
| Food Preparation & Serving | 0 (0.0%) | 4 (100.0%) |
| Cleaning & Maintenance | 0 (0.0%) | 24 (100.0%) |
| Personal Care & Service | 0 (0.0%) | 26 (100.0%) |
| Total (Category) | 0 (0.0%) | 57 (100.0%) |
| Total (Overall) | 218 (62.8%) | 129 (37.2%) |
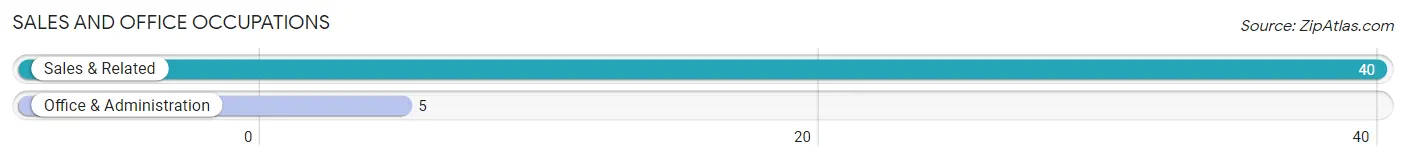
Sales and Office Occupations
The most common Sales and Office occupations in Leonville are Sales & Related (40 | 11.5%), and Office & Administration (5 | 1.4%).
Sales and Office Occupations by Sex
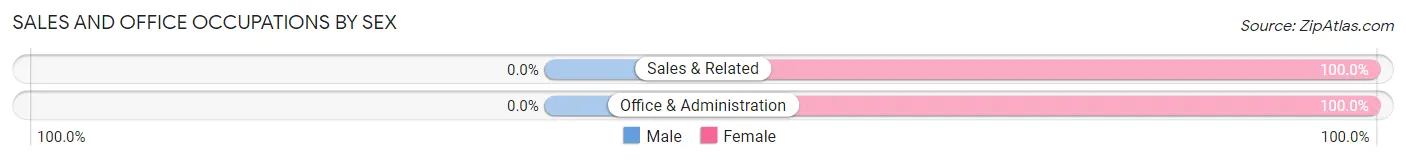
| Occupation | Male | Female |
| Sales & Related | 0 (0.0%) | 40 (100.0%) |
| Office & Administration | 0 (0.0%) | 5 (100.0%) |
| Total (Category) | 0 (0.0%) | 45 (100.0%) |
| Total (Overall) | 218 (62.8%) | 129 (37.2%) |
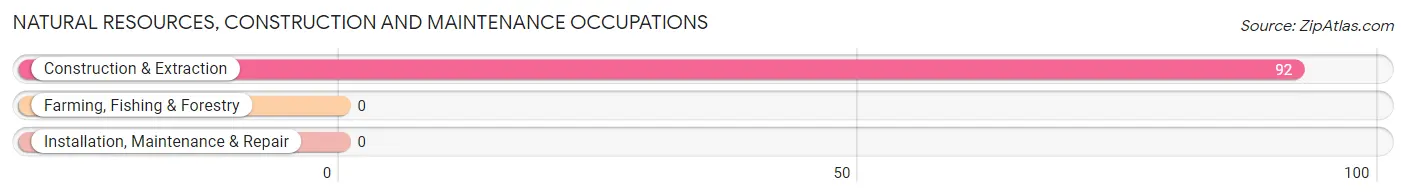
Natural Resources, Construction and Maintenance Occupations
The most common Natural Resources, Construction and Maintenance occupations in Leonville are , and Construction & Extraction (92 | 26.5%).
Natural Resources, Construction and Maintenance Occupations by Sex
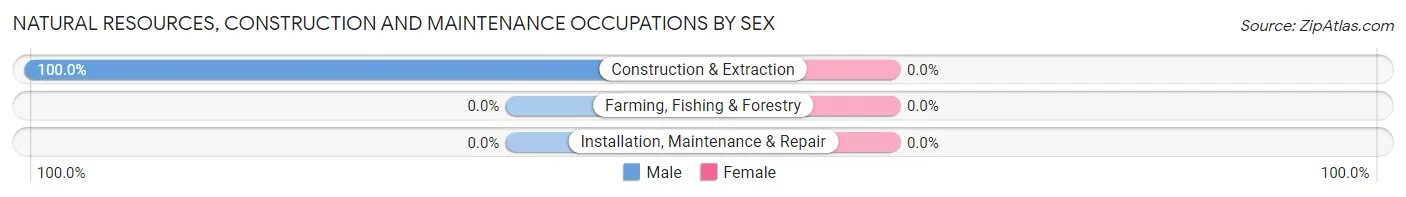
| Occupation | Male | Female |
| Farming, Fishing & Forestry | 0 (0.0%) | 0 (0.0%) |
| Construction & Extraction | 92 (100.0%) | 0 (0.0%) |
| Installation, Maintenance & Repair | 0 (0.0%) | 0 (0.0%) |
| Total (Category) | 92 (100.0%) | 0 (0.0%) |
| Total (Overall) | 218 (62.8%) | 129 (37.2%) |
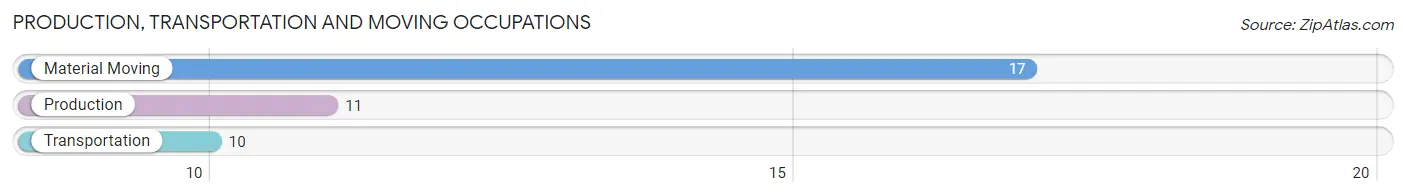
Production, Transportation and Moving Occupations
The most common Production, Transportation and Moving occupations in Leonville are Material Moving (17 | 4.9%), Production (11 | 3.2%), and Transportation (10 | 2.9%).
Production, Transportation and Moving Occupations by Sex
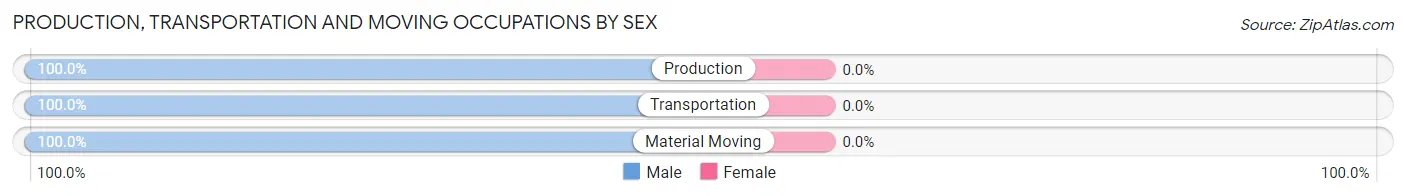
| Occupation | Male | Female |
| Production | 11 (100.0%) | 0 (0.0%) |
| Transportation | 10 (100.0%) | 0 (0.0%) |
| Material Moving | 17 (100.0%) | 0 (0.0%) |
| Total (Category) | 38 (100.0%) | 0 (0.0%) |
| Total (Overall) | 218 (62.8%) | 129 (37.2%) |
Employment Industries by Sex in Leonville
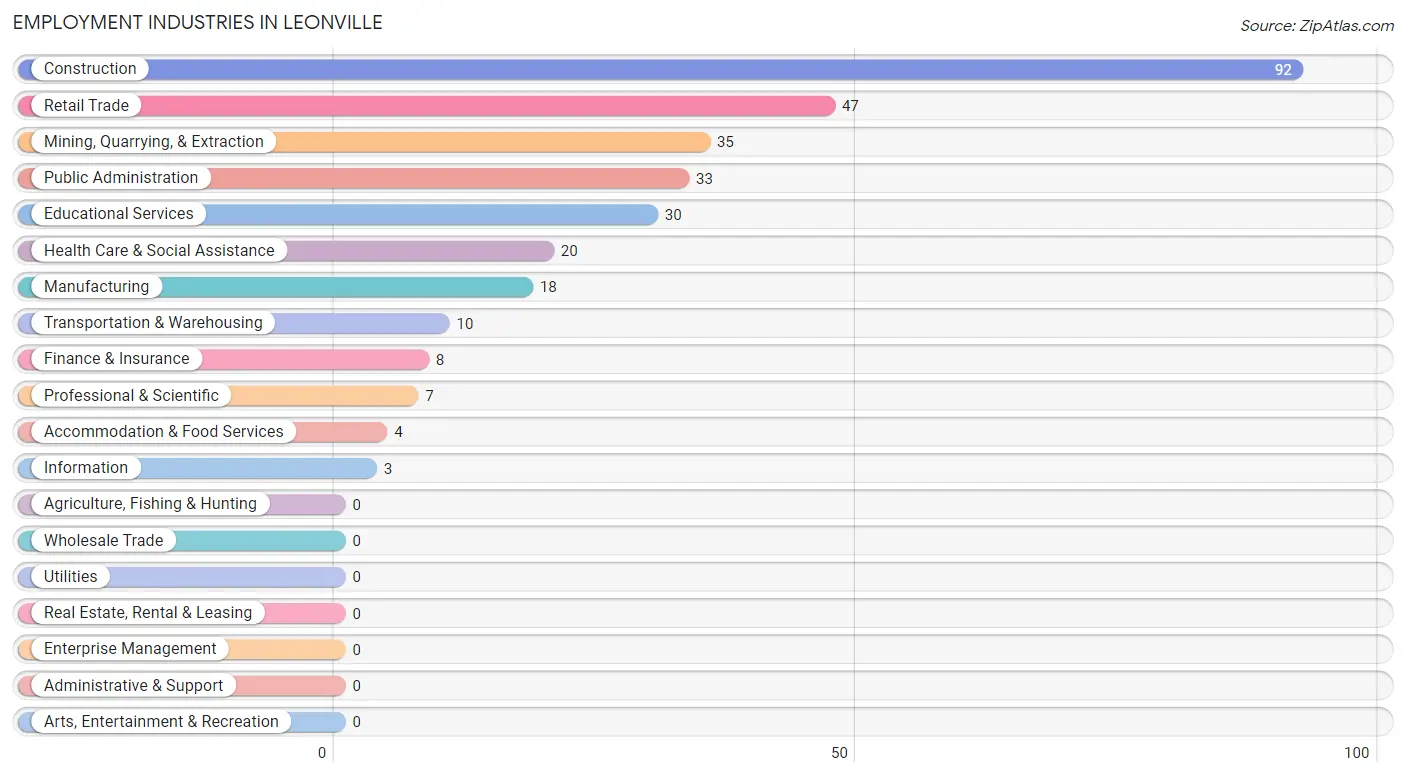
Employment Industries in Leonville
The major employment industries in Leonville include Construction (92 | 26.5%), Retail Trade (47 | 13.5%), Mining, Quarrying, & Extraction (35 | 10.1%), Public Administration (33 | 9.5%), and Educational Services (30 | 8.6%).
Employment Industries by Sex in Leonville
The Leonville industries that see more men than women are Mining, Quarrying, & Extraction (100.0%), Construction (100.0%), and Transportation & Warehousing (100.0%), whereas the industries that tend to have a higher number of women are Finance & Insurance (100.0%), Accommodation & Food Services (100.0%), and Retail Trade (80.8%).
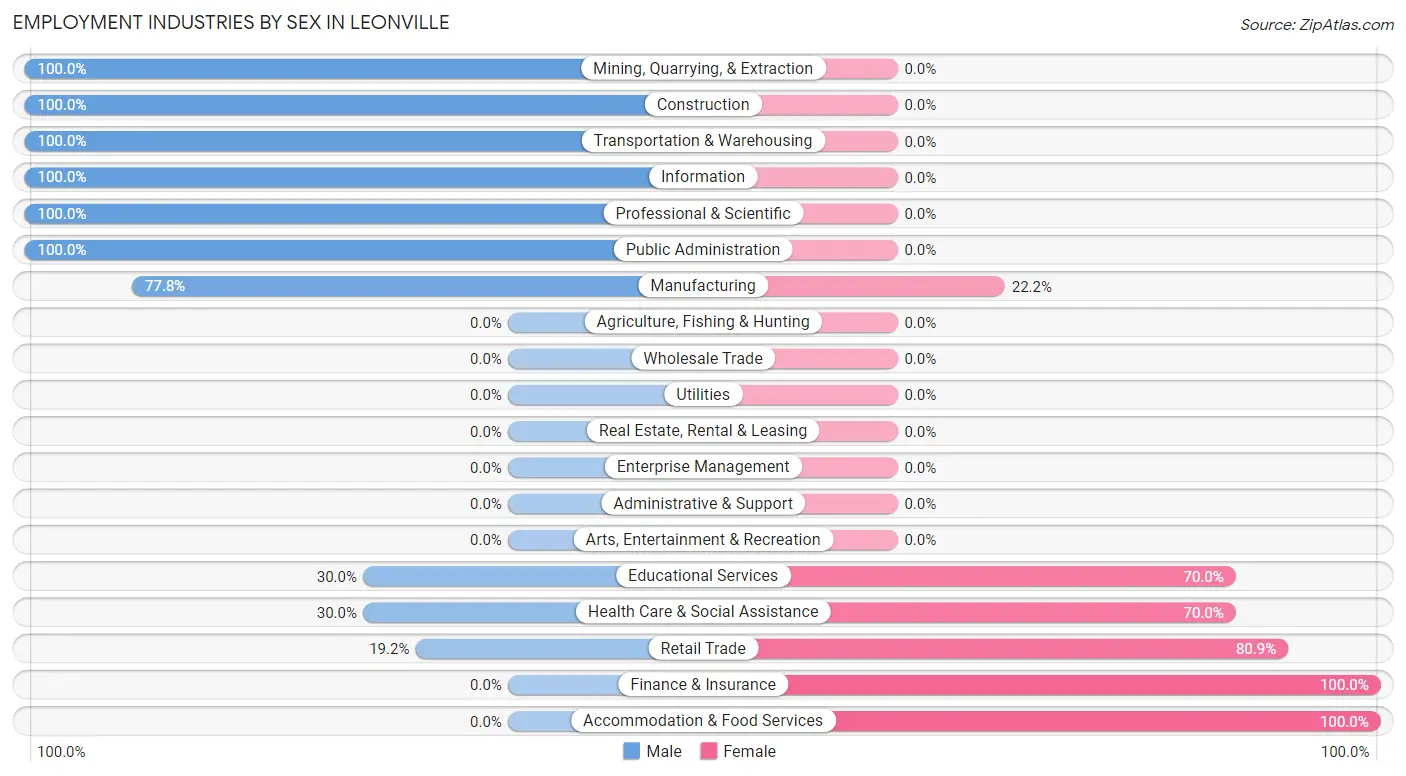
| Industry | Male | Female |
| Agriculture, Fishing & Hunting | 0 (0.0%) | 0 (0.0%) |
| Mining, Quarrying, & Extraction | 35 (100.0%) | 0 (0.0%) |
| Construction | 92 (100.0%) | 0 (0.0%) |
| Manufacturing | 14 (77.8%) | 4 (22.2%) |
| Wholesale Trade | 0 (0.0%) | 0 (0.0%) |
| Retail Trade | 9 (19.2%) | 38 (80.8%) |
| Transportation & Warehousing | 10 (100.0%) | 0 (0.0%) |
| Utilities | 0 (0.0%) | 0 (0.0%) |
| Information | 3 (100.0%) | 0 (0.0%) |
| Finance & Insurance | 0 (0.0%) | 8 (100.0%) |
| Real Estate, Rental & Leasing | 0 (0.0%) | 0 (0.0%) |
| Professional & Scientific | 7 (100.0%) | 0 (0.0%) |
| Enterprise Management | 0 (0.0%) | 0 (0.0%) |
| Administrative & Support | 0 (0.0%) | 0 (0.0%) |
| Educational Services | 9 (30.0%) | 21 (70.0%) |
| Health Care & Social Assistance | 6 (30.0%) | 14 (70.0%) |
| Arts, Entertainment & Recreation | 0 (0.0%) | 0 (0.0%) |
| Accommodation & Food Services | 0 (0.0%) | 4 (100.0%) |
| Public Administration | 33 (100.0%) | 0 (0.0%) |
| Total | 218 (62.8%) | 129 (37.2%) |
Education in Leonville
School Enrollment in Leonville
The most common levels of schooling among the 402 students in Leonville are elementary school (120 | 29.8%), kindergarten (116 | 28.9%), and middle school (95 | 23.6%).
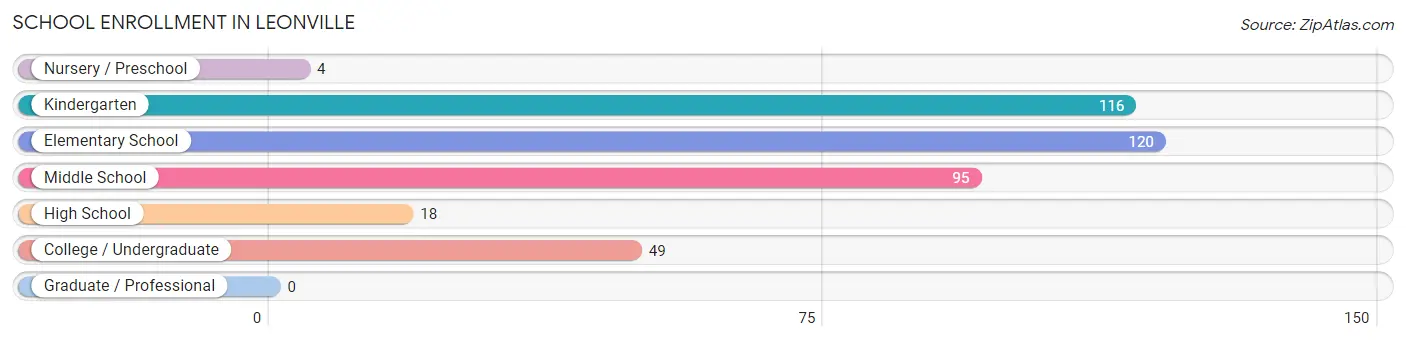
| School Level | # Students | % Students |
| Nursery / Preschool | 4 | 1.0% |
| Kindergarten | 116 | 28.9% |
| Elementary School | 120 | 29.8% |
| Middle School | 95 | 23.6% |
| High School | 18 | 4.5% |
| College / Undergraduate | 49 | 12.2% |
| Graduate / Professional | 0 | 0.0% |
| Total | 402 | 100.0% |
School Enrollment by Age by Funding Source in Leonville
Out of a total of 402 students who are enrolled in schools in Leonville, 91 (22.6%) attend a private institution, while the remaining 311 (77.4%) are enrolled in public schools. The age group of 5 to 9 year old has the highest likelihood of being enrolled in private schools, with 84 (34.0% in the age bracket) enrolled. Conversely, the age group of 10 to 14 year olds has the lowest likelihood of being enrolled in a private school, with 91 (100.0% in the age bracket) attending a public institution.
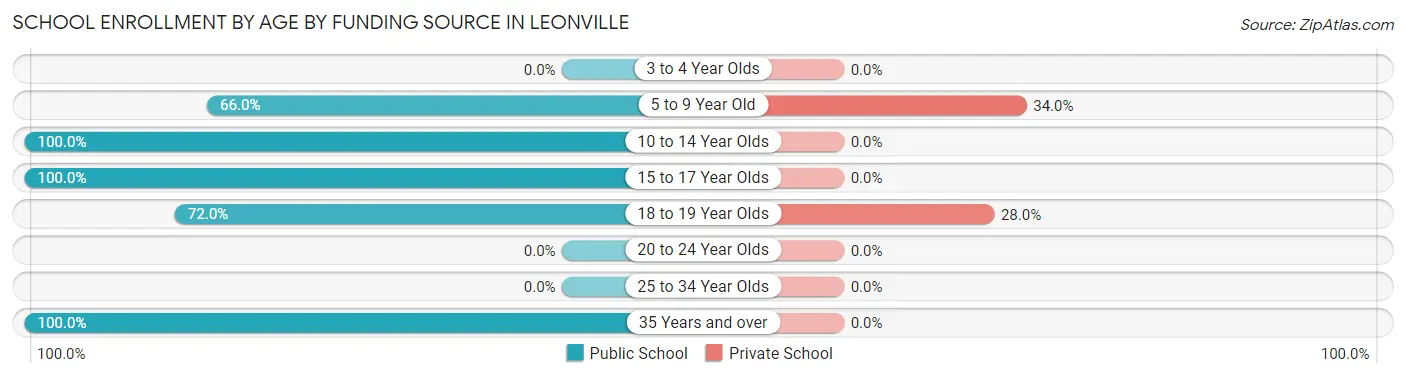
| Age Bracket | Public School | Private School |
| 3 to 4 Year Olds | 0 (0.0%) | 0 (0.0%) |
| 5 to 9 Year Old | 163 (66.0%) | 84 (34.0%) |
| 10 to 14 Year Olds | 91 (100.0%) | 0 (0.0%) |
| 15 to 17 Year Olds | 15 (100.0%) | 0 (0.0%) |
| 18 to 19 Year Olds | 18 (72.0%) | 7 (28.0%) |
| 20 to 24 Year Olds | 0 (0.0%) | 0 (0.0%) |
| 25 to 34 Year Olds | 0 (0.0%) | 0 (0.0%) |
| 35 Years and over | 24 (100.0%) | 0 (0.0%) |
| Total | 311 (77.4%) | 91 (22.6%) |
Educational Attainment by Field of Study in Leonville
Education (214 | 76.7%), engineering (33 | 11.8%), business (21 | 7.5%), liberal arts & history (8 | 2.9%), and multidisciplinary studies (2 | 0.7%) are the most common fields of study among 279 individuals in Leonville who have obtained a bachelor's degree or higher.
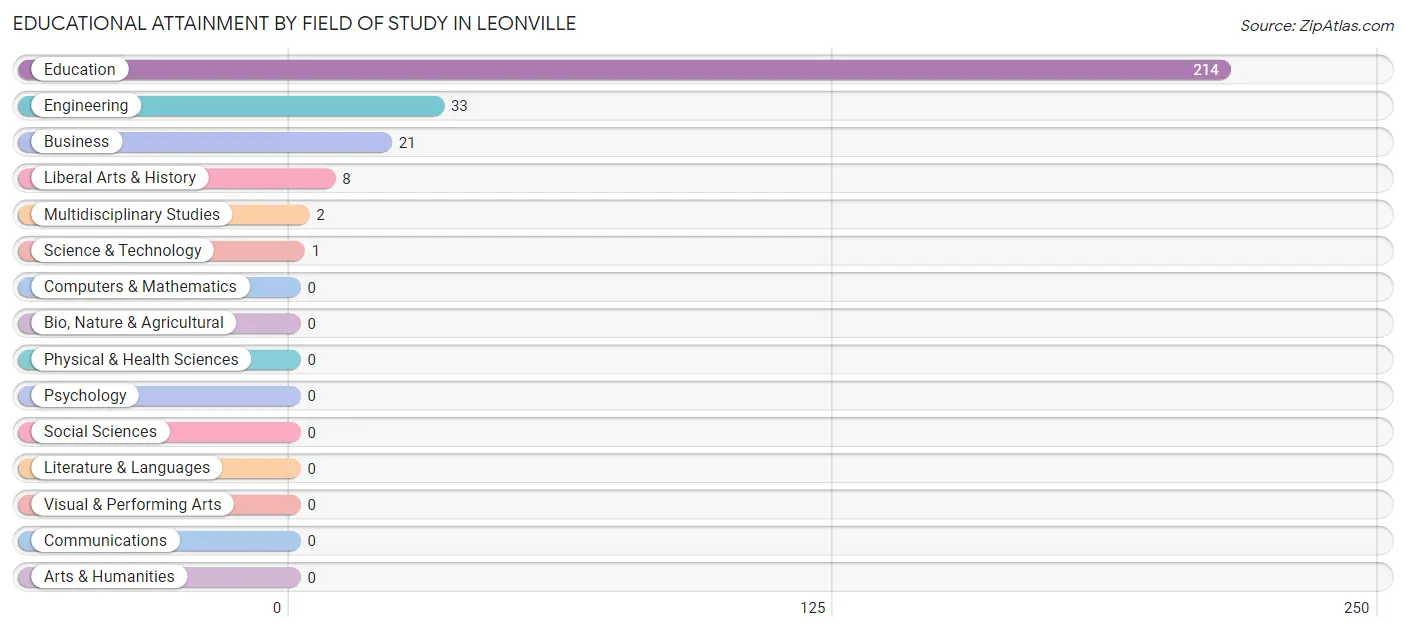
| Field of Study | # Graduates | % Graduates |
| Computers & Mathematics | 0 | 0.0% |
| Bio, Nature & Agricultural | 0 | 0.0% |
| Physical & Health Sciences | 0 | 0.0% |
| Psychology | 0 | 0.0% |
| Social Sciences | 0 | 0.0% |
| Engineering | 33 | 11.8% |
| Multidisciplinary Studies | 2 | 0.7% |
| Science & Technology | 1 | 0.4% |
| Business | 21 | 7.5% |
| Education | 214 | 76.7% |
| Literature & Languages | 0 | 0.0% |
| Liberal Arts & History | 8 | 2.9% |
| Visual & Performing Arts | 0 | 0.0% |
| Communications | 0 | 0.0% |
| Arts & Humanities | 0 | 0.0% |
| Total | 279 | 100.0% |
Transportation & Commute in Leonville
Vehicle Availability by Sex in Leonville
The most prevalent vehicle ownership categories in Leonville are males with 2 vehicles (125, accounting for 57.3%) and females with 2 vehicles (53, making up 112.6%).
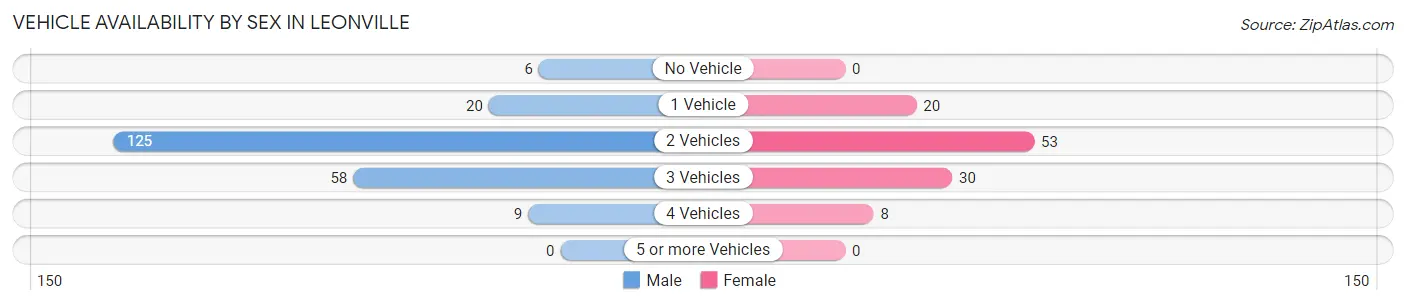
| Vehicles Available | Male | Female |
| No Vehicle | 6 (2.8%) | 0 (0.0%) |
| 1 Vehicle | 20 (9.2%) | 20 (18.0%) |
| 2 Vehicles | 125 (57.3%) | 53 (47.7%) |
| 3 Vehicles | 58 (26.6%) | 30 (27.0%) |
| 4 Vehicles | 9 (4.1%) | 8 (7.2%) |
| 5 or more Vehicles | 0 (0.0%) | 0 (0.0%) |
| Total | 218 (100.0%) | 111 (100.0%) |
Commute Time in Leonville
The most frequently occuring commute durations in Leonville are 30 to 34 minutes (90 commuters, 27.7%), 15 to 19 minutes (53 commuters, 16.3%), and 25 to 29 minutes (45 commuters, 13.9%).
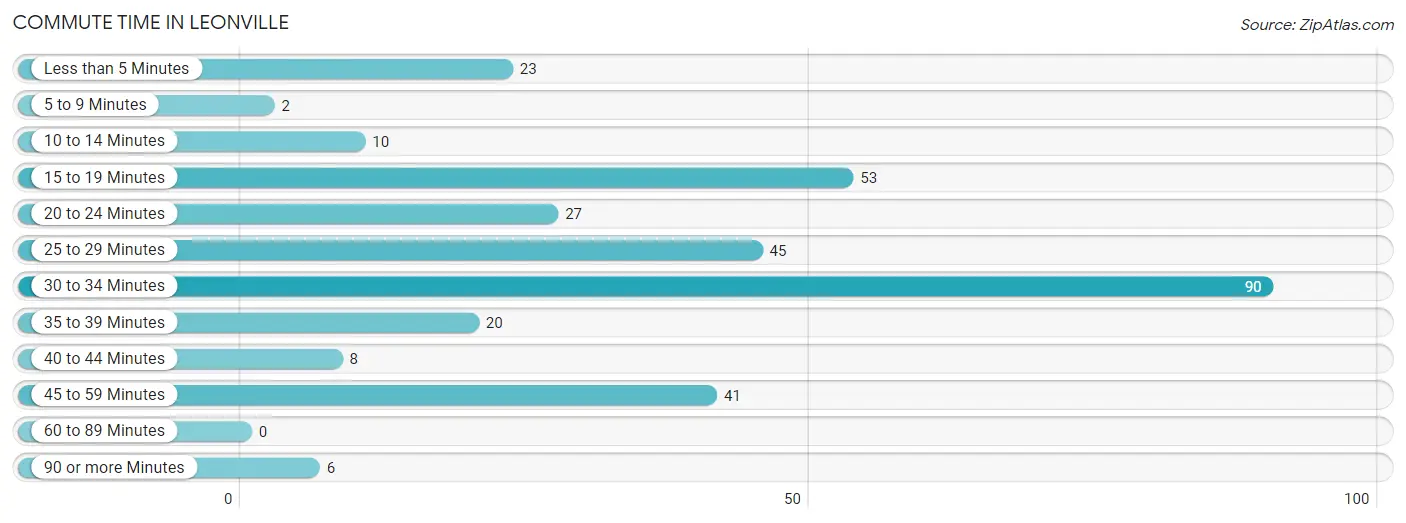
| Commute Time | # Commuters | % Commuters |
| Less than 5 Minutes | 23 | 7.1% |
| 5 to 9 Minutes | 2 | 0.6% |
| 10 to 14 Minutes | 10 | 3.1% |
| 15 to 19 Minutes | 53 | 16.3% |
| 20 to 24 Minutes | 27 | 8.3% |
| 25 to 29 Minutes | 45 | 13.9% |
| 30 to 34 Minutes | 90 | 27.7% |
| 35 to 39 Minutes | 20 | 6.1% |
| 40 to 44 Minutes | 8 | 2.5% |
| 45 to 59 Minutes | 41 | 12.6% |
| 60 to 89 Minutes | 0 | 0.0% |
| 90 or more Minutes | 6 | 1.8% |
Commute Time by Sex in Leonville
The most common commute times in Leonville are 30 to 34 minutes (90 commuters, 41.3%) for males and 15 to 19 minutes (30 commuters, 28.0%) for females.
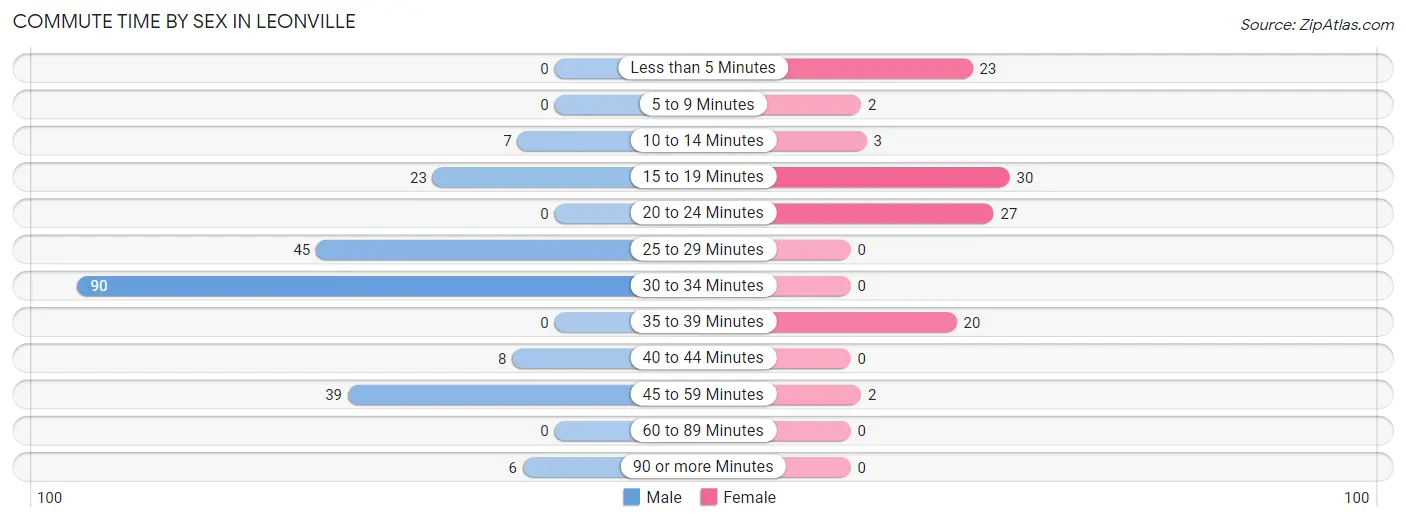
| Commute Time | Male | Female |
| Less than 5 Minutes | 0 (0.0%) | 23 (21.5%) |
| 5 to 9 Minutes | 0 (0.0%) | 2 (1.9%) |
| 10 to 14 Minutes | 7 (3.2%) | 3 (2.8%) |
| 15 to 19 Minutes | 23 (10.5%) | 30 (28.0%) |
| 20 to 24 Minutes | 0 (0.0%) | 27 (25.2%) |
| 25 to 29 Minutes | 45 (20.6%) | 0 (0.0%) |
| 30 to 34 Minutes | 90 (41.3%) | 0 (0.0%) |
| 35 to 39 Minutes | 0 (0.0%) | 20 (18.7%) |
| 40 to 44 Minutes | 8 (3.7%) | 0 (0.0%) |
| 45 to 59 Minutes | 39 (17.9%) | 2 (1.9%) |
| 60 to 89 Minutes | 0 (0.0%) | 0 (0.0%) |
| 90 or more Minutes | 6 (2.8%) | 0 (0.0%) |
Time of Departure to Work by Sex in Leonville
The most frequent times of departure to work in Leonville are 6:00 AM to 6:29 AM (105, 48.2%) for males and 7:00 AM to 7:29 AM (40, 37.4%) for females.
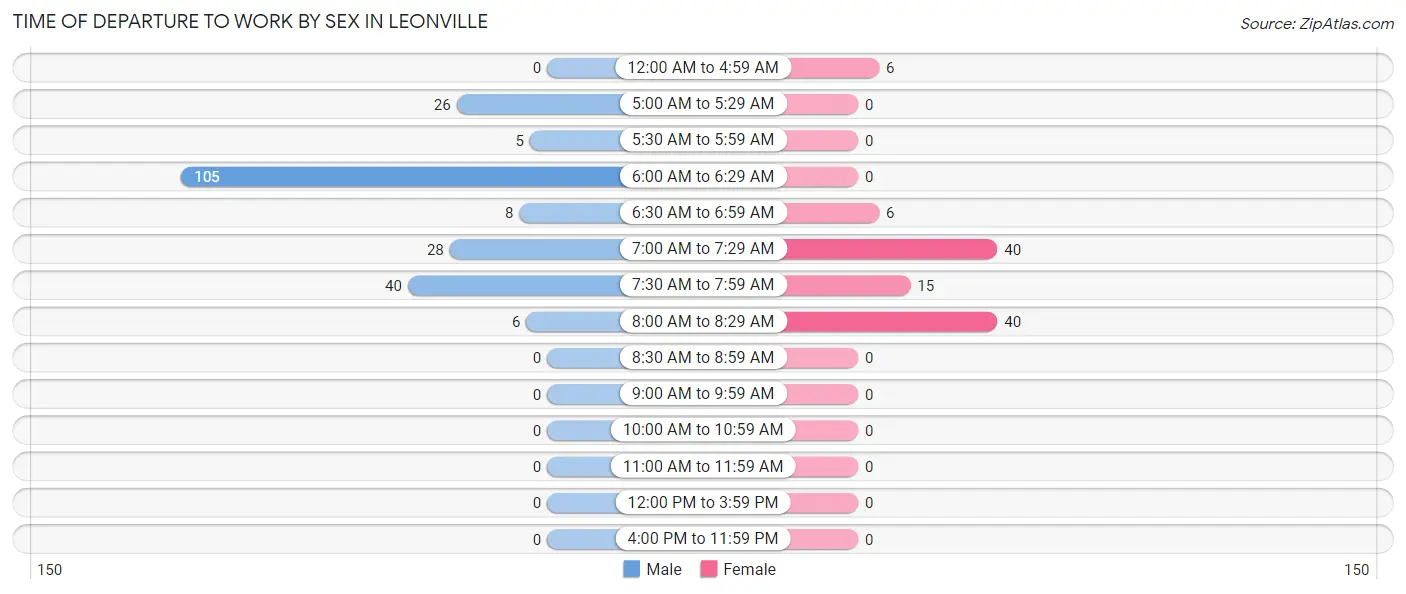
| Time of Departure | Male | Female |
| 12:00 AM to 4:59 AM | 0 (0.0%) | 6 (5.6%) |
| 5:00 AM to 5:29 AM | 26 (11.9%) | 0 (0.0%) |
| 5:30 AM to 5:59 AM | 5 (2.3%) | 0 (0.0%) |
| 6:00 AM to 6:29 AM | 105 (48.2%) | 0 (0.0%) |
| 6:30 AM to 6:59 AM | 8 (3.7%) | 6 (5.6%) |
| 7:00 AM to 7:29 AM | 28 (12.8%) | 40 (37.4%) |
| 7:30 AM to 7:59 AM | 40 (18.3%) | 15 (14.0%) |
| 8:00 AM to 8:29 AM | 6 (2.8%) | 40 (37.4%) |
| 8:30 AM to 8:59 AM | 0 (0.0%) | 0 (0.0%) |
| 9:00 AM to 9:59 AM | 0 (0.0%) | 0 (0.0%) |
| 10:00 AM to 10:59 AM | 0 (0.0%) | 0 (0.0%) |
| 11:00 AM to 11:59 AM | 0 (0.0%) | 0 (0.0%) |
| 12:00 PM to 3:59 PM | 0 (0.0%) | 0 (0.0%) |
| 4:00 PM to 11:59 PM | 0 (0.0%) | 0 (0.0%) |
| Total | 218 (100.0%) | 107 (100.0%) |
Housing Occupancy in Leonville
Occupancy by Ownership in Leonville
Of the total 566 dwellings in Leonville, owner-occupied units account for 538 (95.1%), while renter-occupied units make up 28 (5.0%).
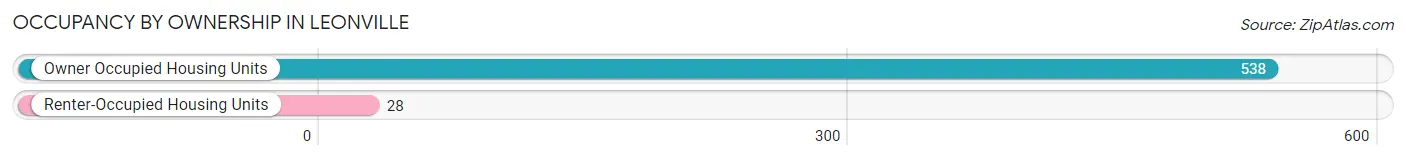
| Occupancy | # Housing Units | % Housing Units |
| Owner Occupied Housing Units | 538 | 95.1% |
| Renter-Occupied Housing Units | 28 | 5.0% |
| Total Occupied Housing Units | 566 | 100.0% |
Occupancy by Household Size in Leonville
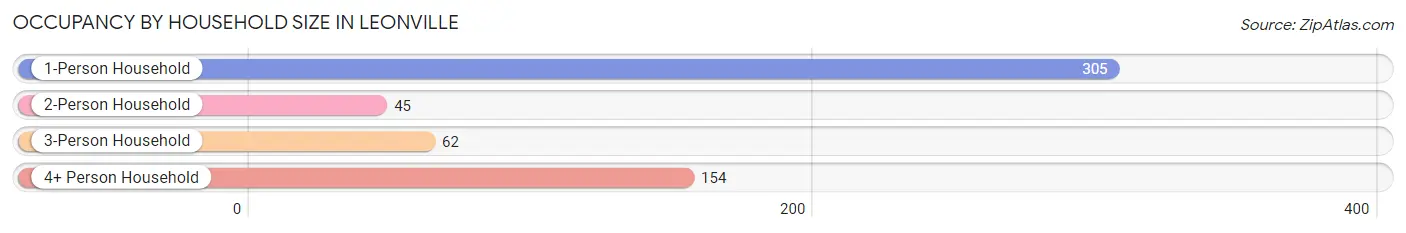
| Household Size | # Housing Units | % Housing Units |
| 1-Person Household | 305 | 53.9% |
| 2-Person Household | 45 | 8.0% |
| 3-Person Household | 62 | 11.0% |
| 4+ Person Household | 154 | 27.2% |
| Total Housing Units | 566 | 100.0% |
Occupancy by Ownership by Household Size in Leonville
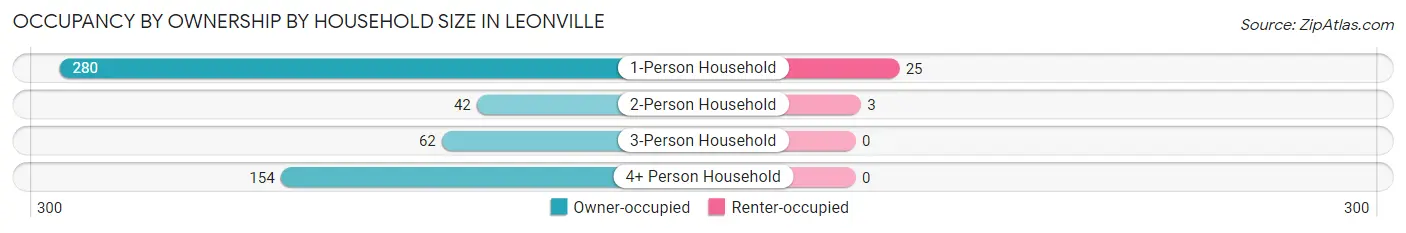
| Household Size | Owner-occupied | Renter-occupied |
| 1-Person Household | 280 (91.8%) | 25 (8.2%) |
| 2-Person Household | 42 (93.3%) | 3 (6.7%) |
| 3-Person Household | 62 (100.0%) | 0 (0.0%) |
| 4+ Person Household | 154 (100.0%) | 0 (0.0%) |
| Total Housing Units | 538 (95.1%) | 28 (5.0%) |
Occupancy by Educational Attainment in Leonville
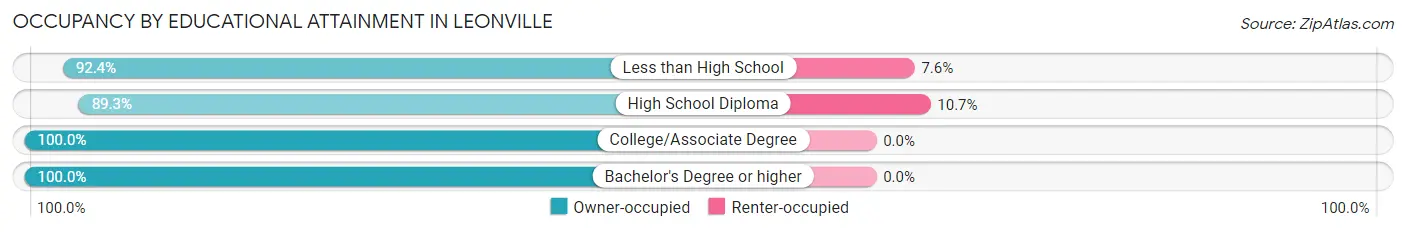
| Household Size | Owner-occupied | Renter-occupied |
| Less than High School | 146 (92.4%) | 12 (7.6%) |
| High School Diploma | 133 (89.3%) | 16 (10.7%) |
| College/Associate Degree | 23 (100.0%) | 0 (0.0%) |
| Bachelor's Degree or higher | 236 (100.0%) | 0 (0.0%) |
Occupancy by Age of Householder in Leonville
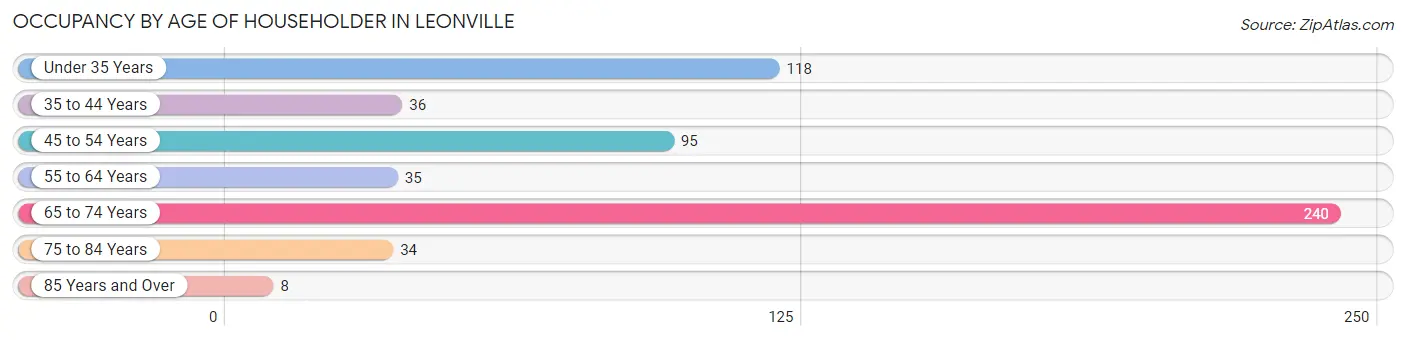
| Age Bracket | # Households | % Households |
| Under 35 Years | 118 | 20.8% |
| 35 to 44 Years | 36 | 6.4% |
| 45 to 54 Years | 95 | 16.8% |
| 55 to 64 Years | 35 | 6.2% |
| 65 to 74 Years | 240 | 42.4% |
| 75 to 84 Years | 34 | 6.0% |
| 85 Years and Over | 8 | 1.4% |
| Total | 566 | 100.0% |
Housing Finances in Leonville
Median Income by Occupancy in Leonville
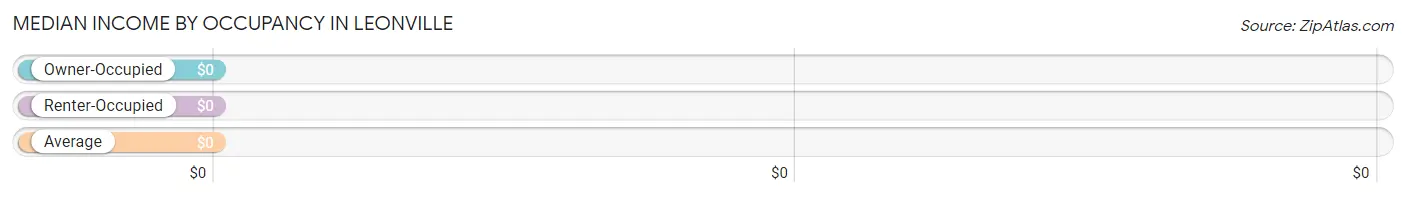
| Occupancy Type | # Households | Median Income |
| Owner-Occupied | 538 (95.1%) | $0 |
| Renter-Occupied | 28 (5.0%) | $0 |
| Average | 566 (100.0%) | $0 |
Occupancy by Householder Income Bracket in Leonville
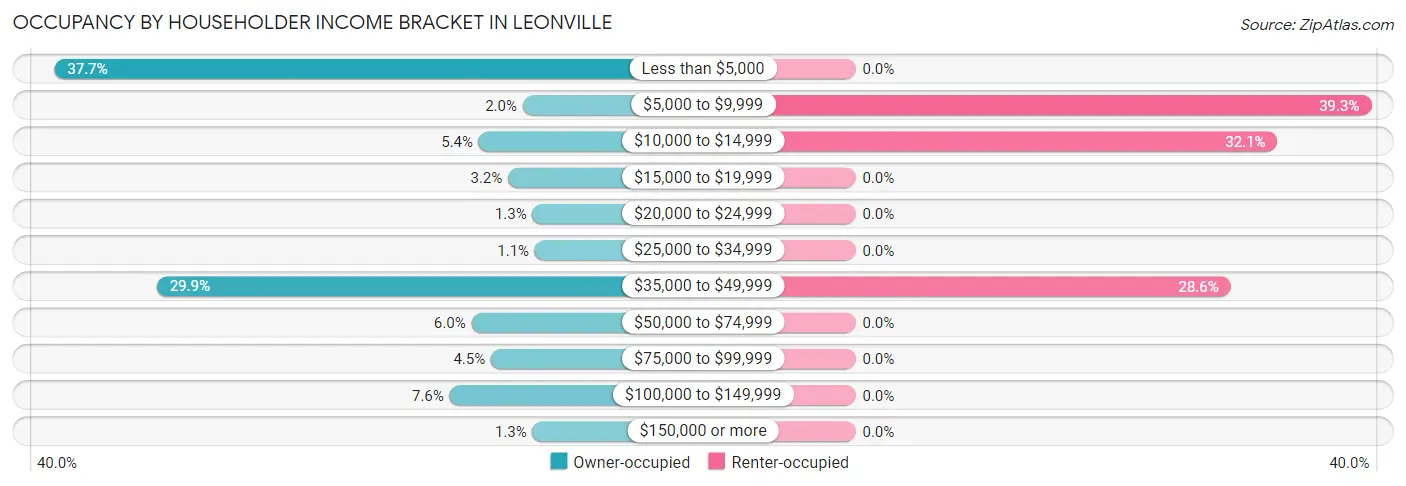
| Income Bracket | Owner-occupied | Renter-occupied |
| Less than $5,000 | 203 (37.7%) | 0 (0.0%) |
| $5,000 to $9,999 | 11 (2.0%) | 11 (39.3%) |
| $10,000 to $14,999 | 29 (5.4%) | 9 (32.1%) |
| $15,000 to $19,999 | 17 (3.2%) | 0 (0.0%) |
| $20,000 to $24,999 | 7 (1.3%) | 0 (0.0%) |
| $25,000 to $34,999 | 6 (1.1%) | 0 (0.0%) |
| $35,000 to $49,999 | 161 (29.9%) | 8 (28.6%) |
| $50,000 to $74,999 | 32 (5.9%) | 0 (0.0%) |
| $75,000 to $99,999 | 24 (4.5%) | 0 (0.0%) |
| $100,000 to $149,999 | 41 (7.6%) | 0 (0.0%) |
| $150,000 or more | 7 (1.3%) | 0 (0.0%) |
| Total | 538 (100.0%) | 28 (100.0%) |
Monthly Housing Cost Tiers in Leonville
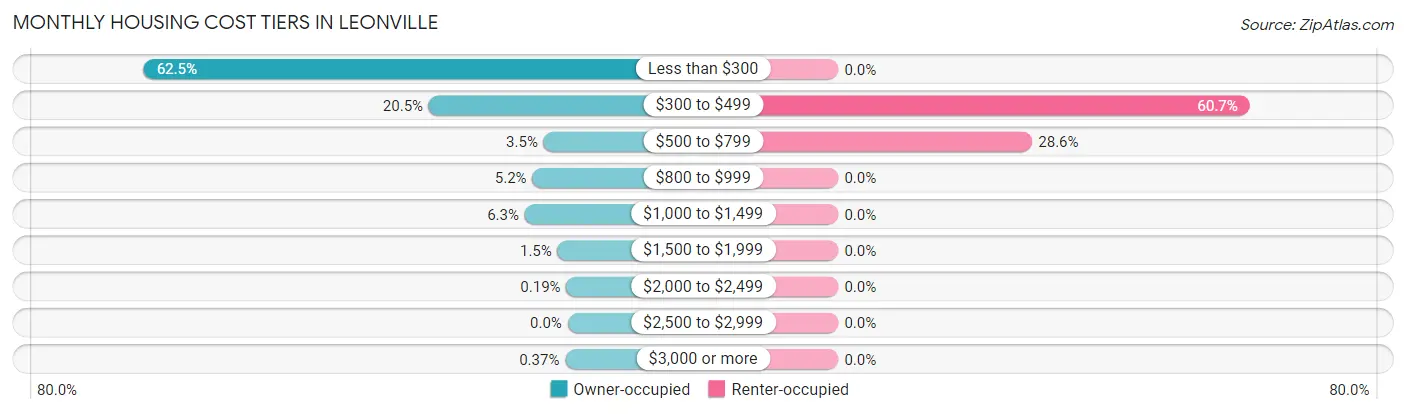
| Monthly Cost | Owner-occupied | Renter-occupied |
| Less than $300 | 336 (62.5%) | 0 (0.0%) |
| $300 to $499 | 110 (20.4%) | 17 (60.7%) |
| $500 to $799 | 19 (3.5%) | 8 (28.6%) |
| $800 to $999 | 28 (5.2%) | 0 (0.0%) |
| $1,000 to $1,499 | 34 (6.3%) | 0 (0.0%) |
| $1,500 to $1,999 | 8 (1.5%) | 0 (0.0%) |
| $2,000 to $2,499 | 1 (0.2%) | 0 (0.0%) |
| $2,500 to $2,999 | 0 (0.0%) | 0 (0.0%) |
| $3,000 or more | 2 (0.4%) | 0 (0.0%) |
| Total | 538 (100.0%) | 28 (100.0%) |
Physical Housing Characteristics in Leonville
Housing Structures in Leonville
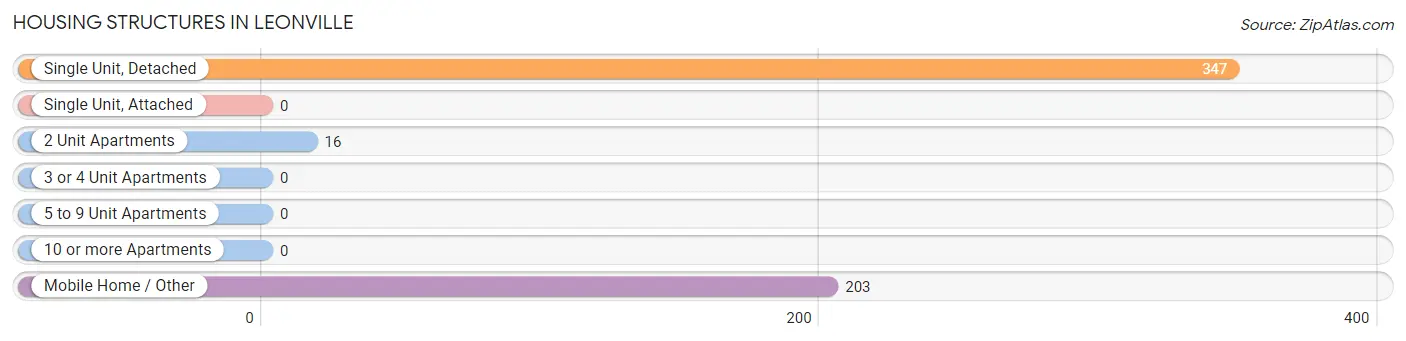
| Structure Type | # Housing Units | % Housing Units |
| Single Unit, Detached | 347 | 61.3% |
| Single Unit, Attached | 0 | 0.0% |
| 2 Unit Apartments | 16 | 2.8% |
| 3 or 4 Unit Apartments | 0 | 0.0% |
| 5 to 9 Unit Apartments | 0 | 0.0% |
| 10 or more Apartments | 0 | 0.0% |
| Mobile Home / Other | 203 | 35.9% |
| Total | 566 | 100.0% |
Housing Structures by Occupancy in Leonville
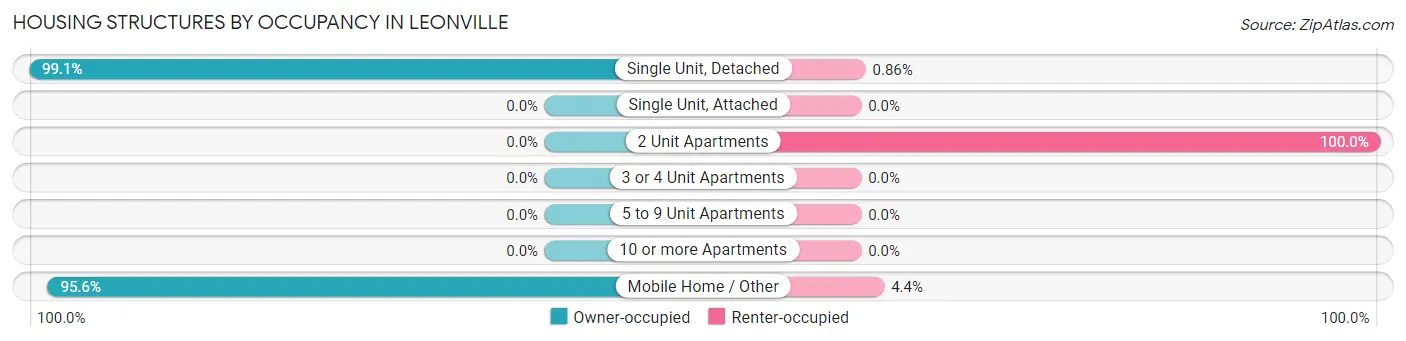
| Structure Type | Owner-occupied | Renter-occupied |
| Single Unit, Detached | 344 (99.1%) | 3 (0.9%) |
| Single Unit, Attached | 0 (0.0%) | 0 (0.0%) |
| 2 Unit Apartments | 0 (0.0%) | 16 (100.0%) |
| 3 or 4 Unit Apartments | 0 (0.0%) | 0 (0.0%) |
| 5 to 9 Unit Apartments | 0 (0.0%) | 0 (0.0%) |
| 10 or more Apartments | 0 (0.0%) | 0 (0.0%) |
| Mobile Home / Other | 194 (95.6%) | 9 (4.4%) |
| Total | 538 (95.1%) | 28 (5.0%) |
Housing Structures by Number of Rooms in Leonville
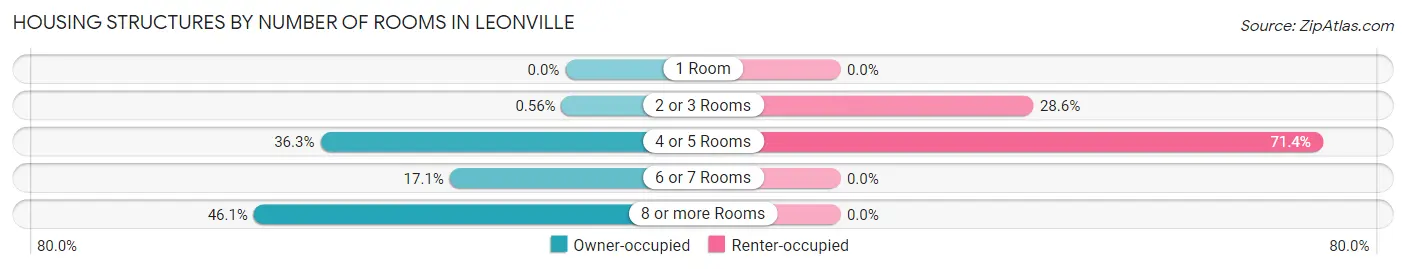
| Number of Rooms | Owner-occupied | Renter-occupied |
| 1 Room | 0 (0.0%) | 0 (0.0%) |
| 2 or 3 Rooms | 3 (0.6%) | 8 (28.6%) |
| 4 or 5 Rooms | 195 (36.2%) | 20 (71.4%) |
| 6 or 7 Rooms | 92 (17.1%) | 0 (0.0%) |
| 8 or more Rooms | 248 (46.1%) | 0 (0.0%) |
| Total | 538 (100.0%) | 28 (100.0%) |
Housing Structure by Heating Type in Leonville
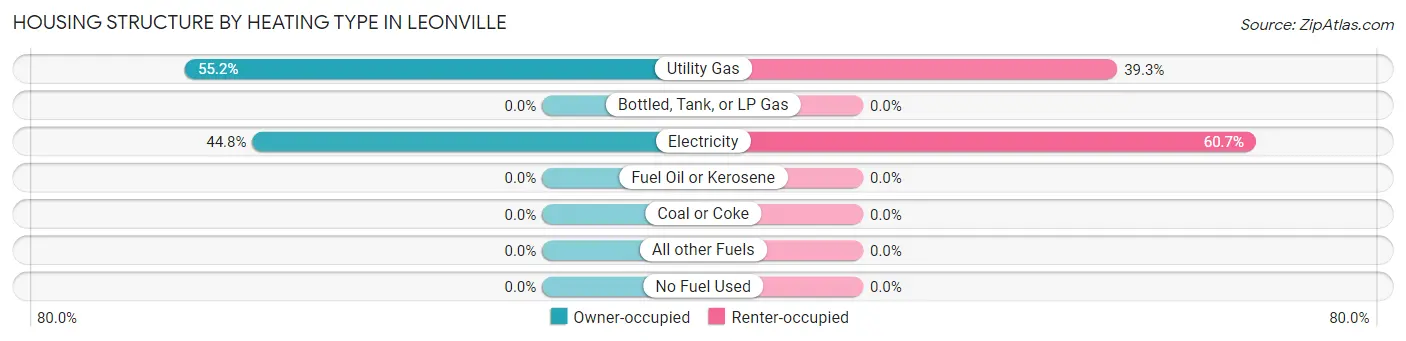
| Heating Type | Owner-occupied | Renter-occupied |
| Utility Gas | 297 (55.2%) | 11 (39.3%) |
| Bottled, Tank, or LP Gas | 0 (0.0%) | 0 (0.0%) |
| Electricity | 241 (44.8%) | 17 (60.7%) |
| Fuel Oil or Kerosene | 0 (0.0%) | 0 (0.0%) |
| Coal or Coke | 0 (0.0%) | 0 (0.0%) |
| All other Fuels | 0 (0.0%) | 0 (0.0%) |
| No Fuel Used | 0 (0.0%) | 0 (0.0%) |
| Total | 538 (100.0%) | 28 (100.0%) |
Household Vehicle Usage in Leonville
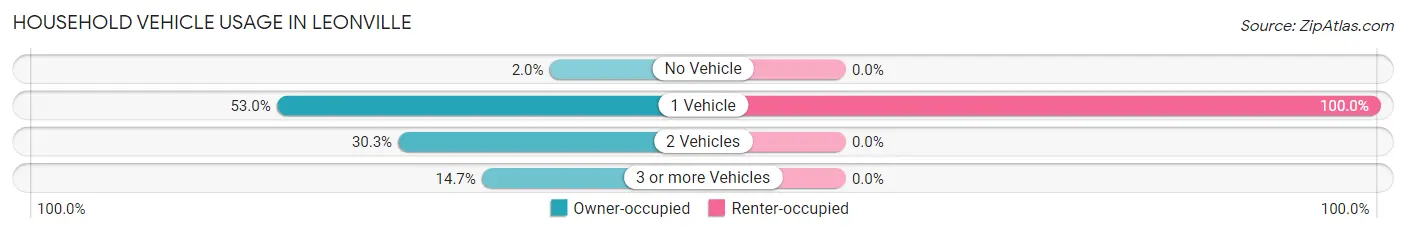
| Vehicles per Household | Owner-occupied | Renter-occupied |
| No Vehicle | 11 (2.0%) | 0 (0.0%) |
| 1 Vehicle | 285 (53.0%) | 28 (100.0%) |
| 2 Vehicles | 163 (30.3%) | 0 (0.0%) |
| 3 or more Vehicles | 79 (14.7%) | 0 (0.0%) |
| Total | 538 (100.0%) | 28 (100.0%) |
Real Estate & Mortgages in Leonville
Real Estate and Mortgage Overview in Leonville
| Characteristic | Without Mortgage | With Mortgage |
| Housing Units | 448 | 90 |
| Median Property Value | $175,300 | $122,900 |
| Median Household Income | - | - |
| Monthly Housing Costs | $194 | $2 |
| Real Estate Taxes | $199 | $52 |
Property Value by Mortgage Status in Leonville
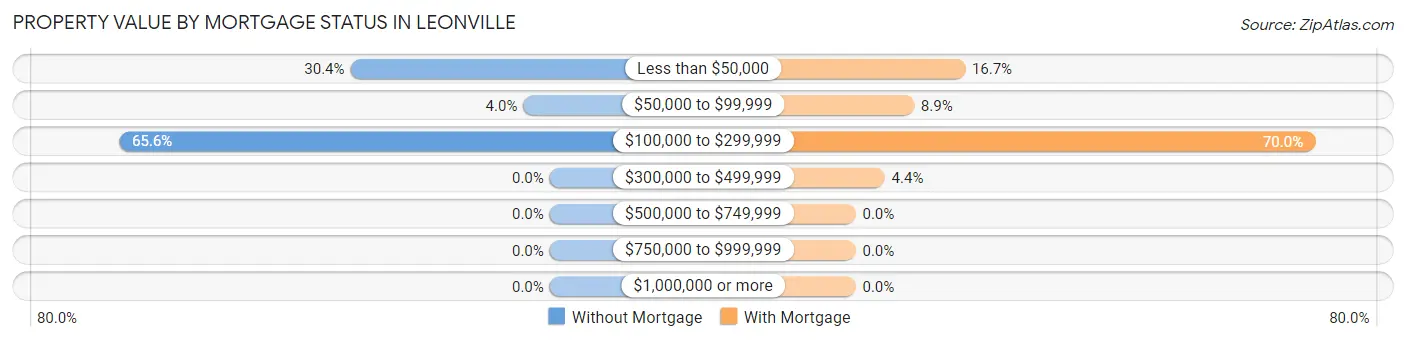
| Property Value | Without Mortgage | With Mortgage |
| Less than $50,000 | 136 (30.4%) | 15 (16.7%) |
| $50,000 to $99,999 | 18 (4.0%) | 8 (8.9%) |
| $100,000 to $299,999 | 294 (65.6%) | 63 (70.0%) |
| $300,000 to $499,999 | 0 (0.0%) | 4 (4.4%) |
| $500,000 to $749,999 | 0 (0.0%) | 0 (0.0%) |
| $750,000 to $999,999 | 0 (0.0%) | 0 (0.0%) |
| $1,000,000 or more | 0 (0.0%) | 0 (0.0%) |
| Total | 448 (100.0%) | 90 (100.0%) |
Household Income by Mortgage Status in Leonville
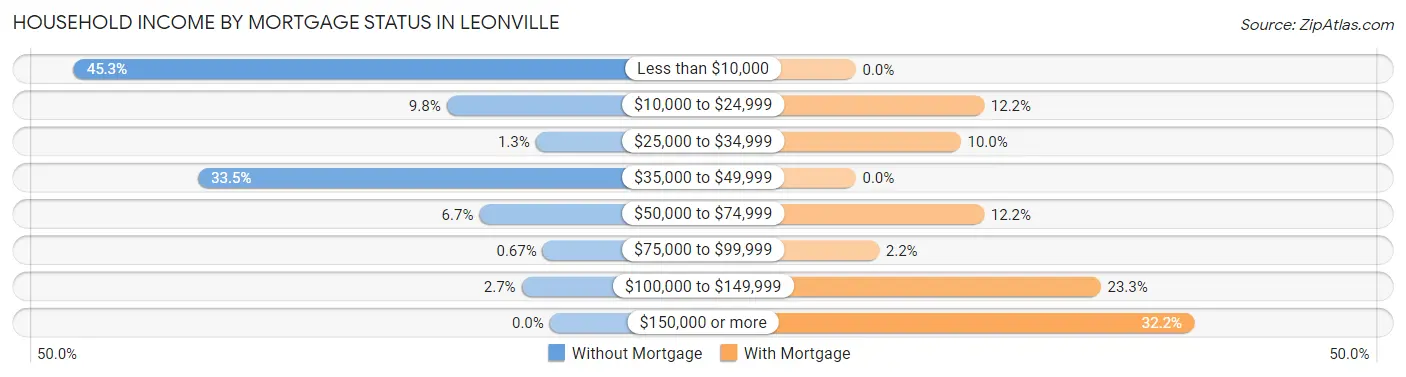
| Household Income | Without Mortgage | With Mortgage |
| Less than $10,000 | 203 (45.3%) | 0 (0.0%) |
| $10,000 to $24,999 | 44 (9.8%) | 11 (12.2%) |
| $25,000 to $34,999 | 6 (1.3%) | 9 (10.0%) |
| $35,000 to $49,999 | 150 (33.5%) | 0 (0.0%) |
| $50,000 to $74,999 | 30 (6.7%) | 11 (12.2%) |
| $75,000 to $99,999 | 3 (0.7%) | 2 (2.2%) |
| $100,000 to $149,999 | 12 (2.7%) | 21 (23.3%) |
| $150,000 or more | 0 (0.0%) | 29 (32.2%) |
| Total | 448 (100.0%) | 90 (100.0%) |
Property Value to Household Income Ratio in Leonville
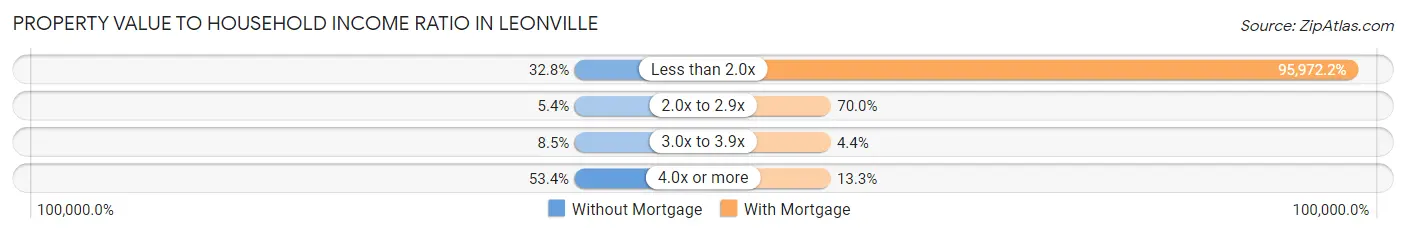
| Value-to-Income Ratio | Without Mortgage | With Mortgage |
| Less than 2.0x | 147 (32.8%) | 86,375 (95,972.2%) |
| 2.0x to 2.9x | 24 (5.4%) | 63 (70.0%) |
| 3.0x to 3.9x | 38 (8.5%) | 4 (4.4%) |
| 4.0x or more | 239 (53.3%) | 12 (13.3%) |
| Total | 448 (100.0%) | 90 (100.0%) |
Real Estate Taxes by Mortgage Status in Leonville
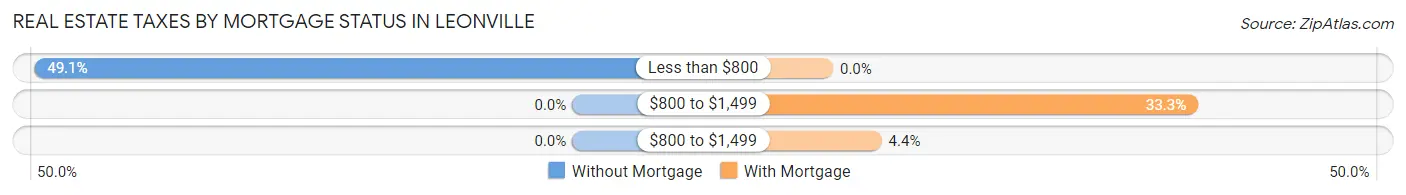
| Property Taxes | Without Mortgage | With Mortgage |
| Less than $800 | 220 (49.1%) | 0 (0.0%) |
| $800 to $1,499 | 0 (0.0%) | 30 (33.3%) |
| $800 to $1,499 | 0 (0.0%) | 4 (4.4%) |
| Total | 448 (100.0%) | 90 (100.0%) |
Health & Disability in Leonville
Health Insurance Coverage by Age in Leonville
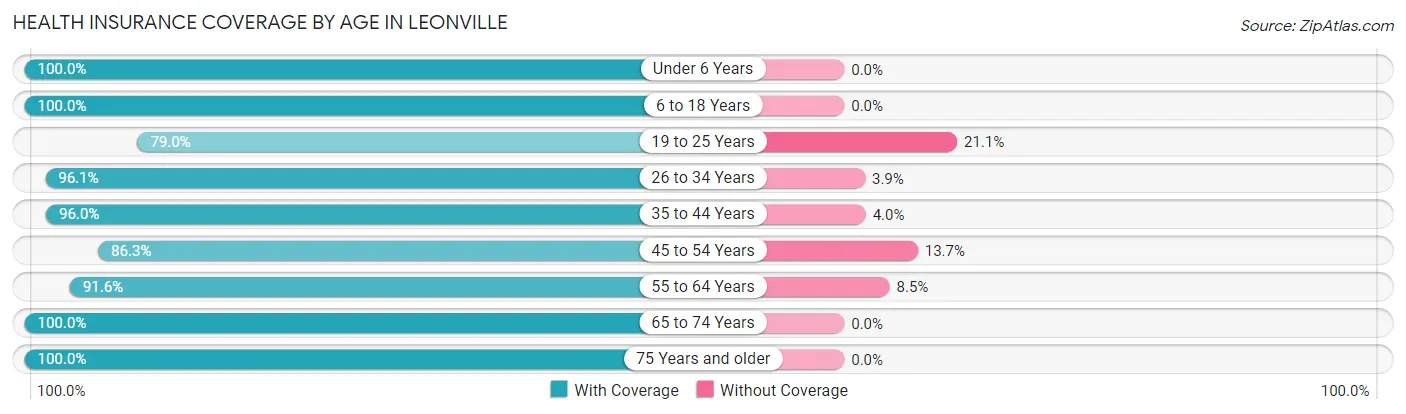
| Age Bracket | With Coverage | Without Coverage |
| Under 6 Years | 126 (100.0%) | 0 (0.0%) |
| 6 to 18 Years | 370 (100.0%) | 0 (0.0%) |
| 19 to 25 Years | 15 (78.9%) | 4 (21.0%) |
| 26 to 34 Years | 273 (96.1%) | 11 (3.9%) |
| 35 to 44 Years | 48 (96.0%) | 2 (4.0%) |
| 45 to 54 Years | 170 (86.3%) | 27 (13.7%) |
| 55 to 64 Years | 65 (91.5%) | 6 (8.5%) |
| 65 to 74 Years | 264 (100.0%) | 0 (0.0%) |
| 75 Years and older | 58 (100.0%) | 0 (0.0%) |
| Total | 1,389 (96.5%) | 50 (3.5%) |
Health Insurance Coverage by Citizenship Status in Leonville
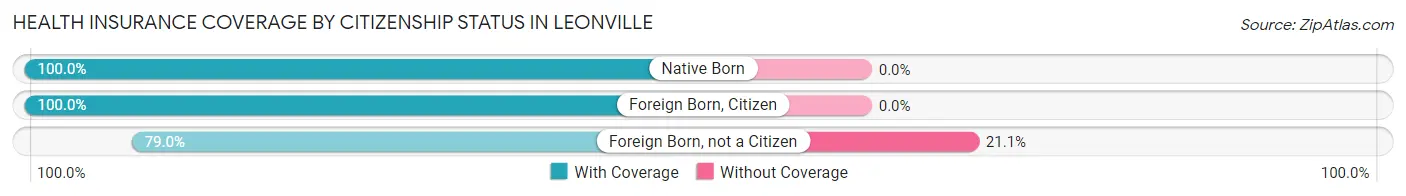
| Citizenship Status | With Coverage | Without Coverage |
| Native Born | 126 (100.0%) | 0 (0.0%) |
| Foreign Born, Citizen | 370 (100.0%) | 0 (0.0%) |
| Foreign Born, not a Citizen | 15 (78.9%) | 4 (21.0%) |
Health Insurance Coverage by Household Income in Leonville
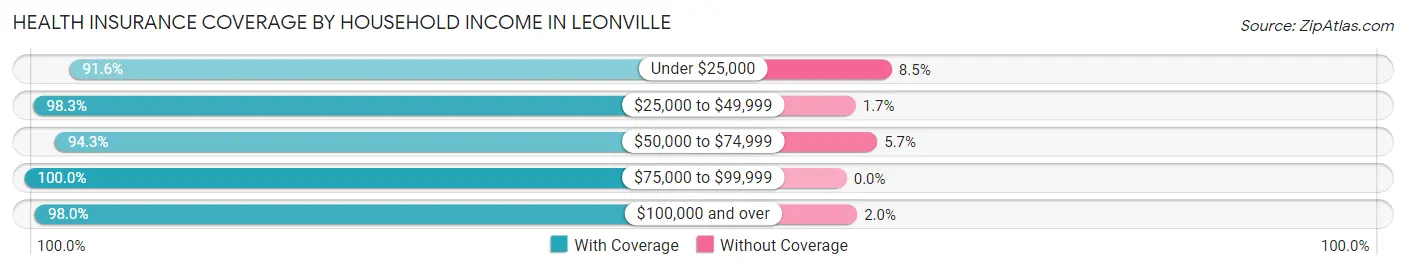
| Household Income | With Coverage | Without Coverage |
| Under $25,000 | 325 (91.5%) | 30 (8.5%) |
| $25,000 to $49,999 | 639 (98.3%) | 11 (1.7%) |
| $50,000 to $74,999 | 66 (94.3%) | 4 (5.7%) |
| $75,000 to $99,999 | 104 (100.0%) | 0 (0.0%) |
| $100,000 and over | 250 (98.0%) | 5 (2.0%) |
Public vs Private Health Insurance Coverage by Age in Leonville
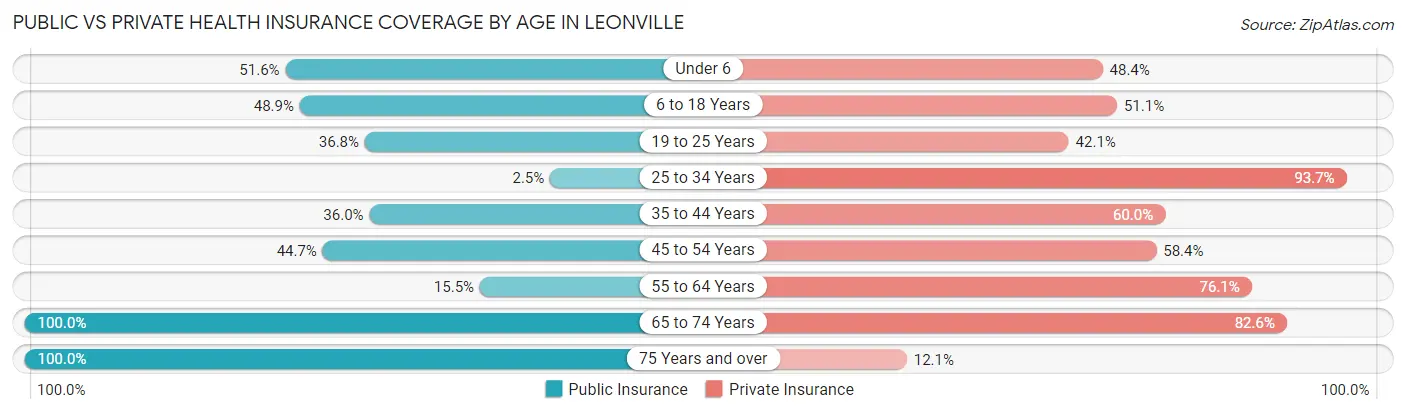
| Age Bracket | Public Insurance | Private Insurance |
| Under 6 | 65 (51.6%) | 61 (48.4%) |
| 6 to 18 Years | 181 (48.9%) | 189 (51.1%) |
| 19 to 25 Years | 7 (36.8%) | 8 (42.1%) |
| 25 to 34 Years | 7 (2.5%) | 266 (93.7%) |
| 35 to 44 Years | 18 (36.0%) | 30 (60.0%) |
| 45 to 54 Years | 88 (44.7%) | 115 (58.4%) |
| 55 to 64 Years | 11 (15.5%) | 54 (76.1%) |
| 65 to 74 Years | 264 (100.0%) | 218 (82.6%) |
| 75 Years and over | 58 (100.0%) | 7 (12.1%) |
| Total | 699 (48.6%) | 948 (65.9%) |
Disability Status by Sex by Age in Leonville
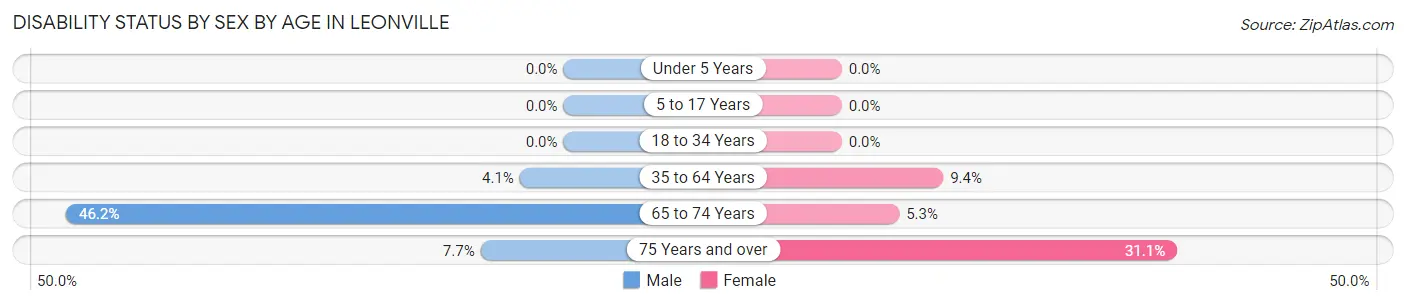
| Age Bracket | Male | Female |
| Under 5 Years | 0 (0.0%) | 0 (0.0%) |
| 5 to 17 Years | 0 (0.0%) | 0 (0.0%) |
| 18 to 34 Years | 0 (0.0%) | 0 (0.0%) |
| 35 to 64 Years | 6 (4.1%) | 16 (9.4%) |
| 65 to 74 Years | 18 (46.2%) | 12 (5.3%) |
| 75 Years and over | 1 (7.7%) | 14 (31.1%) |
Disability Class by Sex by Age in Leonville
Disability Class: Hearing Difficulty
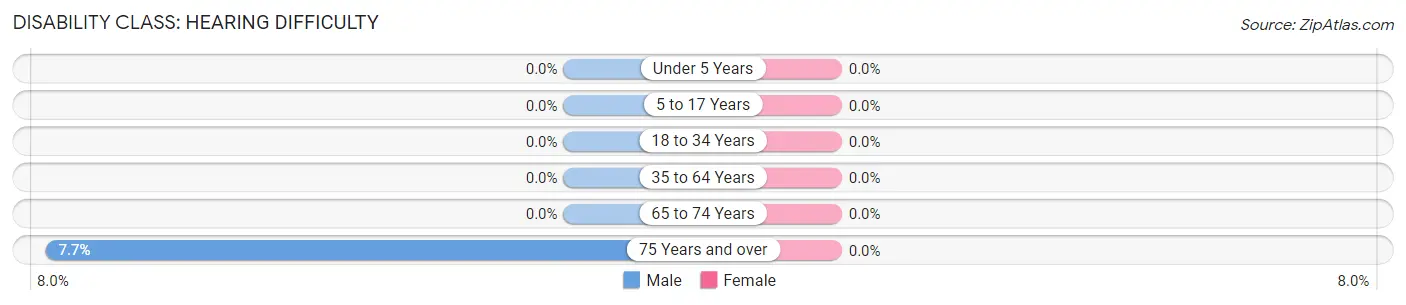
| Age Bracket | Male | Female |
| Under 5 Years | 0 (0.0%) | 0 (0.0%) |
| 5 to 17 Years | 0 (0.0%) | 0 (0.0%) |
| 18 to 34 Years | 0 (0.0%) | 0 (0.0%) |
| 35 to 64 Years | 0 (0.0%) | 0 (0.0%) |
| 65 to 74 Years | 0 (0.0%) | 0 (0.0%) |
| 75 Years and over | 1 (7.7%) | 0 (0.0%) |
Disability Class: Vision Difficulty
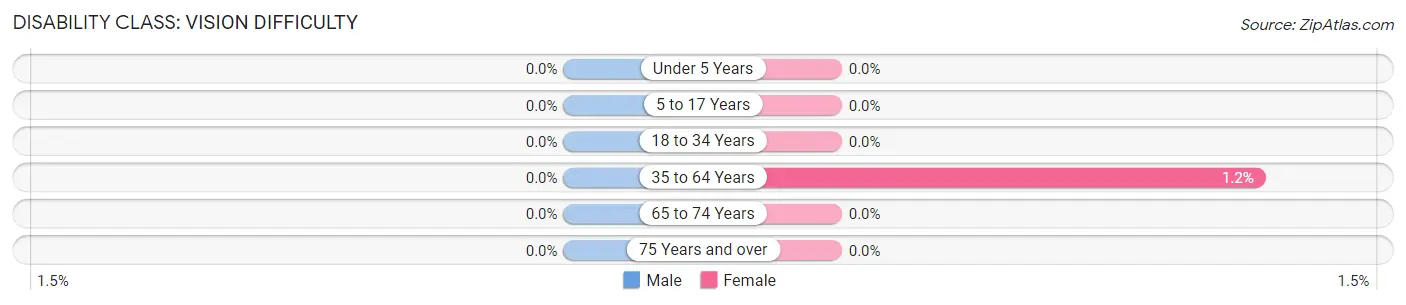
| Age Bracket | Male | Female |
| Under 5 Years | 0 (0.0%) | 0 (0.0%) |
| 5 to 17 Years | 0 (0.0%) | 0 (0.0%) |
| 18 to 34 Years | 0 (0.0%) | 0 (0.0%) |
| 35 to 64 Years | 0 (0.0%) | 2 (1.2%) |
| 65 to 74 Years | 0 (0.0%) | 0 (0.0%) |
| 75 Years and over | 0 (0.0%) | 0 (0.0%) |
Disability Class: Cognitive Difficulty
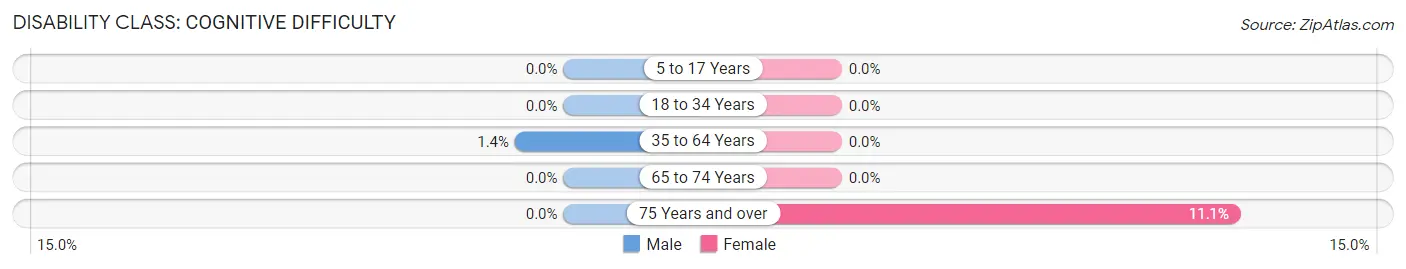
| Age Bracket | Male | Female |
| 5 to 17 Years | 0 (0.0%) | 0 (0.0%) |
| 18 to 34 Years | 0 (0.0%) | 0 (0.0%) |
| 35 to 64 Years | 2 (1.3%) | 0 (0.0%) |
| 65 to 74 Years | 0 (0.0%) | 0 (0.0%) |
| 75 Years and over | 0 (0.0%) | 5 (11.1%) |
Disability Class: Ambulatory Difficulty
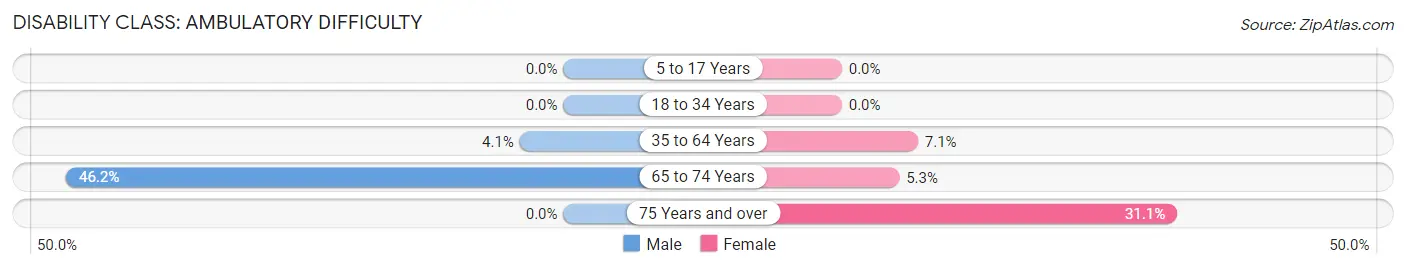
| Age Bracket | Male | Female |
| 5 to 17 Years | 0 (0.0%) | 0 (0.0%) |
| 18 to 34 Years | 0 (0.0%) | 0 (0.0%) |
| 35 to 64 Years | 6 (4.1%) | 12 (7.1%) |
| 65 to 74 Years | 18 (46.2%) | 12 (5.3%) |
| 75 Years and over | 0 (0.0%) | 14 (31.1%) |
Disability Class: Self-Care Difficulty
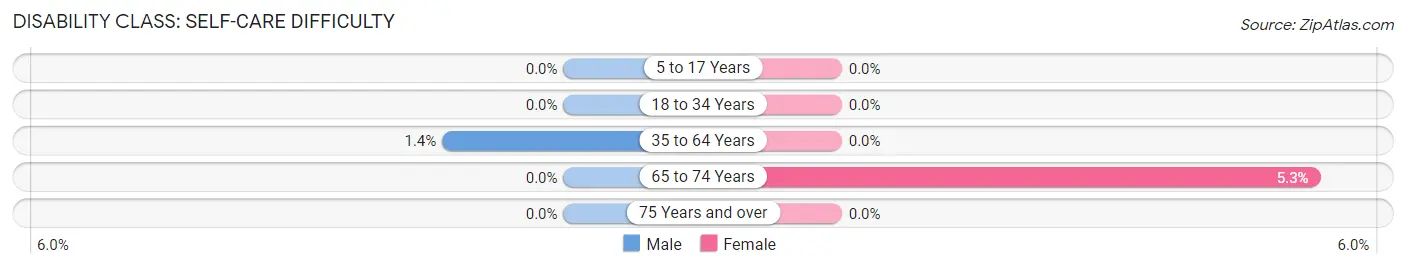
| Age Bracket | Male | Female |
| 5 to 17 Years | 0 (0.0%) | 0 (0.0%) |
| 18 to 34 Years | 0 (0.0%) | 0 (0.0%) |
| 35 to 64 Years | 2 (1.3%) | 0 (0.0%) |
| 65 to 74 Years | 0 (0.0%) | 12 (5.3%) |
| 75 Years and over | 0 (0.0%) | 0 (0.0%) |
Technology Access in Leonville
Computing Device Access in Leonville
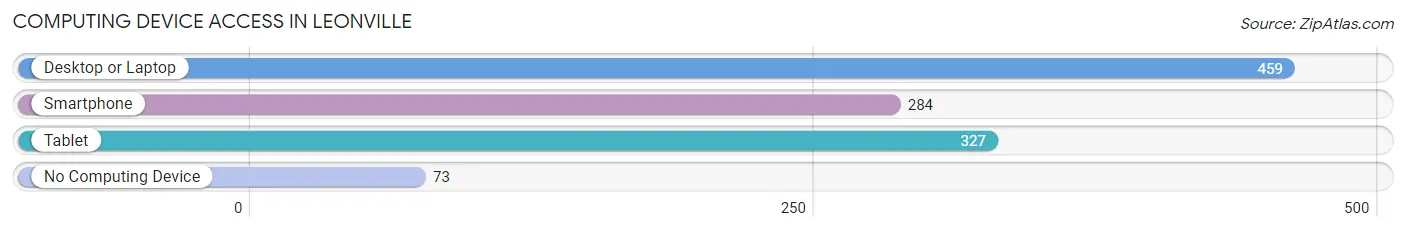
| Device Type | # Households | % Households |
| Desktop or Laptop | 459 | 81.1% |
| Smartphone | 284 | 50.2% |
| Tablet | 327 | 57.8% |
| No Computing Device | 73 | 12.9% |
| Total | 566 | 100.0% |
Internet Access in Leonville
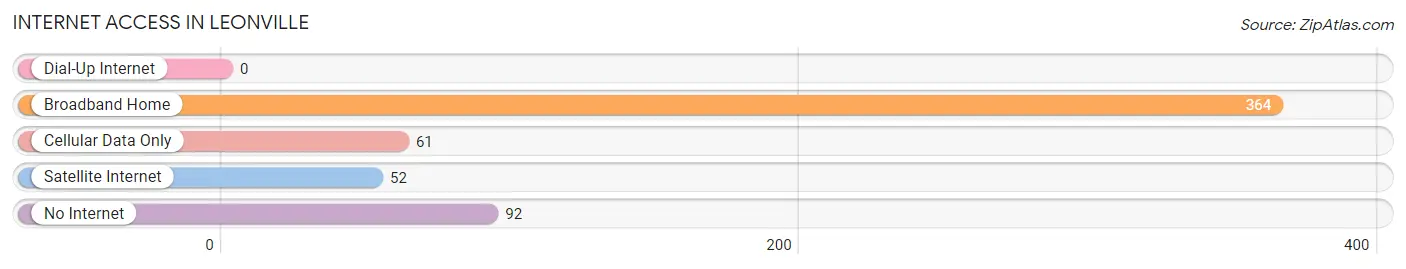
| Internet Type | # Households | % Households |
| Dial-Up Internet | 0 | 0.0% |
| Broadband Home | 364 | 64.3% |
| Cellular Data Only | 61 | 10.8% |
| Satellite Internet | 52 | 9.2% |
| No Internet | 92 | 16.3% |
| Total | 566 | 100.0% |
Leonville Summary
History
The small town of Leonville, Louisiana is located in St. Landry Parish, approximately 10 miles northwest of the city of Opelousas. The town was founded in 1883 by a group of French-speaking settlers from the nearby town of Grand Coteau. The settlers named the town after their leader, Leon Voorhies. The town was incorporated in 1884 and has remained a small, rural community ever since.
The town of Leonville has a rich history of French-speaking settlers and their descendants. The town was originally settled by French-speaking Acadians who had been expelled from Nova Scotia in the mid-1700s. These settlers were known as Cajuns and their descendants still make up a large portion of the population of Leonville today.
The town of Leonville has also been home to a number of notable figures throughout its history. One of the most famous is the late Governor of Louisiana, Edwin Edwards. Edwards was born in Leonville in 1927 and served as Governor from 1972 to 1980. He was known for his colorful personality and his ability to bring people together.
Geography
Leonville is located in St. Landry Parish, approximately 10 miles northwest of the city of Opelousas. The town is situated on the banks of Bayou Teche, a slow-moving river that runs through the area. The town is surrounded by a number of small towns and villages, including Grand Coteau, Arnaudville, and Port Barre.
The town of Leonville is located in the heart of Cajun Country, an area known for its unique culture and cuisine. The area is known for its lush wetlands, bayous, and swamps, as well as its abundance of wildlife. The town is also located near the Atchafalaya Basin, the largest wetland in the United States.
Economy
The economy of Leonville is largely based on agriculture and tourism. The town is home to a number of small farms and ranches, as well as a number of small businesses. The town is also home to a number of restaurants, bars, and other tourist attractions.
The town of Leonville is also home to a number of manufacturing and industrial businesses. The town is home to a number of small factories and warehouses, as well as a number of larger companies. The town is also home to a number of oil and gas companies, as well as a number of other energy-related businesses.
Demographics
As of the 2010 census, the population of Leonville was 1,845. The town is predominantly white, with a small African American population. The town is also home to a large number of French-speaking Cajuns, as well as a small number of other ethnicities.
The median household income in Leonville is $37,917, and the median home value is $90,000. The town has a poverty rate of 22.3%, and the unemployment rate is 6.2%. The town is served by a number of public schools, as well as a number of private schools.
Conclusion
The small town of Leonville, Louisiana is a unique and vibrant community with a rich history and culture. The town is home to a number of small businesses, farms, and ranches, as well as a number of manufacturing and industrial businesses. The town is also home to a large number of French-speaking Cajuns, as well as a small number of other ethnicities. The town has a median household income of $37,917 and a median home value of $90,000. The town is served by a number of public schools, as well as a number of private schools. Leonville is a great place to live and work, and it is a great example of the unique culture and history of Louisiana.
Common Questions
What is Per Capita Income in Leonville?
Per Capita income in Leonville is $14,710.
What is the Median Family Income in Leonville?
Median Family Income in Leonville is $41,466.
What is Family Income Deficit in Leonville?
Family Income Deficit in Leonville is $15,530.
Families that are below poverty line in Leonville earn $15,530 less on average than the poverty threshold level.
What is Inequality or Gini Index in Leonville?
Inequality or Gini Index in Leonville is 0.55.
What is the Total Population of Leonville?
Total Population of Leonville is 1,442.
What is the Total Male Population of Leonville?
Total Male Population of Leonville is 565.
What is the Total Female Population of Leonville?
Total Female Population of Leonville is 877.
What is the Ratio of Males per 100 Females in Leonville?
There are 64.42 Males per 100 Females in Leonville.
What is the Ratio of Females per 100 Males in Leonville?
There are 155.22 Females per 100 Males in Leonville.
What is the Median Population Age in Leonville?
Median Population Age in Leonville is 29.9 Years.
What is the Average Family Size in Leonville
Average Family Size in Leonville is 4.3 People.
What is the Average Household Size in Leonville
Average Household Size in Leonville is 2.5 People.
How Large is the Labor Force in Leonville?
There are 350 People in the Labor Forcein in Leonville.
What is the Percentage of People in the Labor Force in Leonville?
35.5% of People are in the Labor Force in Leonville.