Morse, LA Map & Demographics
Morse Map
Morse Overview
$22,043
PER CAPITA INCOME
$90,893
AVG FAMILY INCOME
$53,393
AVG HOUSEHOLD INCOME
65.7%
WAGE / INCOME GAP [ % ]
34.3¢/ $1
WAGE / INCOME GAP [ $ ]
0.37
INEQUALITY / GINI INDEX
1,111
TOTAL POPULATION
509
MALE POPULATION
602
FEMALE POPULATION
84.55
MALES / 100 FEMALES
118.27
FEMALES / 100 MALES
28.6
MEDIAN AGE
3.4
AVG FAMILY SIZE
3.1
AVG HOUSEHOLD SIZE
495
LABOR FORCE [ PEOPLE ]
63.3%
PERCENT IN LABOR FORCE
1.4%
UNEMPLOYMENT RATE
Morse Zip Codes
Morse Area Codes
Income in Morse
Income Overview in Morse
Per Capita Income in Morse is $22,043, while median incomes of families and households are $90,893 and $53,393 respectively.
| Characteristic | Number | Measure |
| Per Capita Income | 1,111 | $22,043 |
| Median Family Income | 297 | $90,893 |
| Mean Family Income | 297 | $70,739 |
| Median Household Income | 363 | $53,393 |
| Mean Household Income | 363 | $64,863 |
| Income Deficit | 297 | $0 |
| Wage / Income Gap (%) | 1,111 | 65.68% |
| Wage / Income Gap ($) | 1,111 | 34.32¢ per $1 |
| Gini / Inequality Index | 1,111 | 0.37 |
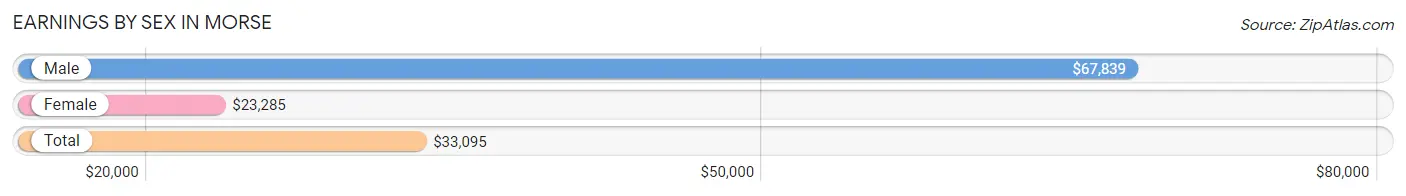
Earnings by Sex in Morse
Average Earnings in Morse are $33,095, $67,839 for men and $23,285 for women, a difference of 65.7%.
| Sex | Number | Average Earnings |
| Male | 249 (49.8%) | $67,839 |
| Female | 251 (50.2%) | $23,285 |
| Total | 500 (100.0%) | $33,095 |
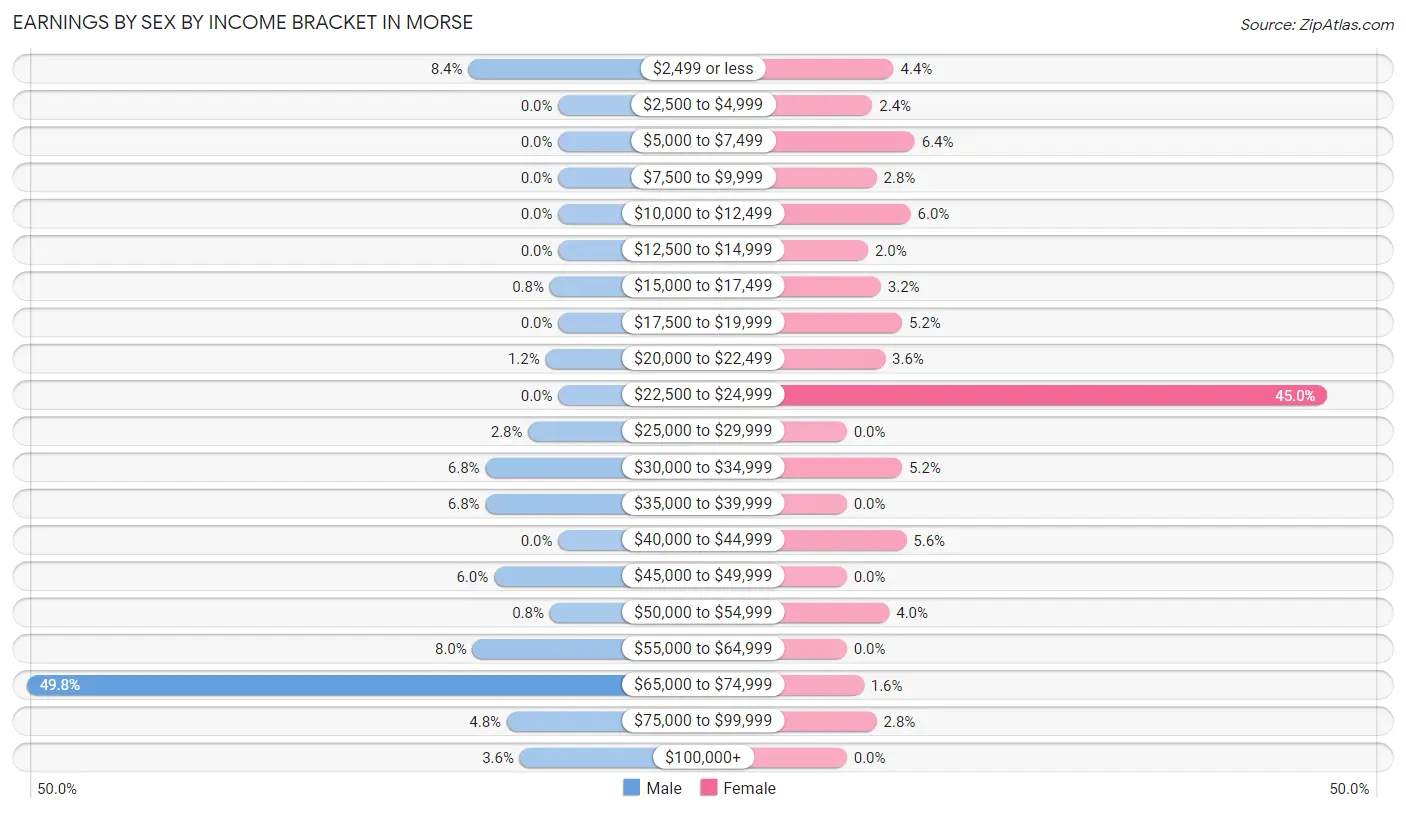
Earnings by Sex by Income Bracket in Morse
The most common earnings brackets in Morse are $65,000 to $74,999 for men (124 | 49.8%) and $22,500 to $24,999 for women (113 | 45.0%).
| Income | Male | Female |
| $2,499 or less | 21 (8.4%) | 11 (4.4%) |
| $2,500 to $4,999 | 0 (0.0%) | 6 (2.4%) |
| $5,000 to $7,499 | 0 (0.0%) | 16 (6.4%) |
| $7,500 to $9,999 | 0 (0.0%) | 7 (2.8%) |
| $10,000 to $12,499 | 0 (0.0%) | 15 (6.0%) |
| $12,500 to $14,999 | 0 (0.0%) | 5 (2.0%) |
| $15,000 to $17,499 | 2 (0.8%) | 8 (3.2%) |
| $17,500 to $19,999 | 0 (0.0%) | 13 (5.2%) |
| $20,000 to $22,499 | 3 (1.2%) | 9 (3.6%) |
| $22,500 to $24,999 | 0 (0.0%) | 113 (45.0%) |
| $25,000 to $29,999 | 7 (2.8%) | 0 (0.0%) |
| $30,000 to $34,999 | 17 (6.8%) | 13 (5.2%) |
| $35,000 to $39,999 | 17 (6.8%) | 0 (0.0%) |
| $40,000 to $44,999 | 0 (0.0%) | 14 (5.6%) |
| $45,000 to $49,999 | 15 (6.0%) | 0 (0.0%) |
| $50,000 to $54,999 | 2 (0.8%) | 10 (4.0%) |
| $55,000 to $64,999 | 20 (8.0%) | 0 (0.0%) |
| $65,000 to $74,999 | 124 (49.8%) | 4 (1.6%) |
| $75,000 to $99,999 | 12 (4.8%) | 7 (2.8%) |
| $100,000+ | 9 (3.6%) | 0 (0.0%) |
| Total | 249 (100.0%) | 251 (100.0%) |
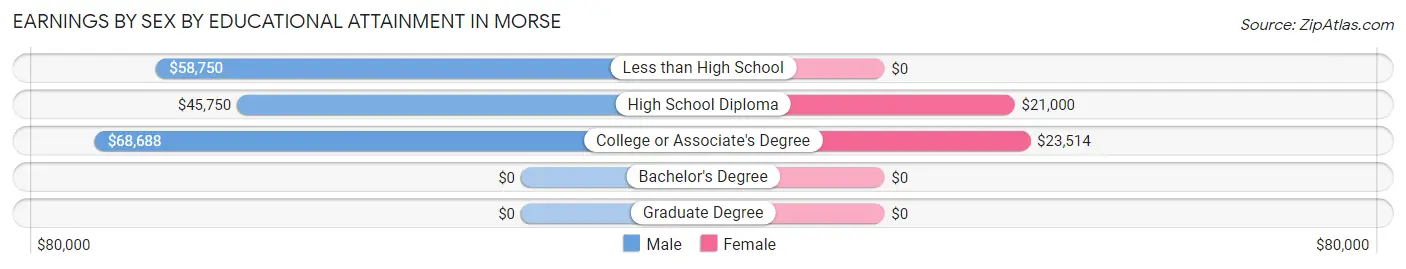
Earnings by Sex by Educational Attainment in Morse
Average earnings in Morse are $67,991 for men and $23,451 for women, a difference of 65.5%. Men with an educational attainment of college or associate's degree enjoy the highest average annual earnings of $68,688, while those with high school diploma education earn the least with $45,750. Women with an educational attainment of college or associate's degree earn the most with the average annual earnings of $23,514, while those with high school diploma education have the smallest earnings of $21,000.
| Educational Attainment | Male Income | Female Income |
| Less than High School | $58,750 | $0 |
| High School Diploma | $45,750 | $21,000 |
| College or Associate's Degree | $68,688 | $23,514 |
| Bachelor's Degree | - | - |
| Graduate Degree | - | - |
| Total | $67,991 | $23,451 |
Family Income in Morse
Family Income Brackets in Morse
According to the Morse family income data, there are 118 families falling into the $75,000 to $99,999 income range, which is the most common income bracket and makes up 39.7% of all families.
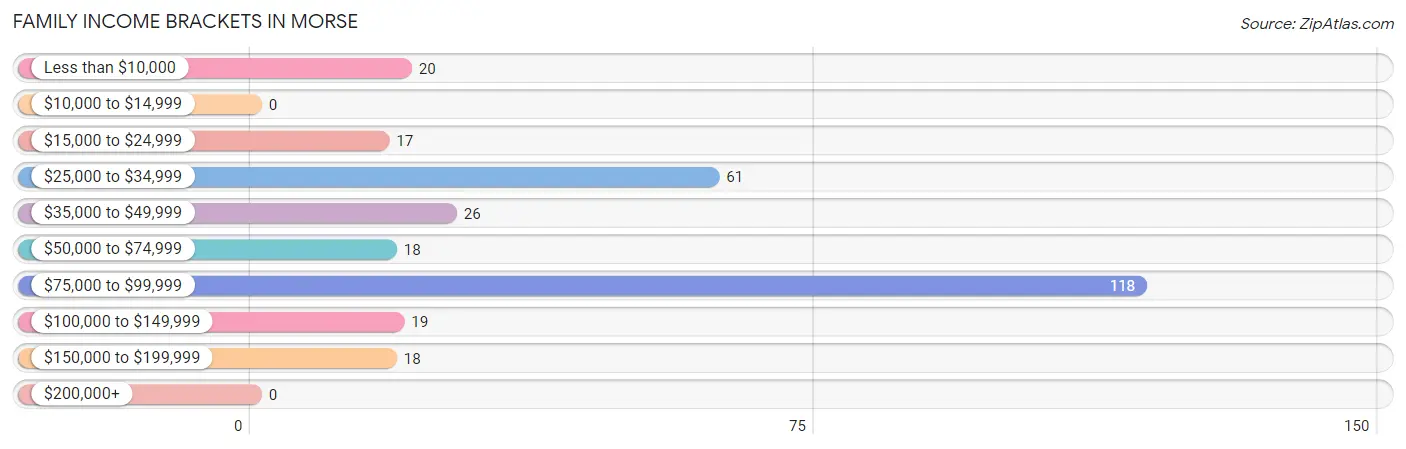
| Income Bracket | # Families | % Families |
| Less than $10,000 | 20 | 6.7% |
| $10,000 to $14,999 | 0 | 0.0% |
| $15,000 to $24,999 | 17 | 5.7% |
| $25,000 to $34,999 | 61 | 20.5% |
| $35,000 to $49,999 | 26 | 8.8% |
| $50,000 to $74,999 | 18 | 6.1% |
| $75,000 to $99,999 | 118 | 39.7% |
| $100,000 to $149,999 | 19 | 6.4% |
| $150,000 to $199,999 | 18 | 6.1% |
| $200,000+ | 0 | 0.0% |
Family Income by Famaliy Size in Morse
3-person families (144 | 48.5%) account for the highest median family income in Morse with $93,525 per family, while 3-person families (144 | 48.5%) have the highest median income of $31,175 per family member.
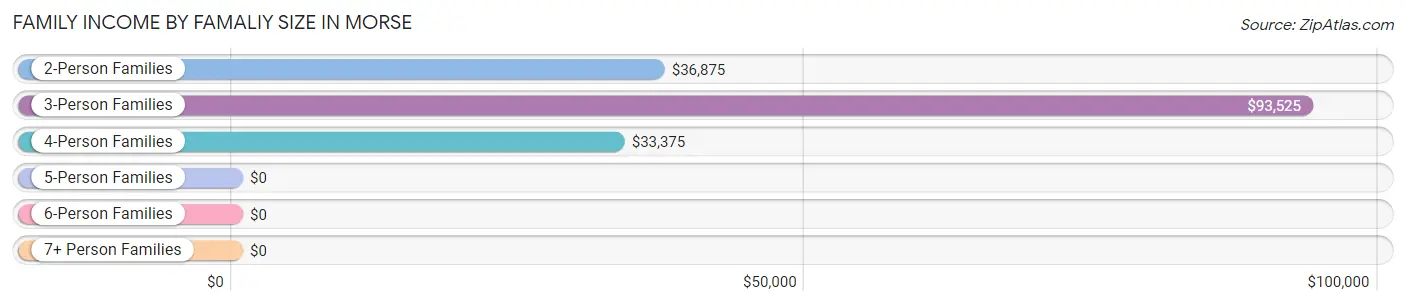
| Income Bracket | # Families | Median Income |
| 2-Person Families | 74 (24.9%) | $36,875 |
| 3-Person Families | 144 (48.5%) | $93,525 |
| 4-Person Families | 53 (17.8%) | $33,375 |
| 5-Person Families | 26 (8.7%) | $0 |
| 6-Person Families | 0 (0.0%) | $0 |
| 7+ Person Families | 0 (0.0%) | $0 |
| Total | 297 (100.0%) | $90,893 |
Family Income by Number of Earners in Morse
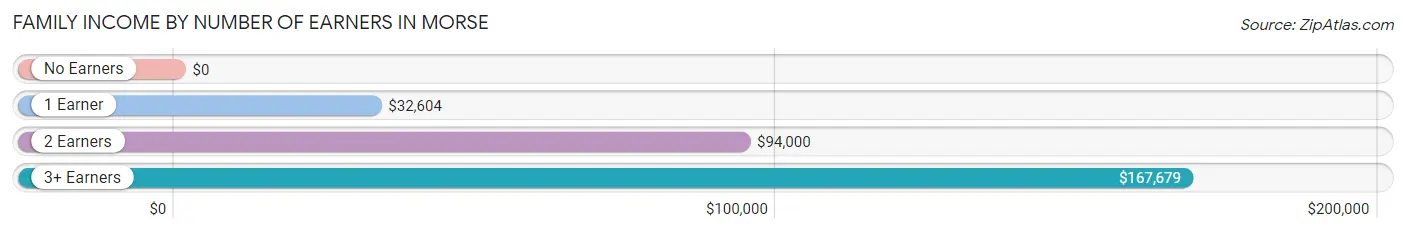
| Number of Earners | # Families | Median Income |
| No Earners | 43 (14.5%) | $0 |
| 1 Earner | 99 (33.3%) | $32,604 |
| 2 Earners | 142 (47.8%) | $94,000 |
| 3+ Earners | 13 (4.4%) | $167,679 |
| Total | 297 (100.0%) | $90,893 |
Household Income in Morse
Household Income Brackets in Morse
With 125 households falling in the category, the $75,000 to $99,999 income range is the most frequent in Morse, accounting for 34.4% of all households.
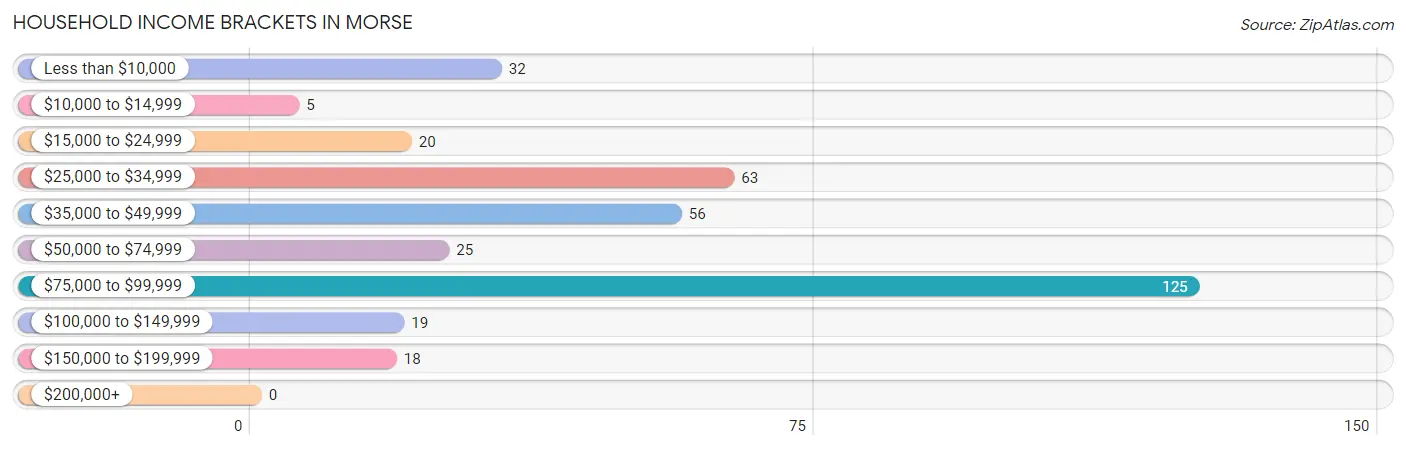
| Income Bracket | # Households | % Households |
| Less than $10,000 | 32 | 8.8% |
| $10,000 to $14,999 | 5 | 1.4% |
| $15,000 to $24,999 | 20 | 5.5% |
| $25,000 to $34,999 | 63 | 17.4% |
| $35,000 to $49,999 | 56 | 15.4% |
| $50,000 to $74,999 | 25 | 6.9% |
| $75,000 to $99,999 | 125 | 34.4% |
| $100,000 to $149,999 | 19 | 5.2% |
| $150,000 to $199,999 | 18 | 5.0% |
| $200,000+ | 0 | 0.0% |
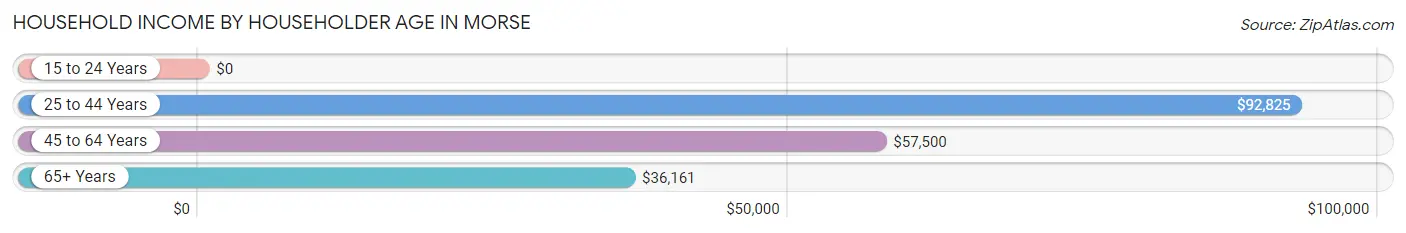
Household Income by Householder Age in Morse
The median household income in Morse is $53,393, with the highest median household income of $92,825 found in the 25 to 44 years age bracket for the primary householder. A total of 194 households (53.4%) fall into this category.
| Income Bracket | # Households | Median Income |
| 15 to 24 Years | 0 (0.0%) | $0 |
| 25 to 44 Years | 194 (53.4%) | $92,825 |
| 45 to 64 Years | 92 (25.3%) | $57,500 |
| 65+ Years | 77 (21.2%) | $36,161 |
| Total | 363 (100.0%) | $53,393 |
Poverty in Morse
Income Below Poverty by Sex and Age in Morse
With 22.4% poverty level for males and 18.8% for females among the residents of Morse, under 5 year old males and 12 to 14 year old females are the most vulnerable to poverty, with 13 males (56.5%) and 7 females (77.8%) in their respective age groups living below the poverty level.
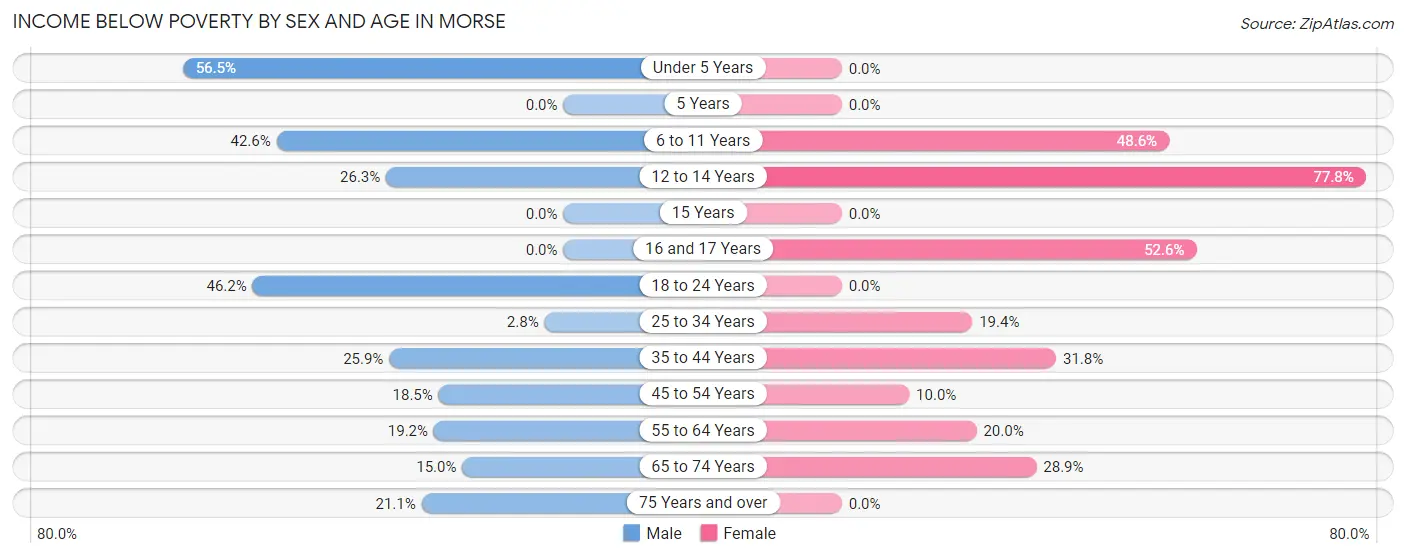
| Age Bracket | Male | Female |
| Under 5 Years | 13 (56.5%) | 0 (0.0%) |
| 5 Years | 0 (0.0%) | 0 (0.0%) |
| 6 to 11 Years | 46 (42.6%) | 17 (48.6%) |
| 12 to 14 Years | 5 (26.3%) | 7 (77.8%) |
| 15 Years | 0 (0.0%) | 0 (0.0%) |
| 16 and 17 Years | 0 (0.0%) | 10 (52.6%) |
| 18 to 24 Years | 6 (46.2%) | 0 (0.0%) |
| 25 to 34 Years | 4 (2.8%) | 37 (19.4%) |
| 35 to 44 Years | 15 (25.9%) | 14 (31.8%) |
| 45 to 54 Years | 5 (18.5%) | 4 (10.0%) |
| 55 to 64 Years | 10 (19.2%) | 11 (20.0%) |
| 65 to 74 Years | 6 (15.0%) | 13 (28.9%) |
| 75 Years and over | 4 (21.0%) | 0 (0.0%) |
| Total | 114 (22.4%) | 113 (18.8%) |
Income Above Poverty by Sex and Age in Morse
According to the poverty statistics in Morse, males aged 5 years and females aged under 5 years are the age groups that are most secure financially, with 100.0% of males and 100.0% of females in these age groups living above the poverty line.
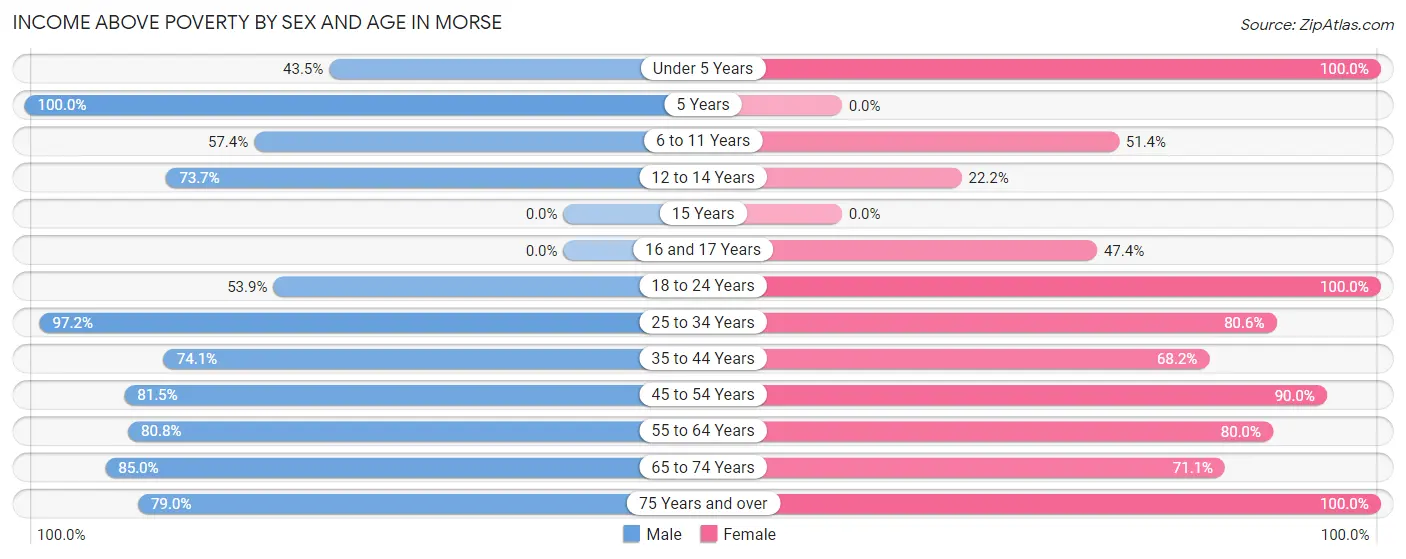
| Age Bracket | Male | Female |
| Under 5 Years | 10 (43.5%) | 128 (100.0%) |
| 5 Years | 7 (100.0%) | 0 (0.0%) |
| 6 to 11 Years | 62 (57.4%) | 18 (51.4%) |
| 12 to 14 Years | 14 (73.7%) | 2 (22.2%) |
| 15 Years | 0 (0.0%) | 0 (0.0%) |
| 16 and 17 Years | 0 (0.0%) | 9 (47.4%) |
| 18 to 24 Years | 7 (53.8%) | 20 (100.0%) |
| 25 to 34 Years | 139 (97.2%) | 154 (80.6%) |
| 35 to 44 Years | 43 (74.1%) | 30 (68.2%) |
| 45 to 54 Years | 22 (81.5%) | 36 (90.0%) |
| 55 to 64 Years | 42 (80.8%) | 44 (80.0%) |
| 65 to 74 Years | 34 (85.0%) | 32 (71.1%) |
| 75 Years and over | 15 (78.9%) | 16 (100.0%) |
| Total | 395 (77.6%) | 489 (81.2%) |
Income Below Poverty Among Married-Couple Families in Morse
The poverty statistics for married-couple families in Morse show that 5.5% or 11 of the total 201 families live below the poverty line. Families with no children have the highest poverty rate of 9.0%, comprising of 6 families. On the other hand, families with 1 or 2 children have the lowest poverty rate of 3.7%, which includes 5 families.
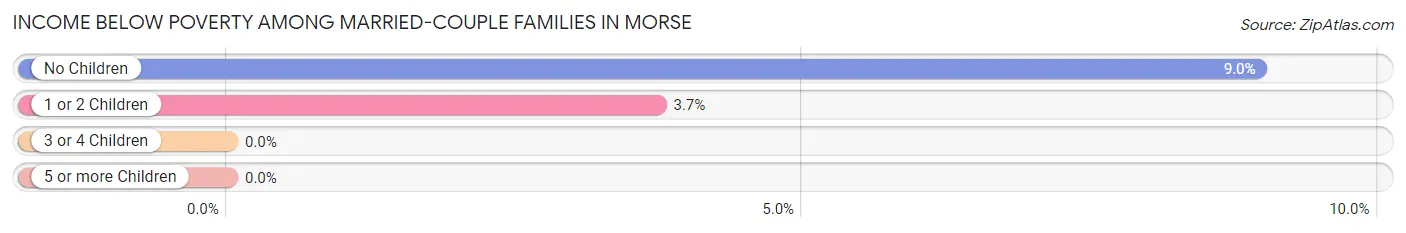
| Children | Above Poverty | Below Poverty |
| No Children | 61 (91.0%) | 6 (9.0%) |
| 1 or 2 Children | 129 (96.3%) | 5 (3.7%) |
| 3 or 4 Children | 0 (0.0%) | 0 (0.0%) |
| 5 or more Children | 0 (0.0%) | 0 (0.0%) |
| Total | 190 (94.5%) | 11 (5.5%) |
Income Below Poverty Among Single-Parent Households in Morse
According to the poverty data in Morse, 7.4% or 2 single-father households and 53.6% or 37 single-mother households are living below the poverty line. Among single-father households, those with no children have the highest poverty rate, with 2 households (14.3%) experiencing poverty. Likewise, among single-mother households, those with 3 or 4 children have the highest poverty rate, with 35 households (77.8%) falling below the poverty line.
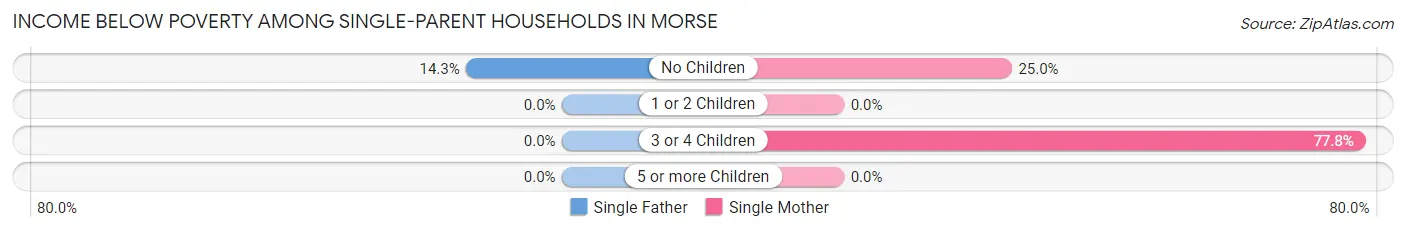
| Children | Single Father | Single Mother |
| No Children | 2 (14.3%) | 2 (25.0%) |
| 1 or 2 Children | 0 (0.0%) | 0 (0.0%) |
| 3 or 4 Children | 0 (0.0%) | 35 (77.8%) |
| 5 or more Children | 0 (0.0%) | 0 (0.0%) |
| Total | 2 (7.4%) | 37 (53.6%) |
Income Below Poverty Among Married-Couple vs Single-Parent Households in Morse
The poverty data for Morse shows that 11 of the married-couple family households (5.5%) and 39 of the single-parent households (40.6%) are living below the poverty level. Within the married-couple family households, those with no children have the highest poverty rate, with 6 households (9.0%) falling below the poverty line. Among the single-parent households, those with 3 or 4 children have the highest poverty rate, with 35 household (77.8%) living below poverty.
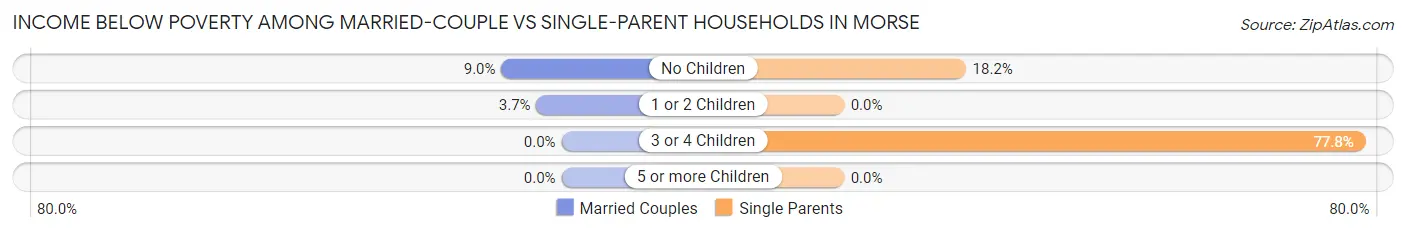
| Children | Married-Couple Families | Single-Parent Households |
| No Children | 6 (9.0%) | 4 (18.2%) |
| 1 or 2 Children | 5 (3.7%) | 0 (0.0%) |
| 3 or 4 Children | 0 (0.0%) | 35 (77.8%) |
| 5 or more Children | 0 (0.0%) | 0 (0.0%) |
| Total | 11 (5.5%) | 39 (40.6%) |
Race in Morse
The most populous races in Morse are White / Caucasian (1,068 | 96.1%), Two or more Races (34 | 3.1%), and Black / African American (9 | 0.8%).
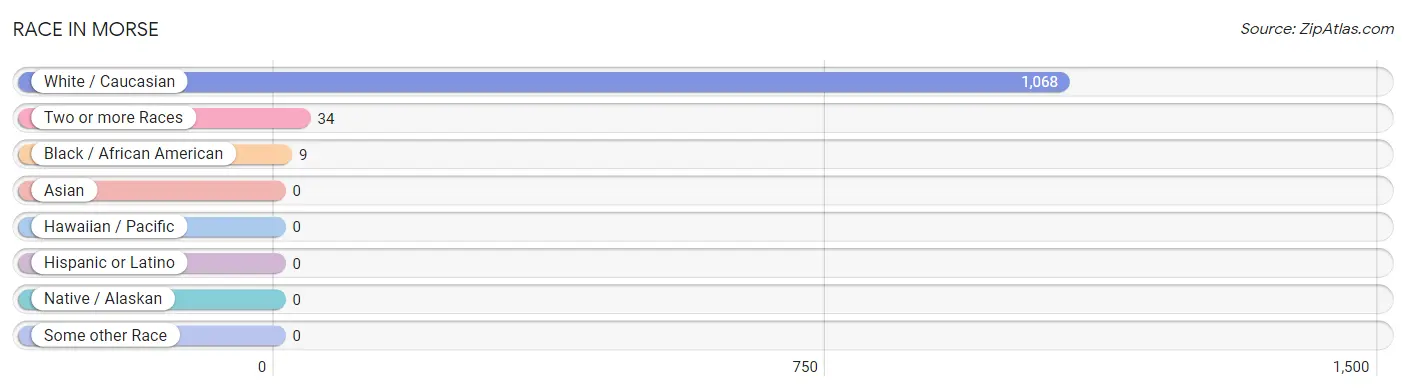
| Race | # Population | % Population |
| Asian | 0 | 0.0% |
| Black / African American | 9 | 0.8% |
| Hawaiian / Pacific | 0 | 0.0% |
| Hispanic or Latino | 0 | 0.0% |
| Native / Alaskan | 0 | 0.0% |
| White / Caucasian | 1,068 | 96.1% |
| Two or more Races | 34 | 3.1% |
| Some other Race | 0 | 0.0% |
| Total | 1,111 | 100.0% |
Ancestry in Morse
The most populous ancestries reported in Morse are French (181 | 16.3%), German (102 | 9.2%), French Canadian (81 | 7.3%), American (75 | 6.8%), and Irish (35 | 3.2%), together accounting for 42.7% of all Morse residents.
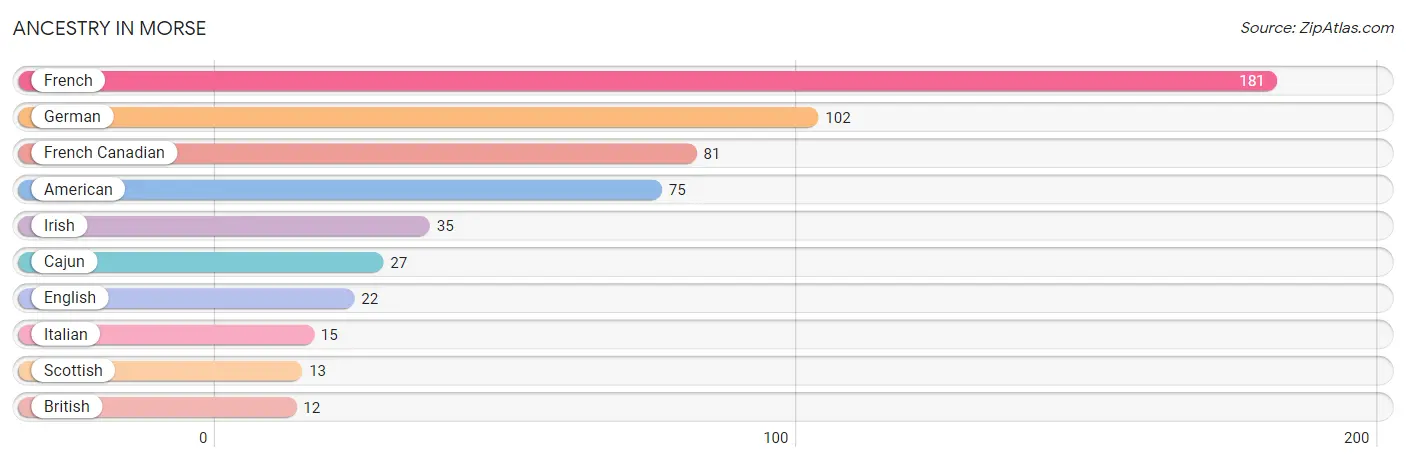
| Ancestry | # Population | % Population |
| American | 75 | 6.8% |
| British | 12 | 1.1% |
| Cajun | 27 | 2.4% |
| English | 22 | 2.0% |
| French | 181 | 16.3% |
| French Canadian | 81 | 7.3% |
| German | 102 | 9.2% |
| Irish | 35 | 3.2% |
| Italian | 15 | 1.3% |
| Scottish | 13 | 1.2% | View All 10 Rows |
Immigrants in Morse

| Immigration Origin | # Population | % Population | View All 0 Rows |
Sex and Age in Morse
Sex and Age in Morse
The most populous age groups in Morse are 25 to 29 Years (113 | 22.2%) for men and Under 5 Years (128 | 21.3%) for women.
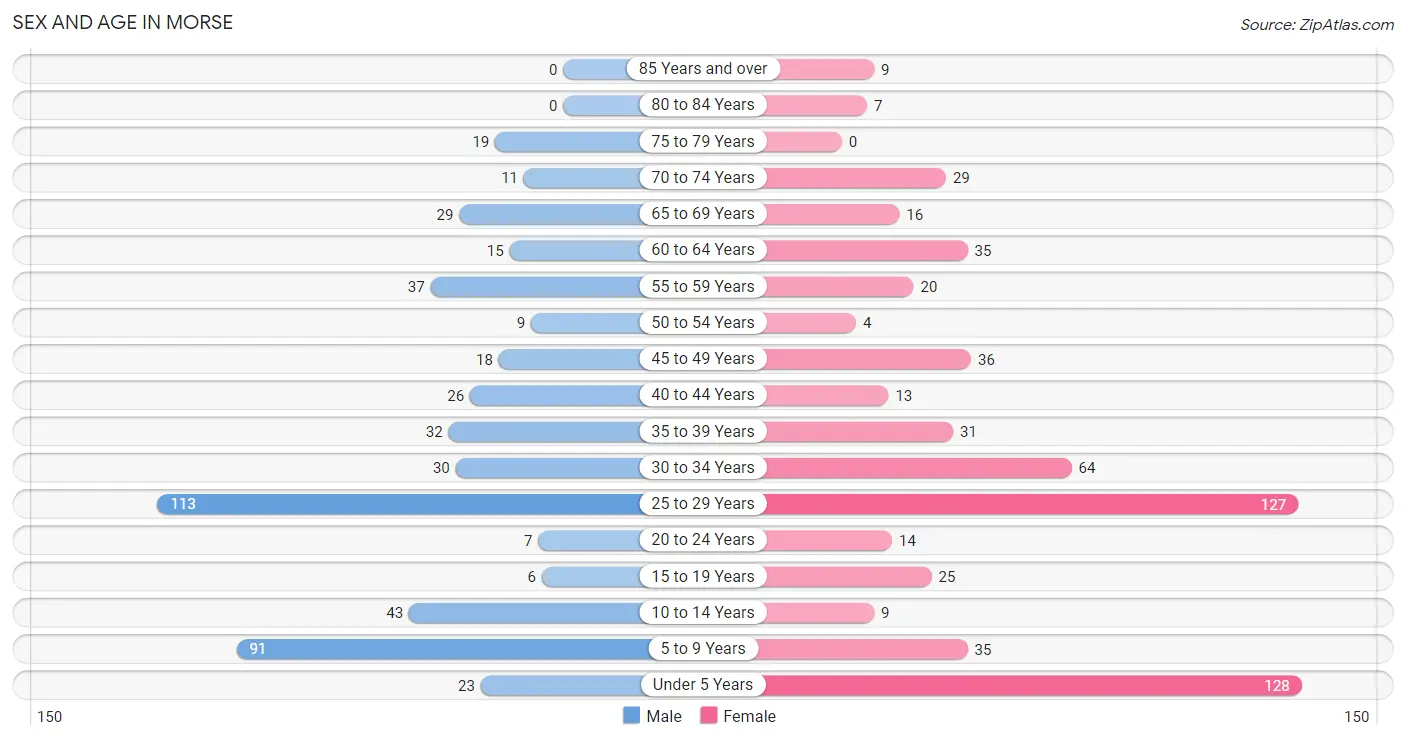
| Age Bracket | Male | Female |
| Under 5 Years | 23 (4.5%) | 128 (21.3%) |
| 5 to 9 Years | 91 (17.9%) | 35 (5.8%) |
| 10 to 14 Years | 43 (8.5%) | 9 (1.5%) |
| 15 to 19 Years | 6 (1.2%) | 25 (4.2%) |
| 20 to 24 Years | 7 (1.4%) | 14 (2.3%) |
| 25 to 29 Years | 113 (22.2%) | 127 (21.1%) |
| 30 to 34 Years | 30 (5.9%) | 64 (10.6%) |
| 35 to 39 Years | 32 (6.3%) | 31 (5.1%) |
| 40 to 44 Years | 26 (5.1%) | 13 (2.2%) |
| 45 to 49 Years | 18 (3.5%) | 36 (6.0%) |
| 50 to 54 Years | 9 (1.8%) | 4 (0.7%) |
| 55 to 59 Years | 37 (7.3%) | 20 (3.3%) |
| 60 to 64 Years | 15 (2.9%) | 35 (5.8%) |
| 65 to 69 Years | 29 (5.7%) | 16 (2.7%) |
| 70 to 74 Years | 11 (2.2%) | 29 (4.8%) |
| 75 to 79 Years | 19 (3.7%) | 0 (0.0%) |
| 80 to 84 Years | 0 (0.0%) | 7 (1.2%) |
| 85 Years and over | 0 (0.0%) | 9 (1.5%) |
| Total | 509 (100.0%) | 602 (100.0%) |
Families and Households in Morse
Median Family Size in Morse
The median family size in Morse is 3.38 persons per family, with single female/mother families (69 | 23.2%) accounting for the largest median family size of 3.7 persons per family. On the other hand, single male/father families (27 | 9.1%) represent the smallest median family size with 3.19 persons per family.
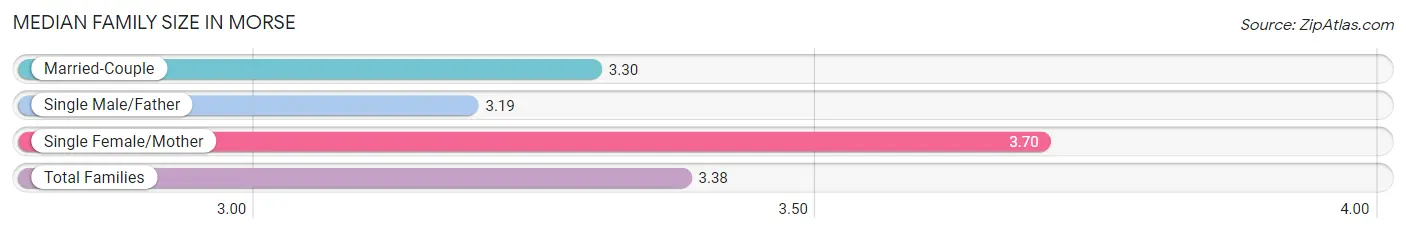
| Family Type | # Families | Family Size |
| Married-Couple | 201 (67.7%) | 3.30 |
| Single Male/Father | 27 (9.1%) | 3.19 |
| Single Female/Mother | 69 (23.2%) | 3.70 |
| Total Families | 297 (100.0%) | 3.38 |
Median Household Size in Morse
The median household size in Morse is 3.06 persons per household, with single male/father households (27 | 7.4%) accounting for the largest median household size of 4.11 persons per household. non-family households (66 | 18.2%) represent the smallest median household size with 1.15 persons per household.
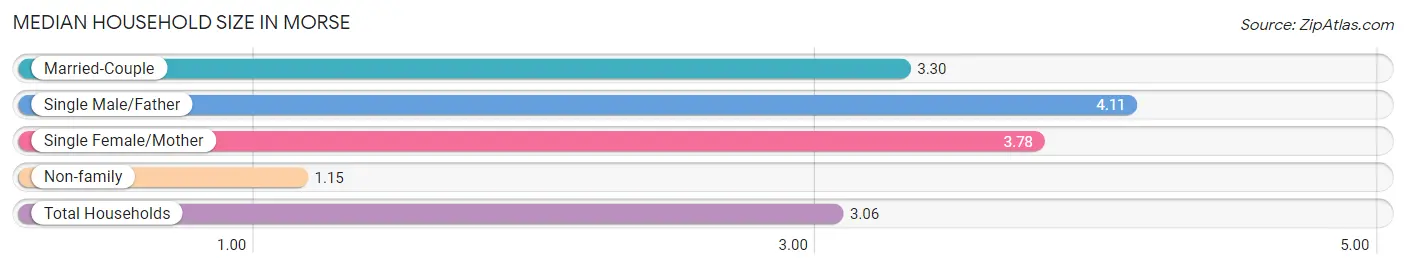
| Household Type | # Households | Household Size |
| Married-Couple | 201 (55.4%) | 3.30 |
| Single Male/Father | 27 (7.4%) | 4.11 |
| Single Female/Mother | 69 (19.0%) | 3.78 |
| Non-family | 66 (18.2%) | 1.15 |
| Total Households | 363 (100.0%) | 3.06 |
Household Size by Marriage Status in Morse
Out of a total of 363 households in Morse, 297 (81.8%) are family households, while 66 (18.2%) are nonfamily households. The most numerous type of family households are 3-person households, comprising 154, and the most common type of nonfamily households are 1-person households, comprising 55.
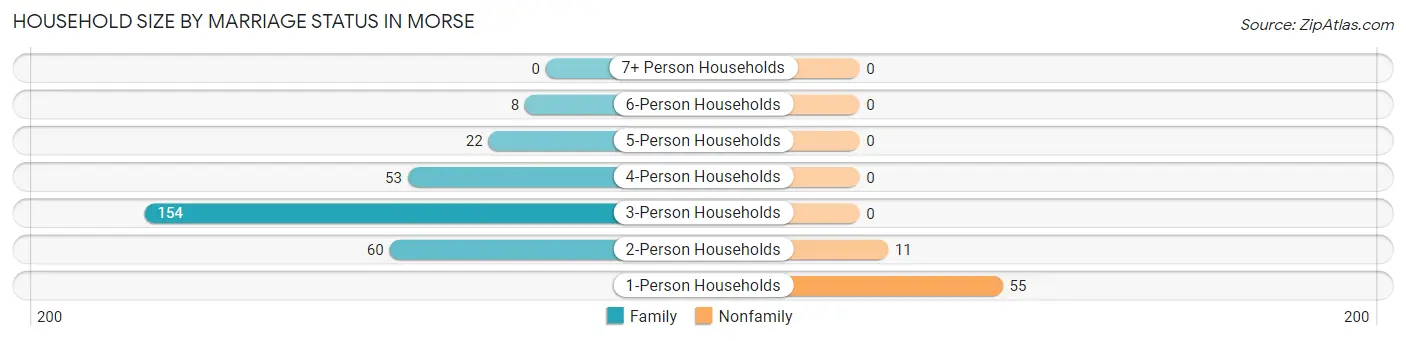
| Household Size | Family Households | Nonfamily Households |
| 1-Person Households | - | 55 (15.1%) |
| 2-Person Households | 60 (16.5%) | 11 (3.0%) |
| 3-Person Households | 154 (42.4%) | 0 (0.0%) |
| 4-Person Households | 53 (14.6%) | 0 (0.0%) |
| 5-Person Households | 22 (6.1%) | 0 (0.0%) |
| 6-Person Households | 8 (2.2%) | 0 (0.0%) |
| 7+ Person Households | 0 (0.0%) | 0 (0.0%) |
| Total | 297 (81.8%) | 66 (18.2%) |
Female Fertility in Morse
Fertility by Age in Morse

| Age Bracket | Women with Births | Births / 1,000 Women |
| 15 to 19 years | 0 (0.0%) | 0.0 |
| 20 to 34 years | 0 (0.0%) | 0.0 |
| 35 to 50 years | 0 (0.0%) | 0.0 |
| Total | 0 (0.0%) | 0.0 |
Fertility by Age by Marriage Status in Morse
| Age Bracket | Married | Unmarried |
| 15 to 19 years | 0 (0.0%) | 0 (0.0%) |
| 20 to 34 years | 0 (0.0%) | 0 (0.0%) |
| 35 to 50 years | 0 (0.0%) | 0 (0.0%) |
| Total | 0 (0.0%) | 0 (0.0%) |
Fertility by Education in Morse
| Educational Attainment | Women with Births | Births / 1,000 Women |
| Less than High School | 0 (0.0%) | 0.0 |
| High School Diploma | 0 (0.0%) | 0.0 |
| College or Associate's Degree | 0 (0.0%) | 0.0 |
| Bachelor's Degree | 0 (0.0%) | 0.0 |
| Graduate Degree | 0 (0.0%) | 0.0 |
| Total | 0 (0.0%) | 0.0 |
Fertility by Education by Marriage Status in Morse
| Educational Attainment | Married | Unmarried |
| Less than High School | 0 (0.0%) | 0 (0.0%) |
| High School Diploma | 0 (0.0%) | 0 (0.0%) |
| College or Associate's Degree | 0 (0.0%) | 0 (0.0%) |
| Bachelor's Degree | 0 (0.0%) | 0 (0.0%) |
| Graduate Degree | 0 (0.0%) | 0 (0.0%) |
| Total | 0 (0.0%) | 0 (0.0%) |
Employment Characteristics in Morse
Employment by Class of Employer in Morse
Among the 482 employed individuals in Morse, not-for-profit organizations (196 | 40.7%), private company employees (192 | 39.8%), and local government employees (51 | 10.6%) make up the most common classes of employment.
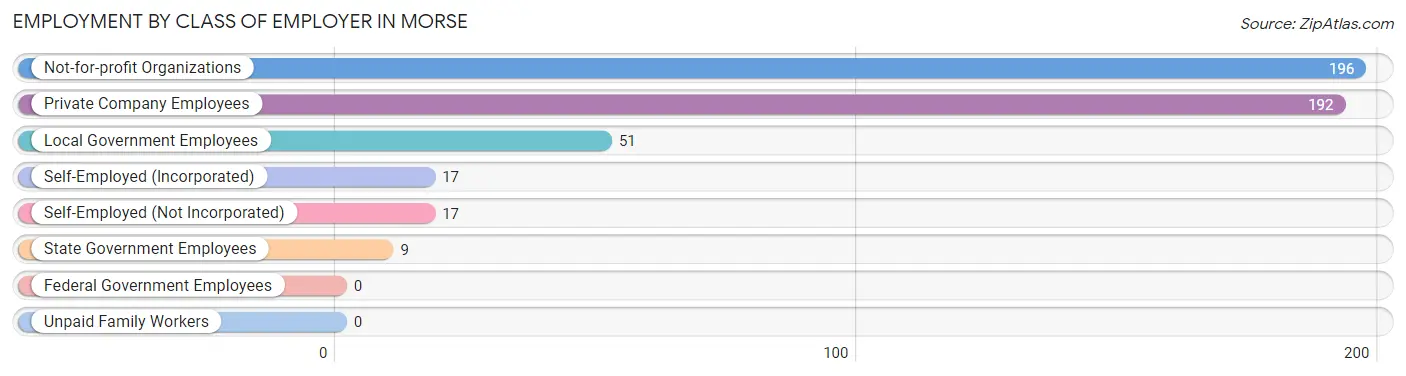
| Employer Class | # Employees | % Employees |
| Private Company Employees | 192 | 39.8% |
| Self-Employed (Incorporated) | 17 | 3.5% |
| Self-Employed (Not Incorporated) | 17 | 3.5% |
| Not-for-profit Organizations | 196 | 40.7% |
| Local Government Employees | 51 | 10.6% |
| State Government Employees | 9 | 1.9% |
| Federal Government Employees | 0 | 0.0% |
| Unpaid Family Workers | 0 | 0.0% |
| Total | 482 | 100.0% |
Employment Status by Age in Morse
According to the labor force statistics for Morse, out of the total population over 16 years of age (782), 63.3% or 495 individuals are in the labor force, with 1.4% or 7 of them unemployed. The age group with the highest labor force participation rate is 25 to 29 years, with 88.8% or 213 individuals in the labor force. Within the labor force, the 55 to 59 years age range has the highest percentage of unemployed individuals, with 13.5% or 5 of them being unemployed.
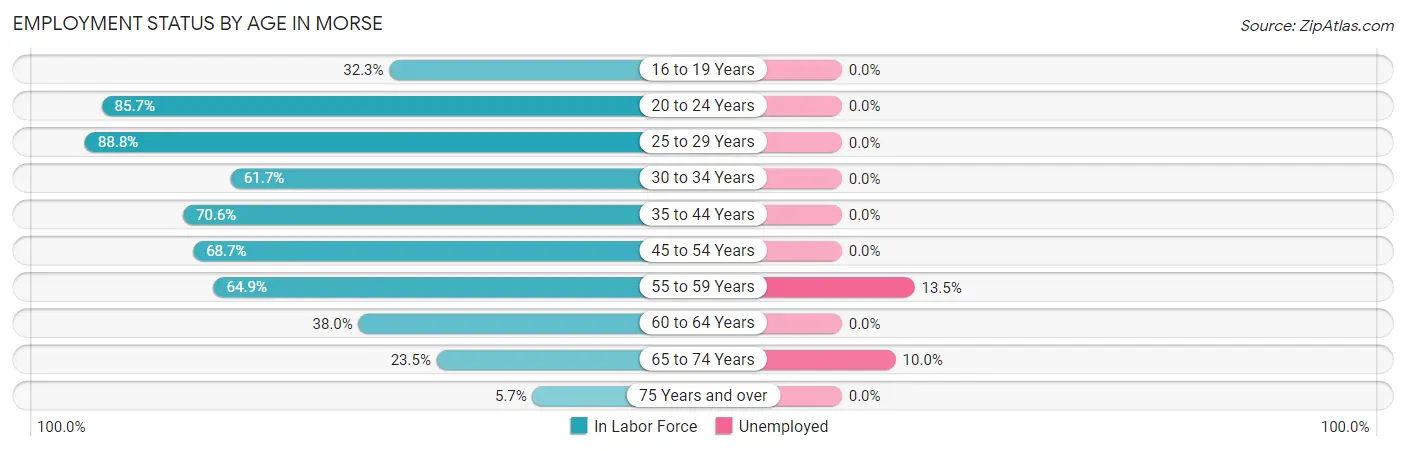
| Age Bracket | In Labor Force | Unemployed |
| 16 to 19 Years | 10 (32.3%) | 0 (0.0%) |
| 20 to 24 Years | 18 (85.7%) | 0 (0.0%) |
| 25 to 29 Years | 213 (88.8%) | 0 (0.0%) |
| 30 to 34 Years | 58 (61.7%) | 0 (0.0%) |
| 35 to 44 Years | 72 (70.6%) | 0 (0.0%) |
| 45 to 54 Years | 46 (68.7%) | 0 (0.0%) |
| 55 to 59 Years | 37 (64.9%) | 5 (13.5%) |
| 60 to 64 Years | 19 (38.0%) | 0 (0.0%) |
| 65 to 74 Years | 20 (23.5%) | 2 (10.0%) |
| 75 Years and over | 2 (5.7%) | 0 (0.0%) |
| Total | 495 (63.3%) | 7 (1.4%) |
Employment Status by Educational Attainment in Morse
According to labor force statistics for Morse, 73.0% of individuals (445) out of the total population between 25 and 64 years of age (610) are in the labor force, with 1.1% or 5 of them being unemployed. The group with the highest labor force participation rate are those with the educational attainment of bachelor's degree or higher, with 100.0% or 8 individuals in the labor force. Within the labor force, individuals with high school diploma education have the highest percentage of unemployment, with 3.0% or 5 of them being unemployed.
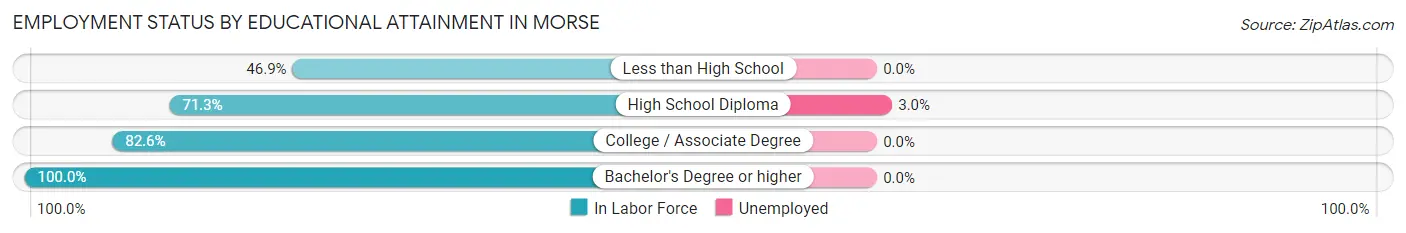
| Educational Attainment | In Labor Force | Unemployed |
| Less than High School | 45 (46.9%) | 0 (0.0%) |
| High School Diploma | 164 (71.3%) | 7 (3.0%) |
| College / Associate Degree | 228 (82.6%) | 0 (0.0%) |
| Bachelor's Degree or higher | 8 (100.0%) | 0 (0.0%) |
| Total | 445 (73.0%) | 7 (1.1%) |
Employment Occupations by Sex in Morse
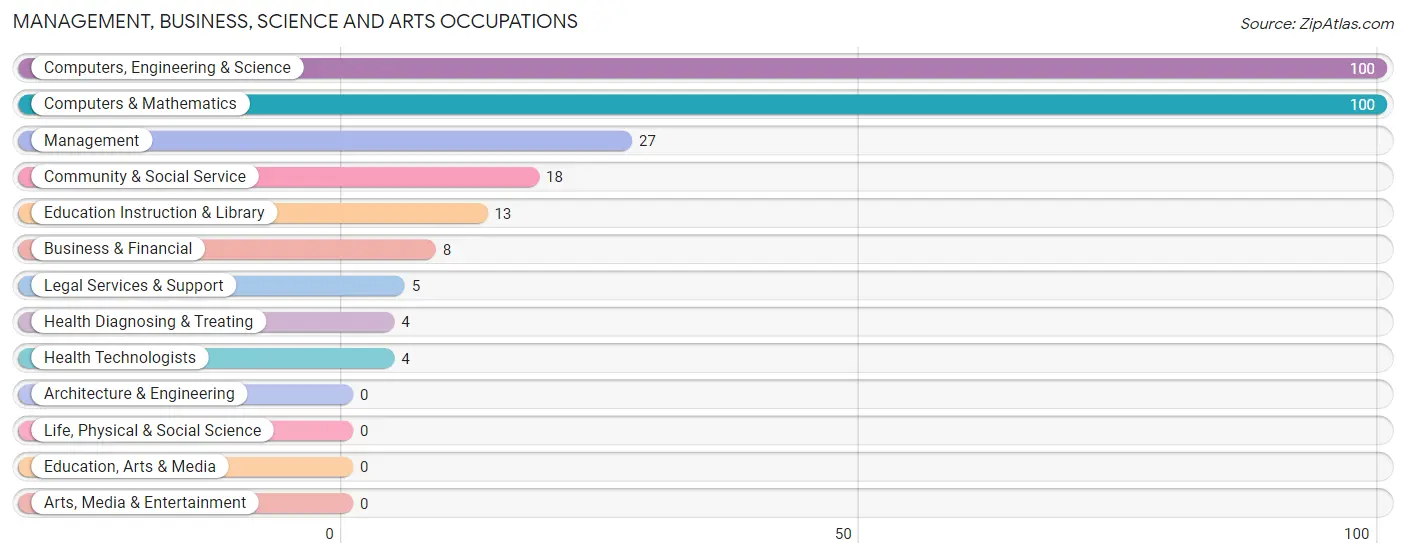
Management, Business, Science and Arts Occupations
The most common Management, Business, Science and Arts occupations in Morse are Computers, Engineering & Science (100 | 20.5%), Computers & Mathematics (100 | 20.5%), Management (27 | 5.5%), Community & Social Service (18 | 3.7%), and Education Instruction & Library (13 | 2.7%).
Management, Business, Science and Arts Occupations by Sex
Within the Management, Business, Science and Arts occupations in Morse, the most male-oriented occupations are Computers, Engineering & Science (100.0%), Computers & Mathematics (100.0%), and Legal Services & Support (100.0%), while the most female-oriented occupations are Business & Financial (100.0%), Education Instruction & Library (100.0%), and Health Diagnosing & Treating (100.0%).
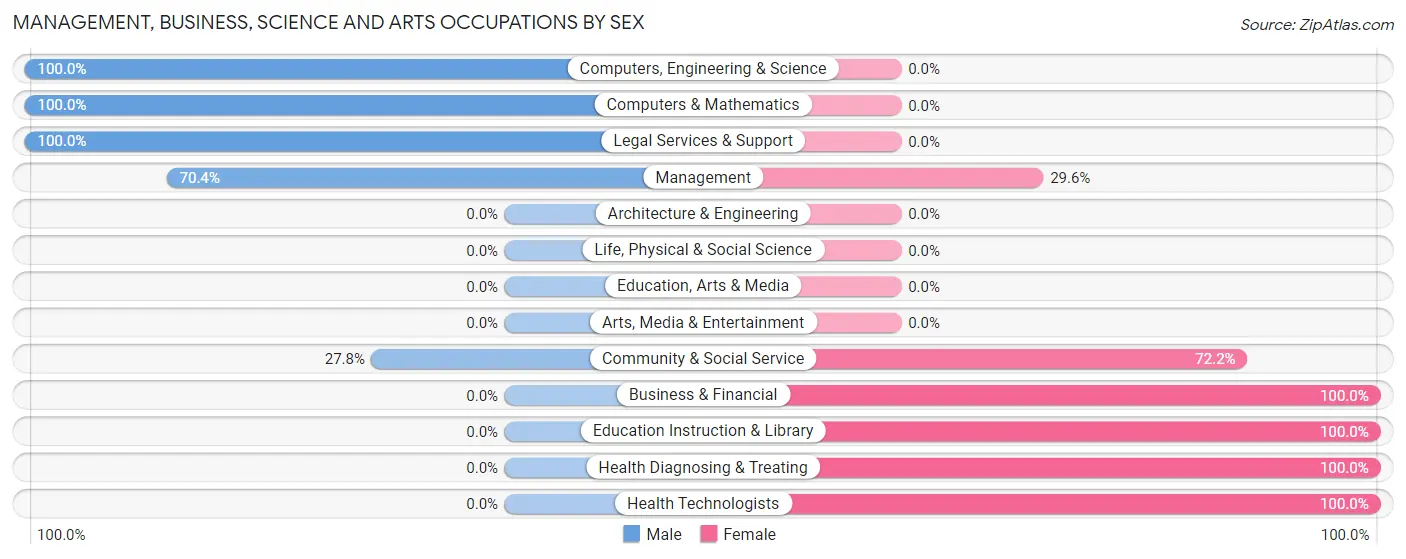
| Occupation | Male | Female |
| Management | 19 (70.4%) | 8 (29.6%) |
| Business & Financial | 0 (0.0%) | 8 (100.0%) |
| Computers, Engineering & Science | 100 (100.0%) | 0 (0.0%) |
| Computers & Mathematics | 100 (100.0%) | 0 (0.0%) |
| Architecture & Engineering | 0 (0.0%) | 0 (0.0%) |
| Life, Physical & Social Science | 0 (0.0%) | 0 (0.0%) |
| Community & Social Service | 5 (27.8%) | 13 (72.2%) |
| Education, Arts & Media | 0 (0.0%) | 0 (0.0%) |
| Legal Services & Support | 5 (100.0%) | 0 (0.0%) |
| Education Instruction & Library | 0 (0.0%) | 13 (100.0%) |
| Arts, Media & Entertainment | 0 (0.0%) | 0 (0.0%) |
| Health Diagnosing & Treating | 0 (0.0%) | 4 (100.0%) |
| Health Technologists | 0 (0.0%) | 4 (100.0%) |
| Total (Category) | 124 (79.0%) | 33 (21.0%) |
| Total (Overall) | 244 (50.0%) | 244 (50.0%) |
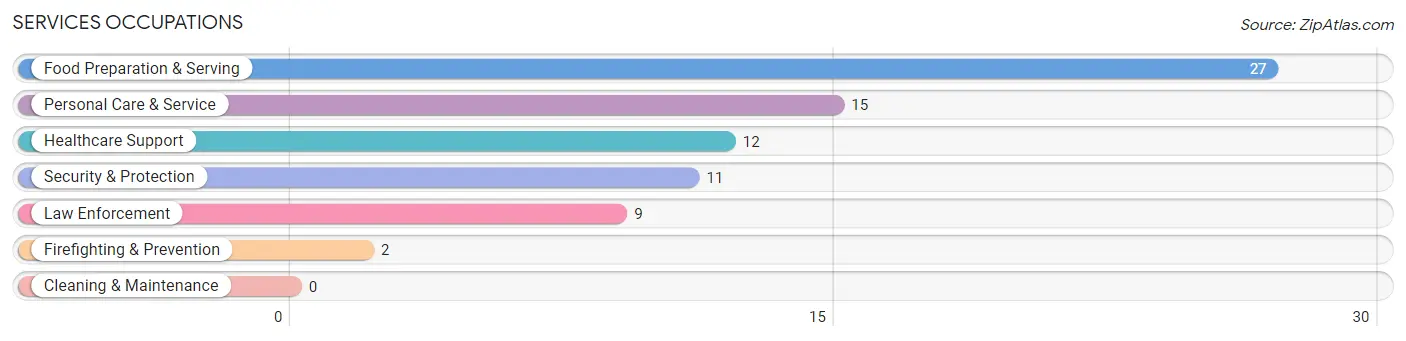
Services Occupations
The most common Services occupations in Morse are Food Preparation & Serving (27 | 5.5%), Personal Care & Service (15 | 3.1%), Healthcare Support (12 | 2.5%), Security & Protection (11 | 2.2%), and Law Enforcement (9 | 1.8%).
Services Occupations by Sex
Within the Services occupations in Morse, the most male-oriented occupations are Security & Protection (100.0%), Firefighting & Prevention (100.0%), and Law Enforcement (100.0%), while the most female-oriented occupations are Healthcare Support (100.0%), Personal Care & Service (86.7%), and Food Preparation & Serving (40.7%).
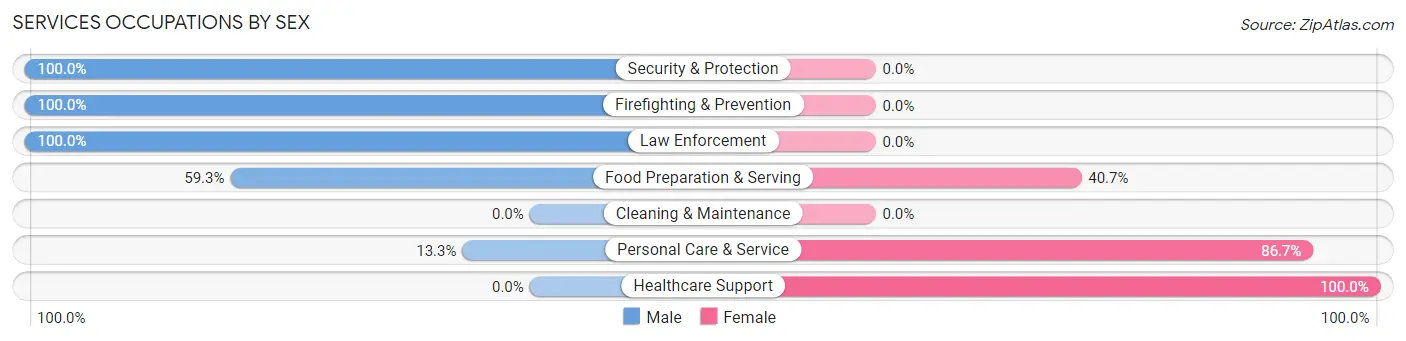
| Occupation | Male | Female |
| Healthcare Support | 0 (0.0%) | 12 (100.0%) |
| Security & Protection | 11 (100.0%) | 0 (0.0%) |
| Firefighting & Prevention | 2 (100.0%) | 0 (0.0%) |
| Law Enforcement | 9 (100.0%) | 0 (0.0%) |
| Food Preparation & Serving | 16 (59.3%) | 11 (40.7%) |
| Cleaning & Maintenance | 0 (0.0%) | 0 (0.0%) |
| Personal Care & Service | 2 (13.3%) | 13 (86.7%) |
| Total (Category) | 29 (44.6%) | 36 (55.4%) |
| Total (Overall) | 244 (50.0%) | 244 (50.0%) |
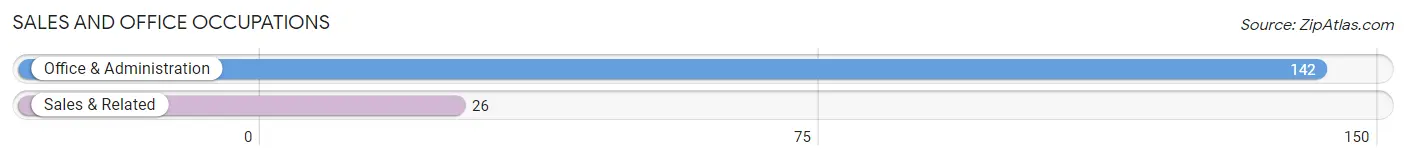
Sales and Office Occupations
The most common Sales and Office occupations in Morse are Office & Administration (142 | 29.1%), and Sales & Related (26 | 5.3%).
Sales and Office Occupations by Sex
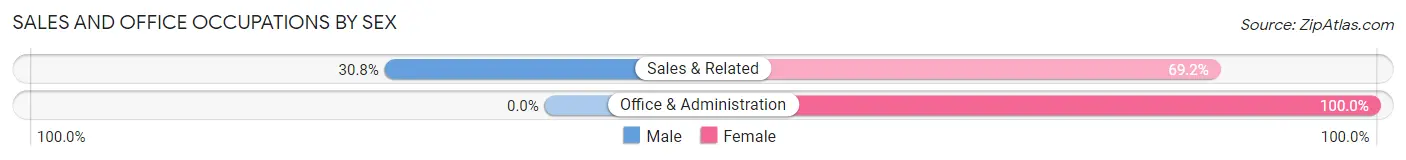
| Occupation | Male | Female |
| Sales & Related | 8 (30.8%) | 18 (69.2%) |
| Office & Administration | 0 (0.0%) | 142 (100.0%) |
| Total (Category) | 8 (4.8%) | 160 (95.2%) |
| Total (Overall) | 244 (50.0%) | 244 (50.0%) |
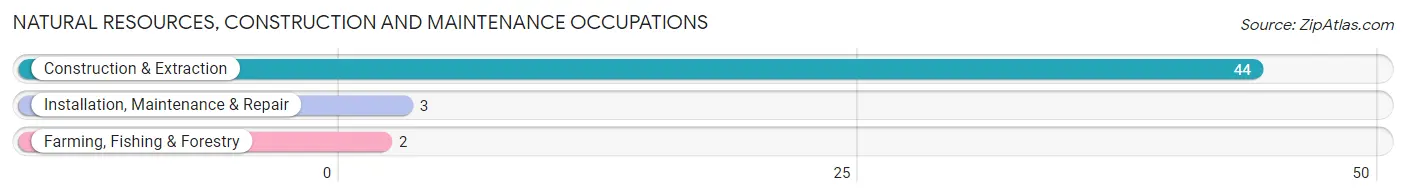
Natural Resources, Construction and Maintenance Occupations
The most common Natural Resources, Construction and Maintenance occupations in Morse are Construction & Extraction (44 | 9.0%), Installation, Maintenance & Repair (3 | 0.6%), and Farming, Fishing & Forestry (2 | 0.4%).
Natural Resources, Construction and Maintenance Occupations by Sex
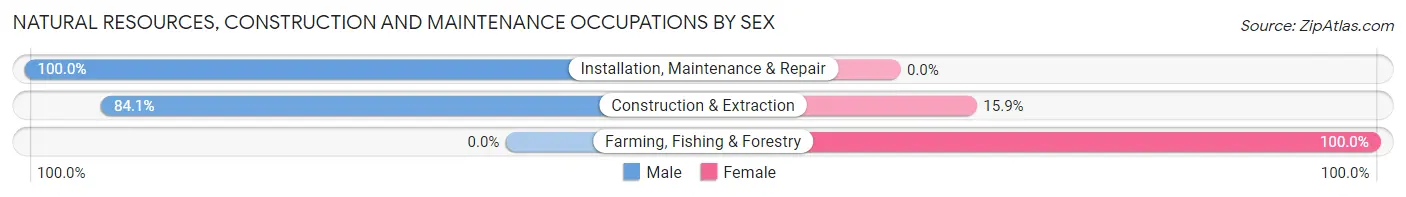
| Occupation | Male | Female |
| Farming, Fishing & Forestry | 0 (0.0%) | 2 (100.0%) |
| Construction & Extraction | 37 (84.1%) | 7 (15.9%) |
| Installation, Maintenance & Repair | 3 (100.0%) | 0 (0.0%) |
| Total (Category) | 40 (81.6%) | 9 (18.4%) |
| Total (Overall) | 244 (50.0%) | 244 (50.0%) |
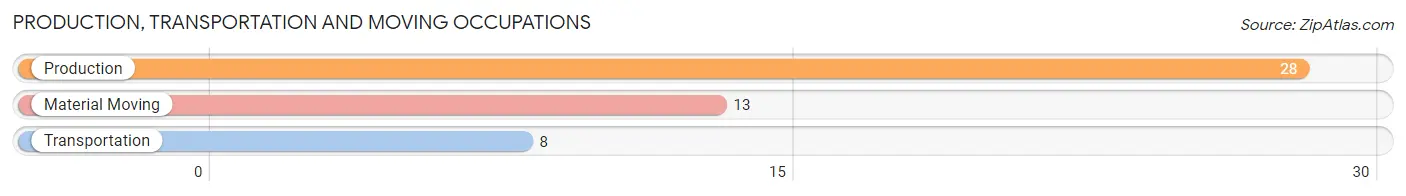
Production, Transportation and Moving Occupations
The most common Production, Transportation and Moving occupations in Morse are Production (28 | 5.7%), Material Moving (13 | 2.7%), and Transportation (8 | 1.6%).
Production, Transportation and Moving Occupations by Sex
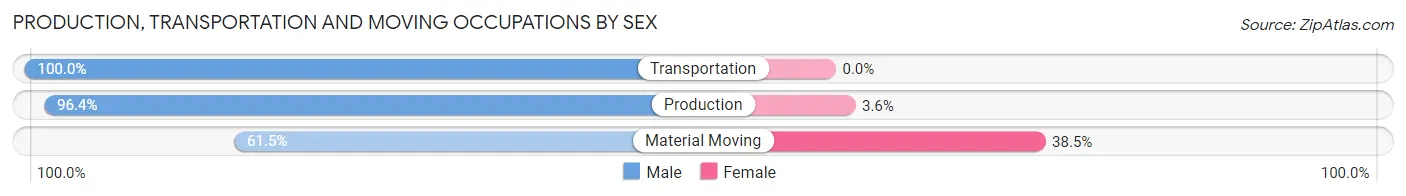
| Occupation | Male | Female |
| Production | 27 (96.4%) | 1 (3.6%) |
| Transportation | 8 (100.0%) | 0 (0.0%) |
| Material Moving | 8 (61.5%) | 5 (38.5%) |
| Total (Category) | 43 (87.8%) | 6 (12.2%) |
| Total (Overall) | 244 (50.0%) | 244 (50.0%) |
Employment Industries by Sex in Morse
Employment Industries in Morse
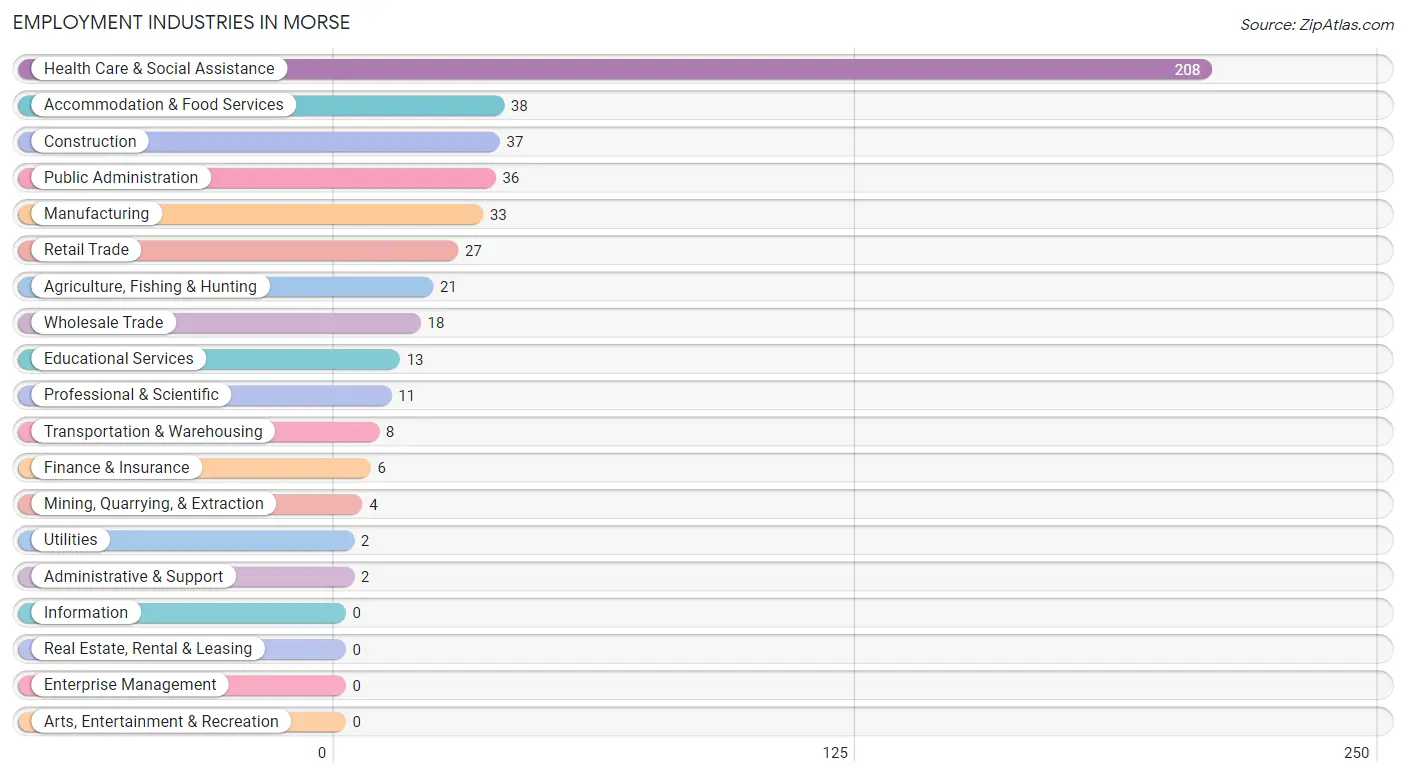
The major employment industries in Morse include Health Care & Social Assistance (208 | 42.6%), Accommodation & Food Services (38 | 7.8%), Construction (37 | 7.6%), Public Administration (36 | 7.4%), and Manufacturing (33 | 6.8%).
Employment Industries by Sex in Morse
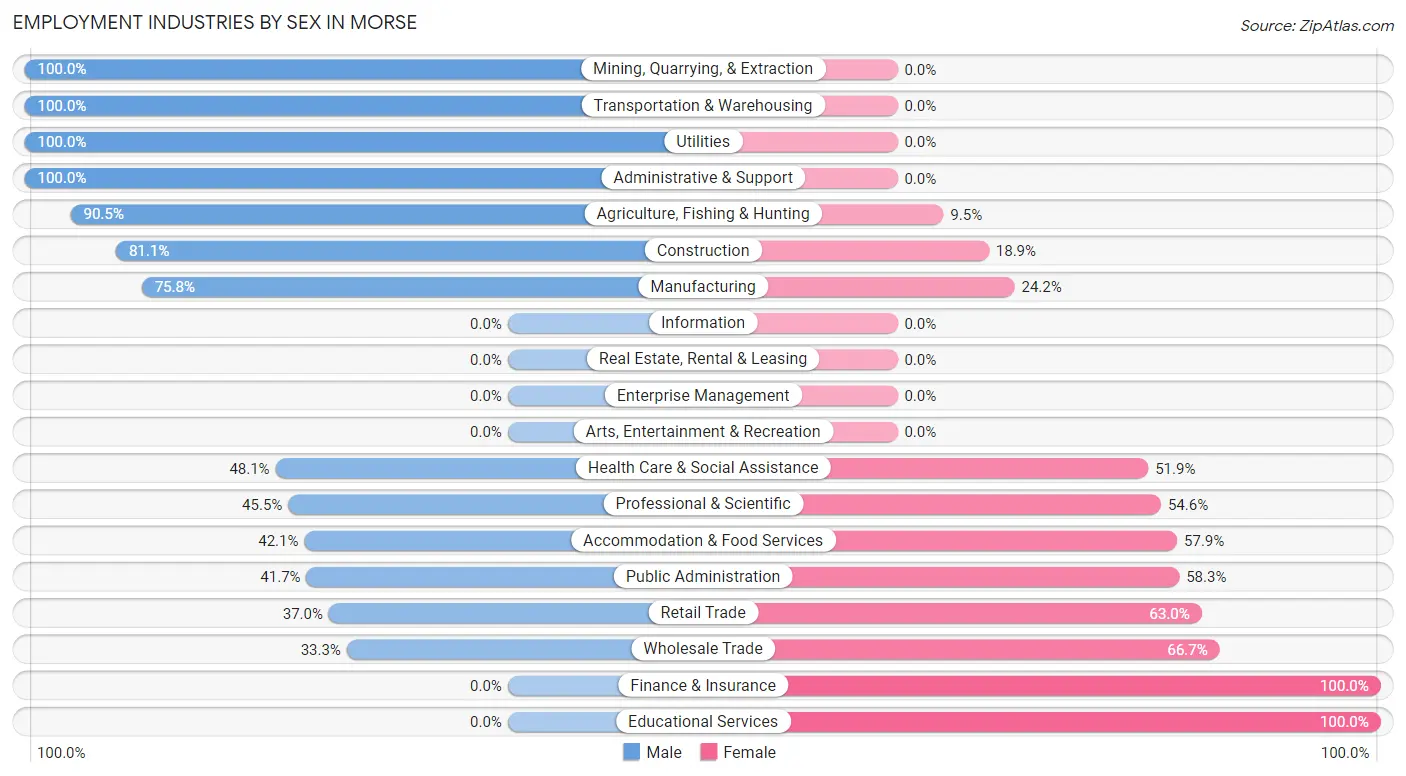
The Morse industries that see more men than women are Mining, Quarrying, & Extraction (100.0%), Transportation & Warehousing (100.0%), and Utilities (100.0%), whereas the industries that tend to have a higher number of women are Finance & Insurance (100.0%), Educational Services (100.0%), and Wholesale Trade (66.7%).
| Industry | Male | Female |
| Agriculture, Fishing & Hunting | 19 (90.5%) | 2 (9.5%) |
| Mining, Quarrying, & Extraction | 4 (100.0%) | 0 (0.0%) |
| Construction | 30 (81.1%) | 7 (18.9%) |
| Manufacturing | 25 (75.8%) | 8 (24.2%) |
| Wholesale Trade | 6 (33.3%) | 12 (66.7%) |
| Retail Trade | 10 (37.0%) | 17 (63.0%) |
| Transportation & Warehousing | 8 (100.0%) | 0 (0.0%) |
| Utilities | 2 (100.0%) | 0 (0.0%) |
| Information | 0 (0.0%) | 0 (0.0%) |
| Finance & Insurance | 0 (0.0%) | 6 (100.0%) |
| Real Estate, Rental & Leasing | 0 (0.0%) | 0 (0.0%) |
| Professional & Scientific | 5 (45.5%) | 6 (54.5%) |
| Enterprise Management | 0 (0.0%) | 0 (0.0%) |
| Administrative & Support | 2 (100.0%) | 0 (0.0%) |
| Educational Services | 0 (0.0%) | 13 (100.0%) |
| Health Care & Social Assistance | 100 (48.1%) | 108 (51.9%) |
| Arts, Entertainment & Recreation | 0 (0.0%) | 0 (0.0%) |
| Accommodation & Food Services | 16 (42.1%) | 22 (57.9%) |
| Public Administration | 15 (41.7%) | 21 (58.3%) |
| Total | 244 (50.0%) | 244 (50.0%) |
Education in Morse
School Enrollment in Morse
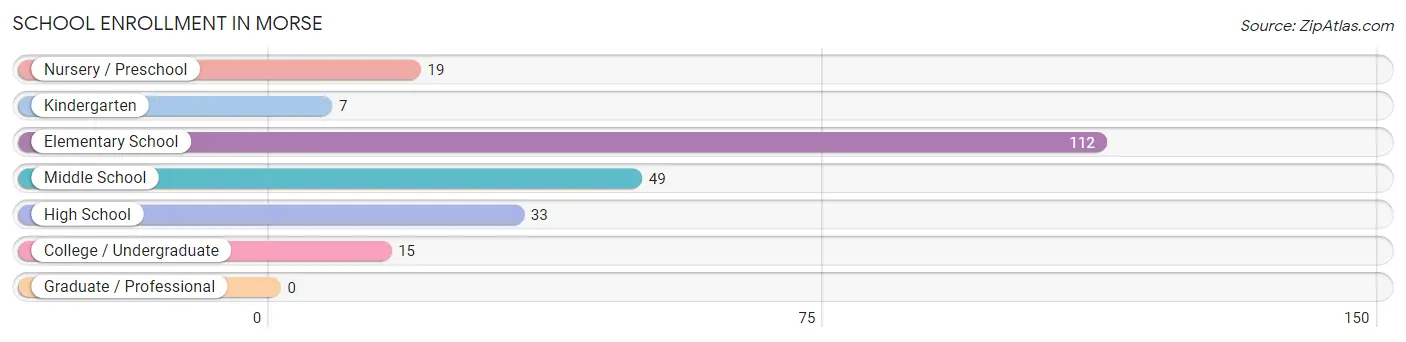
The most common levels of schooling among the 235 students in Morse are elementary school (112 | 47.7%), middle school (49 | 20.8%), and high school (33 | 14.0%).
| School Level | # Students | % Students |
| Nursery / Preschool | 19 | 8.1% |
| Kindergarten | 7 | 3.0% |
| Elementary School | 112 | 47.7% |
| Middle School | 49 | 20.8% |
| High School | 33 | 14.0% |
| College / Undergraduate | 15 | 6.4% |
| Graduate / Professional | 0 | 0.0% |
| Total | 235 | 100.0% |
School Enrollment by Age by Funding Source in Morse
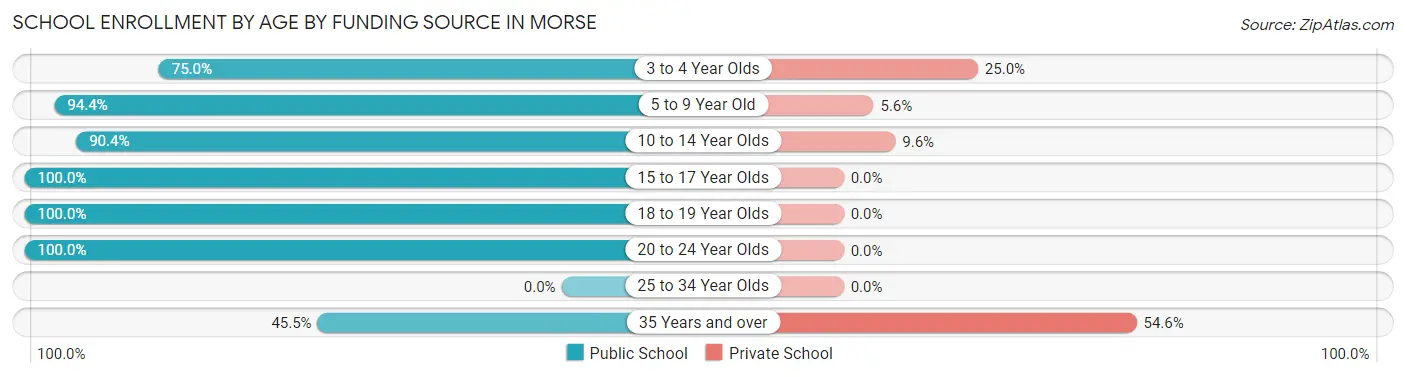
Out of a total of 235 students who are enrolled in schools in Morse, 21 (8.9%) attend a private institution, while the remaining 214 (91.1%) are enrolled in public schools. The age group of 35 years and over has the highest likelihood of being enrolled in private schools, with 6 (54.5% in the age bracket) enrolled. Conversely, the age group of 15 to 17 year olds has the lowest likelihood of being enrolled in a private school, with 19 (100.0% in the age bracket) attending a public institution.
| Age Bracket | Public School | Private School |
| 3 to 4 Year Olds | 9 (75.0%) | 3 (25.0%) |
| 5 to 9 Year Old | 119 (94.4%) | 7 (5.6%) |
| 10 to 14 Year Olds | 47 (90.4%) | 5 (9.6%) |
| 15 to 17 Year Olds | 19 (100.0%) | 0 (0.0%) |
| 18 to 19 Year Olds | 12 (100.0%) | 0 (0.0%) |
| 20 to 24 Year Olds | 3 (100.0%) | 0 (0.0%) |
| 25 to 34 Year Olds | 0 (0.0%) | 0 (0.0%) |
| 35 Years and over | 5 (45.5%) | 6 (54.5%) |
| Total | 214 (91.1%) | 21 (8.9%) |
Educational Attainment by Field of Study in Morse
Education (20 | 71.4%), science & technology (4 | 14.3%), and business (4 | 14.3%) are the most common fields of study among 28 individuals in Morse who have obtained a bachelor's degree or higher.
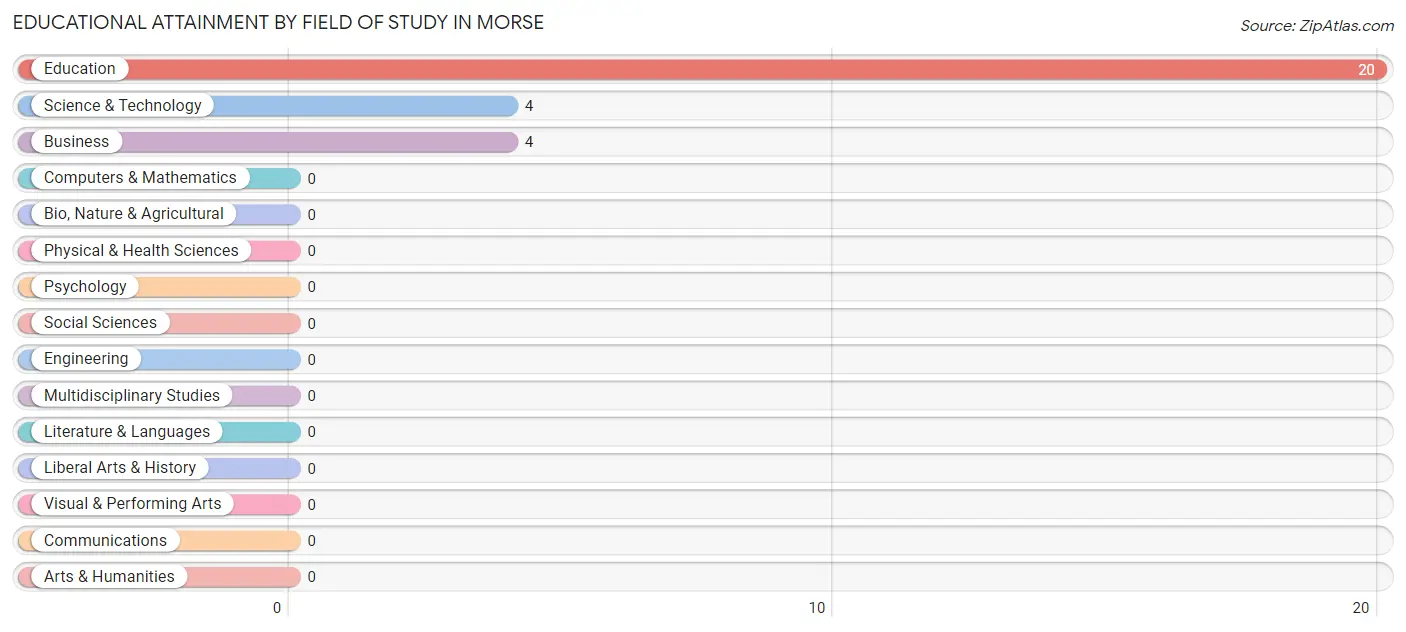
| Field of Study | # Graduates | % Graduates |
| Computers & Mathematics | 0 | 0.0% |
| Bio, Nature & Agricultural | 0 | 0.0% |
| Physical & Health Sciences | 0 | 0.0% |
| Psychology | 0 | 0.0% |
| Social Sciences | 0 | 0.0% |
| Engineering | 0 | 0.0% |
| Multidisciplinary Studies | 0 | 0.0% |
| Science & Technology | 4 | 14.3% |
| Business | 4 | 14.3% |
| Education | 20 | 71.4% |
| Literature & Languages | 0 | 0.0% |
| Liberal Arts & History | 0 | 0.0% |
| Visual & Performing Arts | 0 | 0.0% |
| Communications | 0 | 0.0% |
| Arts & Humanities | 0 | 0.0% |
| Total | 28 | 100.0% |
Transportation & Commute in Morse
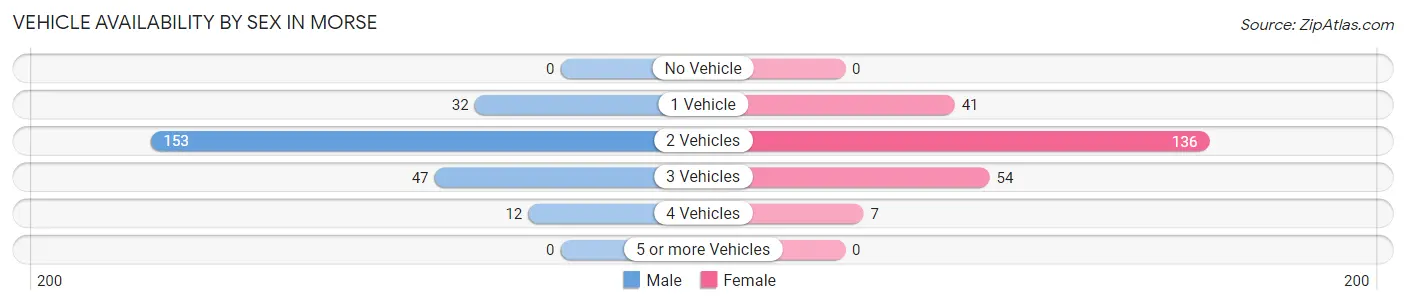
Vehicle Availability by Sex in Morse
The most prevalent vehicle ownership categories in Morse are males with 2 vehicles (153, accounting for 62.7%) and females with 2 vehicles (136, making up 64.3%).
| Vehicles Available | Male | Female |
| No Vehicle | 0 (0.0%) | 0 (0.0%) |
| 1 Vehicle | 32 (13.1%) | 41 (17.2%) |
| 2 Vehicles | 153 (62.7%) | 136 (57.1%) |
| 3 Vehicles | 47 (19.3%) | 54 (22.7%) |
| 4 Vehicles | 12 (4.9%) | 7 (2.9%) |
| 5 or more Vehicles | 0 (0.0%) | 0 (0.0%) |
| Total | 244 (100.0%) | 238 (100.0%) |
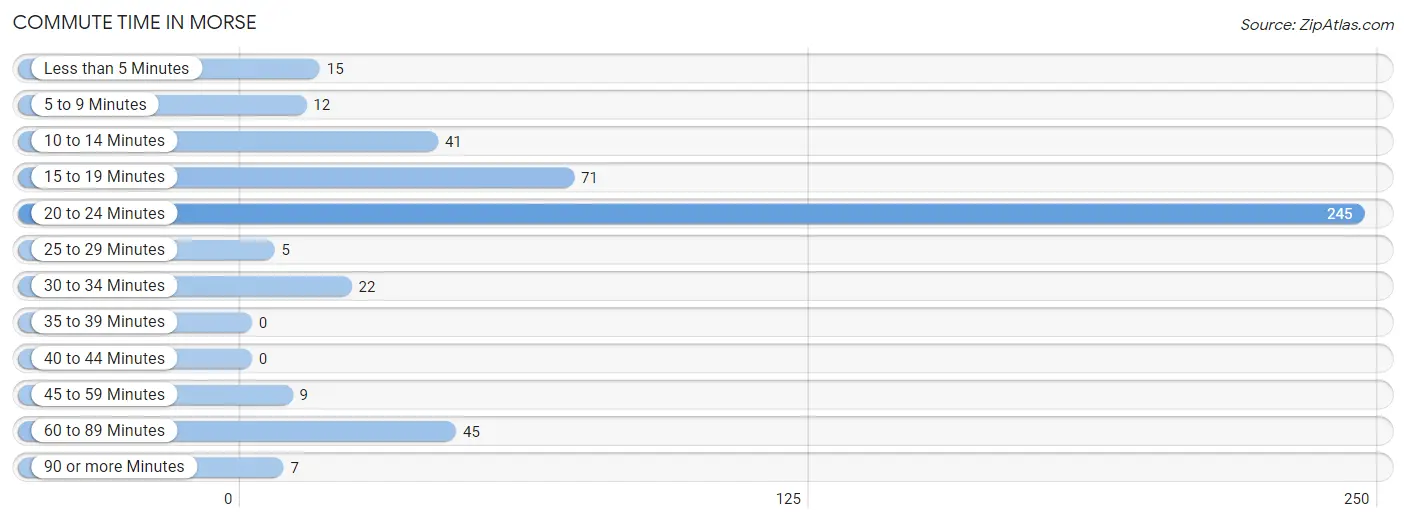
Commute Time in Morse
The most frequently occuring commute durations in Morse are 20 to 24 minutes (245 commuters, 51.9%), 15 to 19 minutes (71 commuters, 15.0%), and 60 to 89 minutes (45 commuters, 9.5%).
| Commute Time | # Commuters | % Commuters |
| Less than 5 Minutes | 15 | 3.2% |
| 5 to 9 Minutes | 12 | 2.5% |
| 10 to 14 Minutes | 41 | 8.7% |
| 15 to 19 Minutes | 71 | 15.0% |
| 20 to 24 Minutes | 245 | 51.9% |
| 25 to 29 Minutes | 5 | 1.1% |
| 30 to 34 Minutes | 22 | 4.7% |
| 35 to 39 Minutes | 0 | 0.0% |
| 40 to 44 Minutes | 0 | 0.0% |
| 45 to 59 Minutes | 9 | 1.9% |
| 60 to 89 Minutes | 45 | 9.5% |
| 90 or more Minutes | 7 | 1.5% |
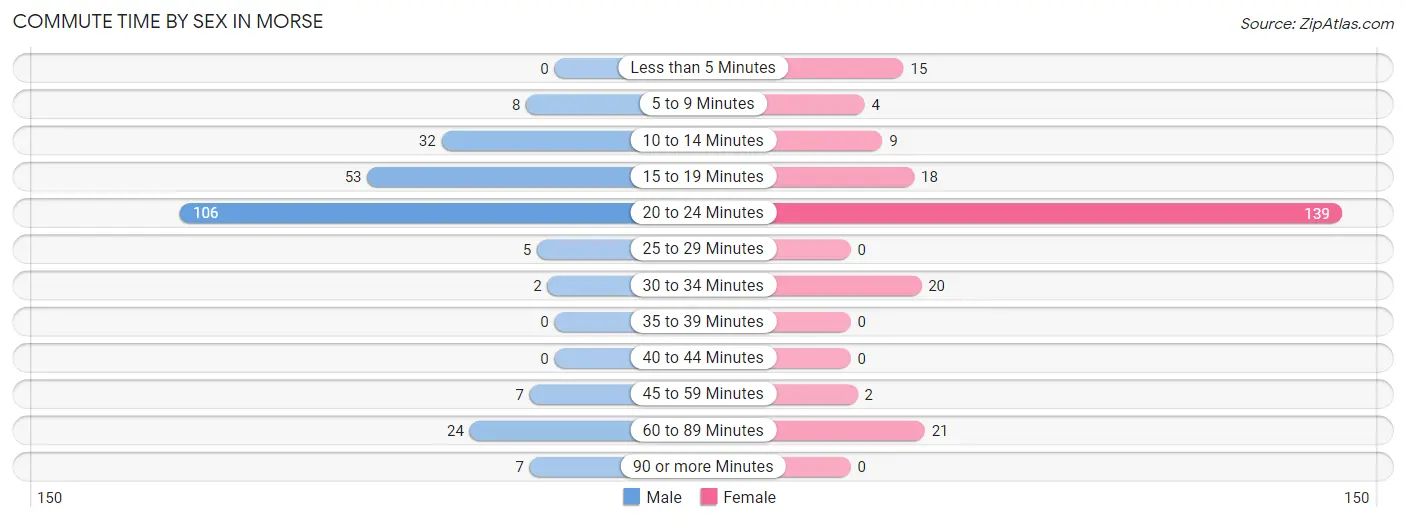
Commute Time by Sex in Morse
The most common commute times in Morse are 20 to 24 minutes (106 commuters, 43.4%) for males and 20 to 24 minutes (139 commuters, 61.0%) for females.
| Commute Time | Male | Female |
| Less than 5 Minutes | 0 (0.0%) | 15 (6.6%) |
| 5 to 9 Minutes | 8 (3.3%) | 4 (1.8%) |
| 10 to 14 Minutes | 32 (13.1%) | 9 (4.0%) |
| 15 to 19 Minutes | 53 (21.7%) | 18 (7.9%) |
| 20 to 24 Minutes | 106 (43.4%) | 139 (61.0%) |
| 25 to 29 Minutes | 5 (2.1%) | 0 (0.0%) |
| 30 to 34 Minutes | 2 (0.8%) | 20 (8.8%) |
| 35 to 39 Minutes | 0 (0.0%) | 0 (0.0%) |
| 40 to 44 Minutes | 0 (0.0%) | 0 (0.0%) |
| 45 to 59 Minutes | 7 (2.9%) | 2 (0.9%) |
| 60 to 89 Minutes | 24 (9.8%) | 21 (9.2%) |
| 90 or more Minutes | 7 (2.9%) | 0 (0.0%) |
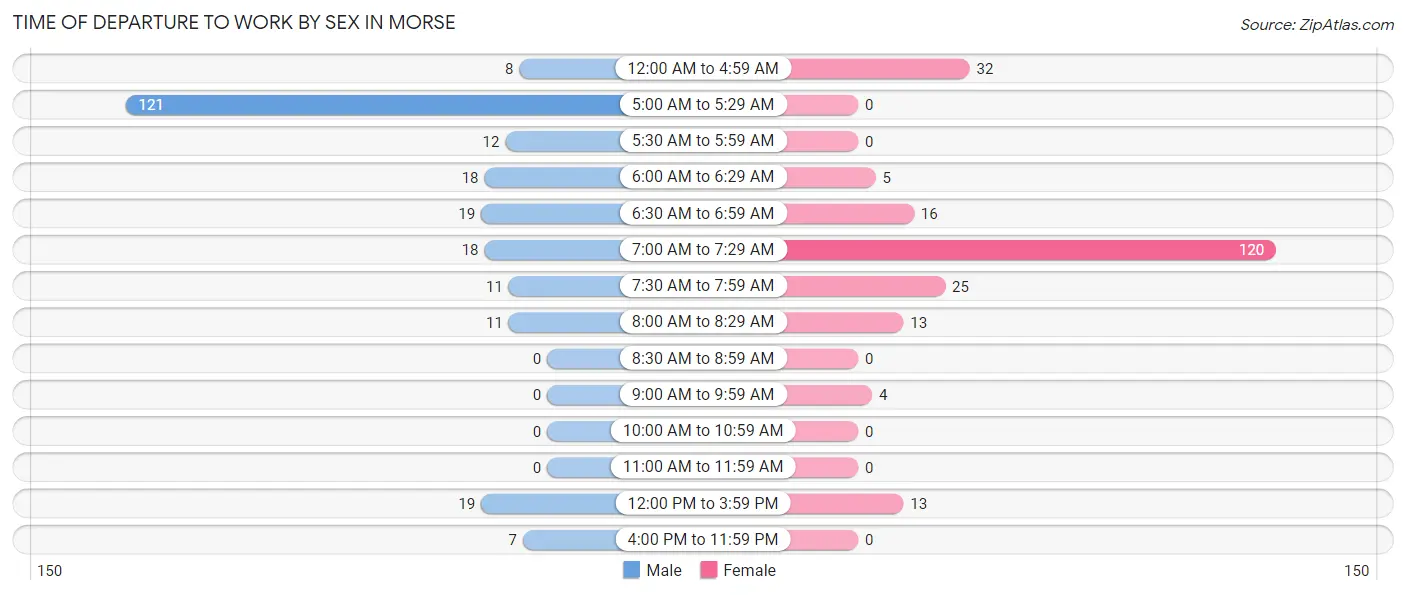
Time of Departure to Work by Sex in Morse
The most frequent times of departure to work in Morse are 5:00 AM to 5:29 AM (121, 49.6%) for males and 7:00 AM to 7:29 AM (120, 52.6%) for females.
| Time of Departure | Male | Female |
| 12:00 AM to 4:59 AM | 8 (3.3%) | 32 (14.0%) |
| 5:00 AM to 5:29 AM | 121 (49.6%) | 0 (0.0%) |
| 5:30 AM to 5:59 AM | 12 (4.9%) | 0 (0.0%) |
| 6:00 AM to 6:29 AM | 18 (7.4%) | 5 (2.2%) |
| 6:30 AM to 6:59 AM | 19 (7.8%) | 16 (7.0%) |
| 7:00 AM to 7:29 AM | 18 (7.4%) | 120 (52.6%) |
| 7:30 AM to 7:59 AM | 11 (4.5%) | 25 (11.0%) |
| 8:00 AM to 8:29 AM | 11 (4.5%) | 13 (5.7%) |
| 8:30 AM to 8:59 AM | 0 (0.0%) | 0 (0.0%) |
| 9:00 AM to 9:59 AM | 0 (0.0%) | 4 (1.8%) |
| 10:00 AM to 10:59 AM | 0 (0.0%) | 0 (0.0%) |
| 11:00 AM to 11:59 AM | 0 (0.0%) | 0 (0.0%) |
| 12:00 PM to 3:59 PM | 19 (7.8%) | 13 (5.7%) |
| 4:00 PM to 11:59 PM | 7 (2.9%) | 0 (0.0%) |
| Total | 244 (100.0%) | 228 (100.0%) |
Housing Occupancy in Morse
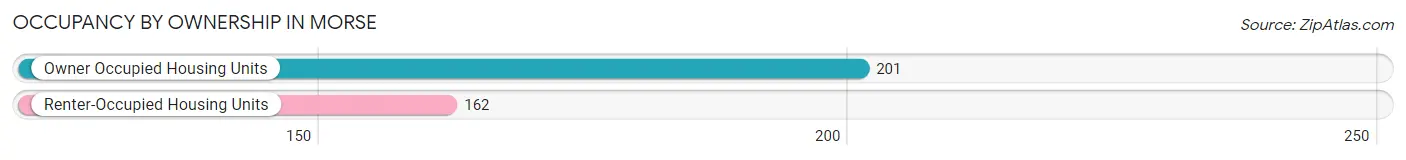
Occupancy by Ownership in Morse
Of the total 363 dwellings in Morse, owner-occupied units account for 201 (55.4%), while renter-occupied units make up 162 (44.6%).
| Occupancy | # Housing Units | % Housing Units |
| Owner Occupied Housing Units | 201 | 55.4% |
| Renter-Occupied Housing Units | 162 | 44.6% |
| Total Occupied Housing Units | 363 | 100.0% |
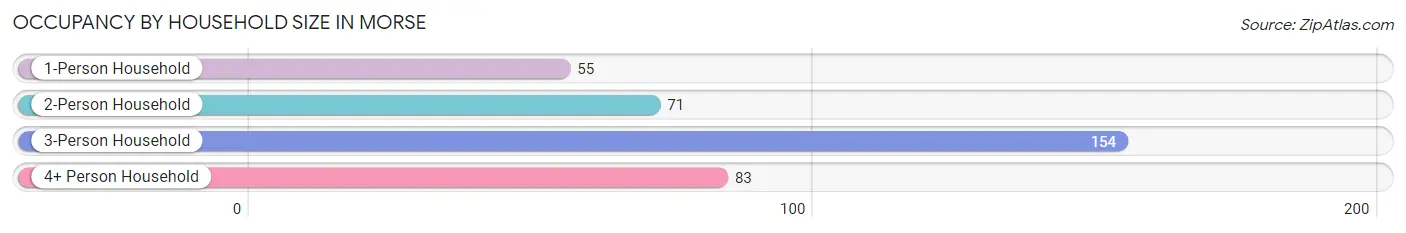
Occupancy by Household Size in Morse
| Household Size | # Housing Units | % Housing Units |
| 1-Person Household | 55 | 15.1% |
| 2-Person Household | 71 | 19.6% |
| 3-Person Household | 154 | 42.4% |
| 4+ Person Household | 83 | 22.9% |
| Total Housing Units | 363 | 100.0% |
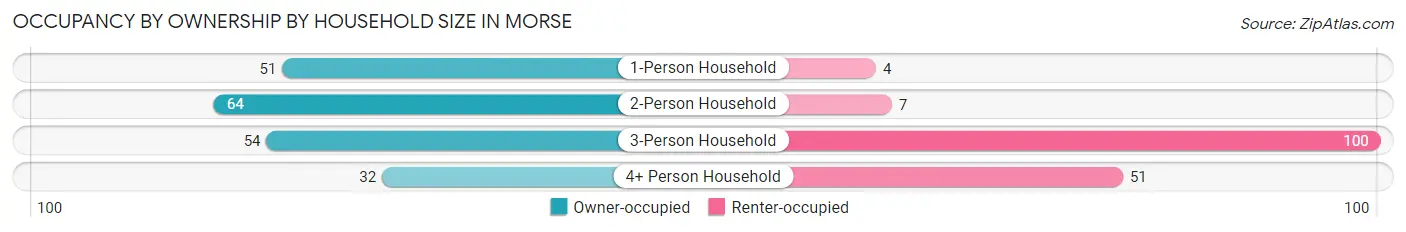
Occupancy by Ownership by Household Size in Morse
| Household Size | Owner-occupied | Renter-occupied |
| 1-Person Household | 51 (92.7%) | 4 (7.3%) |
| 2-Person Household | 64 (90.1%) | 7 (9.9%) |
| 3-Person Household | 54 (35.1%) | 100 (64.9%) |
| 4+ Person Household | 32 (38.6%) | 51 (61.5%) |
| Total Housing Units | 201 (55.4%) | 162 (44.6%) |
Occupancy by Educational Attainment in Morse
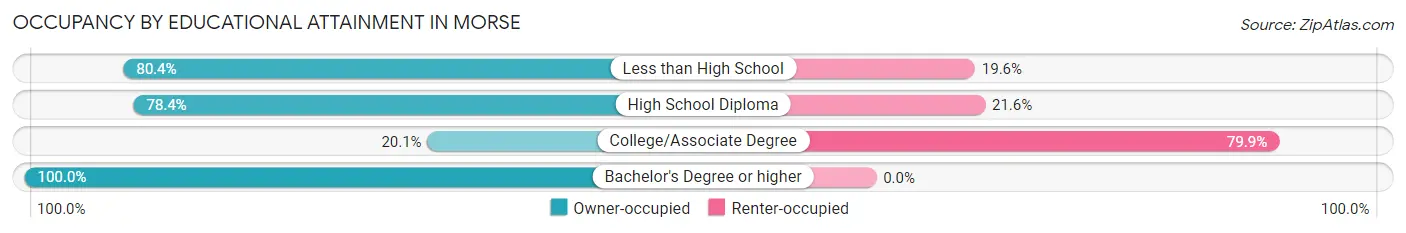
| Household Size | Owner-occupied | Renter-occupied |
| Less than High School | 37 (80.4%) | 9 (19.6%) |
| High School Diploma | 109 (78.4%) | 30 (21.6%) |
| College/Associate Degree | 31 (20.1%) | 123 (79.9%) |
| Bachelor's Degree or higher | 24 (100.0%) | 0 (0.0%) |
Occupancy by Age of Householder in Morse
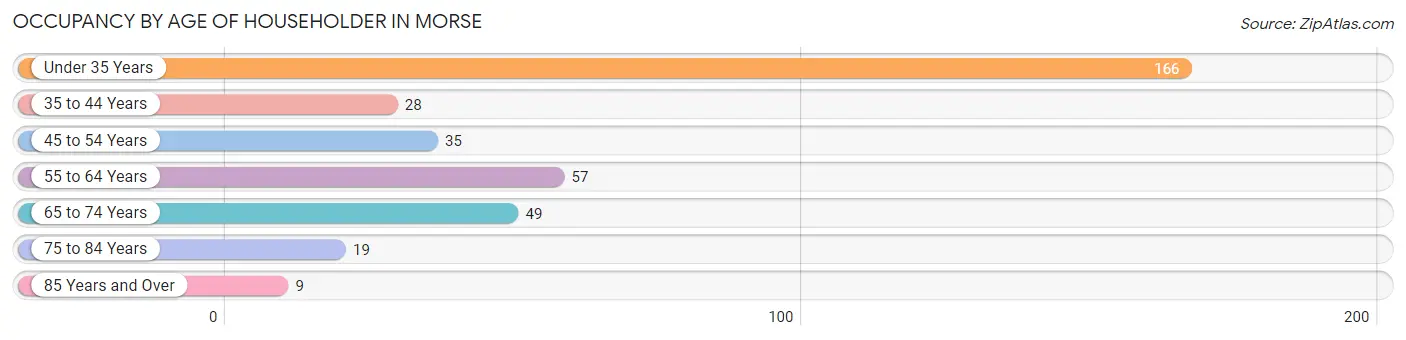
| Age Bracket | # Households | % Households |
| Under 35 Years | 166 | 45.7% |
| 35 to 44 Years | 28 | 7.7% |
| 45 to 54 Years | 35 | 9.6% |
| 55 to 64 Years | 57 | 15.7% |
| 65 to 74 Years | 49 | 13.5% |
| 75 to 84 Years | 19 | 5.2% |
| 85 Years and Over | 9 | 2.5% |
| Total | 363 | 100.0% |
Housing Finances in Morse
Median Income by Occupancy in Morse
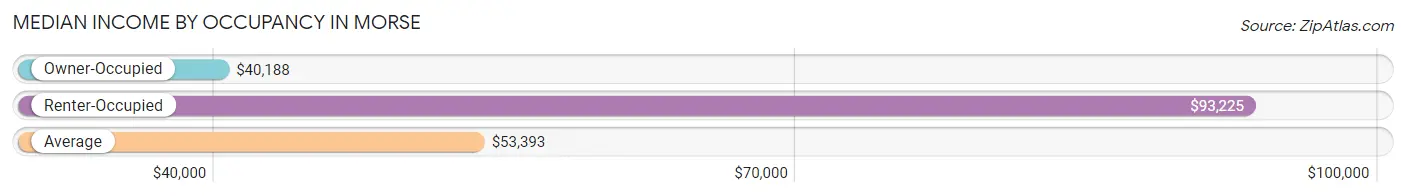
| Occupancy Type | # Households | Median Income |
| Owner-Occupied | 201 (55.4%) | $40,188 |
| Renter-Occupied | 162 (44.6%) | $93,225 |
| Average | 363 (100.0%) | $53,393 |
Occupancy by Householder Income Bracket in Morse
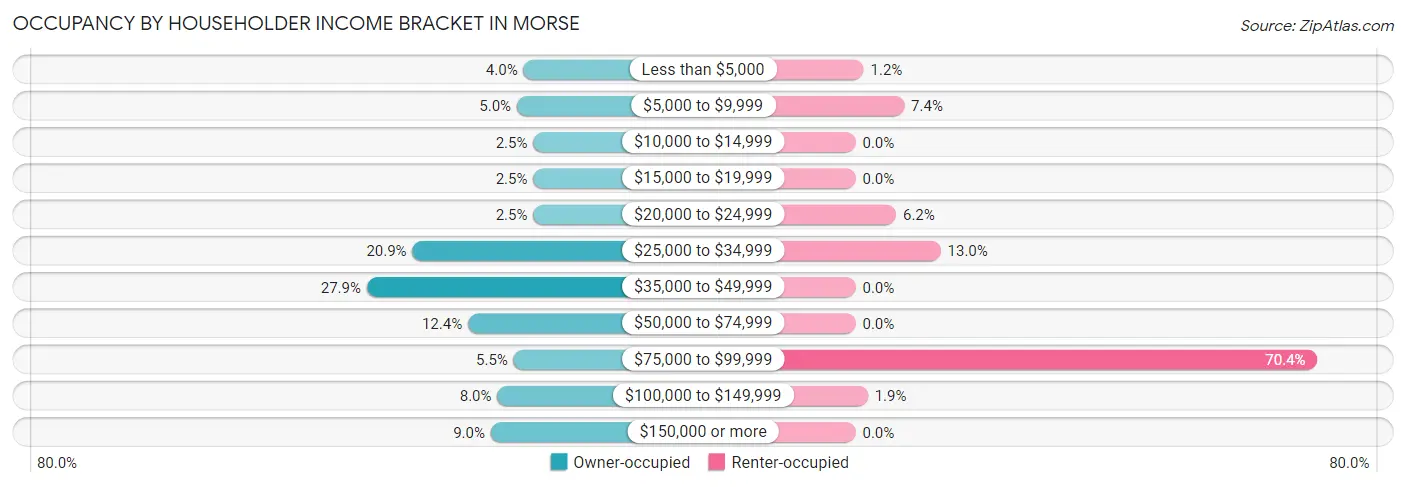
| Income Bracket | Owner-occupied | Renter-occupied |
| Less than $5,000 | 8 (4.0%) | 2 (1.2%) |
| $5,000 to $9,999 | 10 (5.0%) | 12 (7.4%) |
| $10,000 to $14,999 | 5 (2.5%) | 0 (0.0%) |
| $15,000 to $19,999 | 5 (2.5%) | 0 (0.0%) |
| $20,000 to $24,999 | 5 (2.5%) | 10 (6.2%) |
| $25,000 to $34,999 | 42 (20.9%) | 21 (13.0%) |
| $35,000 to $49,999 | 56 (27.9%) | 0 (0.0%) |
| $50,000 to $74,999 | 25 (12.4%) | 0 (0.0%) |
| $75,000 to $99,999 | 11 (5.5%) | 114 (70.4%) |
| $100,000 to $149,999 | 16 (8.0%) | 3 (1.8%) |
| $150,000 or more | 18 (9.0%) | 0 (0.0%) |
| Total | 201 (100.0%) | 162 (100.0%) |
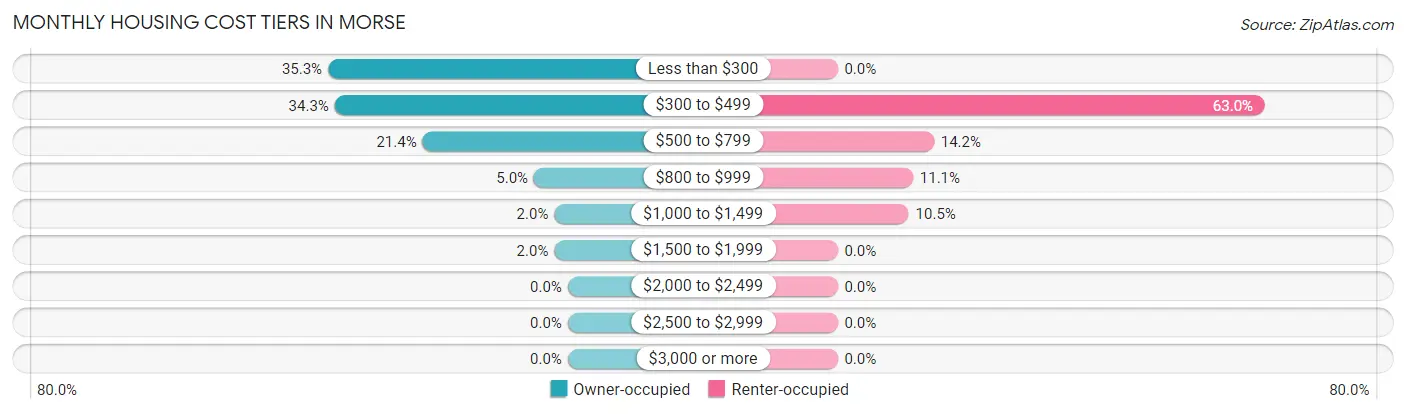
Monthly Housing Cost Tiers in Morse
| Monthly Cost | Owner-occupied | Renter-occupied |
| Less than $300 | 71 (35.3%) | 0 (0.0%) |
| $300 to $499 | 69 (34.3%) | 102 (63.0%) |
| $500 to $799 | 43 (21.4%) | 23 (14.2%) |
| $800 to $999 | 10 (5.0%) | 18 (11.1%) |
| $1,000 to $1,499 | 4 (2.0%) | 17 (10.5%) |
| $1,500 to $1,999 | 4 (2.0%) | 0 (0.0%) |
| $2,000 to $2,499 | 0 (0.0%) | 0 (0.0%) |
| $2,500 to $2,999 | 0 (0.0%) | 0 (0.0%) |
| $3,000 or more | 0 (0.0%) | 0 (0.0%) |
| Total | 201 (100.0%) | 162 (100.0%) |
Physical Housing Characteristics in Morse
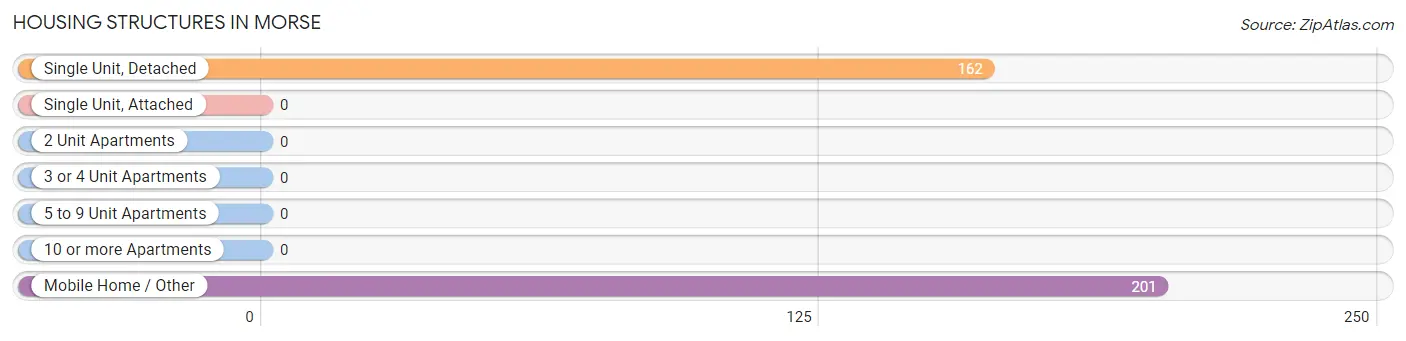
Housing Structures in Morse
| Structure Type | # Housing Units | % Housing Units |
| Single Unit, Detached | 162 | 44.6% |
| Single Unit, Attached | 0 | 0.0% |
| 2 Unit Apartments | 0 | 0.0% |
| 3 or 4 Unit Apartments | 0 | 0.0% |
| 5 to 9 Unit Apartments | 0 | 0.0% |
| 10 or more Apartments | 0 | 0.0% |
| Mobile Home / Other | 201 | 55.4% |
| Total | 363 | 100.0% |
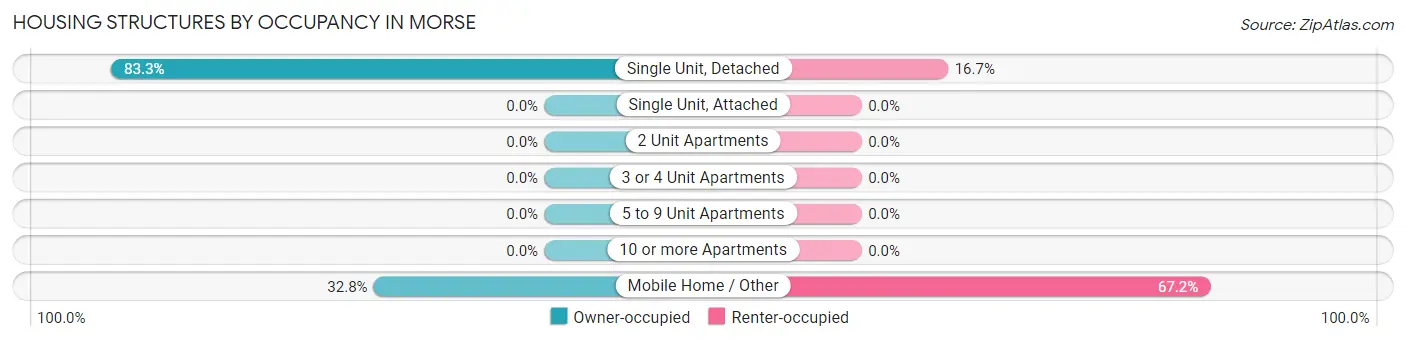
Housing Structures by Occupancy in Morse
| Structure Type | Owner-occupied | Renter-occupied |
| Single Unit, Detached | 135 (83.3%) | 27 (16.7%) |
| Single Unit, Attached | 0 (0.0%) | 0 (0.0%) |
| 2 Unit Apartments | 0 (0.0%) | 0 (0.0%) |
| 3 or 4 Unit Apartments | 0 (0.0%) | 0 (0.0%) |
| 5 to 9 Unit Apartments | 0 (0.0%) | 0 (0.0%) |
| 10 or more Apartments | 0 (0.0%) | 0 (0.0%) |
| Mobile Home / Other | 66 (32.8%) | 135 (67.2%) |
| Total | 201 (55.4%) | 162 (44.6%) |
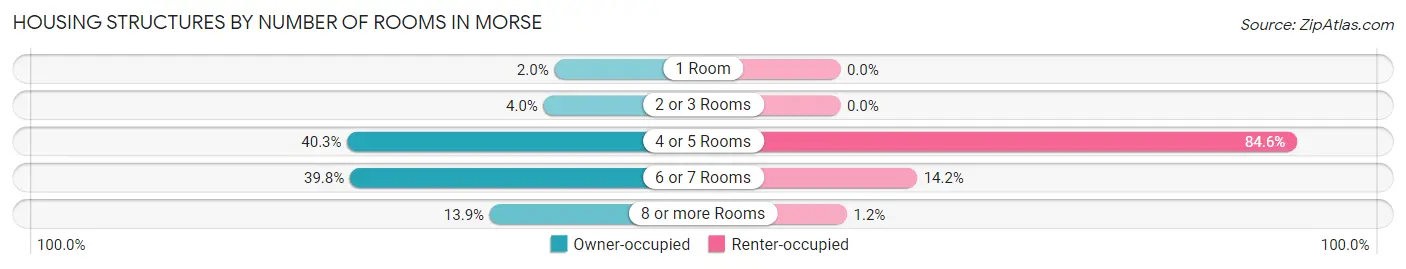
Housing Structures by Number of Rooms in Morse
| Number of Rooms | Owner-occupied | Renter-occupied |
| 1 Room | 4 (2.0%) | 0 (0.0%) |
| 2 or 3 Rooms | 8 (4.0%) | 0 (0.0%) |
| 4 or 5 Rooms | 81 (40.3%) | 137 (84.6%) |
| 6 or 7 Rooms | 80 (39.8%) | 23 (14.2%) |
| 8 or more Rooms | 28 (13.9%) | 2 (1.2%) |
| Total | 201 (100.0%) | 162 (100.0%) |
Housing Structure by Heating Type in Morse
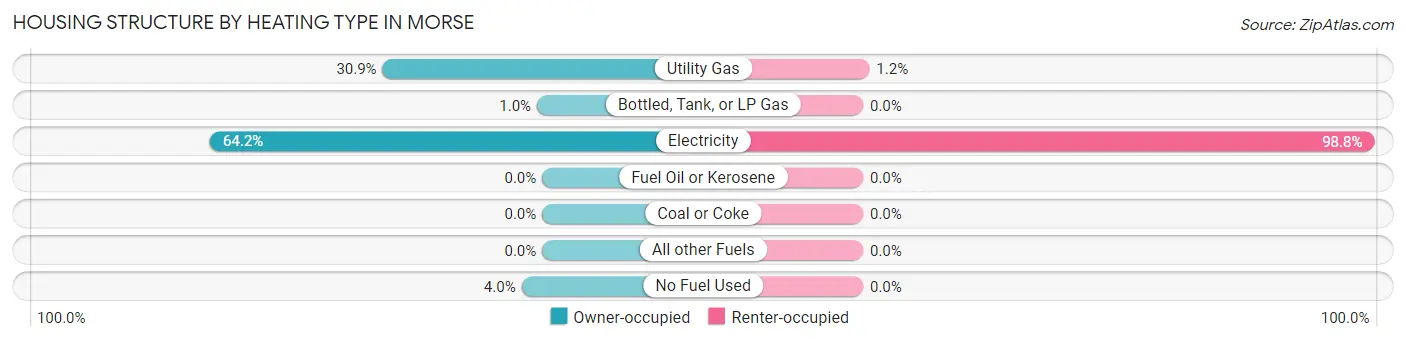
| Heating Type | Owner-occupied | Renter-occupied |
| Utility Gas | 62 (30.8%) | 2 (1.2%) |
| Bottled, Tank, or LP Gas | 2 (1.0%) | 0 (0.0%) |
| Electricity | 129 (64.2%) | 160 (98.8%) |
| Fuel Oil or Kerosene | 0 (0.0%) | 0 (0.0%) |
| Coal or Coke | 0 (0.0%) | 0 (0.0%) |
| All other Fuels | 0 (0.0%) | 0 (0.0%) |
| No Fuel Used | 8 (4.0%) | 0 (0.0%) |
| Total | 201 (100.0%) | 162 (100.0%) |
Household Vehicle Usage in Morse
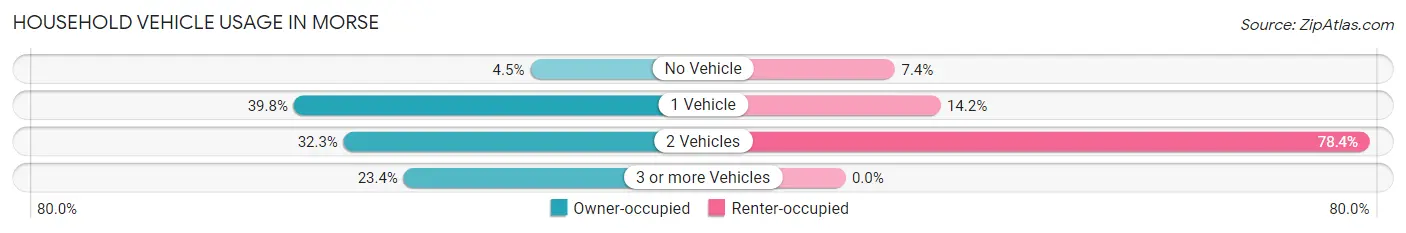
| Vehicles per Household | Owner-occupied | Renter-occupied |
| No Vehicle | 9 (4.5%) | 12 (7.4%) |
| 1 Vehicle | 80 (39.8%) | 23 (14.2%) |
| 2 Vehicles | 65 (32.3%) | 127 (78.4%) |
| 3 or more Vehicles | 47 (23.4%) | 0 (0.0%) |
| Total | 201 (100.0%) | 162 (100.0%) |
Real Estate & Mortgages in Morse
Real Estate and Mortgage Overview in Morse
| Characteristic | Without Mortgage | With Mortgage |
| Housing Units | 151 | 50 |
| Median Property Value | $84,000 | $61,400 |
| Median Household Income | $36,688 | $16 |
| Monthly Housing Costs | $315 | $0 |
| Real Estate Taxes | $199 | $20 |
Property Value by Mortgage Status in Morse
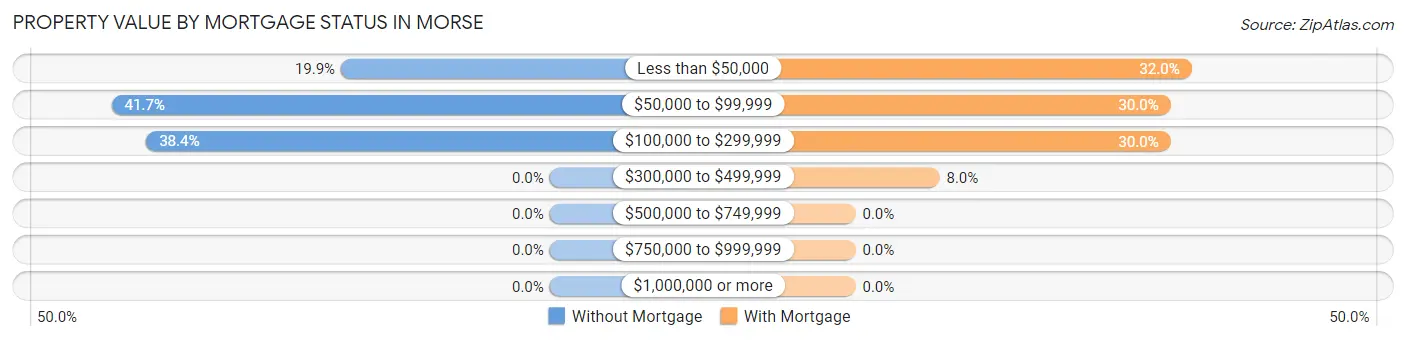
| Property Value | Without Mortgage | With Mortgage |
| Less than $50,000 | 30 (19.9%) | 16 (32.0%) |
| $50,000 to $99,999 | 63 (41.7%) | 15 (30.0%) |
| $100,000 to $299,999 | 58 (38.4%) | 15 (30.0%) |
| $300,000 to $499,999 | 0 (0.0%) | 4 (8.0%) |
| $500,000 to $749,999 | 0 (0.0%) | 0 (0.0%) |
| $750,000 to $999,999 | 0 (0.0%) | 0 (0.0%) |
| $1,000,000 or more | 0 (0.0%) | 0 (0.0%) |
| Total | 151 (100.0%) | 50 (100.0%) |
Household Income by Mortgage Status in Morse
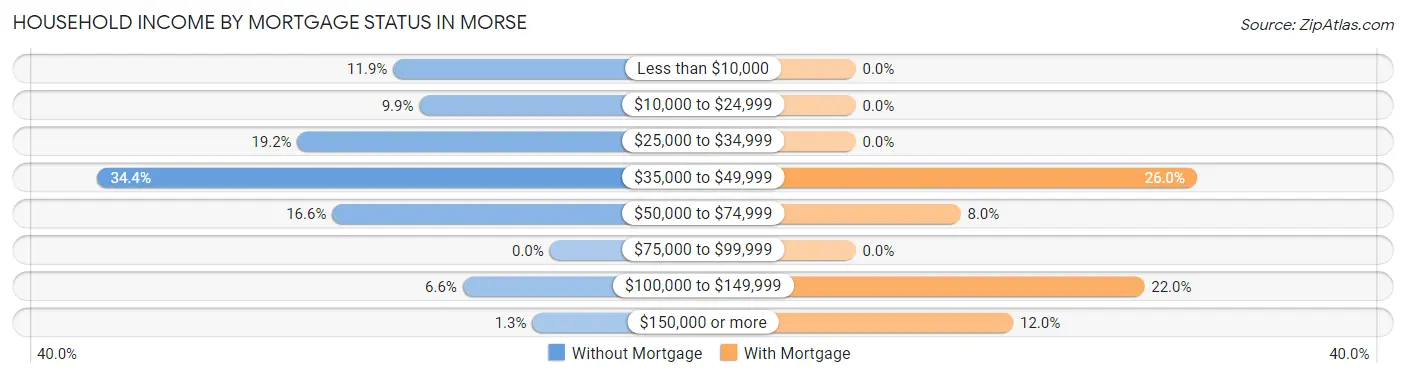
| Household Income | Without Mortgage | With Mortgage |
| Less than $10,000 | 18 (11.9%) | 0 (0.0%) |
| $10,000 to $24,999 | 15 (9.9%) | 0 (0.0%) |
| $25,000 to $34,999 | 29 (19.2%) | 0 (0.0%) |
| $35,000 to $49,999 | 52 (34.4%) | 13 (26.0%) |
| $50,000 to $74,999 | 25 (16.6%) | 4 (8.0%) |
| $75,000 to $99,999 | 0 (0.0%) | 0 (0.0%) |
| $100,000 to $149,999 | 10 (6.6%) | 11 (22.0%) |
| $150,000 or more | 2 (1.3%) | 6 (12.0%) |
| Total | 151 (100.0%) | 50 (100.0%) |
Property Value to Household Income Ratio in Morse
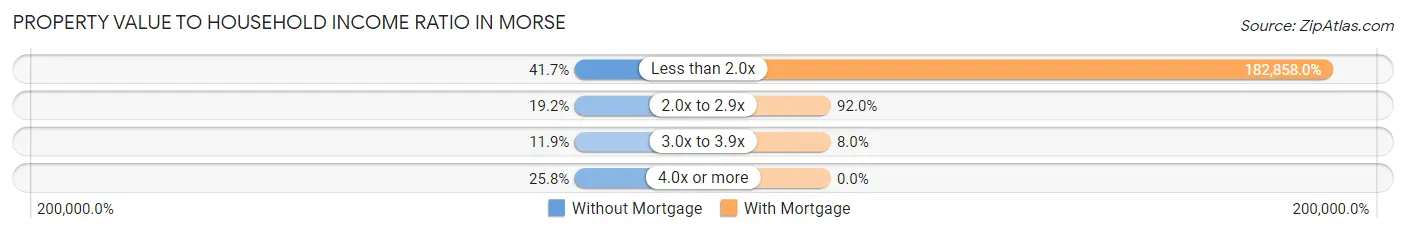
| Value-to-Income Ratio | Without Mortgage | With Mortgage |
| Less than 2.0x | 63 (41.7%) | 91,429 (182,858.0%) |
| 2.0x to 2.9x | 29 (19.2%) | 46 (92.0%) |
| 3.0x to 3.9x | 18 (11.9%) | 4 (8.0%) |
| 4.0x or more | 39 (25.8%) | 0 (0.0%) |
| Total | 151 (100.0%) | 50 (100.0%) |
Real Estate Taxes by Mortgage Status in Morse
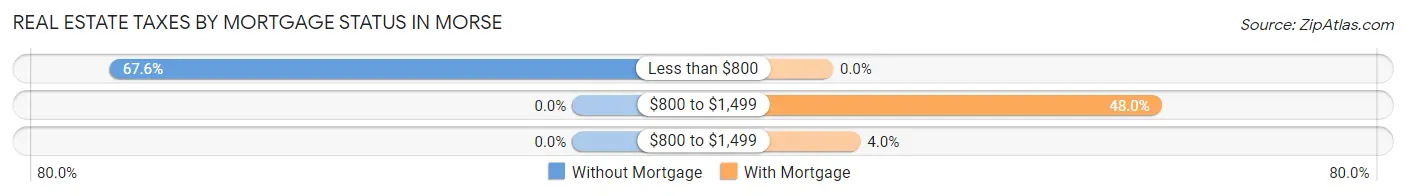
| Property Taxes | Without Mortgage | With Mortgage |
| Less than $800 | 102 (67.5%) | 0 (0.0%) |
| $800 to $1,499 | 0 (0.0%) | 24 (48.0%) |
| $800 to $1,499 | 0 (0.0%) | 2 (4.0%) |
| Total | 151 (100.0%) | 50 (100.0%) |
Health & Disability in Morse
Health Insurance Coverage by Age in Morse
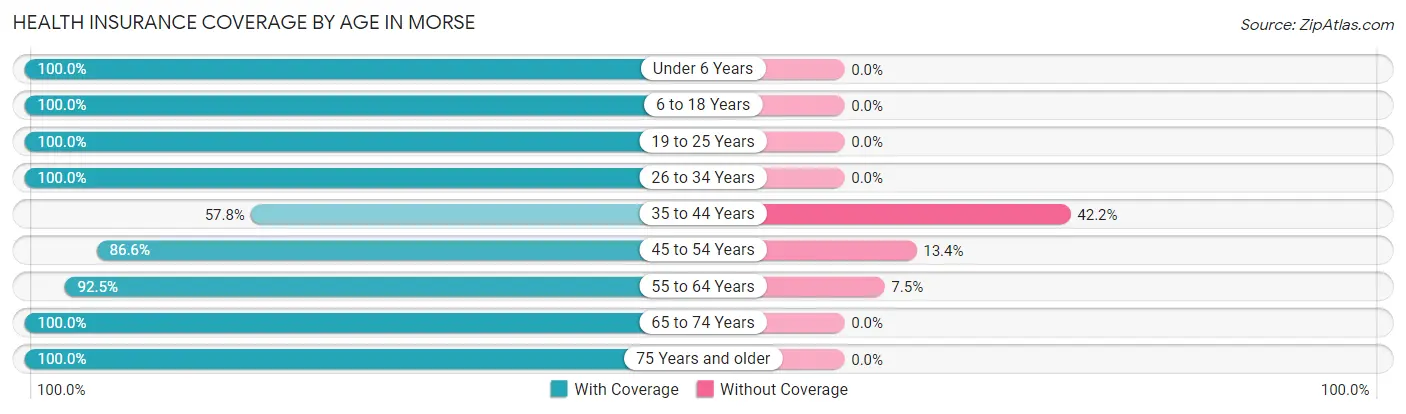
| Age Bracket | With Coverage | Without Coverage |
| Under 6 Years | 158 (100.0%) | 0 (0.0%) |
| 6 to 18 Years | 202 (100.0%) | 0 (0.0%) |
| 19 to 25 Years | 21 (100.0%) | 0 (0.0%) |
| 26 to 34 Years | 334 (100.0%) | 0 (0.0%) |
| 35 to 44 Years | 59 (57.8%) | 43 (42.2%) |
| 45 to 54 Years | 58 (86.6%) | 9 (13.4%) |
| 55 to 64 Years | 99 (92.5%) | 8 (7.5%) |
| 65 to 74 Years | 85 (100.0%) | 0 (0.0%) |
| 75 Years and older | 35 (100.0%) | 0 (0.0%) |
| Total | 1,051 (94.6%) | 60 (5.4%) |
Health Insurance Coverage by Citizenship Status in Morse
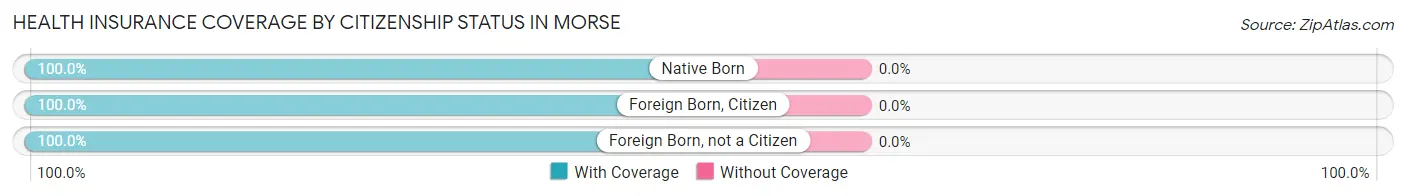
| Citizenship Status | With Coverage | Without Coverage |
| Native Born | 158 (100.0%) | 0 (0.0%) |
| Foreign Born, Citizen | 202 (100.0%) | 0 (0.0%) |
| Foreign Born, not a Citizen | 21 (100.0%) | 0 (0.0%) |
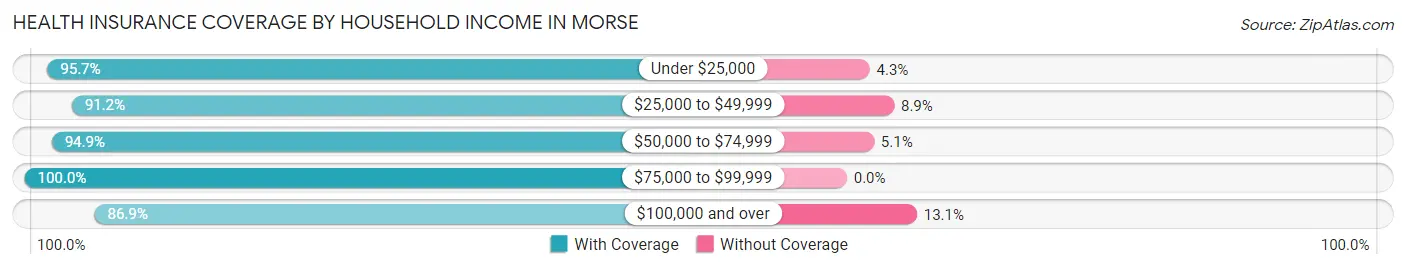
Health Insurance Coverage by Household Income in Morse
| Household Income | With Coverage | Without Coverage |
| Under $25,000 | 112 (95.7%) | 5 (4.3%) |
| $25,000 to $49,999 | 371 (91.1%) | 36 (8.8%) |
| $50,000 to $74,999 | 56 (94.9%) | 3 (5.1%) |
| $75,000 to $99,999 | 406 (100.0%) | 0 (0.0%) |
| $100,000 and over | 106 (86.9%) | 16 (13.1%) |
Public vs Private Health Insurance Coverage by Age in Morse
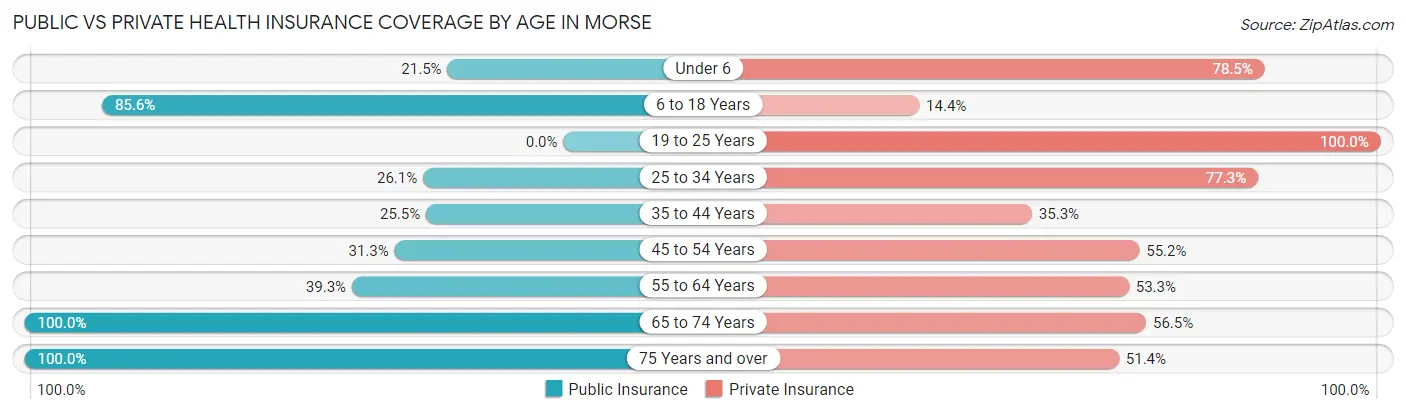
| Age Bracket | Public Insurance | Private Insurance |
| Under 6 | 34 (21.5%) | 124 (78.5%) |
| 6 to 18 Years | 173 (85.6%) | 29 (14.4%) |
| 19 to 25 Years | 0 (0.0%) | 21 (100.0%) |
| 25 to 34 Years | 87 (26.1%) | 258 (77.2%) |
| 35 to 44 Years | 26 (25.5%) | 36 (35.3%) |
| 45 to 54 Years | 21 (31.3%) | 37 (55.2%) |
| 55 to 64 Years | 42 (39.3%) | 57 (53.3%) |
| 65 to 74 Years | 85 (100.0%) | 48 (56.5%) |
| 75 Years and over | 35 (100.0%) | 18 (51.4%) |
| Total | 503 (45.3%) | 628 (56.5%) |
Disability Status by Sex by Age in Morse
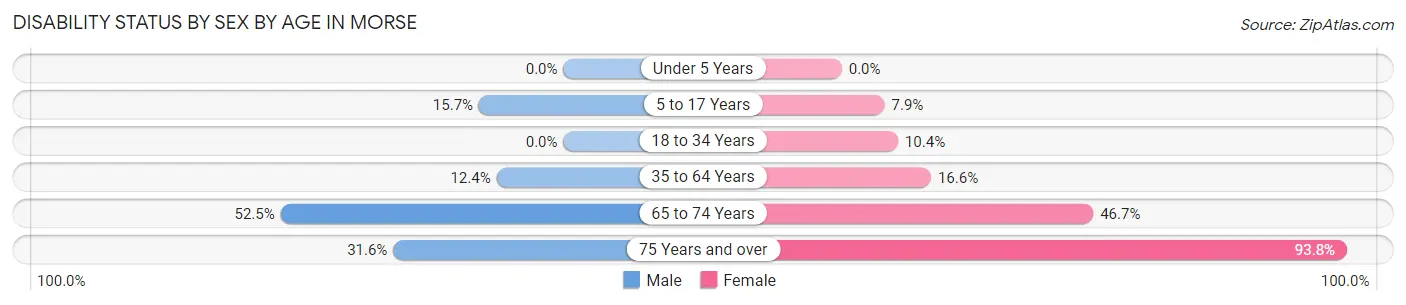
| Age Bracket | Male | Female |
| Under 5 Years | 0 (0.0%) | 0 (0.0%) |
| 5 to 17 Years | 21 (15.7%) | 5 (7.9%) |
| 18 to 34 Years | 0 (0.0%) | 22 (10.4%) |
| 35 to 64 Years | 17 (12.4%) | 23 (16.6%) |
| 65 to 74 Years | 21 (52.5%) | 21 (46.7%) |
| 75 Years and over | 6 (31.6%) | 15 (93.8%) |
Disability Class by Sex by Age in Morse
Disability Class: Hearing Difficulty
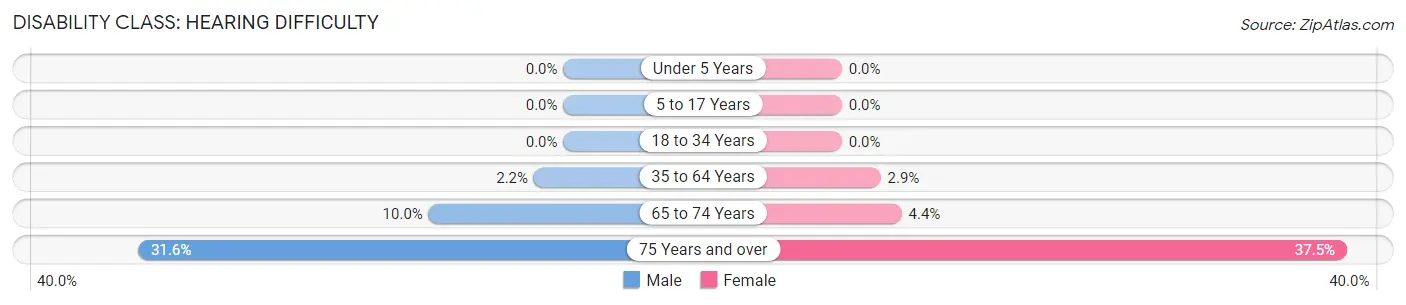
| Age Bracket | Male | Female |
| Under 5 Years | 0 (0.0%) | 0 (0.0%) |
| 5 to 17 Years | 0 (0.0%) | 0 (0.0%) |
| 18 to 34 Years | 0 (0.0%) | 0 (0.0%) |
| 35 to 64 Years | 3 (2.2%) | 4 (2.9%) |
| 65 to 74 Years | 4 (10.0%) | 2 (4.4%) |
| 75 Years and over | 6 (31.6%) | 6 (37.5%) |
Disability Class: Vision Difficulty
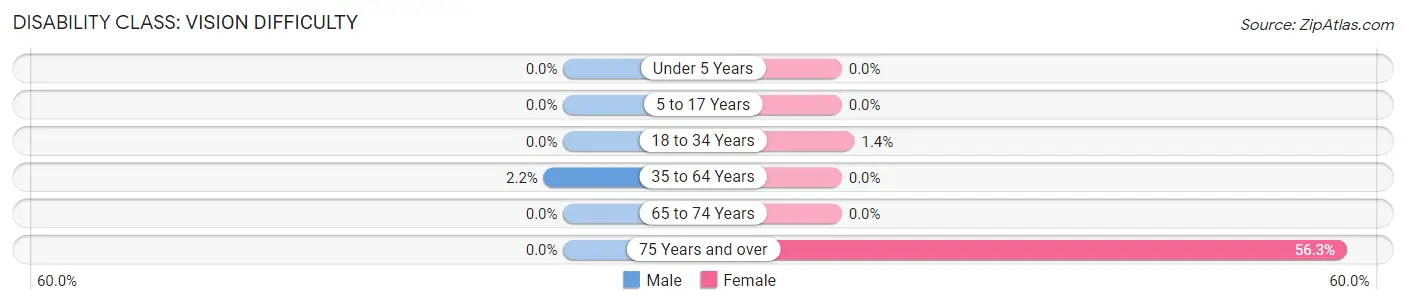
| Age Bracket | Male | Female |
| Under 5 Years | 0 (0.0%) | 0 (0.0%) |
| 5 to 17 Years | 0 (0.0%) | 0 (0.0%) |
| 18 to 34 Years | 0 (0.0%) | 3 (1.4%) |
| 35 to 64 Years | 3 (2.2%) | 0 (0.0%) |
| 65 to 74 Years | 0 (0.0%) | 0 (0.0%) |
| 75 Years and over | 0 (0.0%) | 9 (56.2%) |
Disability Class: Cognitive Difficulty
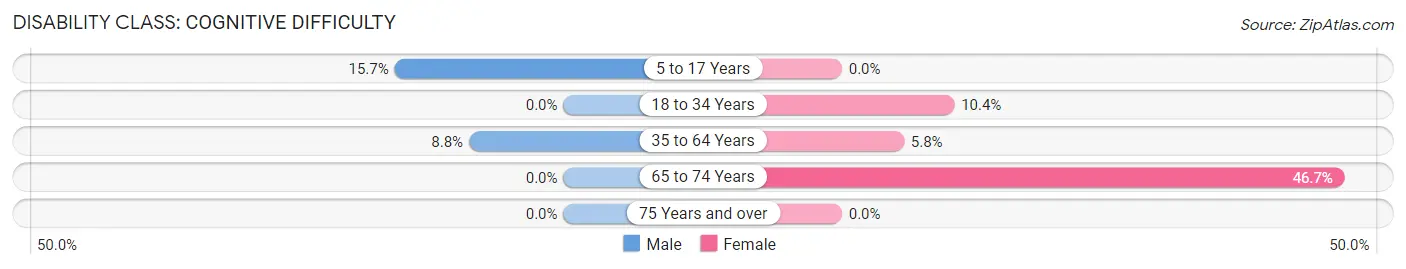
| Age Bracket | Male | Female |
| 5 to 17 Years | 21 (15.7%) | 0 (0.0%) |
| 18 to 34 Years | 0 (0.0%) | 22 (10.4%) |
| 35 to 64 Years | 12 (8.8%) | 8 (5.8%) |
| 65 to 74 Years | 0 (0.0%) | 21 (46.7%) |
| 75 Years and over | 0 (0.0%) | 0 (0.0%) |
Disability Class: Ambulatory Difficulty
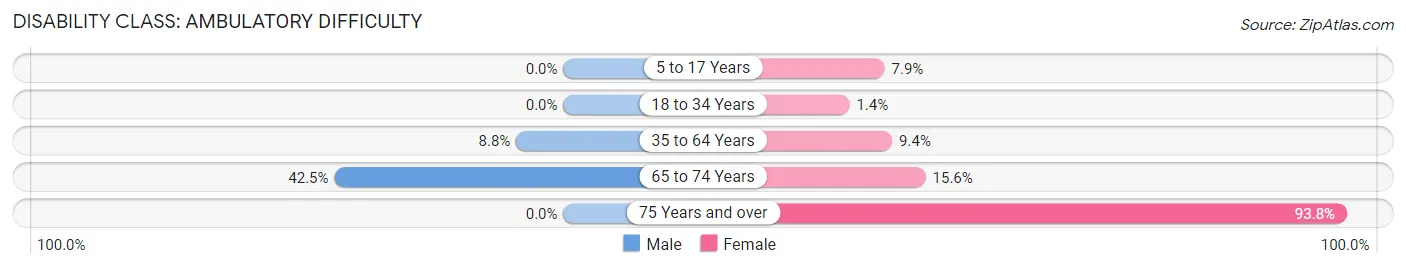
| Age Bracket | Male | Female |
| 5 to 17 Years | 0 (0.0%) | 5 (7.9%) |
| 18 to 34 Years | 0 (0.0%) | 3 (1.4%) |
| 35 to 64 Years | 12 (8.8%) | 13 (9.3%) |
| 65 to 74 Years | 17 (42.5%) | 7 (15.6%) |
| 75 Years and over | 0 (0.0%) | 15 (93.8%) |
Disability Class: Self-Care Difficulty
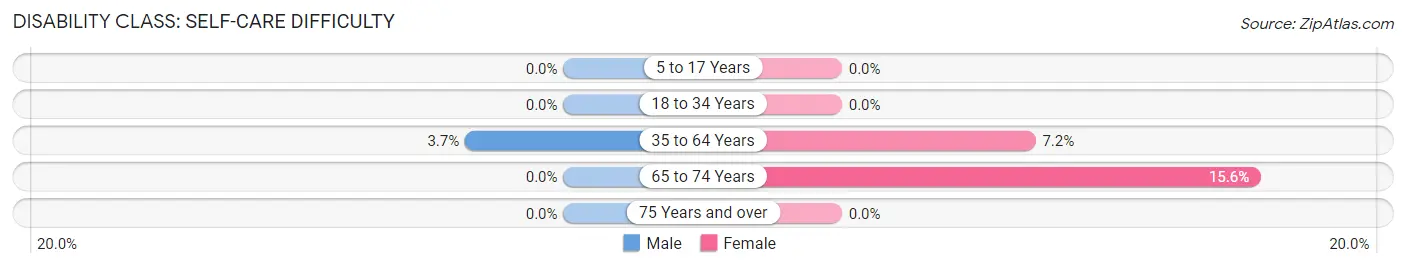
| Age Bracket | Male | Female |
| 5 to 17 Years | 0 (0.0%) | 0 (0.0%) |
| 18 to 34 Years | 0 (0.0%) | 0 (0.0%) |
| 35 to 64 Years | 5 (3.6%) | 10 (7.2%) |
| 65 to 74 Years | 0 (0.0%) | 7 (15.6%) |
| 75 Years and over | 0 (0.0%) | 0 (0.0%) |
Technology Access in Morse
Computing Device Access in Morse
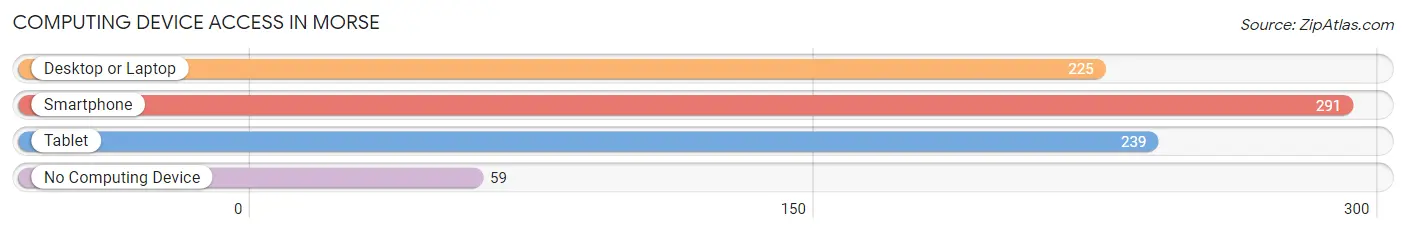
| Device Type | # Households | % Households |
| Desktop or Laptop | 225 | 62.0% |
| Smartphone | 291 | 80.2% |
| Tablet | 239 | 65.8% |
| No Computing Device | 59 | 16.3% |
| Total | 363 | 100.0% |
Internet Access in Morse
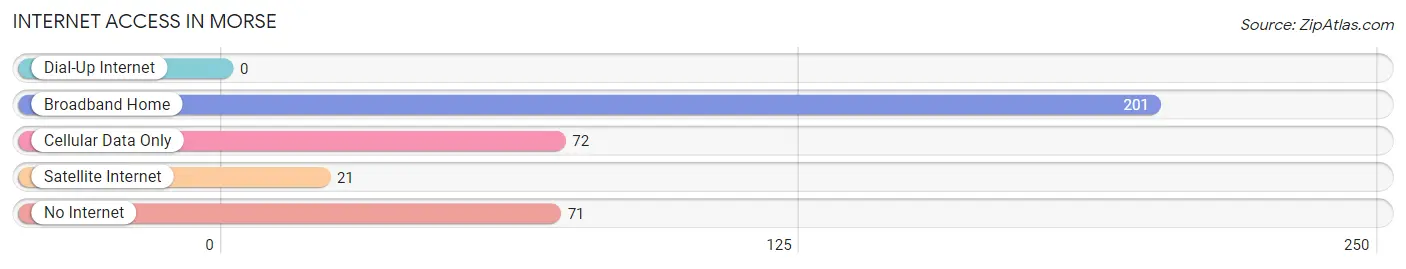
| Internet Type | # Households | % Households |
| Dial-Up Internet | 0 | 0.0% |
| Broadband Home | 201 | 55.4% |
| Cellular Data Only | 72 | 19.8% |
| Satellite Internet | 21 | 5.8% |
| No Internet | 71 | 19.6% |
| Total | 363 | 100.0% |
Morse Summary
Morse is a small town located in the state of Louisiana, in the United States of America. It is situated in the parish of St. Landry, and is part of the Opelousas-Eunice Metropolitan Statistical Area. The town has a population of 1,845 people, according to the 2010 census.
History
Morse was founded in 1883 by the railroad company, the Southern Pacific Railroad. The town was named after the railroad's president, Charles Morse. The town was originally a small farming community, but it soon grew to become a major hub for the railroad. The town was incorporated in 1891, and the first mayor was elected in 1892.
In the early 1900s, the town began to experience a period of growth and prosperity. The railroad brought in new businesses and industries, and the town's population began to grow. The town also became a popular tourist destination, as it was located near the popular tourist destination of Grand Coteau.
In the 1950s, the town began to experience a decline in population and economic activity. The railroad began to move away from the town, and the businesses and industries that had been attracted to the town began to move away as well. The town's population began to decline, and by the 1970s, the town had become a small, rural community.
Geography
Morse is located in the southwestern part of St. Landry Parish, in the state of Louisiana. It is situated at the intersection of U.S. Route 190 and Louisiana Highway 182. The town is located about 25 miles east of Lafayette, and about 50 miles west of Baton Rouge.
The town is situated in a rural area, and is surrounded by farmland and small towns. The town is located in a flat, low-lying area, and is surrounded by swamps and bayous. The town is located near the Atchafalaya River, and is also close to the Gulf of Mexico.
Economy
Morse is a small, rural town, and its economy is largely based on agriculture. The town is home to several farms, and the surrounding area is used for growing crops such as corn, soybeans, and cotton. The town is also home to several small businesses, including a grocery store, a hardware store, and a few restaurants.
The town is also home to a few manufacturing companies, including a furniture factory and a plastics factory. The town is also home to a few small oil and gas companies, which are involved in the exploration and production of oil and gas in the area.
Demographics
According to the 2010 census, the population of Morse was 1,845 people. The town has a population that is predominantly white, with a small African American population. The town also has a small Hispanic population, as well as a small Asian population.
The median household income in Morse is $31,250, and the median family income is $37,500. The town has a poverty rate of 22.3%, which is higher than the national average. The town also has a high unemployment rate, with an unemployment rate of 8.2%.
Conclusion
Morse is a small town located in the state of Louisiana. It was founded in 1883 by the railroad company, the Southern Pacific Railroad, and was named after the railroad's president, Charles Morse. The town has a population of 1,845 people, according to the 2010 census. The town's economy is largely based on agriculture, and it is also home to several small businesses and manufacturing companies. The town has a predominantly white population, with a small African American, Hispanic, and Asian population. The median household income in Morse is $31,250, and the median family income is $37,500. The town has a high poverty rate and a high unemployment rate.
Common Questions
What is Per Capita Income in Morse?
Per Capita income in Morse is $22,043.
What is the Median Family Income in Morse?
Median Family Income in Morse is $90,893.
What is the Median Household income in Morse?
Median Household Income in Morse is $53,393.
What is Income or Wage Gap in Morse?
Income or Wage Gap in Morse is 65.7%.
Women in Morse earn 34.3 cents for every dollar earned by a man.
What is Inequality or Gini Index in Morse?
Inequality or Gini Index in Morse is 0.37.
What is the Total Population of Morse?
Total Population of Morse is 1,111.
What is the Total Male Population of Morse?
Total Male Population of Morse is 509.
What is the Total Female Population of Morse?
Total Female Population of Morse is 602.
What is the Ratio of Males per 100 Females in Morse?
There are 84.55 Males per 100 Females in Morse.
What is the Ratio of Females per 100 Males in Morse?
There are 118.27 Females per 100 Males in Morse.
What is the Median Population Age in Morse?
Median Population Age in Morse is 28.6 Years.
What is the Average Family Size in Morse
Average Family Size in Morse is 3.4 People.
What is the Average Household Size in Morse
Average Household Size in Morse is 3.1 People.
How Large is the Labor Force in Morse?
There are 495 People in the Labor Forcein in Morse.
What is the Percentage of People in the Labor Force in Morse?
63.3% of People are in the Labor Force in Morse.
What is the Unemployment Rate in Morse?
Unemployment Rate in Morse is 1.4%.