Rayne, LA Map & Demographics
Rayne Map
Rayne Overview
$21,218
PER CAPITA INCOME
$41,724
AVG FAMILY INCOME
$34,725
AVG HOUSEHOLD INCOME
54.7%
WAGE / INCOME GAP [ % ]
45.3¢/ $1
WAGE / INCOME GAP [ $ ]
$10,607
FAMILY INCOME DEFICIT
0.46
INEQUALITY / GINI INDEX
7,223
TOTAL POPULATION
3,588
MALE POPULATION
3,635
FEMALE POPULATION
98.71
MALES / 100 FEMALES
101.31
FEMALES / 100 MALES
35.4
MEDIAN AGE
3.4
AVG FAMILY SIZE
2.5
AVG HOUSEHOLD SIZE
3,048
LABOR FORCE [ PEOPLE ]
56.1%
PERCENT IN LABOR FORCE
11.4%
UNEMPLOYMENT RATE
Rayne Zip Codes
Rayne Area Codes
Income in Rayne
Income Overview in Rayne
Per Capita Income in Rayne is $21,218, while median incomes of families and households are $41,724 and $34,725 respectively.
| Characteristic | Number | Measure |
| Per Capita Income | 7,223 | $21,218 |
| Median Family Income | 1,586 | $41,724 |
| Mean Family Income | 1,586 | $60,461 |
| Median Household Income | 2,865 | $34,725 |
| Mean Household Income | 2,865 | $50,378 |
| Income Deficit | 1,586 | $10,607 |
| Wage / Income Gap (%) | 7,223 | 54.74% |
| Wage / Income Gap ($) | 7,223 | 45.26¢ per $1 |
| Gini / Inequality Index | 7,223 | 0.46 |
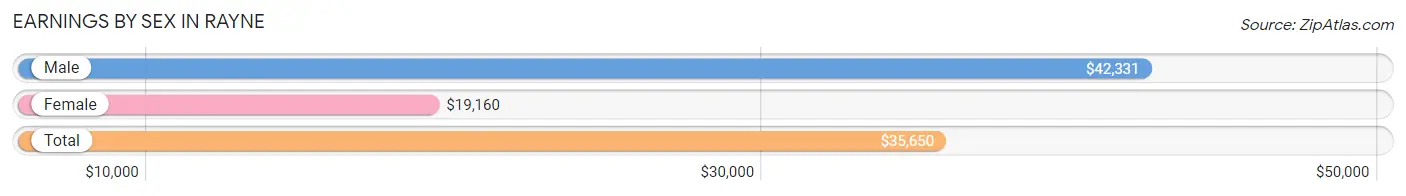
Earnings by Sex in Rayne
Average Earnings in Rayne are $35,650, $42,331 for men and $19,160 for women, a difference of 54.7%.
| Sex | Number | Average Earnings |
| Male | 1,430 (47.8%) | $42,331 |
| Female | 1,561 (52.2%) | $19,160 |
| Total | 2,991 (100.0%) | $35,650 |
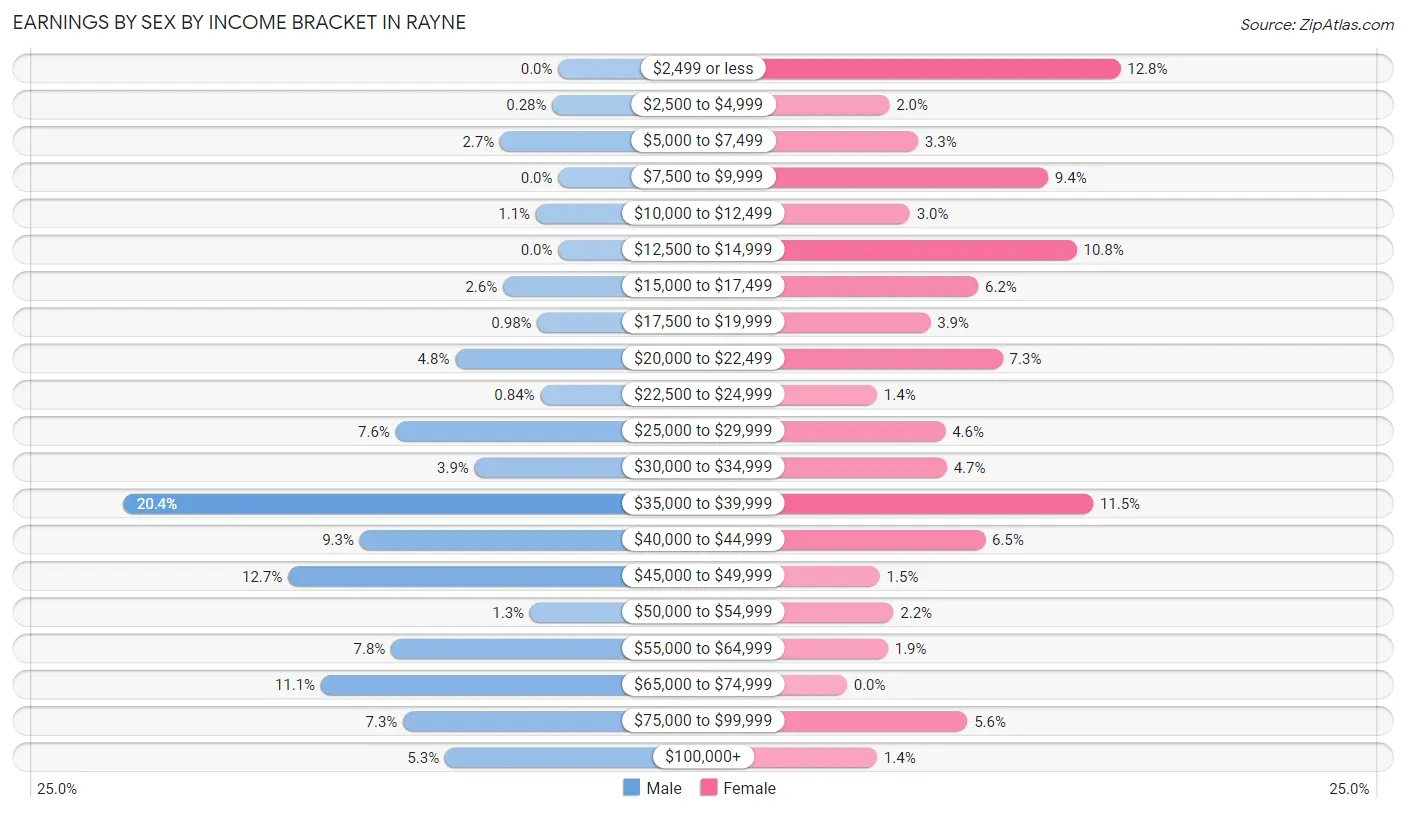
Earnings by Sex by Income Bracket in Rayne
The most common earnings brackets in Rayne are $35,000 to $39,999 for men (291 | 20.3%) and $2,499 or less for women (200 | 12.8%).
| Income | Male | Female |
| $2,499 or less | 0 (0.0%) | 200 (12.8%) |
| $2,500 to $4,999 | 4 (0.3%) | 31 (2.0%) |
| $5,000 to $7,499 | 39 (2.7%) | 52 (3.3%) |
| $7,500 to $9,999 | 0 (0.0%) | 147 (9.4%) |
| $10,000 to $12,499 | 15 (1.1%) | 46 (2.9%) |
| $12,500 to $14,999 | 0 (0.0%) | 168 (10.8%) |
| $15,000 to $17,499 | 37 (2.6%) | 96 (6.1%) |
| $17,500 to $19,999 | 14 (1.0%) | 61 (3.9%) |
| $20,000 to $22,499 | 69 (4.8%) | 114 (7.3%) |
| $22,500 to $24,999 | 12 (0.8%) | 22 (1.4%) |
| $25,000 to $29,999 | 109 (7.6%) | 72 (4.6%) |
| $30,000 to $34,999 | 56 (3.9%) | 73 (4.7%) |
| $35,000 to $39,999 | 291 (20.3%) | 180 (11.5%) |
| $40,000 to $44,999 | 133 (9.3%) | 101 (6.5%) |
| $45,000 to $49,999 | 181 (12.7%) | 24 (1.5%) |
| $50,000 to $54,999 | 19 (1.3%) | 34 (2.2%) |
| $55,000 to $64,999 | 112 (7.8%) | 30 (1.9%) |
| $65,000 to $74,999 | 159 (11.1%) | 0 (0.0%) |
| $75,000 to $99,999 | 104 (7.3%) | 88 (5.6%) |
| $100,000+ | 76 (5.3%) | 22 (1.4%) |
| Total | 1,430 (100.0%) | 1,561 (100.0%) |
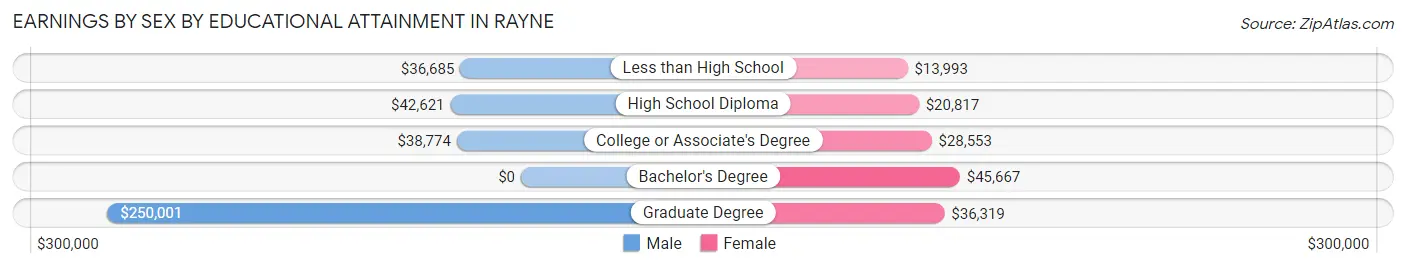
Earnings by Sex by Educational Attainment in Rayne
Average earnings in Rayne are $42,564 for men and $22,259 for women, a difference of 47.7%. Men with an educational attainment of graduate degree enjoy the highest average annual earnings of $250,001, while those with less than high school education earn the least with $36,685. Women with an educational attainment of bachelor's degree earn the most with the average annual earnings of $45,667, while those with less than high school education have the smallest earnings of $13,993.
| Educational Attainment | Male Income | Female Income |
| Less than High School | $36,685 | $13,993 |
| High School Diploma | $42,621 | $20,817 |
| College or Associate's Degree | $38,774 | $28,553 |
| Bachelor's Degree | - | - |
| Graduate Degree | $250,001 | $36,319 |
| Total | $42,564 | $22,259 |
Family Income in Rayne
Family Income Brackets in Rayne
According to the Rayne family income data, there are 352 families falling into the $50,000 to $74,999 income range, which is the most common income bracket and makes up 22.2% of all families. Conversely, the less than $10,000 income bracket is the least frequent group with only 36 families (2.3%) belonging to this category.
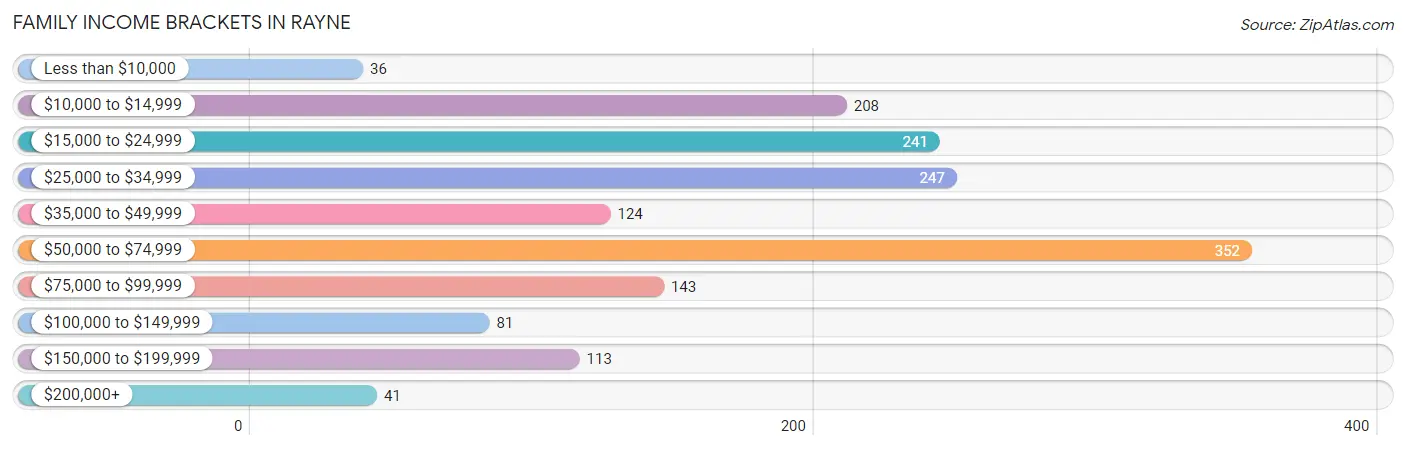
| Income Bracket | # Families | % Families |
| Less than $10,000 | 36 | 2.3% |
| $10,000 to $14,999 | 208 | 13.1% |
| $15,000 to $24,999 | 241 | 15.2% |
| $25,000 to $34,999 | 247 | 15.6% |
| $35,000 to $49,999 | 124 | 7.8% |
| $50,000 to $74,999 | 352 | 22.2% |
| $75,000 to $99,999 | 143 | 9.0% |
| $100,000 to $149,999 | 81 | 5.1% |
| $150,000 to $199,999 | 113 | 7.1% |
| $200,000+ | 41 | 2.6% |
Family Income by Famaliy Size in Rayne
3-person families (331 | 20.9%) account for the highest median family income in Rayne with $82,801 per family, while 3-person families (331 | 20.9%) have the highest median income of $27,600 per family member.
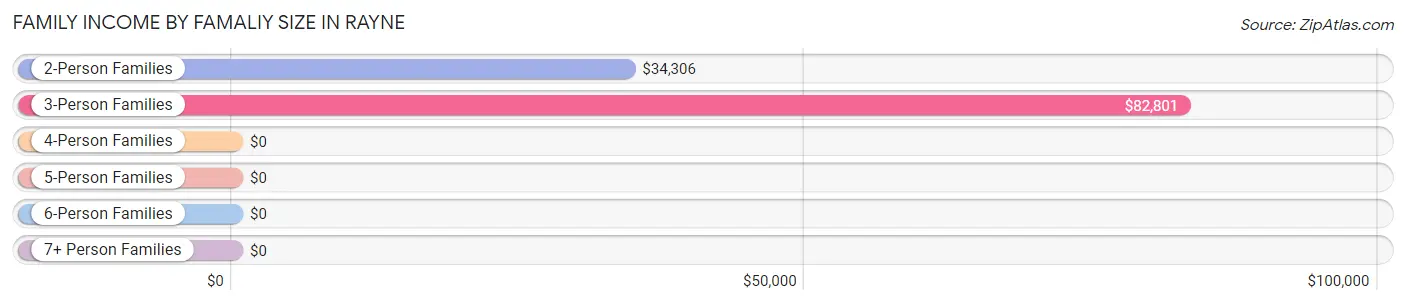
| Income Bracket | # Families | Median Income |
| 2-Person Families | 694 (43.8%) | $34,306 |
| 3-Person Families | 331 (20.9%) | $82,801 |
| 4-Person Families | 167 (10.5%) | $0 |
| 5-Person Families | 229 (14.4%) | $0 |
| 6-Person Families | 116 (7.3%) | $0 |
| 7+ Person Families | 49 (3.1%) | $0 |
| Total | 1,586 (100.0%) | $41,724 |
Family Income by Number of Earners in Rayne
The median family income in Rayne is $41,724, with families comprising 3+ earners (121) having the highest median family income of $137,372, while families with 1 earner (567) have the lowest median family income of $24,604, accounting for 7.6% and 35.7% of families, respectively.
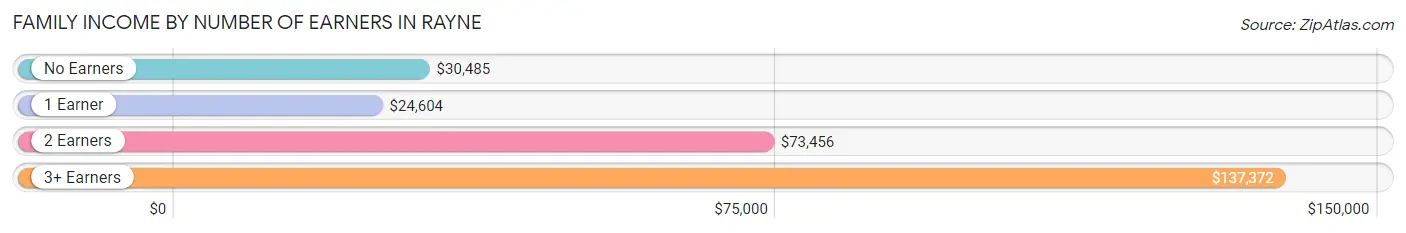
| Number of Earners | # Families | Median Income |
| No Earners | 415 (26.2%) | $30,485 |
| 1 Earner | 567 (35.7%) | $24,604 |
| 2 Earners | 483 (30.4%) | $73,456 |
| 3+ Earners | 121 (7.6%) | $137,372 |
| Total | 1,586 (100.0%) | $41,724 |
Household Income in Rayne
Household Income Brackets in Rayne
With 544 households falling in the category, the $50,000 to $74,999 income range is the most frequent in Rayne, accounting for 19.0% of all households. In contrast, only 43 households (1.5%) fall into the $200,000+ income bracket, making it the least populous group.
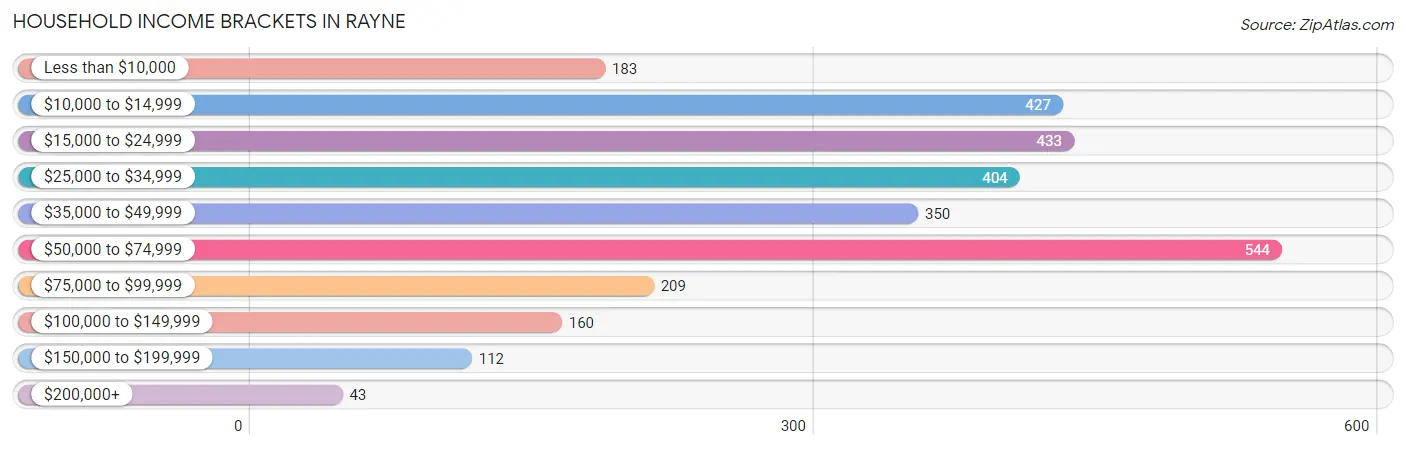
| Income Bracket | # Households | % Households |
| Less than $10,000 | 183 | 6.4% |
| $10,000 to $14,999 | 427 | 14.9% |
| $15,000 to $24,999 | 433 | 15.1% |
| $25,000 to $34,999 | 404 | 14.1% |
| $35,000 to $49,999 | 350 | 12.2% |
| $50,000 to $74,999 | 544 | 19.0% |
| $75,000 to $99,999 | 209 | 7.3% |
| $100,000 to $149,999 | 160 | 5.6% |
| $150,000 to $199,999 | 112 | 3.9% |
| $200,000+ | 43 | 1.5% |
Household Income by Householder Age in Rayne
The median household income in Rayne is $34,725, with the highest median household income of $45,625 found in the 25 to 44 years age bracket for the primary householder. A total of 1,022 households (35.7%) fall into this category. Meanwhile, the 15 to 24 years age bracket for the primary householder has the lowest median household income of $16,153, with 141 households (4.9%) in this group.
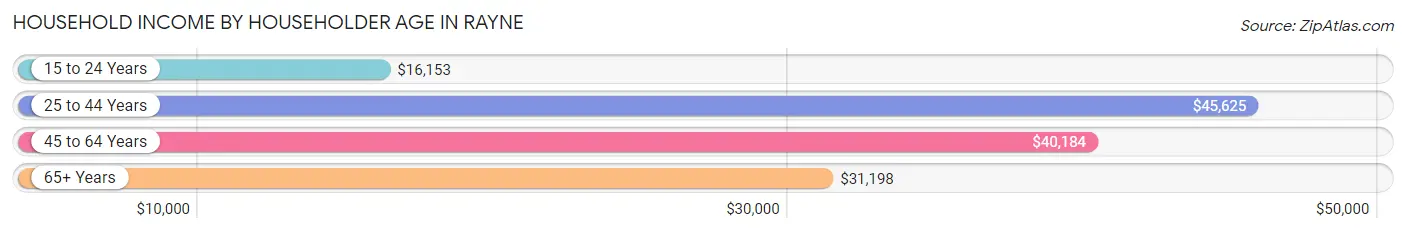
| Income Bracket | # Households | Median Income |
| 15 to 24 Years | 141 (4.9%) | $16,153 |
| 25 to 44 Years | 1,022 (35.7%) | $45,625 |
| 45 to 64 Years | 901 (31.5%) | $40,184 |
| 65+ Years | 801 (28.0%) | $31,198 |
| Total | 2,865 (100.0%) | $34,725 |
Poverty in Rayne
Income Below Poverty by Sex and Age in Rayne
With 24.8% poverty level for males and 32.2% for females among the residents of Rayne, 18 to 24 year old males and 18 to 24 year old females are the most vulnerable to poverty, with 115 males (71.9%) and 188 females (60.7%) in their respective age groups living below the poverty level.
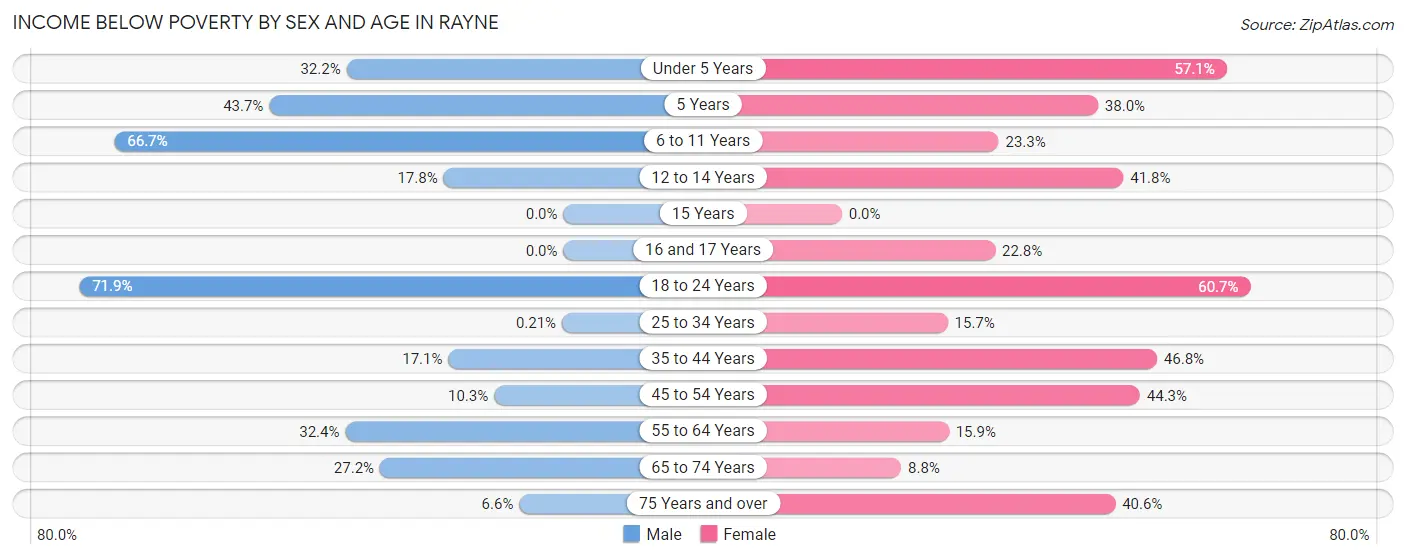
| Age Bracket | Male | Female |
| Under 5 Years | 170 (32.2%) | 80 (57.1%) |
| 5 Years | 38 (43.7%) | 27 (38.0%) |
| 6 to 11 Years | 148 (66.7%) | 95 (23.3%) |
| 12 to 14 Years | 21 (17.8%) | 51 (41.8%) |
| 15 Years | 0 (0.0%) | 0 (0.0%) |
| 16 and 17 Years | 0 (0.0%) | 38 (22.8%) |
| 18 to 24 Years | 115 (71.9%) | 188 (60.7%) |
| 25 to 34 Years | 1 (0.2%) | 98 (15.7%) |
| 35 to 44 Years | 103 (17.1%) | 124 (46.8%) |
| 45 to 54 Years | 25 (10.3%) | 239 (44.3%) |
| 55 to 64 Years | 158 (32.4%) | 47 (15.9%) |
| 65 to 74 Years | 73 (27.2%) | 25 (8.8%) |
| 75 Years and over | 15 (6.6%) | 136 (40.6%) |
| Total | 867 (24.8%) | 1,148 (32.2%) |
Income Above Poverty by Sex and Age in Rayne
According to the poverty statistics in Rayne, males aged 15 years and females aged 65 to 74 years are the age groups that are most secure financially, with 100.0% of males and 91.2% of females in these age groups living above the poverty line.
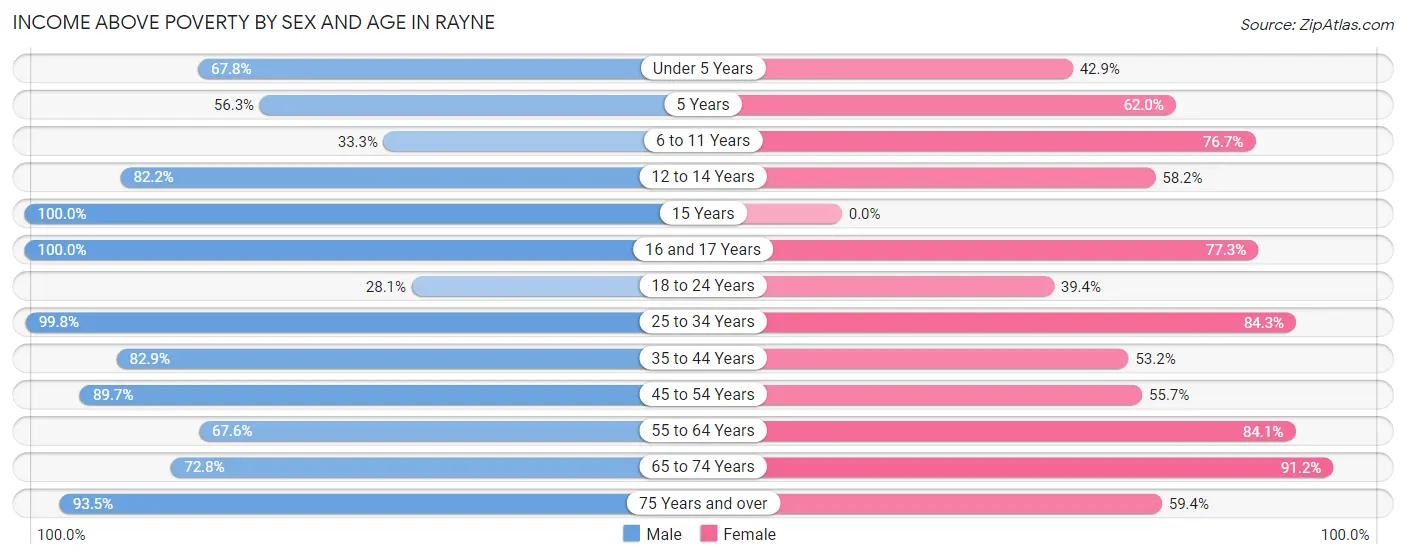
| Age Bracket | Male | Female |
| Under 5 Years | 358 (67.8%) | 60 (42.9%) |
| 5 Years | 49 (56.3%) | 44 (62.0%) |
| 6 to 11 Years | 74 (33.3%) | 313 (76.7%) |
| 12 to 14 Years | 97 (82.2%) | 71 (58.2%) |
| 15 Years | 70 (100.0%) | 0 (0.0%) |
| 16 and 17 Years | 9 (100.0%) | 129 (77.2%) |
| 18 to 24 Years | 45 (28.1%) | 122 (39.4%) |
| 25 to 34 Years | 469 (99.8%) | 526 (84.3%) |
| 35 to 44 Years | 500 (82.9%) | 141 (53.2%) |
| 45 to 54 Years | 218 (89.7%) | 301 (55.7%) |
| 55 to 64 Years | 330 (67.6%) | 249 (84.1%) |
| 65 to 74 Years | 195 (72.8%) | 259 (91.2%) |
| 75 Years and over | 214 (93.4%) | 199 (59.4%) |
| Total | 2,628 (75.2%) | 2,414 (67.8%) |
Income Below Poverty Among Married-Couple Families in Rayne
The poverty statistics for married-couple families in Rayne show that 7.4% or 73 of the total 989 families live below the poverty line. Families with no children have the highest poverty rate of 13.6%, comprising of 73 families. On the other hand, families with 1 or 2 children have the lowest poverty rate of 0.0%, which includes 0 families.
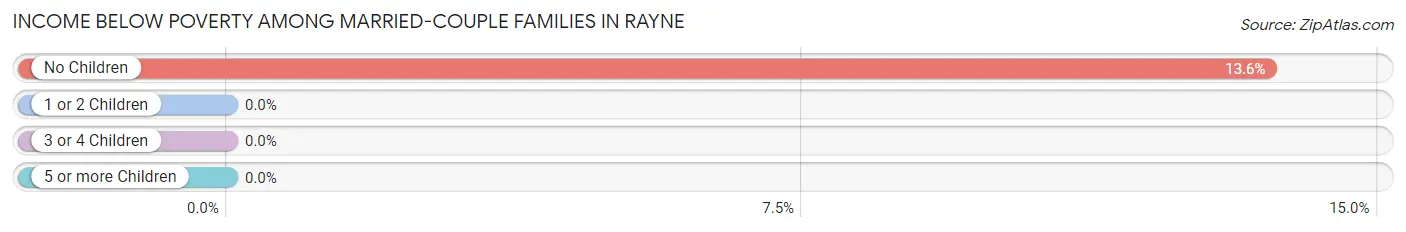
| Children | Above Poverty | Below Poverty |
| No Children | 465 (86.4%) | 73 (13.6%) |
| 1 or 2 Children | 245 (100.0%) | 0 (0.0%) |
| 3 or 4 Children | 157 (100.0%) | 0 (0.0%) |
| 5 or more Children | 49 (100.0%) | 0 (0.0%) |
| Total | 916 (92.6%) | 73 (7.4%) |
Income Below Poverty Among Single-Parent Households in Rayne
According to the poverty data in Rayne, 78.8% or 82 single-father households and 60.7% or 299 single-mother households are living below the poverty line. Among single-father households, those with no children have the highest poverty rate, with 55 households (82.1%) experiencing poverty. Likewise, among single-mother households, those with 3 or 4 children have the highest poverty rate, with 198 households (100.0%) falling below the poverty line.
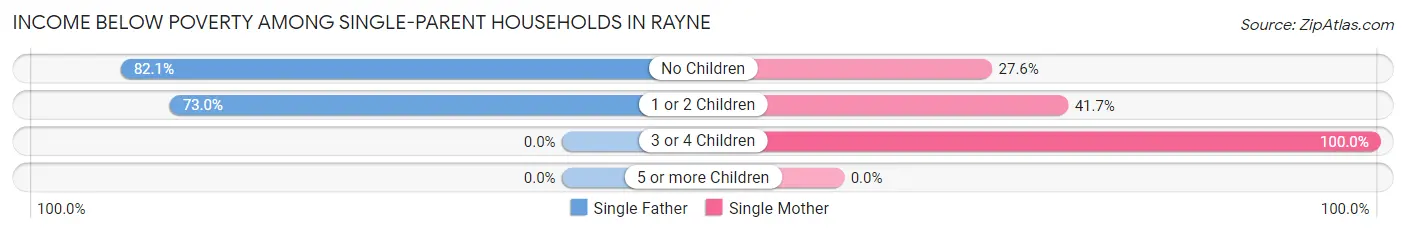
| Children | Single Father | Single Mother |
| No Children | 55 (82.1%) | 43 (27.6%) |
| 1 or 2 Children | 27 (73.0%) | 58 (41.7%) |
| 3 or 4 Children | 0 (0.0%) | 198 (100.0%) |
| 5 or more Children | 0 (0.0%) | 0 (0.0%) |
| Total | 82 (78.8%) | 299 (60.7%) |
Income Below Poverty Among Married-Couple vs Single-Parent Households in Rayne
The poverty data for Rayne shows that 73 of the married-couple family households (7.4%) and 381 of the single-parent households (63.8%) are living below the poverty level. Within the married-couple family households, those with no children have the highest poverty rate, with 73 households (13.6%) falling below the poverty line. Among the single-parent households, those with 3 or 4 children have the highest poverty rate, with 198 household (100.0%) living below poverty.
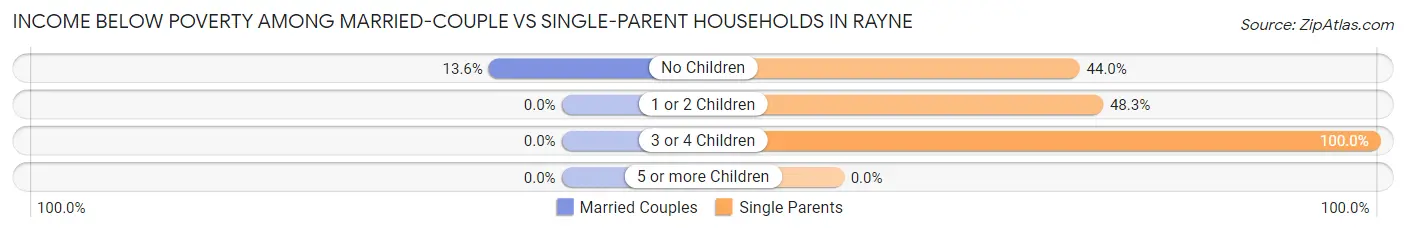
| Children | Married-Couple Families | Single-Parent Households |
| No Children | 73 (13.6%) | 98 (44.0%) |
| 1 or 2 Children | 0 (0.0%) | 85 (48.3%) |
| 3 or 4 Children | 0 (0.0%) | 198 (100.0%) |
| 5 or more Children | 0 (0.0%) | 0 (0.0%) |
| Total | 73 (7.4%) | 381 (63.8%) |
Race in Rayne
The most populous races in Rayne are White / Caucasian (3,570 | 49.4%), Black / African American (3,214 | 44.5%), and Two or more Races (321 | 4.4%).
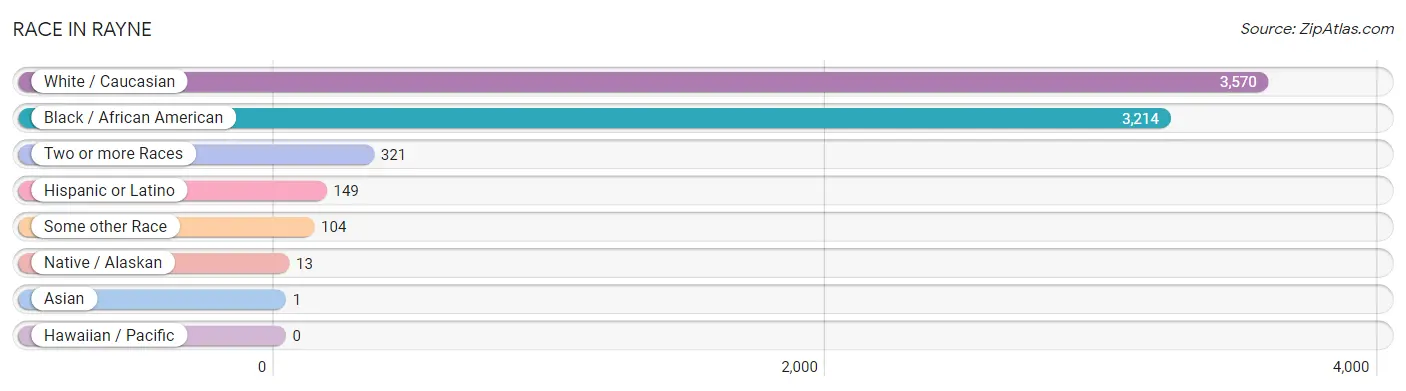
| Race | # Population | % Population |
| Asian | 1 | 0.0% |
| Black / African American | 3,214 | 44.5% |
| Hawaiian / Pacific | 0 | 0.0% |
| Hispanic or Latino | 149 | 2.1% |
| Native / Alaskan | 13 | 0.2% |
| White / Caucasian | 3,570 | 49.4% |
| Two or more Races | 321 | 4.4% |
| Some other Race | 104 | 1.4% |
| Total | 7,223 | 100.0% |
Ancestry in Rayne
The most populous ancestries reported in Rayne are French Canadian (583 | 8.1%), German (468 | 6.5%), Cajun (435 | 6.0%), French (400 | 5.5%), and American (374 | 5.2%), together accounting for 31.3% of all Rayne residents.
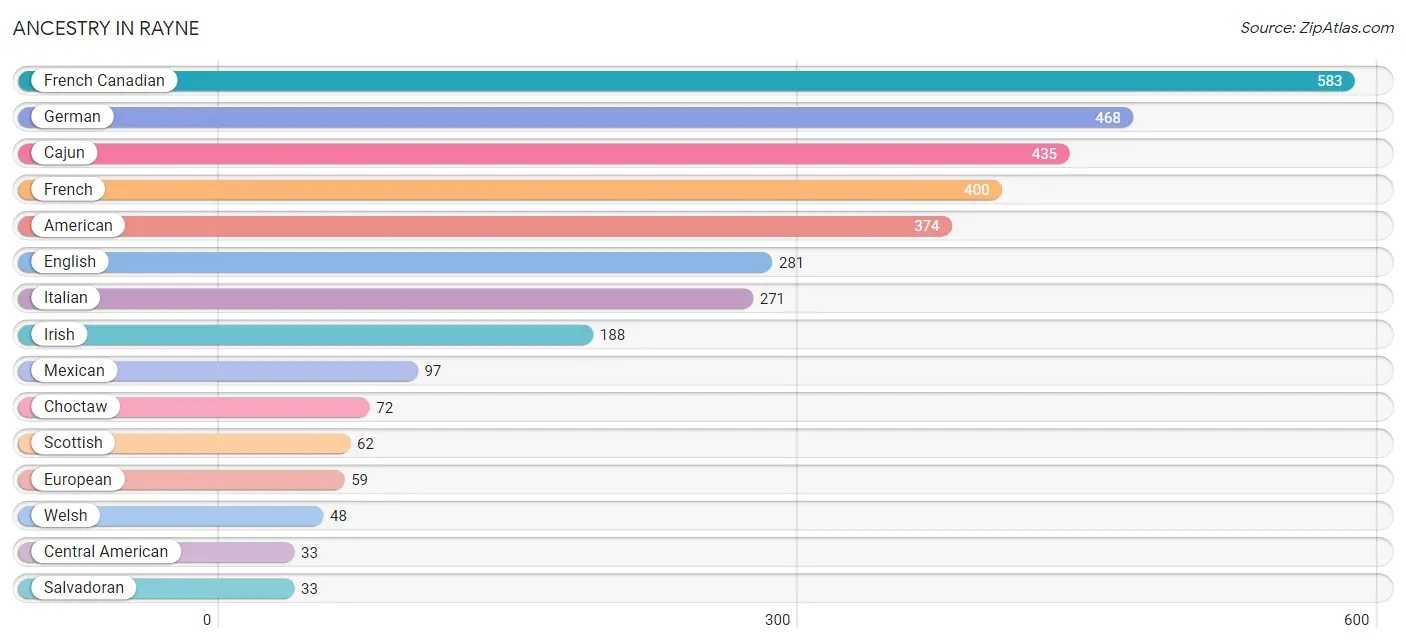
| Ancestry | # Population | % Population |
| American | 374 | 5.2% |
| Cajun | 435 | 6.0% |
| Central American | 33 | 0.5% |
| Cherokee | 4 | 0.1% |
| Choctaw | 72 | 1.0% |
| English | 281 | 3.9% |
| European | 59 | 0.8% |
| French | 400 | 5.5% |
| French Canadian | 583 | 8.1% |
| German | 468 | 6.5% |
| Irish | 188 | 2.6% |
| Italian | 271 | 3.7% |
| Malaysian | 11 | 0.2% |
| Mexican | 97 | 1.3% |
| Romanian | 8 | 0.1% |
| Salvadoran | 33 | 0.5% |
| Scotch-Irish | 30 | 0.4% |
| Scottish | 62 | 0.9% |
| Spanish | 19 | 0.3% |
| Thai | 1 | 0.0% |
| Welsh | 48 | 0.7% |
| West Indian | 12 | 0.2% | View All 22 Rows |
Immigrants in Rayne
The most numerous immigrant groups reported in Rayne came from Central America (14 | 0.2%), Latin America (14 | 0.2%), El Salvador (12 | 0.2%), Mexico (2 | 0.0%), and England (1 | 0.0%), together accounting for 0.6% of all Rayne residents.
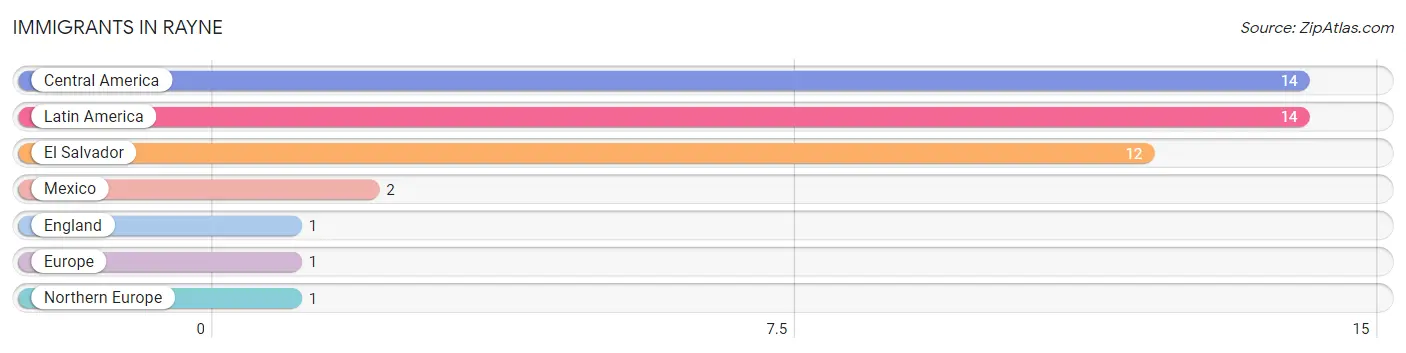
| Immigration Origin | # Population | % Population |
| Central America | 14 | 0.2% |
| El Salvador | 12 | 0.2% |
| England | 1 | 0.0% |
| Europe | 1 | 0.0% |
| Latin America | 14 | 0.2% |
| Mexico | 2 | 0.0% |
| Northern Europe | 1 | 0.0% | View All 7 Rows |
Sex and Age in Rayne
Sex and Age in Rayne
The most populous age groups in Rayne are Under 5 Years (528 | 14.7%) for men and 5 to 9 Years (360 | 9.9%) for women.
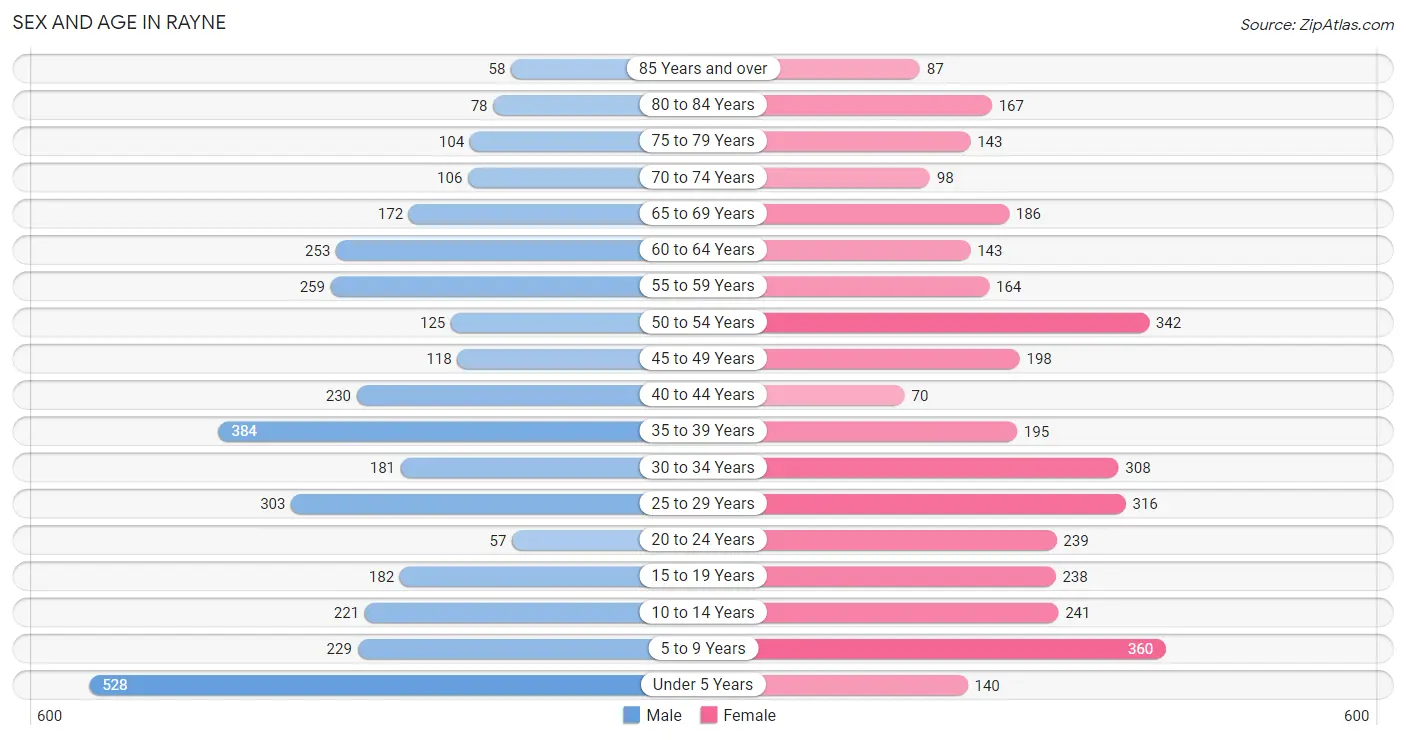
| Age Bracket | Male | Female |
| Under 5 Years | 528 (14.7%) | 140 (3.8%) |
| 5 to 9 Years | 229 (6.4%) | 360 (9.9%) |
| 10 to 14 Years | 221 (6.2%) | 241 (6.6%) |
| 15 to 19 Years | 182 (5.1%) | 238 (6.6%) |
| 20 to 24 Years | 57 (1.6%) | 239 (6.6%) |
| 25 to 29 Years | 303 (8.4%) | 316 (8.7%) |
| 30 to 34 Years | 181 (5.0%) | 308 (8.5%) |
| 35 to 39 Years | 384 (10.7%) | 195 (5.4%) |
| 40 to 44 Years | 230 (6.4%) | 70 (1.9%) |
| 45 to 49 Years | 118 (3.3%) | 198 (5.4%) |
| 50 to 54 Years | 125 (3.5%) | 342 (9.4%) |
| 55 to 59 Years | 259 (7.2%) | 164 (4.5%) |
| 60 to 64 Years | 253 (7.0%) | 143 (3.9%) |
| 65 to 69 Years | 172 (4.8%) | 186 (5.1%) |
| 70 to 74 Years | 106 (2.9%) | 98 (2.7%) |
| 75 to 79 Years | 104 (2.9%) | 143 (3.9%) |
| 80 to 84 Years | 78 (2.2%) | 167 (4.6%) |
| 85 Years and over | 58 (1.6%) | 87 (2.4%) |
| Total | 3,588 (100.0%) | 3,635 (100.0%) |
Families and Households in Rayne
Median Family Size in Rayne
The median family size in Rayne is 3.39 persons per family, with single male/father families (104 | 6.6%) accounting for the largest median family size of 3.6 persons per family. On the other hand, single female/mother families (493 | 31.1%) represent the smallest median family size with 3.34 persons per family.
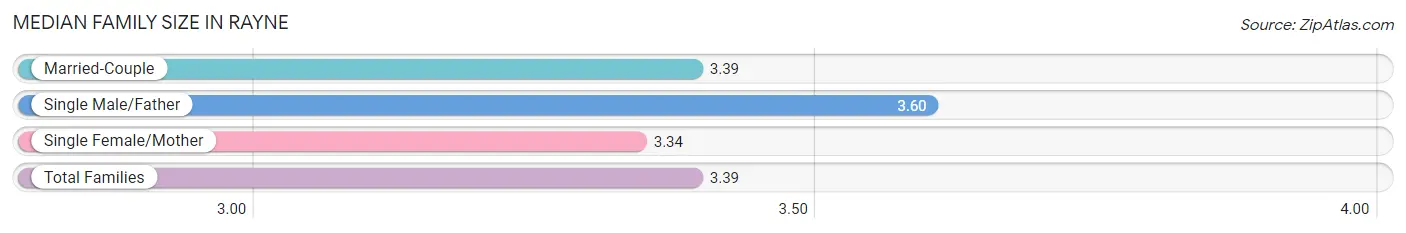
| Family Type | # Families | Family Size |
| Married-Couple | 989 (62.4%) | 3.39 |
| Single Male/Father | 104 (6.6%) | 3.60 |
| Single Female/Mother | 493 (31.1%) | 3.34 |
| Total Families | 1,586 (100.0%) | 3.39 |
Median Household Size in Rayne
The median household size in Rayne is 2.46 persons per household, with single male/father households (104 | 3.6%) accounting for the largest median household size of 3.82 persons per household. non-family households (1,279 | 44.6%) represent the smallest median household size with 1.21 persons per household.
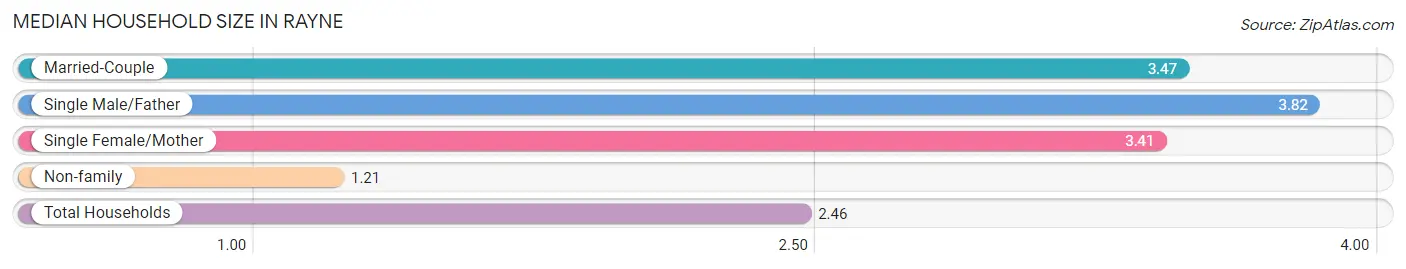
| Household Type | # Households | Household Size |
| Married-Couple | 989 (34.5%) | 3.47 |
| Single Male/Father | 104 (3.6%) | 3.82 |
| Single Female/Mother | 493 (17.2%) | 3.41 |
| Non-family | 1,279 (44.6%) | 1.21 |
| Total Households | 2,865 (100.0%) | 2.46 |
Household Size by Marriage Status in Rayne
Out of a total of 2,865 households in Rayne, 1,586 (55.4%) are family households, while 1,279 (44.6%) are nonfamily households. The most numerous type of family households are 2-person households, comprising 687, and the most common type of nonfamily households are 1-person households, comprising 1,101.
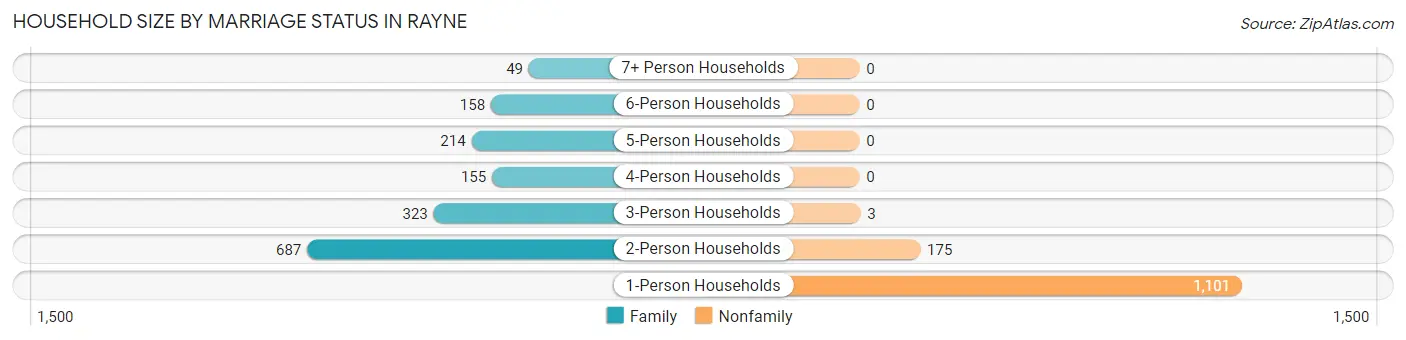
| Household Size | Family Households | Nonfamily Households |
| 1-Person Households | - | 1,101 (38.4%) |
| 2-Person Households | 687 (24.0%) | 175 (6.1%) |
| 3-Person Households | 323 (11.3%) | 3 (0.1%) |
| 4-Person Households | 155 (5.4%) | 0 (0.0%) |
| 5-Person Households | 214 (7.5%) | 0 (0.0%) |
| 6-Person Households | 158 (5.5%) | 0 (0.0%) |
| 7+ Person Households | 49 (1.7%) | 0 (0.0%) |
| Total | 1,586 (55.4%) | 1,279 (44.6%) |
Female Fertility in Rayne
Fertility by Age in Rayne
Average fertility rate in Rayne is 94.0 births per 1,000 women. Women in the age bracket of 20 to 34 years have the highest fertility rate with 146.0 births per 1,000 women. Women in the age bracket of 20 to 34 years acount for 85.1% of all women with births.
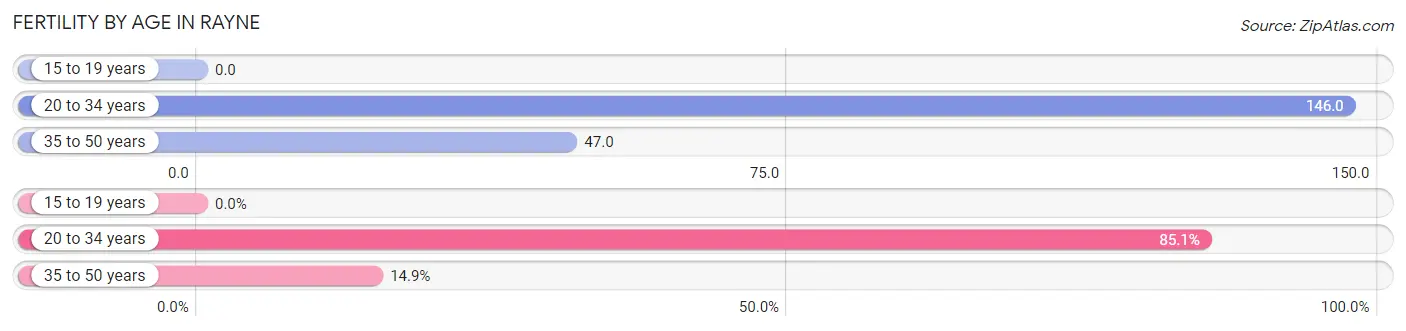
| Age Bracket | Women with Births | Births / 1,000 Women |
| 15 to 19 years | 0 (0.0%) | 0.0 |
| 20 to 34 years | 126 (85.1%) | 146.0 |
| 35 to 50 years | 22 (14.9%) | 47.0 |
| Total | 148 (100.0%) | 94.0 |
Fertility by Age by Marriage Status in Rayne
14.9% of women with births (148) in Rayne are married. The highest percentage of unmarried women with births falls into 20 to 34 years age bracket with 100.0% of them unmarried at the time of birth, while the lowest percentage of unmarried women with births belong to 35 to 50 years age bracket with 0.0% of them unmarried.
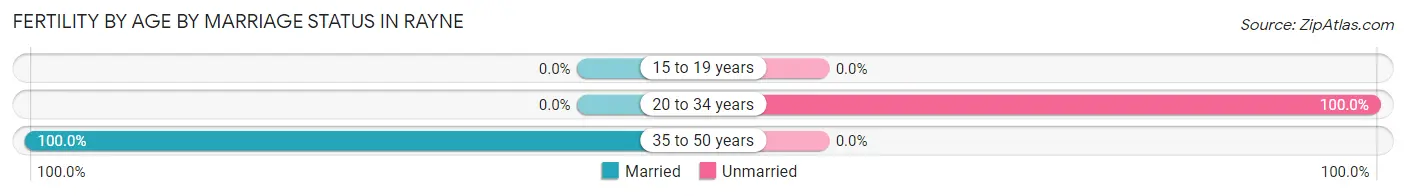
| Age Bracket | Married | Unmarried |
| 15 to 19 years | 0 (0.0%) | 0 (0.0%) |
| 20 to 34 years | 0 (0.0%) | 126 (100.0%) |
| 35 to 50 years | 22 (100.0%) | 0 (0.0%) |
| Total | 22 (14.9%) | 126 (85.1%) |
Fertility by Education in Rayne
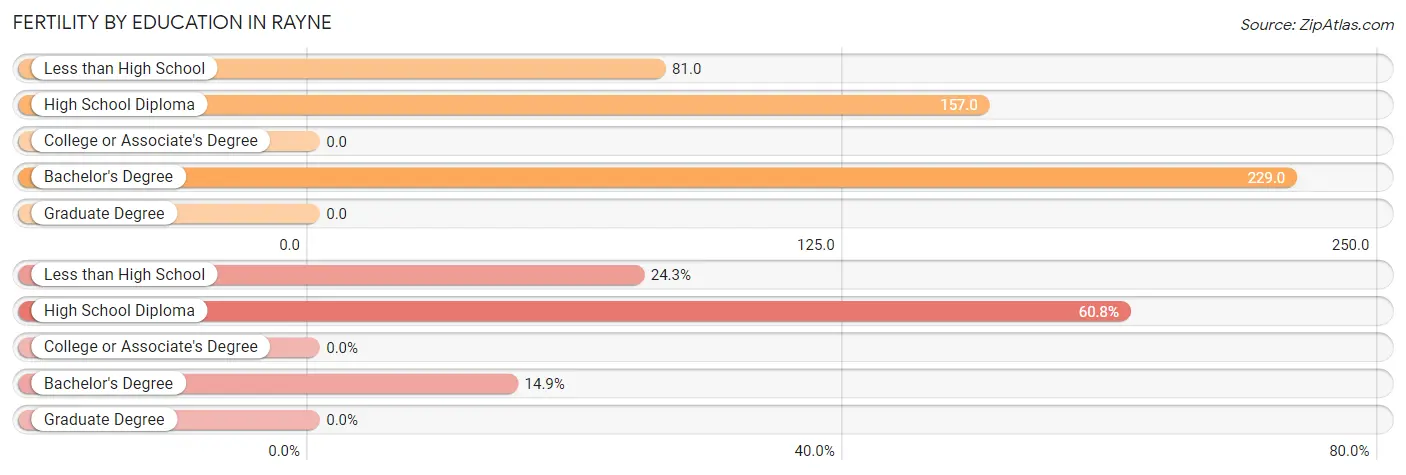
| Educational Attainment | Women with Births | Births / 1,000 Women |
| Less than High School | 36 (24.3%) | 81.0 |
| High School Diploma | 90 (60.8%) | 157.0 |
| College or Associate's Degree | 0 (0.0%) | 0.0 |
| Bachelor's Degree | 22 (14.9%) | 229.0 |
| Graduate Degree | 0 (0.0%) | 0.0 |
| Total | 148 (100.0%) | 94.0 |
Fertility by Education by Marriage Status in Rayne
85.1% of women with births in Rayne are unmarried. Women with the educational attainment of bachelor's degree are most likely to be married with 100.0% of them married at childbirth, while women with the educational attainment of less than high school are least likely to be married with 100.0% of them unmarried at childbirth.
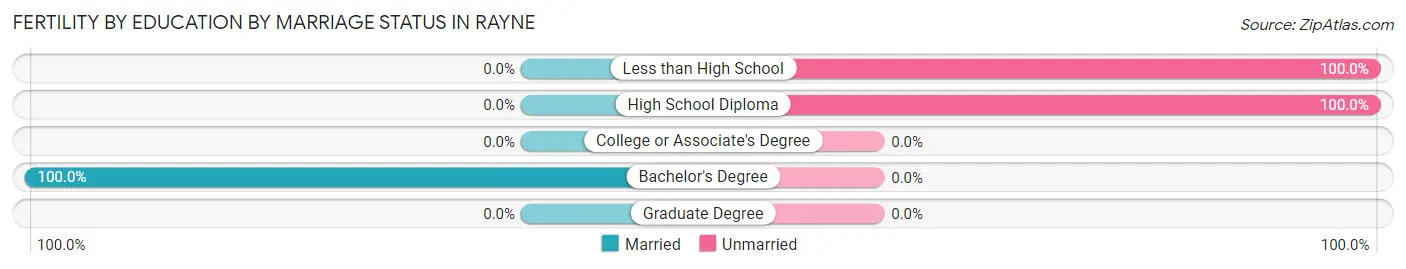
| Educational Attainment | Married | Unmarried |
| Less than High School | 0 (0.0%) | 36 (100.0%) |
| High School Diploma | 0 (0.0%) | 90 (100.0%) |
| College or Associate's Degree | 0 (0.0%) | 0 (0.0%) |
| Bachelor's Degree | 22 (100.0%) | 0 (0.0%) |
| Graduate Degree | 0 (0.0%) | 0 (0.0%) |
| Total | 22 (14.9%) | 126 (85.1%) |
Employment Characteristics in Rayne
Employment by Class of Employer in Rayne
Among the 2,700 employed individuals in Rayne, private company employees (1,821 | 67.4%), local government employees (537 | 19.9%), and not-for-profit organizations (113 | 4.2%) make up the most common classes of employment.
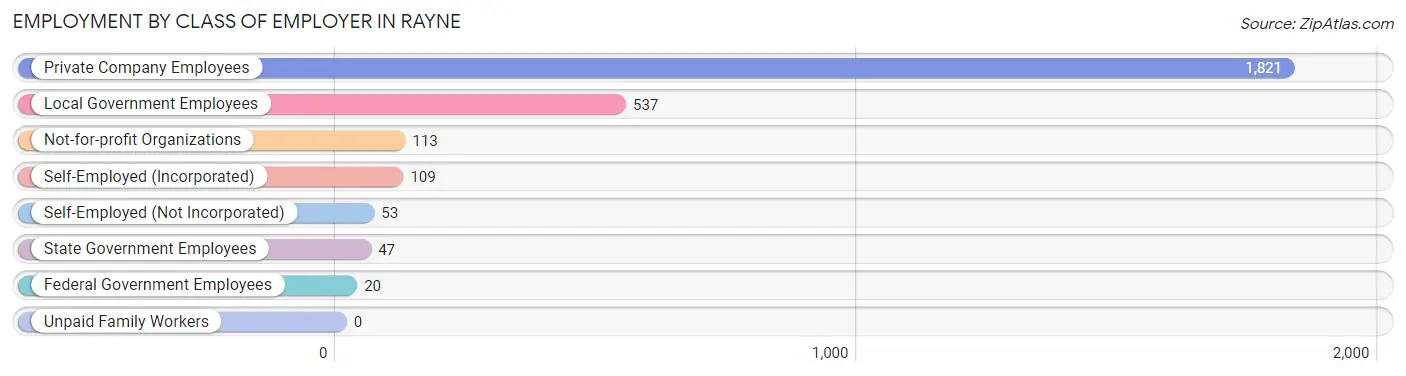
| Employer Class | # Employees | % Employees |
| Private Company Employees | 1,821 | 67.4% |
| Self-Employed (Incorporated) | 109 | 4.0% |
| Self-Employed (Not Incorporated) | 53 | 2.0% |
| Not-for-profit Organizations | 113 | 4.2% |
| Local Government Employees | 537 | 19.9% |
| State Government Employees | 47 | 1.7% |
| Federal Government Employees | 20 | 0.7% |
| Unpaid Family Workers | 0 | 0.0% |
| Total | 2,700 | 100.0% |
Employment Status by Age in Rayne
According to the labor force statistics for Rayne, out of the total population over 16 years of age (5,434), 56.1% or 3,048 individuals are in the labor force, with 11.4% or 347 of them unemployed. The age group with the highest labor force participation rate is 30 to 34 years, with 93.7% or 458 individuals in the labor force. Within the labor force, the 16 to 19 years age range has the highest percentage of unemployed individuals, with 54.9% or 129 of them being unemployed.
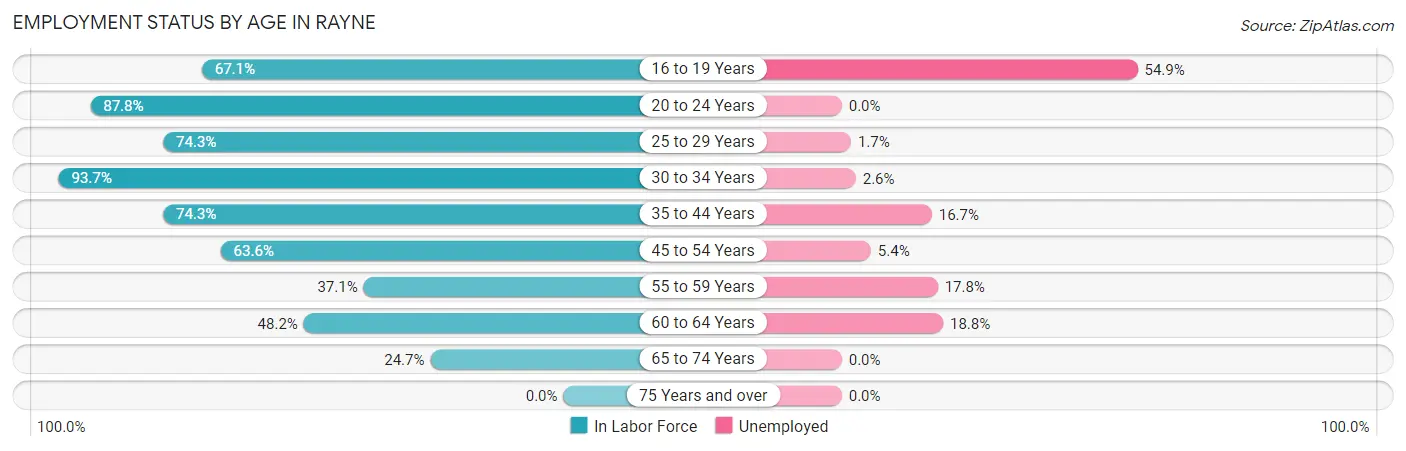
| Age Bracket | In Labor Force | Unemployed |
| 16 to 19 Years | 235 (67.1%) | 129 (54.9%) |
| 20 to 24 Years | 260 (87.8%) | 0 (0.0%) |
| 25 to 29 Years | 460 (74.3%) | 8 (1.7%) |
| 30 to 34 Years | 458 (93.7%) | 12 (2.6%) |
| 35 to 44 Years | 653 (74.3%) | 109 (16.7%) |
| 45 to 54 Years | 498 (63.6%) | 27 (5.4%) |
| 55 to 59 Years | 157 (37.1%) | 28 (17.8%) |
| 60 to 64 Years | 191 (48.2%) | 36 (18.8%) |
| 65 to 74 Years | 139 (24.7%) | 0 (0.0%) |
| 75 Years and over | 0 (0.0%) | 0 (0.0%) |
| Total | 3,048 (56.1%) | 347 (11.4%) |
Employment Status by Educational Attainment in Rayne
According to labor force statistics for Rayne, 67.3% of individuals (2,415) out of the total population between 25 and 64 years of age (3,589) are in the labor force, with 9.1% or 220 of them being unemployed. The group with the highest labor force participation rate are those with the educational attainment of bachelor's degree or higher, with 90.6% or 328 individuals in the labor force. Within the labor force, individuals with less than high school education have the highest percentage of unemployment, with 37.4% or 101 of them being unemployed.
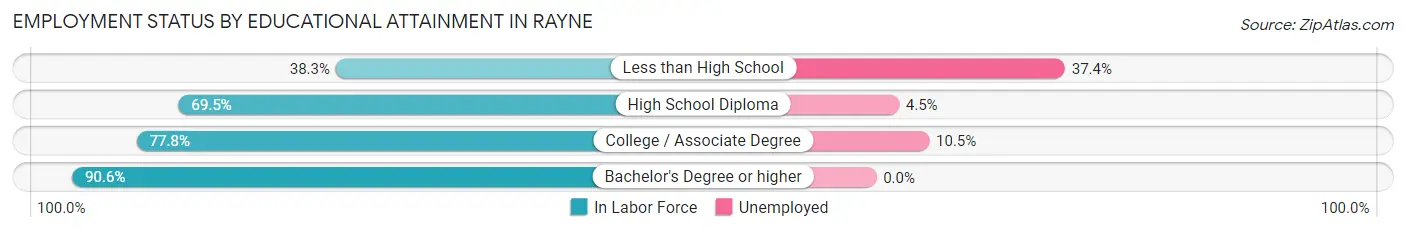
| Educational Attainment | In Labor Force | Unemployed |
| Less than High School | 270 (38.3%) | 264 (37.4%) |
| High School Diploma | 1,191 (69.5%) | 77 (4.5%) |
| College / Associate Degree | 629 (77.8%) | 85 (10.5%) |
| Bachelor's Degree or higher | 328 (90.6%) | 0 (0.0%) |
| Total | 2,415 (67.3%) | 327 (9.1%) |
Employment Occupations by Sex in Rayne
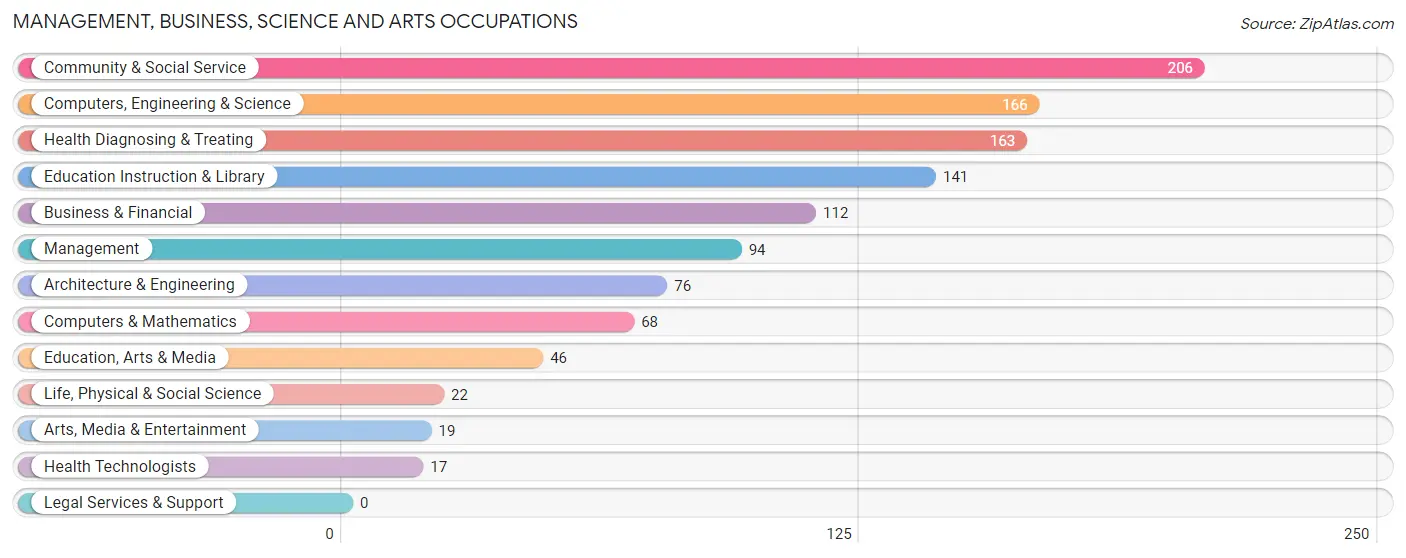
Management, Business, Science and Arts Occupations
The most common Management, Business, Science and Arts occupations in Rayne are Community & Social Service (206 | 7.6%), Computers, Engineering & Science (166 | 6.1%), Health Diagnosing & Treating (163 | 6.0%), Education Instruction & Library (141 | 5.2%), and Business & Financial (112 | 4.2%).
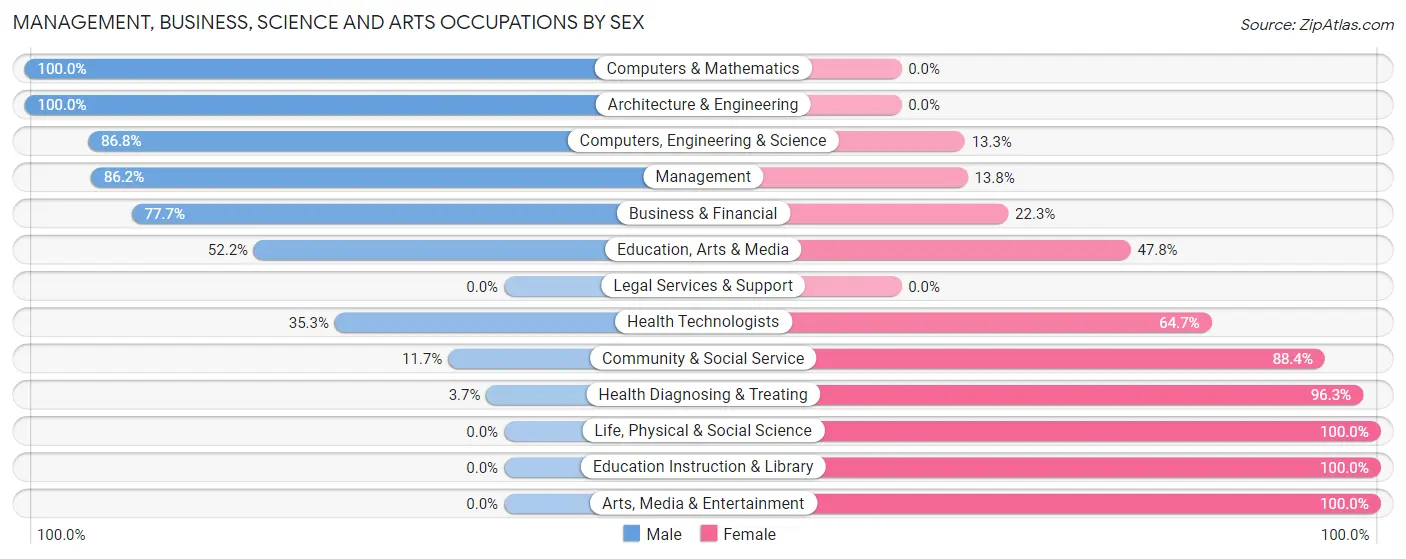
Management, Business, Science and Arts Occupations by Sex
Within the Management, Business, Science and Arts occupations in Rayne, the most male-oriented occupations are Computers & Mathematics (100.0%), Architecture & Engineering (100.0%), and Computers, Engineering & Science (86.8%), while the most female-oriented occupations are Life, Physical & Social Science (100.0%), Education Instruction & Library (100.0%), and Arts, Media & Entertainment (100.0%).
| Occupation | Male | Female |
| Management | 81 (86.2%) | 13 (13.8%) |
| Business & Financial | 87 (77.7%) | 25 (22.3%) |
| Computers, Engineering & Science | 144 (86.8%) | 22 (13.3%) |
| Computers & Mathematics | 68 (100.0%) | 0 (0.0%) |
| Architecture & Engineering | 76 (100.0%) | 0 (0.0%) |
| Life, Physical & Social Science | 0 (0.0%) | 22 (100.0%) |
| Community & Social Service | 24 (11.7%) | 182 (88.3%) |
| Education, Arts & Media | 24 (52.2%) | 22 (47.8%) |
| Legal Services & Support | 0 (0.0%) | 0 (0.0%) |
| Education Instruction & Library | 0 (0.0%) | 141 (100.0%) |
| Arts, Media & Entertainment | 0 (0.0%) | 19 (100.0%) |
| Health Diagnosing & Treating | 6 (3.7%) | 157 (96.3%) |
| Health Technologists | 6 (35.3%) | 11 (64.7%) |
| Total (Category) | 342 (46.2%) | 399 (53.8%) |
| Total (Overall) | 1,328 (49.1%) | 1,374 (50.8%) |
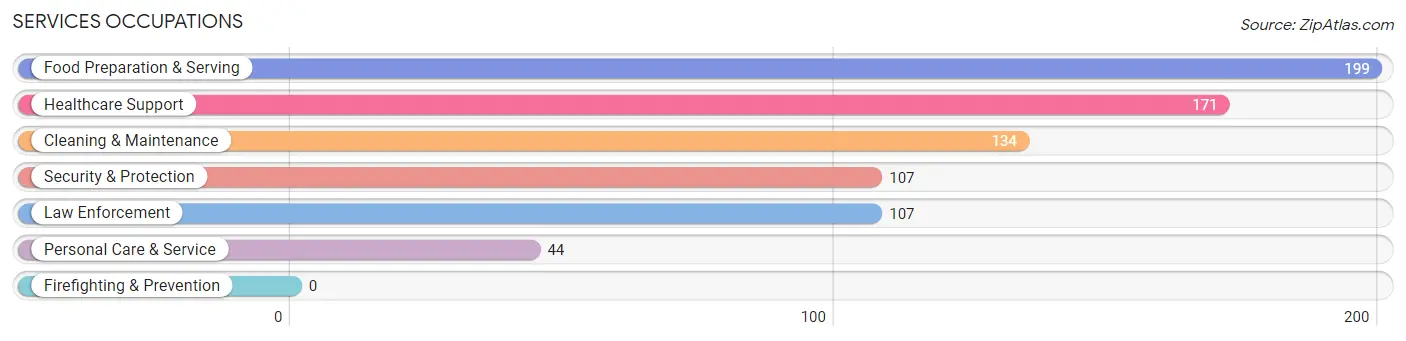
Services Occupations
The most common Services occupations in Rayne are Food Preparation & Serving (199 | 7.4%), Healthcare Support (171 | 6.3%), Cleaning & Maintenance (134 | 5.0%), Security & Protection (107 | 4.0%), and Law Enforcement (107 | 4.0%).
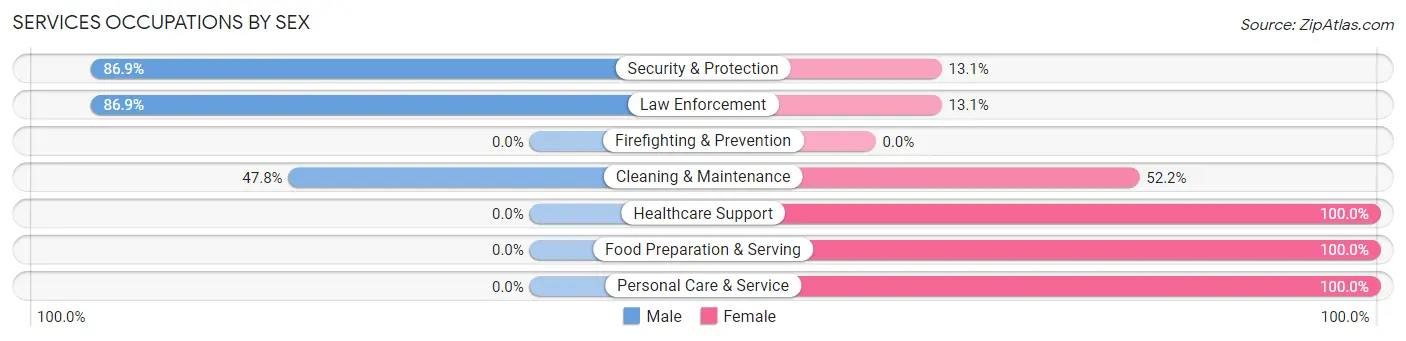
Services Occupations by Sex
Within the Services occupations in Rayne, the most male-oriented occupations are Security & Protection (86.9%), Law Enforcement (86.9%), and Cleaning & Maintenance (47.8%), while the most female-oriented occupations are Healthcare Support (100.0%), Food Preparation & Serving (100.0%), and Personal Care & Service (100.0%).
| Occupation | Male | Female |
| Healthcare Support | 0 (0.0%) | 171 (100.0%) |
| Security & Protection | 93 (86.9%) | 14 (13.1%) |
| Firefighting & Prevention | 0 (0.0%) | 0 (0.0%) |
| Law Enforcement | 93 (86.9%) | 14 (13.1%) |
| Food Preparation & Serving | 0 (0.0%) | 199 (100.0%) |
| Cleaning & Maintenance | 64 (47.8%) | 70 (52.2%) |
| Personal Care & Service | 0 (0.0%) | 44 (100.0%) |
| Total (Category) | 157 (24.0%) | 498 (76.0%) |
| Total (Overall) | 1,328 (49.1%) | 1,374 (50.8%) |
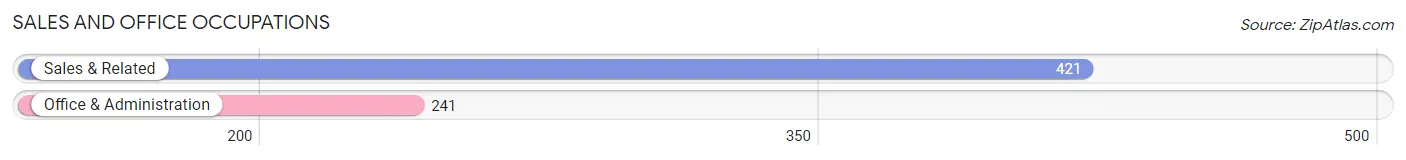
Sales and Office Occupations
The most common Sales and Office occupations in Rayne are Sales & Related (421 | 15.6%), and Office & Administration (241 | 8.9%).
Sales and Office Occupations by Sex
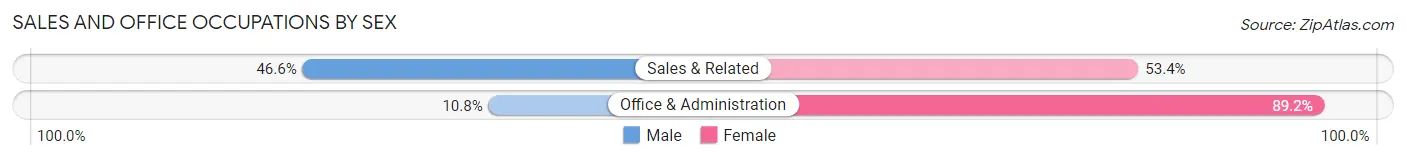
| Occupation | Male | Female |
| Sales & Related | 196 (46.6%) | 225 (53.4%) |
| Office & Administration | 26 (10.8%) | 215 (89.2%) |
| Total (Category) | 222 (33.5%) | 440 (66.5%) |
| Total (Overall) | 1,328 (49.1%) | 1,374 (50.8%) |
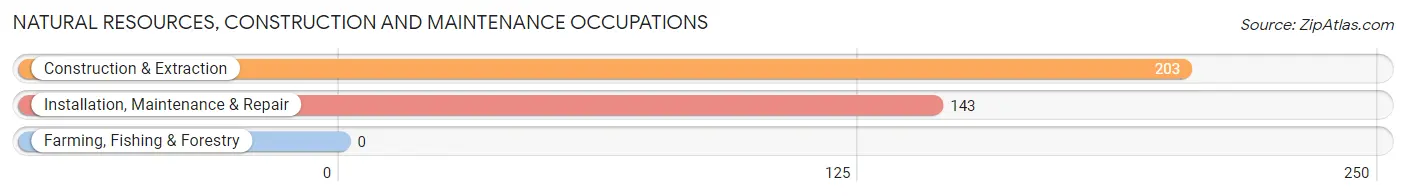
Natural Resources, Construction and Maintenance Occupations
The most common Natural Resources, Construction and Maintenance occupations in Rayne are Construction & Extraction (203 | 7.5%), and Installation, Maintenance & Repair (143 | 5.3%).
Natural Resources, Construction and Maintenance Occupations by Sex
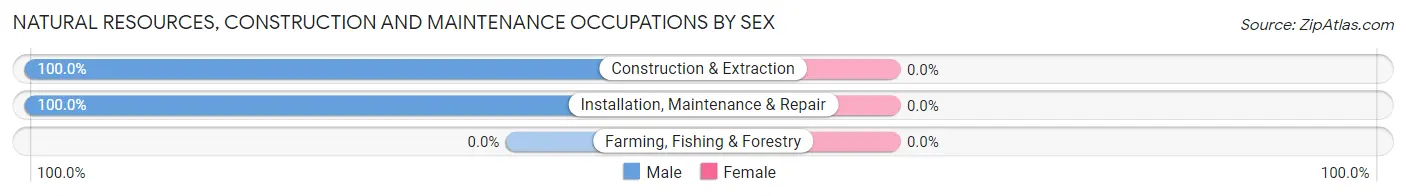
| Occupation | Male | Female |
| Farming, Fishing & Forestry | 0 (0.0%) | 0 (0.0%) |
| Construction & Extraction | 203 (100.0%) | 0 (0.0%) |
| Installation, Maintenance & Repair | 143 (100.0%) | 0 (0.0%) |
| Total (Category) | 346 (100.0%) | 0 (0.0%) |
| Total (Overall) | 1,328 (49.1%) | 1,374 (50.8%) |
Production, Transportation and Moving Occupations
The most common Production, Transportation and Moving occupations in Rayne are Production (171 | 6.3%), and Transportation (127 | 4.7%).
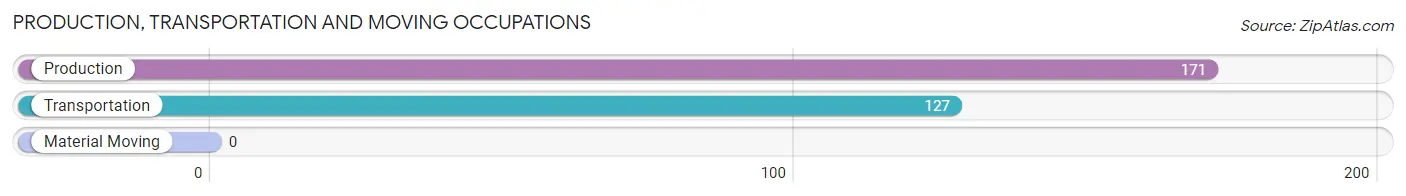
Production, Transportation and Moving Occupations by Sex
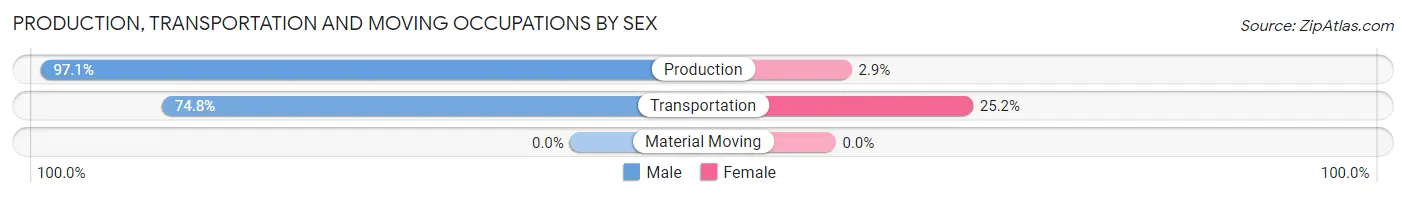
| Occupation | Male | Female |
| Production | 166 (97.1%) | 5 (2.9%) |
| Transportation | 95 (74.8%) | 32 (25.2%) |
| Material Moving | 0 (0.0%) | 0 (0.0%) |
| Total (Category) | 261 (87.6%) | 37 (12.4%) |
| Total (Overall) | 1,328 (49.1%) | 1,374 (50.8%) |
Employment Industries by Sex in Rayne
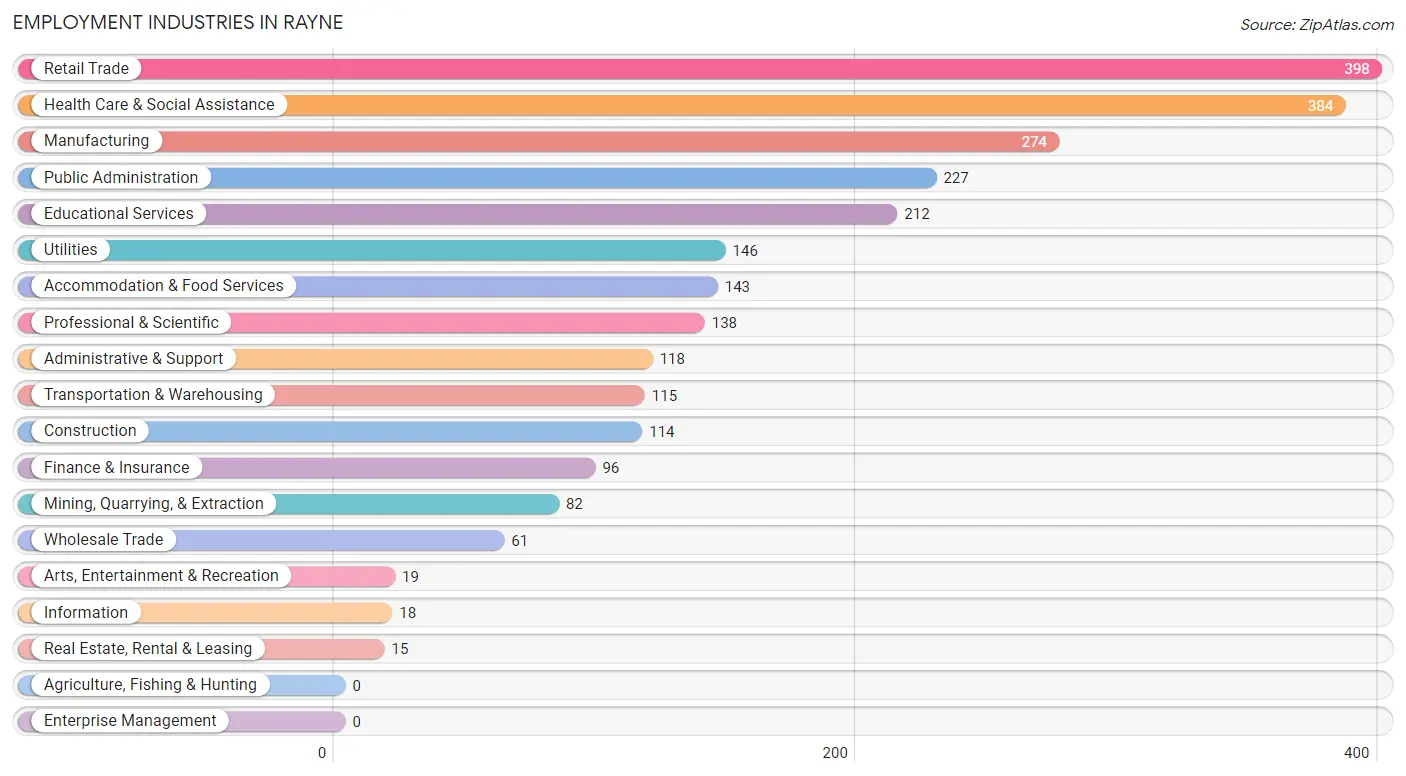
Employment Industries in Rayne
The major employment industries in Rayne include Retail Trade (398 | 14.7%), Health Care & Social Assistance (384 | 14.2%), Manufacturing (274 | 10.1%), Public Administration (227 | 8.4%), and Educational Services (212 | 7.9%).
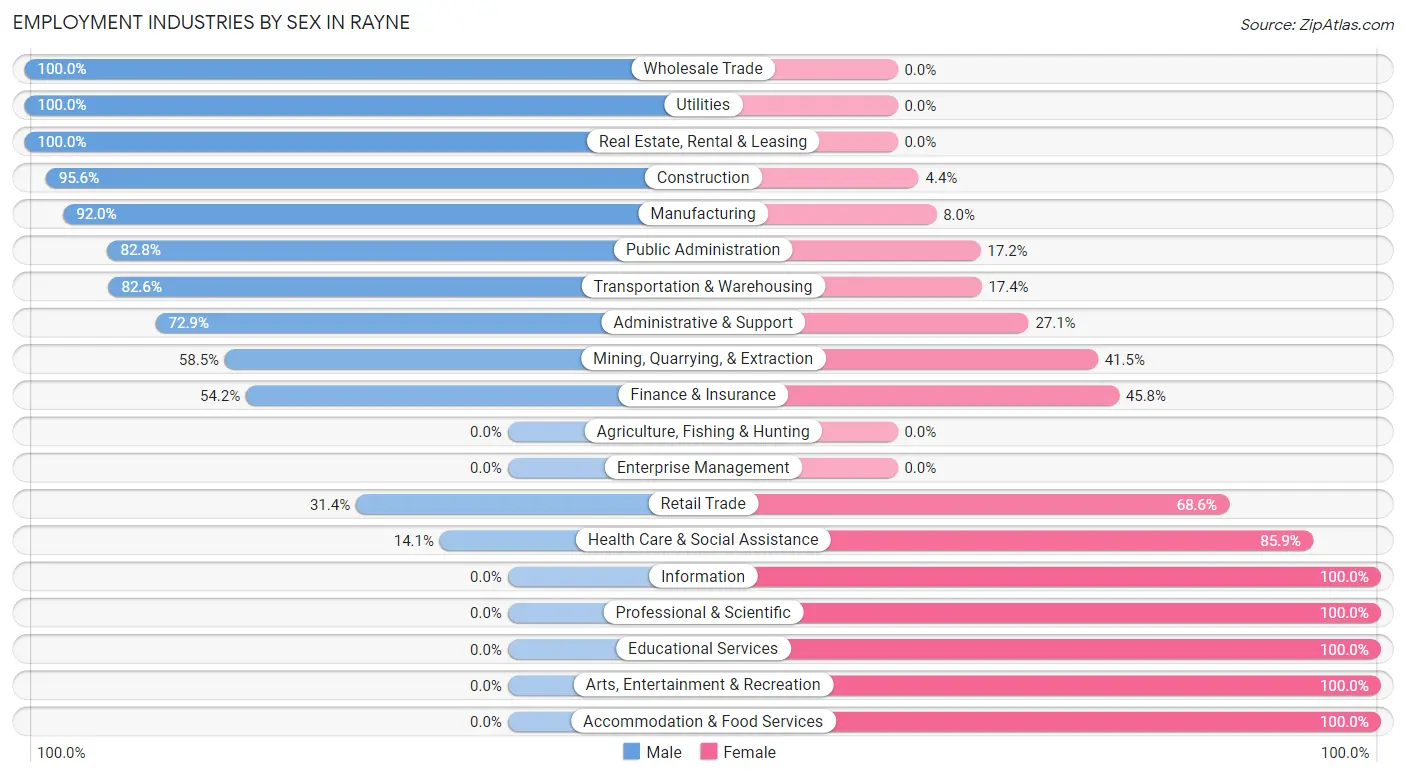
Employment Industries by Sex in Rayne
The Rayne industries that see more men than women are Wholesale Trade (100.0%), Utilities (100.0%), and Real Estate, Rental & Leasing (100.0%), whereas the industries that tend to have a higher number of women are Information (100.0%), Professional & Scientific (100.0%), and Educational Services (100.0%).
| Industry | Male | Female |
| Agriculture, Fishing & Hunting | 0 (0.0%) | 0 (0.0%) |
| Mining, Quarrying, & Extraction | 48 (58.5%) | 34 (41.5%) |
| Construction | 109 (95.6%) | 5 (4.4%) |
| Manufacturing | 252 (92.0%) | 22 (8.0%) |
| Wholesale Trade | 61 (100.0%) | 0 (0.0%) |
| Retail Trade | 125 (31.4%) | 273 (68.6%) |
| Transportation & Warehousing | 95 (82.6%) | 20 (17.4%) |
| Utilities | 146 (100.0%) | 0 (0.0%) |
| Information | 0 (0.0%) | 18 (100.0%) |
| Finance & Insurance | 52 (54.2%) | 44 (45.8%) |
| Real Estate, Rental & Leasing | 15 (100.0%) | 0 (0.0%) |
| Professional & Scientific | 0 (0.0%) | 138 (100.0%) |
| Enterprise Management | 0 (0.0%) | 0 (0.0%) |
| Administrative & Support | 86 (72.9%) | 32 (27.1%) |
| Educational Services | 0 (0.0%) | 212 (100.0%) |
| Health Care & Social Assistance | 54 (14.1%) | 330 (85.9%) |
| Arts, Entertainment & Recreation | 0 (0.0%) | 19 (100.0%) |
| Accommodation & Food Services | 0 (0.0%) | 143 (100.0%) |
| Public Administration | 188 (82.8%) | 39 (17.2%) |
| Total | 1,328 (49.1%) | 1,374 (50.8%) |
Education in Rayne
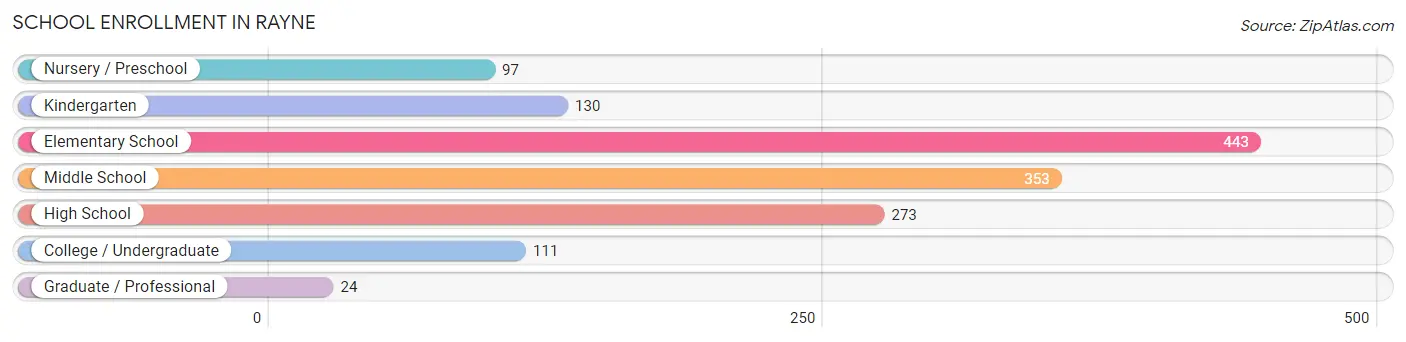
School Enrollment in Rayne
The most common levels of schooling among the 1,431 students in Rayne are elementary school (443 | 31.0%), middle school (353 | 24.7%), and high school (273 | 19.1%).
| School Level | # Students | % Students |
| Nursery / Preschool | 97 | 6.8% |
| Kindergarten | 130 | 9.1% |
| Elementary School | 443 | 31.0% |
| Middle School | 353 | 24.7% |
| High School | 273 | 19.1% |
| College / Undergraduate | 111 | 7.8% |
| Graduate / Professional | 24 | 1.7% |
| Total | 1,431 | 100.0% |
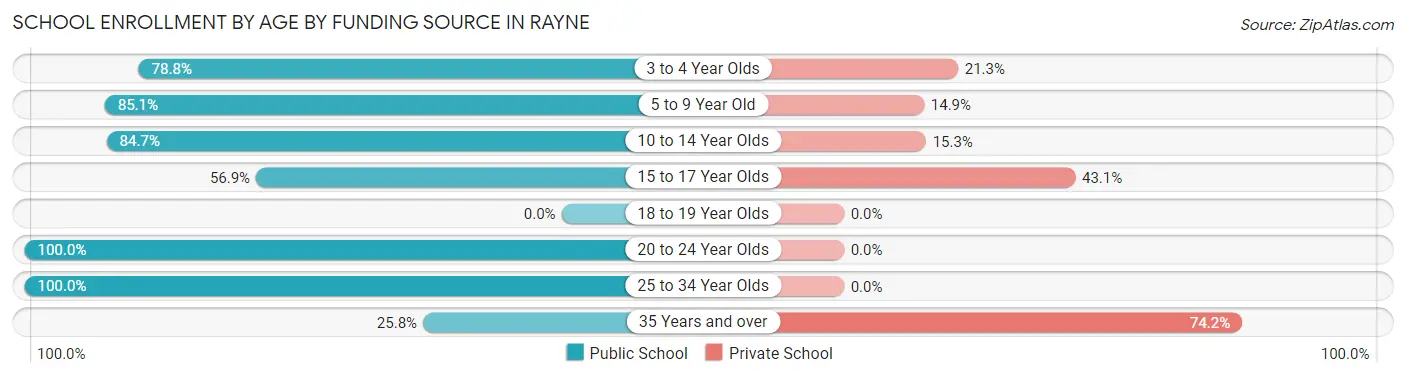
School Enrollment by Age by Funding Source in Rayne
Out of a total of 1,431 students who are enrolled in schools in Rayne, 292 (20.4%) attend a private institution, while the remaining 1,139 (79.6%) are enrolled in public schools. The age group of 35 years and over has the highest likelihood of being enrolled in private schools, with 23 (74.2% in the age bracket) enrolled. Conversely, the age group of 20 to 24 year olds has the lowest likelihood of being enrolled in a private school, with 46 (100.0% in the age bracket) attending a public institution.
| Age Bracket | Public School | Private School |
| 3 to 4 Year Olds | 63 (78.7%) | 17 (21.2%) |
| 5 to 9 Year Old | 444 (85.1%) | 78 (14.9%) |
| 10 to 14 Year Olds | 377 (84.7%) | 68 (15.3%) |
| 15 to 17 Year Olds | 140 (56.9%) | 106 (43.1%) |
| 18 to 19 Year Olds | 0 (0.0%) | 0 (0.0%) |
| 20 to 24 Year Olds | 46 (100.0%) | 0 (0.0%) |
| 25 to 34 Year Olds | 61 (100.0%) | 0 (0.0%) |
| 35 Years and over | 8 (25.8%) | 23 (74.2%) |
| Total | 1,139 (79.6%) | 292 (20.4%) |
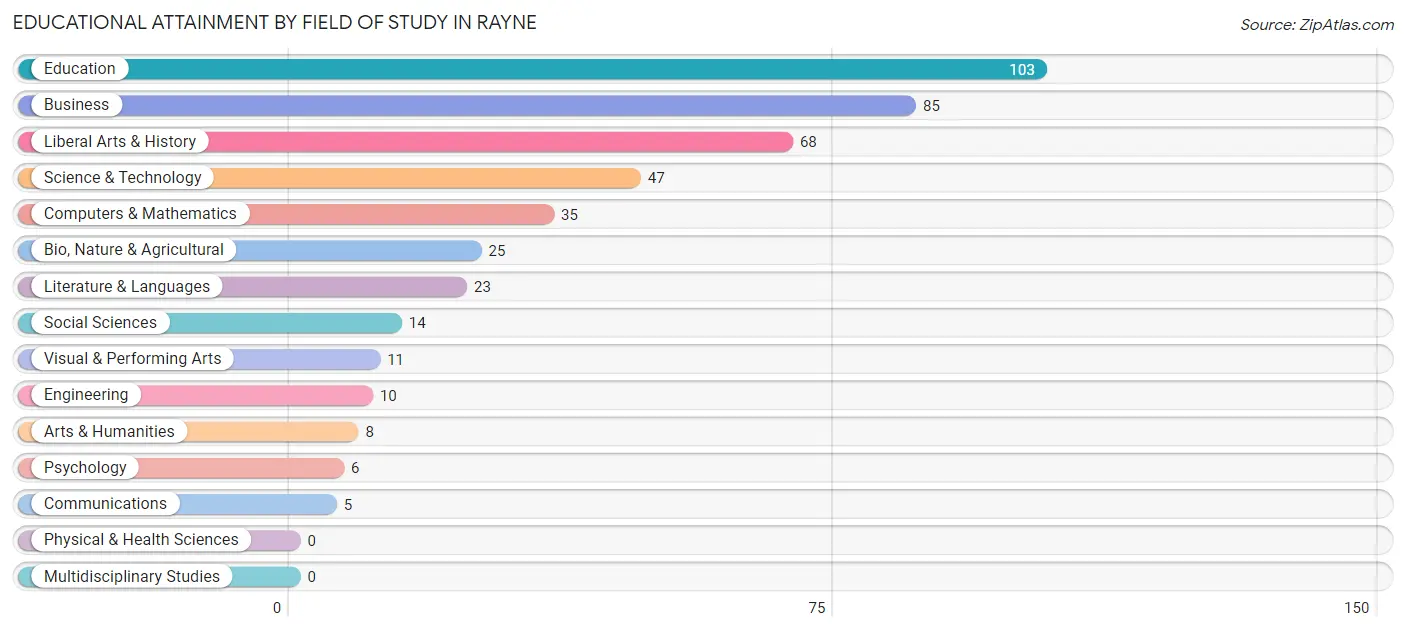
Educational Attainment by Field of Study in Rayne
Education (103 | 23.4%), business (85 | 19.3%), liberal arts & history (68 | 15.4%), science & technology (47 | 10.7%), and computers & mathematics (35 | 8.0%) are the most common fields of study among 440 individuals in Rayne who have obtained a bachelor's degree or higher.
| Field of Study | # Graduates | % Graduates |
| Computers & Mathematics | 35 | 8.0% |
| Bio, Nature & Agricultural | 25 | 5.7% |
| Physical & Health Sciences | 0 | 0.0% |
| Psychology | 6 | 1.4% |
| Social Sciences | 14 | 3.2% |
| Engineering | 10 | 2.3% |
| Multidisciplinary Studies | 0 | 0.0% |
| Science & Technology | 47 | 10.7% |
| Business | 85 | 19.3% |
| Education | 103 | 23.4% |
| Literature & Languages | 23 | 5.2% |
| Liberal Arts & History | 68 | 15.4% |
| Visual & Performing Arts | 11 | 2.5% |
| Communications | 5 | 1.1% |
| Arts & Humanities | 8 | 1.8% |
| Total | 440 | 100.0% |
Transportation & Commute in Rayne
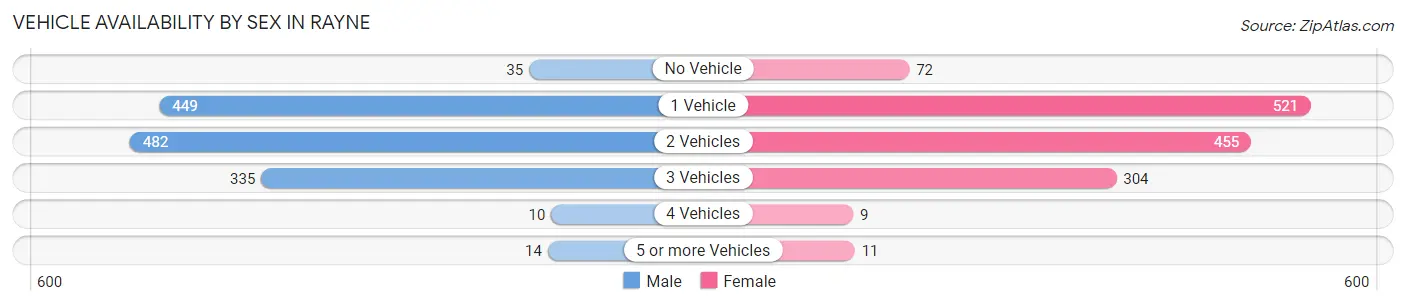
Vehicle Availability by Sex in Rayne
The most prevalent vehicle ownership categories in Rayne are males with 2 vehicles (482, accounting for 36.4%) and females with 2 vehicles (455, making up 35.1%).
| Vehicles Available | Male | Female |
| No Vehicle | 35 (2.6%) | 72 (5.2%) |
| 1 Vehicle | 449 (33.9%) | 521 (38.0%) |
| 2 Vehicles | 482 (36.4%) | 455 (33.2%) |
| 3 Vehicles | 335 (25.3%) | 304 (22.2%) |
| 4 Vehicles | 10 (0.7%) | 9 (0.7%) |
| 5 or more Vehicles | 14 (1.1%) | 11 (0.8%) |
| Total | 1,325 (100.0%) | 1,372 (100.0%) |
Commute Time in Rayne
The most frequently occuring commute durations in Rayne are 10 to 14 minutes (639 commuters, 23.7%), 30 to 34 minutes (566 commuters, 21.0%), and 20 to 24 minutes (426 commuters, 15.8%).
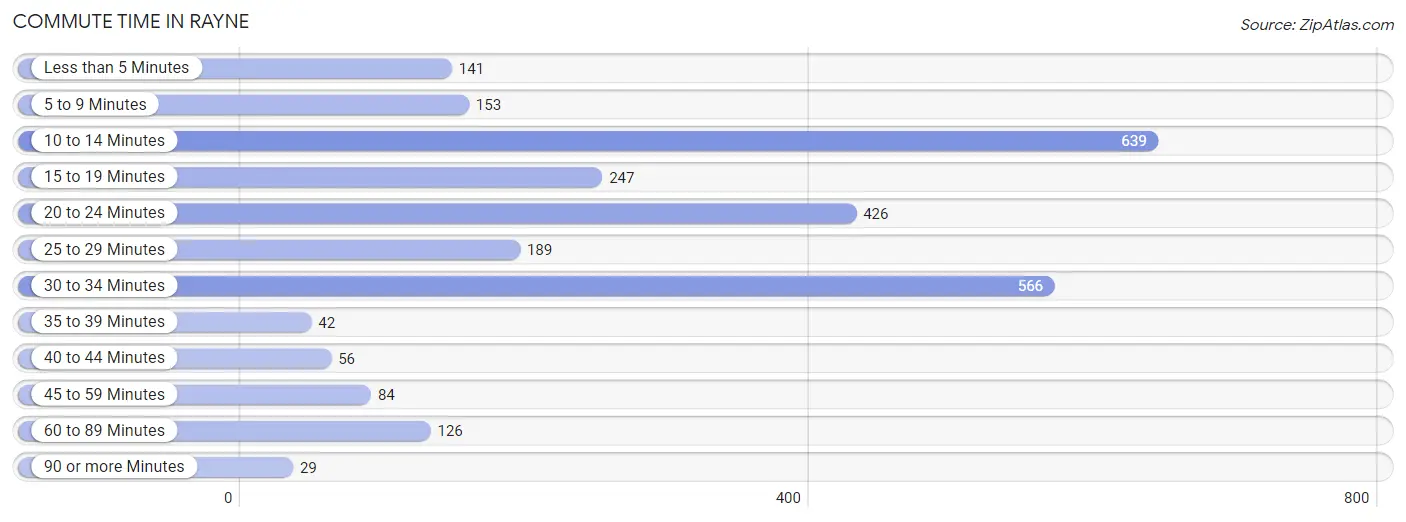
| Commute Time | # Commuters | % Commuters |
| Less than 5 Minutes | 141 | 5.2% |
| 5 to 9 Minutes | 153 | 5.7% |
| 10 to 14 Minutes | 639 | 23.7% |
| 15 to 19 Minutes | 247 | 9.1% |
| 20 to 24 Minutes | 426 | 15.8% |
| 25 to 29 Minutes | 189 | 7.0% |
| 30 to 34 Minutes | 566 | 21.0% |
| 35 to 39 Minutes | 42 | 1.6% |
| 40 to 44 Minutes | 56 | 2.1% |
| 45 to 59 Minutes | 84 | 3.1% |
| 60 to 89 Minutes | 126 | 4.7% |
| 90 or more Minutes | 29 | 1.1% |
Commute Time by Sex in Rayne
The most common commute times in Rayne are 10 to 14 minutes (462 commuters, 34.8%) for males and 30 to 34 minutes (325 commuters, 23.7%) for females.
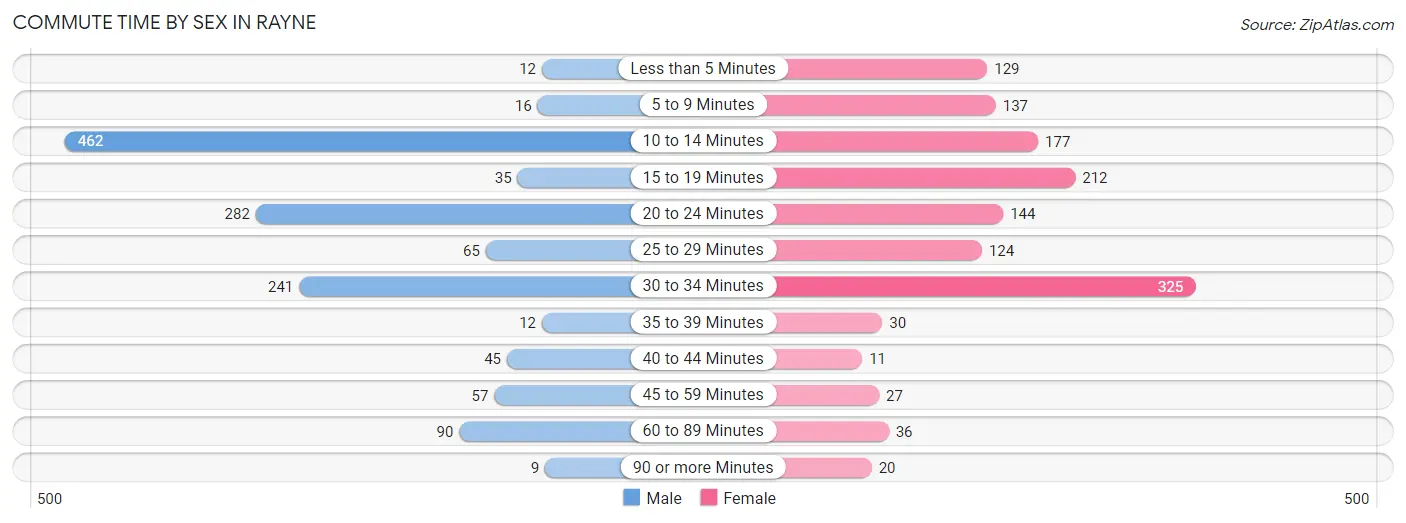
| Commute Time | Male | Female |
| Less than 5 Minutes | 12 (0.9%) | 129 (9.4%) |
| 5 to 9 Minutes | 16 (1.2%) | 137 (10.0%) |
| 10 to 14 Minutes | 462 (34.8%) | 177 (12.9%) |
| 15 to 19 Minutes | 35 (2.6%) | 212 (15.4%) |
| 20 to 24 Minutes | 282 (21.3%) | 144 (10.5%) |
| 25 to 29 Minutes | 65 (4.9%) | 124 (9.0%) |
| 30 to 34 Minutes | 241 (18.2%) | 325 (23.7%) |
| 35 to 39 Minutes | 12 (0.9%) | 30 (2.2%) |
| 40 to 44 Minutes | 45 (3.4%) | 11 (0.8%) |
| 45 to 59 Minutes | 57 (4.3%) | 27 (2.0%) |
| 60 to 89 Minutes | 90 (6.8%) | 36 (2.6%) |
| 90 or more Minutes | 9 (0.7%) | 20 (1.5%) |
Time of Departure to Work by Sex in Rayne
The most frequent times of departure to work in Rayne are 7:00 AM to 7:29 AM (307, 23.2%) for males and 7:00 AM to 7:29 AM (279, 20.3%) for females.
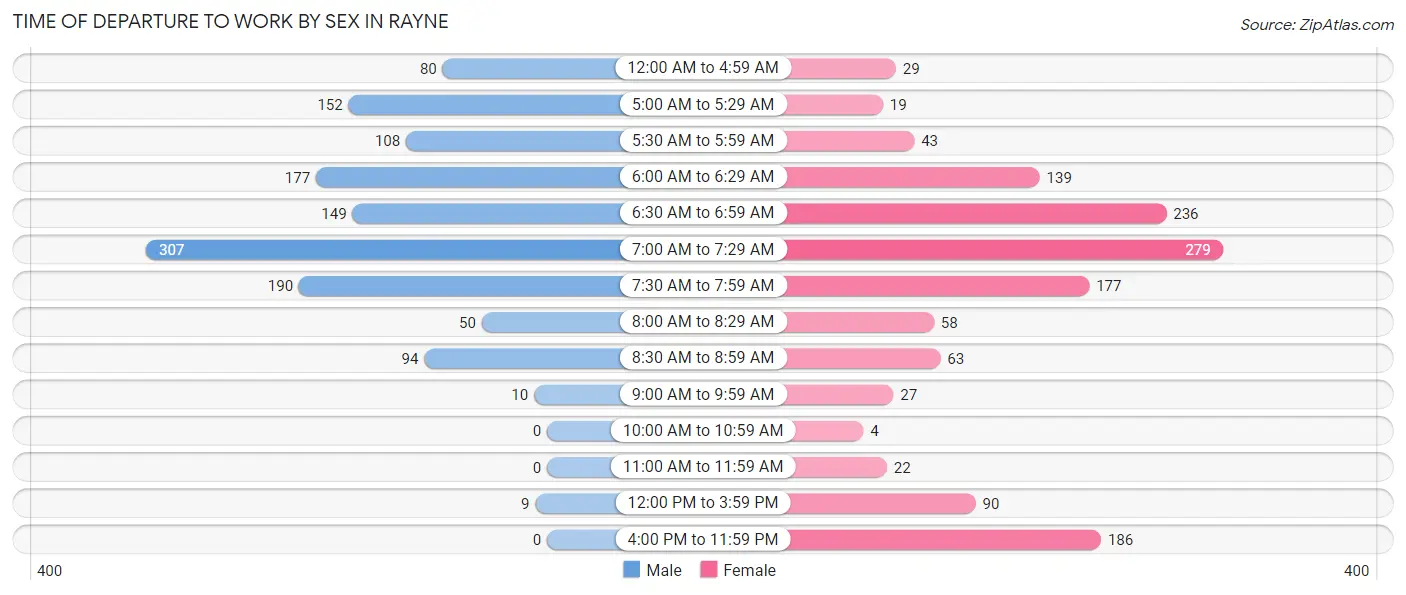
| Time of Departure | Male | Female |
| 12:00 AM to 4:59 AM | 80 (6.0%) | 29 (2.1%) |
| 5:00 AM to 5:29 AM | 152 (11.5%) | 19 (1.4%) |
| 5:30 AM to 5:59 AM | 108 (8.1%) | 43 (3.1%) |
| 6:00 AM to 6:29 AM | 177 (13.4%) | 139 (10.1%) |
| 6:30 AM to 6:59 AM | 149 (11.2%) | 236 (17.2%) |
| 7:00 AM to 7:29 AM | 307 (23.2%) | 279 (20.3%) |
| 7:30 AM to 7:59 AM | 190 (14.3%) | 177 (12.9%) |
| 8:00 AM to 8:29 AM | 50 (3.8%) | 58 (4.2%) |
| 8:30 AM to 8:59 AM | 94 (7.1%) | 63 (4.6%) |
| 9:00 AM to 9:59 AM | 10 (0.7%) | 27 (2.0%) |
| 10:00 AM to 10:59 AM | 0 (0.0%) | 4 (0.3%) |
| 11:00 AM to 11:59 AM | 0 (0.0%) | 22 (1.6%) |
| 12:00 PM to 3:59 PM | 9 (0.7%) | 90 (6.6%) |
| 4:00 PM to 11:59 PM | 0 (0.0%) | 186 (13.6%) |
| Total | 1,326 (100.0%) | 1,372 (100.0%) |
Housing Occupancy in Rayne
Occupancy by Ownership in Rayne
Of the total 2,865 dwellings in Rayne, owner-occupied units account for 1,594 (55.6%), while renter-occupied units make up 1,271 (44.4%).
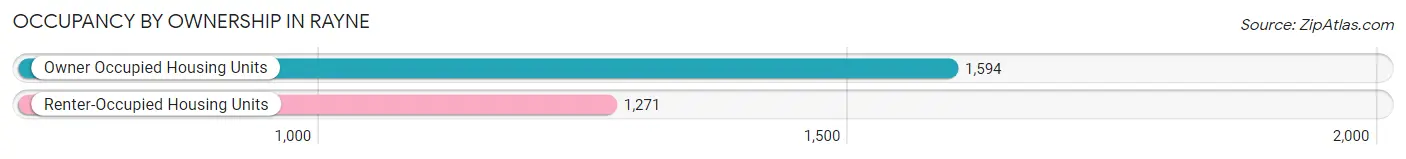
| Occupancy | # Housing Units | % Housing Units |
| Owner Occupied Housing Units | 1,594 | 55.6% |
| Renter-Occupied Housing Units | 1,271 | 44.4% |
| Total Occupied Housing Units | 2,865 | 100.0% |
Occupancy by Household Size in Rayne
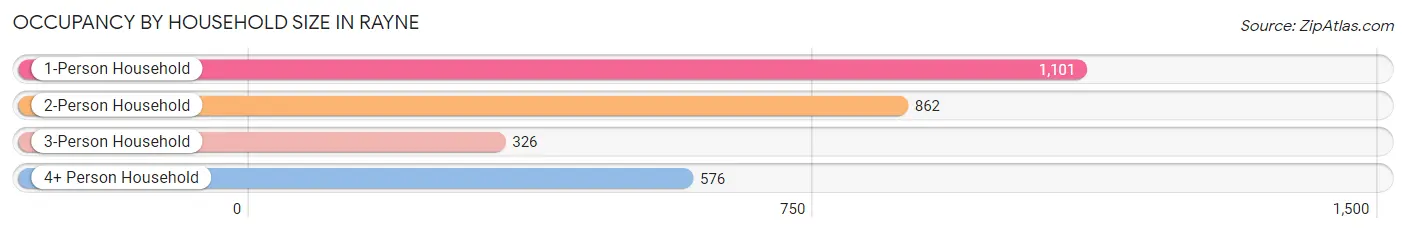
| Household Size | # Housing Units | % Housing Units |
| 1-Person Household | 1,101 | 38.4% |
| 2-Person Household | 862 | 30.1% |
| 3-Person Household | 326 | 11.4% |
| 4+ Person Household | 576 | 20.1% |
| Total Housing Units | 2,865 | 100.0% |
Occupancy by Ownership by Household Size in Rayne
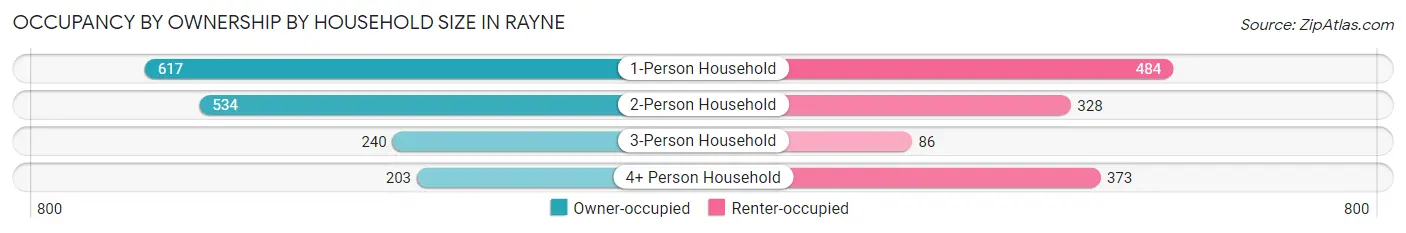
| Household Size | Owner-occupied | Renter-occupied |
| 1-Person Household | 617 (56.0%) | 484 (44.0%) |
| 2-Person Household | 534 (62.0%) | 328 (38.1%) |
| 3-Person Household | 240 (73.6%) | 86 (26.4%) |
| 4+ Person Household | 203 (35.2%) | 373 (64.8%) |
| Total Housing Units | 1,594 (55.6%) | 1,271 (44.4%) |
Occupancy by Educational Attainment in Rayne
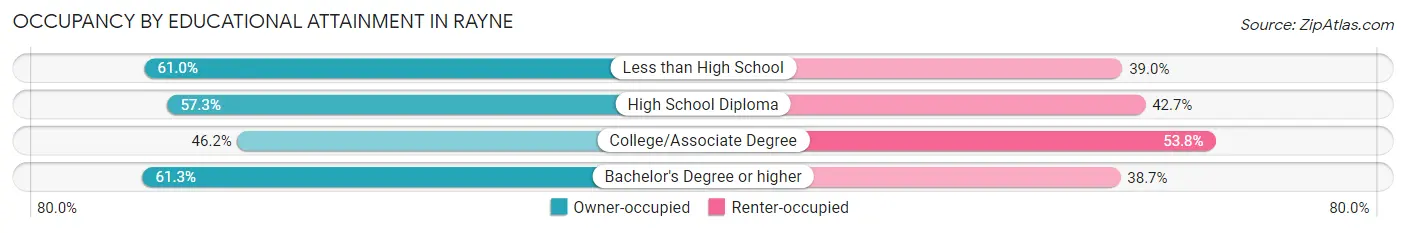
| Household Size | Owner-occupied | Renter-occupied |
| Less than High School | 328 (61.0%) | 210 (39.0%) |
| High School Diploma | 763 (57.3%) | 568 (42.7%) |
| College/Associate Degree | 329 (46.2%) | 383 (53.8%) |
| Bachelor's Degree or higher | 174 (61.3%) | 110 (38.7%) |
Occupancy by Age of Householder in Rayne
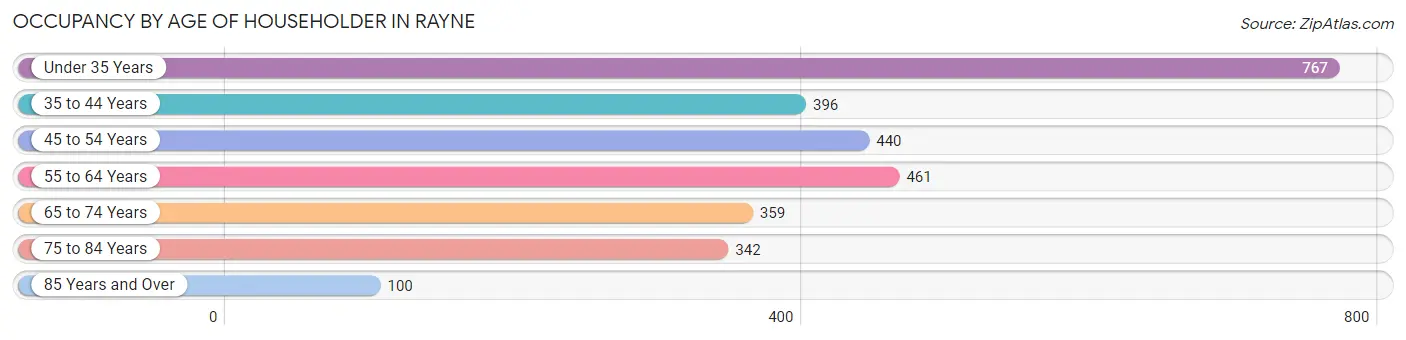
| Age Bracket | # Households | % Households |
| Under 35 Years | 767 | 26.8% |
| 35 to 44 Years | 396 | 13.8% |
| 45 to 54 Years | 440 | 15.4% |
| 55 to 64 Years | 461 | 16.1% |
| 65 to 74 Years | 359 | 12.5% |
| 75 to 84 Years | 342 | 11.9% |
| 85 Years and Over | 100 | 3.5% |
| Total | 2,865 | 100.0% |
Housing Finances in Rayne
Median Income by Occupancy in Rayne
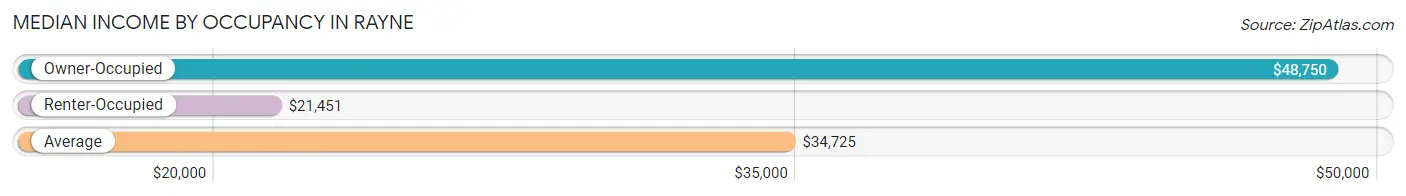
| Occupancy Type | # Households | Median Income |
| Owner-Occupied | 1,594 (55.6%) | $48,750 |
| Renter-Occupied | 1,271 (44.4%) | $21,451 |
| Average | 2,865 (100.0%) | $34,725 |
Occupancy by Householder Income Bracket in Rayne
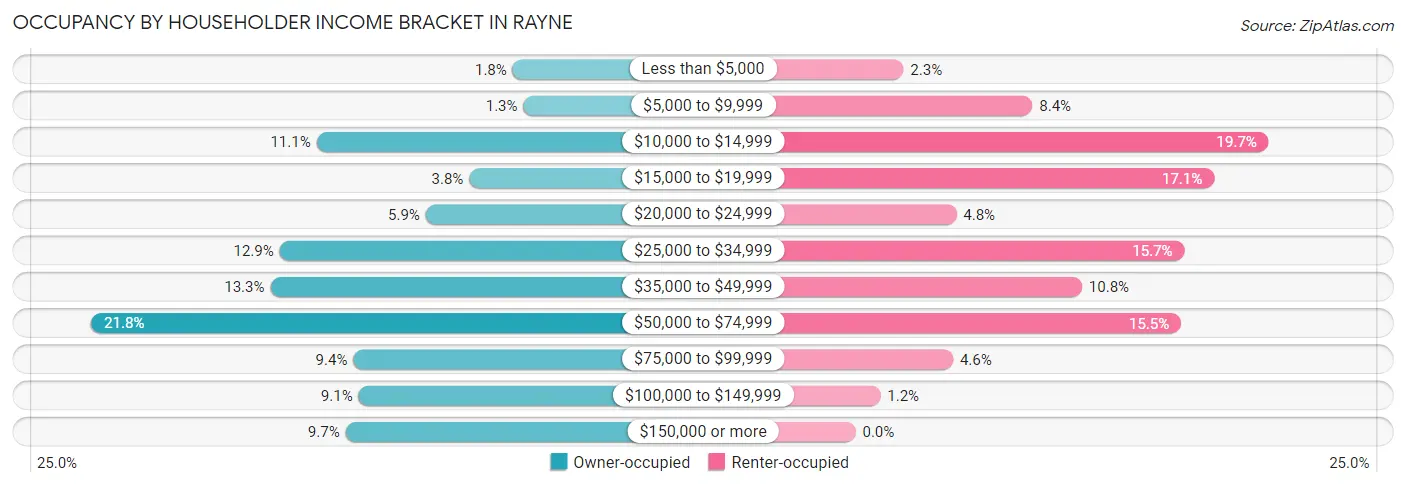
| Income Bracket | Owner-occupied | Renter-occupied |
| Less than $5,000 | 28 (1.8%) | 29 (2.3%) |
| $5,000 to $9,999 | 20 (1.3%) | 107 (8.4%) |
| $10,000 to $14,999 | 177 (11.1%) | 250 (19.7%) |
| $15,000 to $19,999 | 61 (3.8%) | 217 (17.1%) |
| $20,000 to $24,999 | 94 (5.9%) | 61 (4.8%) |
| $25,000 to $34,999 | 205 (12.9%) | 199 (15.7%) |
| $35,000 to $49,999 | 212 (13.3%) | 137 (10.8%) |
| $50,000 to $74,999 | 348 (21.8%) | 197 (15.5%) |
| $75,000 to $99,999 | 149 (9.3%) | 59 (4.6%) |
| $100,000 to $149,999 | 145 (9.1%) | 15 (1.2%) |
| $150,000 or more | 155 (9.7%) | 0 (0.0%) |
| Total | 1,594 (100.0%) | 1,271 (100.0%) |
Monthly Housing Cost Tiers in Rayne
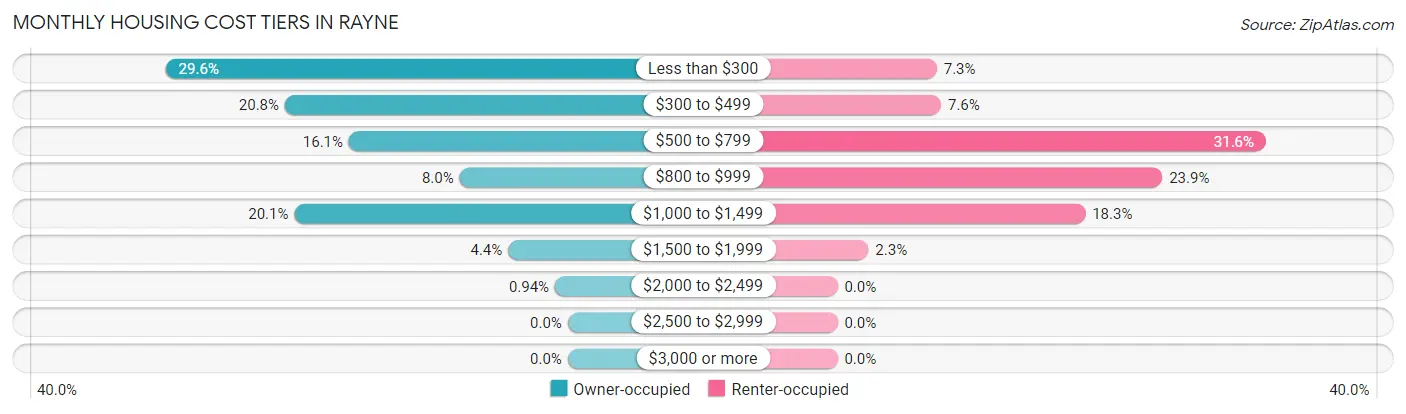
| Monthly Cost | Owner-occupied | Renter-occupied |
| Less than $300 | 472 (29.6%) | 93 (7.3%) |
| $300 to $499 | 332 (20.8%) | 97 (7.6%) |
| $500 to $799 | 257 (16.1%) | 401 (31.6%) |
| $800 to $999 | 127 (8.0%) | 304 (23.9%) |
| $1,000 to $1,499 | 321 (20.1%) | 232 (18.2%) |
| $1,500 to $1,999 | 70 (4.4%) | 29 (2.3%) |
| $2,000 to $2,499 | 15 (0.9%) | 0 (0.0%) |
| $2,500 to $2,999 | 0 (0.0%) | 0 (0.0%) |
| $3,000 or more | 0 (0.0%) | 0 (0.0%) |
| Total | 1,594 (100.0%) | 1,271 (100.0%) |
Physical Housing Characteristics in Rayne
Housing Structures in Rayne
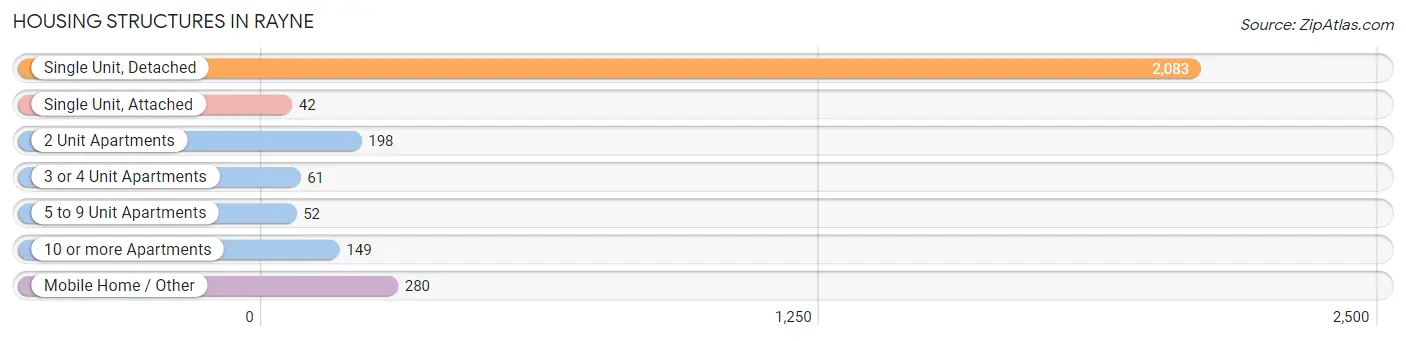
| Structure Type | # Housing Units | % Housing Units |
| Single Unit, Detached | 2,083 | 72.7% |
| Single Unit, Attached | 42 | 1.5% |
| 2 Unit Apartments | 198 | 6.9% |
| 3 or 4 Unit Apartments | 61 | 2.1% |
| 5 to 9 Unit Apartments | 52 | 1.8% |
| 10 or more Apartments | 149 | 5.2% |
| Mobile Home / Other | 280 | 9.8% |
| Total | 2,865 | 100.0% |
Housing Structures by Occupancy in Rayne
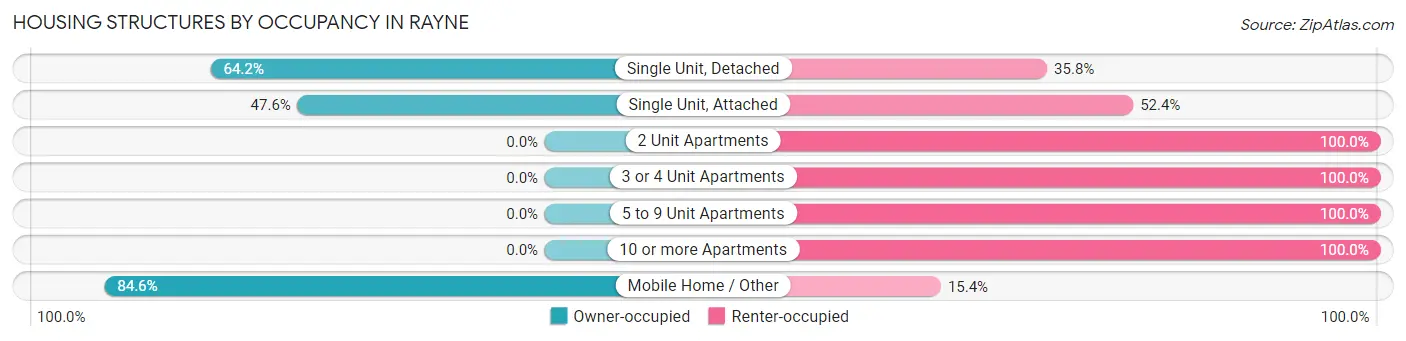
| Structure Type | Owner-occupied | Renter-occupied |
| Single Unit, Detached | 1,337 (64.2%) | 746 (35.8%) |
| Single Unit, Attached | 20 (47.6%) | 22 (52.4%) |
| 2 Unit Apartments | 0 (0.0%) | 198 (100.0%) |
| 3 or 4 Unit Apartments | 0 (0.0%) | 61 (100.0%) |
| 5 to 9 Unit Apartments | 0 (0.0%) | 52 (100.0%) |
| 10 or more Apartments | 0 (0.0%) | 149 (100.0%) |
| Mobile Home / Other | 237 (84.6%) | 43 (15.4%) |
| Total | 1,594 (55.6%) | 1,271 (44.4%) |
Housing Structures by Number of Rooms in Rayne
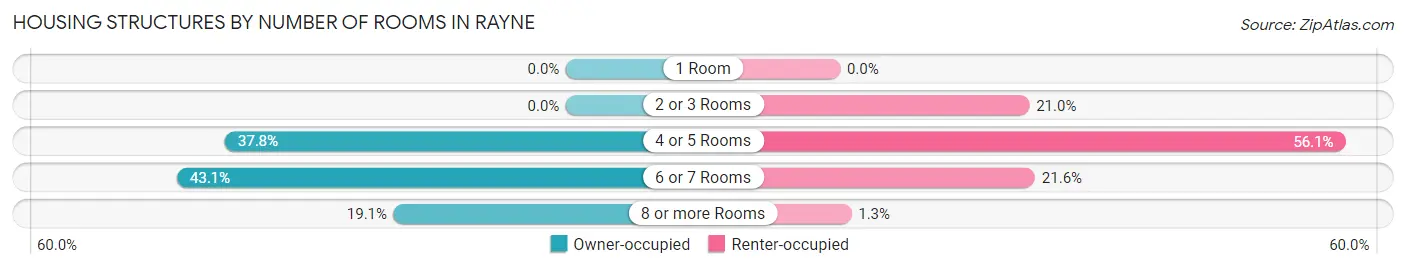
| Number of Rooms | Owner-occupied | Renter-occupied |
| 1 Room | 0 (0.0%) | 0 (0.0%) |
| 2 or 3 Rooms | 0 (0.0%) | 267 (21.0%) |
| 4 or 5 Rooms | 602 (37.8%) | 713 (56.1%) |
| 6 or 7 Rooms | 687 (43.1%) | 275 (21.6%) |
| 8 or more Rooms | 305 (19.1%) | 16 (1.3%) |
| Total | 1,594 (100.0%) | 1,271 (100.0%) |
Housing Structure by Heating Type in Rayne
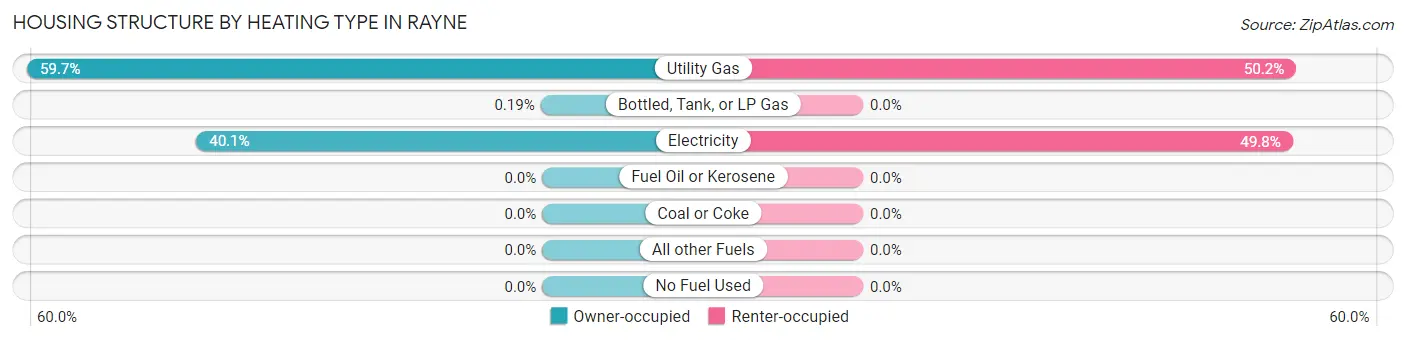
| Heating Type | Owner-occupied | Renter-occupied |
| Utility Gas | 952 (59.7%) | 638 (50.2%) |
| Bottled, Tank, or LP Gas | 3 (0.2%) | 0 (0.0%) |
| Electricity | 639 (40.1%) | 633 (49.8%) |
| Fuel Oil or Kerosene | 0 (0.0%) | 0 (0.0%) |
| Coal or Coke | 0 (0.0%) | 0 (0.0%) |
| All other Fuels | 0 (0.0%) | 0 (0.0%) |
| No Fuel Used | 0 (0.0%) | 0 (0.0%) |
| Total | 1,594 (100.0%) | 1,271 (100.0%) |
Household Vehicle Usage in Rayne
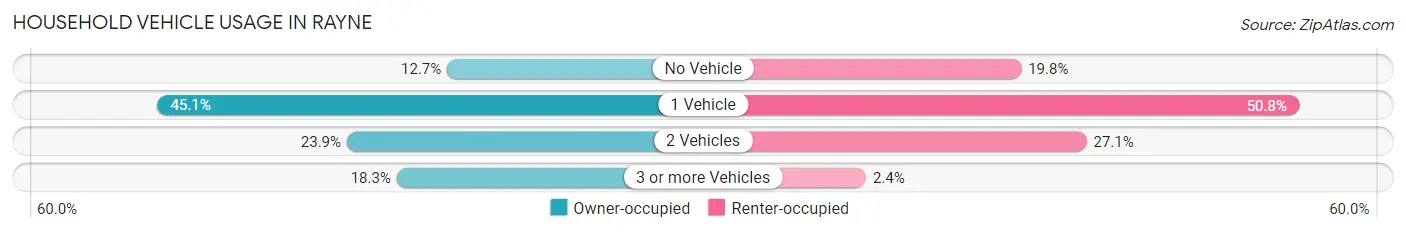
| Vehicles per Household | Owner-occupied | Renter-occupied |
| No Vehicle | 202 (12.7%) | 251 (19.8%) |
| 1 Vehicle | 719 (45.1%) | 646 (50.8%) |
| 2 Vehicles | 381 (23.9%) | 344 (27.1%) |
| 3 or more Vehicles | 292 (18.3%) | 30 (2.4%) |
| Total | 1,594 (100.0%) | 1,271 (100.0%) |
Real Estate & Mortgages in Rayne
Real Estate and Mortgage Overview in Rayne
| Characteristic | Without Mortgage | With Mortgage |
| Housing Units | 1,064 | 530 |
| Median Property Value | $91,700 | $161,300 |
| Median Household Income | $40,987 | $135 |
| Monthly Housing Costs | $325 | $0 |
| Real Estate Taxes | $199 | $73 |
Property Value by Mortgage Status in Rayne
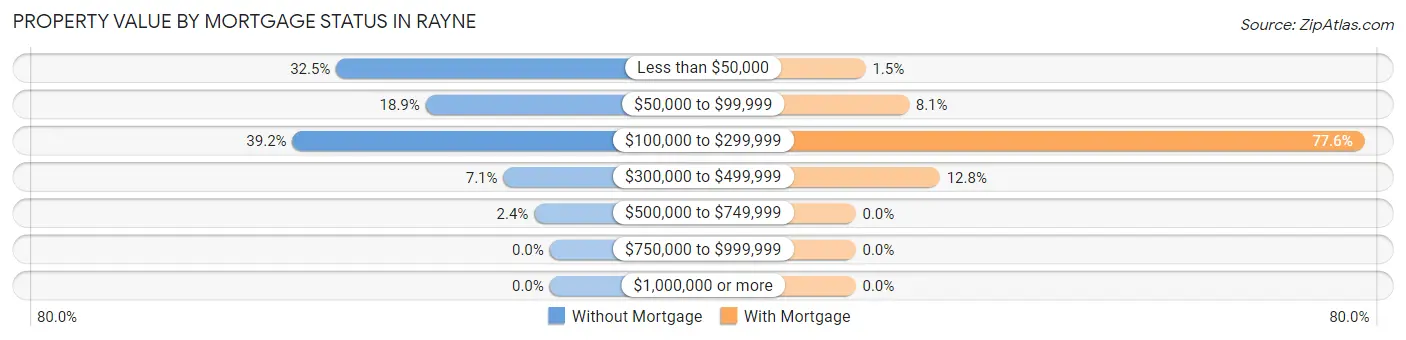
| Property Value | Without Mortgage | With Mortgage |
| Less than $50,000 | 346 (32.5%) | 8 (1.5%) |
| $50,000 to $99,999 | 201 (18.9%) | 43 (8.1%) |
| $100,000 to $299,999 | 417 (39.2%) | 411 (77.5%) |
| $300,000 to $499,999 | 75 (7.0%) | 68 (12.8%) |
| $500,000 to $749,999 | 25 (2.4%) | 0 (0.0%) |
| $750,000 to $999,999 | 0 (0.0%) | 0 (0.0%) |
| $1,000,000 or more | 0 (0.0%) | 0 (0.0%) |
| Total | 1,064 (100.0%) | 530 (100.0%) |
Household Income by Mortgage Status in Rayne
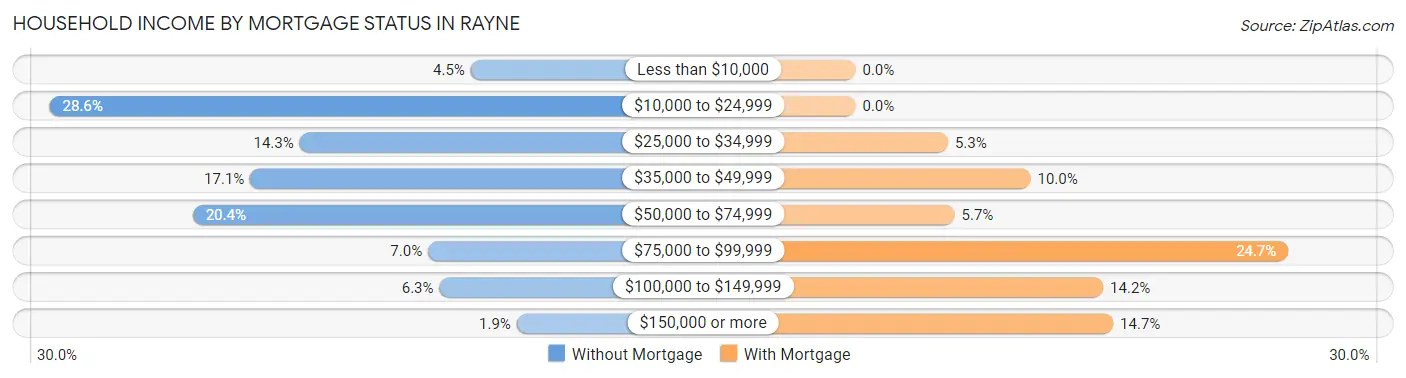
| Household Income | Without Mortgage | With Mortgage |
| Less than $10,000 | 48 (4.5%) | 0 (0.0%) |
| $10,000 to $24,999 | 304 (28.6%) | 0 (0.0%) |
| $25,000 to $34,999 | 152 (14.3%) | 28 (5.3%) |
| $35,000 to $49,999 | 182 (17.1%) | 53 (10.0%) |
| $50,000 to $74,999 | 217 (20.4%) | 30 (5.7%) |
| $75,000 to $99,999 | 74 (7.0%) | 131 (24.7%) |
| $100,000 to $149,999 | 67 (6.3%) | 75 (14.1%) |
| $150,000 or more | 20 (1.9%) | 78 (14.7%) |
| Total | 1,064 (100.0%) | 530 (100.0%) |
Property Value to Household Income Ratio in Rayne
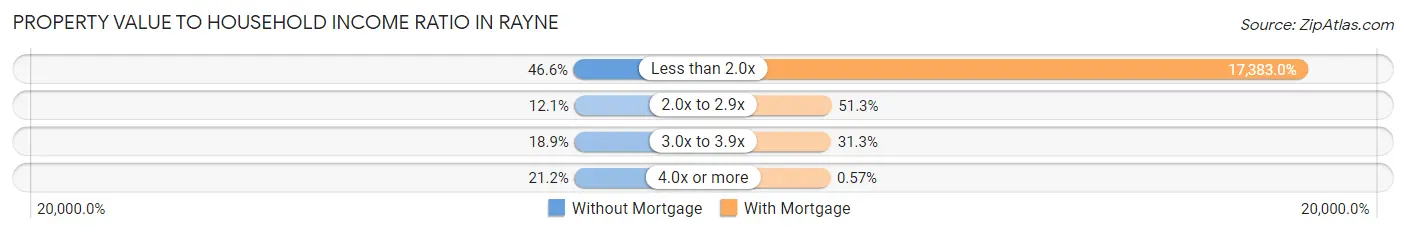
| Value-to-Income Ratio | Without Mortgage | With Mortgage |
| Less than 2.0x | 496 (46.6%) | 92,130 (17,383.0%) |
| 2.0x to 2.9x | 129 (12.1%) | 272 (51.3%) |
| 3.0x to 3.9x | 201 (18.9%) | 166 (31.3%) |
| 4.0x or more | 226 (21.2%) | 3 (0.6%) |
| Total | 1,064 (100.0%) | 530 (100.0%) |
Real Estate Taxes by Mortgage Status in Rayne
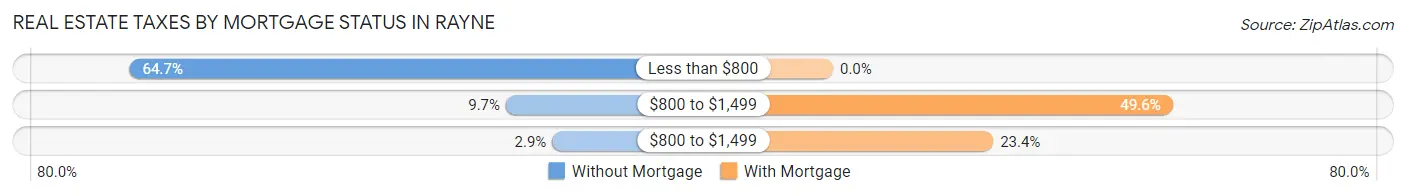
| Property Taxes | Without Mortgage | With Mortgage |
| Less than $800 | 688 (64.7%) | 0 (0.0%) |
| $800 to $1,499 | 103 (9.7%) | 263 (49.6%) |
| $800 to $1,499 | 31 (2.9%) | 124 (23.4%) |
| Total | 1,064 (100.0%) | 530 (100.0%) |
Health & Disability in Rayne
Health Insurance Coverage by Age in Rayne
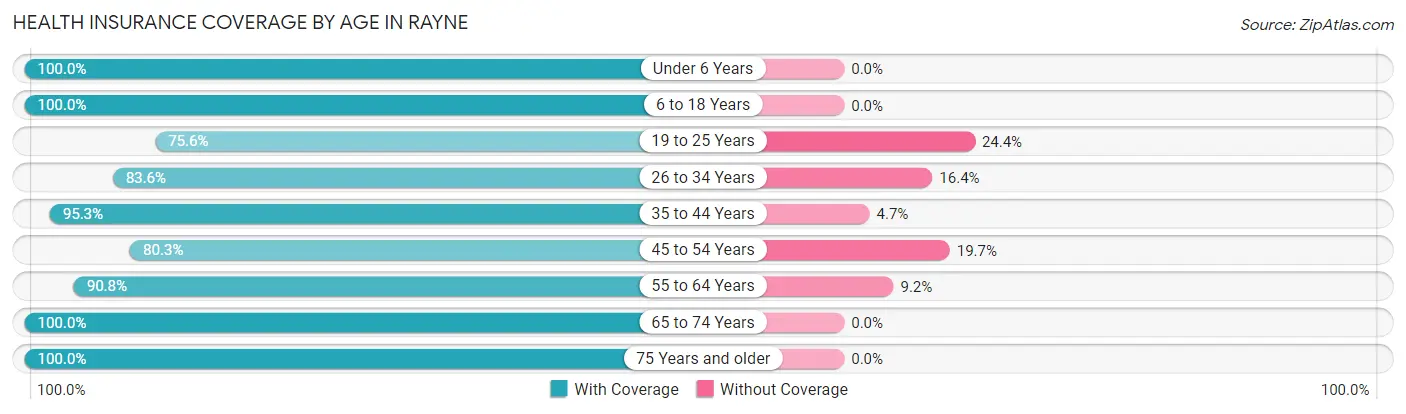
| Age Bracket | With Coverage | Without Coverage |
| Under 6 Years | 826 (100.0%) | 0 (0.0%) |
| 6 to 18 Years | 1,290 (100.0%) | 0 (0.0%) |
| 19 to 25 Years | 323 (75.6%) | 104 (24.4%) |
| 26 to 34 Years | 824 (83.6%) | 162 (16.4%) |
| 35 to 44 Years | 827 (95.3%) | 41 (4.7%) |
| 45 to 54 Years | 629 (80.3%) | 154 (19.7%) |
| 55 to 64 Years | 712 (90.8%) | 72 (9.2%) |
| 65 to 74 Years | 552 (100.0%) | 0 (0.0%) |
| 75 Years and older | 564 (100.0%) | 0 (0.0%) |
| Total | 6,547 (92.5%) | 533 (7.5%) |
Health Insurance Coverage by Citizenship Status in Rayne
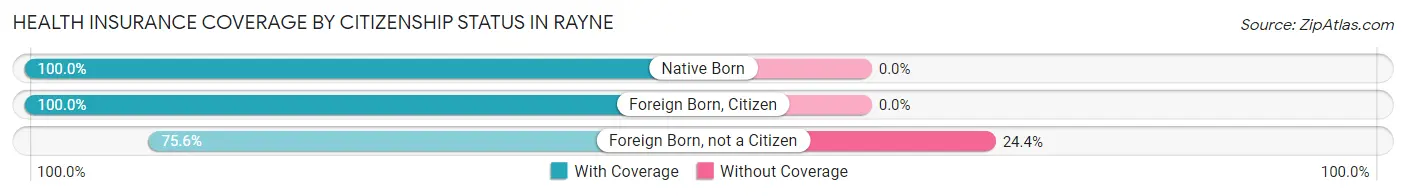
| Citizenship Status | With Coverage | Without Coverage |
| Native Born | 826 (100.0%) | 0 (0.0%) |
| Foreign Born, Citizen | 1,290 (100.0%) | 0 (0.0%) |
| Foreign Born, not a Citizen | 323 (75.6%) | 104 (24.4%) |
Health Insurance Coverage by Household Income in Rayne
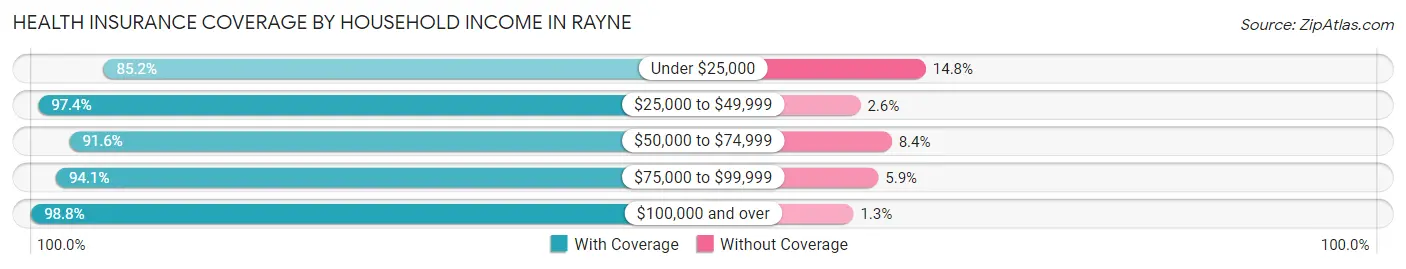
| Household Income | With Coverage | Without Coverage |
| Under $25,000 | 1,817 (85.2%) | 316 (14.8%) |
| $25,000 to $49,999 | 1,563 (97.4%) | 41 (2.6%) |
| $50,000 to $74,999 | 1,296 (91.6%) | 119 (8.4%) |
| $75,000 to $99,999 | 669 (94.1%) | 42 (5.9%) |
| $100,000 and over | 1,184 (98.8%) | 15 (1.3%) |
Public vs Private Health Insurance Coverage by Age in Rayne
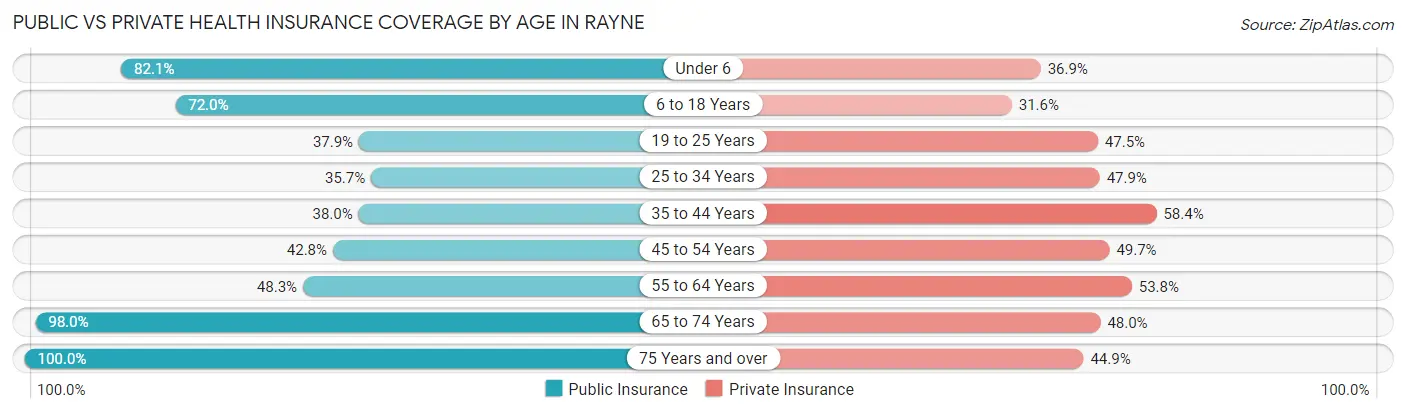
| Age Bracket | Public Insurance | Private Insurance |
| Under 6 | 678 (82.1%) | 305 (36.9%) |
| 6 to 18 Years | 929 (72.0%) | 407 (31.6%) |
| 19 to 25 Years | 162 (37.9%) | 203 (47.5%) |
| 25 to 34 Years | 352 (35.7%) | 472 (47.9%) |
| 35 to 44 Years | 330 (38.0%) | 507 (58.4%) |
| 45 to 54 Years | 335 (42.8%) | 389 (49.7%) |
| 55 to 64 Years | 379 (48.3%) | 422 (53.8%) |
| 65 to 74 Years | 541 (98.0%) | 265 (48.0%) |
| 75 Years and over | 564 (100.0%) | 253 (44.9%) |
| Total | 4,270 (60.3%) | 3,223 (45.5%) |
Disability Status by Sex by Age in Rayne
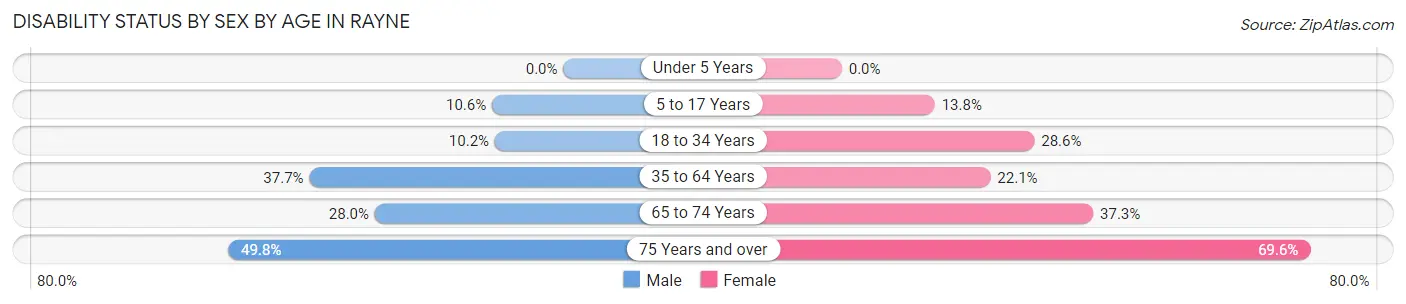
| Age Bracket | Male | Female |
| Under 5 Years | 0 (0.0%) | 0 (0.0%) |
| 5 to 17 Years | 56 (10.6%) | 106 (13.8%) |
| 18 to 34 Years | 64 (10.2%) | 267 (28.6%) |
| 35 to 64 Years | 503 (37.7%) | 243 (22.1%) |
| 65 to 74 Years | 75 (28.0%) | 106 (37.3%) |
| 75 Years and over | 114 (49.8%) | 233 (69.6%) |
Disability Class by Sex by Age in Rayne
Disability Class: Hearing Difficulty
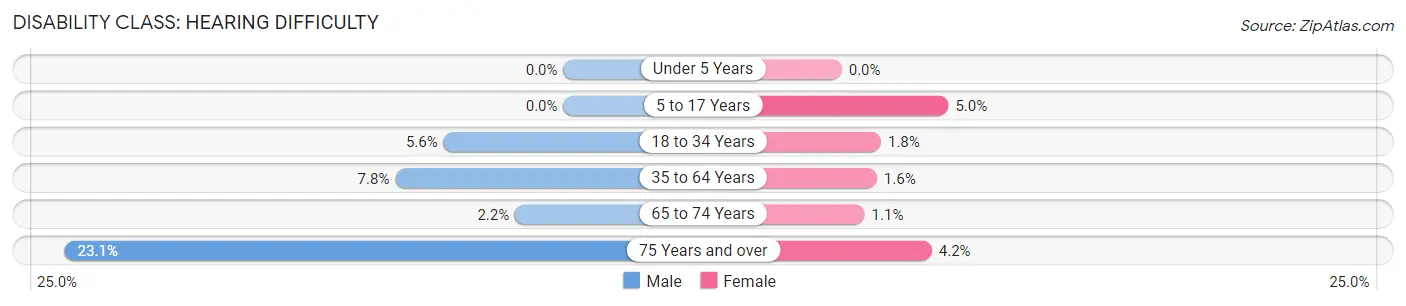
| Age Bracket | Male | Female |
| Under 5 Years | 0 (0.0%) | 0 (0.0%) |
| 5 to 17 Years | 0 (0.0%) | 38 (5.0%) |
| 18 to 34 Years | 35 (5.6%) | 17 (1.8%) |
| 35 to 64 Years | 104 (7.8%) | 18 (1.6%) |
| 65 to 74 Years | 6 (2.2%) | 3 (1.1%) |
| 75 Years and over | 53 (23.1%) | 14 (4.2%) |
Disability Class: Vision Difficulty
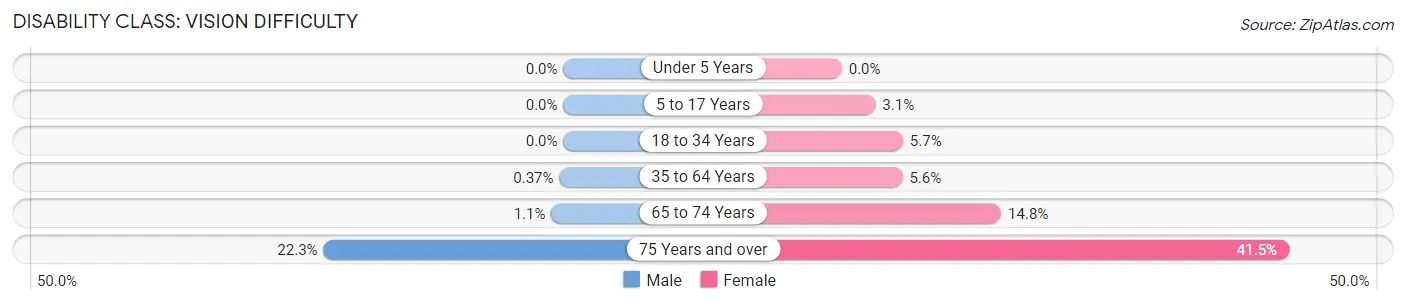
| Age Bracket | Male | Female |
| Under 5 Years | 0 (0.0%) | 0 (0.0%) |
| 5 to 17 Years | 0 (0.0%) | 24 (3.1%) |
| 18 to 34 Years | 0 (0.0%) | 53 (5.7%) |
| 35 to 64 Years | 5 (0.4%) | 62 (5.6%) |
| 65 to 74 Years | 3 (1.1%) | 42 (14.8%) |
| 75 Years and over | 51 (22.3%) | 139 (41.5%) |
Disability Class: Cognitive Difficulty
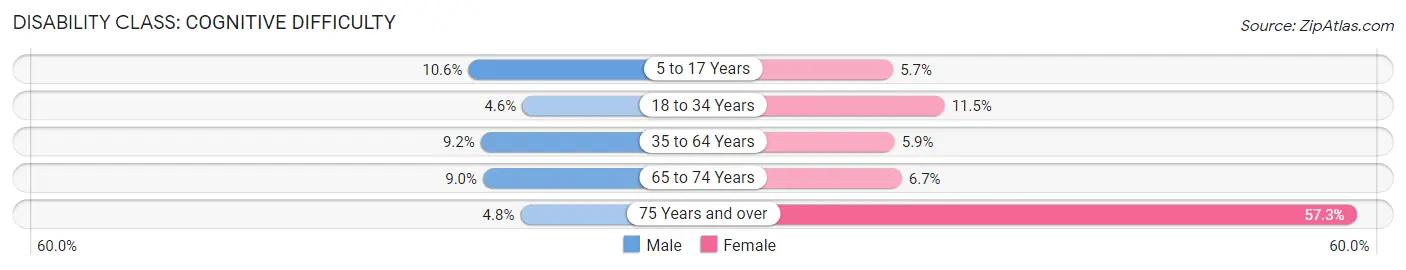
| Age Bracket | Male | Female |
| 5 to 17 Years | 56 (10.6%) | 44 (5.7%) |
| 18 to 34 Years | 29 (4.6%) | 107 (11.5%) |
| 35 to 64 Years | 123 (9.2%) | 65 (5.9%) |
| 65 to 74 Years | 24 (9.0%) | 19 (6.7%) |
| 75 Years and over | 11 (4.8%) | 192 (57.3%) |
Disability Class: Ambulatory Difficulty
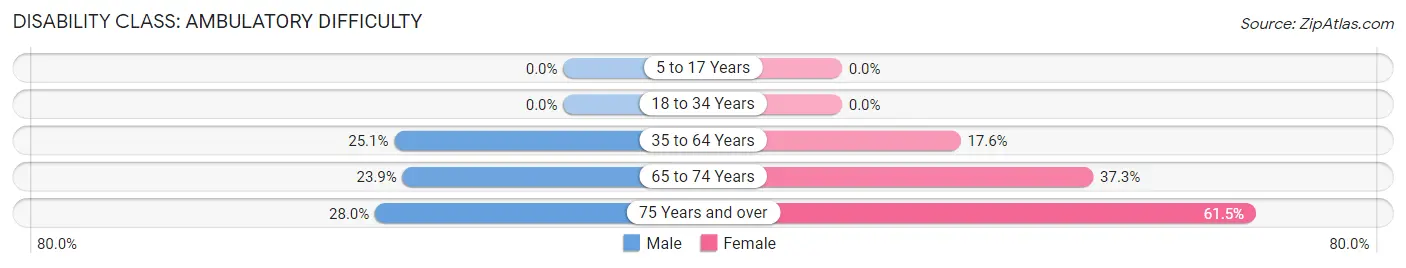
| Age Bracket | Male | Female |
| 5 to 17 Years | 0 (0.0%) | 0 (0.0%) |
| 18 to 34 Years | 0 (0.0%) | 0 (0.0%) |
| 35 to 64 Years | 335 (25.1%) | 194 (17.6%) |
| 65 to 74 Years | 64 (23.9%) | 106 (37.3%) |
| 75 Years and over | 64 (28.0%) | 206 (61.5%) |
Disability Class: Self-Care Difficulty
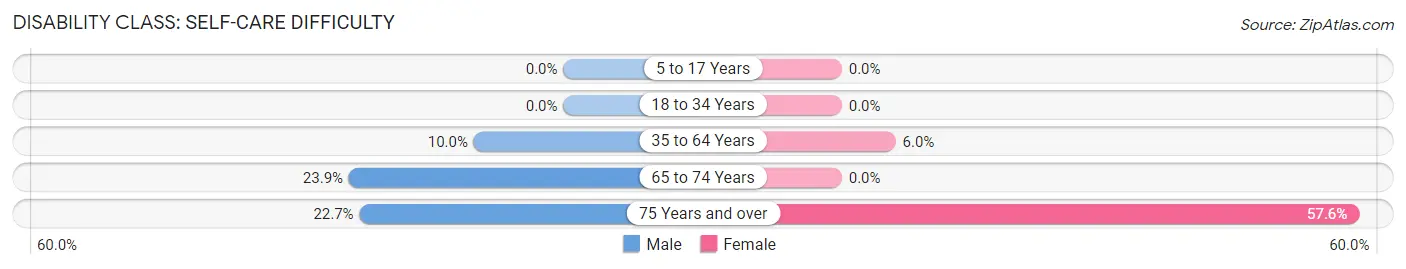
| Age Bracket | Male | Female |
| 5 to 17 Years | 0 (0.0%) | 0 (0.0%) |
| 18 to 34 Years | 0 (0.0%) | 0 (0.0%) |
| 35 to 64 Years | 133 (10.0%) | 66 (6.0%) |
| 65 to 74 Years | 64 (23.9%) | 0 (0.0%) |
| 75 Years and over | 52 (22.7%) | 193 (57.6%) |
Technology Access in Rayne
Computing Device Access in Rayne
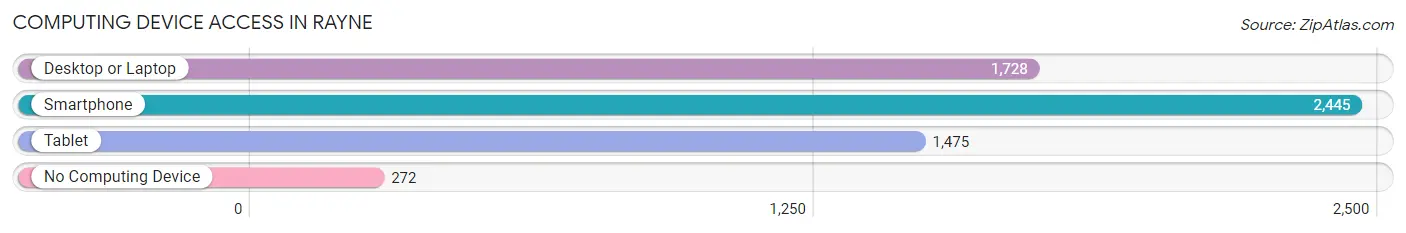
| Device Type | # Households | % Households |
| Desktop or Laptop | 1,728 | 60.3% |
| Smartphone | 2,445 | 85.3% |
| Tablet | 1,475 | 51.5% |
| No Computing Device | 272 | 9.5% |
| Total | 2,865 | 100.0% |
Internet Access in Rayne
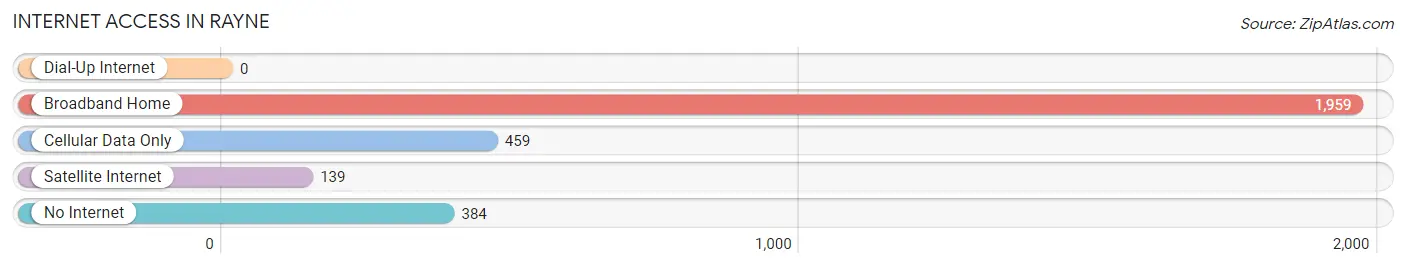
| Internet Type | # Households | % Households |
| Dial-Up Internet | 0 | 0.0% |
| Broadband Home | 1,959 | 68.4% |
| Cellular Data Only | 459 | 16.0% |
| Satellite Internet | 139 | 4.9% |
| No Internet | 384 | 13.4% |
| Total | 2,865 | 100.0% |
Rayne Summary
Rayne, Louisiana is a small city located in Acadia Parish in the southwestern part of the state. It is the largest city in the parish and is known as the “Frog Capital of the World” due to its large frog-processing industry. The city has a population of 8,552 as of the 2010 census and is part of the Lafayette Metropolitan Statistical Area.
History
Rayne was founded in 1881 by the Rayne Land and Lumber Company. The company was formed by a group of investors from New Orleans who wanted to take advantage of the area’s abundant timber resources. The town was named after the company’s president, John Rayne. The town grew quickly and by the early 1900s, it had become a major center for the lumber industry.
In the 1920s, the town began to diversify its economy by becoming a major center for the frog-processing industry. The industry was so successful that Rayne became known as the “Frog Capital of the World.” The industry continued to thrive until the late 1970s when it began to decline due to increased competition from other states.
Geography
Rayne is located in the southwestern part of Louisiana, about 30 miles east of Lafayette. The city is situated on the banks of the Mermentau River and is surrounded by flat, low-lying land. The climate is humid subtropical, with hot, humid summers and mild winters.
Economy
Rayne’s economy is largely based on agriculture and manufacturing. The city is home to several large agricultural operations, including rice, soybeans, and crawfish farms. The manufacturing sector is dominated by the frog-processing industry, which is still a major employer in the city. Other major employers include the local school district, the city government, and several retail stores.
Demographics
As of the 2010 census, Rayne had a population of 8,552. The racial makeup of the city was 73.3% White, 22.2% African American, 0.4% Native American, 0.7% Asian, 0.1% Pacific Islander, and 2.3% from other races. The median household income was $30,945, and the median family income was $37,945. The per capita income was $17,845.
Rayne is a small city with a rich history and a diverse economy. It is home to a large agricultural and manufacturing sector, as well as a thriving frog-processing industry. The city has a population of 8,552 and is part of the Lafayette Metropolitan Statistical Area.
Common Questions
What is Per Capita Income in Rayne?
Per Capita income in Rayne is $21,218.
What is the Median Family Income in Rayne?
Median Family Income in Rayne is $41,724.
What is the Median Household income in Rayne?
Median Household Income in Rayne is $34,725.
What is Income or Wage Gap in Rayne?
Income or Wage Gap in Rayne is 54.7%.
Women in Rayne earn 45.3 cents for every dollar earned by a man.
What is Family Income Deficit in Rayne?
Family Income Deficit in Rayne is $10,607.
Families that are below poverty line in Rayne earn $10,607 less on average than the poverty threshold level.
What is Inequality or Gini Index in Rayne?
Inequality or Gini Index in Rayne is 0.46.
What is the Total Population of Rayne?
Total Population of Rayne is 7,223.
What is the Total Male Population of Rayne?
Total Male Population of Rayne is 3,588.
What is the Total Female Population of Rayne?
Total Female Population of Rayne is 3,635.
What is the Ratio of Males per 100 Females in Rayne?
There are 98.71 Males per 100 Females in Rayne.
What is the Ratio of Females per 100 Males in Rayne?
There are 101.31 Females per 100 Males in Rayne.
What is the Median Population Age in Rayne?
Median Population Age in Rayne is 35.4 Years.
What is the Average Family Size in Rayne
Average Family Size in Rayne is 3.4 People.
What is the Average Household Size in Rayne
Average Household Size in Rayne is 2.5 People.
How Large is the Labor Force in Rayne?
There are 3,048 People in the Labor Forcein in Rayne.
What is the Percentage of People in the Labor Force in Rayne?
56.1% of People are in the Labor Force in Rayne.
What is the Unemployment Rate in Rayne?
Unemployment Rate in Rayne is 11.4%.