Zip Codes with the Highest Percentage of Population Employed in Computer, Engineering & Science in Denham Springs, LA
RELATED REPORTS & OPTIONS
Computer, Engineering & Science
Denham Springs
Compare Zip Codes
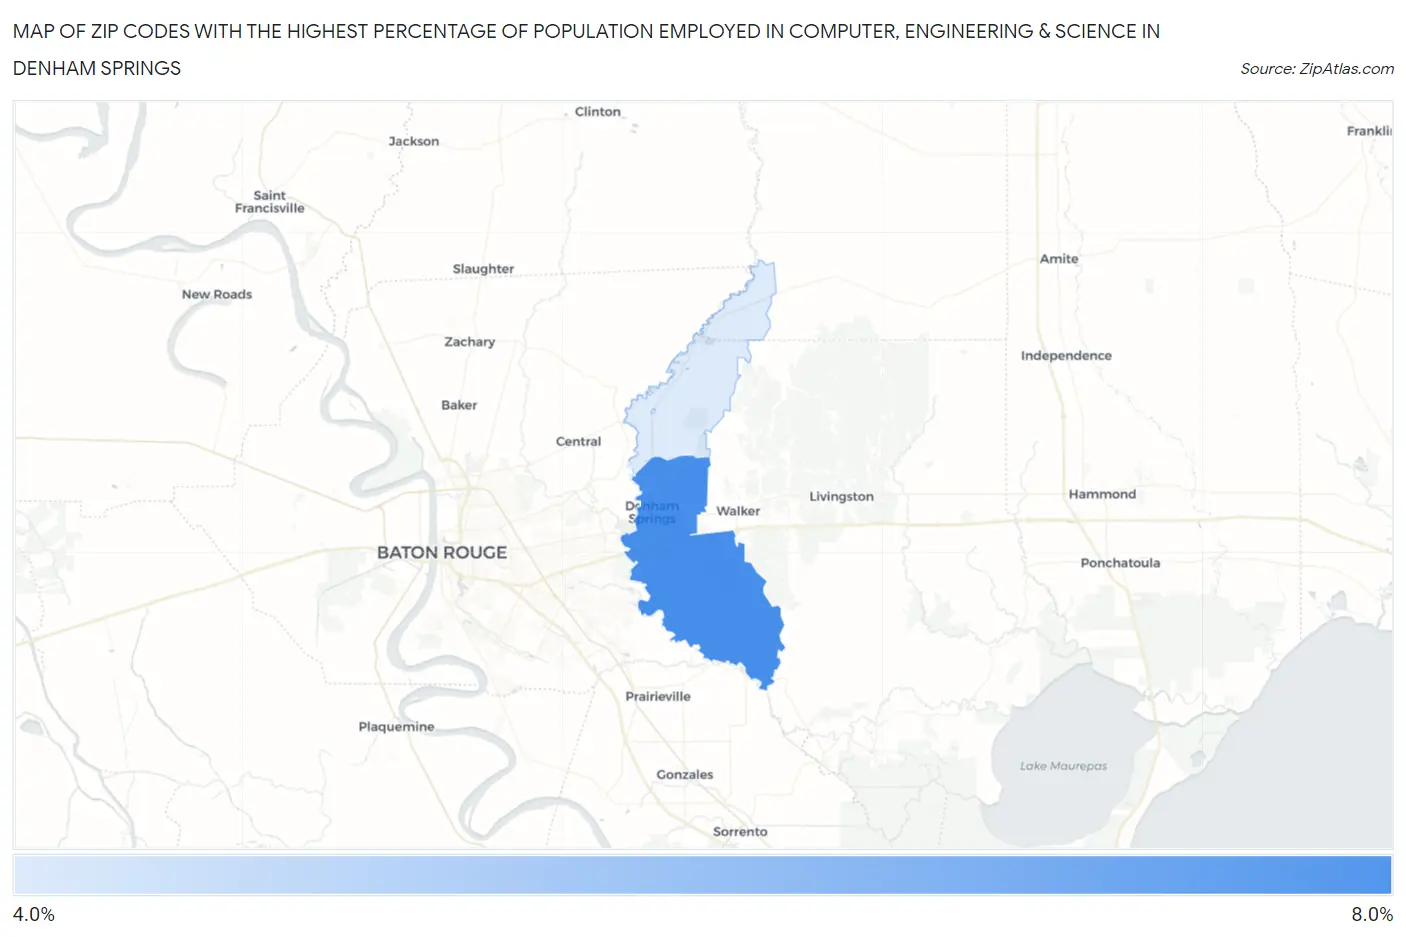
Map of Zip Codes with the Highest Percentage of Population Employed in Computer, Engineering & Science in Denham Springs
4.8%
6.3%
Zip Codes with the Highest Percentage of Population Employed in Computer, Engineering & Science in Denham Springs, LA
| Zip Code | % Employed | vs State | vs National | |
| 1. | 70726 | 6.3% | 4.6%(+1.72)#74 | 6.8%(-0.436)#8,074 |
| 2. | 70706 | 4.8% | 4.6%(+0.205)#123 | 6.8%(-1.95)#11,919 |
1
Common Questions
What are the Top Zip Codes with the Highest Percentage of Population Employed in Computer, Engineering & Science in Denham Springs, LA?
Top Zip Codes with the Highest Percentage of Population Employed in Computer, Engineering & Science in Denham Springs, LA are:
What zip code has the Highest Percentage of Population Employed in Computer, Engineering & Science in Denham Springs, LA?
70726 has the Highest Percentage of Population Employed in Computer, Engineering & Science in Denham Springs, LA with 6.3%.
What is the Percentage of Population Employed in Computer, Engineering & Science in Denham Springs, LA?
Percentage of Population Employed in Computer, Engineering & Science in Denham Springs is 8.3%.
What is the Percentage of Population Employed in Computer, Engineering & Science in Louisiana?
Percentage of Population Employed in Computer, Engineering & Science in Louisiana is 4.6%.
What is the Percentage of Population Employed in Computer, Engineering & Science in the United States?
Percentage of Population Employed in Computer, Engineering & Science in the United States is 6.8%.