Claiborne, LA Map & Demographics
Claiborne Map
Claiborne Overview
$33,513
PER CAPITA INCOME
$79,620
AVG FAMILY INCOME
$63,056
AVG HOUSEHOLD INCOME
20.2%
WAGE / INCOME GAP [ % ]
79.8¢/ $1
WAGE / INCOME GAP [ $ ]
0.46
INEQUALITY / GINI INDEX
12,159
TOTAL POPULATION
5,566
MALE POPULATION
6,593
FEMALE POPULATION
84.42
MALES / 100 FEMALES
118.45
FEMALES / 100 MALES
35.1
MEDIAN AGE
2.8
AVG FAMILY SIZE
2.4
AVG HOUSEHOLD SIZE
6,198
LABOR FORCE [ PEOPLE ]
62.2%
PERCENT IN LABOR FORCE
0.8%
UNEMPLOYMENT RATE
Income in Claiborne
Income Overview in Claiborne
Per Capita Income in Claiborne is $33,513, while median incomes of families and households are $79,620 and $63,056 respectively.
| Characteristic | Number | Measure |
| Per Capita Income | 12,159 | $33,513 |
| Median Family Income | 3,482 | $79,620 |
| Mean Family Income | 3,482 | $92,560 |
| Median Household Income | 4,966 | $63,056 |
| Mean Household Income | 4,966 | $80,422 |
| Income Deficit | 3,482 | $0 |
| Wage / Income Gap (%) | 12,159 | 20.19% |
| Wage / Income Gap ($) | 12,159 | 79.81¢ per $1 |
| Gini / Inequality Index | 12,159 | 0.46 |
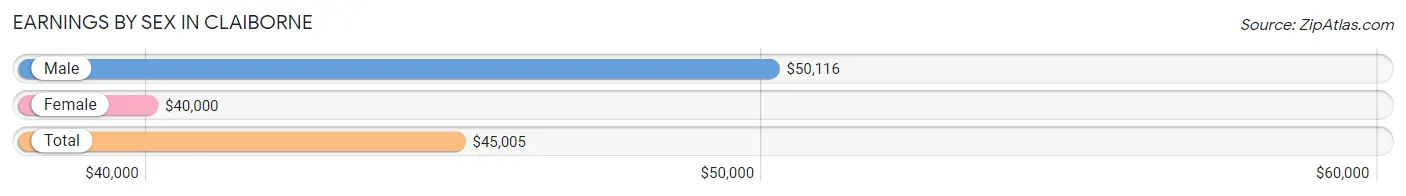
Earnings by Sex in Claiborne
Average Earnings in Claiborne are $45,005, $50,116 for men and $40,000 for women, a difference of 20.2%.
| Sex | Number | Average Earnings |
| Male | 3,198 (50.5%) | $50,116 |
| Female | 3,130 (49.5%) | $40,000 |
| Total | 6,328 (100.0%) | $45,005 |
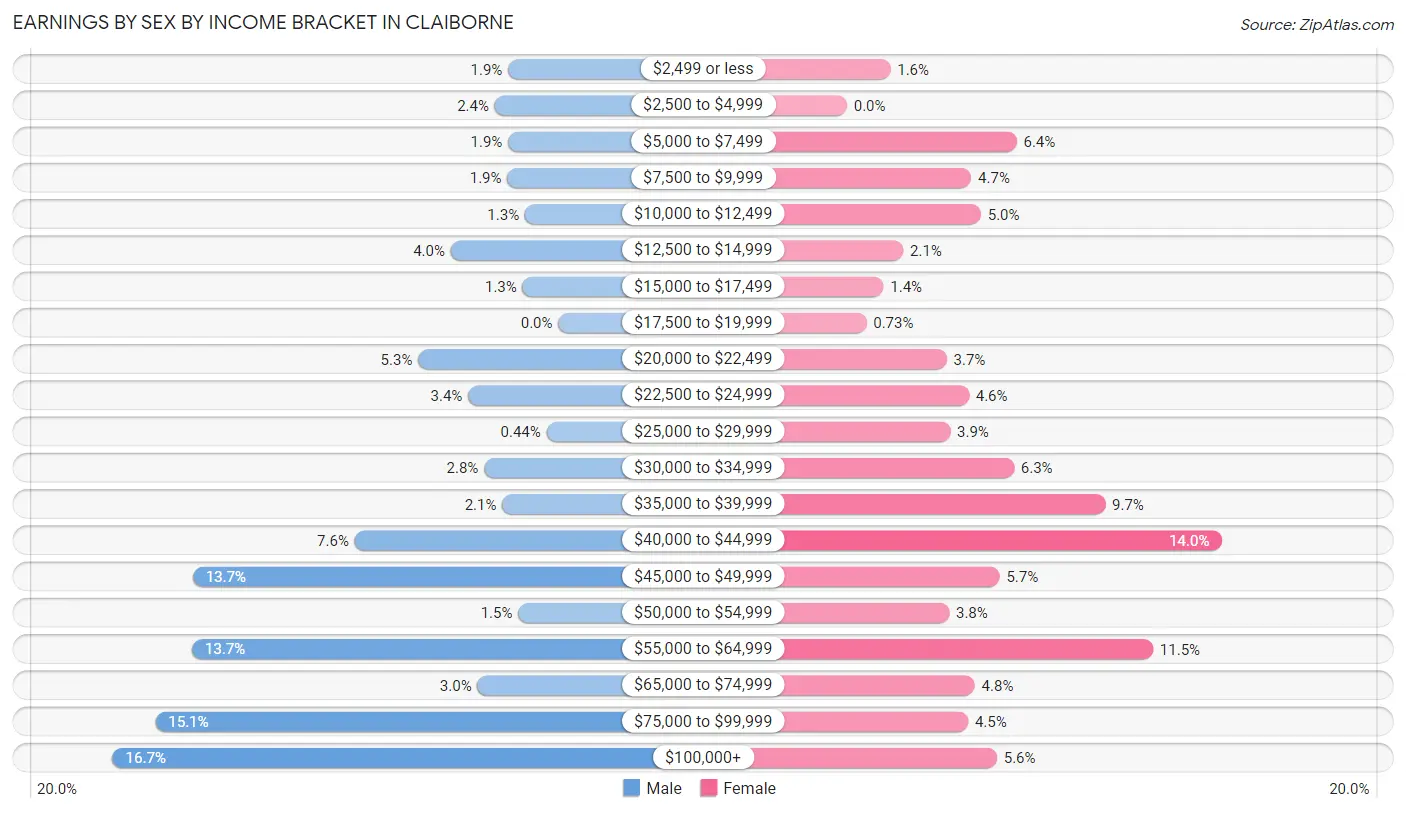
Earnings by Sex by Income Bracket in Claiborne
The most common earnings brackets in Claiborne are $100,000+ for men (534 | 16.7%) and $40,000 to $44,999 for women (439 | 14.0%).
| Income | Male | Female |
| $2,499 or less | 60 (1.9%) | 51 (1.6%) |
| $2,500 to $4,999 | 76 (2.4%) | 0 (0.0%) |
| $5,000 to $7,499 | 60 (1.9%) | 199 (6.4%) |
| $7,500 to $9,999 | 61 (1.9%) | 146 (4.7%) |
| $10,000 to $12,499 | 40 (1.3%) | 157 (5.0%) |
| $12,500 to $14,999 | 129 (4.0%) | 66 (2.1%) |
| $15,000 to $17,499 | 43 (1.3%) | 43 (1.4%) |
| $17,500 to $19,999 | 0 (0.0%) | 23 (0.7%) |
| $20,000 to $22,499 | 168 (5.2%) | 117 (3.7%) |
| $22,500 to $24,999 | 108 (3.4%) | 143 (4.6%) |
| $25,000 to $29,999 | 14 (0.4%) | 121 (3.9%) |
| $30,000 to $34,999 | 89 (2.8%) | 196 (6.3%) |
| $35,000 to $39,999 | 67 (2.1%) | 303 (9.7%) |
| $40,000 to $44,999 | 244 (7.6%) | 439 (14.0%) |
| $45,000 to $49,999 | 438 (13.7%) | 179 (5.7%) |
| $50,000 to $54,999 | 48 (1.5%) | 120 (3.8%) |
| $55,000 to $64,999 | 439 (13.7%) | 359 (11.5%) |
| $65,000 to $74,999 | 97 (3.0%) | 150 (4.8%) |
| $75,000 to $99,999 | 483 (15.1%) | 142 (4.5%) |
| $100,000+ | 534 (16.7%) | 176 (5.6%) |
| Total | 3,198 (100.0%) | 3,130 (100.0%) |
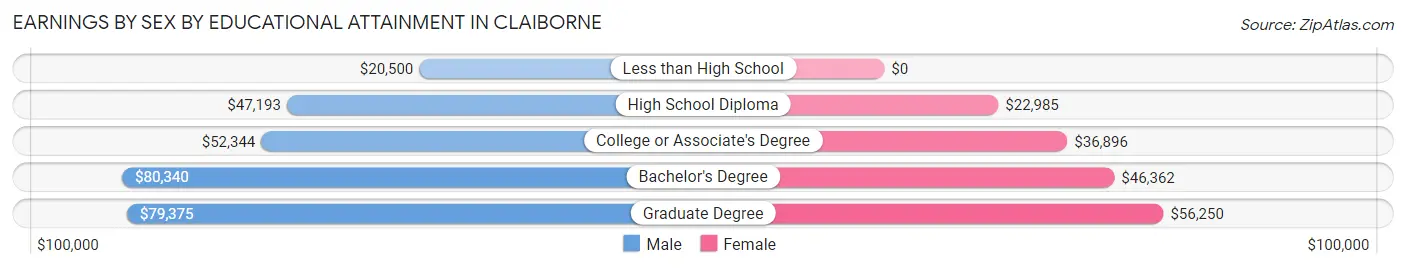
Earnings by Sex by Educational Attainment in Claiborne
Average earnings in Claiborne are $55,954 for men and $41,334 for women, a difference of 26.1%. Men with an educational attainment of bachelor's degree enjoy the highest average annual earnings of $80,340, while those with less than high school education earn the least with $20,500. Women with an educational attainment of graduate degree earn the most with the average annual earnings of $56,250, while those with high school diploma education have the smallest earnings of $22,985.
| Educational Attainment | Male Income | Female Income |
| Less than High School | $20,500 | $0 |
| High School Diploma | $47,193 | $22,985 |
| College or Associate's Degree | $52,344 | $36,896 |
| Bachelor's Degree | $80,340 | $46,362 |
| Graduate Degree | $79,375 | $56,250 |
| Total | $55,954 | $41,334 |
Family Income in Claiborne
Family Income Brackets in Claiborne
According to the Claiborne family income data, there are 763 families falling into the $75,000 to $99,999 income range, which is the most common income bracket and makes up 21.9% of all families. Conversely, the $10,000 to $14,999 income bracket is the least frequent group with only 70 families (2.0%) belonging to this category.
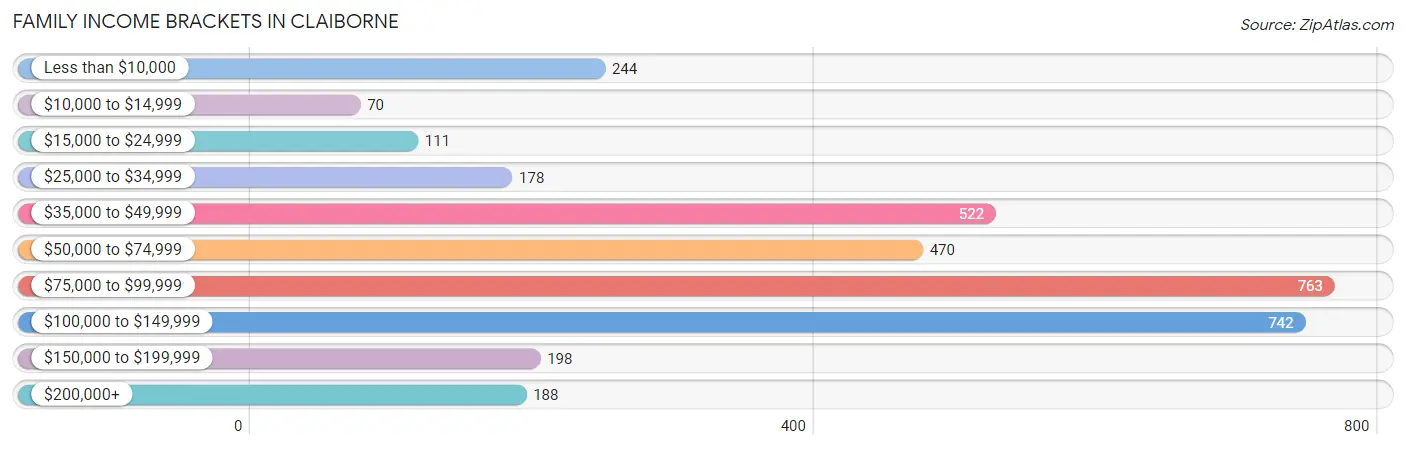
| Income Bracket | # Families | % Families |
| Less than $10,000 | 244 | 7.0% |
| $10,000 to $14,999 | 70 | 2.0% |
| $15,000 to $24,999 | 111 | 3.2% |
| $25,000 to $34,999 | 178 | 5.1% |
| $35,000 to $49,999 | 522 | 15.0% |
| $50,000 to $74,999 | 470 | 13.5% |
| $75,000 to $99,999 | 763 | 21.9% |
| $100,000 to $149,999 | 742 | 21.3% |
| $150,000 to $199,999 | 198 | 5.7% |
| $200,000+ | 188 | 5.4% |
Family Income by Famaliy Size in Claiborne
6-person families (80 | 2.3%) account for the highest median family income in Claiborne with $116,190 per family, while 2-person families (1,938 | 55.7%) have the highest median income of $34,599 per family member.
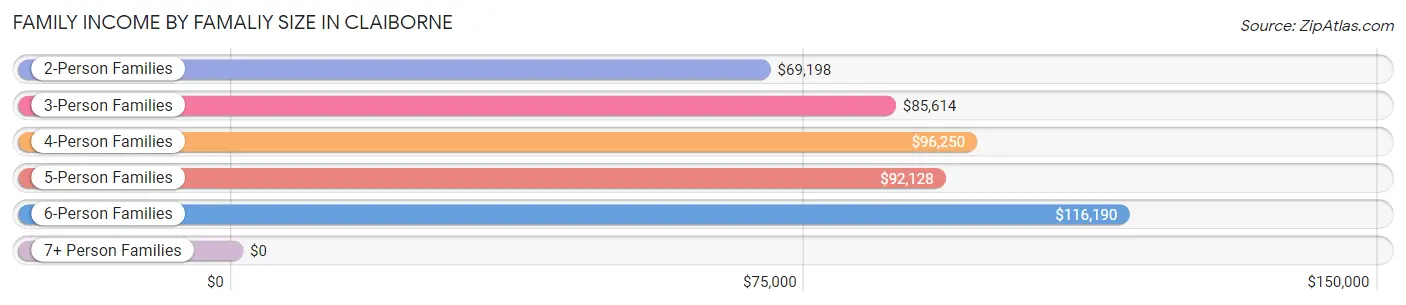
| Income Bracket | # Families | Median Income |
| 2-Person Families | 1,938 (55.7%) | $69,198 |
| 3-Person Families | 928 (26.7%) | $85,614 |
| 4-Person Families | 394 (11.3%) | $96,250 |
| 5-Person Families | 142 (4.1%) | $92,128 |
| 6-Person Families | 80 (2.3%) | $116,190 |
| 7+ Person Families | 0 (0.0%) | $0 |
| Total | 3,482 (100.0%) | $79,620 |
Family Income by Number of Earners in Claiborne
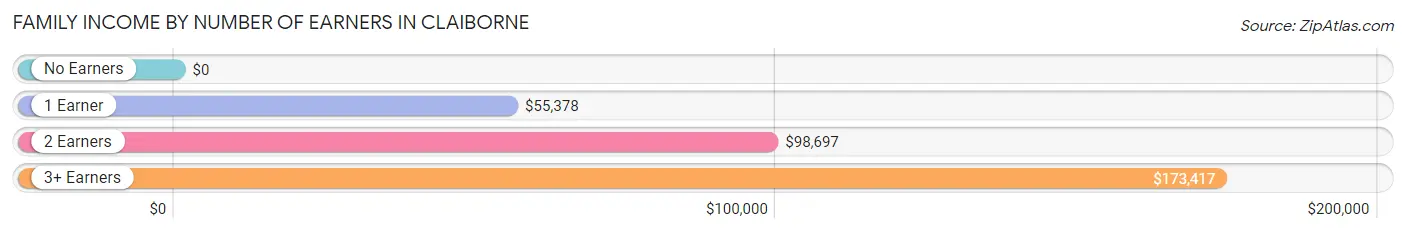
| Number of Earners | # Families | Median Income |
| No Earners | 616 (17.7%) | $0 |
| 1 Earner | 1,108 (31.8%) | $55,378 |
| 2 Earners | 1,583 (45.5%) | $98,697 |
| 3+ Earners | 175 (5.0%) | $173,417 |
| Total | 3,482 (100.0%) | $79,620 |
Household Income in Claiborne
Household Income Brackets in Claiborne
With 864 households falling in the category, the $100,000 to $149,999 income range is the most frequent in Claiborne, accounting for 17.4% of all households. In contrast, only 189 households (3.8%) fall into the $10,000 to $14,999 income bracket, making it the least populous group.
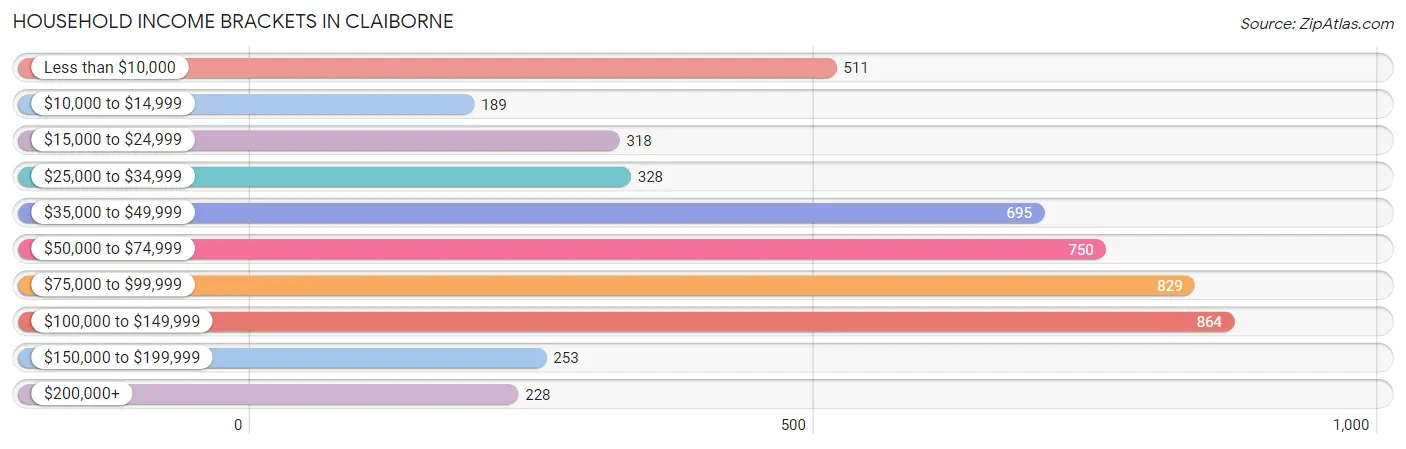
| Income Bracket | # Households | % Households |
| Less than $10,000 | 511 | 10.3% |
| $10,000 to $14,999 | 189 | 3.8% |
| $15,000 to $24,999 | 318 | 6.4% |
| $25,000 to $34,999 | 328 | 6.6% |
| $35,000 to $49,999 | 695 | 14.0% |
| $50,000 to $74,999 | 750 | 15.1% |
| $75,000 to $99,999 | 829 | 16.7% |
| $100,000 to $149,999 | 864 | 17.4% |
| $150,000 to $199,999 | 253 | 5.1% |
| $200,000+ | 228 | 4.6% |
Household Income by Householder Age in Claiborne
The median household income in Claiborne is $63,056, with the highest median household income of $82,000 found in the 25 to 44 years age bracket for the primary householder. A total of 2,008 households (40.4%) fall into this category. Meanwhile, the 65+ years age bracket for the primary householder has the lowest median household income of $0, with 1,297 households (26.1%) in this group.
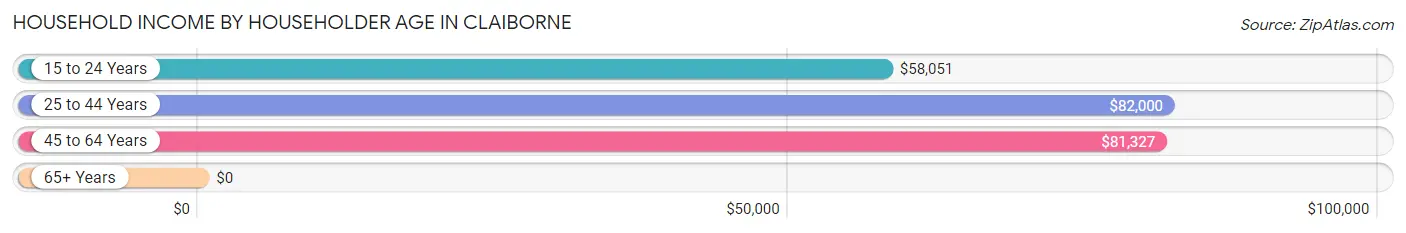
| Income Bracket | # Households | Median Income |
| 15 to 24 Years | 200 (4.0%) | $58,051 |
| 25 to 44 Years | 2,008 (40.4%) | $82,000 |
| 45 to 64 Years | 1,461 (29.4%) | $81,327 |
| 65+ Years | 1,297 (26.1%) | $0 |
| Total | 4,966 (100.0%) | $63,056 |
Poverty in Claiborne
Income Below Poverty by Sex and Age in Claiborne
With 7.9% poverty level for males and 14.4% for females among the residents of Claiborne, 65 to 74 year old males and 65 to 74 year old females are the most vulnerable to poverty, with 203 males (40.8%) and 358 females (43.5%) in their respective age groups living below the poverty level.
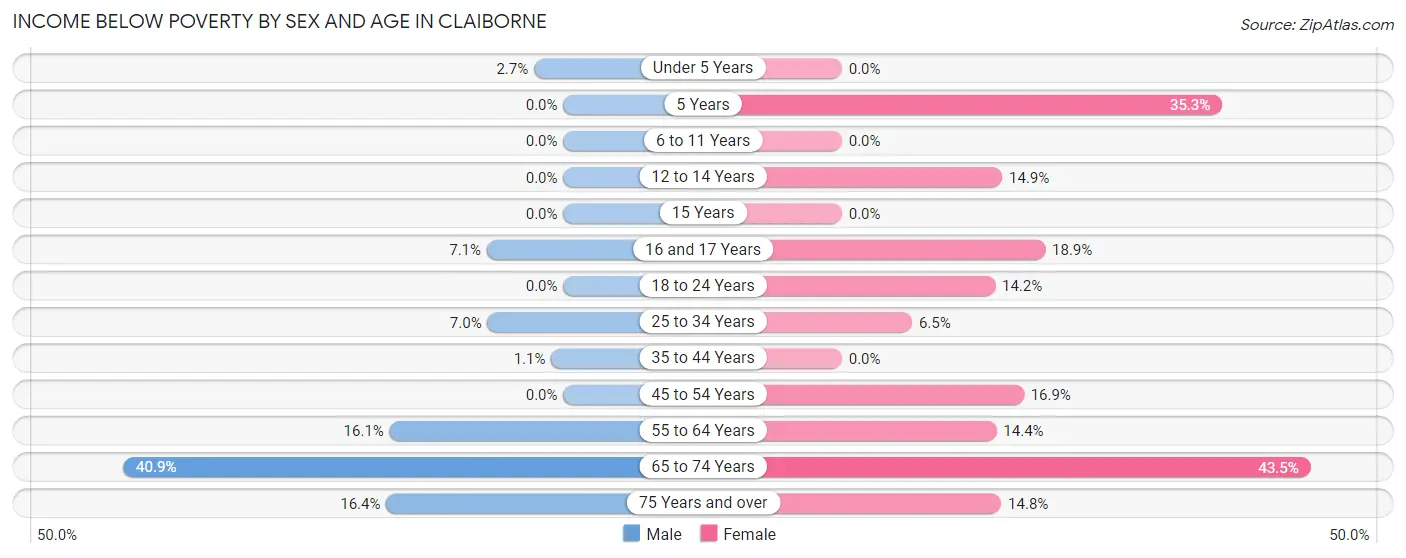
| Age Bracket | Male | Female |
| Under 5 Years | 14 (2.7%) | 0 (0.0%) |
| 5 Years | 0 (0.0%) | 48 (35.3%) |
| 6 to 11 Years | 0 (0.0%) | 0 (0.0%) |
| 12 to 14 Years | 0 (0.0%) | 36 (14.9%) |
| 15 Years | 0 (0.0%) | 0 (0.0%) |
| 16 and 17 Years | 11 (7.1%) | 20 (18.9%) |
| 18 to 24 Years | 0 (0.0%) | 93 (14.2%) |
| 25 to 34 Years | 70 (7.0%) | 83 (6.5%) |
| 35 to 44 Years | 9 (1.1%) | 0 (0.0%) |
| 45 to 54 Years | 0 (0.0%) | 133 (16.9%) |
| 55 to 64 Years | 84 (16.1%) | 99 (14.3%) |
| 65 to 74 Years | 203 (40.8%) | 358 (43.5%) |
| 75 Years and over | 46 (16.4%) | 79 (14.8%) |
| Total | 437 (7.9%) | 949 (14.4%) |
Income Above Poverty by Sex and Age in Claiborne
According to the poverty statistics in Claiborne, males aged 5 years and females aged under 5 years are the age groups that are most secure financially, with 100.0% of males and 100.0% of females in these age groups living above the poverty line.
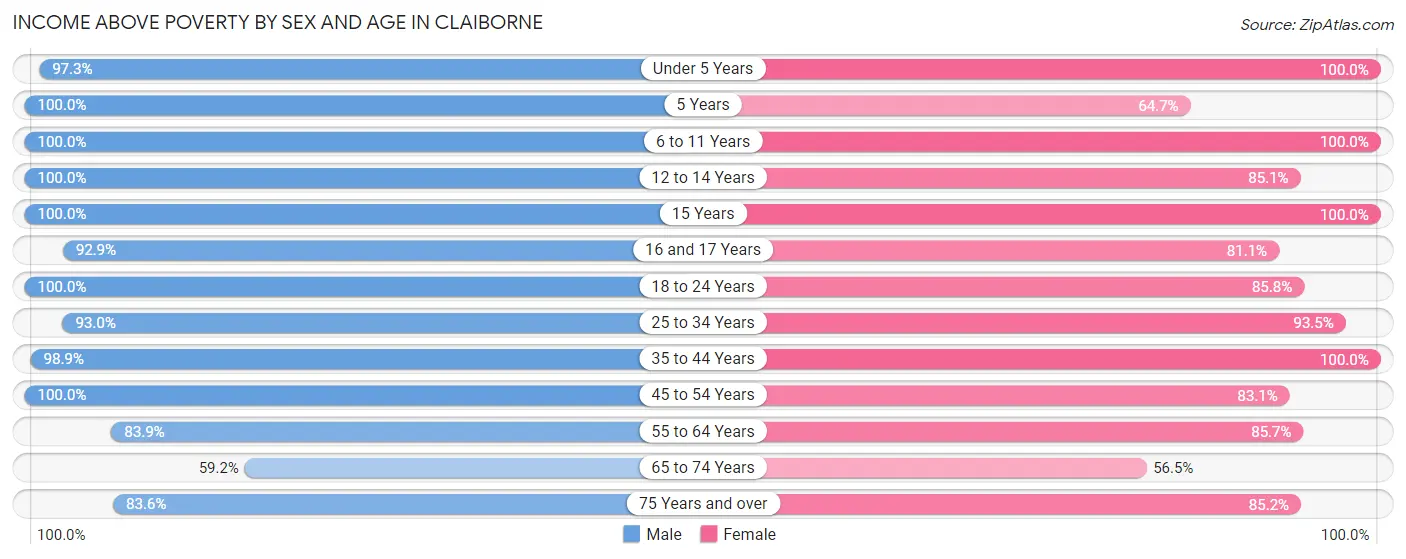
| Age Bracket | Male | Female |
| Under 5 Years | 501 (97.3%) | 384 (100.0%) |
| 5 Years | 25 (100.0%) | 88 (64.7%) |
| 6 to 11 Years | 314 (100.0%) | 287 (100.0%) |
| 12 to 14 Years | 191 (100.0%) | 206 (85.1%) |
| 15 Years | 39 (100.0%) | 52 (100.0%) |
| 16 and 17 Years | 144 (92.9%) | 86 (81.1%) |
| 18 to 24 Years | 681 (100.0%) | 561 (85.8%) |
| 25 to 34 Years | 925 (93.0%) | 1,191 (93.5%) |
| 35 to 44 Years | 798 (98.9%) | 623 (100.0%) |
| 45 to 54 Years | 536 (100.0%) | 655 (83.1%) |
| 55 to 64 Years | 437 (83.9%) | 591 (85.7%) |
| 65 to 74 Years | 294 (59.2%) | 465 (56.5%) |
| 75 Years and over | 234 (83.6%) | 455 (85.2%) |
| Total | 5,119 (92.1%) | 5,644 (85.6%) |
Income Below Poverty Among Married-Couple Families in Claiborne
The poverty statistics for married-couple families in Claiborne show that 8.8% or 231 of the total 2,627 families live below the poverty line. Families with no children have the highest poverty rate of 14.3%, comprising of 231 families. On the other hand, families with 1 or 2 children have the lowest poverty rate of 0.0%, which includes 0 families.
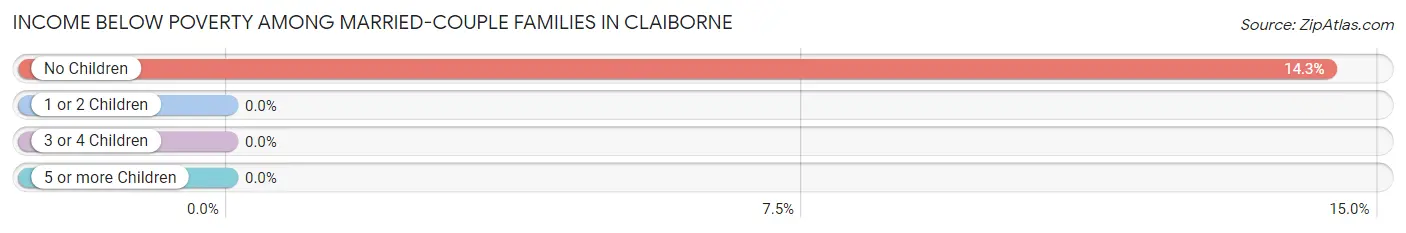
| Children | Above Poverty | Below Poverty |
| No Children | 1,380 (85.7%) | 231 (14.3%) |
| 1 or 2 Children | 860 (100.0%) | 0 (0.0%) |
| 3 or 4 Children | 156 (100.0%) | 0 (0.0%) |
| 5 or more Children | 0 (0.0%) | 0 (0.0%) |
| Total | 2,396 (91.2%) | 231 (8.8%) |
Income Below Poverty Among Single-Parent Households in Claiborne
According to the poverty data in Claiborne, 17.2% or 49 single-father households and 13.9% or 79 single-mother households are living below the poverty line. Among single-father households, those with 1 or 2 children have the highest poverty rate, with 49 households (27.7%) experiencing poverty. Likewise, among single-mother households, those with 1 or 2 children have the highest poverty rate, with 57 households (15.3%) falling below the poverty line.
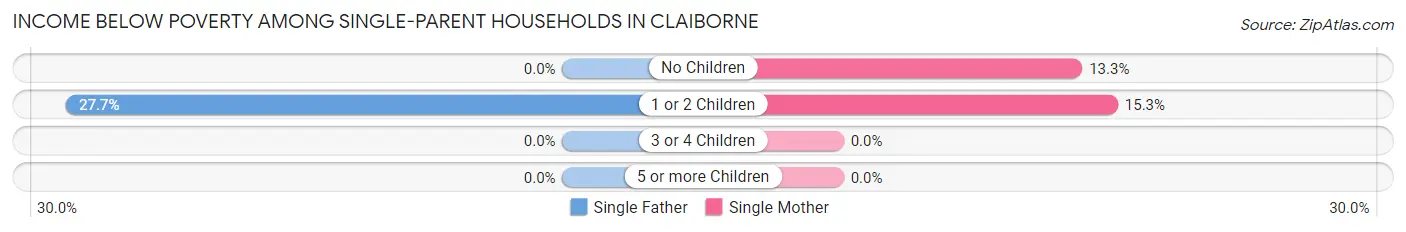
| Children | Single Father | Single Mother |
| No Children | 0 (0.0%) | 22 (13.3%) |
| 1 or 2 Children | 49 (27.7%) | 57 (15.3%) |
| 3 or 4 Children | 0 (0.0%) | 0 (0.0%) |
| 5 or more Children | 0 (0.0%) | 0 (0.0%) |
| Total | 49 (17.2%) | 79 (13.9%) |
Income Below Poverty Among Married-Couple vs Single-Parent Households in Claiborne
The poverty data for Claiborne shows that 231 of the married-couple family households (8.8%) and 128 of the single-parent households (15.0%) are living below the poverty level. Within the married-couple family households, those with no children have the highest poverty rate, with 231 households (14.3%) falling below the poverty line. Among the single-parent households, those with 1 or 2 children have the highest poverty rate, with 106 household (19.3%) living below poverty.
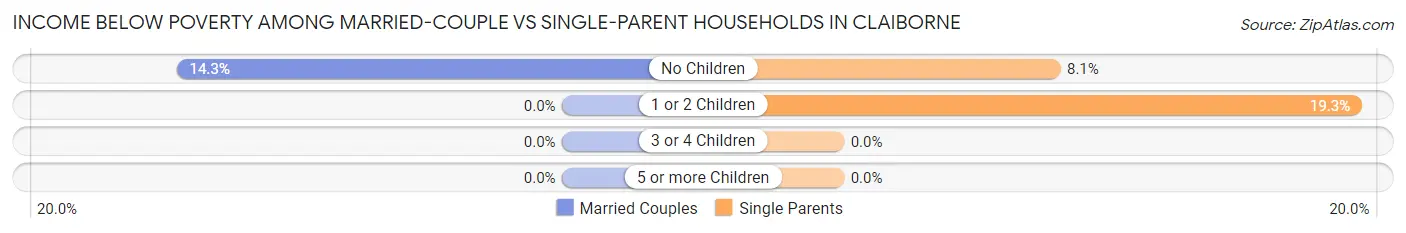
| Children | Married-Couple Families | Single-Parent Households |
| No Children | 231 (14.3%) | 22 (8.1%) |
| 1 or 2 Children | 0 (0.0%) | 106 (19.3%) |
| 3 or 4 Children | 0 (0.0%) | 0 (0.0%) |
| 5 or more Children | 0 (0.0%) | 0 (0.0%) |
| Total | 231 (8.8%) | 128 (15.0%) |
Race in Claiborne
The most populous races in Claiborne are White / Caucasian (10,821 | 89.0%), Black / African American (738 | 6.1%), and Asian (275 | 2.3%).
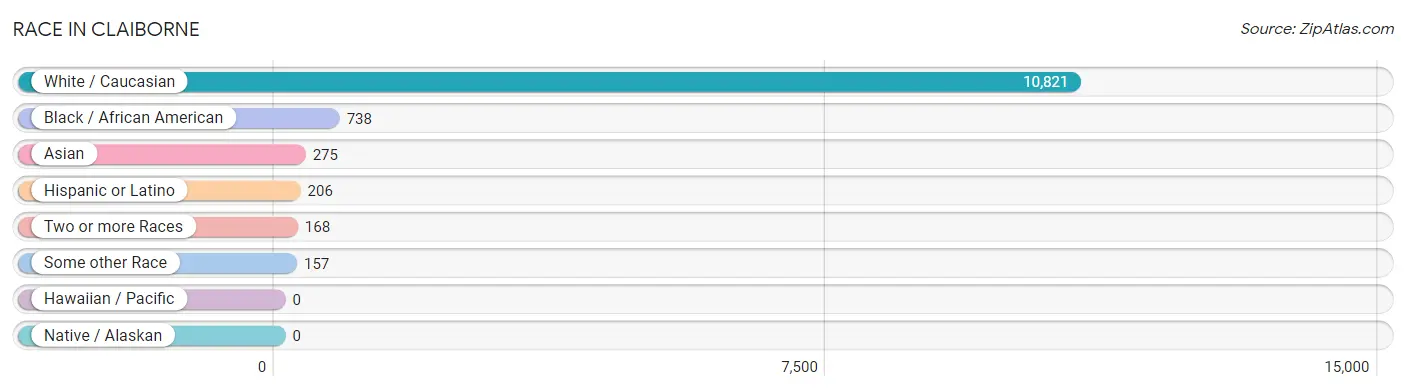
| Race | # Population | % Population |
| Asian | 275 | 2.3% |
| Black / African American | 738 | 6.1% |
| Hawaiian / Pacific | 0 | 0.0% |
| Hispanic or Latino | 206 | 1.7% |
| Native / Alaskan | 0 | 0.0% |
| White / Caucasian | 10,821 | 89.0% |
| Two or more Races | 168 | 1.4% |
| Some other Race | 157 | 1.3% |
| Total | 12,159 | 100.0% |
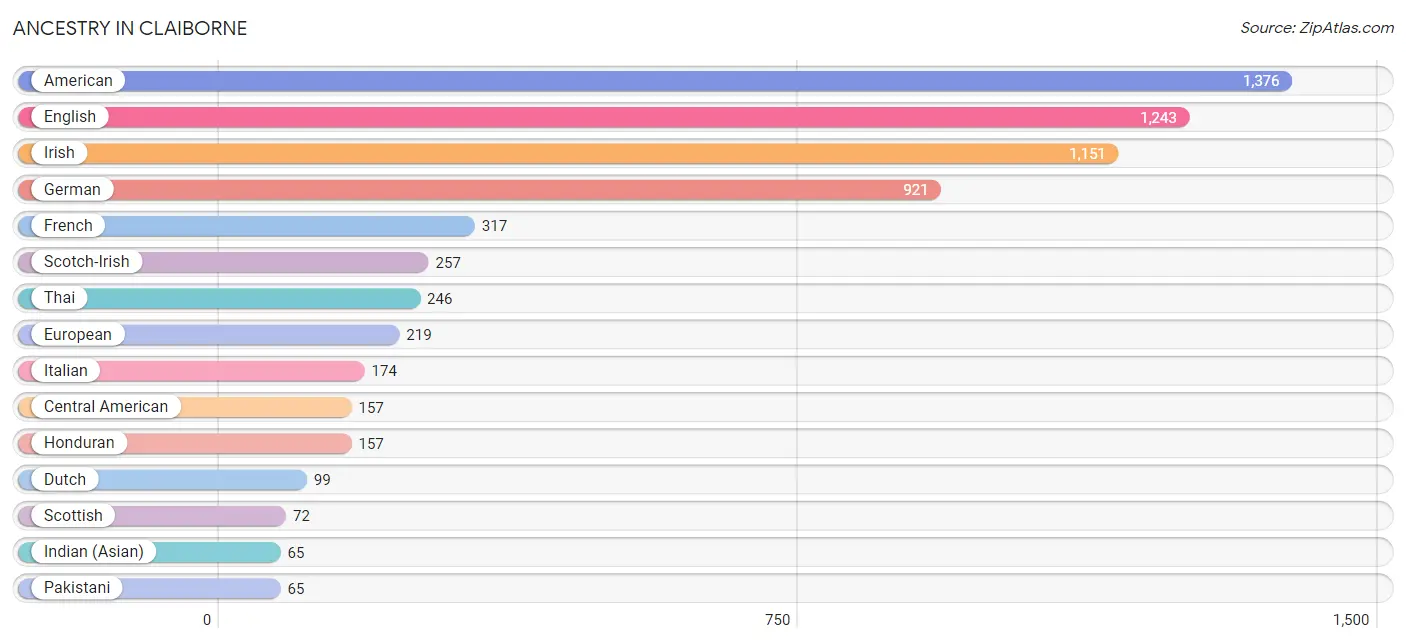
Ancestry in Claiborne
The most populous ancestries reported in Claiborne are American (1,376 | 11.3%), English (1,243 | 10.2%), Irish (1,151 | 9.5%), German (921 | 7.6%), and French (317 | 2.6%), together accounting for 41.2% of all Claiborne residents.
| Ancestry | # Population | % Population |
| African | 18 | 0.2% |
| American | 1,376 | 11.3% |
| British | 44 | 0.4% |
| Burmese | 11 | 0.1% |
| Cajun | 35 | 0.3% |
| Central American | 157 | 1.3% |
| Cherokee | 16 | 0.1% |
| Czech | 11 | 0.1% |
| Dutch | 99 | 0.8% |
| English | 1,243 | 10.2% |
| European | 219 | 1.8% |
| French | 317 | 2.6% |
| French American Indian | 25 | 0.2% |
| French Canadian | 21 | 0.2% |
| German | 921 | 7.6% |
| Honduran | 157 | 1.3% |
| Indian (Asian) | 65 | 0.5% |
| Irish | 1,151 | 9.5% |
| Israeli | 18 | 0.2% |
| Italian | 174 | 1.4% |
| Latvian | 35 | 0.3% |
| Mexican | 46 | 0.4% |
| Norwegian | 27 | 0.2% |
| Pakistani | 65 | 0.5% |
| Polish | 18 | 0.2% |
| Russian | 19 | 0.2% |
| Scandinavian | 30 | 0.3% |
| Scotch-Irish | 257 | 2.1% |
| Scottish | 72 | 0.6% |
| Spaniard | 3 | 0.0% |
| Sri Lankan | 14 | 0.1% |
| Subsaharan African | 18 | 0.2% |
| Swedish | 16 | 0.1% |
| Swiss | 22 | 0.2% |
| Thai | 246 | 2.0% |
| Welsh | 28 | 0.2% | View All 36 Rows |
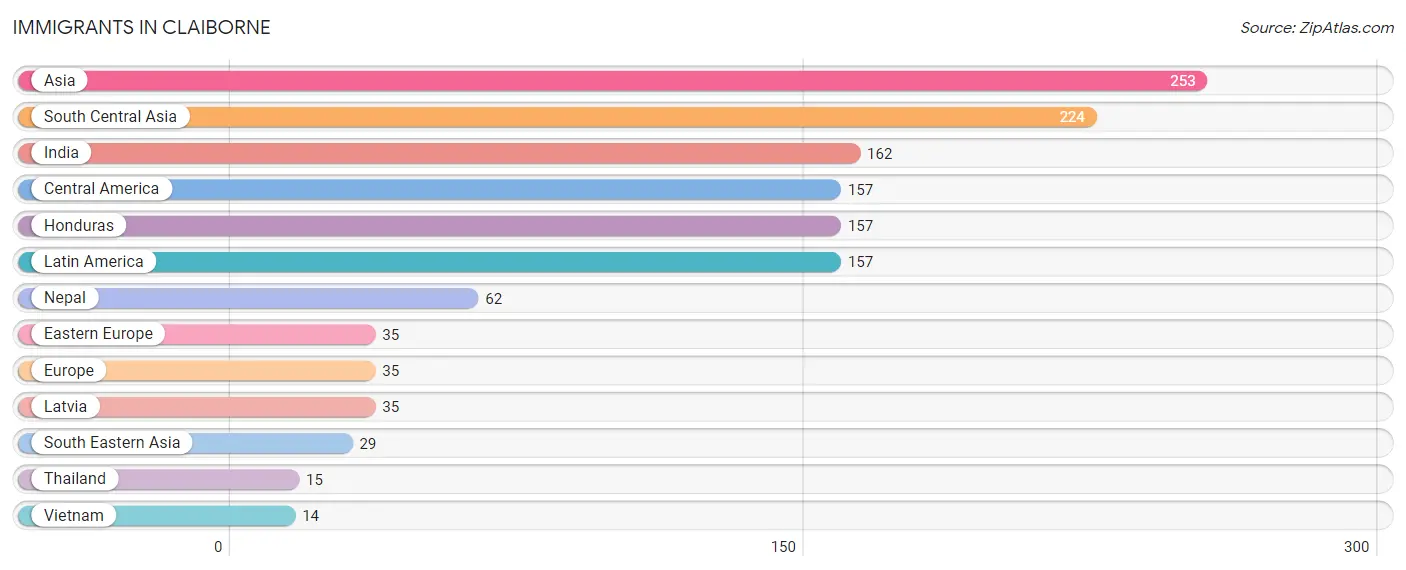
Immigrants in Claiborne
The most numerous immigrant groups reported in Claiborne came from Asia (253 | 2.1%), South Central Asia (224 | 1.8%), India (162 | 1.3%), Central America (157 | 1.3%), and Honduras (157 | 1.3%), together accounting for 7.8% of all Claiborne residents.
| Immigration Origin | # Population | % Population |
| Asia | 253 | 2.1% |
| Central America | 157 | 1.3% |
| Eastern Europe | 35 | 0.3% |
| Europe | 35 | 0.3% |
| Honduras | 157 | 1.3% |
| India | 162 | 1.3% |
| Latin America | 157 | 1.3% |
| Latvia | 35 | 0.3% |
| Nepal | 62 | 0.5% |
| South Central Asia | 224 | 1.8% |
| South Eastern Asia | 29 | 0.2% |
| Thailand | 15 | 0.1% |
| Vietnam | 14 | 0.1% | View All 13 Rows |
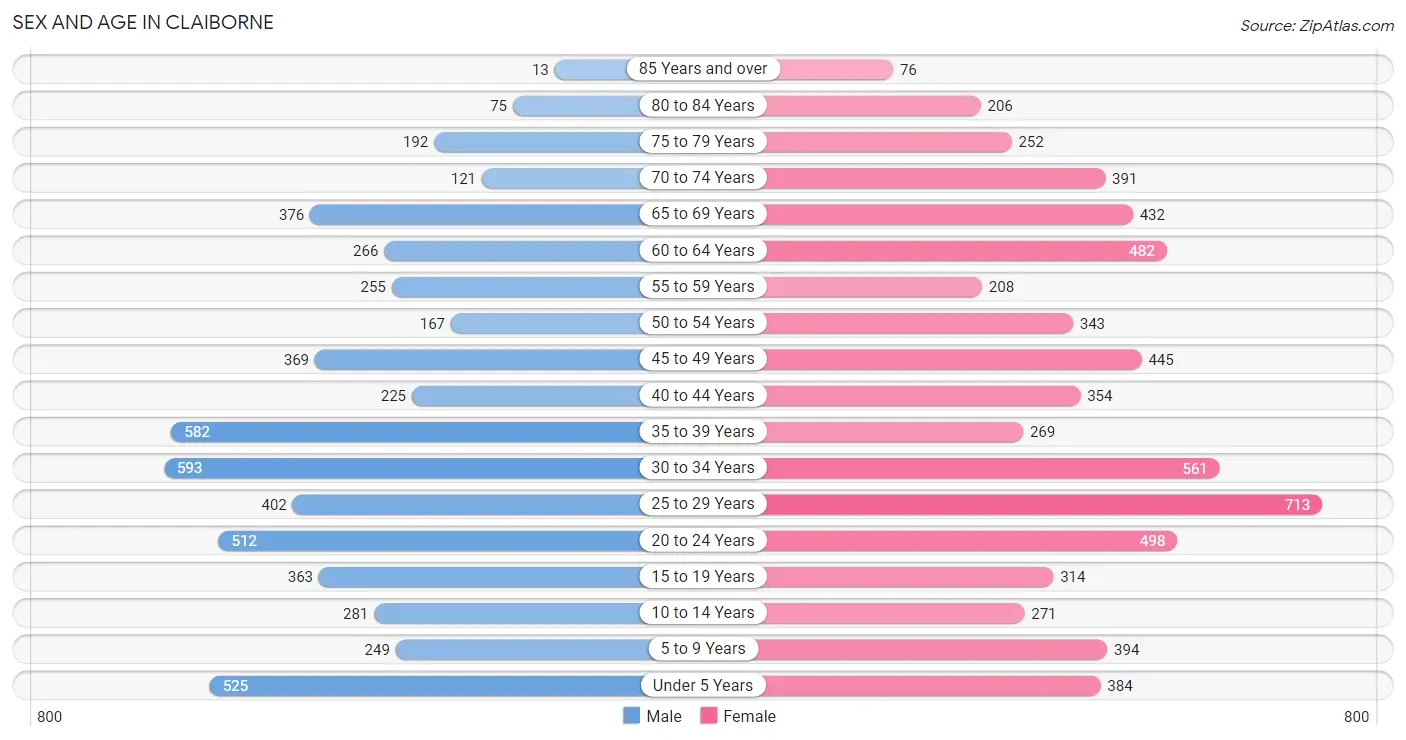
Sex and Age in Claiborne
Sex and Age in Claiborne
The most populous age groups in Claiborne are 30 to 34 Years (593 | 10.6%) for men and 25 to 29 Years (713 | 10.8%) for women.
| Age Bracket | Male | Female |
| Under 5 Years | 525 (9.4%) | 384 (5.8%) |
| 5 to 9 Years | 249 (4.5%) | 394 (6.0%) |
| 10 to 14 Years | 281 (5.1%) | 271 (4.1%) |
| 15 to 19 Years | 363 (6.5%) | 314 (4.8%) |
| 20 to 24 Years | 512 (9.2%) | 498 (7.5%) |
| 25 to 29 Years | 402 (7.2%) | 713 (10.8%) |
| 30 to 34 Years | 593 (10.6%) | 561 (8.5%) |
| 35 to 39 Years | 582 (10.5%) | 269 (4.1%) |
| 40 to 44 Years | 225 (4.0%) | 354 (5.4%) |
| 45 to 49 Years | 369 (6.6%) | 445 (6.8%) |
| 50 to 54 Years | 167 (3.0%) | 343 (5.2%) |
| 55 to 59 Years | 255 (4.6%) | 208 (3.2%) |
| 60 to 64 Years | 266 (4.8%) | 482 (7.3%) |
| 65 to 69 Years | 376 (6.8%) | 432 (6.6%) |
| 70 to 74 Years | 121 (2.2%) | 391 (5.9%) |
| 75 to 79 Years | 192 (3.5%) | 252 (3.8%) |
| 80 to 84 Years | 75 (1.3%) | 206 (3.1%) |
| 85 Years and over | 13 (0.2%) | 76 (1.1%) |
| Total | 5,566 (100.0%) | 6,593 (100.0%) |
Families and Households in Claiborne
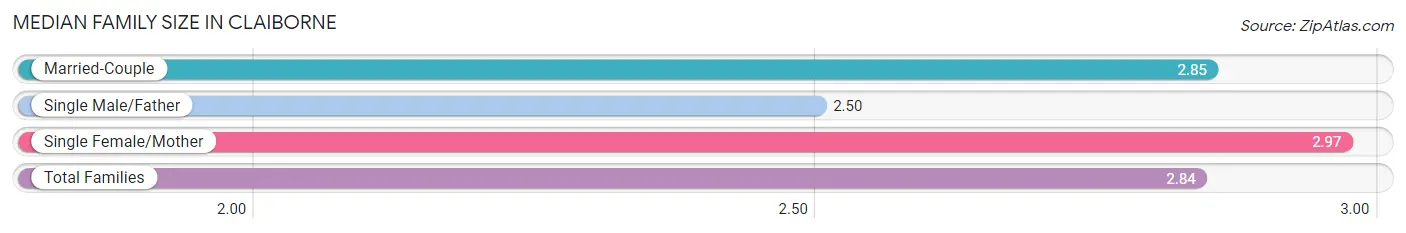
Median Family Size in Claiborne
The median family size in Claiborne is 2.84 persons per family, with single female/mother families (570 | 16.4%) accounting for the largest median family size of 2.97 persons per family. On the other hand, single male/father families (285 | 8.2%) represent the smallest median family size with 2.50 persons per family.
| Family Type | # Families | Family Size |
| Married-Couple | 2,627 (75.4%) | 2.85 |
| Single Male/Father | 285 (8.2%) | 2.50 |
| Single Female/Mother | 570 (16.4%) | 2.97 |
| Total Families | 3,482 (100.0%) | 2.84 |
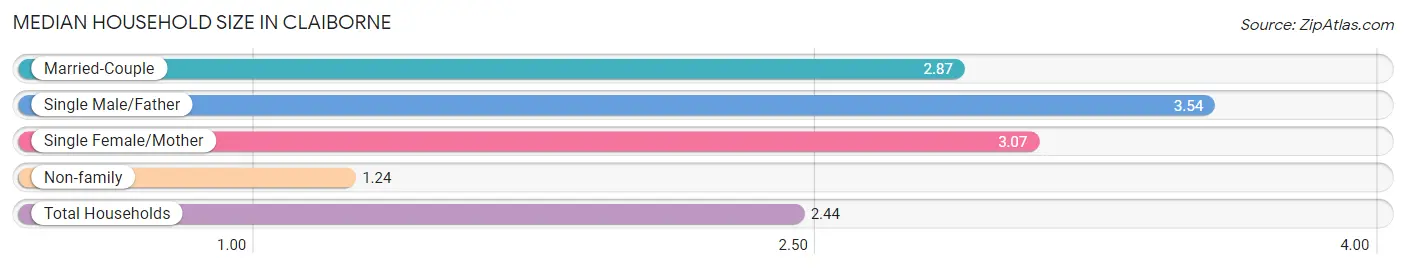
Median Household Size in Claiborne
The median household size in Claiborne is 2.44 persons per household, with single male/father households (285 | 5.7%) accounting for the largest median household size of 3.54 persons per household. non-family households (1,484 | 29.9%) represent the smallest median household size with 1.24 persons per household.
| Household Type | # Households | Household Size |
| Married-Couple | 2,627 (52.9%) | 2.87 |
| Single Male/Father | 285 (5.7%) | 3.54 |
| Single Female/Mother | 570 (11.5%) | 3.07 |
| Non-family | 1,484 (29.9%) | 1.24 |
| Total Households | 4,966 (100.0%) | 2.44 |
Household Size by Marriage Status in Claiborne
Out of a total of 4,966 households in Claiborne, 3,482 (70.1%) are family households, while 1,484 (29.9%) are nonfamily households. The most numerous type of family households are 2-person households, comprising 1,723, and the most common type of nonfamily households are 1-person households, comprising 1,183.
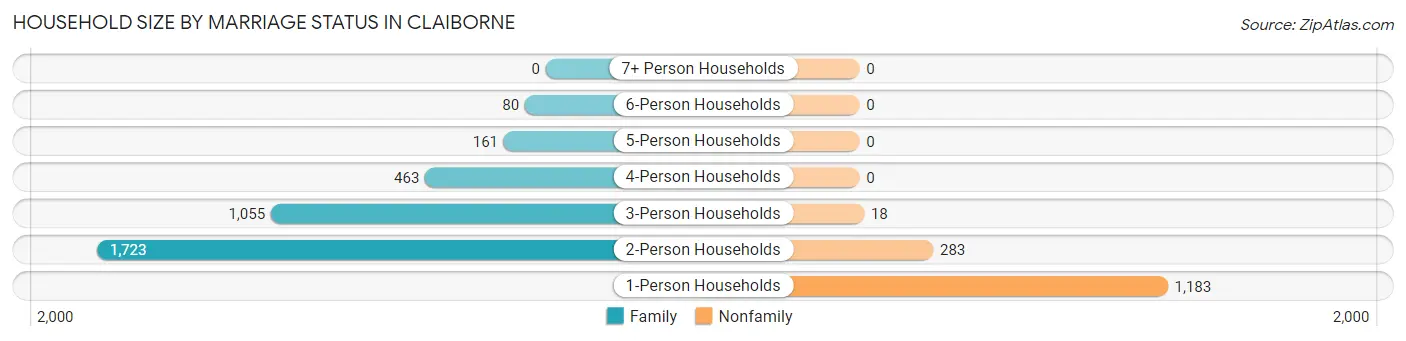
| Household Size | Family Households | Nonfamily Households |
| 1-Person Households | - | 1,183 (23.8%) |
| 2-Person Households | 1,723 (34.7%) | 283 (5.7%) |
| 3-Person Households | 1,055 (21.2%) | 18 (0.4%) |
| 4-Person Households | 463 (9.3%) | 0 (0.0%) |
| 5-Person Households | 161 (3.2%) | 0 (0.0%) |
| 6-Person Households | 80 (1.6%) | 0 (0.0%) |
| 7+ Person Households | 0 (0.0%) | 0 (0.0%) |
| Total | 3,482 (70.1%) | 1,484 (29.9%) |
Female Fertility in Claiborne
Fertility by Age in Claiborne
Average fertility rate in Claiborne is 34.0 births per 1,000 women. Women in the age bracket of 20 to 34 years have the highest fertility rate with 61.0 births per 1,000 women. Women in the age bracket of 20 to 34 years acount for 100.0% of all women with births.
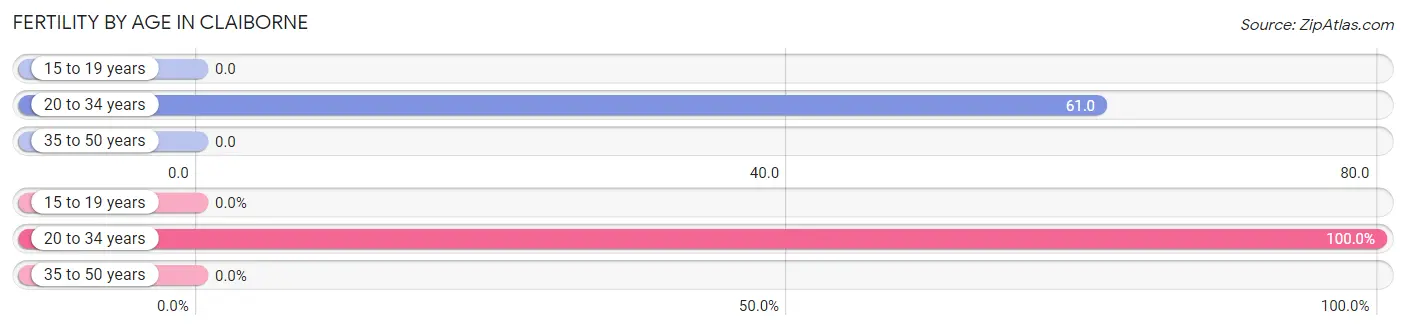
| Age Bracket | Women with Births | Births / 1,000 Women |
| 15 to 19 years | 0 (0.0%) | 0.0 |
| 20 to 34 years | 108 (100.0%) | 61.0 |
| 35 to 50 years | 0 (0.0%) | 0.0 |
| Total | 108 (100.0%) | 34.0 |
Fertility by Age by Marriage Status in Claiborne
45.4% of women with births (108) in Claiborne are married. The highest percentage of unmarried women with births falls into 20 to 34 years age bracket with 54.6% of them unmarried at the time of birth, while the lowest percentage of unmarried women with births belong to 20 to 34 years age bracket with 54.6% of them unmarried.
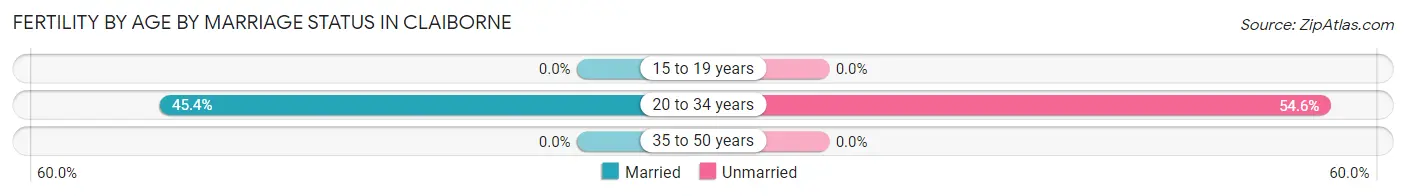
| Age Bracket | Married | Unmarried |
| 15 to 19 years | 0 (0.0%) | 0 (0.0%) |
| 20 to 34 years | 49 (45.4%) | 59 (54.6%) |
| 35 to 50 years | 0 (0.0%) | 0 (0.0%) |
| Total | 49 (45.4%) | 59 (54.6%) |
Fertility by Education in Claiborne
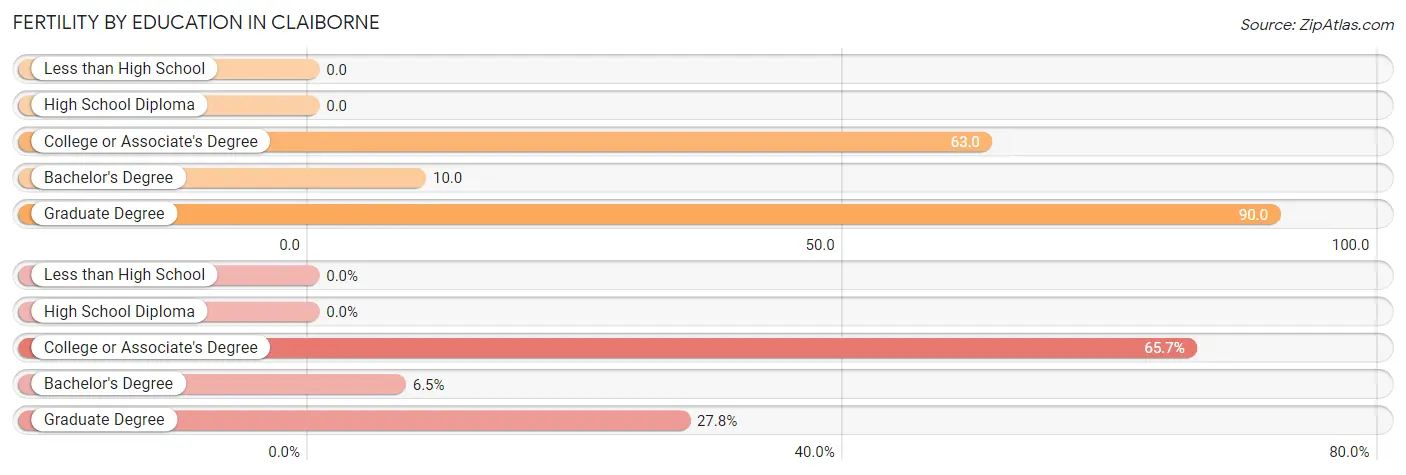
| Educational Attainment | Women with Births | Births / 1,000 Women |
| Less than High School | 0 (0.0%) | 0.0 |
| High School Diploma | 0 (0.0%) | 0.0 |
| College or Associate's Degree | 71 (65.7%) | 63.0 |
| Bachelor's Degree | 7 (6.5%) | 10.0 |
| Graduate Degree | 30 (27.8%) | 90.0 |
| Total | 108 (100.0%) | 34.0 |
Fertility by Education by Marriage Status in Claiborne
54.6% of women with births in Claiborne are unmarried. Women with the educational attainment of bachelor's degree are most likely to be married with 100.0% of them married at childbirth, while women with the educational attainment of college or associate's degree are least likely to be married with 83.1% of them unmarried at childbirth.
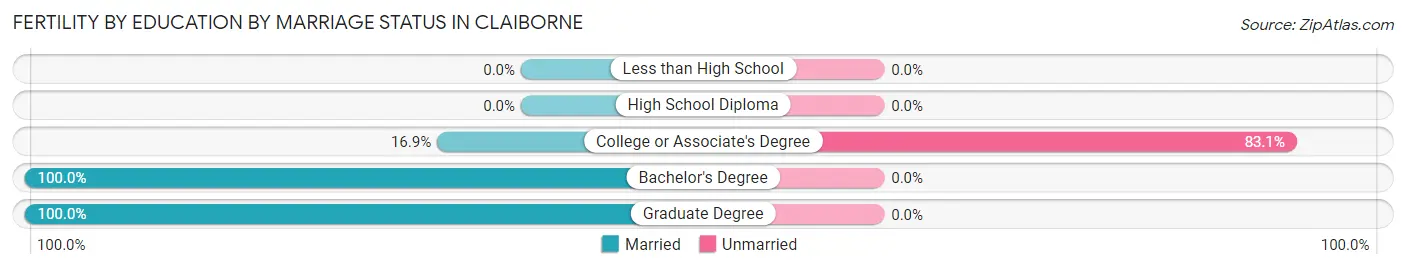
| Educational Attainment | Married | Unmarried |
| Less than High School | 0 (0.0%) | 0 (0.0%) |
| High School Diploma | 0 (0.0%) | 0 (0.0%) |
| College or Associate's Degree | 12 (16.9%) | 59 (83.1%) |
| Bachelor's Degree | 7 (100.0%) | 0 (0.0%) |
| Graduate Degree | 30 (100.0%) | 0 (0.0%) |
| Total | 49 (45.4%) | 59 (54.6%) |
Employment Characteristics in Claiborne
Employment by Class of Employer in Claiborne
Among the 6,111 employed individuals in Claiborne, private company employees (4,045 | 66.2%), local government employees (636 | 10.4%), and self-employed (not incorporated) (567 | 9.3%) make up the most common classes of employment.
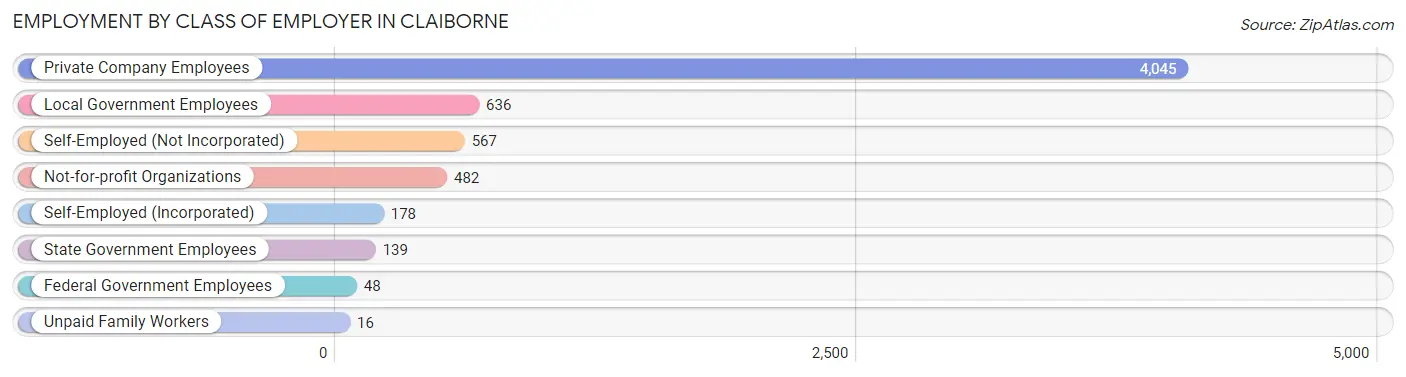
| Employer Class | # Employees | % Employees |
| Private Company Employees | 4,045 | 66.2% |
| Self-Employed (Incorporated) | 178 | 2.9% |
| Self-Employed (Not Incorporated) | 567 | 9.3% |
| Not-for-profit Organizations | 482 | 7.9% |
| Local Government Employees | 636 | 10.4% |
| State Government Employees | 139 | 2.3% |
| Federal Government Employees | 48 | 0.8% |
| Unpaid Family Workers | 16 | 0.3% |
| Total | 6,111 | 100.0% |
Employment Status by Age in Claiborne
According to the labor force statistics for Claiborne, out of the total population over 16 years of age (9,964), 62.2% or 6,198 individuals are in the labor force, with 0.8% or 50 of them unemployed. The age group with the highest labor force participation rate is 35 to 44 years, with 96.1% or 1,374 individuals in the labor force. Within the labor force, the 65 to 74 years age range has the highest percentage of unemployed individuals, with 9.5% or 20 of them being unemployed.
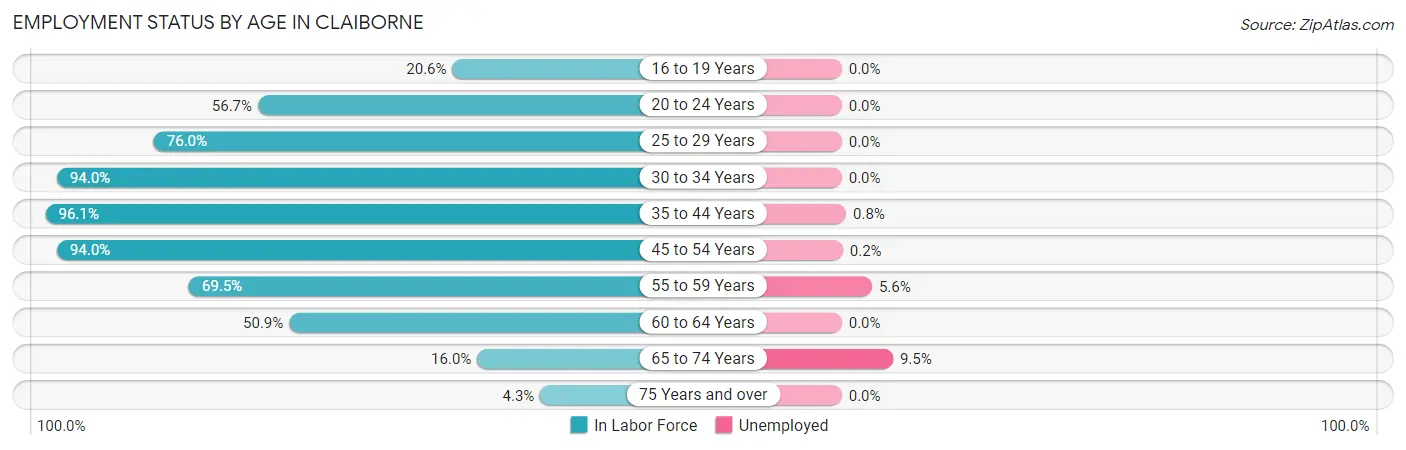
| Age Bracket | In Labor Force | Unemployed |
| 16 to 19 Years | 121 (20.6%) | 0 (0.0%) |
| 20 to 24 Years | 573 (56.7%) | 0 (0.0%) |
| 25 to 29 Years | 847 (76.0%) | 0 (0.0%) |
| 30 to 34 Years | 1,085 (94.0%) | 0 (0.0%) |
| 35 to 44 Years | 1,374 (96.1%) | 11 (0.8%) |
| 45 to 54 Years | 1,245 (94.0%) | 2 (0.2%) |
| 55 to 59 Years | 322 (69.5%) | 18 (5.6%) |
| 60 to 64 Years | 381 (50.9%) | 0 (0.0%) |
| 65 to 74 Years | 211 (16.0%) | 20 (9.5%) |
| 75 Years and over | 35 (4.3%) | 0 (0.0%) |
| Total | 6,198 (62.2%) | 50 (0.8%) |
Employment Status by Educational Attainment in Claiborne
According to labor force statistics for Claiborne, 84.3% of individuals (5,255) out of the total population between 25 and 64 years of age (6,234) are in the labor force, with 0.6% or 32 of them being unemployed. The group with the highest labor force participation rate are those with the educational attainment of bachelor's degree or higher, with 94.7% or 1,942 individuals in the labor force. Within the labor force, individuals with bachelor's degree or higher education have the highest percentage of unemployment, with 1.6% or 31 of them being unemployed.
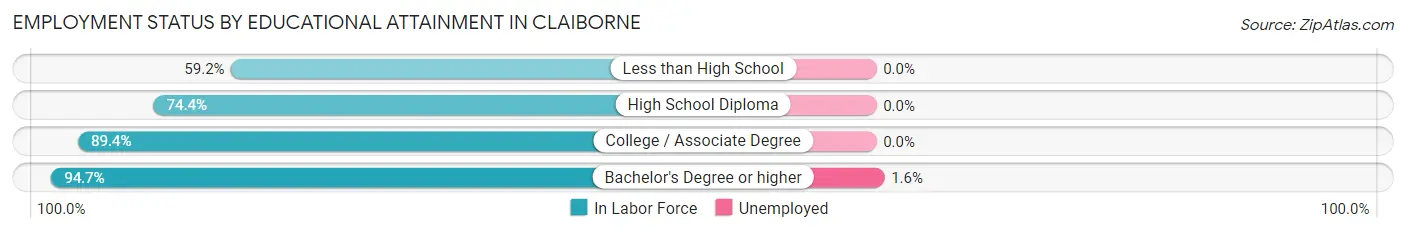
| Educational Attainment | In Labor Force | Unemployed |
| Less than High School | 205 (59.2%) | 0 (0.0%) |
| High School Diploma | 1,603 (74.4%) | 0 (0.0%) |
| College / Associate Degree | 1,505 (89.4%) | 0 (0.0%) |
| Bachelor's Degree or higher | 1,942 (94.7%) | 33 (1.6%) |
| Total | 5,255 (84.3%) | 37 (0.6%) |
Employment Occupations by Sex in Claiborne
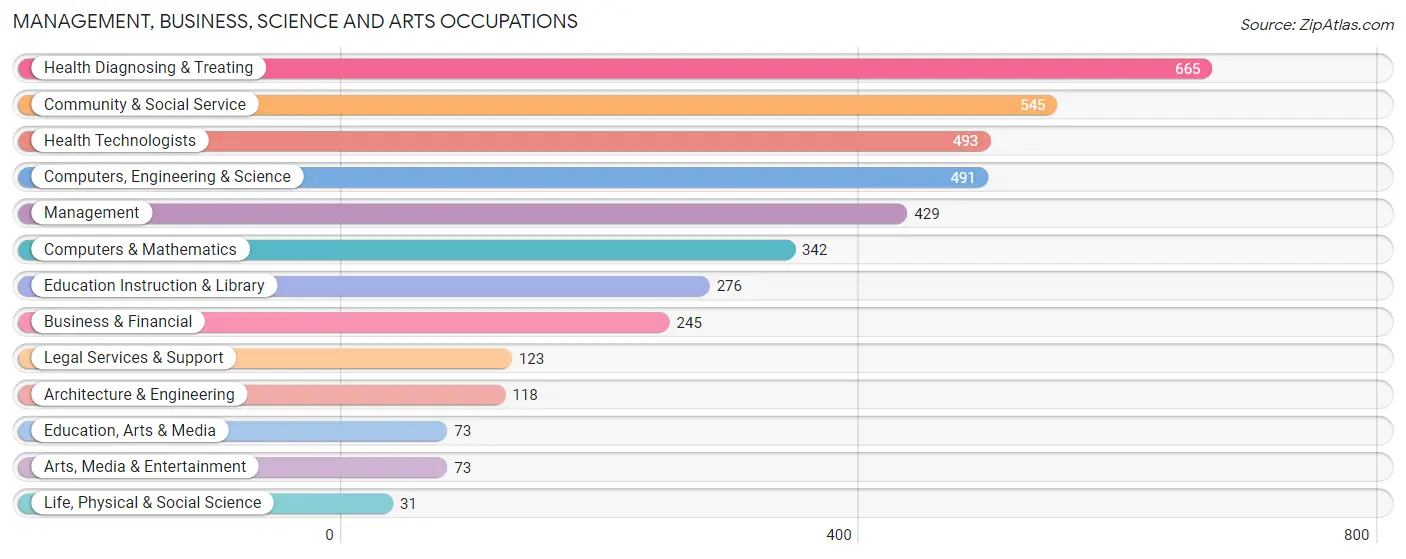
Management, Business, Science and Arts Occupations
The most common Management, Business, Science and Arts occupations in Claiborne are Health Diagnosing & Treating (665 | 10.8%), Community & Social Service (545 | 8.9%), Health Technologists (493 | 8.0%), Computers, Engineering & Science (491 | 8.0%), and Management (429 | 7.0%).
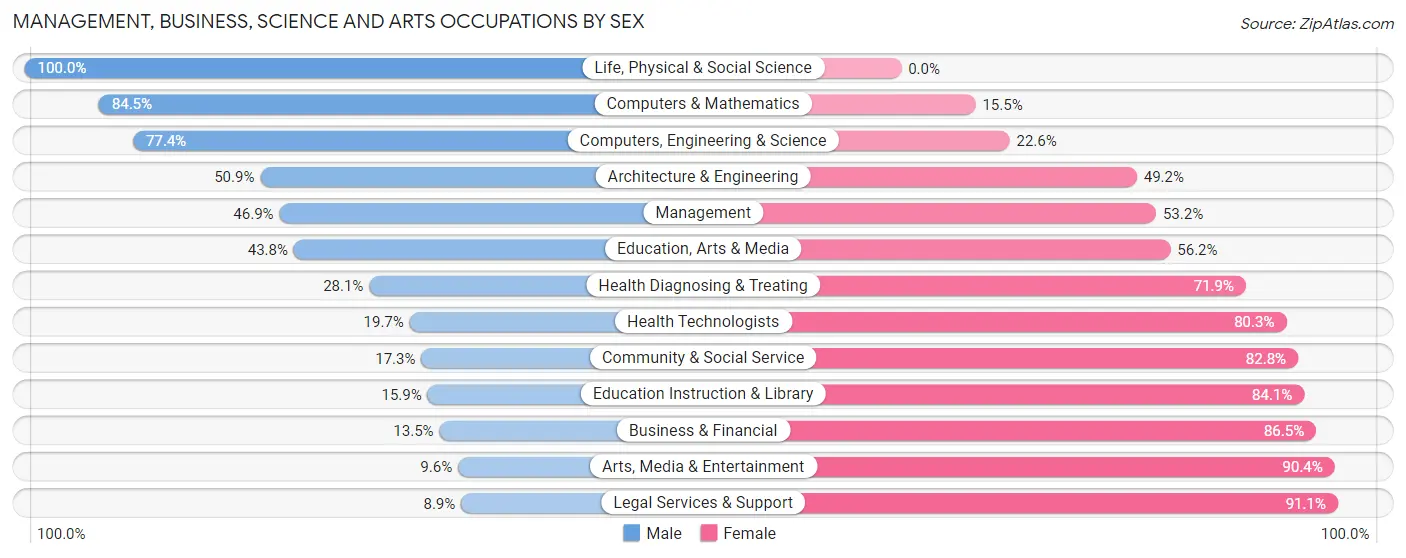
Management, Business, Science and Arts Occupations by Sex
Within the Management, Business, Science and Arts occupations in Claiborne, the most male-oriented occupations are Life, Physical & Social Science (100.0%), Computers & Mathematics (84.5%), and Computers, Engineering & Science (77.4%), while the most female-oriented occupations are Legal Services & Support (91.1%), Arts, Media & Entertainment (90.4%), and Business & Financial (86.5%).
| Occupation | Male | Female |
| Management | 201 (46.9%) | 228 (53.1%) |
| Business & Financial | 33 (13.5%) | 212 (86.5%) |
| Computers, Engineering & Science | 380 (77.4%) | 111 (22.6%) |
| Computers & Mathematics | 289 (84.5%) | 53 (15.5%) |
| Architecture & Engineering | 60 (50.8%) | 58 (49.1%) |
| Life, Physical & Social Science | 31 (100.0%) | 0 (0.0%) |
| Community & Social Service | 94 (17.2%) | 451 (82.8%) |
| Education, Arts & Media | 32 (43.8%) | 41 (56.2%) |
| Legal Services & Support | 11 (8.9%) | 112 (91.1%) |
| Education Instruction & Library | 44 (15.9%) | 232 (84.1%) |
| Arts, Media & Entertainment | 7 (9.6%) | 66 (90.4%) |
| Health Diagnosing & Treating | 187 (28.1%) | 478 (71.9%) |
| Health Technologists | 97 (19.7%) | 396 (80.3%) |
| Total (Category) | 895 (37.7%) | 1,480 (62.3%) |
| Total (Overall) | 3,084 (50.2%) | 3,057 (49.8%) |
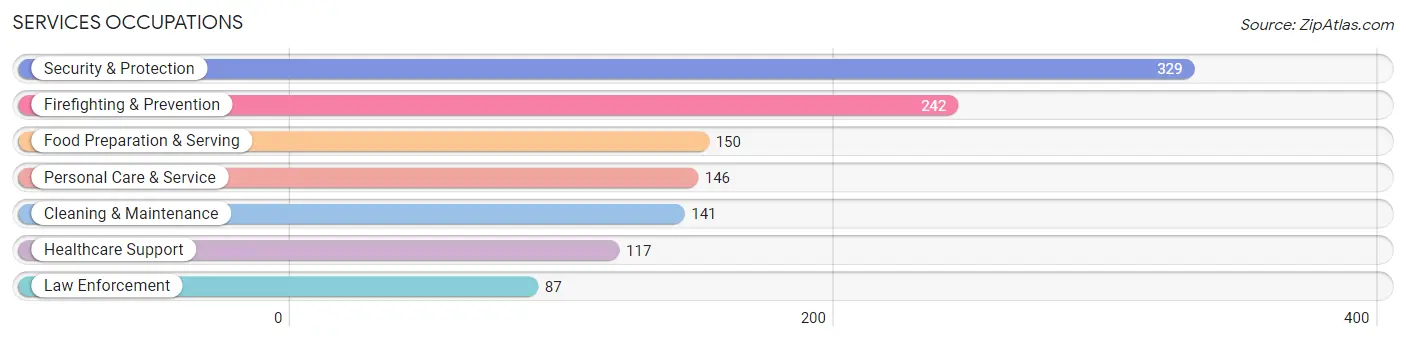
Services Occupations
The most common Services occupations in Claiborne are Security & Protection (329 | 5.4%), Firefighting & Prevention (242 | 3.9%), Food Preparation & Serving (150 | 2.4%), Personal Care & Service (146 | 2.4%), and Cleaning & Maintenance (141 | 2.3%).
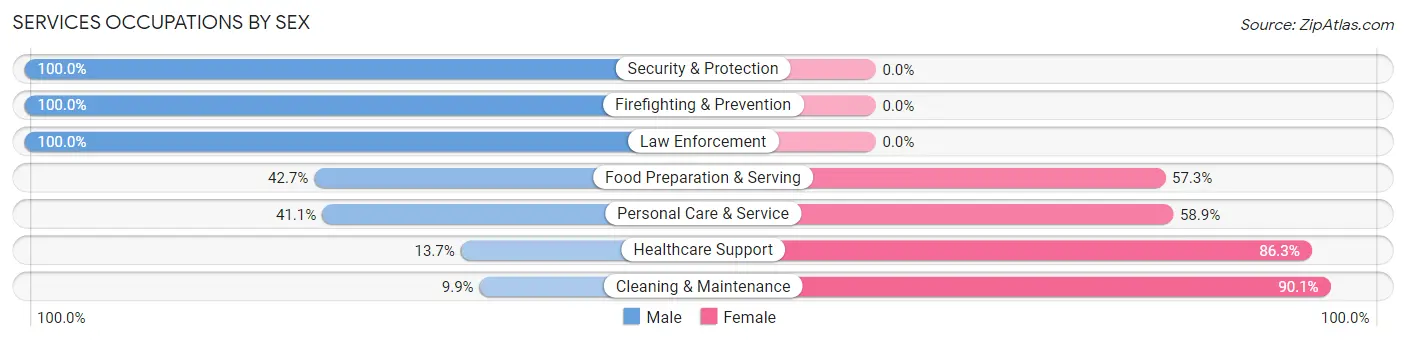
Services Occupations by Sex
Within the Services occupations in Claiborne, the most male-oriented occupations are Security & Protection (100.0%), Firefighting & Prevention (100.0%), and Law Enforcement (100.0%), while the most female-oriented occupations are Cleaning & Maintenance (90.1%), Healthcare Support (86.3%), and Personal Care & Service (58.9%).
| Occupation | Male | Female |
| Healthcare Support | 16 (13.7%) | 101 (86.3%) |
| Security & Protection | 329 (100.0%) | 0 (0.0%) |
| Firefighting & Prevention | 242 (100.0%) | 0 (0.0%) |
| Law Enforcement | 87 (100.0%) | 0 (0.0%) |
| Food Preparation & Serving | 64 (42.7%) | 86 (57.3%) |
| Cleaning & Maintenance | 14 (9.9%) | 127 (90.1%) |
| Personal Care & Service | 60 (41.1%) | 86 (58.9%) |
| Total (Category) | 483 (54.7%) | 400 (45.3%) |
| Total (Overall) | 3,084 (50.2%) | 3,057 (49.8%) |
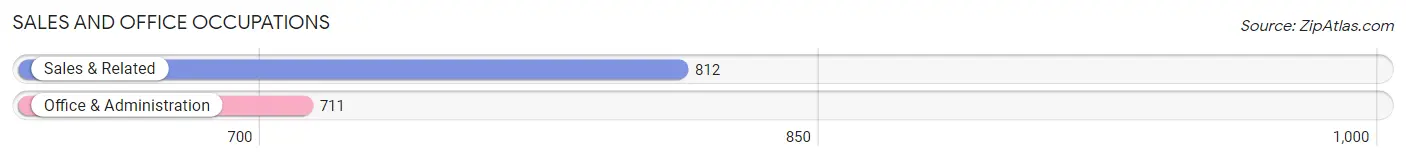
Sales and Office Occupations
The most common Sales and Office occupations in Claiborne are Sales & Related (812 | 13.2%), and Office & Administration (711 | 11.6%).
Sales and Office Occupations by Sex
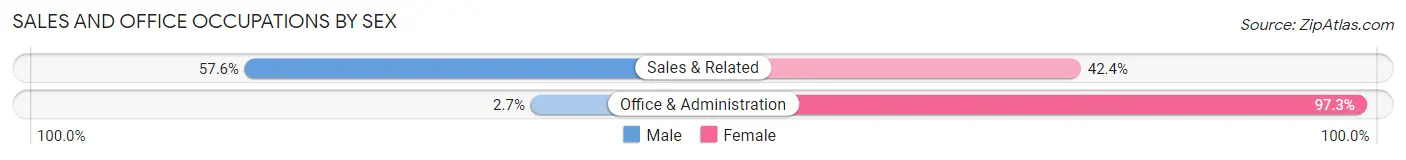
| Occupation | Male | Female |
| Sales & Related | 468 (57.6%) | 344 (42.4%) |
| Office & Administration | 19 (2.7%) | 692 (97.3%) |
| Total (Category) | 487 (32.0%) | 1,036 (68.0%) |
| Total (Overall) | 3,084 (50.2%) | 3,057 (49.8%) |
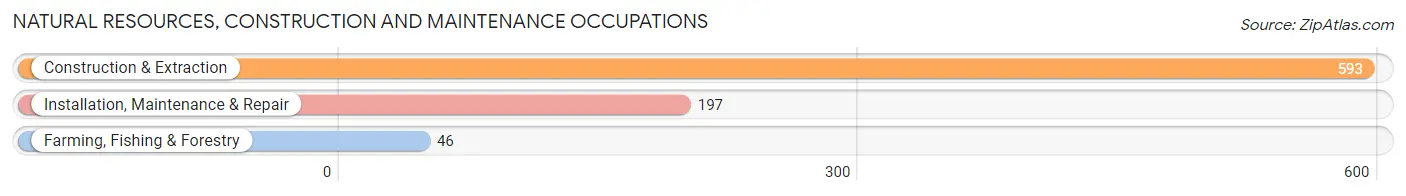
Natural Resources, Construction and Maintenance Occupations
The most common Natural Resources, Construction and Maintenance occupations in Claiborne are Construction & Extraction (593 | 9.7%), Installation, Maintenance & Repair (197 | 3.2%), and Farming, Fishing & Forestry (46 | 0.7%).
Natural Resources, Construction and Maintenance Occupations by Sex
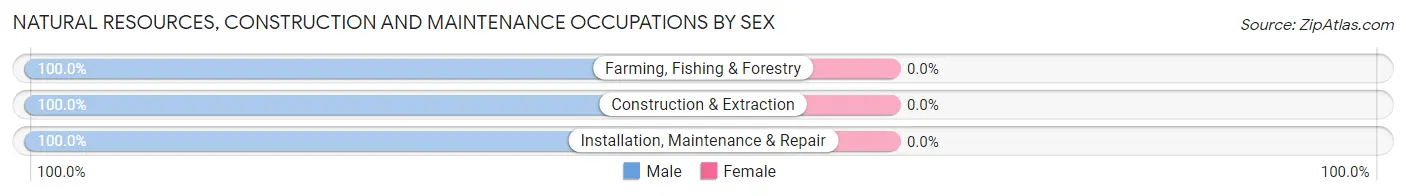
| Occupation | Male | Female |
| Farming, Fishing & Forestry | 46 (100.0%) | 0 (0.0%) |
| Construction & Extraction | 593 (100.0%) | 0 (0.0%) |
| Installation, Maintenance & Repair | 197 (100.0%) | 0 (0.0%) |
| Total (Category) | 836 (100.0%) | 0 (0.0%) |
| Total (Overall) | 3,084 (50.2%) | 3,057 (49.8%) |
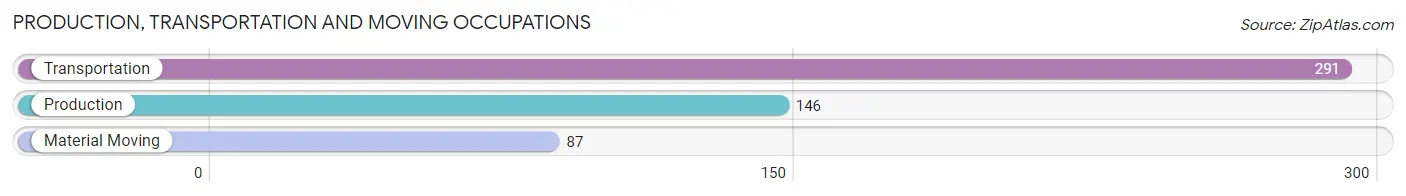
Production, Transportation and Moving Occupations
The most common Production, Transportation and Moving occupations in Claiborne are Transportation (291 | 4.7%), Production (146 | 2.4%), and Material Moving (87 | 1.4%).
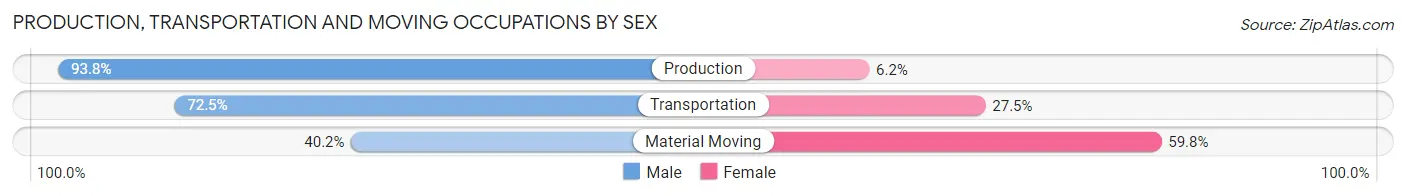
Production, Transportation and Moving Occupations by Sex
| Occupation | Male | Female |
| Production | 137 (93.8%) | 9 (6.2%) |
| Transportation | 211 (72.5%) | 80 (27.5%) |
| Material Moving | 35 (40.2%) | 52 (59.8%) |
| Total (Category) | 383 (73.1%) | 141 (26.9%) |
| Total (Overall) | 3,084 (50.2%) | 3,057 (49.8%) |
Employment Industries by Sex in Claiborne
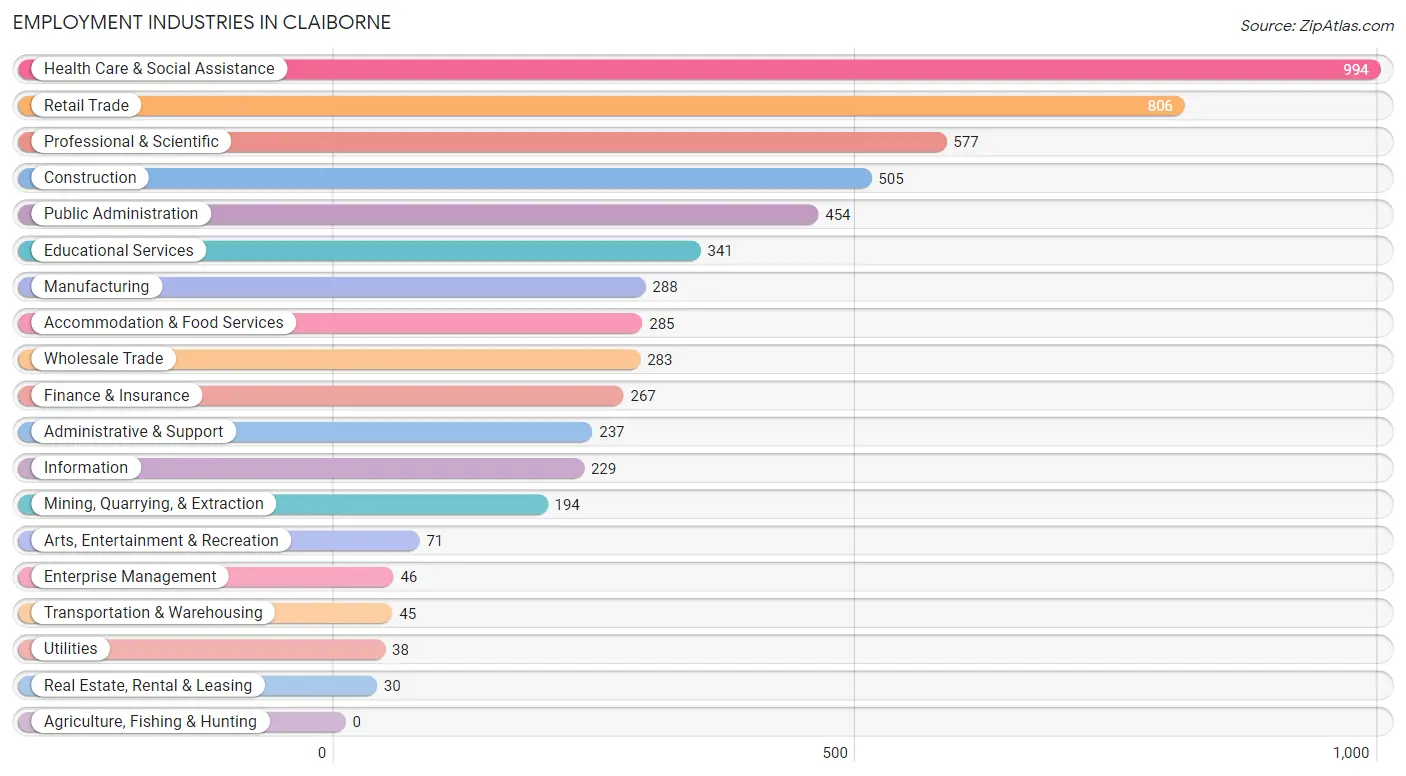
Employment Industries in Claiborne
The major employment industries in Claiborne include Health Care & Social Assistance (994 | 16.2%), Retail Trade (806 | 13.1%), Professional & Scientific (577 | 9.4%), Construction (505 | 8.2%), and Public Administration (454 | 7.4%).
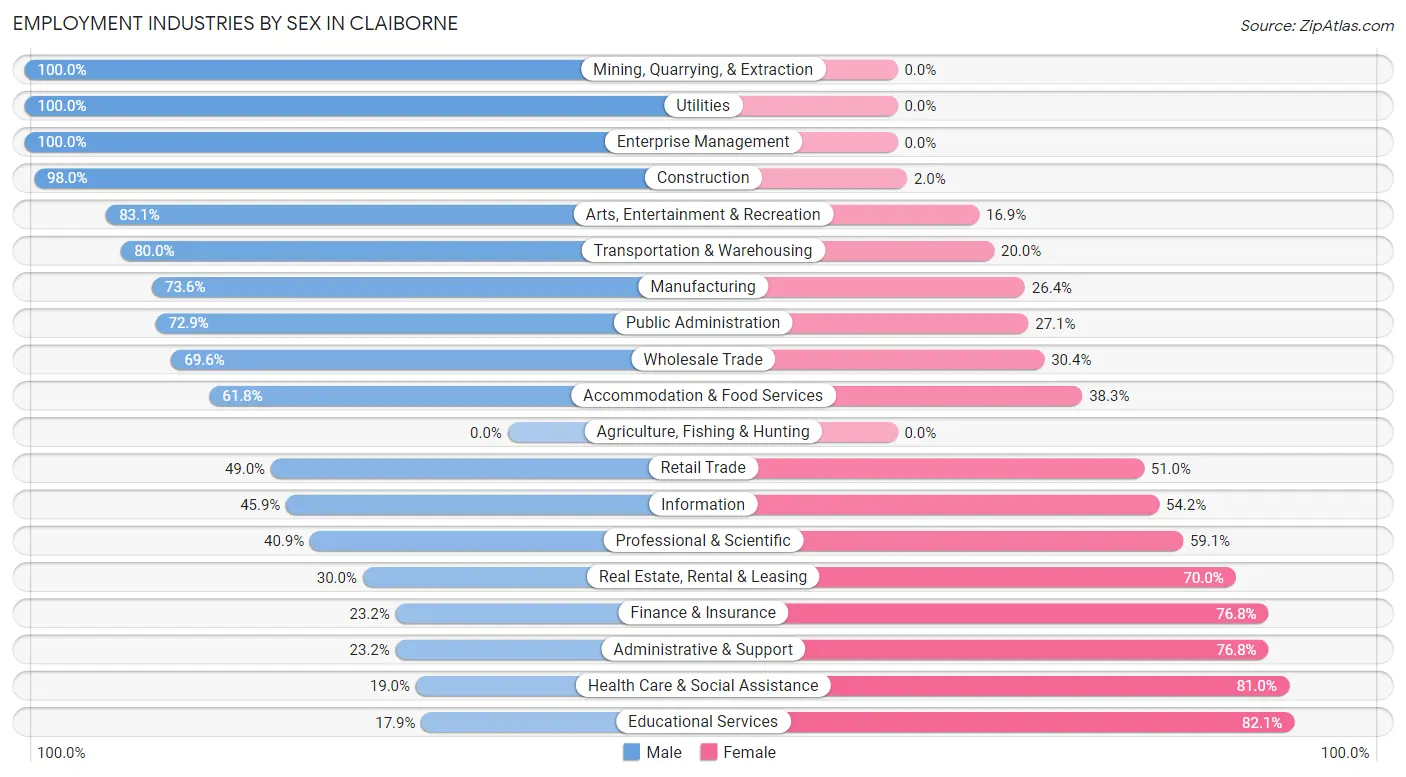
Employment Industries by Sex in Claiborne
The Claiborne industries that see more men than women are Mining, Quarrying, & Extraction (100.0%), Utilities (100.0%), and Enterprise Management (100.0%), whereas the industries that tend to have a higher number of women are Educational Services (82.1%), Health Care & Social Assistance (81.0%), and Administrative & Support (76.8%).
| Industry | Male | Female |
| Agriculture, Fishing & Hunting | 0 (0.0%) | 0 (0.0%) |
| Mining, Quarrying, & Extraction | 194 (100.0%) | 0 (0.0%) |
| Construction | 495 (98.0%) | 10 (2.0%) |
| Manufacturing | 212 (73.6%) | 76 (26.4%) |
| Wholesale Trade | 197 (69.6%) | 86 (30.4%) |
| Retail Trade | 395 (49.0%) | 411 (51.0%) |
| Transportation & Warehousing | 36 (80.0%) | 9 (20.0%) |
| Utilities | 38 (100.0%) | 0 (0.0%) |
| Information | 105 (45.9%) | 124 (54.1%) |
| Finance & Insurance | 62 (23.2%) | 205 (76.8%) |
| Real Estate, Rental & Leasing | 9 (30.0%) | 21 (70.0%) |
| Professional & Scientific | 236 (40.9%) | 341 (59.1%) |
| Enterprise Management | 46 (100.0%) | 0 (0.0%) |
| Administrative & Support | 55 (23.2%) | 182 (76.8%) |
| Educational Services | 61 (17.9%) | 280 (82.1%) |
| Health Care & Social Assistance | 189 (19.0%) | 805 (81.0%) |
| Arts, Entertainment & Recreation | 59 (83.1%) | 12 (16.9%) |
| Accommodation & Food Services | 176 (61.8%) | 109 (38.3%) |
| Public Administration | 331 (72.9%) | 123 (27.1%) |
| Total | 3,084 (50.2%) | 3,057 (49.8%) |
Education in Claiborne
School Enrollment in Claiborne
The most common levels of schooling among the 2,782 students in Claiborne are college / undergraduate (879 | 31.6%), middle school (525 | 18.9%), and high school (495 | 17.8%).
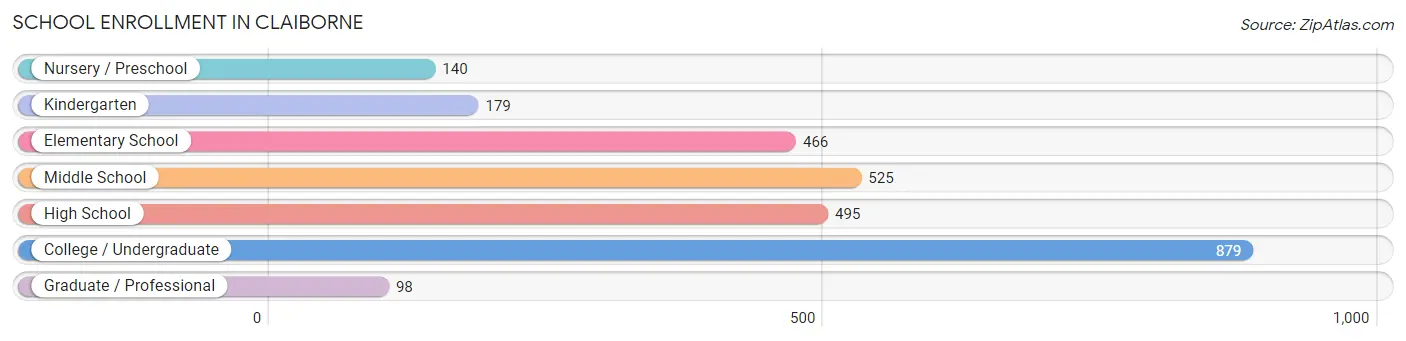
| School Level | # Students | % Students |
| Nursery / Preschool | 140 | 5.0% |
| Kindergarten | 179 | 6.4% |
| Elementary School | 466 | 16.8% |
| Middle School | 525 | 18.9% |
| High School | 495 | 17.8% |
| College / Undergraduate | 879 | 31.6% |
| Graduate / Professional | 98 | 3.5% |
| Total | 2,782 | 100.0% |
School Enrollment by Age by Funding Source in Claiborne
Out of a total of 2,782 students who are enrolled in schools in Claiborne, 278 (10.0%) attend a private institution, while the remaining 2,504 (90.0%) are enrolled in public schools. The age group of 35 years and over has the highest likelihood of being enrolled in private schools, with 53 (36.8% in the age bracket) enrolled. Conversely, the age group of 18 to 19 year olds has the lowest likelihood of being enrolled in a private school, with 261 (100.0% in the age bracket) attending a public institution.
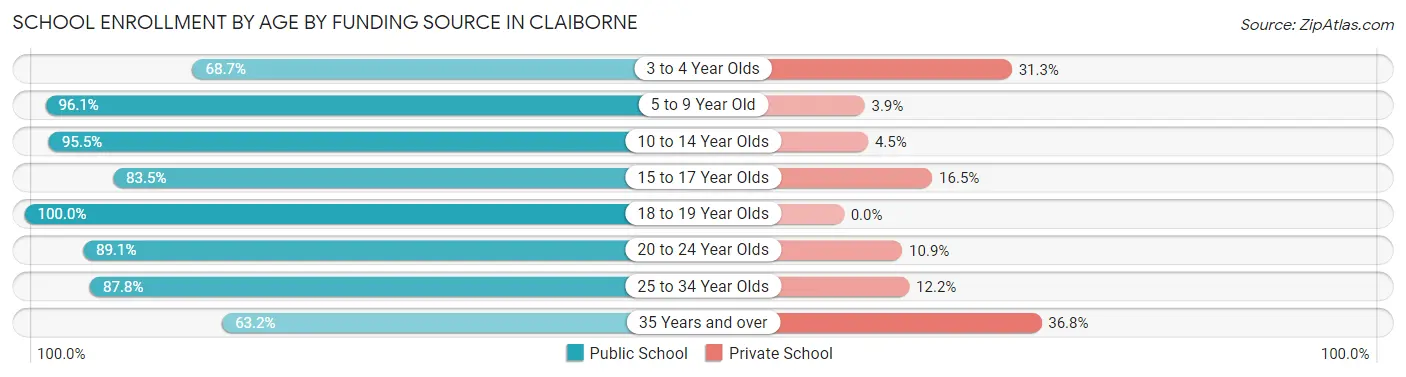
| Age Bracket | Public School | Private School |
| 3 to 4 Year Olds | 79 (68.7%) | 36 (31.3%) |
| 5 to 9 Year Old | 618 (96.1%) | 25 (3.9%) |
| 10 to 14 Year Olds | 527 (95.5%) | 25 (4.5%) |
| 15 to 17 Year Olds | 294 (83.5%) | 58 (16.5%) |
| 18 to 19 Year Olds | 261 (100.0%) | 0 (0.0%) |
| 20 to 24 Year Olds | 491 (89.1%) | 60 (10.9%) |
| 25 to 34 Year Olds | 144 (87.8%) | 20 (12.2%) |
| 35 Years and over | 91 (63.2%) | 53 (36.8%) |
| Total | 2,504 (90.0%) | 278 (10.0%) |
Educational Attainment by Field of Study in Claiborne
Science & technology (644 | 21.3%), business (423 | 14.0%), education (399 | 13.2%), liberal arts & history (382 | 12.6%), and arts & humanities (344 | 11.4%) are the most common fields of study among 3,025 individuals in Claiborne who have obtained a bachelor's degree or higher.
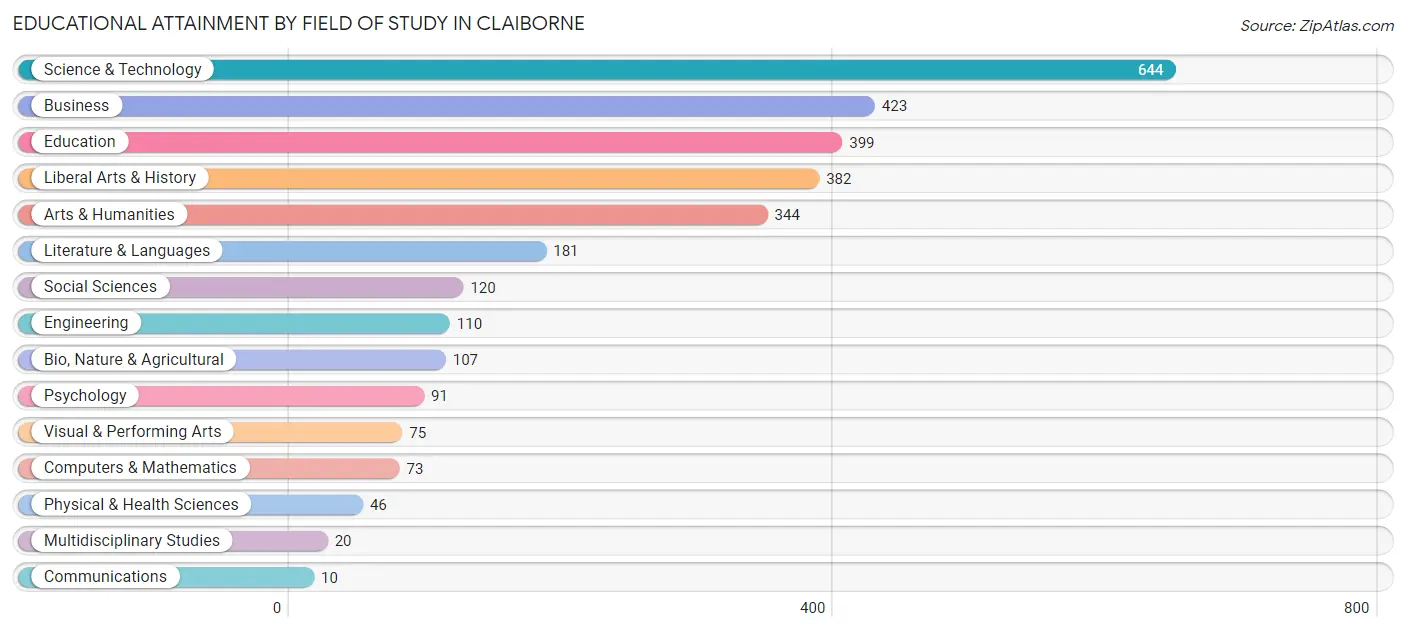
| Field of Study | # Graduates | % Graduates |
| Computers & Mathematics | 73 | 2.4% |
| Bio, Nature & Agricultural | 107 | 3.5% |
| Physical & Health Sciences | 46 | 1.5% |
| Psychology | 91 | 3.0% |
| Social Sciences | 120 | 4.0% |
| Engineering | 110 | 3.6% |
| Multidisciplinary Studies | 20 | 0.7% |
| Science & Technology | 644 | 21.3% |
| Business | 423 | 14.0% |
| Education | 399 | 13.2% |
| Literature & Languages | 181 | 6.0% |
| Liberal Arts & History | 382 | 12.6% |
| Visual & Performing Arts | 75 | 2.5% |
| Communications | 10 | 0.3% |
| Arts & Humanities | 344 | 11.4% |
| Total | 3,025 | 100.0% |
Transportation & Commute in Claiborne
Vehicle Availability by Sex in Claiborne
The most prevalent vehicle ownership categories in Claiborne are males with 2 vehicles (1,662, accounting for 54.4%) and females with 2 vehicles (1,482, making up 54.4%).
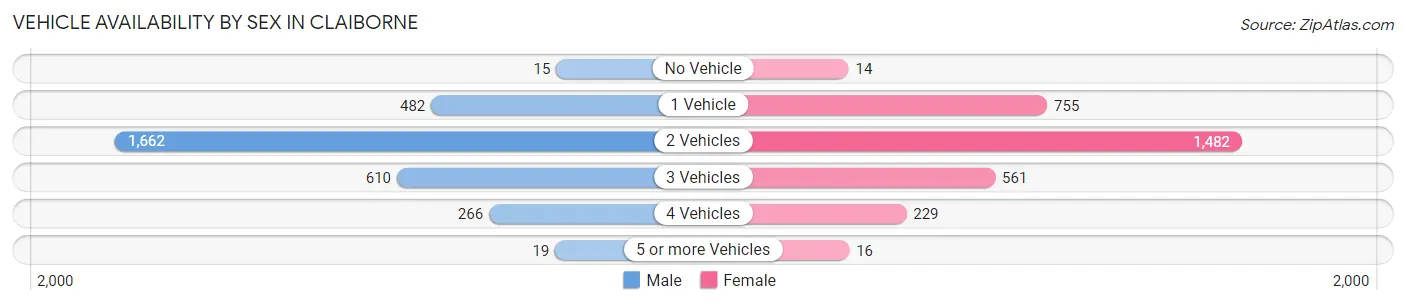
| Vehicles Available | Male | Female |
| No Vehicle | 15 (0.5%) | 14 (0.5%) |
| 1 Vehicle | 482 (15.8%) | 755 (24.7%) |
| 2 Vehicles | 1,662 (54.4%) | 1,482 (48.5%) |
| 3 Vehicles | 610 (20.0%) | 561 (18.3%) |
| 4 Vehicles | 266 (8.7%) | 229 (7.5%) |
| 5 or more Vehicles | 19 (0.6%) | 16 (0.5%) |
| Total | 3,054 (100.0%) | 3,057 (100.0%) |
Commute Time in Claiborne
The most frequently occuring commute durations in Claiborne are 15 to 19 minutes (1,337 commuters, 23.4%), 20 to 24 minutes (1,306 commuters, 22.8%), and 10 to 14 minutes (1,034 commuters, 18.1%).
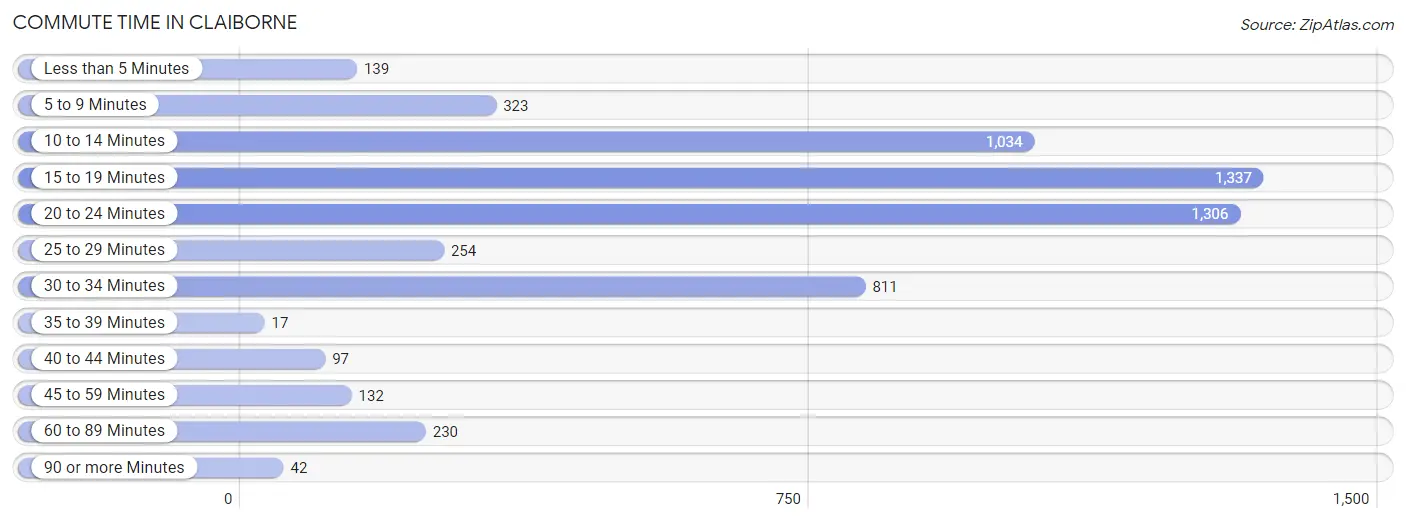
| Commute Time | # Commuters | % Commuters |
| Less than 5 Minutes | 139 | 2.4% |
| 5 to 9 Minutes | 323 | 5.6% |
| 10 to 14 Minutes | 1,034 | 18.1% |
| 15 to 19 Minutes | 1,337 | 23.4% |
| 20 to 24 Minutes | 1,306 | 22.8% |
| 25 to 29 Minutes | 254 | 4.4% |
| 30 to 34 Minutes | 811 | 14.2% |
| 35 to 39 Minutes | 17 | 0.3% |
| 40 to 44 Minutes | 97 | 1.7% |
| 45 to 59 Minutes | 132 | 2.3% |
| 60 to 89 Minutes | 230 | 4.0% |
| 90 or more Minutes | 42 | 0.7% |
Commute Time by Sex in Claiborne
The most common commute times in Claiborne are 15 to 19 minutes (753 commuters, 26.6%) for males and 20 to 24 minutes (729 commuters, 25.2%) for females.
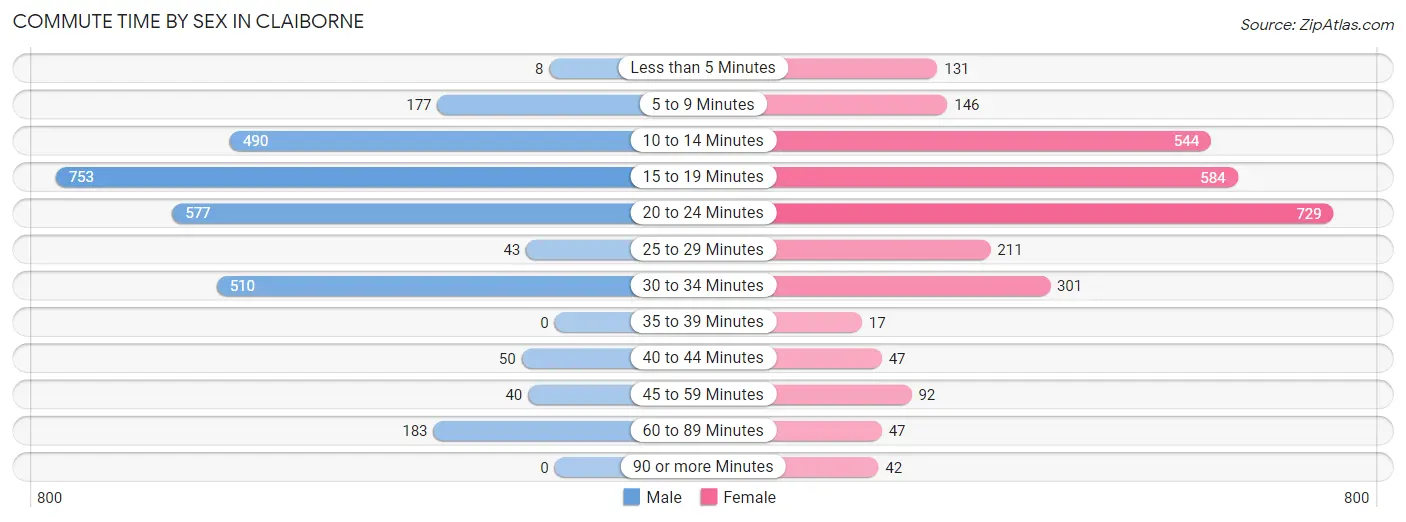
| Commute Time | Male | Female |
| Less than 5 Minutes | 8 (0.3%) | 131 (4.5%) |
| 5 to 9 Minutes | 177 (6.2%) | 146 (5.1%) |
| 10 to 14 Minutes | 490 (17.3%) | 544 (18.8%) |
| 15 to 19 Minutes | 753 (26.6%) | 584 (20.2%) |
| 20 to 24 Minutes | 577 (20.4%) | 729 (25.2%) |
| 25 to 29 Minutes | 43 (1.5%) | 211 (7.3%) |
| 30 to 34 Minutes | 510 (18.0%) | 301 (10.4%) |
| 35 to 39 Minutes | 0 (0.0%) | 17 (0.6%) |
| 40 to 44 Minutes | 50 (1.8%) | 47 (1.6%) |
| 45 to 59 Minutes | 40 (1.4%) | 92 (3.2%) |
| 60 to 89 Minutes | 183 (6.5%) | 47 (1.6%) |
| 90 or more Minutes | 0 (0.0%) | 42 (1.5%) |
Time of Departure to Work by Sex in Claiborne
The most frequent times of departure to work in Claiborne are 7:00 AM to 7:29 AM (673, 23.8%) for males and 7:00 AM to 7:29 AM (788, 27.3%) for females.
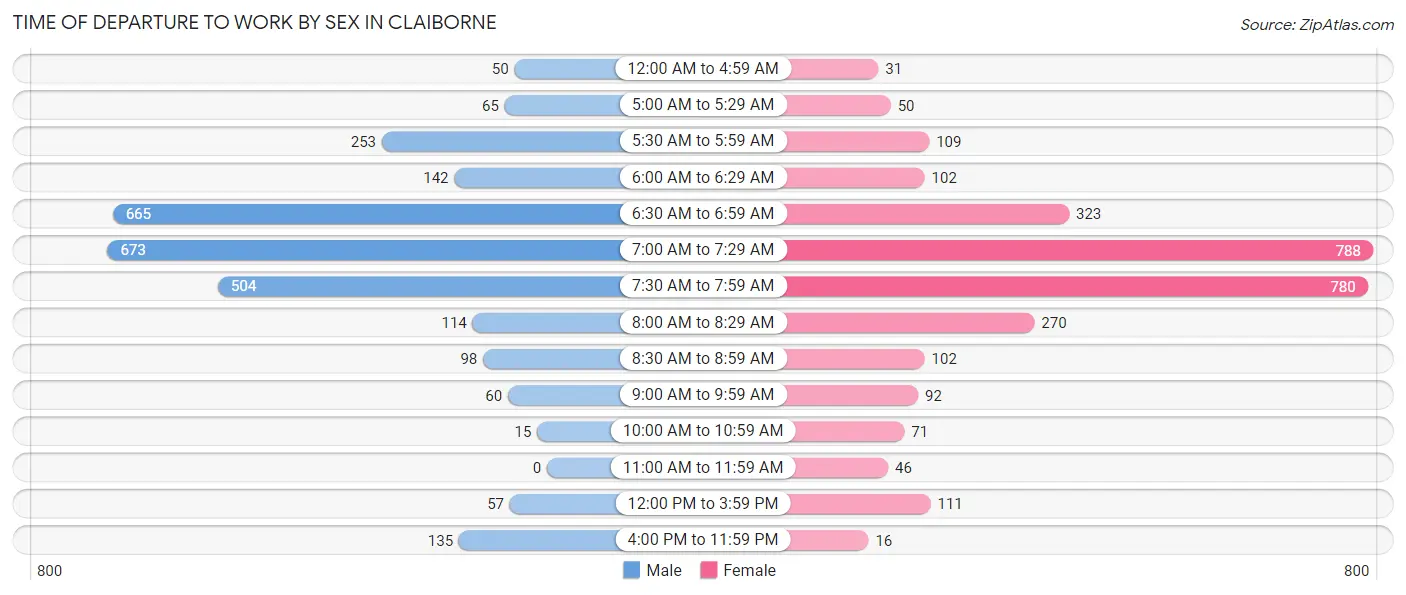
| Time of Departure | Male | Female |
| 12:00 AM to 4:59 AM | 50 (1.8%) | 31 (1.1%) |
| 5:00 AM to 5:29 AM | 65 (2.3%) | 50 (1.7%) |
| 5:30 AM to 5:59 AM | 253 (8.9%) | 109 (3.8%) |
| 6:00 AM to 6:29 AM | 142 (5.0%) | 102 (3.5%) |
| 6:30 AM to 6:59 AM | 665 (23.5%) | 323 (11.2%) |
| 7:00 AM to 7:29 AM | 673 (23.8%) | 788 (27.3%) |
| 7:30 AM to 7:59 AM | 504 (17.8%) | 780 (27.0%) |
| 8:00 AM to 8:29 AM | 114 (4.0%) | 270 (9.3%) |
| 8:30 AM to 8:59 AM | 98 (3.5%) | 102 (3.5%) |
| 9:00 AM to 9:59 AM | 60 (2.1%) | 92 (3.2%) |
| 10:00 AM to 10:59 AM | 15 (0.5%) | 71 (2.5%) |
| 11:00 AM to 11:59 AM | 0 (0.0%) | 46 (1.6%) |
| 12:00 PM to 3:59 PM | 57 (2.0%) | 111 (3.8%) |
| 4:00 PM to 11:59 PM | 135 (4.8%) | 16 (0.5%) |
| Total | 2,831 (100.0%) | 2,891 (100.0%) |
Housing Occupancy in Claiborne
Occupancy by Ownership in Claiborne
Of the total 4,966 dwellings in Claiborne, owner-occupied units account for 2,968 (59.8%), while renter-occupied units make up 1,998 (40.2%).
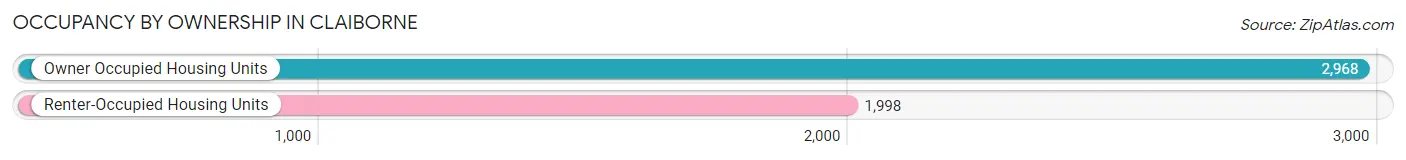
| Occupancy | # Housing Units | % Housing Units |
| Owner Occupied Housing Units | 2,968 | 59.8% |
| Renter-Occupied Housing Units | 1,998 | 40.2% |
| Total Occupied Housing Units | 4,966 | 100.0% |
Occupancy by Household Size in Claiborne
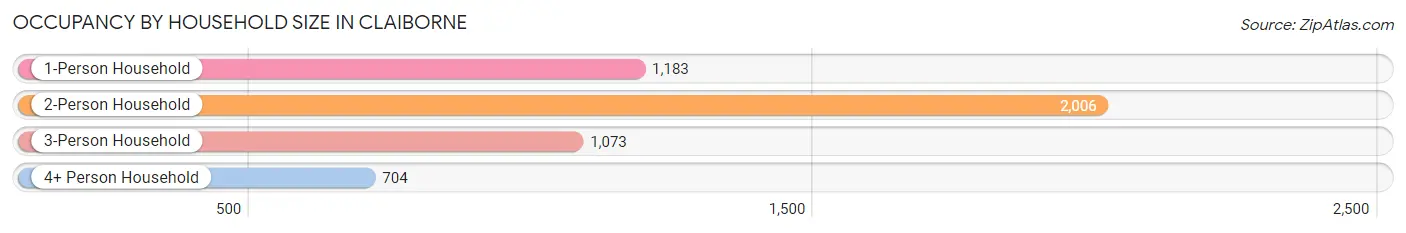
| Household Size | # Housing Units | % Housing Units |
| 1-Person Household | 1,183 | 23.8% |
| 2-Person Household | 2,006 | 40.4% |
| 3-Person Household | 1,073 | 21.6% |
| 4+ Person Household | 704 | 14.2% |
| Total Housing Units | 4,966 | 100.0% |
Occupancy by Ownership by Household Size in Claiborne
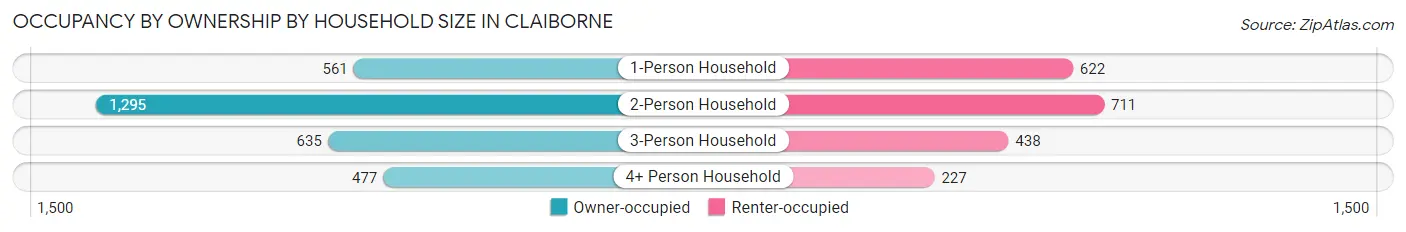
| Household Size | Owner-occupied | Renter-occupied |
| 1-Person Household | 561 (47.4%) | 622 (52.6%) |
| 2-Person Household | 1,295 (64.6%) | 711 (35.4%) |
| 3-Person Household | 635 (59.2%) | 438 (40.8%) |
| 4+ Person Household | 477 (67.8%) | 227 (32.2%) |
| Total Housing Units | 2,968 (59.8%) | 1,998 (40.2%) |
Occupancy by Educational Attainment in Claiborne
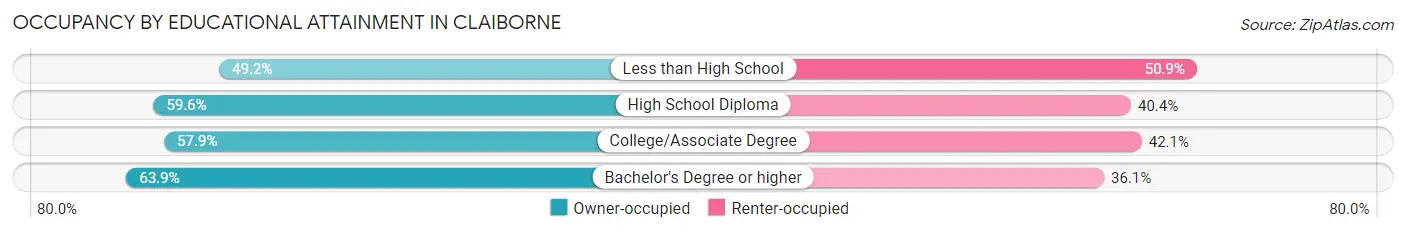
| Household Size | Owner-occupied | Renter-occupied |
| Less than High School | 116 (49.1%) | 120 (50.8%) |
| High School Diploma | 912 (59.6%) | 619 (40.4%) |
| College/Associate Degree | 993 (57.9%) | 723 (42.1%) |
| Bachelor's Degree or higher | 947 (63.9%) | 536 (36.1%) |
Occupancy by Age of Householder in Claiborne
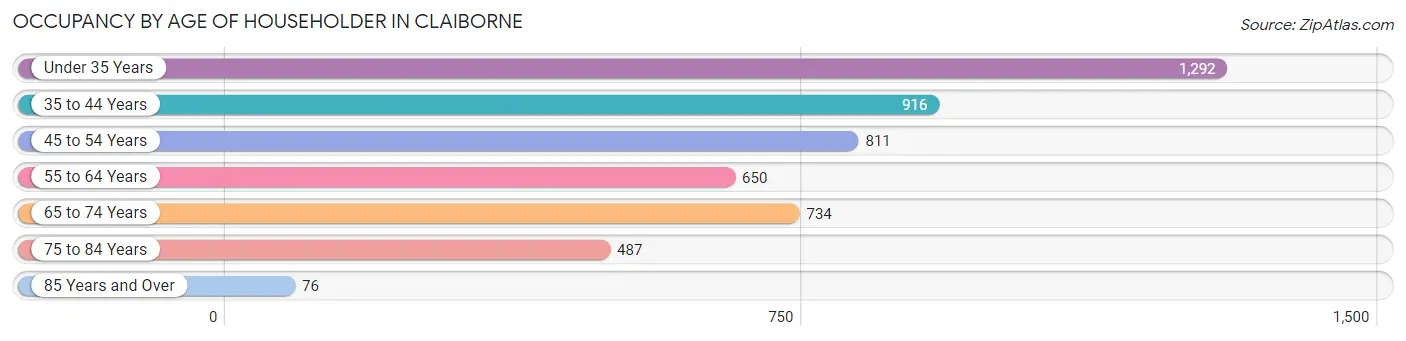
| Age Bracket | # Households | % Households |
| Under 35 Years | 1,292 | 26.0% |
| 35 to 44 Years | 916 | 18.4% |
| 45 to 54 Years | 811 | 16.3% |
| 55 to 64 Years | 650 | 13.1% |
| 65 to 74 Years | 734 | 14.8% |
| 75 to 84 Years | 487 | 9.8% |
| 85 Years and Over | 76 | 1.5% |
| Total | 4,966 | 100.0% |
Housing Finances in Claiborne
Median Income by Occupancy in Claiborne
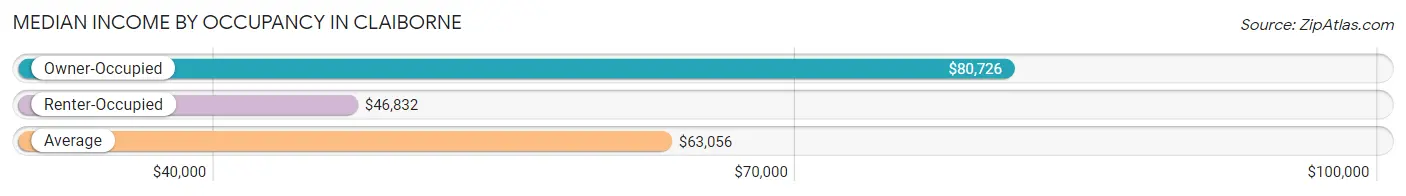
| Occupancy Type | # Households | Median Income |
| Owner-Occupied | 2,968 (59.8%) | $80,726 |
| Renter-Occupied | 1,998 (40.2%) | $46,832 |
| Average | 4,966 (100.0%) | $63,056 |
Occupancy by Householder Income Bracket in Claiborne
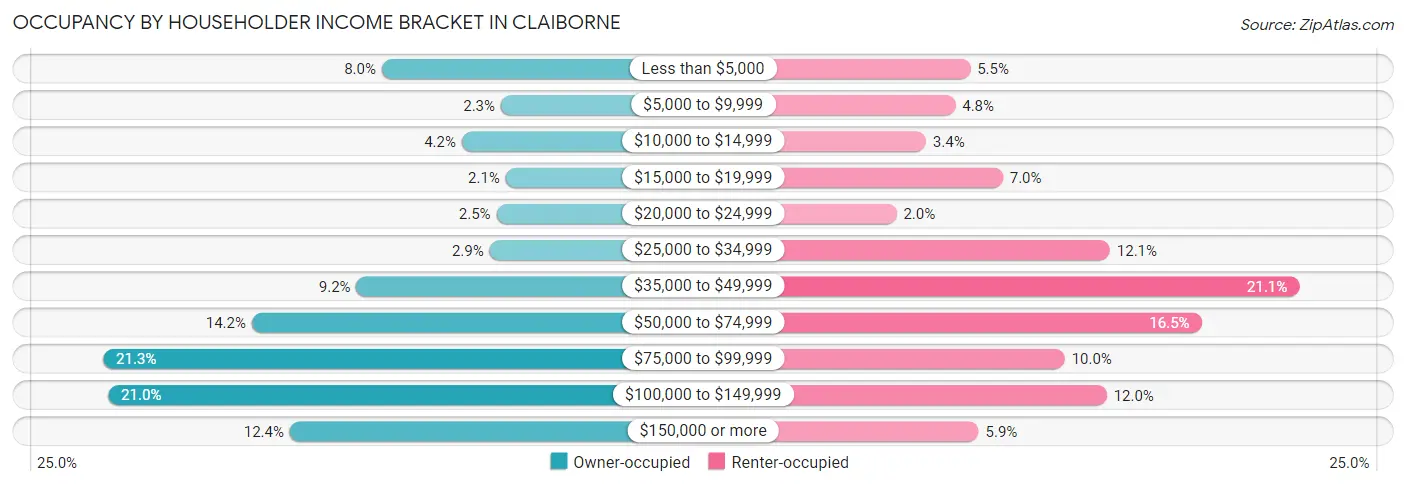
| Income Bracket | Owner-occupied | Renter-occupied |
| Less than $5,000 | 237 (8.0%) | 109 (5.5%) |
| $5,000 to $9,999 | 69 (2.3%) | 95 (4.8%) |
| $10,000 to $14,999 | 124 (4.2%) | 67 (3.4%) |
| $15,000 to $19,999 | 62 (2.1%) | 140 (7.0%) |
| $20,000 to $24,999 | 75 (2.5%) | 39 (1.9%) |
| $25,000 to $34,999 | 85 (2.9%) | 242 (12.1%) |
| $35,000 to $49,999 | 273 (9.2%) | 422 (21.1%) |
| $50,000 to $74,999 | 421 (14.2%) | 329 (16.5%) |
| $75,000 to $99,999 | 631 (21.3%) | 199 (10.0%) |
| $100,000 to $149,999 | 624 (21.0%) | 239 (12.0%) |
| $150,000 or more | 367 (12.4%) | 117 (5.9%) |
| Total | 2,968 (100.0%) | 1,998 (100.0%) |
Monthly Housing Cost Tiers in Claiborne
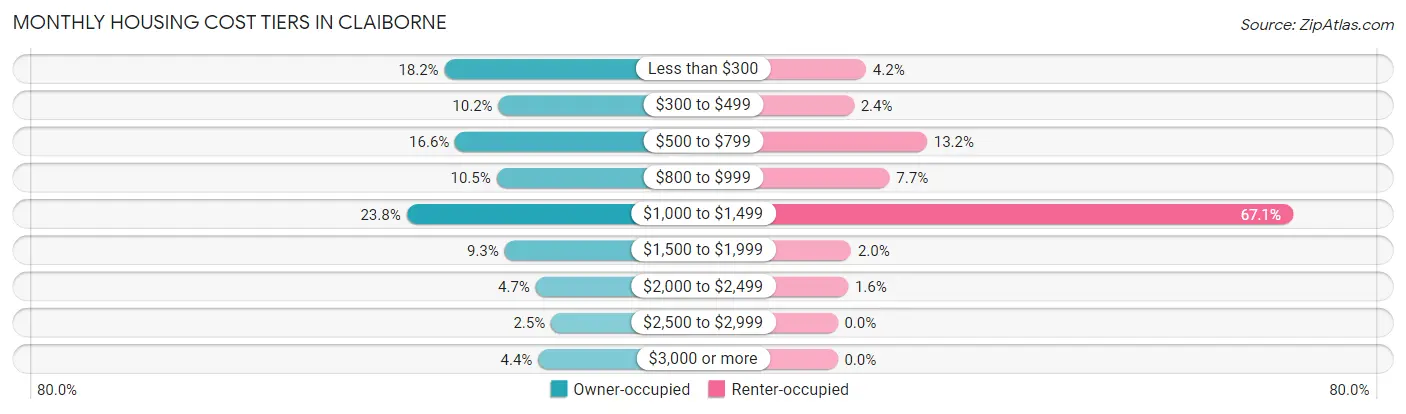
| Monthly Cost | Owner-occupied | Renter-occupied |
| Less than $300 | 539 (18.2%) | 84 (4.2%) |
| $300 to $499 | 303 (10.2%) | 48 (2.4%) |
| $500 to $799 | 492 (16.6%) | 263 (13.2%) |
| $800 to $999 | 311 (10.5%) | 153 (7.7%) |
| $1,000 to $1,499 | 705 (23.7%) | 1,340 (67.1%) |
| $1,500 to $1,999 | 276 (9.3%) | 40 (2.0%) |
| $2,000 to $2,499 | 140 (4.7%) | 31 (1.5%) |
| $2,500 to $2,999 | 73 (2.5%) | 0 (0.0%) |
| $3,000 or more | 129 (4.3%) | 0 (0.0%) |
| Total | 2,968 (100.0%) | 1,998 (100.0%) |
Physical Housing Characteristics in Claiborne
Housing Structures in Claiborne
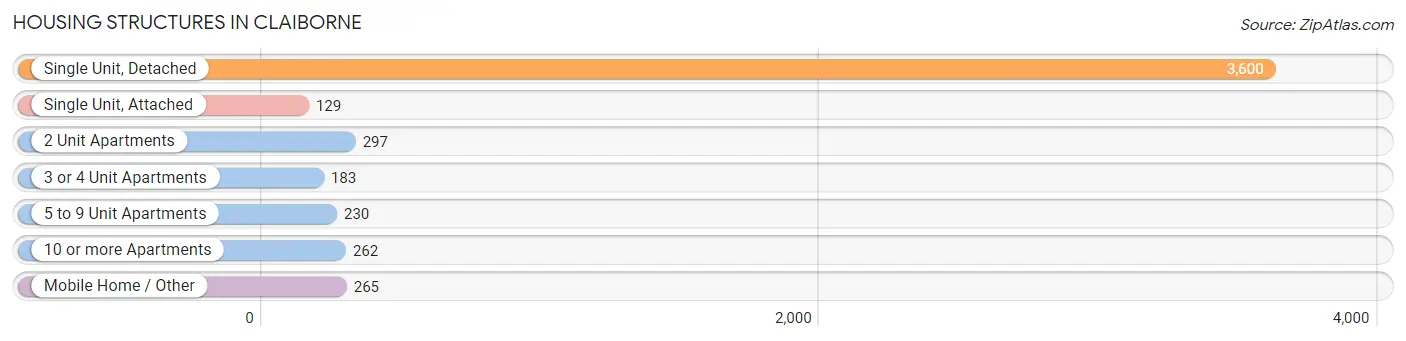
| Structure Type | # Housing Units | % Housing Units |
| Single Unit, Detached | 3,600 | 72.5% |
| Single Unit, Attached | 129 | 2.6% |
| 2 Unit Apartments | 297 | 6.0% |
| 3 or 4 Unit Apartments | 183 | 3.7% |
| 5 to 9 Unit Apartments | 230 | 4.6% |
| 10 or more Apartments | 262 | 5.3% |
| Mobile Home / Other | 265 | 5.3% |
| Total | 4,966 | 100.0% |
Housing Structures by Occupancy in Claiborne
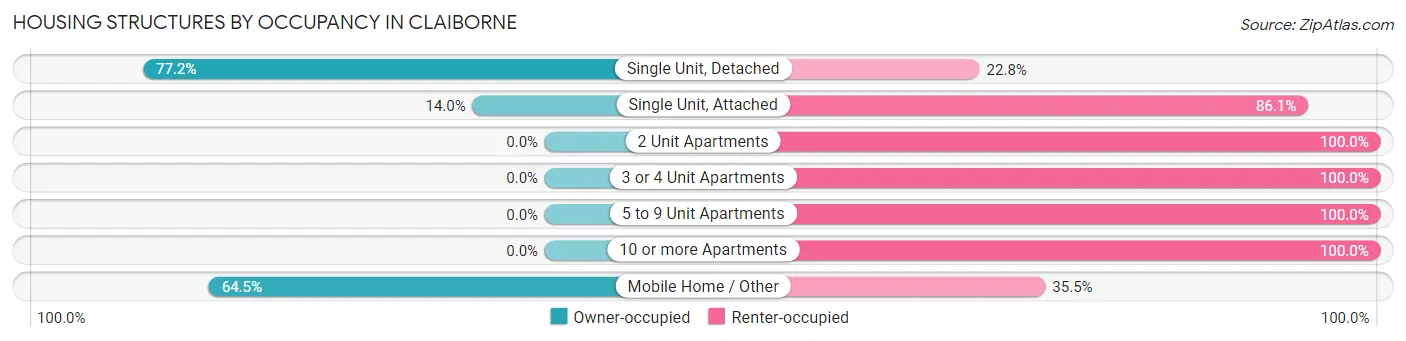
| Structure Type | Owner-occupied | Renter-occupied |
| Single Unit, Detached | 2,779 (77.2%) | 821 (22.8%) |
| Single Unit, Attached | 18 (14.0%) | 111 (86.1%) |
| 2 Unit Apartments | 0 (0.0%) | 297 (100.0%) |
| 3 or 4 Unit Apartments | 0 (0.0%) | 183 (100.0%) |
| 5 to 9 Unit Apartments | 0 (0.0%) | 230 (100.0%) |
| 10 or more Apartments | 0 (0.0%) | 262 (100.0%) |
| Mobile Home / Other | 171 (64.5%) | 94 (35.5%) |
| Total | 2,968 (59.8%) | 1,998 (40.2%) |
Housing Structures by Number of Rooms in Claiborne
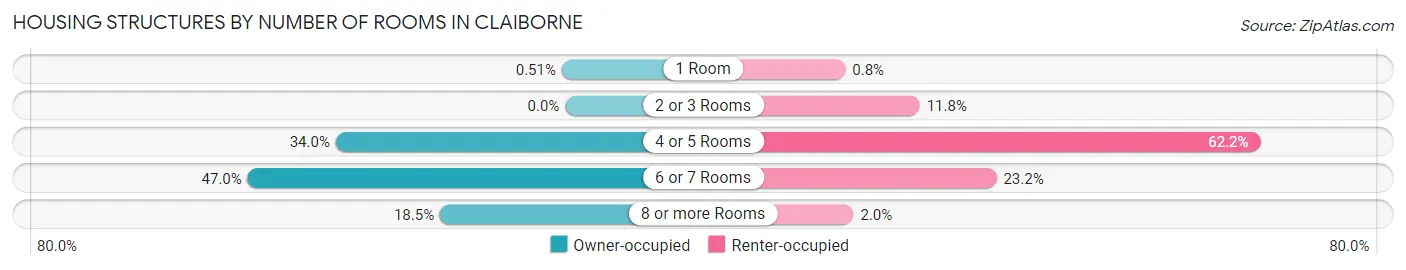
| Number of Rooms | Owner-occupied | Renter-occupied |
| 1 Room | 15 (0.5%) | 16 (0.8%) |
| 2 or 3 Rooms | 0 (0.0%) | 236 (11.8%) |
| 4 or 5 Rooms | 1,008 (34.0%) | 1,243 (62.2%) |
| 6 or 7 Rooms | 1,395 (47.0%) | 463 (23.2%) |
| 8 or more Rooms | 550 (18.5%) | 40 (2.0%) |
| Total | 2,968 (100.0%) | 1,998 (100.0%) |
Housing Structure by Heating Type in Claiborne
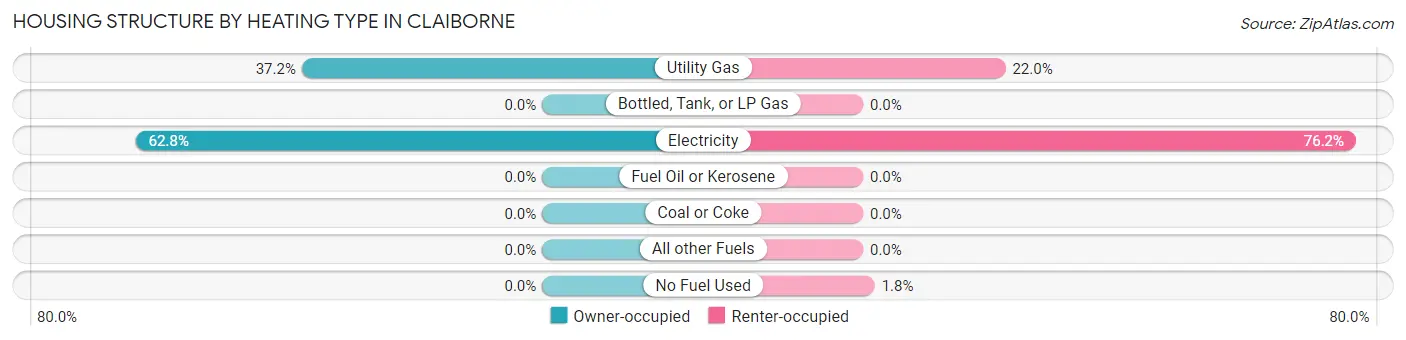
| Heating Type | Owner-occupied | Renter-occupied |
| Utility Gas | 1,103 (37.2%) | 440 (22.0%) |
| Bottled, Tank, or LP Gas | 0 (0.0%) | 0 (0.0%) |
| Electricity | 1,865 (62.8%) | 1,522 (76.2%) |
| Fuel Oil or Kerosene | 0 (0.0%) | 0 (0.0%) |
| Coal or Coke | 0 (0.0%) | 0 (0.0%) |
| All other Fuels | 0 (0.0%) | 0 (0.0%) |
| No Fuel Used | 0 (0.0%) | 36 (1.8%) |
| Total | 2,968 (100.0%) | 1,998 (100.0%) |
Household Vehicle Usage in Claiborne
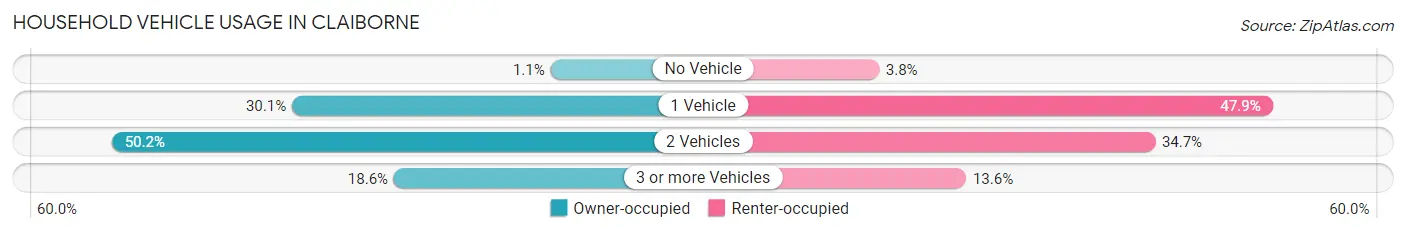
| Vehicles per Household | Owner-occupied | Renter-occupied |
| No Vehicle | 32 (1.1%) | 76 (3.8%) |
| 1 Vehicle | 892 (30.0%) | 957 (47.9%) |
| 2 Vehicles | 1,491 (50.2%) | 694 (34.7%) |
| 3 or more Vehicles | 553 (18.6%) | 271 (13.6%) |
| Total | 2,968 (100.0%) | 1,998 (100.0%) |
Real Estate & Mortgages in Claiborne
Real Estate and Mortgage Overview in Claiborne
| Characteristic | Without Mortgage | With Mortgage |
| Housing Units | 1,225 | 1,743 |
| Median Property Value | $186,900 | $196,200 |
| Median Household Income | $71,058 | $265 |
| Monthly Housing Costs | $387 | $117 |
| Real Estate Taxes | $596 | $96 |
Property Value by Mortgage Status in Claiborne
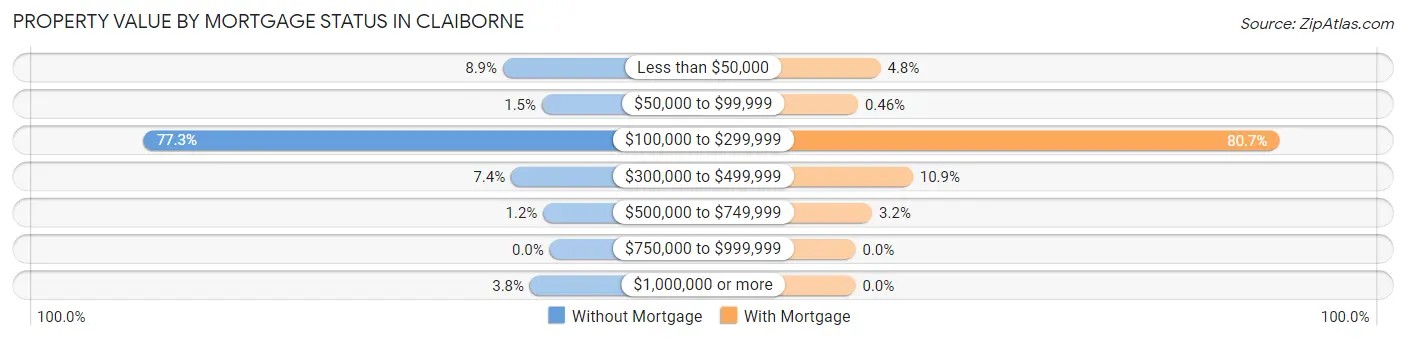
| Property Value | Without Mortgage | With Mortgage |
| Less than $50,000 | 109 (8.9%) | 83 (4.8%) |
| $50,000 to $99,999 | 18 (1.5%) | 8 (0.5%) |
| $100,000 to $299,999 | 947 (77.3%) | 1,407 (80.7%) |
| $300,000 to $499,999 | 90 (7.3%) | 190 (10.9%) |
| $500,000 to $749,999 | 15 (1.2%) | 55 (3.2%) |
| $750,000 to $999,999 | 0 (0.0%) | 0 (0.0%) |
| $1,000,000 or more | 46 (3.8%) | 0 (0.0%) |
| Total | 1,225 (100.0%) | 1,743 (100.0%) |
Household Income by Mortgage Status in Claiborne
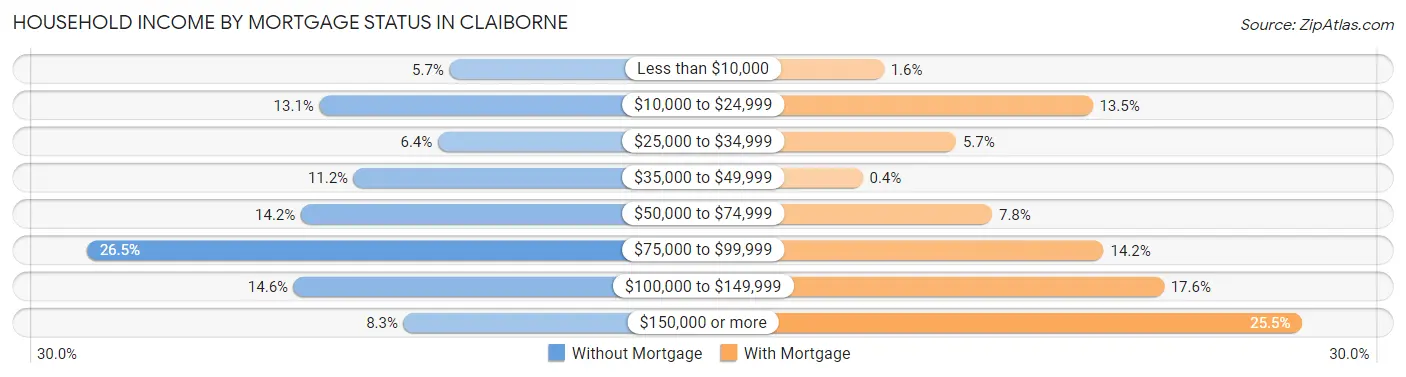
| Household Income | Without Mortgage | With Mortgage |
| Less than $10,000 | 70 (5.7%) | 28 (1.6%) |
| $10,000 to $24,999 | 161 (13.1%) | 236 (13.5%) |
| $25,000 to $34,999 | 78 (6.4%) | 100 (5.7%) |
| $35,000 to $49,999 | 137 (11.2%) | 7 (0.4%) |
| $50,000 to $74,999 | 174 (14.2%) | 136 (7.8%) |
| $75,000 to $99,999 | 324 (26.5%) | 247 (14.2%) |
| $100,000 to $149,999 | 179 (14.6%) | 307 (17.6%) |
| $150,000 or more | 102 (8.3%) | 445 (25.5%) |
| Total | 1,225 (100.0%) | 1,743 (100.0%) |
Property Value to Household Income Ratio in Claiborne
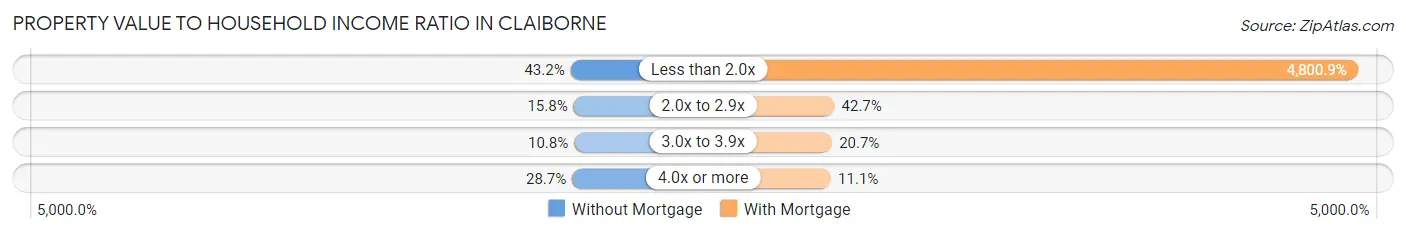
| Value-to-Income Ratio | Without Mortgage | With Mortgage |
| Less than 2.0x | 529 (43.2%) | 83,679 (4,800.9%) |
| 2.0x to 2.9x | 193 (15.8%) | 744 (42.7%) |
| 3.0x to 3.9x | 132 (10.8%) | 361 (20.7%) |
| 4.0x or more | 352 (28.7%) | 194 (11.1%) |
| Total | 1,225 (100.0%) | 1,743 (100.0%) |
Real Estate Taxes by Mortgage Status in Claiborne
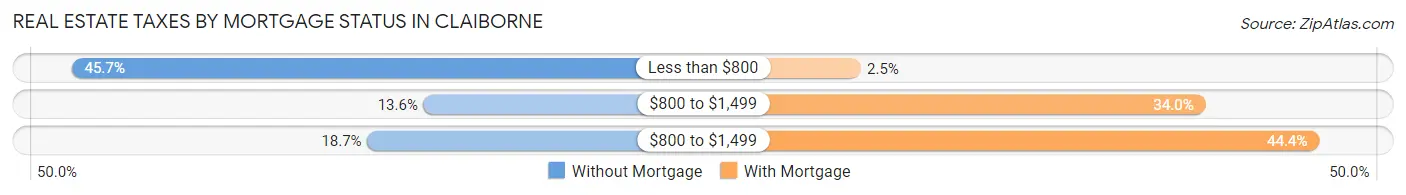
| Property Taxes | Without Mortgage | With Mortgage |
| Less than $800 | 560 (45.7%) | 43 (2.5%) |
| $800 to $1,499 | 166 (13.6%) | 593 (34.0%) |
| $800 to $1,499 | 229 (18.7%) | 774 (44.4%) |
| Total | 1,225 (100.0%) | 1,743 (100.0%) |
Health & Disability in Claiborne
Health Insurance Coverage by Age in Claiborne
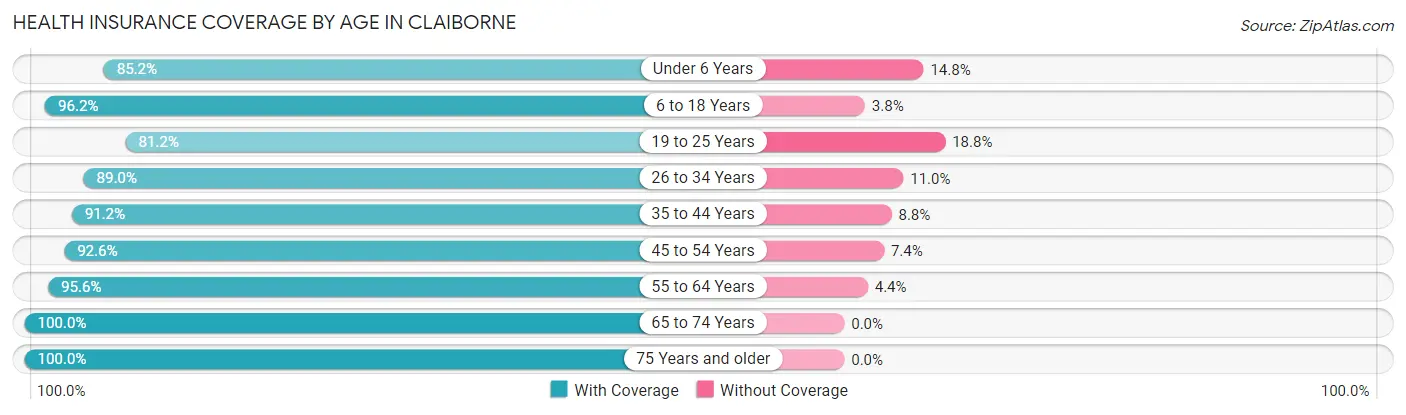
| Age Bracket | With Coverage | Without Coverage |
| Under 6 Years | 912 (85.2%) | 158 (14.8%) |
| 6 to 18 Years | 1,528 (96.2%) | 61 (3.8%) |
| 19 to 25 Years | 1,087 (81.2%) | 252 (18.8%) |
| 26 to 34 Years | 1,835 (89.0%) | 227 (11.0%) |
| 35 to 44 Years | 1,304 (91.2%) | 126 (8.8%) |
| 45 to 54 Years | 1,226 (92.6%) | 98 (7.4%) |
| 55 to 64 Years | 1,158 (95.6%) | 53 (4.4%) |
| 65 to 74 Years | 1,320 (100.0%) | 0 (0.0%) |
| 75 Years and older | 814 (100.0%) | 0 (0.0%) |
| Total | 11,184 (92.0%) | 975 (8.0%) |
Health Insurance Coverage by Citizenship Status in Claiborne
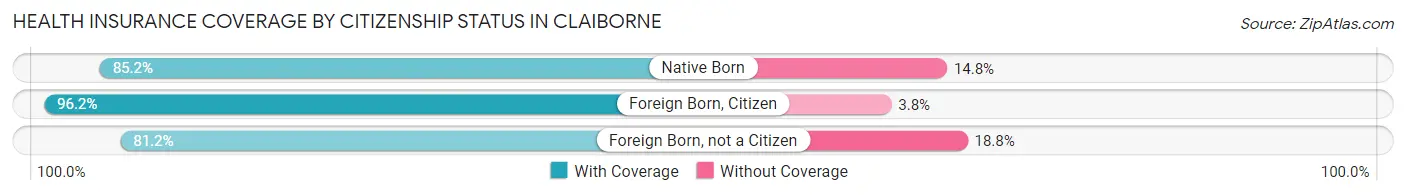
| Citizenship Status | With Coverage | Without Coverage |
| Native Born | 912 (85.2%) | 158 (14.8%) |
| Foreign Born, Citizen | 1,528 (96.2%) | 61 (3.8%) |
| Foreign Born, not a Citizen | 1,087 (81.2%) | 252 (18.8%) |
Health Insurance Coverage by Household Income in Claiborne
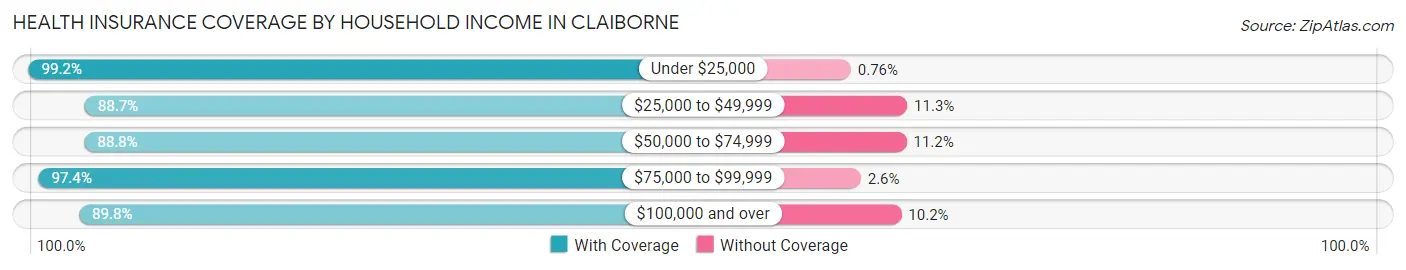
| Household Income | With Coverage | Without Coverage |
| Under $25,000 | 1,562 (99.2%) | 12 (0.8%) |
| $25,000 to $49,999 | 1,984 (88.7%) | 253 (11.3%) |
| $50,000 to $74,999 | 1,704 (88.8%) | 215 (11.2%) |
| $75,000 to $99,999 | 2,046 (97.4%) | 55 (2.6%) |
| $100,000 and over | 3,862 (89.8%) | 440 (10.2%) |
Public vs Private Health Insurance Coverage by Age in Claiborne
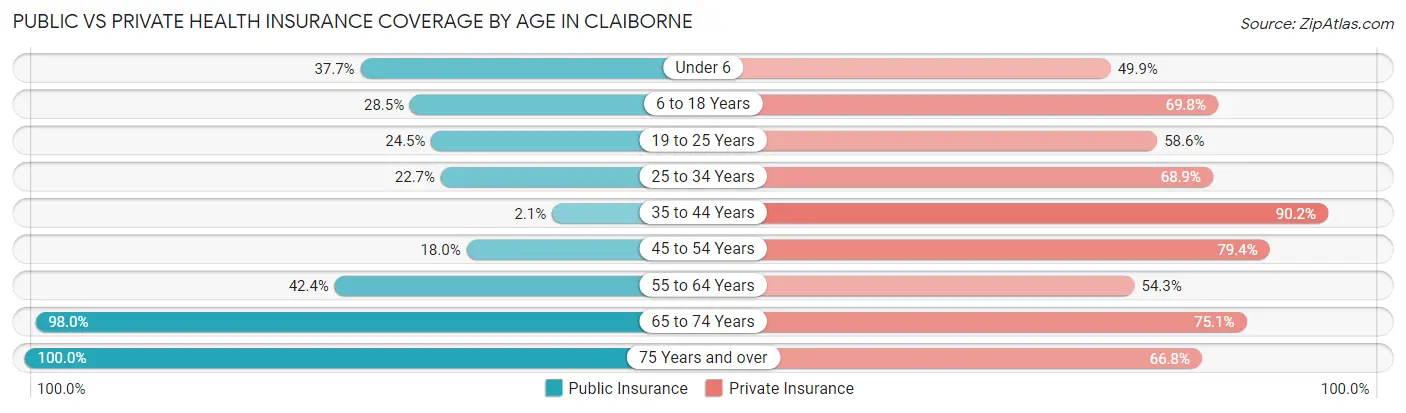
| Age Bracket | Public Insurance | Private Insurance |
| Under 6 | 403 (37.7%) | 534 (49.9%) |
| 6 to 18 Years | 452 (28.4%) | 1,109 (69.8%) |
| 19 to 25 Years | 328 (24.5%) | 784 (58.6%) |
| 25 to 34 Years | 469 (22.7%) | 1,420 (68.9%) |
| 35 to 44 Years | 30 (2.1%) | 1,290 (90.2%) |
| 45 to 54 Years | 238 (18.0%) | 1,051 (79.4%) |
| 55 to 64 Years | 514 (42.4%) | 658 (54.3%) |
| 65 to 74 Years | 1,294 (98.0%) | 991 (75.1%) |
| 75 Years and over | 814 (100.0%) | 544 (66.8%) |
| Total | 4,542 (37.4%) | 8,381 (68.9%) |
Disability Status by Sex by Age in Claiborne
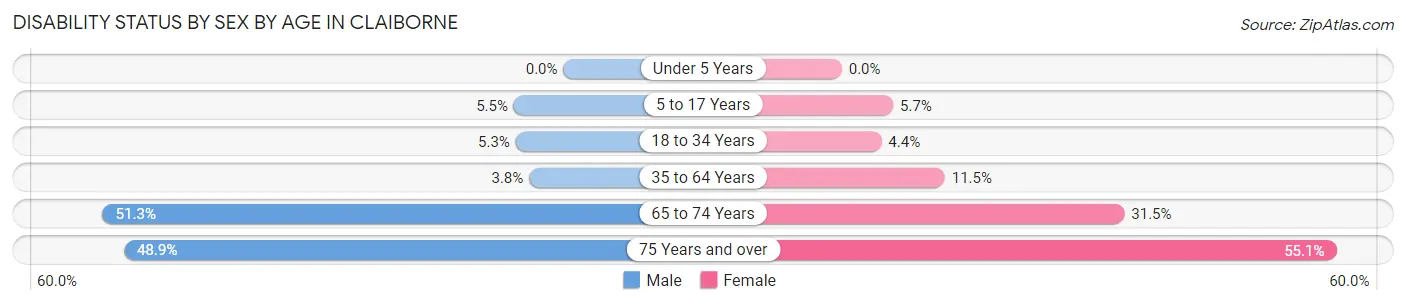
| Age Bracket | Male | Female |
| Under 5 Years | 0 (0.0%) | 0 (0.0%) |
| 5 to 17 Years | 40 (5.5%) | 47 (5.7%) |
| 18 to 34 Years | 89 (5.3%) | 85 (4.4%) |
| 35 to 64 Years | 71 (3.8%) | 241 (11.5%) |
| 65 to 74 Years | 255 (51.3%) | 259 (31.5%) |
| 75 Years and over | 137 (48.9%) | 294 (55.1%) |
Disability Class by Sex by Age in Claiborne
Disability Class: Hearing Difficulty
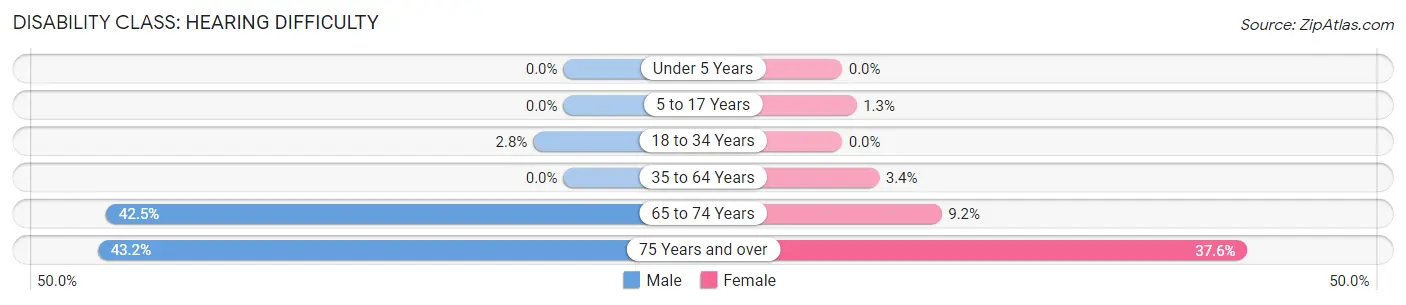
| Age Bracket | Male | Female |
| Under 5 Years | 0 (0.0%) | 0 (0.0%) |
| 5 to 17 Years | 0 (0.0%) | 11 (1.3%) |
| 18 to 34 Years | 47 (2.8%) | 0 (0.0%) |
| 35 to 64 Years | 0 (0.0%) | 72 (3.4%) |
| 65 to 74 Years | 211 (42.4%) | 76 (9.2%) |
| 75 Years and over | 121 (43.2%) | 201 (37.6%) |
Disability Class: Vision Difficulty
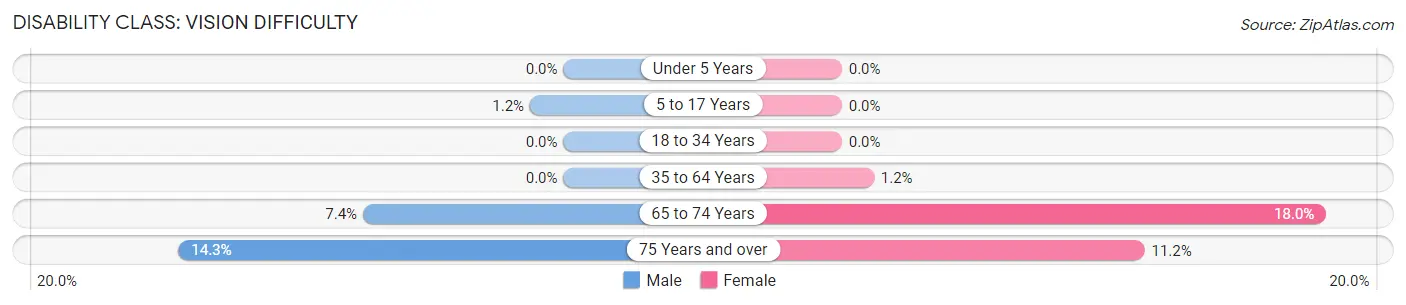
| Age Bracket | Male | Female |
| Under 5 Years | 0 (0.0%) | 0 (0.0%) |
| 5 to 17 Years | 9 (1.2%) | 0 (0.0%) |
| 18 to 34 Years | 0 (0.0%) | 0 (0.0%) |
| 35 to 64 Years | 0 (0.0%) | 25 (1.2%) |
| 65 to 74 Years | 37 (7.4%) | 148 (18.0%) |
| 75 Years and over | 40 (14.3%) | 60 (11.2%) |
Disability Class: Cognitive Difficulty
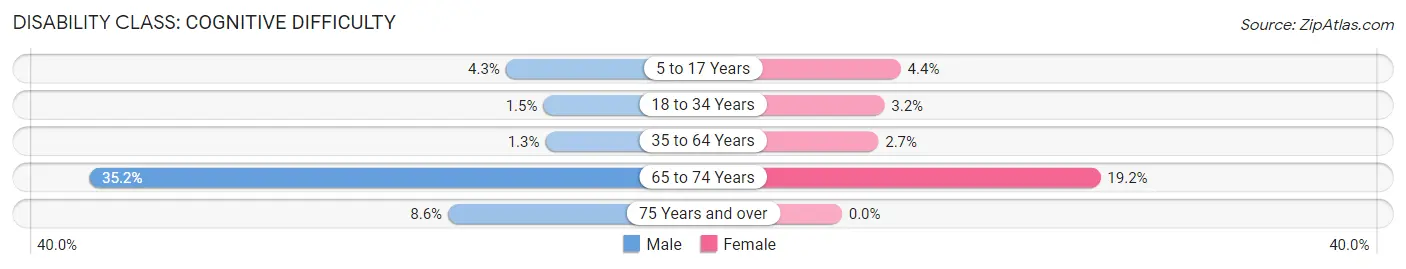
| Age Bracket | Male | Female |
| 5 to 17 Years | 31 (4.3%) | 36 (4.4%) |
| 18 to 34 Years | 25 (1.5%) | 61 (3.2%) |
| 35 to 64 Years | 25 (1.3%) | 57 (2.7%) |
| 65 to 74 Years | 175 (35.2%) | 158 (19.2%) |
| 75 Years and over | 24 (8.6%) | 0 (0.0%) |
Disability Class: Ambulatory Difficulty
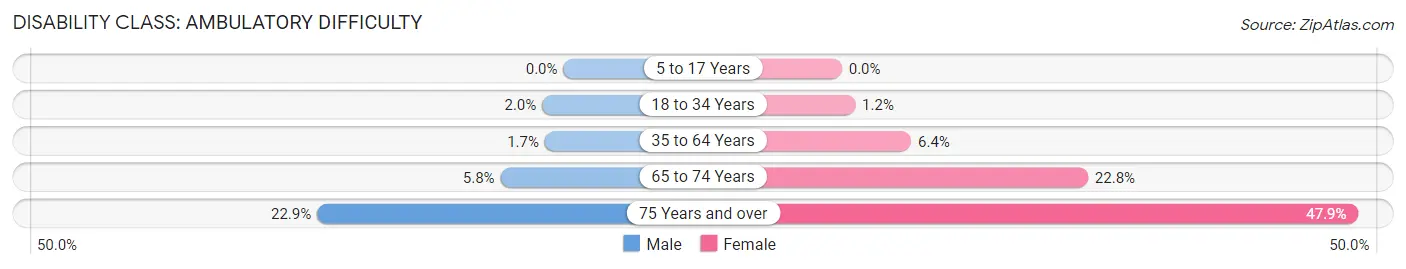
| Age Bracket | Male | Female |
| 5 to 17 Years | 0 (0.0%) | 0 (0.0%) |
| 18 to 34 Years | 33 (2.0%) | 24 (1.2%) |
| 35 to 64 Years | 32 (1.7%) | 135 (6.4%) |
| 65 to 74 Years | 29 (5.8%) | 188 (22.8%) |
| 75 Years and over | 64 (22.9%) | 256 (47.9%) |
Disability Class: Self-Care Difficulty
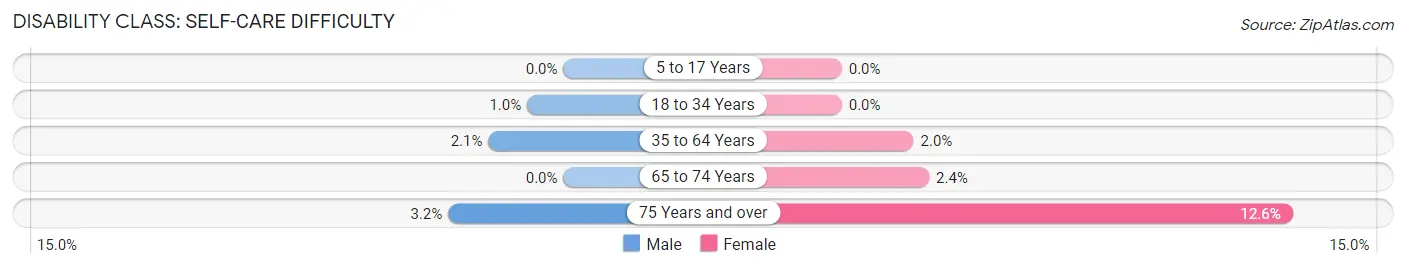
| Age Bracket | Male | Female |
| 5 to 17 Years | 0 (0.0%) | 0 (0.0%) |
| 18 to 34 Years | 17 (1.0%) | 0 (0.0%) |
| 35 to 64 Years | 39 (2.1%) | 42 (2.0%) |
| 65 to 74 Years | 0 (0.0%) | 20 (2.4%) |
| 75 Years and over | 9 (3.2%) | 67 (12.6%) |
Technology Access in Claiborne
Computing Device Access in Claiborne
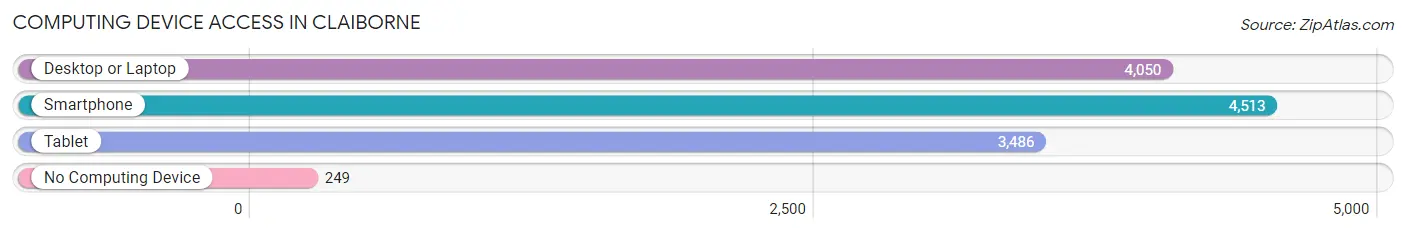
| Device Type | # Households | % Households |
| Desktop or Laptop | 4,050 | 81.6% |
| Smartphone | 4,513 | 90.9% |
| Tablet | 3,486 | 70.2% |
| No Computing Device | 249 | 5.0% |
| Total | 4,966 | 100.0% |
Internet Access in Claiborne
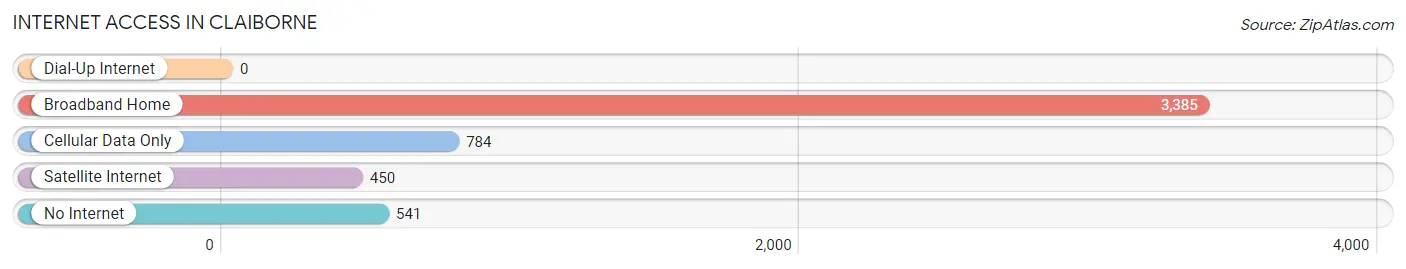
| Internet Type | # Households | % Households |
| Dial-Up Internet | 0 | 0.0% |
| Broadband Home | 3,385 | 68.2% |
| Cellular Data Only | 784 | 15.8% |
| Satellite Internet | 450 | 9.1% |
| No Internet | 541 | 10.9% |
| Total | 4,966 | 100.0% |
Claiborne Summary
Claiborne, Louisiana is a small town located in the northeastern corner of the state, near the Mississippi border. It is part of the larger Claiborne Parish, which is home to a population of over 17,000 people. The town of Claiborne itself has a population of just over 1,000 people. The town is known for its rich history, diverse geography, and vibrant economy.
History
Claiborne, Louisiana was founded in 1812 by a group of settlers from the nearby town of Homer. The town was named after William C.C. Claiborne, the first governor of the Louisiana Territory. The town quickly grew and became an important trading center for the surrounding area. In 1821, the town was incorporated and the first mayor was elected.
In the late 1800s, Claiborne was a bustling center of commerce and industry. The town was home to several cotton mills, sawmills, and other businesses. The town also had a thriving agricultural industry, with many farmers growing cotton, corn, and other crops.
In the early 1900s, the town began to decline as the cotton industry moved away from the area. The Great Depression also had a devastating effect on the town, and many businesses closed. However, the town was able to survive and eventually began to recover.
Geography
Claiborne is located in the northeastern corner of Louisiana, near the Mississippi border. The town is situated on the banks of the Ouachita River, which provides a natural border between Louisiana and Arkansas. The town is surrounded by rolling hills and forests, and is home to several small lakes and streams.
The town is located in a humid subtropical climate, with hot summers and mild winters. The average annual temperature is around 70 degrees Fahrenheit, and the average annual rainfall is around 50 inches.
Economy
The economy of Claiborne is largely based on agriculture and tourism. The town is home to several farms, which produce cotton, corn, soybeans, and other crops. The town is also home to several small businesses, including restaurants, shops, and other services.
The town is also a popular tourist destination, with many visitors coming to enjoy the town’s natural beauty and rich history. The town is home to several historic sites, including the Claiborne Parish Courthouse and the Claiborne Parish Museum.
Demographics
As of the 2010 census, the population of Claiborne was 1,039. The town is predominantly white, with a small African American population. The median household income is around $30,000, and the median home value is around $90,000. The town has a low unemployment rate, and the poverty rate is below the national average.
Common Questions
What is Per Capita Income in Claiborne?
Per Capita income in Claiborne is $33,513.
What is the Median Family Income in Claiborne?
Median Family Income in Claiborne is $79,620.
What is the Median Household income in Claiborne?
Median Household Income in Claiborne is $63,056.
What is Income or Wage Gap in Claiborne?
Income or Wage Gap in Claiborne is 20.2%.
Women in Claiborne earn 79.8 cents for every dollar earned by a man.
What is Inequality or Gini Index in Claiborne?
Inequality or Gini Index in Claiborne is 0.46.
What is the Total Population of Claiborne?
Total Population of Claiborne is 12,159.
What is the Total Male Population of Claiborne?
Total Male Population of Claiborne is 5,566.
What is the Total Female Population of Claiborne?
Total Female Population of Claiborne is 6,593.
What is the Ratio of Males per 100 Females in Claiborne?
There are 84.42 Males per 100 Females in Claiborne.
What is the Ratio of Females per 100 Males in Claiborne?
There are 118.45 Females per 100 Males in Claiborne.
What is the Median Population Age in Claiborne?
Median Population Age in Claiborne is 35.1 Years.
What is the Average Family Size in Claiborne
Average Family Size in Claiborne is 2.8 People.
What is the Average Household Size in Claiborne
Average Household Size in Claiborne is 2.4 People.
How Large is the Labor Force in Claiborne?
There are 6,198 People in the Labor Forcein in Claiborne.
What is the Percentage of People in the Labor Force in Claiborne?
62.2% of People are in the Labor Force in Claiborne.
What is the Unemployment Rate in Claiborne?
Unemployment Rate in Claiborne is 0.8%.