Vienna, LA Map & Demographics
Vienna Map
Vienna Overview
$42,882
PER CAPITA INCOME
$113,194
AVG FAMILY INCOME
$73,636
AVG HOUSEHOLD INCOME
53.4%
WAGE / INCOME GAP [ % ]
46.6¢/ $1
WAGE / INCOME GAP [ $ ]
0.48
INEQUALITY / GINI INDEX
587
TOTAL POPULATION
342
MALE POPULATION
245
FEMALE POPULATION
139.59
MALES / 100 FEMALES
71.64
FEMALES / 100 MALES
43.1
MEDIAN AGE
3.6
AVG FAMILY SIZE
2.8
AVG HOUSEHOLD SIZE
304
LABOR FORCE [ PEOPLE ]
66.2%
PERCENT IN LABOR FORCE
1.0%
UNEMPLOYMENT RATE
Income in Vienna
Income Overview in Vienna
Per Capita Income in Vienna is $42,882, while median incomes of families and households are $113,194 and $73,636 respectively.
| Characteristic | Number | Measure |
| Per Capita Income | 587 | $42,882 |
| Median Family Income | 135 | $113,194 |
| Mean Family Income | 135 | $127,947 |
| Median Household Income | 208 | $73,636 |
| Mean Household Income | 208 | $98,829 |
| Income Deficit | 135 | $0 |
| Wage / Income Gap (%) | 587 | 53.38% |
| Wage / Income Gap ($) | 587 | 46.62¢ per $1 |
| Gini / Inequality Index | 587 | 0.48 |
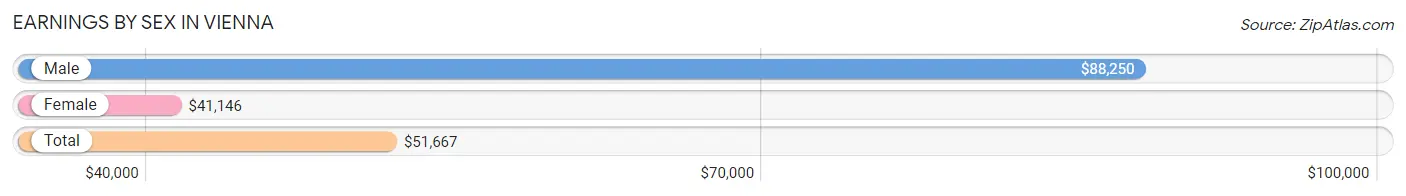
Earnings by Sex in Vienna
Average Earnings in Vienna are $51,667, $88,250 for men and $41,146 for women, a difference of 53.4%.
| Sex | Number | Average Earnings |
| Male | 189 (60.2%) | $88,250 |
| Female | 125 (39.8%) | $41,146 |
| Total | 314 (100.0%) | $51,667 |
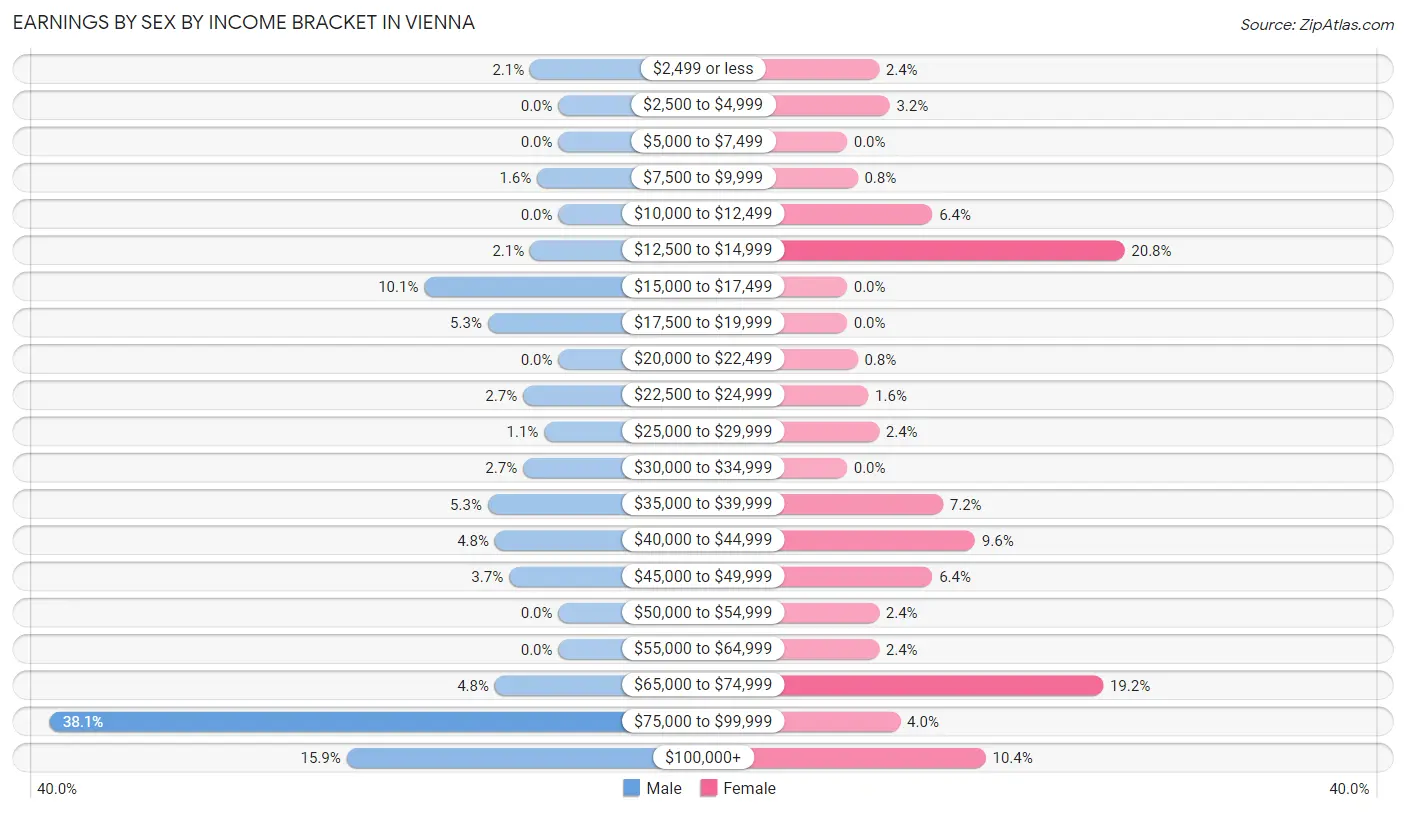
Earnings by Sex by Income Bracket in Vienna
The most common earnings brackets in Vienna are $75,000 to $99,999 for men (72 | 38.1%) and $12,500 to $14,999 for women (26 | 20.8%).
| Income | Male | Female |
| $2,499 or less | 4 (2.1%) | 3 (2.4%) |
| $2,500 to $4,999 | 0 (0.0%) | 4 (3.2%) |
| $5,000 to $7,499 | 0 (0.0%) | 0 (0.0%) |
| $7,500 to $9,999 | 3 (1.6%) | 1 (0.8%) |
| $10,000 to $12,499 | 0 (0.0%) | 8 (6.4%) |
| $12,500 to $14,999 | 4 (2.1%) | 26 (20.8%) |
| $15,000 to $17,499 | 19 (10.1%) | 0 (0.0%) |
| $17,500 to $19,999 | 10 (5.3%) | 0 (0.0%) |
| $20,000 to $22,499 | 0 (0.0%) | 1 (0.8%) |
| $22,500 to $24,999 | 5 (2.6%) | 2 (1.6%) |
| $25,000 to $29,999 | 2 (1.1%) | 3 (2.4%) |
| $30,000 to $34,999 | 5 (2.6%) | 0 (0.0%) |
| $35,000 to $39,999 | 10 (5.3%) | 9 (7.2%) |
| $40,000 to $44,999 | 9 (4.8%) | 12 (9.6%) |
| $45,000 to $49,999 | 7 (3.7%) | 8 (6.4%) |
| $50,000 to $54,999 | 0 (0.0%) | 3 (2.4%) |
| $55,000 to $64,999 | 0 (0.0%) | 3 (2.4%) |
| $65,000 to $74,999 | 9 (4.8%) | 24 (19.2%) |
| $75,000 to $99,999 | 72 (38.1%) | 5 (4.0%) |
| $100,000+ | 30 (15.9%) | 13 (10.4%) |
| Total | 189 (100.0%) | 125 (100.0%) |
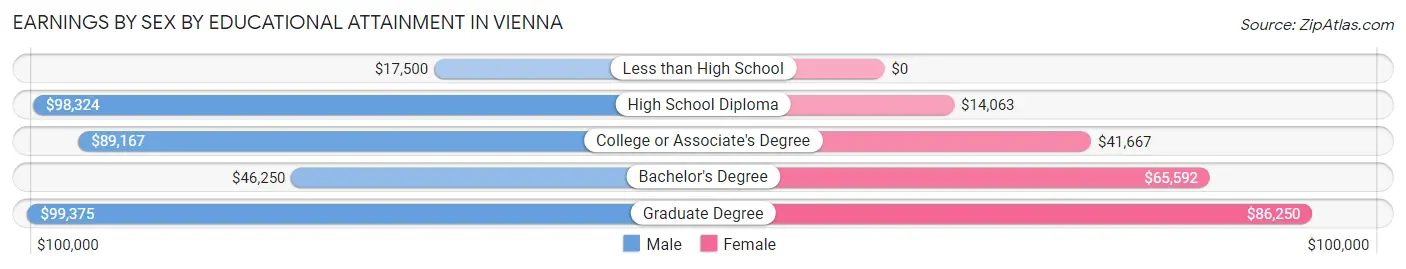
Earnings by Sex by Educational Attainment in Vienna
Average earnings in Vienna are $89,750 for men and $45,536 for women, a difference of 49.3%. Men with an educational attainment of graduate degree enjoy the highest average annual earnings of $99,375, while those with less than high school education earn the least with $17,500. Women with an educational attainment of graduate degree earn the most with the average annual earnings of $86,250, while those with high school diploma education have the smallest earnings of $14,063.
| Educational Attainment | Male Income | Female Income |
| Less than High School | $17,500 | $0 |
| High School Diploma | $98,324 | $14,063 |
| College or Associate's Degree | $89,167 | $41,667 |
| Bachelor's Degree | $46,250 | $65,592 |
| Graduate Degree | $99,375 | $86,250 |
| Total | $89,750 | $45,536 |
Family Income in Vienna
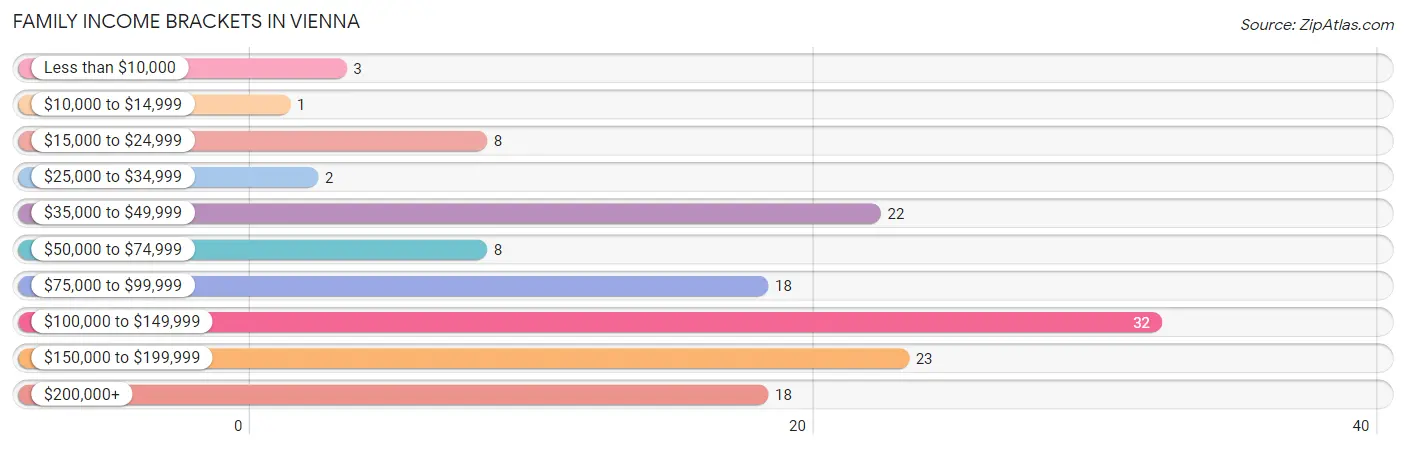
Family Income Brackets in Vienna
According to the Vienna family income data, there are 32 families falling into the $100,000 to $149,999 income range, which is the most common income bracket and makes up 23.7% of all families. Conversely, the $10,000 to $14,999 income bracket is the least frequent group with only 1 families (0.7%) belonging to this category.
| Income Bracket | # Families | % Families |
| Less than $10,000 | 3 | 2.2% |
| $10,000 to $14,999 | 1 | 0.7% |
| $15,000 to $24,999 | 8 | 5.9% |
| $25,000 to $34,999 | 2 | 1.5% |
| $35,000 to $49,999 | 22 | 16.3% |
| $50,000 to $74,999 | 8 | 5.9% |
| $75,000 to $99,999 | 18 | 13.3% |
| $100,000 to $149,999 | 32 | 23.7% |
| $150,000 to $199,999 | 23 | 17.0% |
| $200,000+ | 18 | 13.3% |
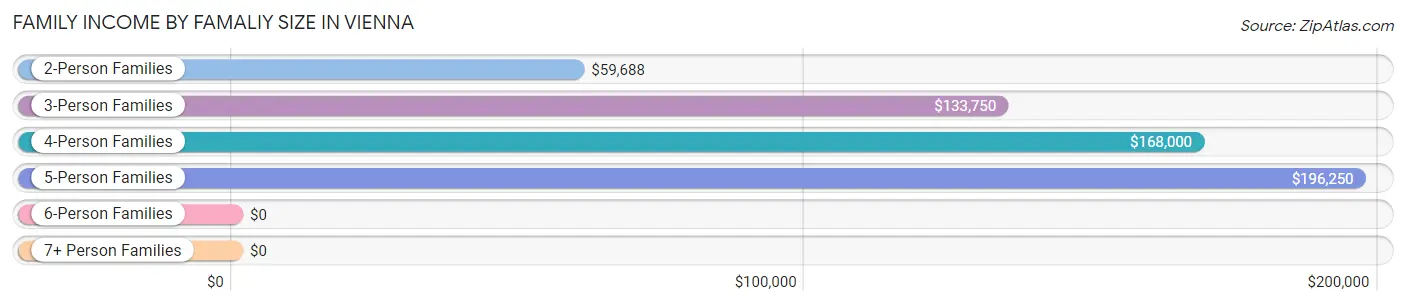
Family Income by Famaliy Size in Vienna
5-person families (4 | 3.0%) account for the highest median family income in Vienna with $196,250 per family, while 3-person families (22 | 16.3%) have the highest median income of $44,583 per family member.
| Income Bracket | # Families | Median Income |
| 2-Person Families | 77 (57.0%) | $59,688 |
| 3-Person Families | 22 (16.3%) | $133,750 |
| 4-Person Families | 26 (19.3%) | $168,000 |
| 5-Person Families | 4 (3.0%) | $196,250 |
| 6-Person Families | 3 (2.2%) | $0 |
| 7+ Person Families | 3 (2.2%) | $0 |
| Total | 135 (100.0%) | $113,194 |
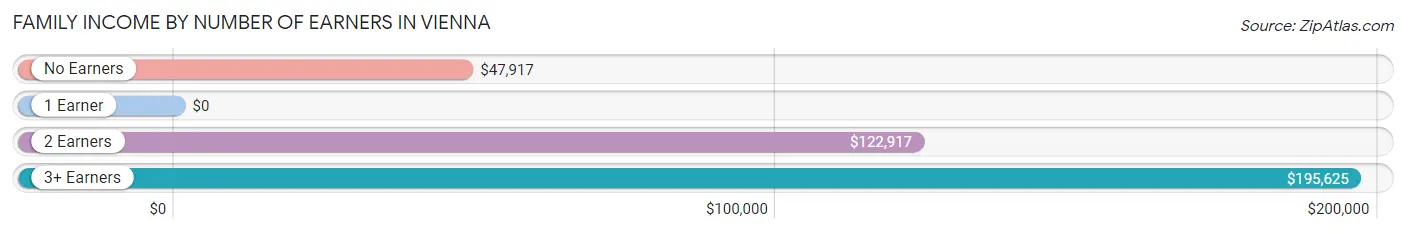
Family Income by Number of Earners in Vienna
| Number of Earners | # Families | Median Income |
| No Earners | 21 (15.6%) | $47,917 |
| 1 Earner | 52 (38.5%) | $0 |
| 2 Earners | 57 (42.2%) | $122,917 |
| 3+ Earners | 5 (3.7%) | $195,625 |
| Total | 135 (100.0%) | $113,194 |
Household Income in Vienna
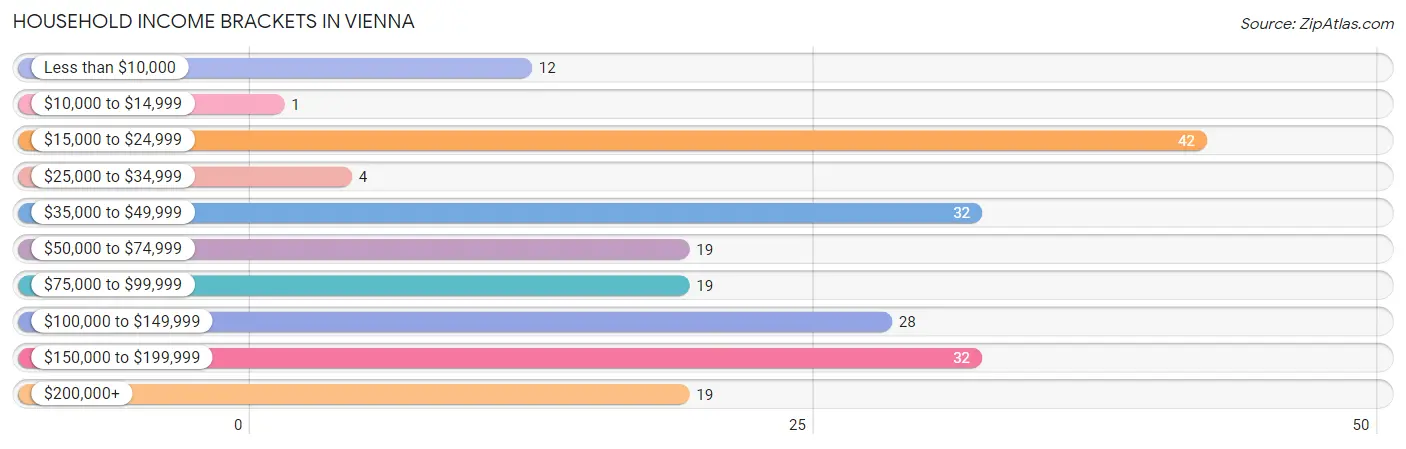
Household Income Brackets in Vienna
With 42 households falling in the category, the $15,000 to $24,999 income range is the most frequent in Vienna, accounting for 20.2% of all households. In contrast, only 1 households (0.5%) fall into the $10,000 to $14,999 income bracket, making it the least populous group.
| Income Bracket | # Households | % Households |
| Less than $10,000 | 12 | 5.8% |
| $10,000 to $14,999 | 1 | 0.5% |
| $15,000 to $24,999 | 42 | 20.2% |
| $25,000 to $34,999 | 4 | 1.9% |
| $35,000 to $49,999 | 32 | 15.4% |
| $50,000 to $74,999 | 19 | 9.1% |
| $75,000 to $99,999 | 19 | 9.1% |
| $100,000 to $149,999 | 28 | 13.5% |
| $150,000 to $199,999 | 32 | 15.4% |
| $200,000+ | 19 | 9.1% |
Household Income by Householder Age in Vienna
The median household income in Vienna is $73,636, with the highest median household income of $150,000 found in the 45 to 64 years age bracket for the primary householder. A total of 58 households (27.9%) fall into this category. Meanwhile, the 15 to 24 years age bracket for the primary householder has the lowest median household income of $0, with 3 households (1.4%) in this group.
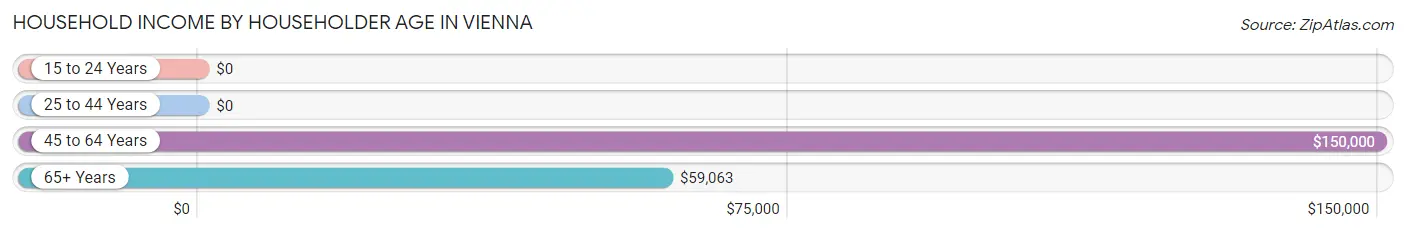
| Income Bracket | # Households | Median Income |
| 15 to 24 Years | 3 (1.4%) | $0 |
| 25 to 44 Years | 70 (33.7%) | $0 |
| 45 to 64 Years | 58 (27.9%) | $150,000 |
| 65+ Years | 77 (37.0%) | $59,063 |
| Total | 208 (100.0%) | $73,636 |
Poverty in Vienna
Income Below Poverty by Sex and Age in Vienna
With 1.5% poverty level for males and 7.0% for females among the residents of Vienna, 18 to 24 year old males and 45 to 54 year old females are the most vulnerable to poverty, with 2 males (33.3%) and 7 females (23.3%) in their respective age groups living below the poverty level.
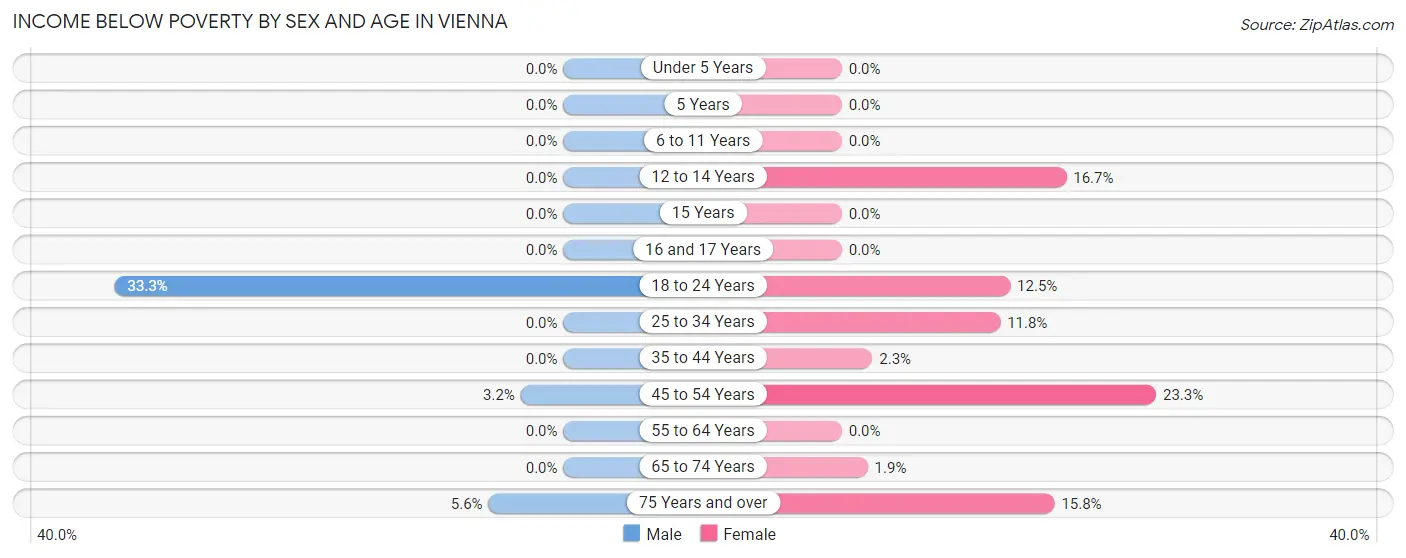
| Age Bracket | Male | Female |
| Under 5 Years | 0 (0.0%) | 0 (0.0%) |
| 5 Years | 0 (0.0%) | 0 (0.0%) |
| 6 to 11 Years | 0 (0.0%) | 0 (0.0%) |
| 12 to 14 Years | 0 (0.0%) | 1 (16.7%) |
| 15 Years | 0 (0.0%) | 0 (0.0%) |
| 16 and 17 Years | 0 (0.0%) | 0 (0.0%) |
| 18 to 24 Years | 2 (33.3%) | 2 (12.5%) |
| 25 to 34 Years | 0 (0.0%) | 2 (11.8%) |
| 35 to 44 Years | 0 (0.0%) | 1 (2.3%) |
| 45 to 54 Years | 2 (3.2%) | 7 (23.3%) |
| 55 to 64 Years | 0 (0.0%) | 0 (0.0%) |
| 65 to 74 Years | 0 (0.0%) | 1 (1.9%) |
| 75 Years and over | 1 (5.6%) | 3 (15.8%) |
| Total | 5 (1.5%) | 17 (7.0%) |
Income Above Poverty by Sex and Age in Vienna
According to the poverty statistics in Vienna, males aged under 5 years and females aged under 5 years are the age groups that are most secure financially, with 100.0% of males and 100.0% of females in these age groups living above the poverty line.
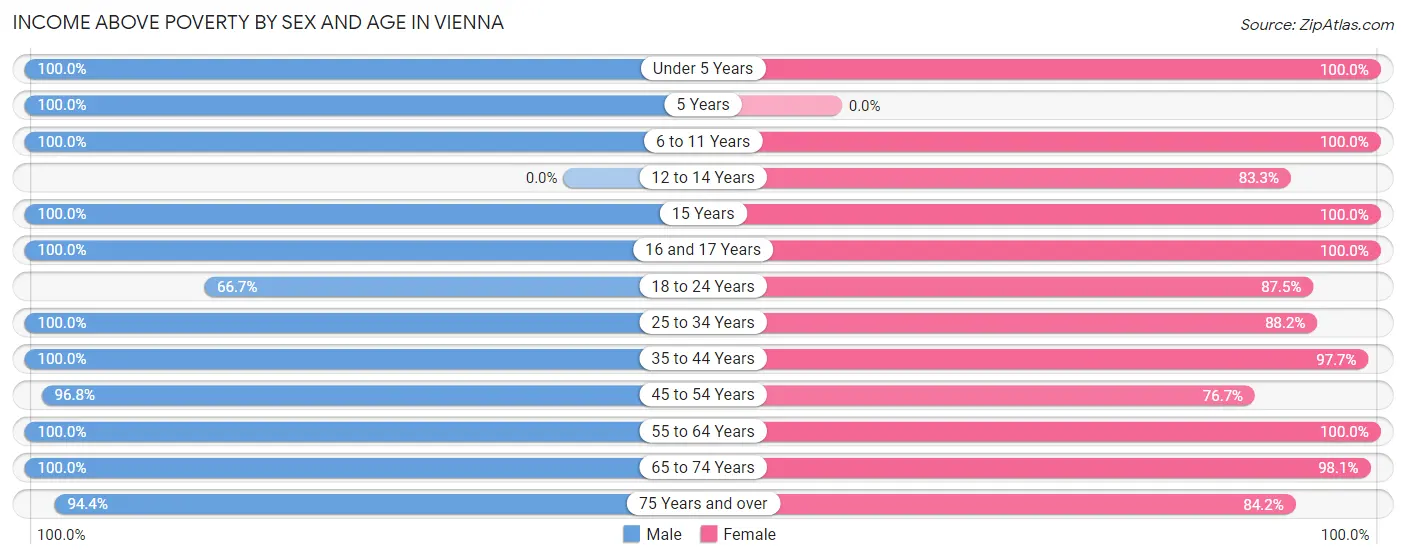
| Age Bracket | Male | Female |
| Under 5 Years | 12 (100.0%) | 3 (100.0%) |
| 5 Years | 3 (100.0%) | 0 (0.0%) |
| 6 to 11 Years | 33 (100.0%) | 23 (100.0%) |
| 12 to 14 Years | 0 (0.0%) | 5 (83.3%) |
| 15 Years | 35 (100.0%) | 4 (100.0%) |
| 16 and 17 Years | 13 (100.0%) | 4 (100.0%) |
| 18 to 24 Years | 4 (66.7%) | 14 (87.5%) |
| 25 to 34 Years | 35 (100.0%) | 15 (88.2%) |
| 35 to 44 Years | 43 (100.0%) | 43 (97.7%) |
| 45 to 54 Years | 61 (96.8%) | 23 (76.7%) |
| 55 to 64 Years | 30 (100.0%) | 24 (100.0%) |
| 65 to 74 Years | 45 (100.0%) | 51 (98.1%) |
| 75 Years and over | 17 (94.4%) | 16 (84.2%) |
| Total | 331 (98.5%) | 225 (93.0%) |
Income Below Poverty Among Married-Couple Families in Vienna
The poverty statistics for married-couple families in Vienna show that 0.8% or 1 of the total 128 families live below the poverty line. Families with no children have the highest poverty rate of 1.2%, comprising of 1 families. On the other hand, families with 1 or 2 children have the lowest poverty rate of 0.0%, which includes 0 families.
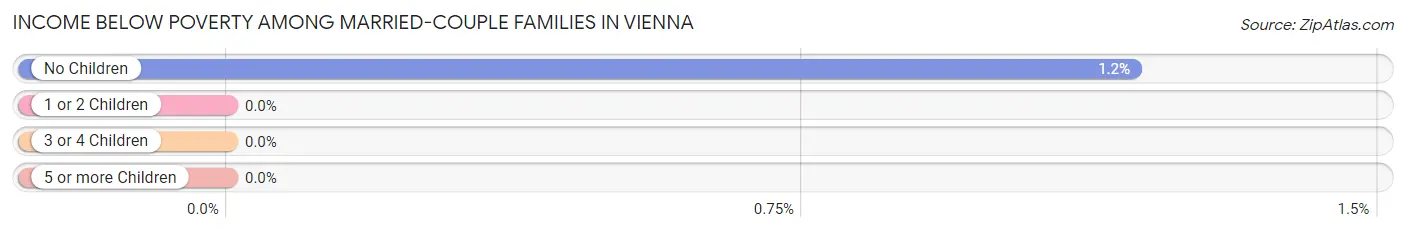
| Children | Above Poverty | Below Poverty |
| No Children | 84 (98.8%) | 1 (1.2%) |
| 1 or 2 Children | 36 (100.0%) | 0 (0.0%) |
| 3 or 4 Children | 4 (100.0%) | 0 (0.0%) |
| 5 or more Children | 3 (100.0%) | 0 (0.0%) |
| Total | 127 (99.2%) | 1 (0.8%) |
Income Below Poverty Among Single-Parent Households in Vienna
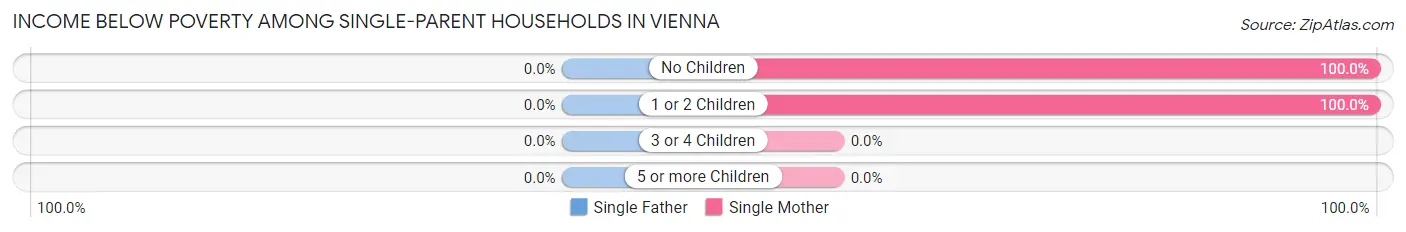
| Children | Single Father | Single Mother |
| No Children | 0 (0.0%) | 2 (100.0%) |
| 1 or 2 Children | 0 (0.0%) | 1 (100.0%) |
| 3 or 4 Children | 0 (0.0%) | 0 (0.0%) |
| 5 or more Children | 0 (0.0%) | 0 (0.0%) |
| Total | 0 (0.0%) | 3 (100.0%) |
Income Below Poverty Among Married-Couple vs Single-Parent Households in Vienna
The poverty data for Vienna shows that 1 of the married-couple family households (0.8%) and 3 of the single-parent households (42.9%) are living below the poverty level. Within the married-couple family households, those with no children have the highest poverty rate, with 1 households (1.2%) falling below the poverty line. Among the single-parent households, those with no children have the highest poverty rate, with 2 household (66.7%) living below poverty.
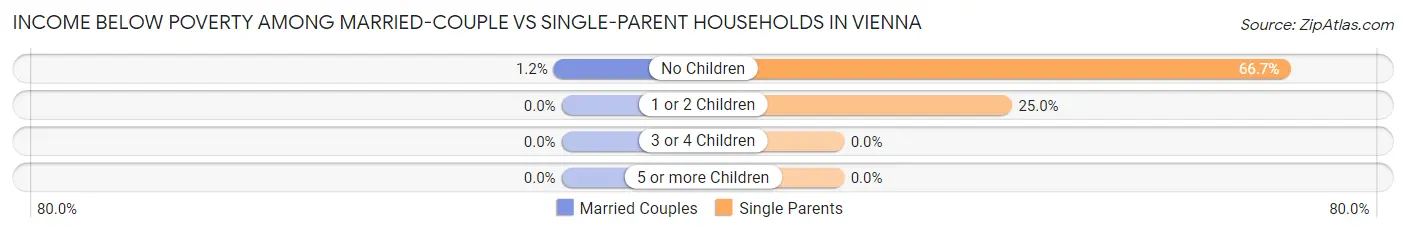
| Children | Married-Couple Families | Single-Parent Households |
| No Children | 1 (1.2%) | 2 (66.7%) |
| 1 or 2 Children | 0 (0.0%) | 1 (25.0%) |
| 3 or 4 Children | 0 (0.0%) | 0 (0.0%) |
| 5 or more Children | 0 (0.0%) | 0 (0.0%) |
| Total | 1 (0.8%) | 3 (42.9%) |
Race in Vienna
The most populous races in Vienna are White / Caucasian (516 | 87.9%), Hispanic or Latino (60 | 10.2%), and Two or more Races (59 | 10.1%).
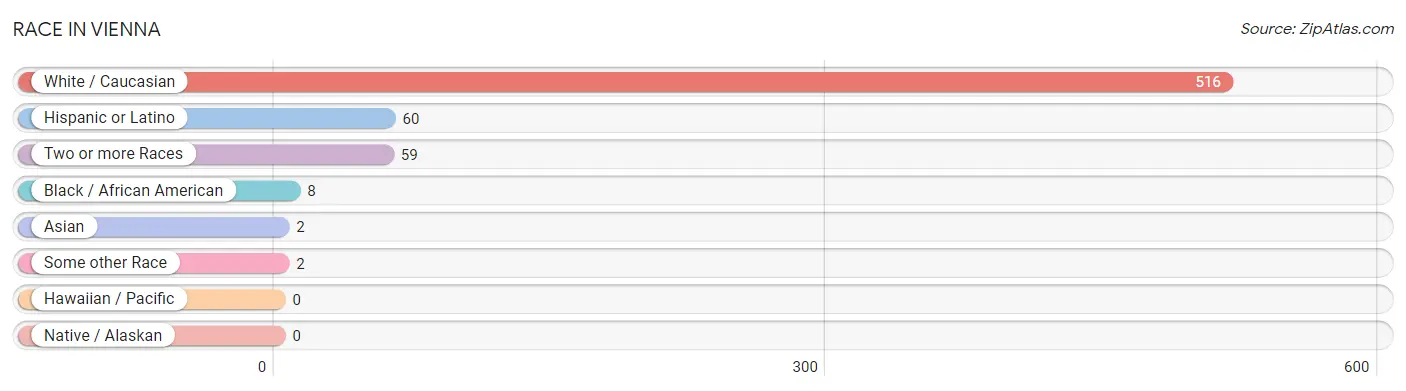
| Race | # Population | % Population |
| Asian | 2 | 0.3% |
| Black / African American | 8 | 1.4% |
| Hawaiian / Pacific | 0 | 0.0% |
| Hispanic or Latino | 60 | 10.2% |
| Native / Alaskan | 0 | 0.0% |
| White / Caucasian | 516 | 87.9% |
| Two or more Races | 59 | 10.1% |
| Some other Race | 2 | 0.3% |
| Total | 587 | 100.0% |
Ancestry in Vienna
The most populous ancestries reported in Vienna are English (139 | 23.7%), European (87 | 14.8%), American (47 | 8.0%), Irish (45 | 7.7%), and German (36 | 6.1%), together accounting for 60.3% of all Vienna residents.
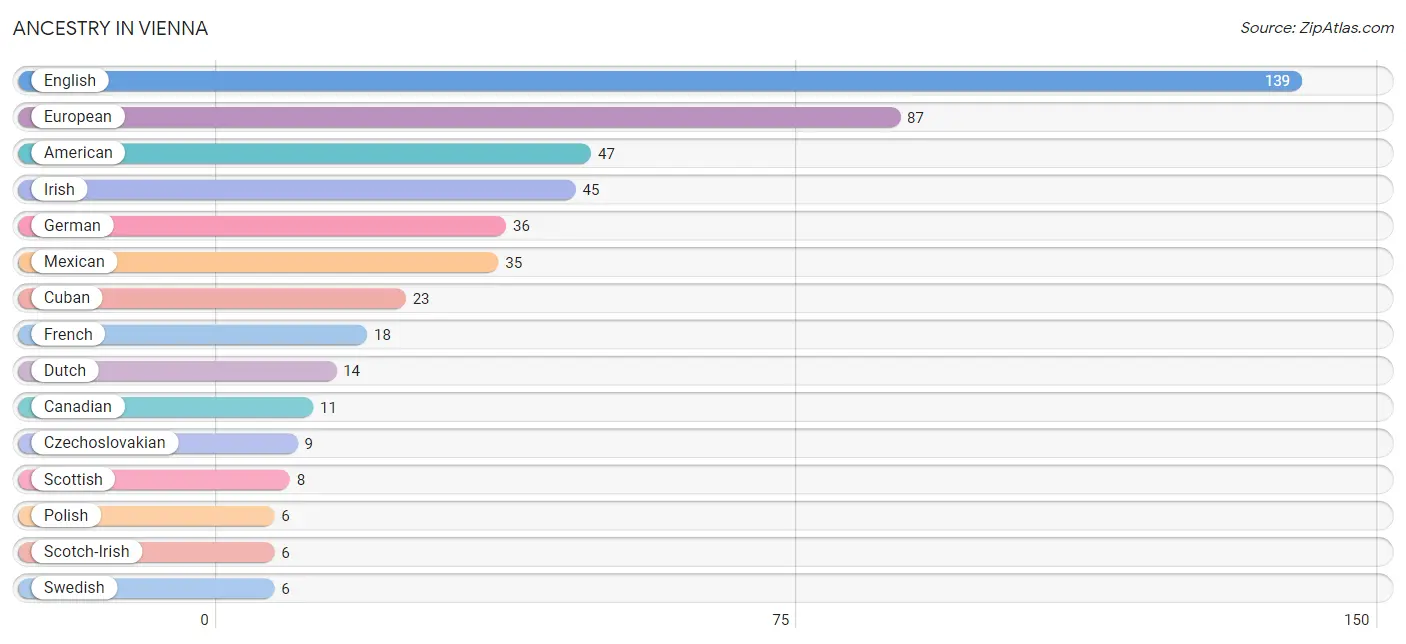
| Ancestry | # Population | % Population |
| American | 47 | 8.0% |
| Arab | 2 | 0.3% |
| Belgian | 1 | 0.2% |
| British | 1 | 0.2% |
| Cajun | 5 | 0.9% |
| Canadian | 11 | 1.9% |
| Central American | 2 | 0.3% |
| Croatian | 1 | 0.2% |
| Cuban | 23 | 3.9% |
| Czechoslovakian | 9 | 1.5% |
| Danish | 2 | 0.3% |
| Dutch | 14 | 2.4% |
| English | 139 | 23.7% |
| European | 87 | 14.8% |
| French | 18 | 3.1% |
| French Canadian | 2 | 0.3% |
| German | 36 | 6.1% |
| Guatemalan | 2 | 0.3% |
| Iraqi | 2 | 0.3% |
| Irish | 45 | 7.7% |
| Italian | 4 | 0.7% |
| Korean | 5 | 0.9% |
| Mexican | 35 | 6.0% |
| Norwegian | 4 | 0.7% |
| Polish | 6 | 1.0% |
| Portuguese | 1 | 0.2% |
| Russian | 1 | 0.2% |
| Scotch-Irish | 6 | 1.0% |
| Scottish | 8 | 1.4% |
| Swedish | 6 | 1.0% |
| Thai | 2 | 0.3% |
| Welsh | 5 | 0.9% | View All 32 Rows |
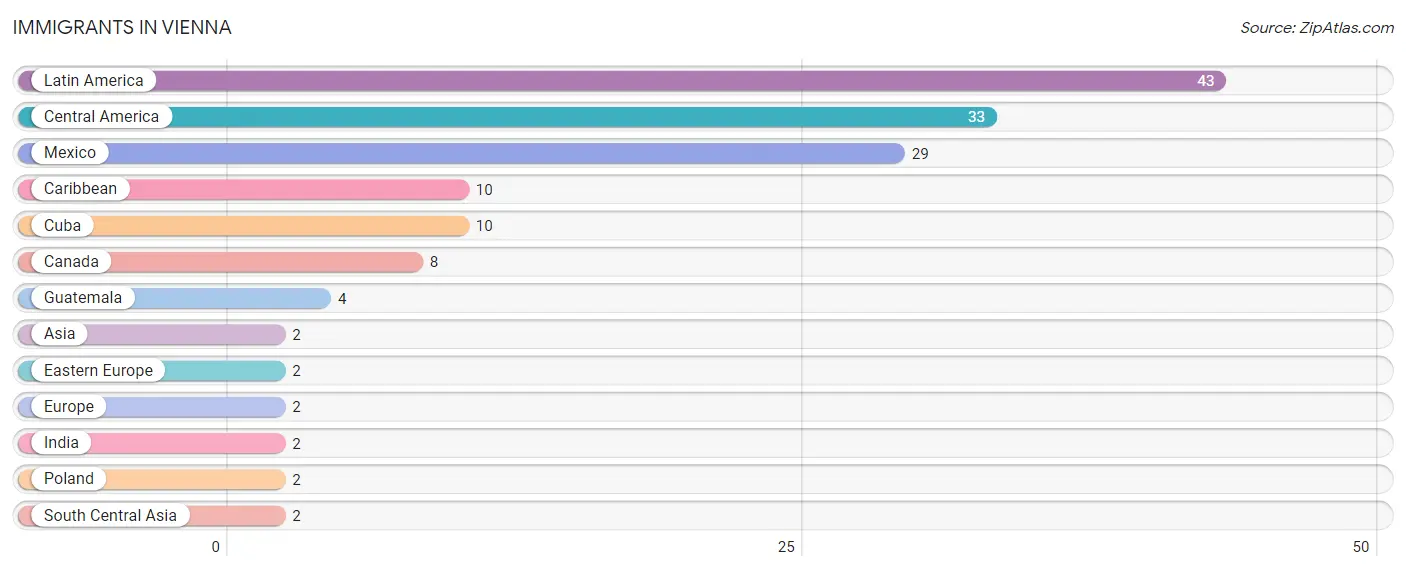
Immigrants in Vienna
The most numerous immigrant groups reported in Vienna came from Latin America (43 | 7.3%), Central America (33 | 5.6%), Mexico (29 | 4.9%), Caribbean (10 | 1.7%), and Cuba (10 | 1.7%), together accounting for 21.3% of all Vienna residents.
| Immigration Origin | # Population | % Population |
| Asia | 2 | 0.3% |
| Canada | 8 | 1.4% |
| Caribbean | 10 | 1.7% |
| Central America | 33 | 5.6% |
| Cuba | 10 | 1.7% |
| Eastern Europe | 2 | 0.3% |
| Europe | 2 | 0.3% |
| Guatemala | 4 | 0.7% |
| India | 2 | 0.3% |
| Latin America | 43 | 7.3% |
| Mexico | 29 | 4.9% |
| Poland | 2 | 0.3% |
| South Central Asia | 2 | 0.3% | View All 13 Rows |
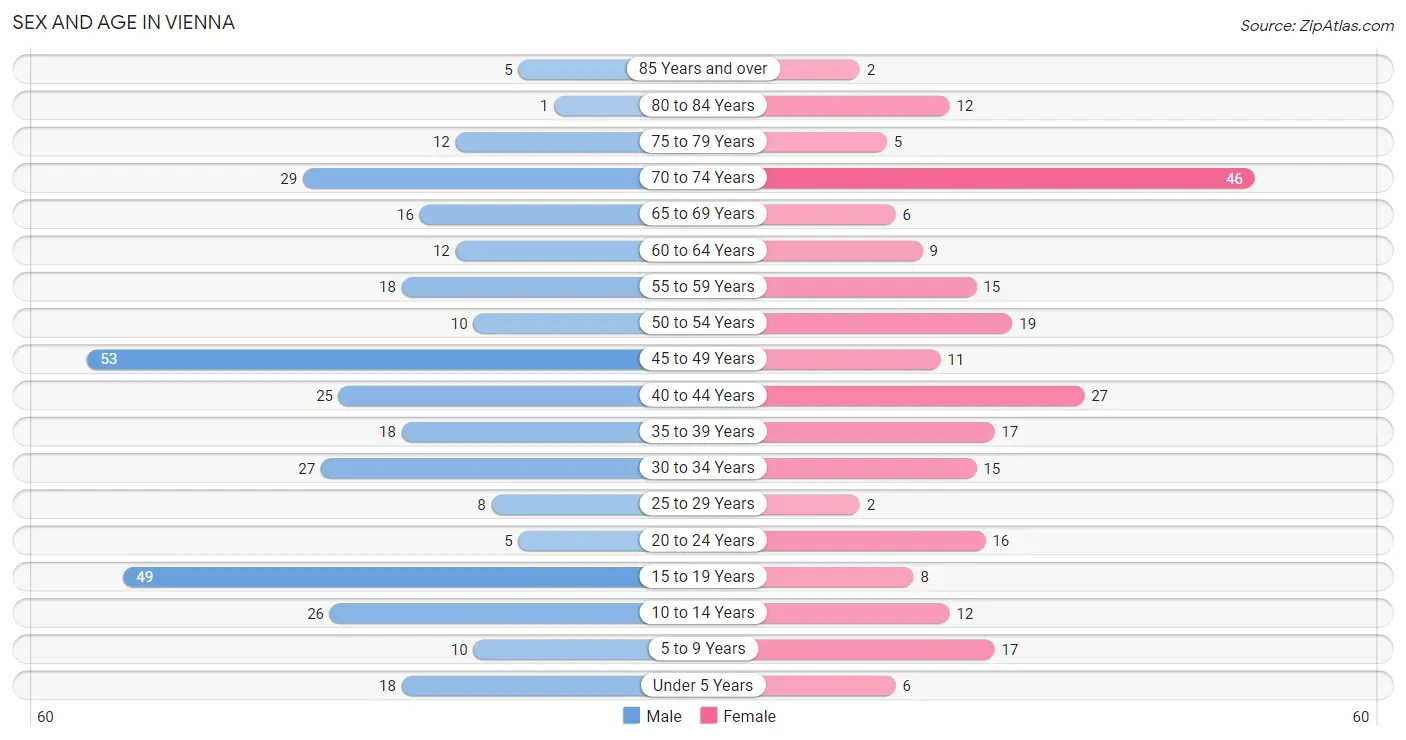
Sex and Age in Vienna
Sex and Age in Vienna
The most populous age groups in Vienna are 45 to 49 Years (53 | 15.5%) for men and 70 to 74 Years (46 | 18.8%) for women.
| Age Bracket | Male | Female |
| Under 5 Years | 18 (5.3%) | 6 (2.5%) |
| 5 to 9 Years | 10 (2.9%) | 17 (6.9%) |
| 10 to 14 Years | 26 (7.6%) | 12 (4.9%) |
| 15 to 19 Years | 49 (14.3%) | 8 (3.3%) |
| 20 to 24 Years | 5 (1.5%) | 16 (6.5%) |
| 25 to 29 Years | 8 (2.3%) | 2 (0.8%) |
| 30 to 34 Years | 27 (7.9%) | 15 (6.1%) |
| 35 to 39 Years | 18 (5.3%) | 17 (6.9%) |
| 40 to 44 Years | 25 (7.3%) | 27 (11.0%) |
| 45 to 49 Years | 53 (15.5%) | 11 (4.5%) |
| 50 to 54 Years | 10 (2.9%) | 19 (7.8%) |
| 55 to 59 Years | 18 (5.3%) | 15 (6.1%) |
| 60 to 64 Years | 12 (3.5%) | 9 (3.7%) |
| 65 to 69 Years | 16 (4.7%) | 6 (2.5%) |
| 70 to 74 Years | 29 (8.5%) | 46 (18.8%) |
| 75 to 79 Years | 12 (3.5%) | 5 (2.0%) |
| 80 to 84 Years | 1 (0.3%) | 12 (4.9%) |
| 85 Years and over | 5 (1.5%) | 2 (0.8%) |
| Total | 342 (100.0%) | 245 (100.0%) |
Families and Households in Vienna
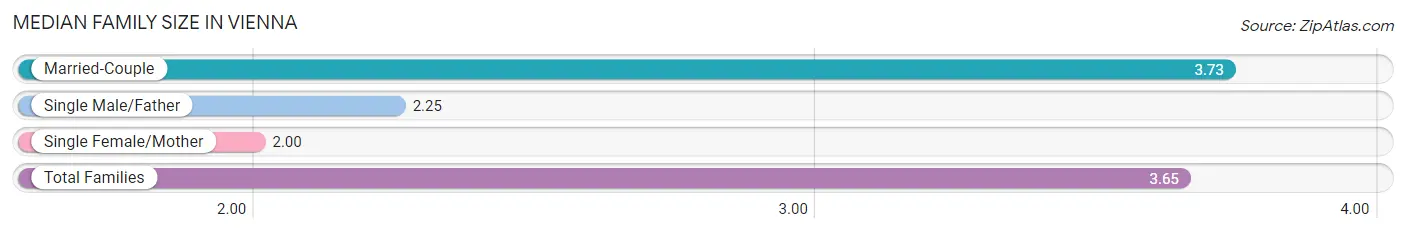
Median Family Size in Vienna
The median family size in Vienna is 3.65 persons per family, with married-couple families (128 | 94.8%) accounting for the largest median family size of 3.73 persons per family. On the other hand, single female/mother families (3 | 2.2%) represent the smallest median family size with 2.00 persons per family.
| Family Type | # Families | Family Size |
| Married-Couple | 128 (94.8%) | 3.73 |
| Single Male/Father | 4 (3.0%) | 2.25 |
| Single Female/Mother | 3 (2.2%) | 2.00 |
| Total Families | 135 (100.0%) | 3.65 |
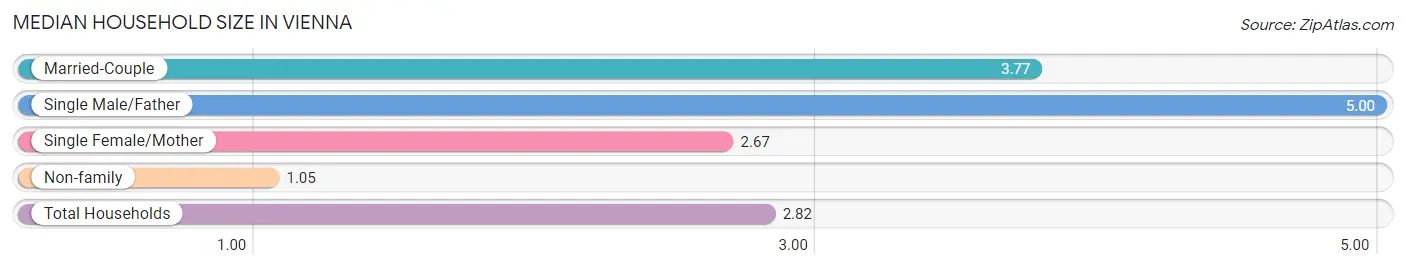
Median Household Size in Vienna
The median household size in Vienna is 2.82 persons per household, with single male/father households (4 | 1.9%) accounting for the largest median household size of 5 persons per household. non-family households (73 | 35.1%) represent the smallest median household size with 1.05 persons per household.
| Household Type | # Households | Household Size |
| Married-Couple | 128 (61.5%) | 3.77 |
| Single Male/Father | 4 (1.9%) | 5.00 |
| Single Female/Mother | 3 (1.4%) | 2.67 |
| Non-family | 73 (35.1%) | 1.05 |
| Total Households | 208 (100.0%) | 2.82 |
Household Size by Marriage Status in Vienna
Out of a total of 208 households in Vienna, 135 (64.9%) are family households, while 73 (35.1%) are nonfamily households. The most numerous type of family households are 2-person households, comprising 73, and the most common type of nonfamily households are 1-person households, comprising 69.
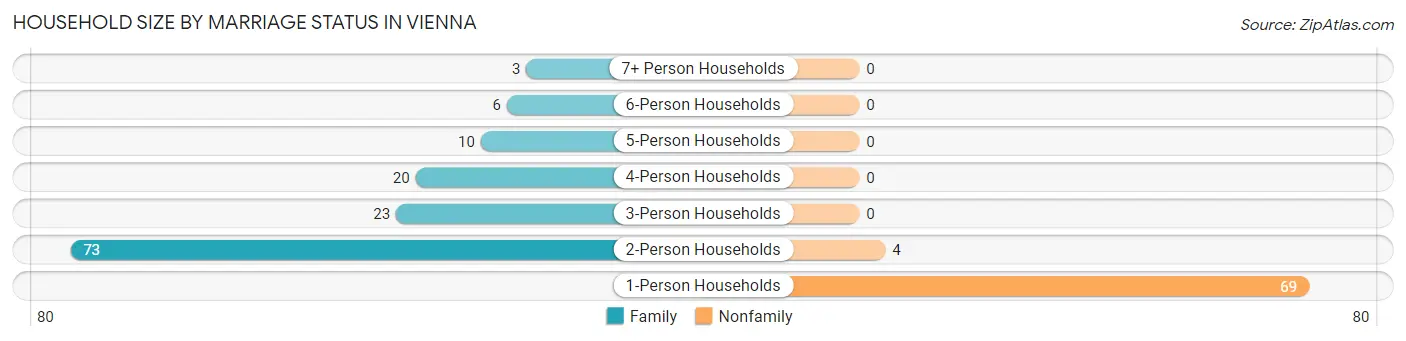
| Household Size | Family Households | Nonfamily Households |
| 1-Person Households | - | 69 (33.2%) |
| 2-Person Households | 73 (35.1%) | 4 (1.9%) |
| 3-Person Households | 23 (11.1%) | 0 (0.0%) |
| 4-Person Households | 20 (9.6%) | 0 (0.0%) |
| 5-Person Households | 10 (4.8%) | 0 (0.0%) |
| 6-Person Households | 6 (2.9%) | 0 (0.0%) |
| 7+ Person Households | 3 (1.4%) | 0 (0.0%) |
| Total | 135 (64.9%) | 73 (35.1%) |
Female Fertility in Vienna
Fertility by Age in Vienna
Average fertility rate in Vienna is 52.0 births per 1,000 women. Women in the age bracket of 20 to 34 years have the highest fertility rate with 152.0 births per 1,000 women. Women in the age bracket of 20 to 34 years acount for 100.0% of all women with births.
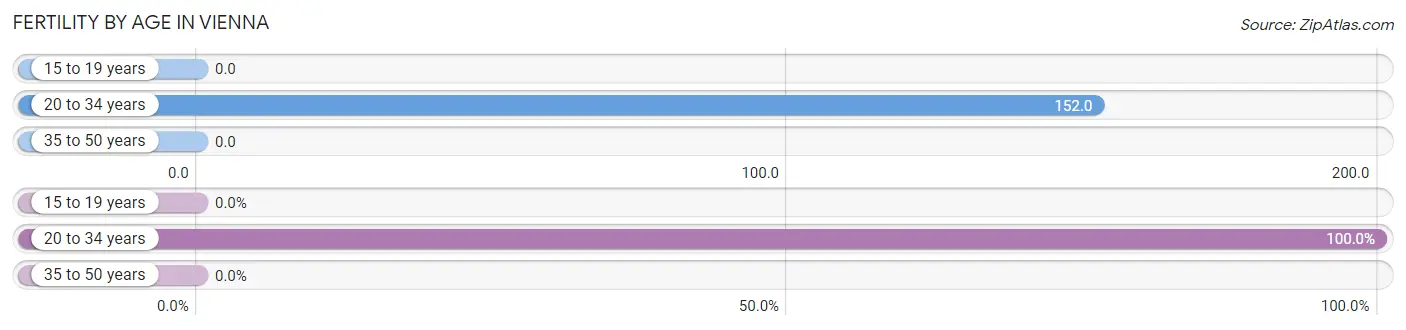
| Age Bracket | Women with Births | Births / 1,000 Women |
| 15 to 19 years | 0 (0.0%) | 0.0 |
| 20 to 34 years | 5 (100.0%) | 152.0 |
| 35 to 50 years | 0 (0.0%) | 0.0 |
| Total | 5 (100.0%) | 52.0 |
Fertility by Age by Marriage Status in Vienna
60.0% of women with births (5) in Vienna are married. The highest percentage of unmarried women with births falls into 20 to 34 years age bracket with 40.0% of them unmarried at the time of birth, while the lowest percentage of unmarried women with births belong to 20 to 34 years age bracket with 40.0% of them unmarried.
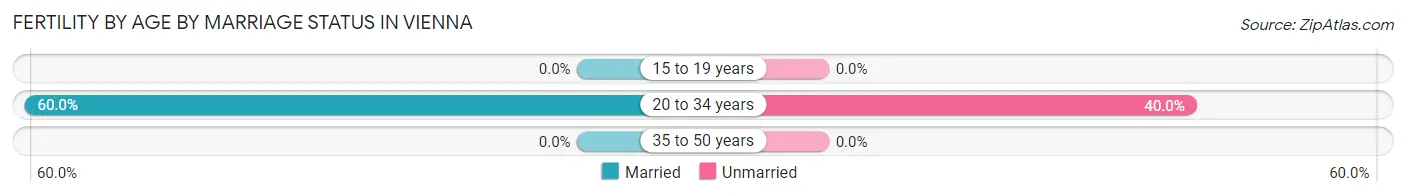
| Age Bracket | Married | Unmarried |
| 15 to 19 years | 0 (0.0%) | 0 (0.0%) |
| 20 to 34 years | 3 (60.0%) | 2 (40.0%) |
| 35 to 50 years | 0 (0.0%) | 0 (0.0%) |
| Total | 3 (60.0%) | 2 (40.0%) |
Fertility by Education in Vienna
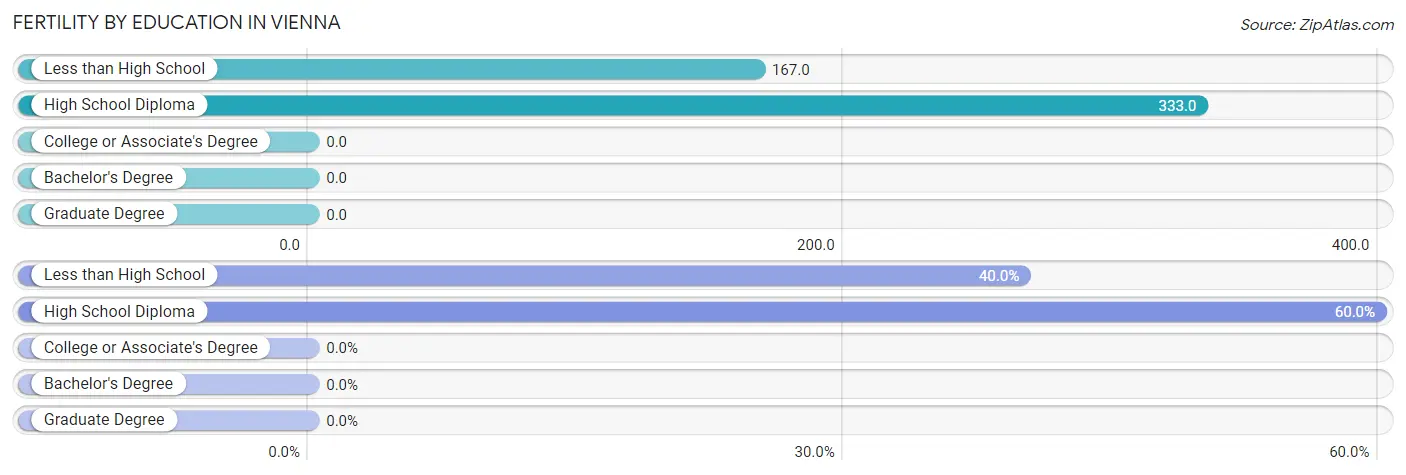
| Educational Attainment | Women with Births | Births / 1,000 Women |
| Less than High School | 2 (40.0%) | 167.0 |
| High School Diploma | 3 (60.0%) | 333.0 |
| College or Associate's Degree | 0 (0.0%) | 0.0 |
| Bachelor's Degree | 0 (0.0%) | 0.0 |
| Graduate Degree | 0 (0.0%) | 0.0 |
| Total | 5 (100.0%) | 52.0 |
Fertility by Education by Marriage Status in Vienna
40.0% of women with births in Vienna are unmarried. Women with the educational attainment of high school diploma are most likely to be married with 100.0% of them married at childbirth, while women with the educational attainment of less than high school are least likely to be married with 100.0% of them unmarried at childbirth.
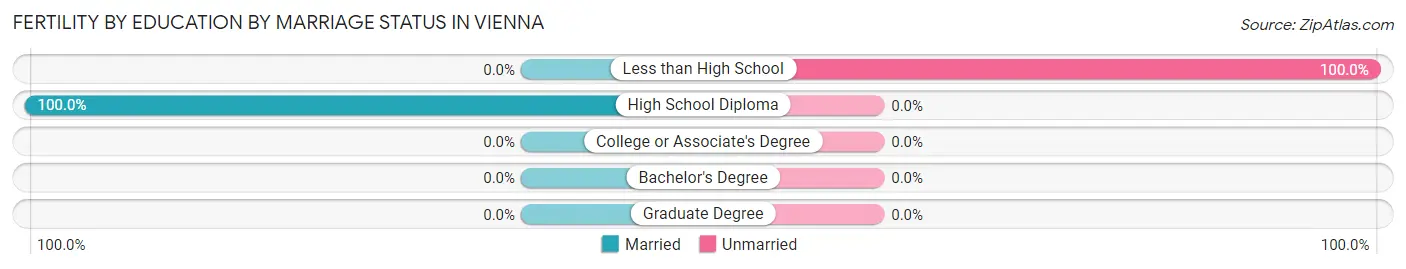
| Educational Attainment | Married | Unmarried |
| Less than High School | 0 (0.0%) | 2 (100.0%) |
| High School Diploma | 3 (100.0%) | 0 (0.0%) |
| College or Associate's Degree | 0 (0.0%) | 0 (0.0%) |
| Bachelor's Degree | 0 (0.0%) | 0 (0.0%) |
| Graduate Degree | 0 (0.0%) | 0 (0.0%) |
| Total | 3 (60.0%) | 2 (40.0%) |
Employment Characteristics in Vienna
Employment by Class of Employer in Vienna
Among the 300 employed individuals in Vienna, private company employees (188 | 62.7%), not-for-profit organizations (39 | 13.0%), and local government employees (31 | 10.3%) make up the most common classes of employment.
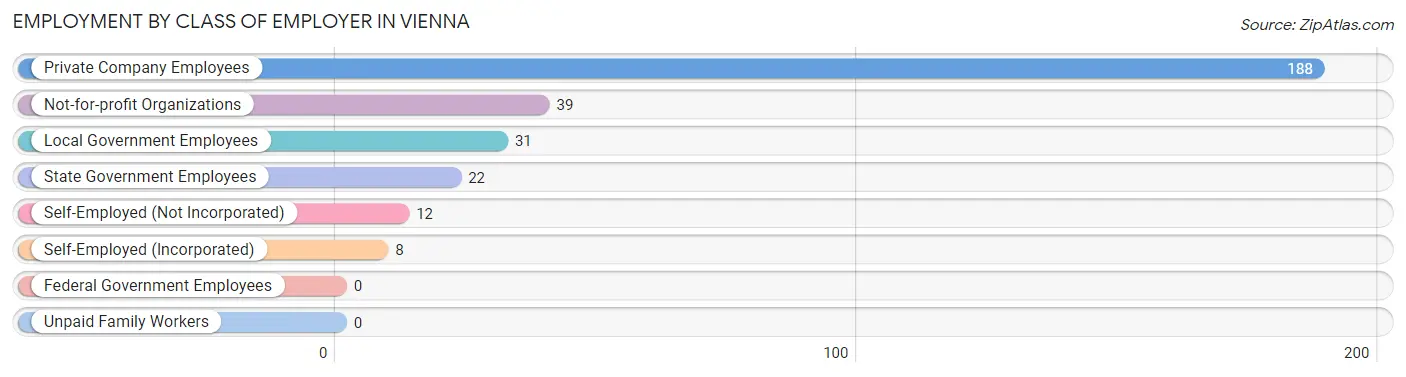
| Employer Class | # Employees | % Employees |
| Private Company Employees | 188 | 62.7% |
| Self-Employed (Incorporated) | 8 | 2.7% |
| Self-Employed (Not Incorporated) | 12 | 4.0% |
| Not-for-profit Organizations | 39 | 13.0% |
| Local Government Employees | 31 | 10.3% |
| State Government Employees | 22 | 7.3% |
| Federal Government Employees | 0 | 0.0% |
| Unpaid Family Workers | 0 | 0.0% |
| Total | 300 | 100.0% |
Employment Status by Age in Vienna
According to the labor force statistics for Vienna, out of the total population over 16 years of age (459), 66.2% or 304 individuals are in the labor force, with 1.0% or 3 of them unemployed. The age group with the highest labor force participation rate is 20 to 24 years, with 100.0% or 21 individuals in the labor force. Within the labor force, the 20 to 24 years age range has the highest percentage of unemployed individuals, with 14.3% or 3 of them being unemployed.
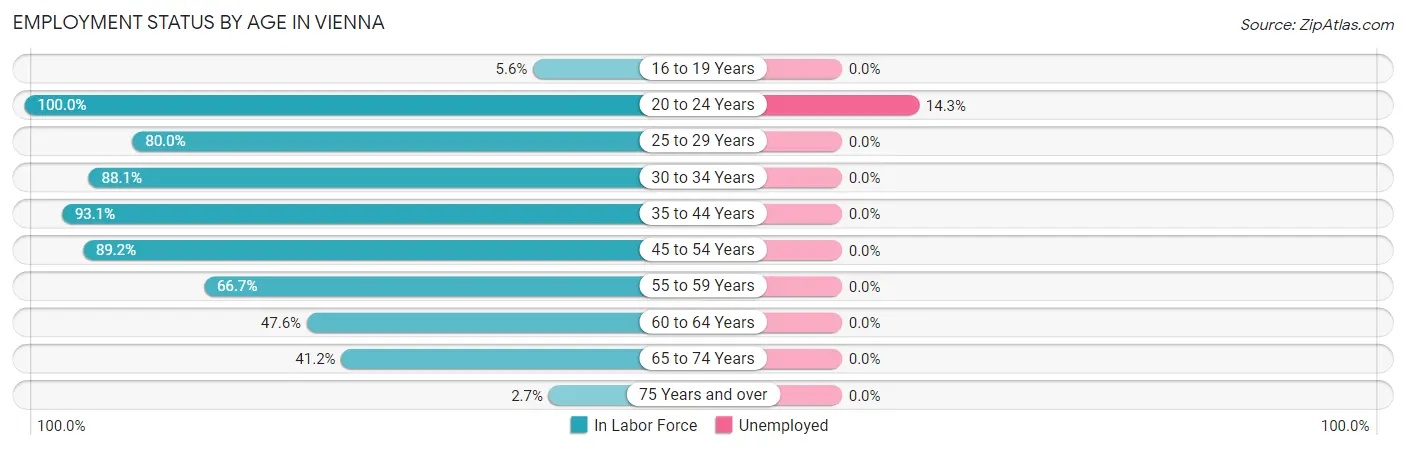
| Age Bracket | In Labor Force | Unemployed |
| 16 to 19 Years | 1 (5.6%) | 0 (0.0%) |
| 20 to 24 Years | 21 (100.0%) | 3 (14.3%) |
| 25 to 29 Years | 8 (80.0%) | 0 (0.0%) |
| 30 to 34 Years | 37 (88.1%) | 0 (0.0%) |
| 35 to 44 Years | 81 (93.1%) | 0 (0.0%) |
| 45 to 54 Years | 83 (89.2%) | 0 (0.0%) |
| 55 to 59 Years | 22 (66.7%) | 0 (0.0%) |
| 60 to 64 Years | 10 (47.6%) | 0 (0.0%) |
| 65 to 74 Years | 40 (41.2%) | 0 (0.0%) |
| 75 Years and over | 1 (2.7%) | 0 (0.0%) |
| Total | 304 (66.2%) | 3 (1.0%) |
Employment Status by Educational Attainment in Vienna
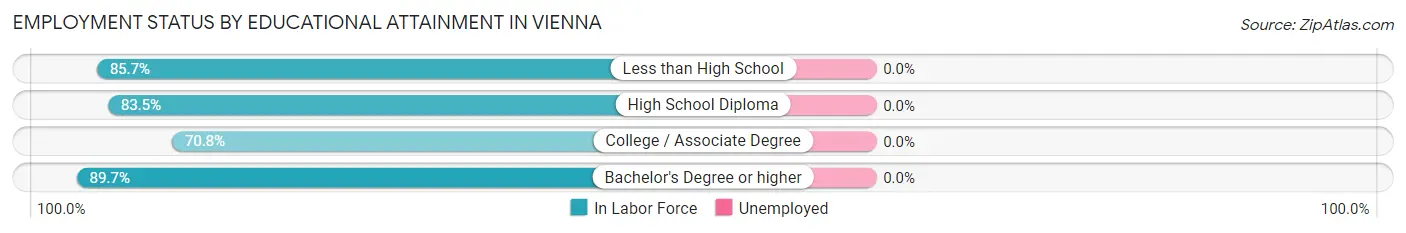
| Educational Attainment | In Labor Force | Unemployed |
| Less than High School | 36 (85.7%) | 0 (0.0%) |
| High School Diploma | 66 (83.5%) | 0 (0.0%) |
| College / Associate Degree | 34 (70.8%) | 0 (0.0%) |
| Bachelor's Degree or higher | 105 (89.7%) | 0 (0.0%) |
| Total | 241 (84.3%) | 0 (0.0%) |
Employment Occupations by Sex in Vienna
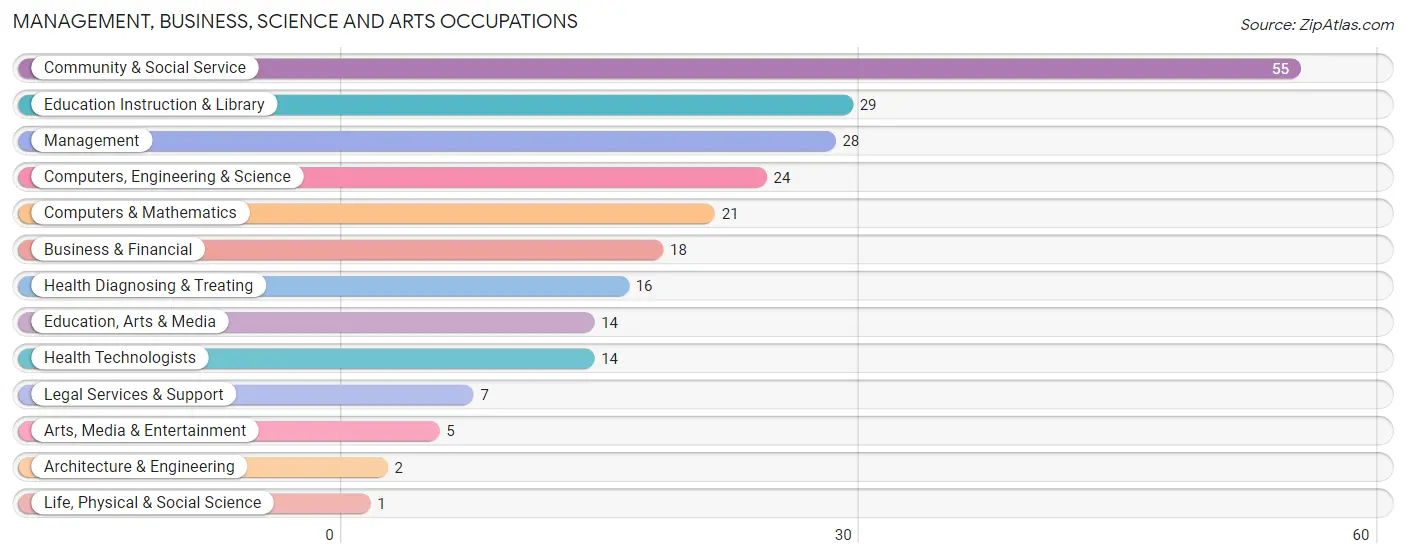
Management, Business, Science and Arts Occupations
The most common Management, Business, Science and Arts occupations in Vienna are Community & Social Service (55 | 18.3%), Education Instruction & Library (29 | 9.6%), Management (28 | 9.3%), Computers, Engineering & Science (24 | 8.0%), and Computers & Mathematics (21 | 7.0%).
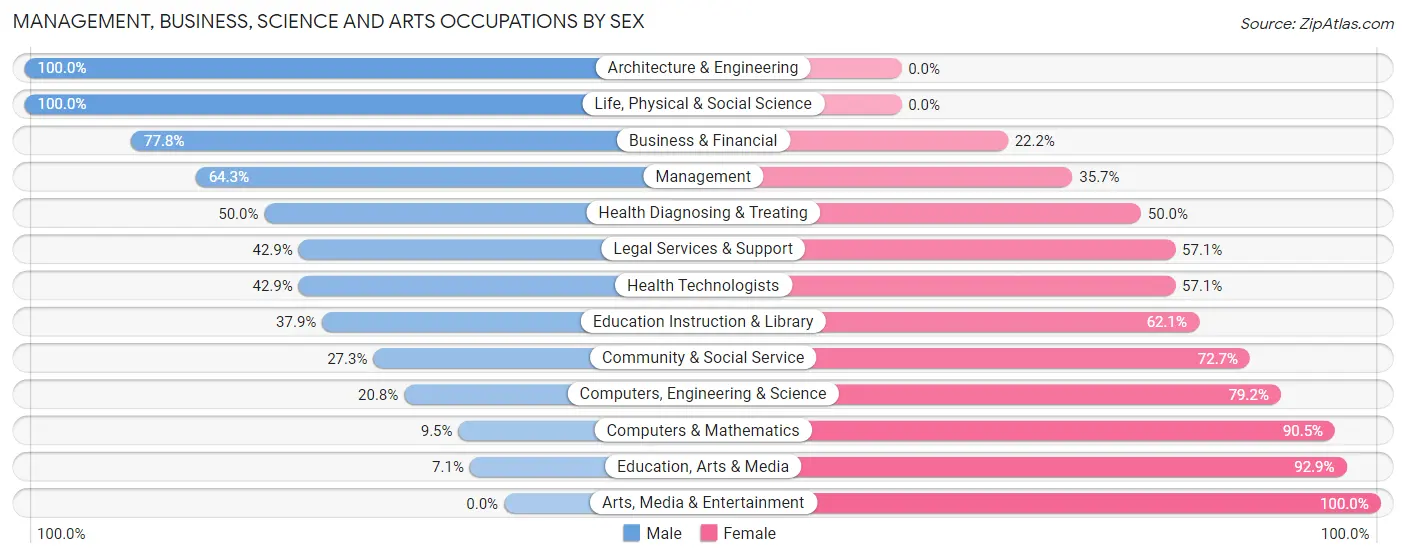
Management, Business, Science and Arts Occupations by Sex
Within the Management, Business, Science and Arts occupations in Vienna, the most male-oriented occupations are Architecture & Engineering (100.0%), Life, Physical & Social Science (100.0%), and Business & Financial (77.8%), while the most female-oriented occupations are Arts, Media & Entertainment (100.0%), Education, Arts & Media (92.9%), and Computers & Mathematics (90.5%).
| Occupation | Male | Female |
| Management | 18 (64.3%) | 10 (35.7%) |
| Business & Financial | 14 (77.8%) | 4 (22.2%) |
| Computers, Engineering & Science | 5 (20.8%) | 19 (79.2%) |
| Computers & Mathematics | 2 (9.5%) | 19 (90.5%) |
| Architecture & Engineering | 2 (100.0%) | 0 (0.0%) |
| Life, Physical & Social Science | 1 (100.0%) | 0 (0.0%) |
| Community & Social Service | 15 (27.3%) | 40 (72.7%) |
| Education, Arts & Media | 1 (7.1%) | 13 (92.9%) |
| Legal Services & Support | 3 (42.9%) | 4 (57.1%) |
| Education Instruction & Library | 11 (37.9%) | 18 (62.1%) |
| Arts, Media & Entertainment | 0 (0.0%) | 5 (100.0%) |
| Health Diagnosing & Treating | 8 (50.0%) | 8 (50.0%) |
| Health Technologists | 6 (42.9%) | 8 (57.1%) |
| Total (Category) | 60 (42.5%) | 81 (57.5%) |
| Total (Overall) | 182 (60.5%) | 119 (39.5%) |
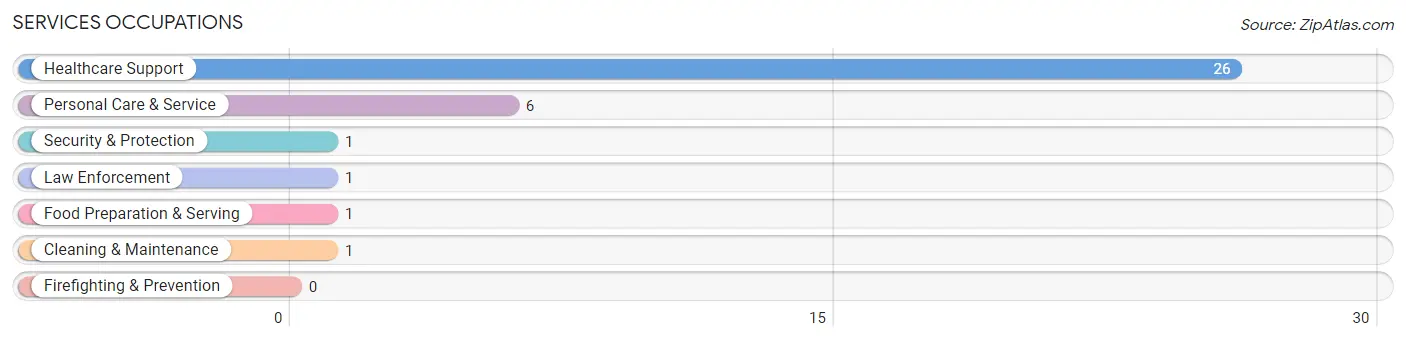
Services Occupations
The most common Services occupations in Vienna are Healthcare Support (26 | 8.6%), Personal Care & Service (6 | 2.0%), Security & Protection (1 | 0.3%), Law Enforcement (1 | 0.3%), and Food Preparation & Serving (1 | 0.3%).
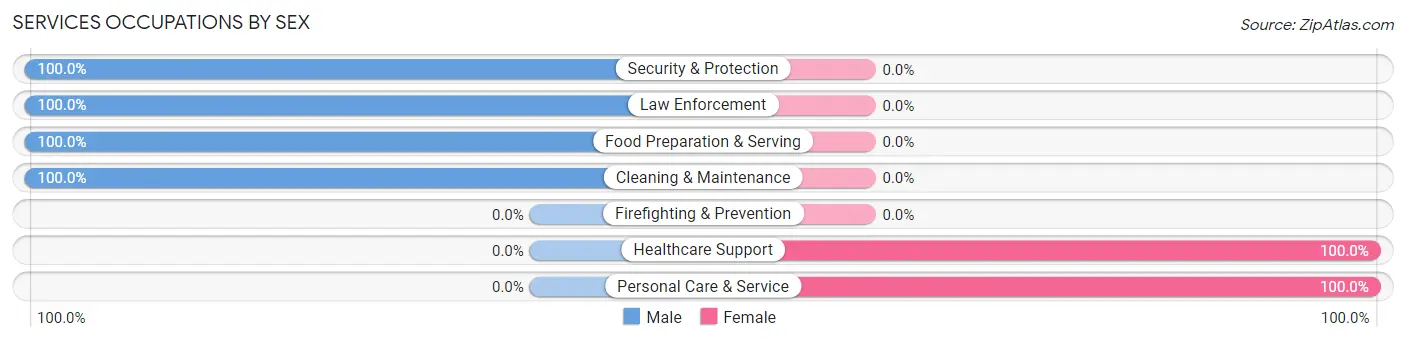
Services Occupations by Sex
Within the Services occupations in Vienna, the most male-oriented occupations are Security & Protection (100.0%), Law Enforcement (100.0%), and Food Preparation & Serving (100.0%), while the most female-oriented occupations are Healthcare Support (100.0%), and Personal Care & Service (100.0%).
| Occupation | Male | Female |
| Healthcare Support | 0 (0.0%) | 26 (100.0%) |
| Security & Protection | 1 (100.0%) | 0 (0.0%) |
| Firefighting & Prevention | 0 (0.0%) | 0 (0.0%) |
| Law Enforcement | 1 (100.0%) | 0 (0.0%) |
| Food Preparation & Serving | 1 (100.0%) | 0 (0.0%) |
| Cleaning & Maintenance | 1 (100.0%) | 0 (0.0%) |
| Personal Care & Service | 0 (0.0%) | 6 (100.0%) |
| Total (Category) | 3 (8.6%) | 32 (91.4%) |
| Total (Overall) | 182 (60.5%) | 119 (39.5%) |
Sales and Office Occupations
The most common Sales and Office occupations in Vienna are Sales & Related (12 | 4.0%), and Office & Administration (7 | 2.3%).
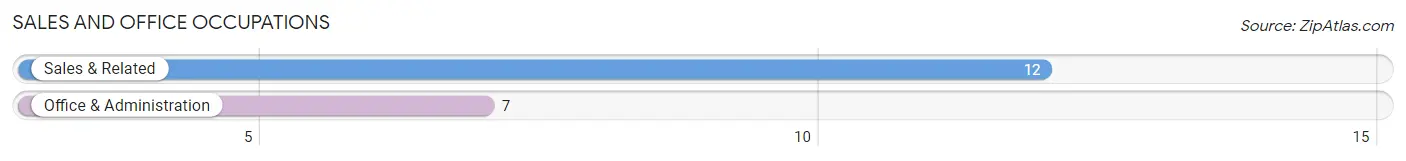
Sales and Office Occupations by Sex
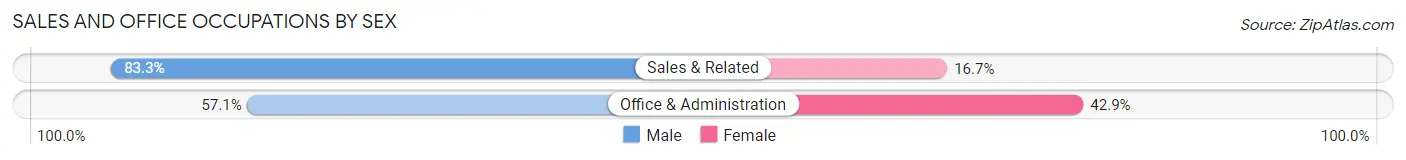
| Occupation | Male | Female |
| Sales & Related | 10 (83.3%) | 2 (16.7%) |
| Office & Administration | 4 (57.1%) | 3 (42.9%) |
| Total (Category) | 14 (73.7%) | 5 (26.3%) |
| Total (Overall) | 182 (60.5%) | 119 (39.5%) |
Natural Resources, Construction and Maintenance Occupations
The most common Natural Resources, Construction and Maintenance occupations in Vienna are Construction & Extraction (93 | 30.9%), Installation, Maintenance & Repair (2 | 0.7%), and Farming, Fishing & Forestry (1 | 0.3%).
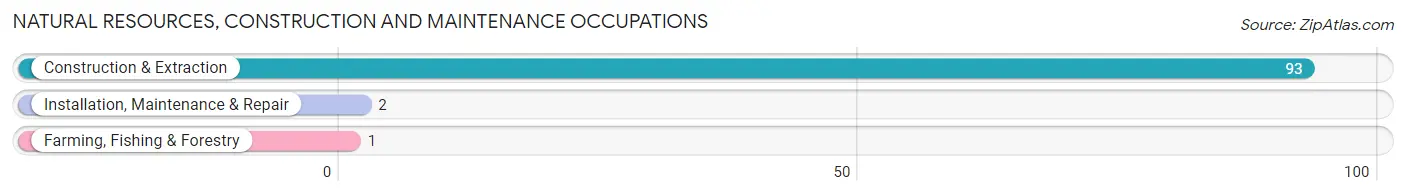
Natural Resources, Construction and Maintenance Occupations by Sex
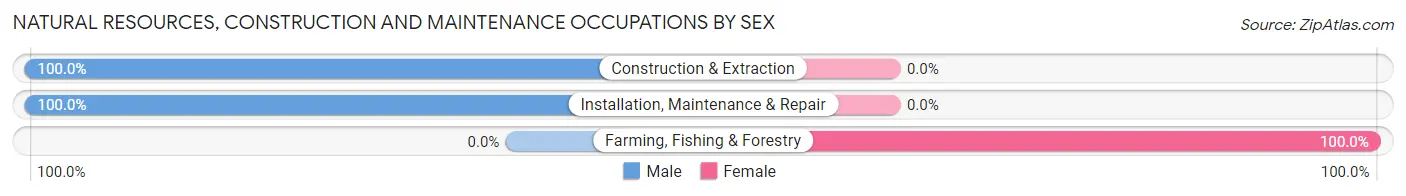
| Occupation | Male | Female |
| Farming, Fishing & Forestry | 0 (0.0%) | 1 (100.0%) |
| Construction & Extraction | 93 (100.0%) | 0 (0.0%) |
| Installation, Maintenance & Repair | 2 (100.0%) | 0 (0.0%) |
| Total (Category) | 95 (99.0%) | 1 (1.0%) |
| Total (Overall) | 182 (60.5%) | 119 (39.5%) |
Production, Transportation and Moving Occupations
The most common Production, Transportation and Moving occupations in Vienna are Production (6 | 2.0%), Material Moving (3 | 1.0%), and Transportation (1 | 0.3%).
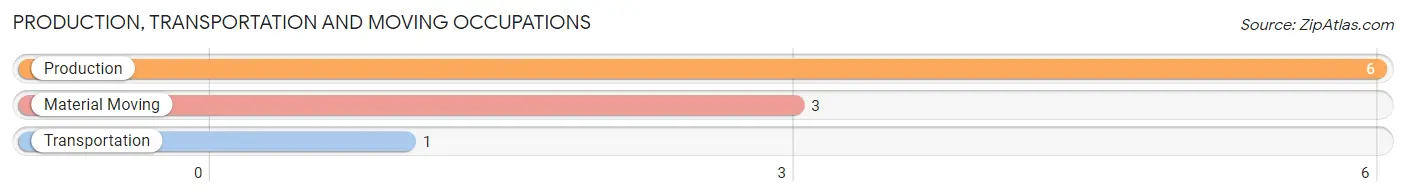
Production, Transportation and Moving Occupations by Sex
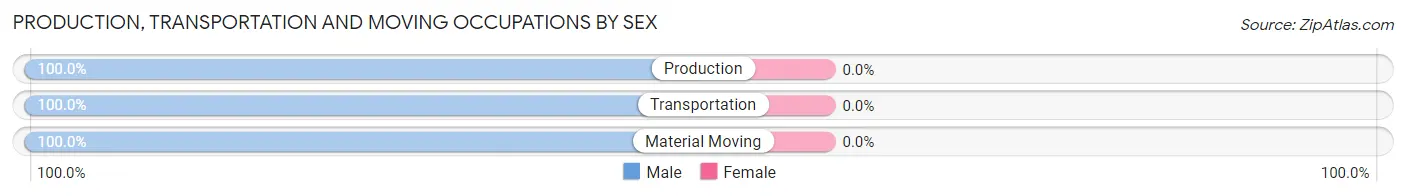
| Occupation | Male | Female |
| Production | 6 (100.0%) | 0 (0.0%) |
| Transportation | 1 (100.0%) | 0 (0.0%) |
| Material Moving | 3 (100.0%) | 0 (0.0%) |
| Total (Category) | 10 (100.0%) | 0 (0.0%) |
| Total (Overall) | 182 (60.5%) | 119 (39.5%) |
Employment Industries by Sex in Vienna
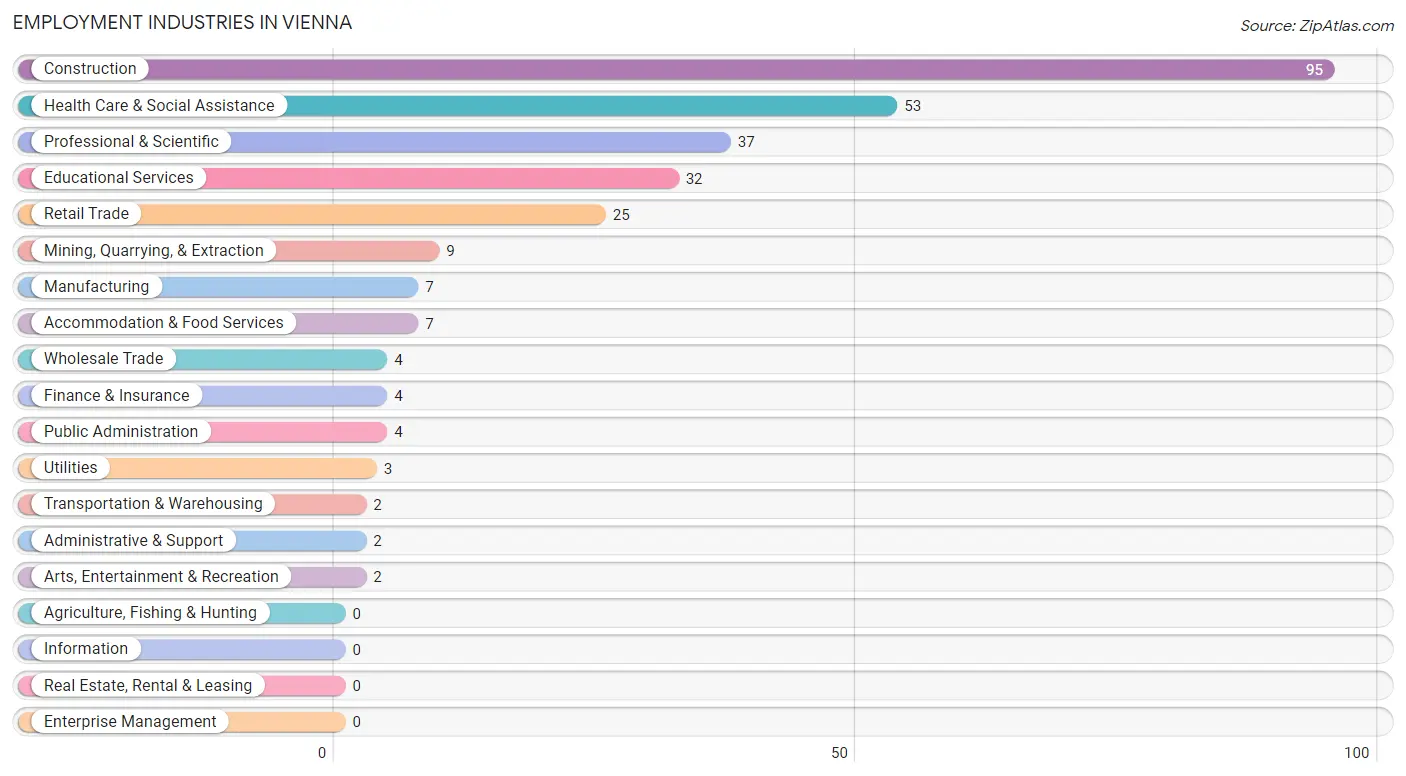
Employment Industries in Vienna
The major employment industries in Vienna include Construction (95 | 31.6%), Health Care & Social Assistance (53 | 17.6%), Professional & Scientific (37 | 12.3%), Educational Services (32 | 10.6%), and Retail Trade (25 | 8.3%).
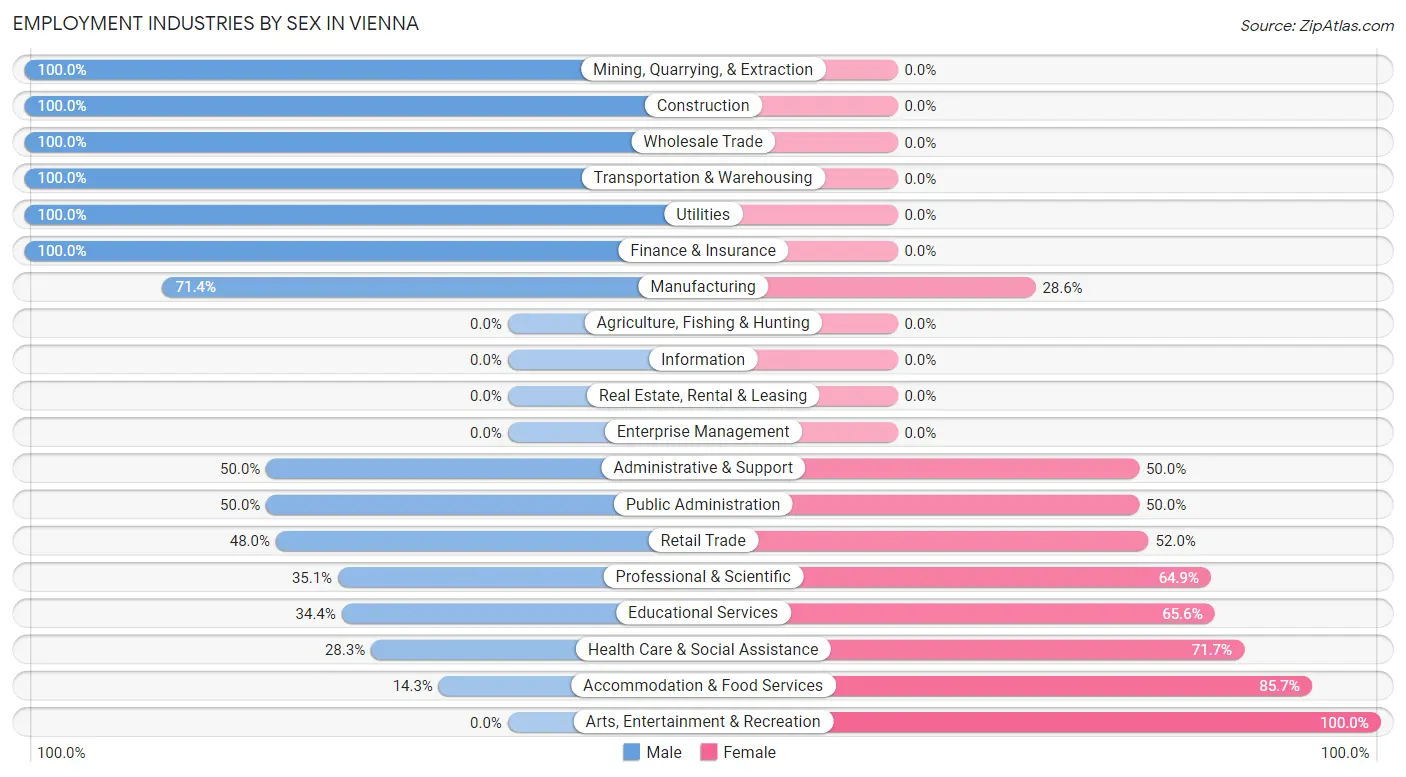
Employment Industries by Sex in Vienna
The Vienna industries that see more men than women are Mining, Quarrying, & Extraction (100.0%), Construction (100.0%), and Wholesale Trade (100.0%), whereas the industries that tend to have a higher number of women are Arts, Entertainment & Recreation (100.0%), Accommodation & Food Services (85.7%), and Health Care & Social Assistance (71.7%).
| Industry | Male | Female |
| Agriculture, Fishing & Hunting | 0 (0.0%) | 0 (0.0%) |
| Mining, Quarrying, & Extraction | 9 (100.0%) | 0 (0.0%) |
| Construction | 95 (100.0%) | 0 (0.0%) |
| Manufacturing | 5 (71.4%) | 2 (28.6%) |
| Wholesale Trade | 4 (100.0%) | 0 (0.0%) |
| Retail Trade | 12 (48.0%) | 13 (52.0%) |
| Transportation & Warehousing | 2 (100.0%) | 0 (0.0%) |
| Utilities | 3 (100.0%) | 0 (0.0%) |
| Information | 0 (0.0%) | 0 (0.0%) |
| Finance & Insurance | 4 (100.0%) | 0 (0.0%) |
| Real Estate, Rental & Leasing | 0 (0.0%) | 0 (0.0%) |
| Professional & Scientific | 13 (35.1%) | 24 (64.9%) |
| Enterprise Management | 0 (0.0%) | 0 (0.0%) |
| Administrative & Support | 1 (50.0%) | 1 (50.0%) |
| Educational Services | 11 (34.4%) | 21 (65.6%) |
| Health Care & Social Assistance | 15 (28.3%) | 38 (71.7%) |
| Arts, Entertainment & Recreation | 0 (0.0%) | 2 (100.0%) |
| Accommodation & Food Services | 1 (14.3%) | 6 (85.7%) |
| Public Administration | 2 (50.0%) | 2 (50.0%) |
| Total | 182 (60.5%) | 119 (39.5%) |
Education in Vienna
School Enrollment in Vienna
The most common levels of schooling among the 136 students in Vienna are high school (57 | 41.9%), middle school (36 | 26.5%), and elementary school (26 | 19.1%).
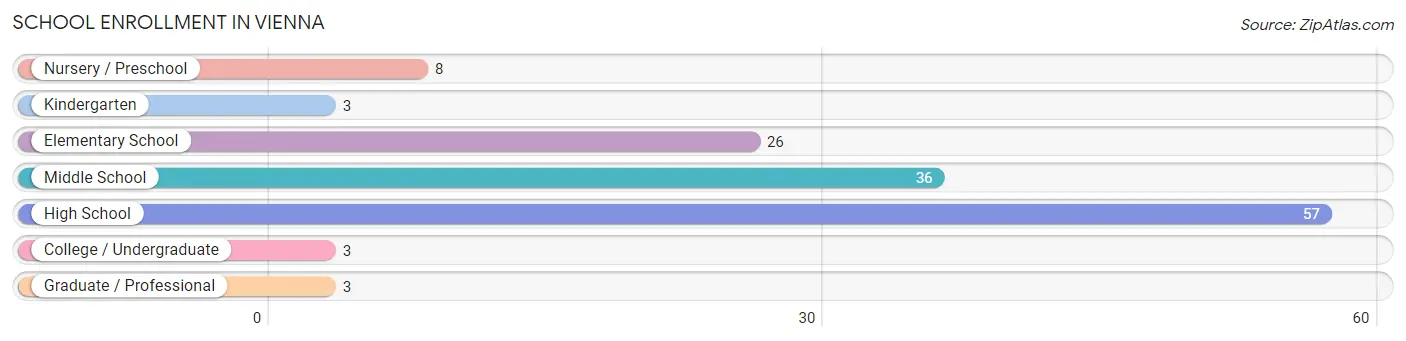
| School Level | # Students | % Students |
| Nursery / Preschool | 8 | 5.9% |
| Kindergarten | 3 | 2.2% |
| Elementary School | 26 | 19.1% |
| Middle School | 36 | 26.5% |
| High School | 57 | 41.9% |
| College / Undergraduate | 3 | 2.2% |
| Graduate / Professional | 3 | 2.2% |
| Total | 136 | 100.0% |
School Enrollment by Age by Funding Source in Vienna
Out of a total of 136 students who are enrolled in schools in Vienna, 73 (53.7%) attend a private institution, while the remaining 63 (46.3%) are enrolled in public schools. The age group of 25 to 34 year olds has the highest likelihood of being enrolled in private schools, with 3 (100.0% in the age bracket) enrolled. Conversely, the age group of 18 to 19 year olds has the lowest likelihood of being enrolled in a private school, with 1 (100.0% in the age bracket) attending a public institution.
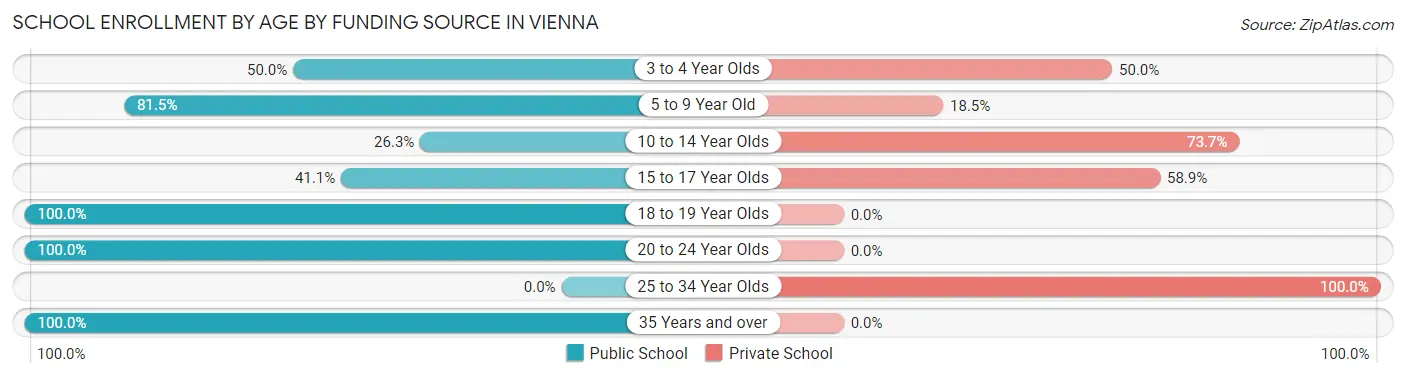
| Age Bracket | Public School | Private School |
| 3 to 4 Year Olds | 4 (50.0%) | 4 (50.0%) |
| 5 to 9 Year Old | 22 (81.5%) | 5 (18.5%) |
| 10 to 14 Year Olds | 10 (26.3%) | 28 (73.7%) |
| 15 to 17 Year Olds | 23 (41.1%) | 33 (58.9%) |
| 18 to 19 Year Olds | 1 (100.0%) | 0 (0.0%) |
| 20 to 24 Year Olds | 1 (100.0%) | 0 (0.0%) |
| 25 to 34 Year Olds | 0 (0.0%) | 3 (100.0%) |
| 35 Years and over | 2 (100.0%) | 0 (0.0%) |
| Total | 63 (46.3%) | 73 (53.7%) |
Educational Attainment by Field of Study in Vienna
Computers & mathematics (22 | 14.5%), business (20 | 13.2%), engineering (16 | 10.5%), bio, nature & agricultural (15 | 9.9%), and science & technology (15 | 9.9%) are the most common fields of study among 152 individuals in Vienna who have obtained a bachelor's degree or higher.
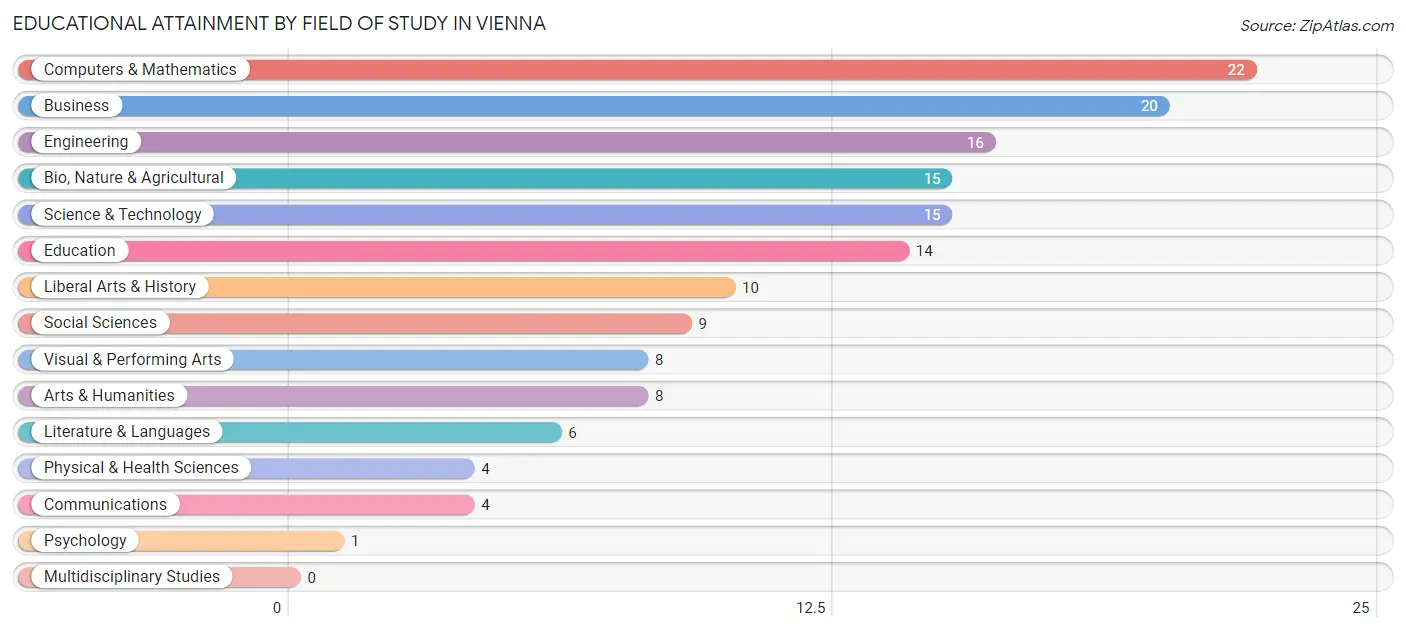
| Field of Study | # Graduates | % Graduates |
| Computers & Mathematics | 22 | 14.5% |
| Bio, Nature & Agricultural | 15 | 9.9% |
| Physical & Health Sciences | 4 | 2.6% |
| Psychology | 1 | 0.7% |
| Social Sciences | 9 | 5.9% |
| Engineering | 16 | 10.5% |
| Multidisciplinary Studies | 0 | 0.0% |
| Science & Technology | 15 | 9.9% |
| Business | 20 | 13.2% |
| Education | 14 | 9.2% |
| Literature & Languages | 6 | 4.0% |
| Liberal Arts & History | 10 | 6.6% |
| Visual & Performing Arts | 8 | 5.3% |
| Communications | 4 | 2.6% |
| Arts & Humanities | 8 | 5.3% |
| Total | 152 | 100.0% |
Transportation & Commute in Vienna
Vehicle Availability by Sex in Vienna
The most prevalent vehicle ownership categories in Vienna are males with 3 vehicles (64, accounting for 35.4%) and females with 3 vehicles (25, making up 53.8%).
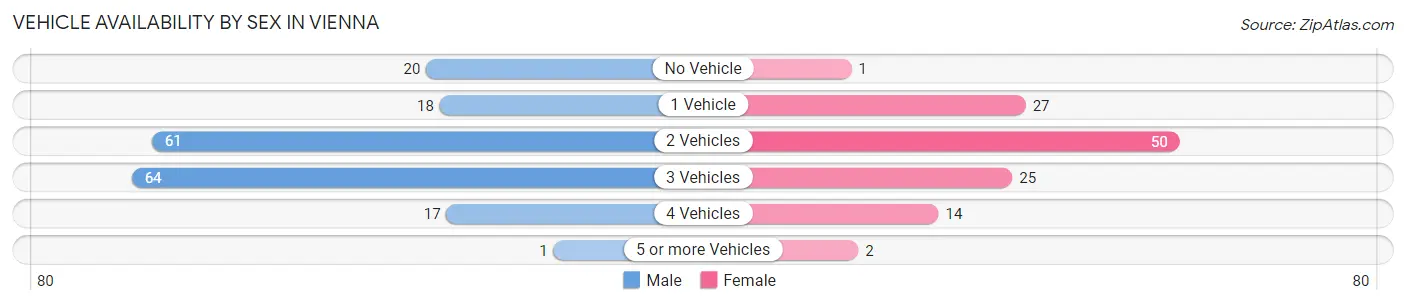
| Vehicles Available | Male | Female |
| No Vehicle | 20 (11.1%) | 1 (0.8%) |
| 1 Vehicle | 18 (9.9%) | 27 (22.7%) |
| 2 Vehicles | 61 (33.7%) | 50 (42.0%) |
| 3 Vehicles | 64 (35.4%) | 25 (21.0%) |
| 4 Vehicles | 17 (9.4%) | 14 (11.8%) |
| 5 or more Vehicles | 1 (0.5%) | 2 (1.7%) |
| Total | 181 (100.0%) | 119 (100.0%) |
Commute Time in Vienna
The most frequently occuring commute durations in Vienna are 10 to 14 minutes (69 commuters, 24.2%), 60 to 89 minutes (49 commuters, 17.2%), and 15 to 19 minutes (48 commuters, 16.8%).
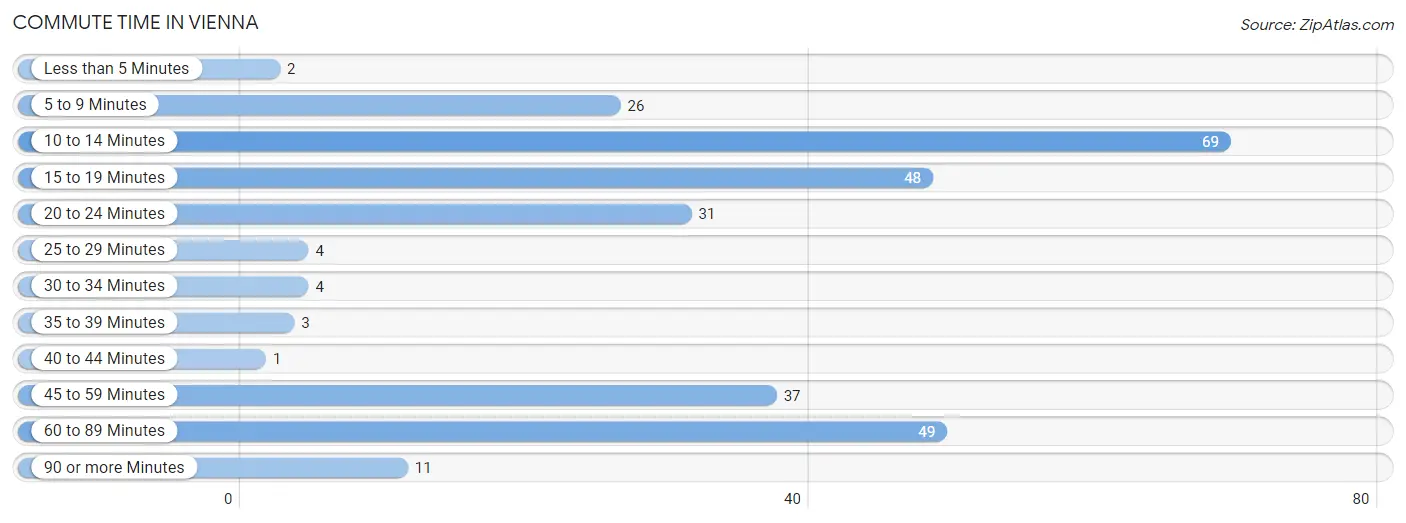
| Commute Time | # Commuters | % Commuters |
| Less than 5 Minutes | 2 | 0.7% |
| 5 to 9 Minutes | 26 | 9.1% |
| 10 to 14 Minutes | 69 | 24.2% |
| 15 to 19 Minutes | 48 | 16.8% |
| 20 to 24 Minutes | 31 | 10.9% |
| 25 to 29 Minutes | 4 | 1.4% |
| 30 to 34 Minutes | 4 | 1.4% |
| 35 to 39 Minutes | 3 | 1.1% |
| 40 to 44 Minutes | 1 | 0.4% |
| 45 to 59 Minutes | 37 | 13.0% |
| 60 to 89 Minutes | 49 | 17.2% |
| 90 or more Minutes | 11 | 3.9% |
Commute Time by Sex in Vienna
The most common commute times in Vienna are 60 to 89 minutes (48 commuters, 27.6%) for males and 10 to 14 minutes (35 commuters, 31.5%) for females.
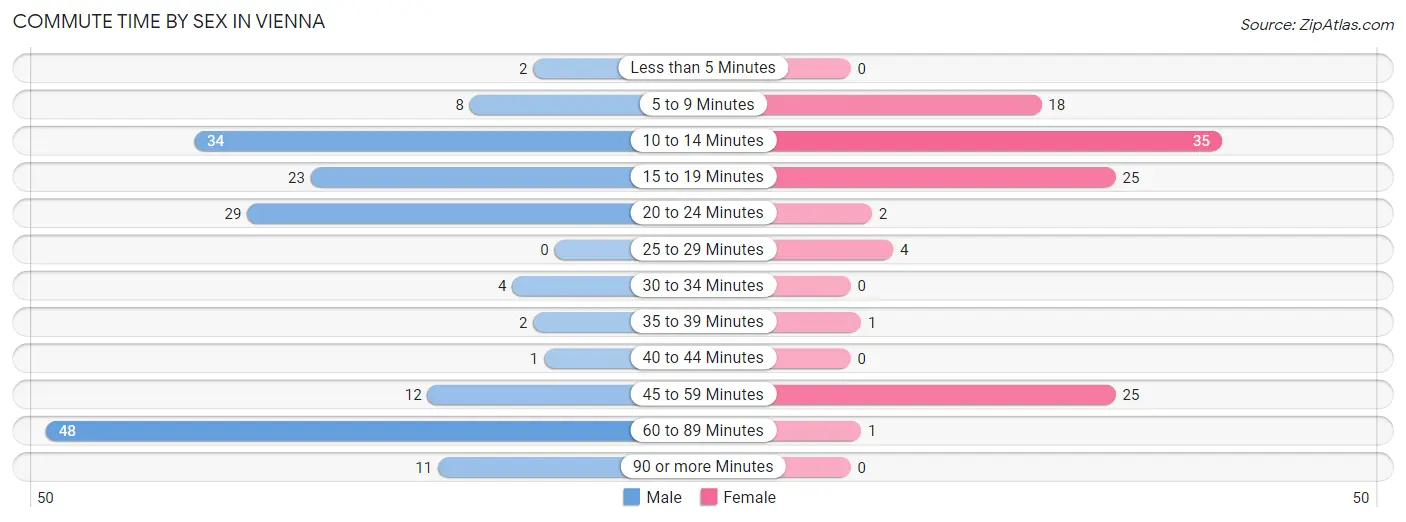
| Commute Time | Male | Female |
| Less than 5 Minutes | 2 (1.1%) | 0 (0.0%) |
| 5 to 9 Minutes | 8 (4.6%) | 18 (16.2%) |
| 10 to 14 Minutes | 34 (19.5%) | 35 (31.5%) |
| 15 to 19 Minutes | 23 (13.2%) | 25 (22.5%) |
| 20 to 24 Minutes | 29 (16.7%) | 2 (1.8%) |
| 25 to 29 Minutes | 0 (0.0%) | 4 (3.6%) |
| 30 to 34 Minutes | 4 (2.3%) | 0 (0.0%) |
| 35 to 39 Minutes | 2 (1.1%) | 1 (0.9%) |
| 40 to 44 Minutes | 1 (0.6%) | 0 (0.0%) |
| 45 to 59 Minutes | 12 (6.9%) | 25 (22.5%) |
| 60 to 89 Minutes | 48 (27.6%) | 1 (0.9%) |
| 90 or more Minutes | 11 (6.3%) | 0 (0.0%) |
Time of Departure to Work by Sex in Vienna
The most frequent times of departure to work in Vienna are 6:30 AM to 6:59 AM (56, 32.2%) for males and 8:00 AM to 8:29 AM (48, 43.2%) for females.
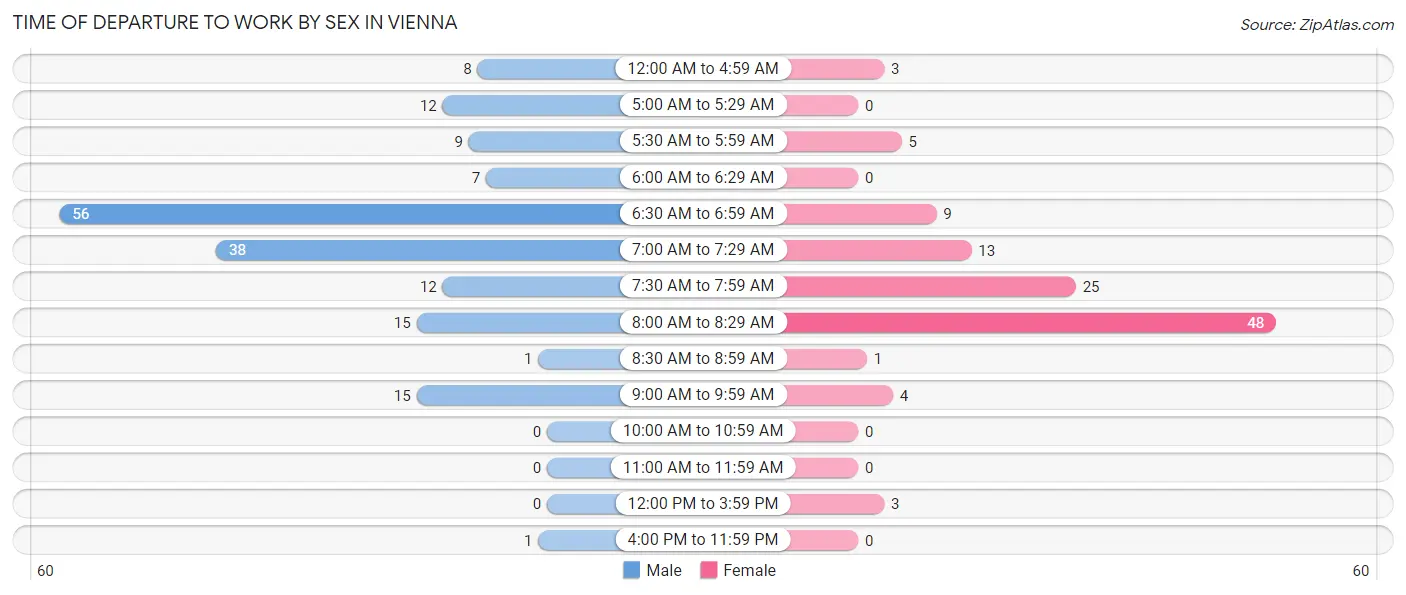
| Time of Departure | Male | Female |
| 12:00 AM to 4:59 AM | 8 (4.6%) | 3 (2.7%) |
| 5:00 AM to 5:29 AM | 12 (6.9%) | 0 (0.0%) |
| 5:30 AM to 5:59 AM | 9 (5.2%) | 5 (4.5%) |
| 6:00 AM to 6:29 AM | 7 (4.0%) | 0 (0.0%) |
| 6:30 AM to 6:59 AM | 56 (32.2%) | 9 (8.1%) |
| 7:00 AM to 7:29 AM | 38 (21.8%) | 13 (11.7%) |
| 7:30 AM to 7:59 AM | 12 (6.9%) | 25 (22.5%) |
| 8:00 AM to 8:29 AM | 15 (8.6%) | 48 (43.2%) |
| 8:30 AM to 8:59 AM | 1 (0.6%) | 1 (0.9%) |
| 9:00 AM to 9:59 AM | 15 (8.6%) | 4 (3.6%) |
| 10:00 AM to 10:59 AM | 0 (0.0%) | 0 (0.0%) |
| 11:00 AM to 11:59 AM | 0 (0.0%) | 0 (0.0%) |
| 12:00 PM to 3:59 PM | 0 (0.0%) | 3 (2.7%) |
| 4:00 PM to 11:59 PM | 1 (0.6%) | 0 (0.0%) |
| Total | 174 (100.0%) | 111 (100.0%) |
Housing Occupancy in Vienna
Occupancy by Ownership in Vienna
Of the total 208 dwellings in Vienna, owner-occupied units account for 135 (64.9%), while renter-occupied units make up 73 (35.1%).
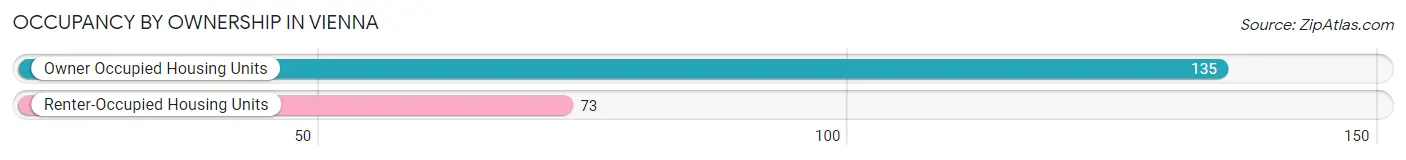
| Occupancy | # Housing Units | % Housing Units |
| Owner Occupied Housing Units | 135 | 64.9% |
| Renter-Occupied Housing Units | 73 | 35.1% |
| Total Occupied Housing Units | 208 | 100.0% |
Occupancy by Household Size in Vienna
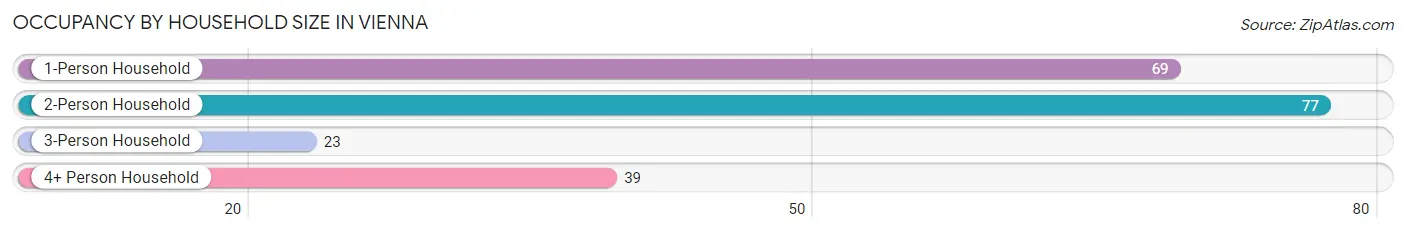
| Household Size | # Housing Units | % Housing Units |
| 1-Person Household | 69 | 33.2% |
| 2-Person Household | 77 | 37.0% |
| 3-Person Household | 23 | 11.1% |
| 4+ Person Household | 39 | 18.8% |
| Total Housing Units | 208 | 100.0% |
Occupancy by Ownership by Household Size in Vienna
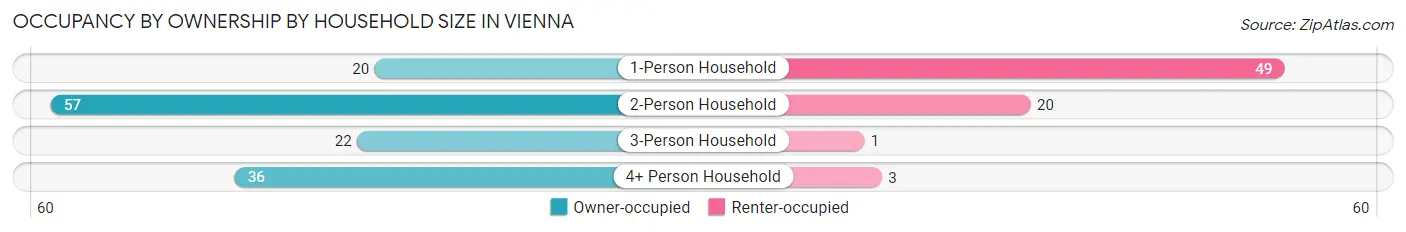
| Household Size | Owner-occupied | Renter-occupied |
| 1-Person Household | 20 (29.0%) | 49 (71.0%) |
| 2-Person Household | 57 (74.0%) | 20 (26.0%) |
| 3-Person Household | 22 (95.7%) | 1 (4.3%) |
| 4+ Person Household | 36 (92.3%) | 3 (7.7%) |
| Total Housing Units | 135 (64.9%) | 73 (35.1%) |
Occupancy by Educational Attainment in Vienna
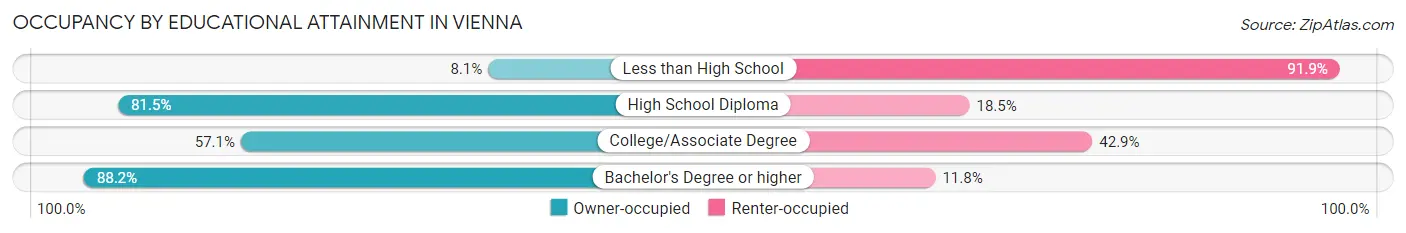
| Household Size | Owner-occupied | Renter-occupied |
| Less than High School | 3 (8.1%) | 34 (91.9%) |
| High School Diploma | 44 (81.5%) | 10 (18.5%) |
| College/Associate Degree | 28 (57.1%) | 21 (42.9%) |
| Bachelor's Degree or higher | 60 (88.2%) | 8 (11.8%) |
Occupancy by Age of Householder in Vienna
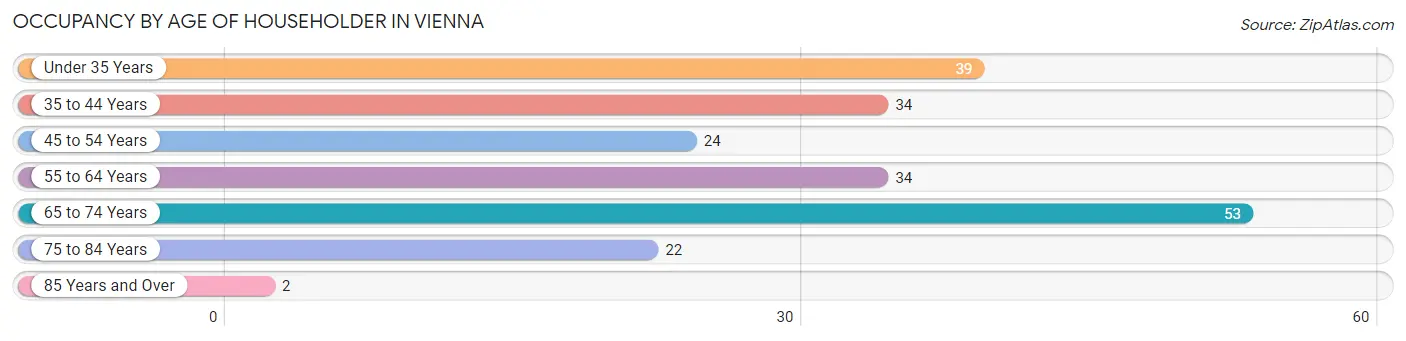
| Age Bracket | # Households | % Households |
| Under 35 Years | 39 | 18.8% |
| 35 to 44 Years | 34 | 16.4% |
| 45 to 54 Years | 24 | 11.5% |
| 55 to 64 Years | 34 | 16.4% |
| 65 to 74 Years | 53 | 25.5% |
| 75 to 84 Years | 22 | 10.6% |
| 85 Years and Over | 2 | 1.0% |
| Total | 208 | 100.0% |
Housing Finances in Vienna
Median Income by Occupancy in Vienna
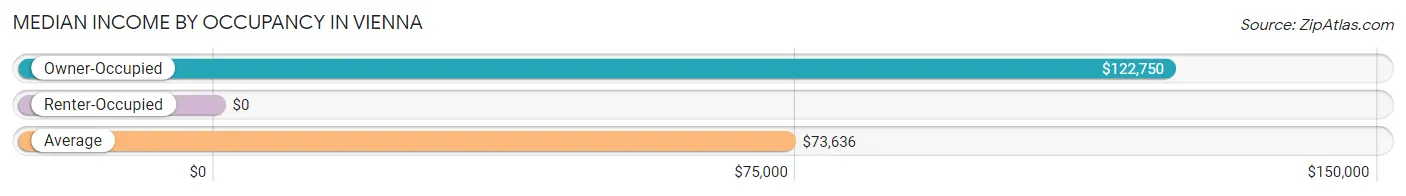
| Occupancy Type | # Households | Median Income |
| Owner-Occupied | 135 (64.9%) | $122,750 |
| Renter-Occupied | 73 (35.1%) | $0 |
| Average | 208 (100.0%) | $73,636 |
Occupancy by Householder Income Bracket in Vienna
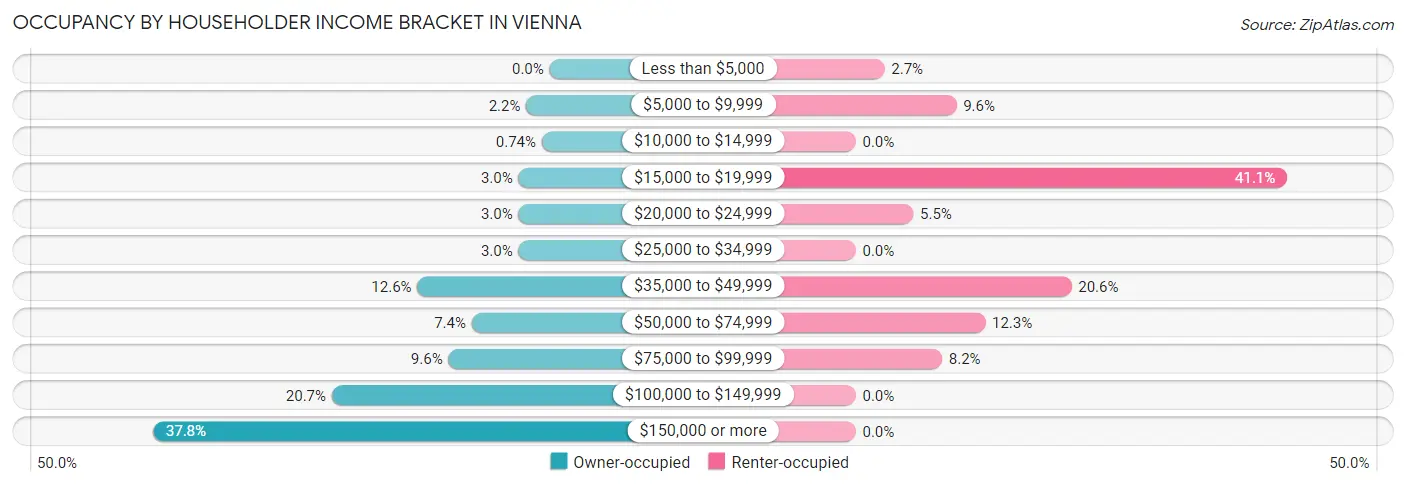
| Income Bracket | Owner-occupied | Renter-occupied |
| Less than $5,000 | 0 (0.0%) | 2 (2.7%) |
| $5,000 to $9,999 | 3 (2.2%) | 7 (9.6%) |
| $10,000 to $14,999 | 1 (0.7%) | 0 (0.0%) |
| $15,000 to $19,999 | 4 (3.0%) | 30 (41.1%) |
| $20,000 to $24,999 | 4 (3.0%) | 4 (5.5%) |
| $25,000 to $34,999 | 4 (3.0%) | 0 (0.0%) |
| $35,000 to $49,999 | 17 (12.6%) | 15 (20.5%) |
| $50,000 to $74,999 | 10 (7.4%) | 9 (12.3%) |
| $75,000 to $99,999 | 13 (9.6%) | 6 (8.2%) |
| $100,000 to $149,999 | 28 (20.7%) | 0 (0.0%) |
| $150,000 or more | 51 (37.8%) | 0 (0.0%) |
| Total | 135 (100.0%) | 73 (100.0%) |
Monthly Housing Cost Tiers in Vienna
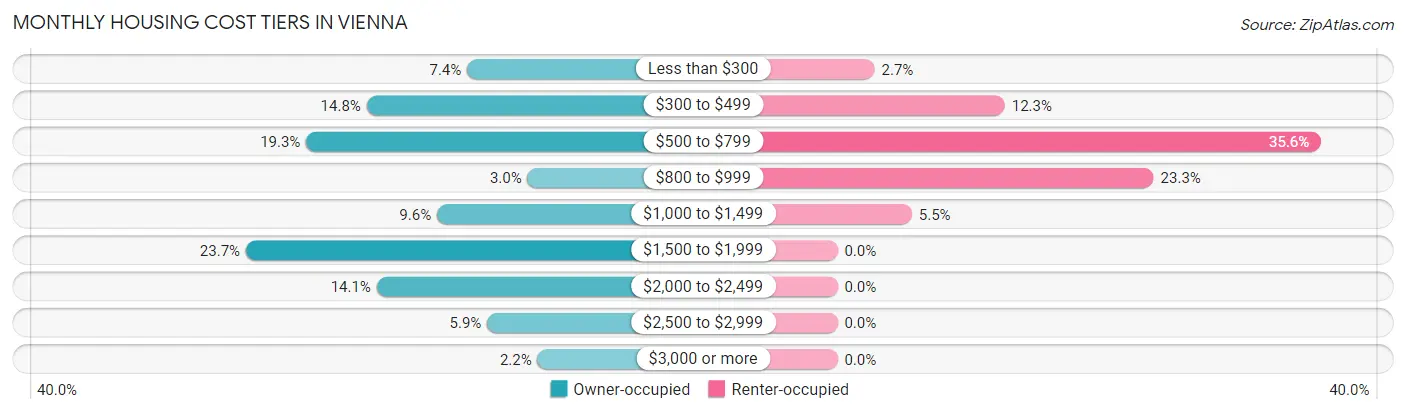
| Monthly Cost | Owner-occupied | Renter-occupied |
| Less than $300 | 10 (7.4%) | 2 (2.7%) |
| $300 to $499 | 20 (14.8%) | 9 (12.3%) |
| $500 to $799 | 26 (19.3%) | 26 (35.6%) |
| $800 to $999 | 4 (3.0%) | 17 (23.3%) |
| $1,000 to $1,499 | 13 (9.6%) | 4 (5.5%) |
| $1,500 to $1,999 | 32 (23.7%) | 0 (0.0%) |
| $2,000 to $2,499 | 19 (14.1%) | 0 (0.0%) |
| $2,500 to $2,999 | 8 (5.9%) | 0 (0.0%) |
| $3,000 or more | 3 (2.2%) | 0 (0.0%) |
| Total | 135 (100.0%) | 73 (100.0%) |
Physical Housing Characteristics in Vienna
Housing Structures in Vienna
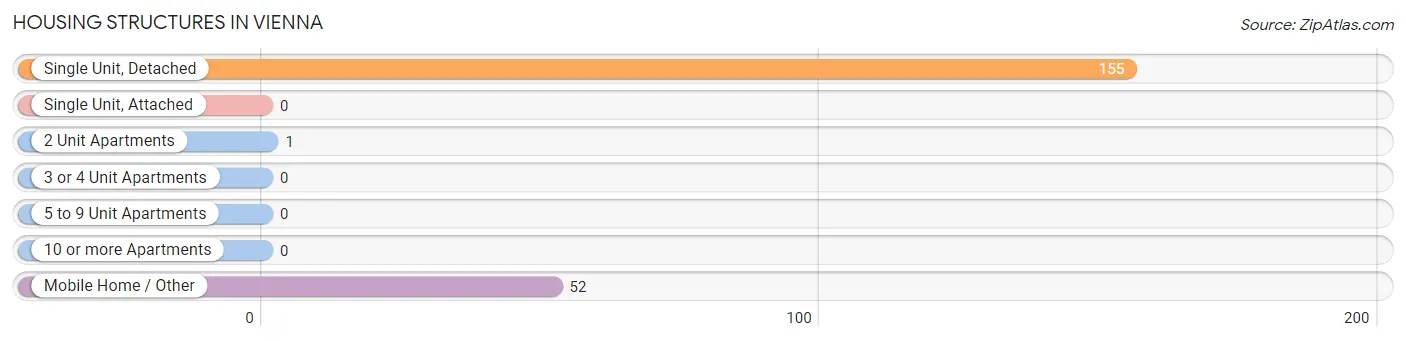
| Structure Type | # Housing Units | % Housing Units |
| Single Unit, Detached | 155 | 74.5% |
| Single Unit, Attached | 0 | 0.0% |
| 2 Unit Apartments | 1 | 0.5% |
| 3 or 4 Unit Apartments | 0 | 0.0% |
| 5 to 9 Unit Apartments | 0 | 0.0% |
| 10 or more Apartments | 0 | 0.0% |
| Mobile Home / Other | 52 | 25.0% |
| Total | 208 | 100.0% |
Housing Structures by Occupancy in Vienna
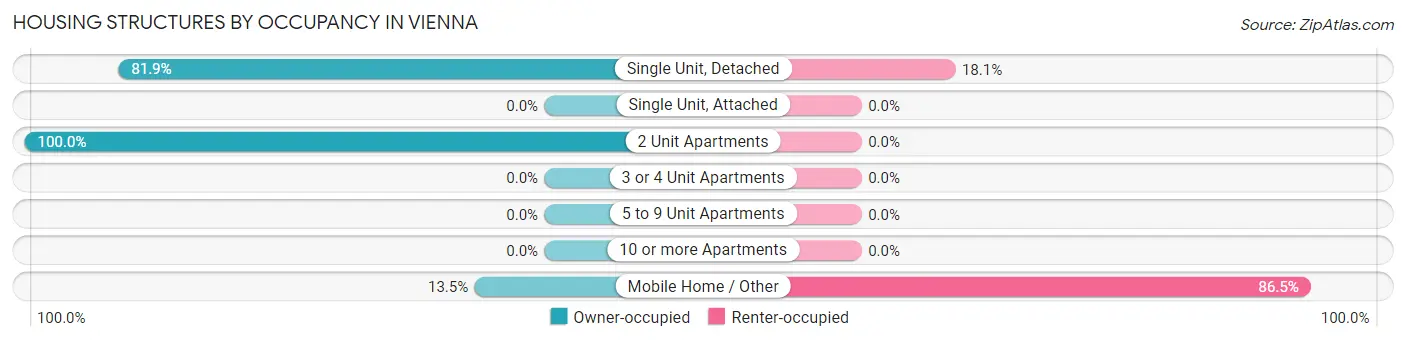
| Structure Type | Owner-occupied | Renter-occupied |
| Single Unit, Detached | 127 (81.9%) | 28 (18.1%) |
| Single Unit, Attached | 0 (0.0%) | 0 (0.0%) |
| 2 Unit Apartments | 1 (100.0%) | 0 (0.0%) |
| 3 or 4 Unit Apartments | 0 (0.0%) | 0 (0.0%) |
| 5 to 9 Unit Apartments | 0 (0.0%) | 0 (0.0%) |
| 10 or more Apartments | 0 (0.0%) | 0 (0.0%) |
| Mobile Home / Other | 7 (13.5%) | 45 (86.5%) |
| Total | 135 (64.9%) | 73 (35.1%) |
Housing Structures by Number of Rooms in Vienna
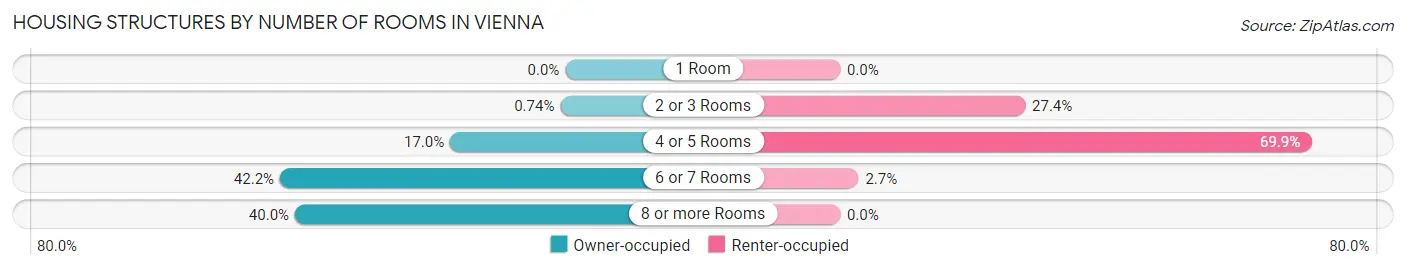
| Number of Rooms | Owner-occupied | Renter-occupied |
| 1 Room | 0 (0.0%) | 0 (0.0%) |
| 2 or 3 Rooms | 1 (0.7%) | 20 (27.4%) |
| 4 or 5 Rooms | 23 (17.0%) | 51 (69.9%) |
| 6 or 7 Rooms | 57 (42.2%) | 2 (2.7%) |
| 8 or more Rooms | 54 (40.0%) | 0 (0.0%) |
| Total | 135 (100.0%) | 73 (100.0%) |
Housing Structure by Heating Type in Vienna
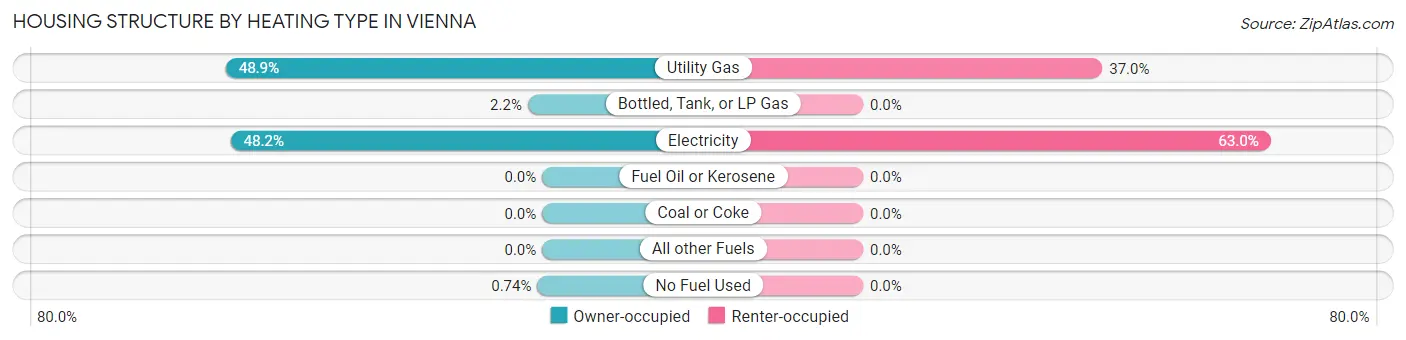
| Heating Type | Owner-occupied | Renter-occupied |
| Utility Gas | 66 (48.9%) | 27 (37.0%) |
| Bottled, Tank, or LP Gas | 3 (2.2%) | 0 (0.0%) |
| Electricity | 65 (48.1%) | 46 (63.0%) |
| Fuel Oil or Kerosene | 0 (0.0%) | 0 (0.0%) |
| Coal or Coke | 0 (0.0%) | 0 (0.0%) |
| All other Fuels | 0 (0.0%) | 0 (0.0%) |
| No Fuel Used | 1 (0.7%) | 0 (0.0%) |
| Total | 135 (100.0%) | 73 (100.0%) |
Household Vehicle Usage in Vienna
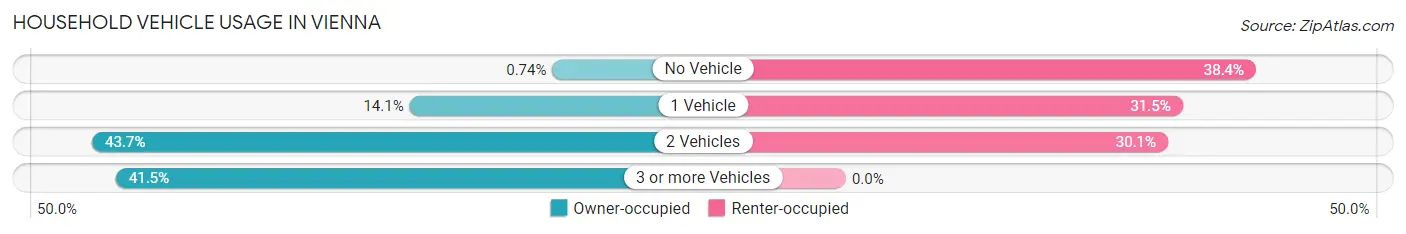
| Vehicles per Household | Owner-occupied | Renter-occupied |
| No Vehicle | 1 (0.7%) | 28 (38.4%) |
| 1 Vehicle | 19 (14.1%) | 23 (31.5%) |
| 2 Vehicles | 59 (43.7%) | 22 (30.1%) |
| 3 or more Vehicles | 56 (41.5%) | 0 (0.0%) |
| Total | 135 (100.0%) | 73 (100.0%) |
Real Estate & Mortgages in Vienna
Real Estate and Mortgage Overview in Vienna
| Characteristic | Without Mortgage | With Mortgage |
| Housing Units | 53 | 82 |
| Median Property Value | $243,800 | $333,300 |
| Median Household Income | $70,625 | $45 |
| Monthly Housing Costs | $413 | $1 |
| Real Estate Taxes | - | - |
Property Value by Mortgage Status in Vienna
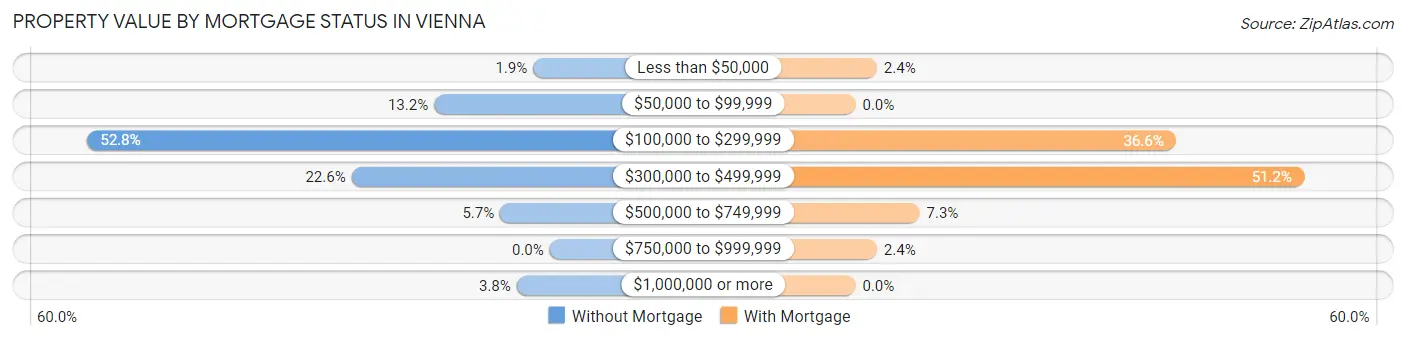
| Property Value | Without Mortgage | With Mortgage |
| Less than $50,000 | 1 (1.9%) | 2 (2.4%) |
| $50,000 to $99,999 | 7 (13.2%) | 0 (0.0%) |
| $100,000 to $299,999 | 28 (52.8%) | 30 (36.6%) |
| $300,000 to $499,999 | 12 (22.6%) | 42 (51.2%) |
| $500,000 to $749,999 | 3 (5.7%) | 6 (7.3%) |
| $750,000 to $999,999 | 0 (0.0%) | 2 (2.4%) |
| $1,000,000 or more | 2 (3.8%) | 0 (0.0%) |
| Total | 53 (100.0%) | 82 (100.0%) |
Household Income by Mortgage Status in Vienna
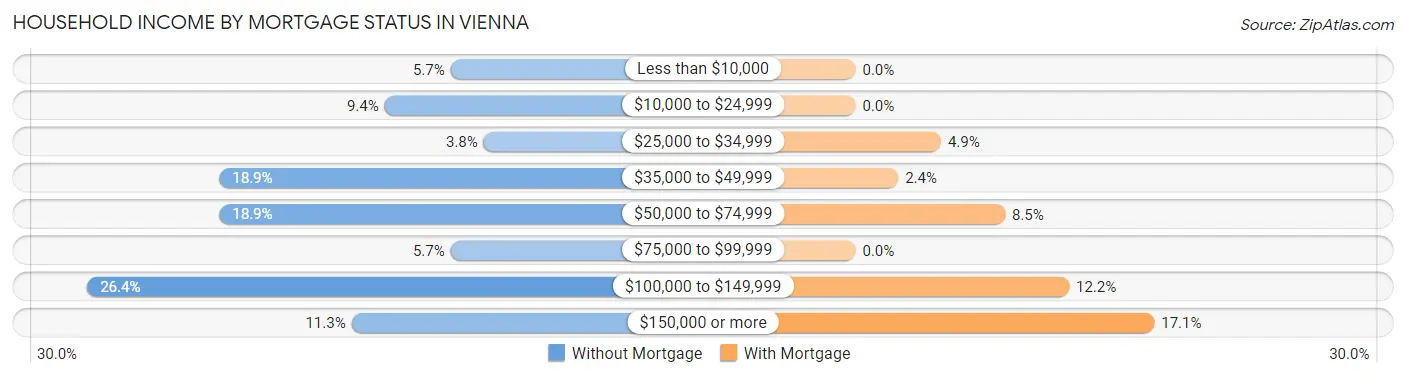
| Household Income | Without Mortgage | With Mortgage |
| Less than $10,000 | 3 (5.7%) | 0 (0.0%) |
| $10,000 to $24,999 | 5 (9.4%) | 0 (0.0%) |
| $25,000 to $34,999 | 2 (3.8%) | 4 (4.9%) |
| $35,000 to $49,999 | 10 (18.9%) | 2 (2.4%) |
| $50,000 to $74,999 | 10 (18.9%) | 7 (8.5%) |
| $75,000 to $99,999 | 3 (5.7%) | 0 (0.0%) |
| $100,000 to $149,999 | 14 (26.4%) | 10 (12.2%) |
| $150,000 or more | 6 (11.3%) | 14 (17.1%) |
| Total | 53 (100.0%) | 82 (100.0%) |
Property Value to Household Income Ratio in Vienna
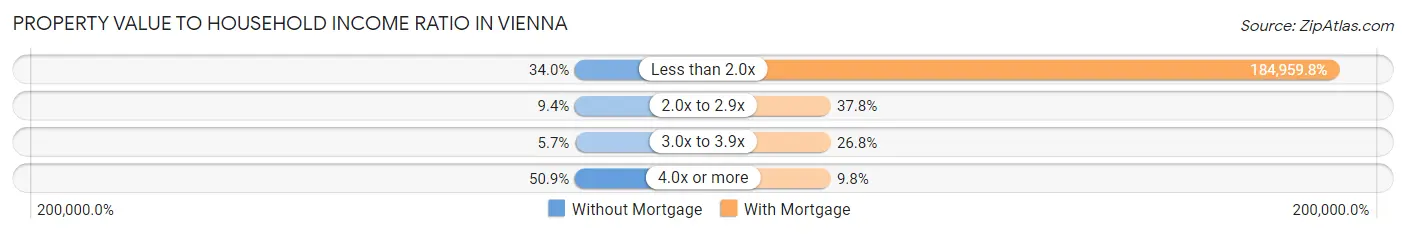
| Value-to-Income Ratio | Without Mortgage | With Mortgage |
| Less than 2.0x | 18 (34.0%) | 151,667 (184,959.8%) |
| 2.0x to 2.9x | 5 (9.4%) | 31 (37.8%) |
| 3.0x to 3.9x | 3 (5.7%) | 22 (26.8%) |
| 4.0x or more | 27 (50.9%) | 8 (9.8%) |
| Total | 53 (100.0%) | 82 (100.0%) |
Real Estate Taxes by Mortgage Status in Vienna
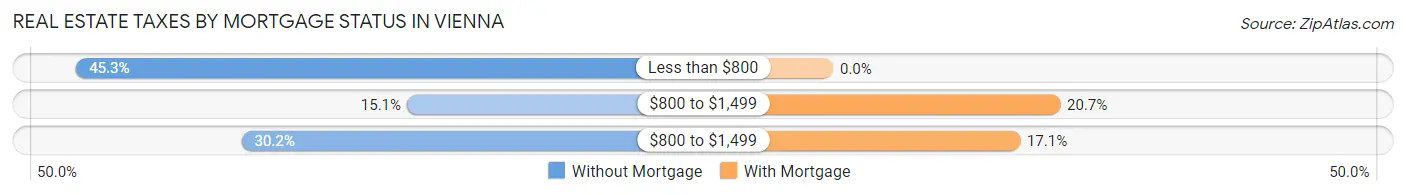
| Property Taxes | Without Mortgage | With Mortgage |
| Less than $800 | 24 (45.3%) | 0 (0.0%) |
| $800 to $1,499 | 8 (15.1%) | 17 (20.7%) |
| $800 to $1,499 | 16 (30.2%) | 14 (17.1%) |
| Total | 53 (100.0%) | 82 (100.0%) |
Health & Disability in Vienna
Health Insurance Coverage by Age in Vienna
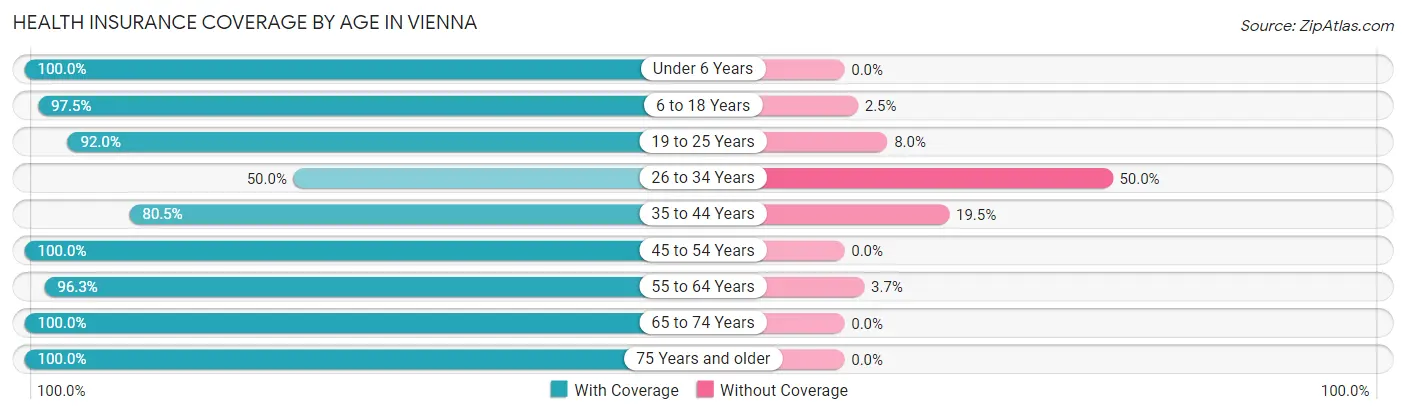
| Age Bracket | With Coverage | Without Coverage |
| Under 6 Years | 27 (100.0%) | 0 (0.0%) |
| 6 to 18 Years | 116 (97.5%) | 3 (2.5%) |
| 19 to 25 Years | 23 (92.0%) | 2 (8.0%) |
| 26 to 34 Years | 24 (50.0%) | 24 (50.0%) |
| 35 to 44 Years | 70 (80.5%) | 17 (19.5%) |
| 45 to 54 Years | 93 (100.0%) | 0 (0.0%) |
| 55 to 64 Years | 52 (96.3%) | 2 (3.7%) |
| 65 to 74 Years | 97 (100.0%) | 0 (0.0%) |
| 75 Years and older | 37 (100.0%) | 0 (0.0%) |
| Total | 539 (91.8%) | 48 (8.2%) |
Health Insurance Coverage by Citizenship Status in Vienna
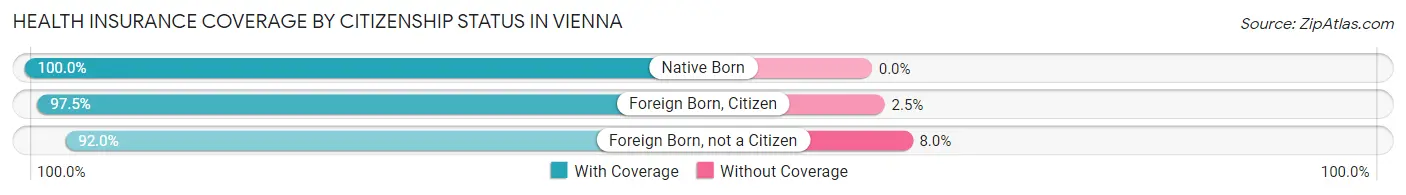
| Citizenship Status | With Coverage | Without Coverage |
| Native Born | 27 (100.0%) | 0 (0.0%) |
| Foreign Born, Citizen | 116 (97.5%) | 3 (2.5%) |
| Foreign Born, not a Citizen | 23 (92.0%) | 2 (8.0%) |
Health Insurance Coverage by Household Income in Vienna
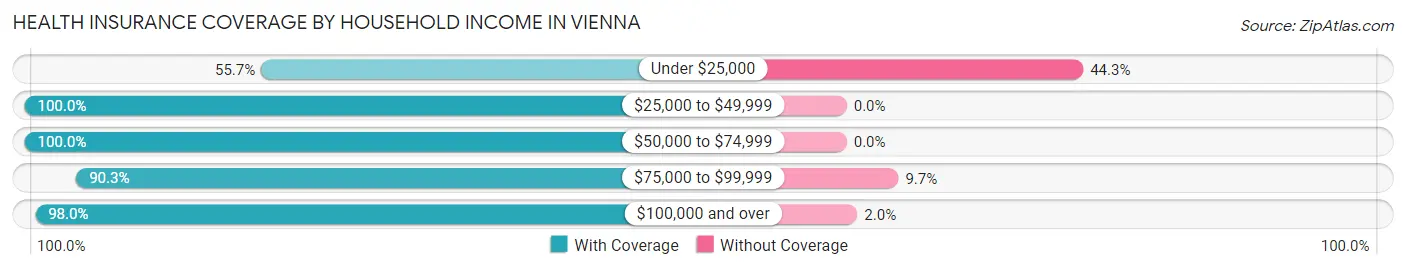
| Household Income | With Coverage | Without Coverage |
| Under $25,000 | 44 (55.7%) | 35 (44.3%) |
| $25,000 to $49,999 | 67 (100.0%) | 0 (0.0%) |
| $50,000 to $74,999 | 27 (100.0%) | 0 (0.0%) |
| $75,000 to $99,999 | 56 (90.3%) | 6 (9.7%) |
| $100,000 and over | 345 (98.0%) | 7 (2.0%) |
Public vs Private Health Insurance Coverage by Age in Vienna
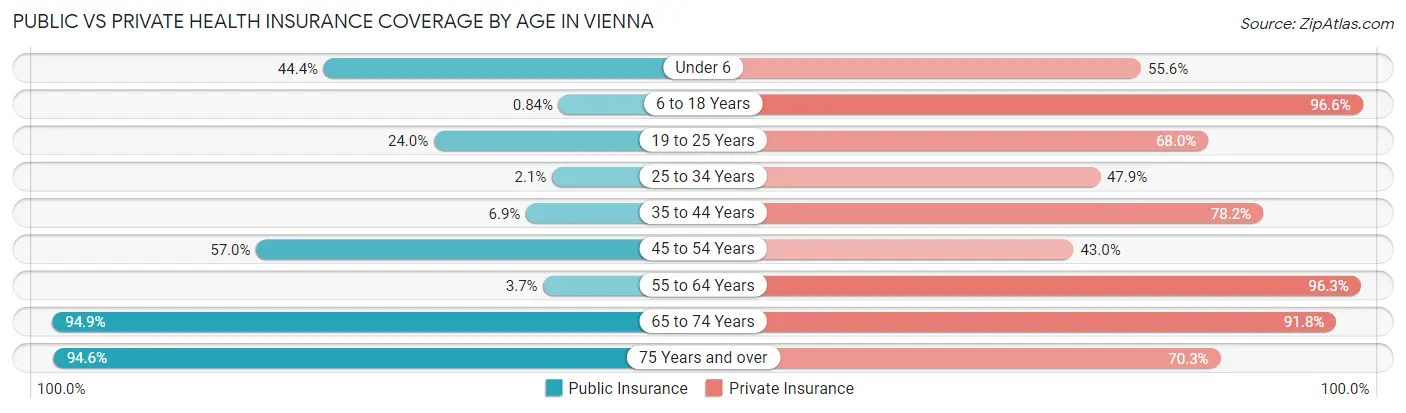
| Age Bracket | Public Insurance | Private Insurance |
| Under 6 | 12 (44.4%) | 15 (55.6%) |
| 6 to 18 Years | 1 (0.8%) | 115 (96.6%) |
| 19 to 25 Years | 6 (24.0%) | 17 (68.0%) |
| 25 to 34 Years | 1 (2.1%) | 23 (47.9%) |
| 35 to 44 Years | 6 (6.9%) | 68 (78.2%) |
| 45 to 54 Years | 53 (57.0%) | 40 (43.0%) |
| 55 to 64 Years | 2 (3.7%) | 52 (96.3%) |
| 65 to 74 Years | 92 (94.9%) | 89 (91.7%) |
| 75 Years and over | 35 (94.6%) | 26 (70.3%) |
| Total | 208 (35.4%) | 445 (75.8%) |
Disability Status by Sex by Age in Vienna
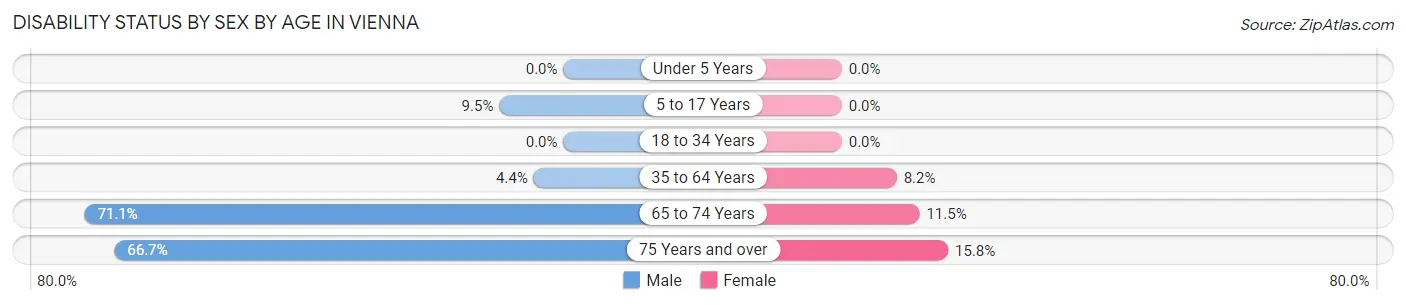
| Age Bracket | Male | Female |
| Under 5 Years | 0 (0.0%) | 0 (0.0%) |
| 5 to 17 Years | 8 (9.5%) | 0 (0.0%) |
| 18 to 34 Years | 0 (0.0%) | 0 (0.0%) |
| 35 to 64 Years | 6 (4.4%) | 8 (8.2%) |
| 65 to 74 Years | 32 (71.1%) | 6 (11.5%) |
| 75 Years and over | 12 (66.7%) | 3 (15.8%) |
Disability Class by Sex by Age in Vienna
Disability Class: Hearing Difficulty
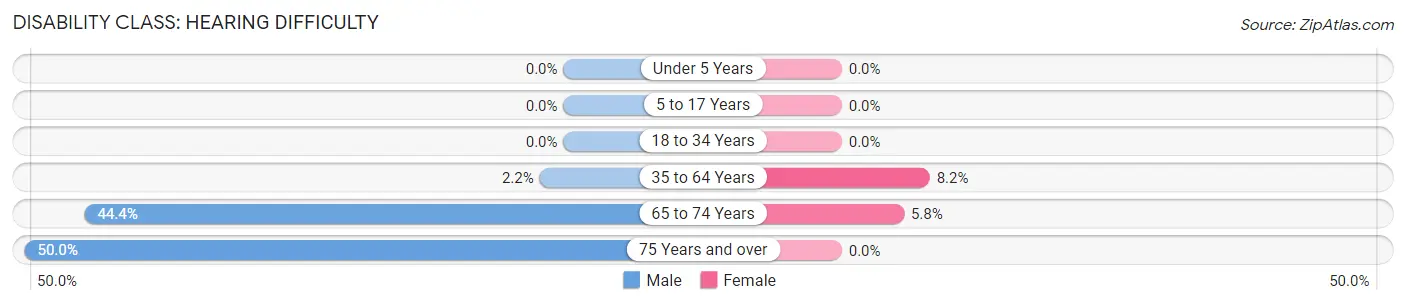
| Age Bracket | Male | Female |
| Under 5 Years | 0 (0.0%) | 0 (0.0%) |
| 5 to 17 Years | 0 (0.0%) | 0 (0.0%) |
| 18 to 34 Years | 0 (0.0%) | 0 (0.0%) |
| 35 to 64 Years | 3 (2.2%) | 8 (8.2%) |
| 65 to 74 Years | 20 (44.4%) | 3 (5.8%) |
| 75 Years and over | 9 (50.0%) | 0 (0.0%) |
Disability Class: Vision Difficulty
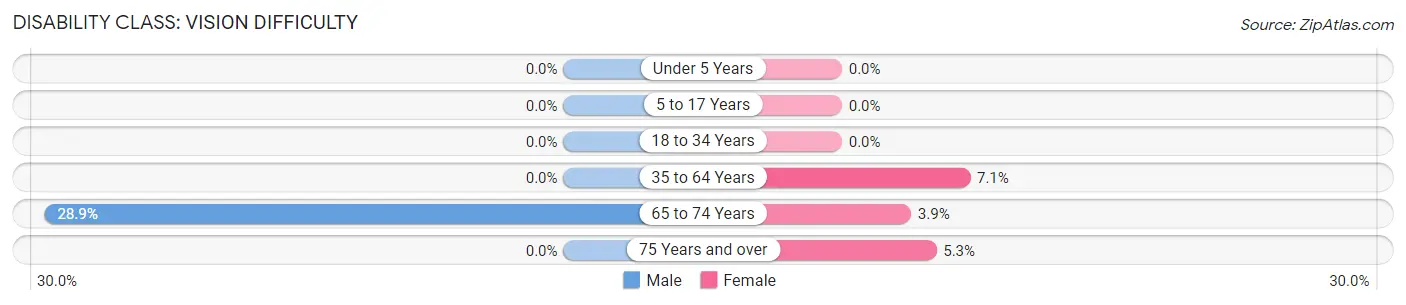
| Age Bracket | Male | Female |
| Under 5 Years | 0 (0.0%) | 0 (0.0%) |
| 5 to 17 Years | 0 (0.0%) | 0 (0.0%) |
| 18 to 34 Years | 0 (0.0%) | 0 (0.0%) |
| 35 to 64 Years | 0 (0.0%) | 7 (7.1%) |
| 65 to 74 Years | 13 (28.9%) | 2 (3.8%) |
| 75 Years and over | 0 (0.0%) | 1 (5.3%) |
Disability Class: Cognitive Difficulty
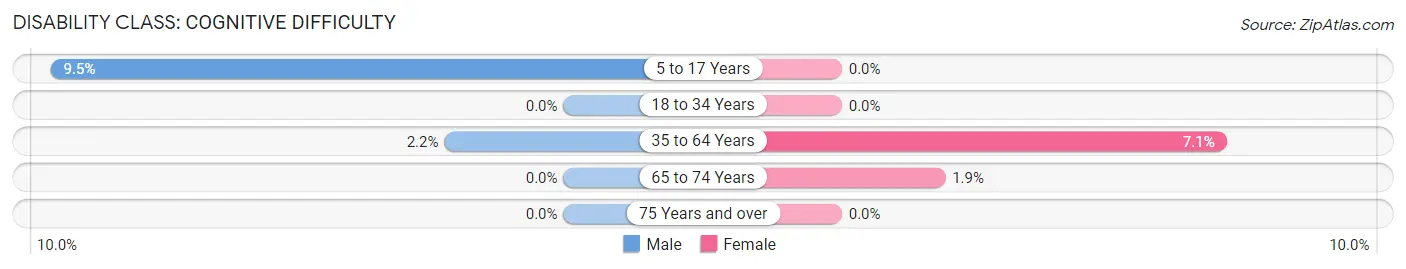
| Age Bracket | Male | Female |
| 5 to 17 Years | 8 (9.5%) | 0 (0.0%) |
| 18 to 34 Years | 0 (0.0%) | 0 (0.0%) |
| 35 to 64 Years | 3 (2.2%) | 7 (7.1%) |
| 65 to 74 Years | 0 (0.0%) | 1 (1.9%) |
| 75 Years and over | 0 (0.0%) | 0 (0.0%) |
Disability Class: Ambulatory Difficulty
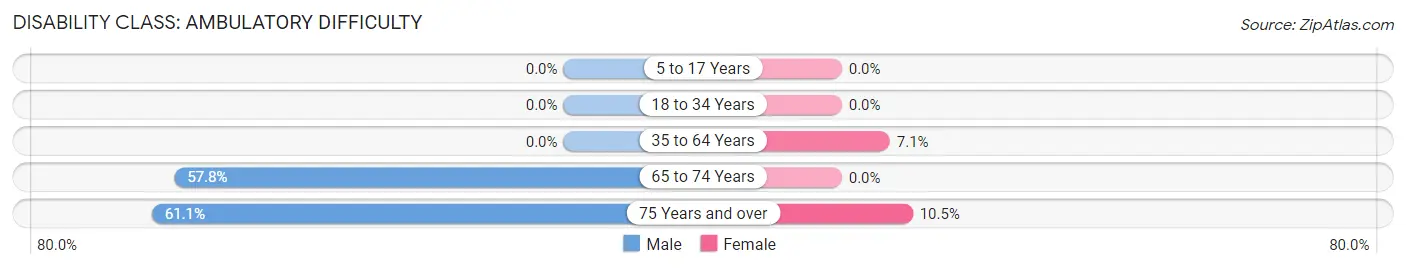
| Age Bracket | Male | Female |
| 5 to 17 Years | 0 (0.0%) | 0 (0.0%) |
| 18 to 34 Years | 0 (0.0%) | 0 (0.0%) |
| 35 to 64 Years | 0 (0.0%) | 7 (7.1%) |
| 65 to 74 Years | 26 (57.8%) | 0 (0.0%) |
| 75 Years and over | 11 (61.1%) | 2 (10.5%) |
Disability Class: Self-Care Difficulty
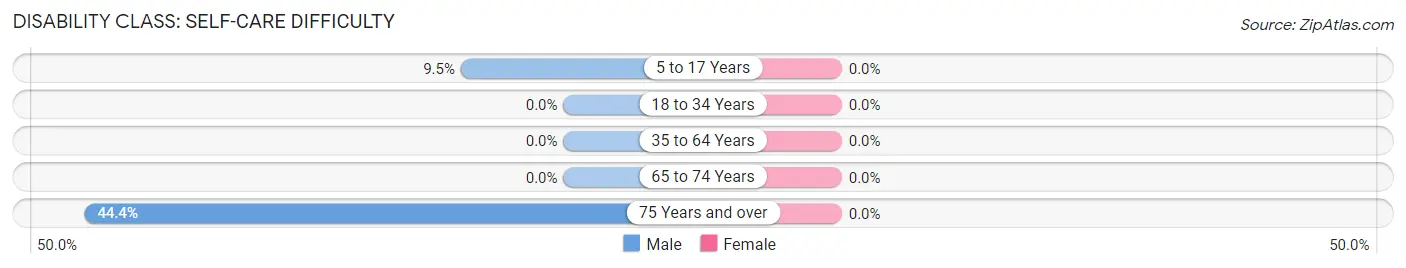
| Age Bracket | Male | Female |
| 5 to 17 Years | 8 (9.5%) | 0 (0.0%) |
| 18 to 34 Years | 0 (0.0%) | 0 (0.0%) |
| 35 to 64 Years | 0 (0.0%) | 0 (0.0%) |
| 65 to 74 Years | 0 (0.0%) | 0 (0.0%) |
| 75 Years and over | 8 (44.4%) | 0 (0.0%) |
Technology Access in Vienna
Computing Device Access in Vienna
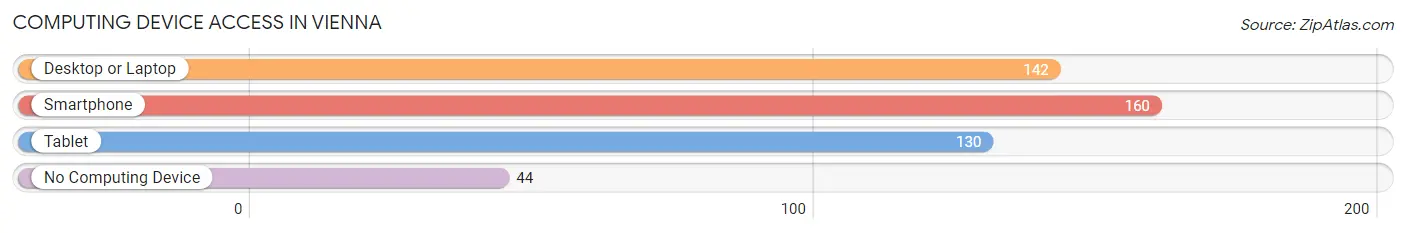
| Device Type | # Households | % Households |
| Desktop or Laptop | 142 | 68.3% |
| Smartphone | 160 | 76.9% |
| Tablet | 130 | 62.5% |
| No Computing Device | 44 | 21.1% |
| Total | 208 | 100.0% |
Internet Access in Vienna
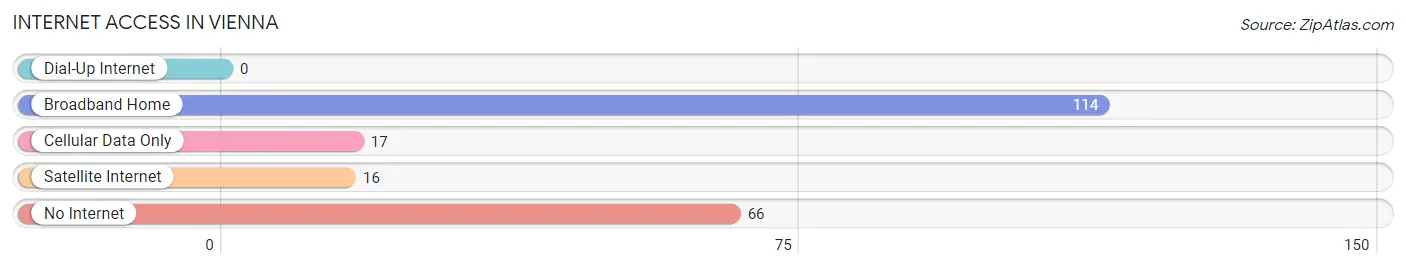
| Internet Type | # Households | % Households |
| Dial-Up Internet | 0 | 0.0% |
| Broadband Home | 114 | 54.8% |
| Cellular Data Only | 17 | 8.2% |
| Satellite Internet | 16 | 7.7% |
| No Internet | 66 | 31.7% |
| Total | 208 | 100.0% |
Vienna Summary
Vienna is a small town located in the state of Louisiana, in the United States. It is situated in the northern part of the state, in the parish of Rapides. The town has a population of around 1,500 people, and is part of the Alexandria Metropolitan Statistical Area.
History
The town of Vienna was founded in 1845 by a group of settlers from the nearby town of Alexandria. The settlers were looking for a place to settle and start a new life, and Vienna seemed to fit the bill. The town was named after the city of Vienna, Austria, and was originally known as Vienna Station. The town was officially incorporated in 1848, and the first mayor was elected in 1849.
The town grew slowly but steadily over the years, and by the early 1900s, it had become a thriving community. The town was home to a variety of businesses, including a cotton gin, a sawmill, and a gristmill. The town also had a post office, a bank, and a hotel.
Geography
Vienna is located in the northern part of the state of Louisiana, in the parish of Rapides. The town is situated on the banks of the Red River, and is surrounded by a number of small towns and villages. The town is located about 25 miles north of Alexandria, and about 50 miles south of Shreveport.
The town is located in a flat, low-lying area, and is surrounded by a number of small lakes and ponds. The town is also located near the Kisatchie National Forest, which is a popular destination for outdoor activities such as camping, fishing, and hiking.
Economy
The economy of Vienna is largely based on agriculture. The town is home to a number of farms, which produce a variety of crops, including cotton, corn, soybeans, and wheat. The town is also home to a number of small businesses, including restaurants, stores, and service providers.
The town is also home to a number of manufacturing companies, which produce a variety of products, including furniture, clothing, and electronics. The town is also home to a number of oil and gas companies, which are involved in the exploration and production of oil and gas in the area.
Demographics
As of the 2010 census, the population of Vienna was 1,500 people. The town is predominantly white, with around 90% of the population being white. The town is also home to a small African American population, which makes up around 5% of the population. The town is also home to a small Hispanic population, which makes up around 3% of the population.
The town has a median household income of around $35,000, and the median home value is around $90,000. The town has a low unemployment rate, and the majority of the population is employed in either the agricultural or manufacturing sectors.
Conclusion
Vienna is a small town located in the northern part of the state of Louisiana, in the parish of Rapides. The town has a population of around 1,500 people, and is part of the Alexandria Metropolitan Statistical Area. The town is predominantly white, with around 90% of the population being white. The town is also home to a small African American population, which makes up around 5% of the population. The town is also home to a small Hispanic population, which makes up around 3% of the population. The town has a median household income of around $35,000, and the median home value is around $90,000. The town has a low unemployment rate, and the majority of the population is employed in either the agricultural or manufacturing sectors. Vienna is a small but thriving town, and is a great place to live and work.
Common Questions
What is Per Capita Income in Vienna?
Per Capita income in Vienna is $42,882.
What is the Median Family Income in Vienna?
Median Family Income in Vienna is $113,194.
What is the Median Household income in Vienna?
Median Household Income in Vienna is $73,636.
What is Income or Wage Gap in Vienna?
Income or Wage Gap in Vienna is 53.4%.
Women in Vienna earn 46.6 cents for every dollar earned by a man.
What is Inequality or Gini Index in Vienna?
Inequality or Gini Index in Vienna is 0.48.
What is the Total Population of Vienna?
Total Population of Vienna is 587.
What is the Total Male Population of Vienna?
Total Male Population of Vienna is 342.
What is the Total Female Population of Vienna?
Total Female Population of Vienna is 245.
What is the Ratio of Males per 100 Females in Vienna?
There are 139.59 Males per 100 Females in Vienna.
What is the Ratio of Females per 100 Males in Vienna?
There are 71.64 Females per 100 Males in Vienna.
What is the Median Population Age in Vienna?
Median Population Age in Vienna is 43.1 Years.
What is the Average Family Size in Vienna
Average Family Size in Vienna is 3.6 People.
What is the Average Household Size in Vienna
Average Household Size in Vienna is 2.8 People.
How Large is the Labor Force in Vienna?
There are 304 People in the Labor Forcein in Vienna.
What is the Percentage of People in the Labor Force in Vienna?
66.2% of People are in the Labor Force in Vienna.
What is the Unemployment Rate in Vienna?
Unemployment Rate in Vienna is 1.0%.