Bel Aire, KS Map & Demographics
Bel Aire Map
Bel Aire Overview
$38,514
PER CAPITA INCOME
$109,438
AVG FAMILY INCOME
$91,979
AVG HOUSEHOLD INCOME
31.5%
WAGE / INCOME GAP [ % ]
68.5¢/ $1
WAGE / INCOME GAP [ $ ]
0.37
INEQUALITY / GINI INDEX
8,341
TOTAL POPULATION
4,109
MALE POPULATION
4,232
FEMALE POPULATION
97.09
MALES / 100 FEMALES
102.99
FEMALES / 100 MALES
34.7
MEDIAN AGE
3.3
AVG FAMILY SIZE
2.9
AVG HOUSEHOLD SIZE
4,416
LABOR FORCE [ PEOPLE ]
69.7%
PERCENT IN LABOR FORCE
2.3%
UNEMPLOYMENT RATE
Bel Aire Area Codes
Income in Bel Aire
Income Overview in Bel Aire
Per Capita Income in Bel Aire is $38,514, while median incomes of families and households are $109,438 and $91,979 respectively.
| Characteristic | Number | Measure |
| Per Capita Income | 8,341 | $38,514 |
| Median Family Income | 2,185 | $109,438 |
| Mean Family Income | 2,185 | $124,043 |
| Median Household Income | 2,911 | $91,979 |
| Mean Household Income | 2,911 | $108,401 |
| Income Deficit | 2,185 | $0 |
| Wage / Income Gap (%) | 8,341 | 31.46% |
| Wage / Income Gap ($) | 8,341 | 68.54¢ per $1 |
| Gini / Inequality Index | 8,341 | 0.37 |
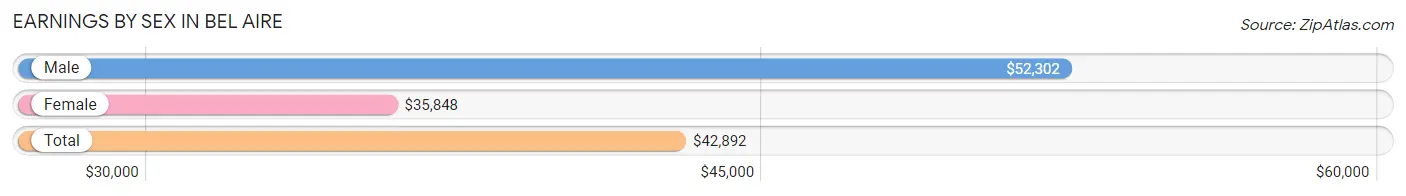
Earnings by Sex in Bel Aire
Average Earnings in Bel Aire are $42,892, $52,302 for men and $35,848 for women, a difference of 31.5%.
| Sex | Number | Average Earnings |
| Male | 2,241 (49.4%) | $52,302 |
| Female | 2,293 (50.6%) | $35,848 |
| Total | 4,534 (100.0%) | $42,892 |
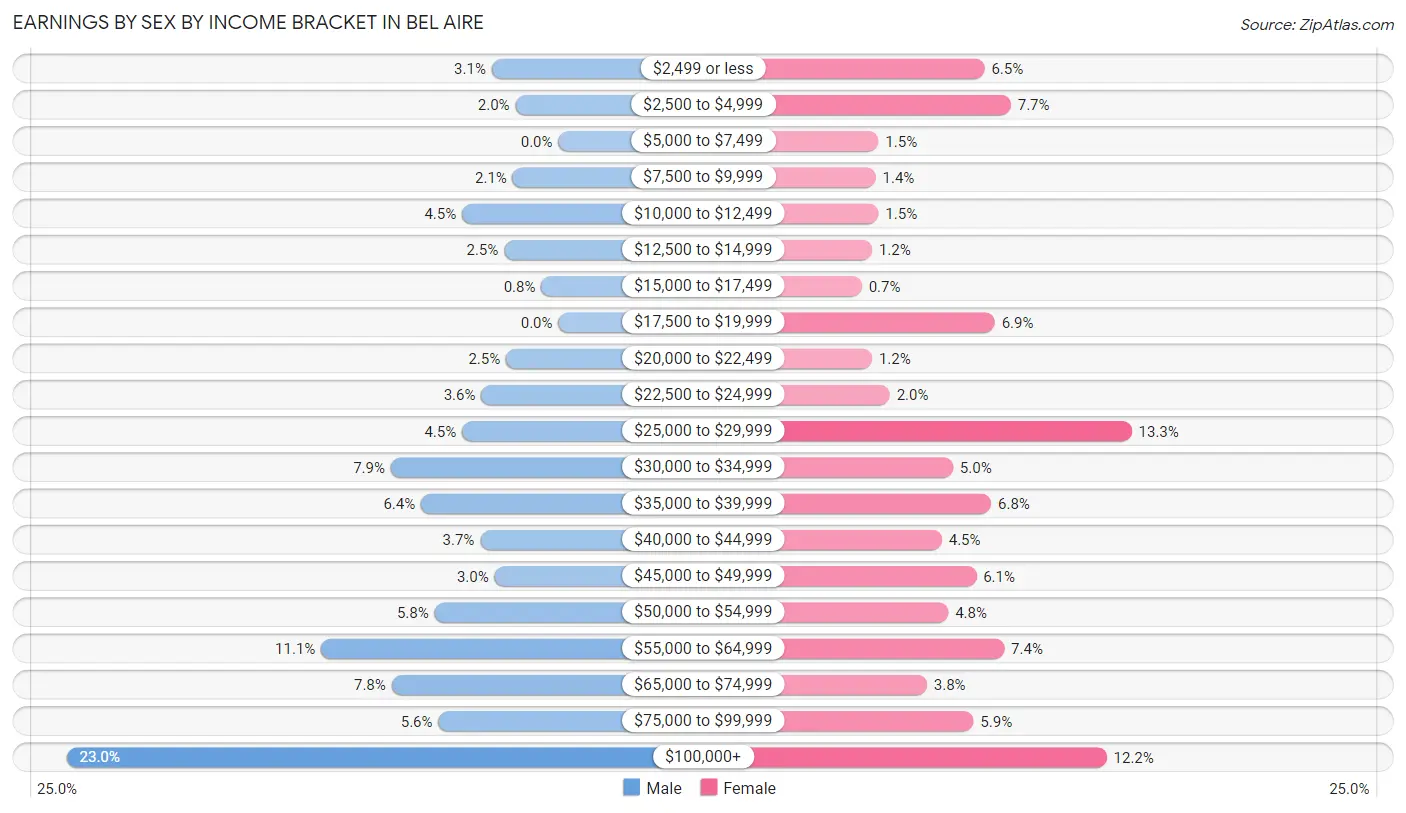
Earnings by Sex by Income Bracket in Bel Aire
The most common earnings brackets in Bel Aire are $100,000+ for men (516 | 23.0%) and $25,000 to $29,999 for women (306 | 13.3%).
| Income | Male | Female |
| $2,499 or less | 70 (3.1%) | 148 (6.5%) |
| $2,500 to $4,999 | 45 (2.0%) | 176 (7.7%) |
| $5,000 to $7,499 | 0 (0.0%) | 34 (1.5%) |
| $7,500 to $9,999 | 48 (2.1%) | 31 (1.3%) |
| $10,000 to $12,499 | 101 (4.5%) | 34 (1.5%) |
| $12,500 to $14,999 | 57 (2.5%) | 27 (1.2%) |
| $15,000 to $17,499 | 18 (0.8%) | 16 (0.7%) |
| $17,500 to $19,999 | 0 (0.0%) | 159 (6.9%) |
| $20,000 to $22,499 | 55 (2.5%) | 27 (1.2%) |
| $22,500 to $24,999 | 81 (3.6%) | 46 (2.0%) |
| $25,000 to $29,999 | 101 (4.5%) | 306 (13.3%) |
| $30,000 to $34,999 | 176 (7.9%) | 114 (5.0%) |
| $35,000 to $39,999 | 144 (6.4%) | 155 (6.8%) |
| $40,000 to $44,999 | 82 (3.7%) | 102 (4.4%) |
| $45,000 to $49,999 | 67 (3.0%) | 139 (6.1%) |
| $50,000 to $54,999 | 130 (5.8%) | 109 (4.8%) |
| $55,000 to $64,999 | 249 (11.1%) | 169 (7.4%) |
| $65,000 to $74,999 | 175 (7.8%) | 86 (3.7%) |
| $75,000 to $99,999 | 126 (5.6%) | 136 (5.9%) |
| $100,000+ | 516 (23.0%) | 279 (12.2%) |
| Total | 2,241 (100.0%) | 2,293 (100.0%) |
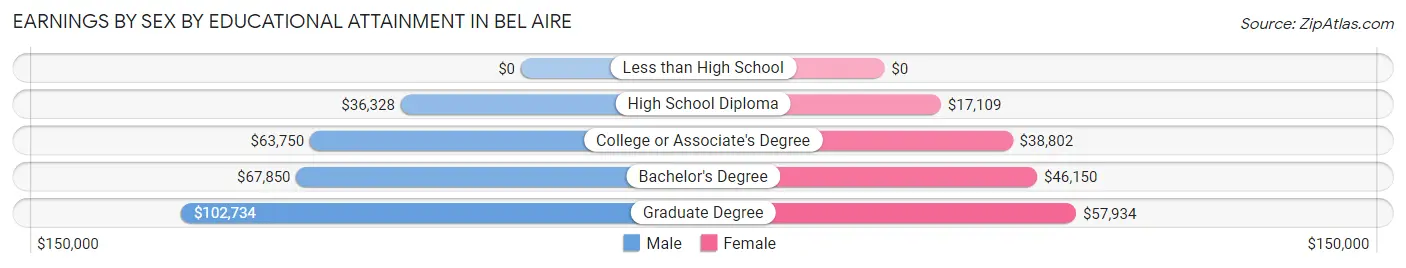
Earnings by Sex by Educational Attainment in Bel Aire
Average earnings in Bel Aire are $59,632 for men and $43,792 for women, a difference of 26.6%. Men with an educational attainment of graduate degree enjoy the highest average annual earnings of $102,734, while those with high school diploma education earn the least with $36,328. Women with an educational attainment of graduate degree earn the most with the average annual earnings of $57,934, while those with high school diploma education have the smallest earnings of $17,109.
| Educational Attainment | Male Income | Female Income |
| Less than High School | - | - |
| High School Diploma | $36,328 | $17,109 |
| College or Associate's Degree | $63,750 | $38,802 |
| Bachelor's Degree | $67,850 | $46,150 |
| Graduate Degree | $102,734 | $57,934 |
| Total | $59,632 | $43,792 |
Family Income in Bel Aire
Family Income Brackets in Bel Aire
According to the Bel Aire family income data, there are 507 families falling into the $100,000 to $149,999 income range, which is the most common income bracket and makes up 23.2% of all families. Conversely, the $10,000 to $14,999 income bracket is the least frequent group with only 28 families (1.3%) belonging to this category.
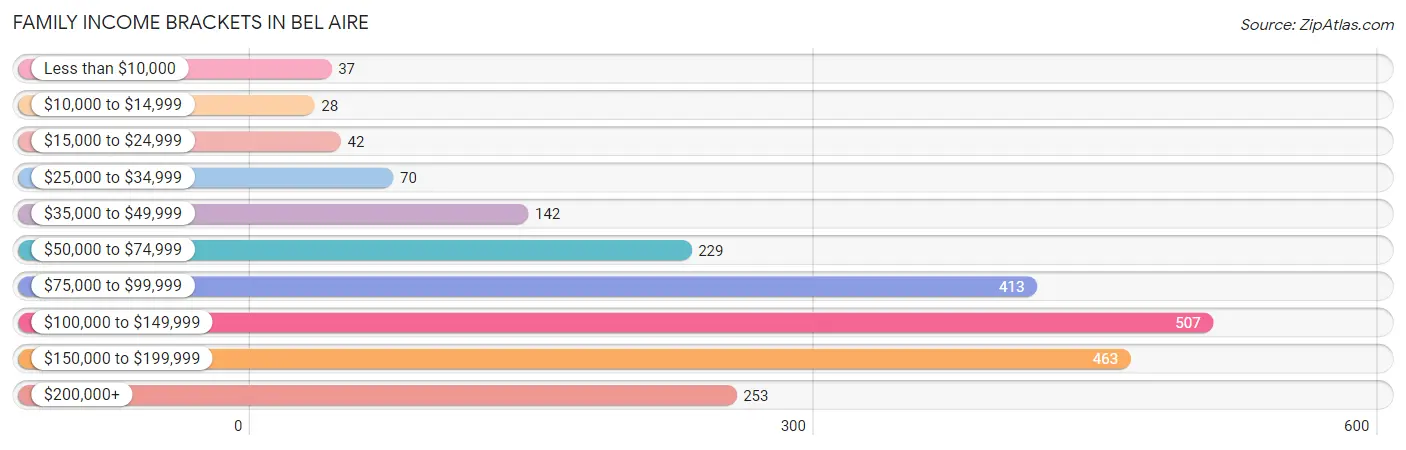
| Income Bracket | # Families | % Families |
| Less than $10,000 | 37 | 1.7% |
| $10,000 to $14,999 | 28 | 1.3% |
| $15,000 to $24,999 | 42 | 1.9% |
| $25,000 to $34,999 | 70 | 3.2% |
| $35,000 to $49,999 | 142 | 6.5% |
| $50,000 to $74,999 | 229 | 10.5% |
| $75,000 to $99,999 | 413 | 18.9% |
| $100,000 to $149,999 | 507 | 23.2% |
| $150,000 to $199,999 | 463 | 21.2% |
| $200,000+ | 253 | 11.6% |
Family Income by Famaliy Size in Bel Aire
4-person families (389 | 17.8%) account for the highest median family income in Bel Aire with $136,339 per family, while 2-person families (905 | 41.4%) have the highest median income of $47,014 per family member.
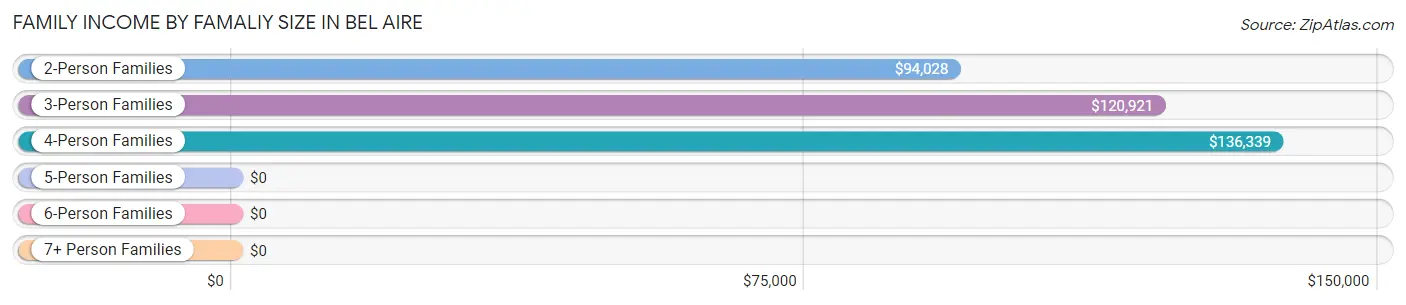
| Income Bracket | # Families | Median Income |
| 2-Person Families | 905 (41.4%) | $94,028 |
| 3-Person Families | 534 (24.4%) | $120,921 |
| 4-Person Families | 389 (17.8%) | $136,339 |
| 5-Person Families | 247 (11.3%) | $0 |
| 6-Person Families | 80 (3.7%) | $0 |
| 7+ Person Families | 30 (1.4%) | $0 |
| Total | 2,185 (100.0%) | $109,438 |
Family Income by Number of Earners in Bel Aire
The median family income in Bel Aire is $109,438, with families comprising 3+ earners (319) having the highest median family income of $184,297, while families with 1 earner (559) have the lowest median family income of $78,297, accounting for 14.6% and 25.6% of families, respectively.
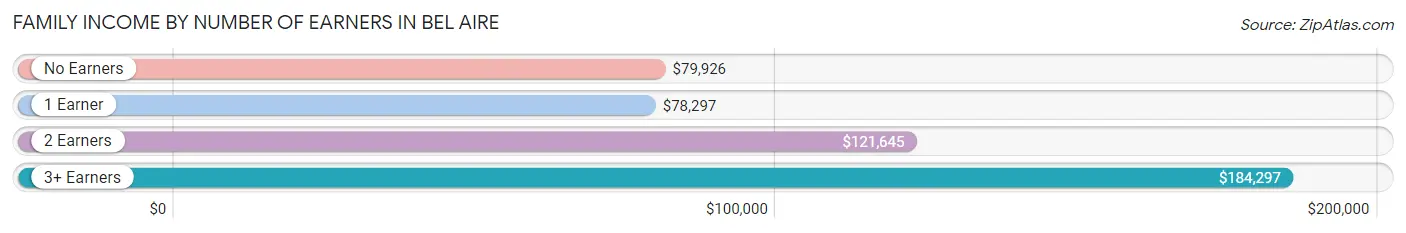
| Number of Earners | # Families | Median Income |
| No Earners | 235 (10.8%) | $79,926 |
| 1 Earner | 559 (25.6%) | $78,297 |
| 2 Earners | 1,072 (49.1%) | $121,645 |
| 3+ Earners | 319 (14.6%) | $184,297 |
| Total | 2,185 (100.0%) | $109,438 |
Household Income in Bel Aire
Household Income Brackets in Bel Aire
With 629 households falling in the category, the $100,000 to $149,999 income range is the most frequent in Bel Aire, accounting for 21.6% of all households. In contrast, only 41 households (1.4%) fall into the $10,000 to $14,999 income bracket, making it the least populous group.
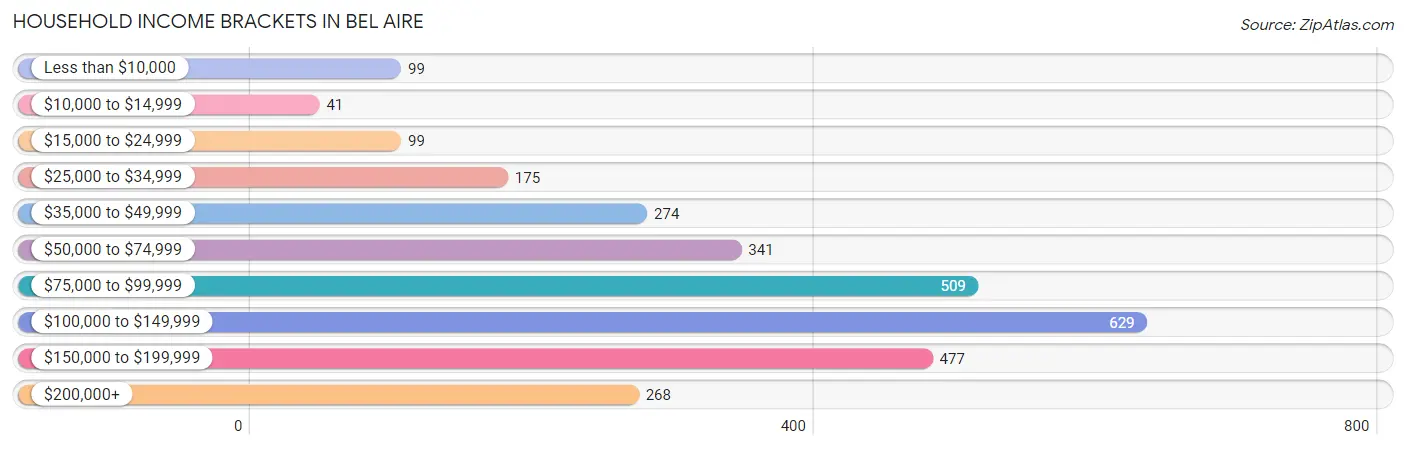
| Income Bracket | # Households | % Households |
| Less than $10,000 | 99 | 3.4% |
| $10,000 to $14,999 | 41 | 1.4% |
| $15,000 to $24,999 | 99 | 3.4% |
| $25,000 to $34,999 | 175 | 6.0% |
| $35,000 to $49,999 | 274 | 9.4% |
| $50,000 to $74,999 | 341 | 11.7% |
| $75,000 to $99,999 | 509 | 17.5% |
| $100,000 to $149,999 | 629 | 21.6% |
| $150,000 to $199,999 | 477 | 16.4% |
| $200,000+ | 268 | 9.2% |
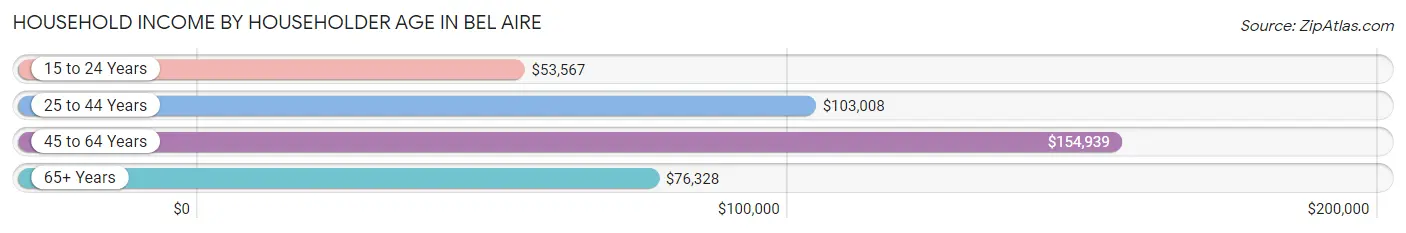
Household Income by Householder Age in Bel Aire
The median household income in Bel Aire is $91,979, with the highest median household income of $154,939 found in the 45 to 64 years age bracket for the primary householder. A total of 1,046 households (35.9%) fall into this category. Meanwhile, the 15 to 24 years age bracket for the primary householder has the lowest median household income of $53,567, with 179 households (6.1%) in this group.
| Income Bracket | # Households | Median Income |
| 15 to 24 Years | 179 (6.1%) | $53,567 |
| 25 to 44 Years | 968 (33.3%) | $103,008 |
| 45 to 64 Years | 1,046 (35.9%) | $154,939 |
| 65+ Years | 718 (24.7%) | $76,328 |
| Total | 2,911 (100.0%) | $91,979 |
Poverty in Bel Aire
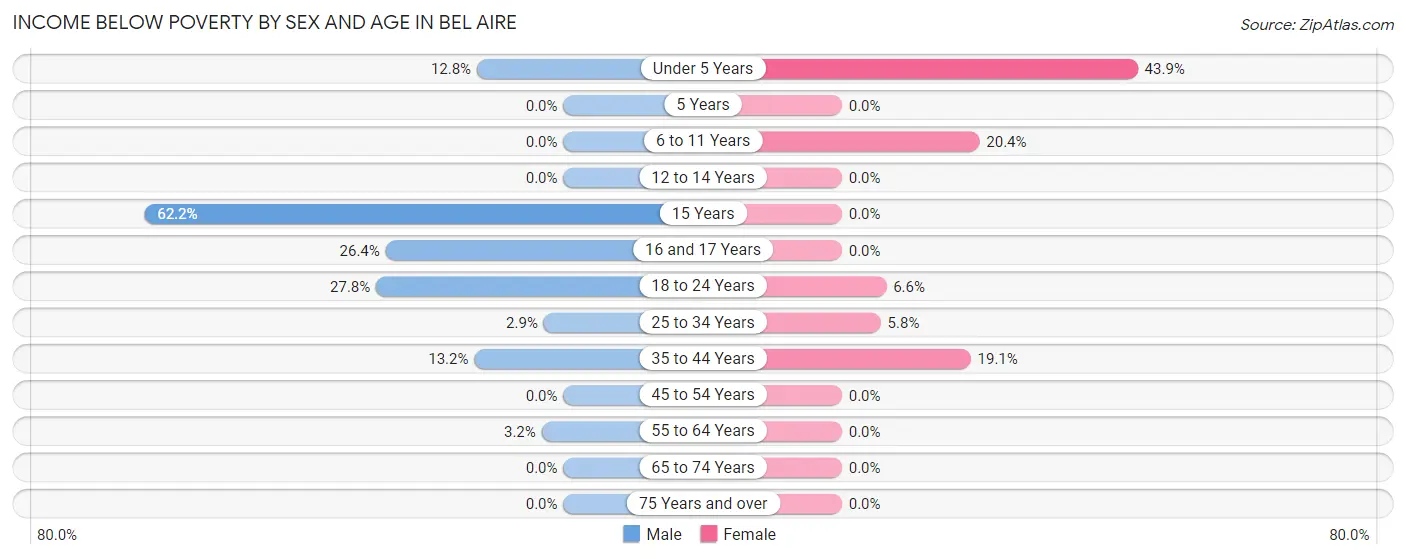
Income Below Poverty by Sex and Age in Bel Aire
With 10.0% poverty level for males and 9.1% for females among the residents of Bel Aire, 15 year old males and under 5 year old females are the most vulnerable to poverty, with 84 males (62.2%) and 141 females (43.9%) in their respective age groups living below the poverty level.
| Age Bracket | Male | Female |
| Under 5 Years | 69 (12.8%) | 141 (43.9%) |
| 5 Years | 0 (0.0%) | 0 (0.0%) |
| 6 to 11 Years | 0 (0.0%) | 67 (20.4%) |
| 12 to 14 Years | 0 (0.0%) | 0 (0.0%) |
| 15 Years | 84 (62.2%) | 0 (0.0%) |
| 16 and 17 Years | 38 (26.4%) | 0 (0.0%) |
| 18 to 24 Years | 119 (27.8%) | 32 (6.6%) |
| 25 to 34 Years | 13 (2.9%) | 37 (5.8%) |
| 35 to 44 Years | 69 (13.2%) | 106 (19.1%) |
| 45 to 54 Years | 0 (0.0%) | 0 (0.0%) |
| 55 to 64 Years | 18 (3.2%) | 0 (0.0%) |
| 65 to 74 Years | 0 (0.0%) | 0 (0.0%) |
| 75 Years and over | 0 (0.0%) | 0 (0.0%) |
| Total | 410 (10.0%) | 383 (9.1%) |
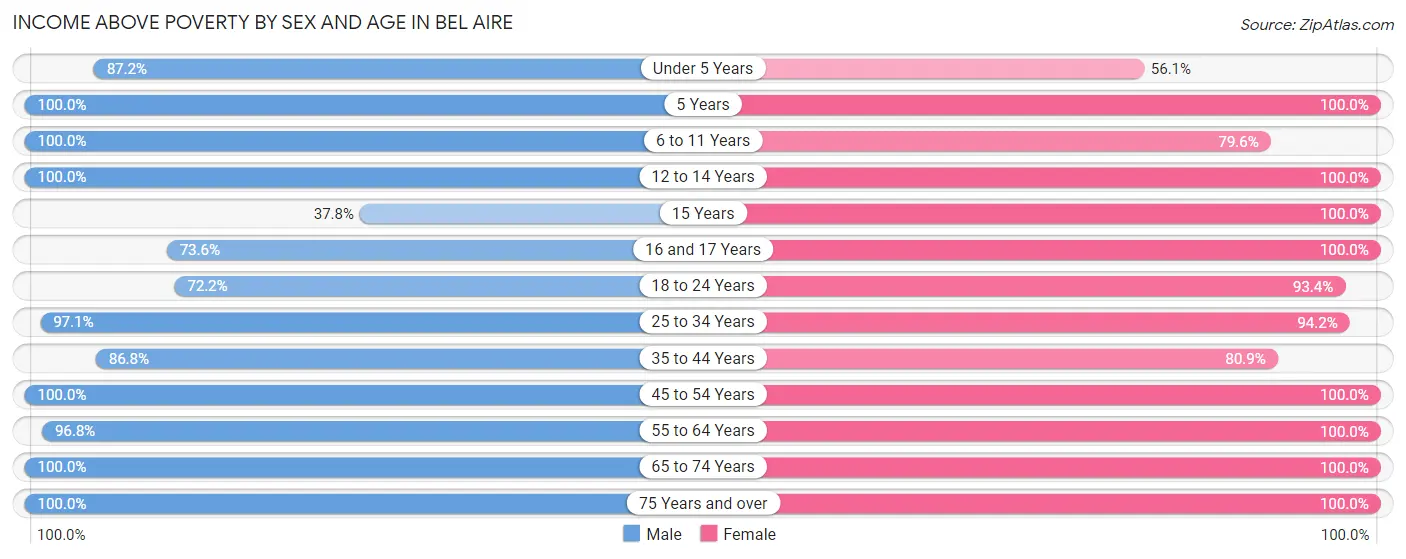
Income Above Poverty by Sex and Age in Bel Aire
According to the poverty statistics in Bel Aire, males aged 5 years and females aged 5 years are the age groups that are most secure financially, with 100.0% of males and 100.0% of females in these age groups living above the poverty line.
| Age Bracket | Male | Female |
| Under 5 Years | 469 (87.2%) | 180 (56.1%) |
| 5 Years | 54 (100.0%) | 99 (100.0%) |
| 6 to 11 Years | 256 (100.0%) | 261 (79.6%) |
| 12 to 14 Years | 124 (100.0%) | 117 (100.0%) |
| 15 Years | 51 (37.8%) | 17 (100.0%) |
| 16 and 17 Years | 106 (73.6%) | 43 (100.0%) |
| 18 to 24 Years | 309 (72.2%) | 453 (93.4%) |
| 25 to 34 Years | 433 (97.1%) | 604 (94.2%) |
| 35 to 44 Years | 453 (86.8%) | 448 (80.9%) |
| 45 to 54 Years | 373 (100.0%) | 472 (100.0%) |
| 55 to 64 Years | 539 (96.8%) | 538 (100.0%) |
| 65 to 74 Years | 237 (100.0%) | 385 (100.0%) |
| 75 Years and over | 270 (100.0%) | 205 (100.0%) |
| Total | 3,674 (90.0%) | 3,822 (90.9%) |
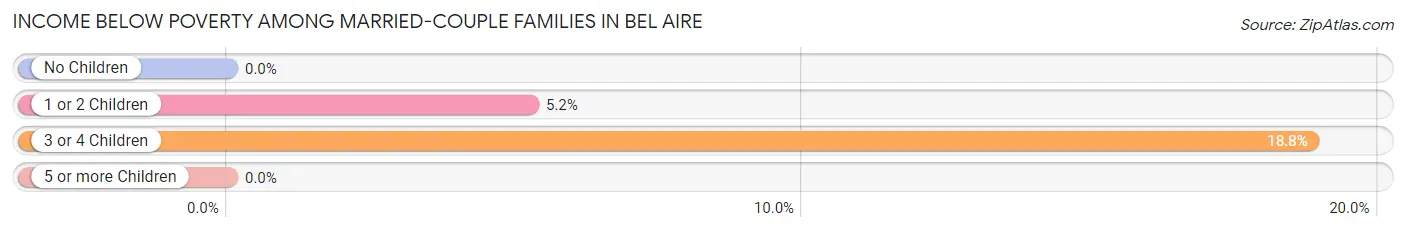
Income Below Poverty Among Married-Couple Families in Bel Aire
The poverty statistics for married-couple families in Bel Aire show that 3.6% or 69 of the total 1,891 families live below the poverty line. Families with 3 or 4 children have the highest poverty rate of 18.8%, comprising of 29 families. On the other hand, families with no children have the lowest poverty rate of 0.0%, which includes 0 families.
| Children | Above Poverty | Below Poverty |
| No Children | 944 (100.0%) | 0 (0.0%) |
| 1 or 2 Children | 723 (94.8%) | 40 (5.2%) |
| 3 or 4 Children | 125 (81.2%) | 29 (18.8%) |
| 5 or more Children | 30 (100.0%) | 0 (0.0%) |
| Total | 1,822 (96.4%) | 69 (3.6%) |
Income Below Poverty Among Single-Parent Households in Bel Aire
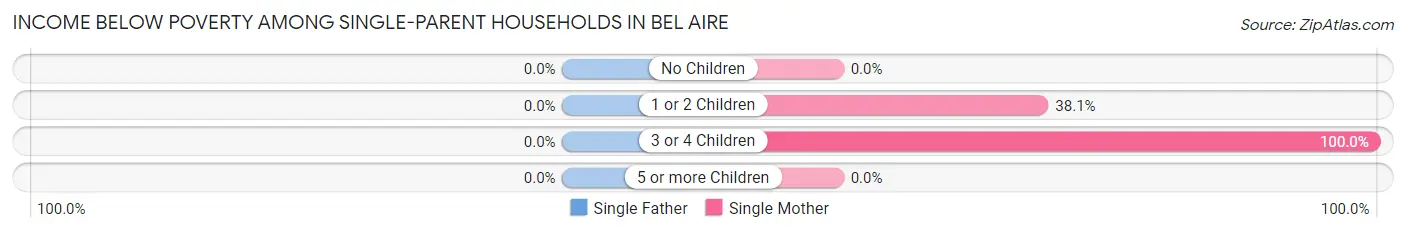
| Children | Single Father | Single Mother |
| No Children | 0 (0.0%) | 0 (0.0%) |
| 1 or 2 Children | 0 (0.0%) | 37 (38.1%) |
| 3 or 4 Children | 0 (0.0%) | 35 (100.0%) |
| 5 or more Children | 0 (0.0%) | 0 (0.0%) |
| Total | 0 (0.0%) | 72 (26.9%) |
Income Below Poverty Among Married-Couple vs Single-Parent Households in Bel Aire
The poverty data for Bel Aire shows that 69 of the married-couple family households (3.6%) and 72 of the single-parent households (24.5%) are living below the poverty level. Within the married-couple family households, those with 3 or 4 children have the highest poverty rate, with 29 households (18.8%) falling below the poverty line. Among the single-parent households, those with 3 or 4 children have the highest poverty rate, with 35 household (100.0%) living below poverty.
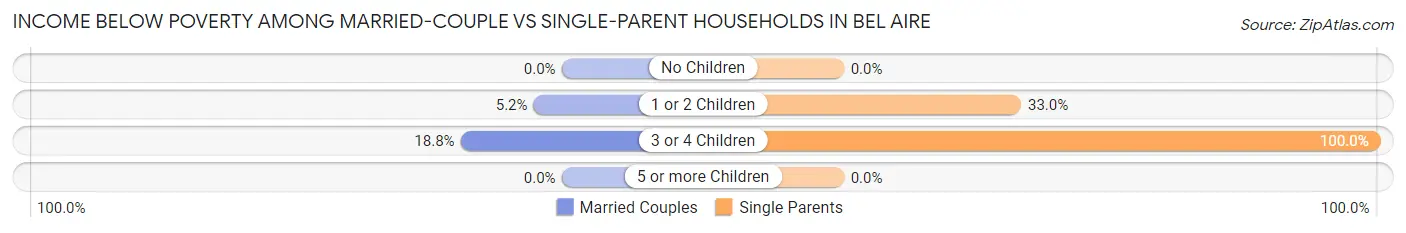
| Children | Married-Couple Families | Single-Parent Households |
| No Children | 0 (0.0%) | 0 (0.0%) |
| 1 or 2 Children | 40 (5.2%) | 37 (33.0%) |
| 3 or 4 Children | 29 (18.8%) | 35 (100.0%) |
| 5 or more Children | 0 (0.0%) | 0 (0.0%) |
| Total | 69 (3.6%) | 72 (24.5%) |
Race in Bel Aire
The most populous races in Bel Aire are White / Caucasian (6,119 | 73.4%), Hispanic or Latino (1,052 | 12.6%), and Black / African American (840 | 10.1%).
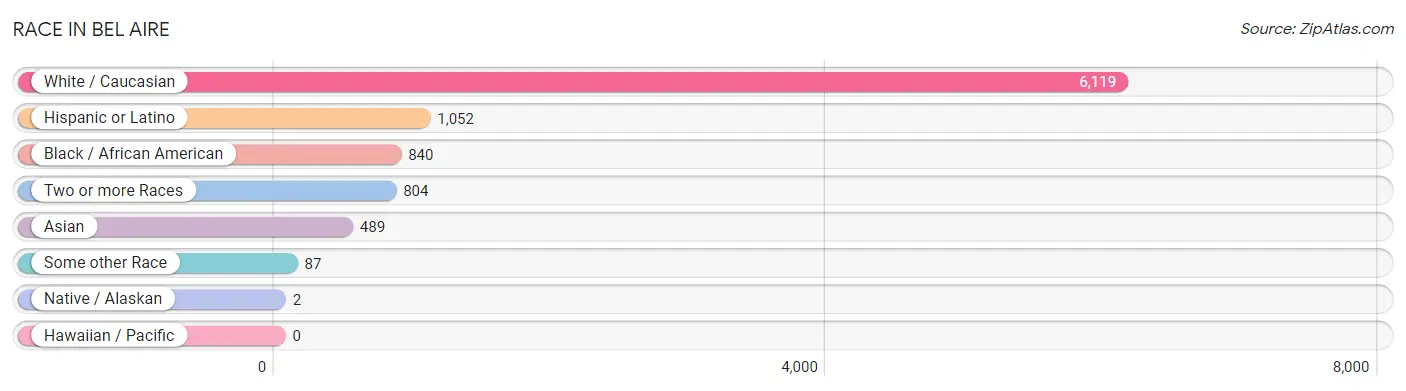
| Race | # Population | % Population |
| Asian | 489 | 5.9% |
| Black / African American | 840 | 10.1% |
| Hawaiian / Pacific | 0 | 0.0% |
| Hispanic or Latino | 1,052 | 12.6% |
| Native / Alaskan | 2 | 0.0% |
| White / Caucasian | 6,119 | 73.4% |
| Two or more Races | 804 | 9.6% |
| Some other Race | 87 | 1.0% |
| Total | 8,341 | 100.0% |
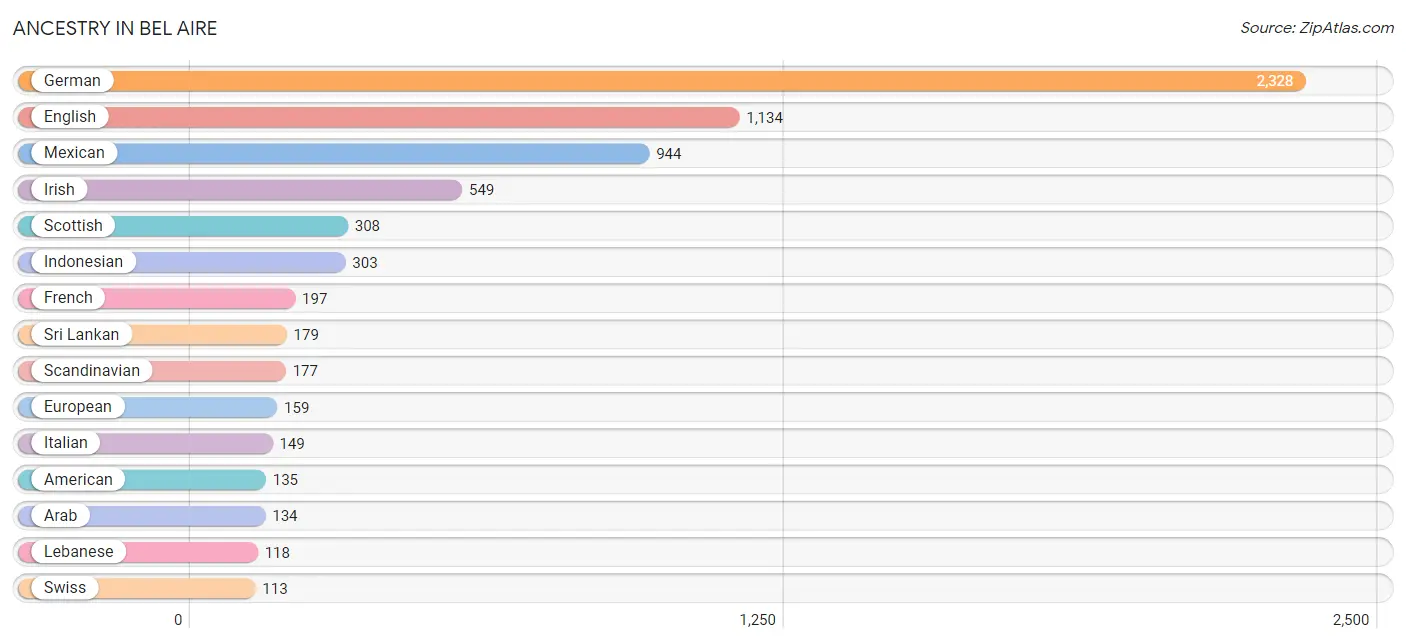
Ancestry in Bel Aire
The most populous ancestries reported in Bel Aire are German (2,328 | 27.9%), English (1,134 | 13.6%), Mexican (944 | 11.3%), Irish (549 | 6.6%), and Scottish (308 | 3.7%), together accounting for 63.1% of all Bel Aire residents.
| Ancestry | # Population | % Population |
| American | 135 | 1.6% |
| Arab | 134 | 1.6% |
| Austrian | 1 | 0.0% |
| Belgian | 15 | 0.2% |
| British | 28 | 0.3% |
| Burmese | 50 | 0.6% |
| Cajun | 28 | 0.3% |
| Central American | 32 | 0.4% |
| Cherokee | 37 | 0.4% |
| Chippewa | 16 | 0.2% |
| Cuban | 9 | 0.1% |
| Czech | 62 | 0.7% |
| Czechoslovakian | 15 | 0.2% |
| Delaware | 16 | 0.2% |
| Dutch | 29 | 0.4% |
| Eastern European | 64 | 0.8% |
| English | 1,134 | 13.6% |
| European | 159 | 1.9% |
| French | 197 | 2.4% |
| French Canadian | 64 | 0.8% |
| German | 2,328 | 27.9% |
| Hungarian | 77 | 0.9% |
| Indian (Asian) | 61 | 0.7% |
| Indonesian | 303 | 3.6% |
| Irish | 549 | 6.6% |
| Italian | 149 | 1.8% |
| Lebanese | 118 | 1.4% |
| Lithuanian | 13 | 0.2% |
| Malaysian | 15 | 0.2% |
| Mexican | 944 | 11.3% |
| Norwegian | 47 | 0.6% |
| Osage | 13 | 0.2% |
| Palestinian | 9 | 0.1% |
| Polish | 40 | 0.5% |
| Portuguese | 26 | 0.3% |
| Russian | 54 | 0.6% |
| Salvadoran | 32 | 0.4% |
| Scandinavian | 177 | 2.1% |
| Scotch-Irish | 24 | 0.3% |
| Scottish | 308 | 3.7% |
| Spaniard | 54 | 0.6% |
| Spanish | 13 | 0.2% |
| Sri Lankan | 179 | 2.1% |
| Swedish | 108 | 1.3% |
| Swiss | 113 | 1.3% |
| Vietnamese | 29 | 0.4% |
| Welsh | 107 | 1.3% | View All 47 Rows |
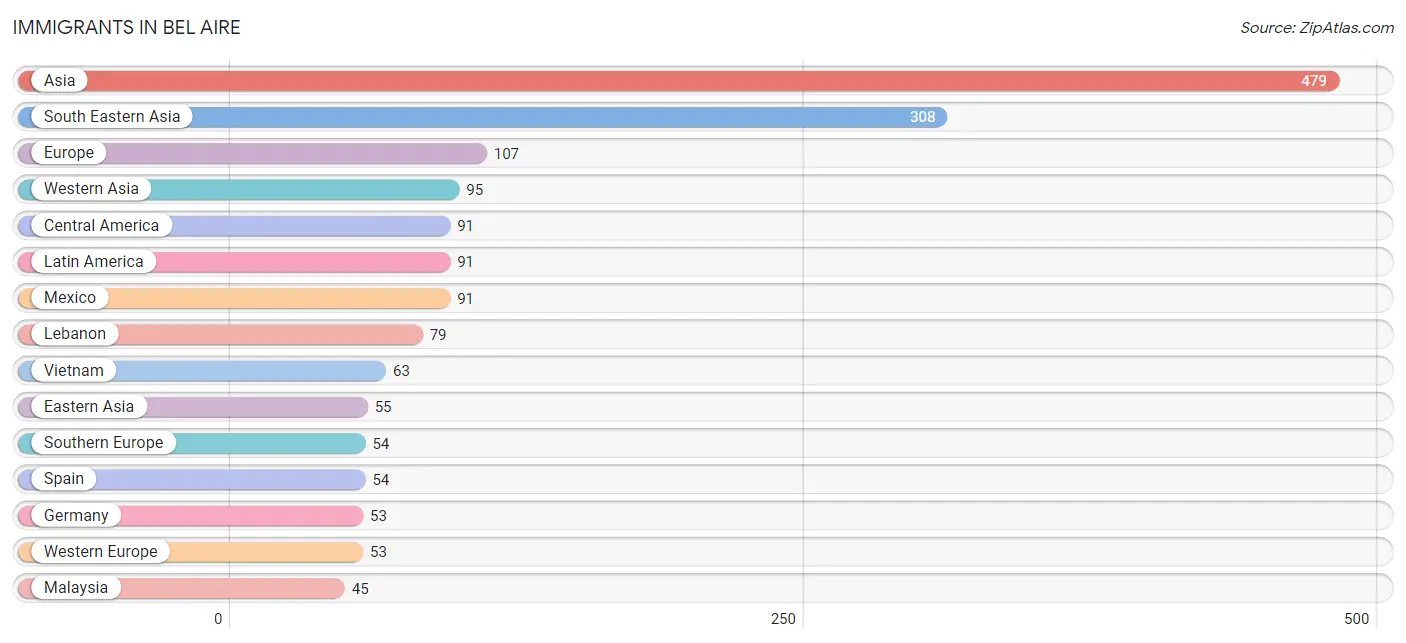
Immigrants in Bel Aire
The most numerous immigrant groups reported in Bel Aire came from Asia (479 | 5.7%), South Eastern Asia (308 | 3.7%), Europe (107 | 1.3%), Western Asia (95 | 1.1%), and Central America (91 | 1.1%), together accounting for 12.9% of all Bel Aire residents.
| Immigration Origin | # Population | % Population |
| Asia | 479 | 5.7% |
| Bangladesh | 14 | 0.2% |
| Canada | 26 | 0.3% |
| Central America | 91 | 1.1% |
| China | 40 | 0.5% |
| Eastern Asia | 55 | 0.7% |
| Europe | 107 | 1.3% |
| Germany | 53 | 0.6% |
| Korea | 15 | 0.2% |
| Laos | 15 | 0.2% |
| Latin America | 91 | 1.1% |
| Lebanon | 79 | 0.9% |
| Malaysia | 45 | 0.5% |
| Mexico | 91 | 1.1% |
| South Central Asia | 14 | 0.2% |
| South Eastern Asia | 308 | 3.7% |
| Southern Europe | 54 | 0.6% |
| Spain | 54 | 0.6% |
| Turkey | 16 | 0.2% |
| Vietnam | 63 | 0.8% |
| Western Asia | 95 | 1.1% |
| Western Europe | 53 | 0.6% | View All 22 Rows |
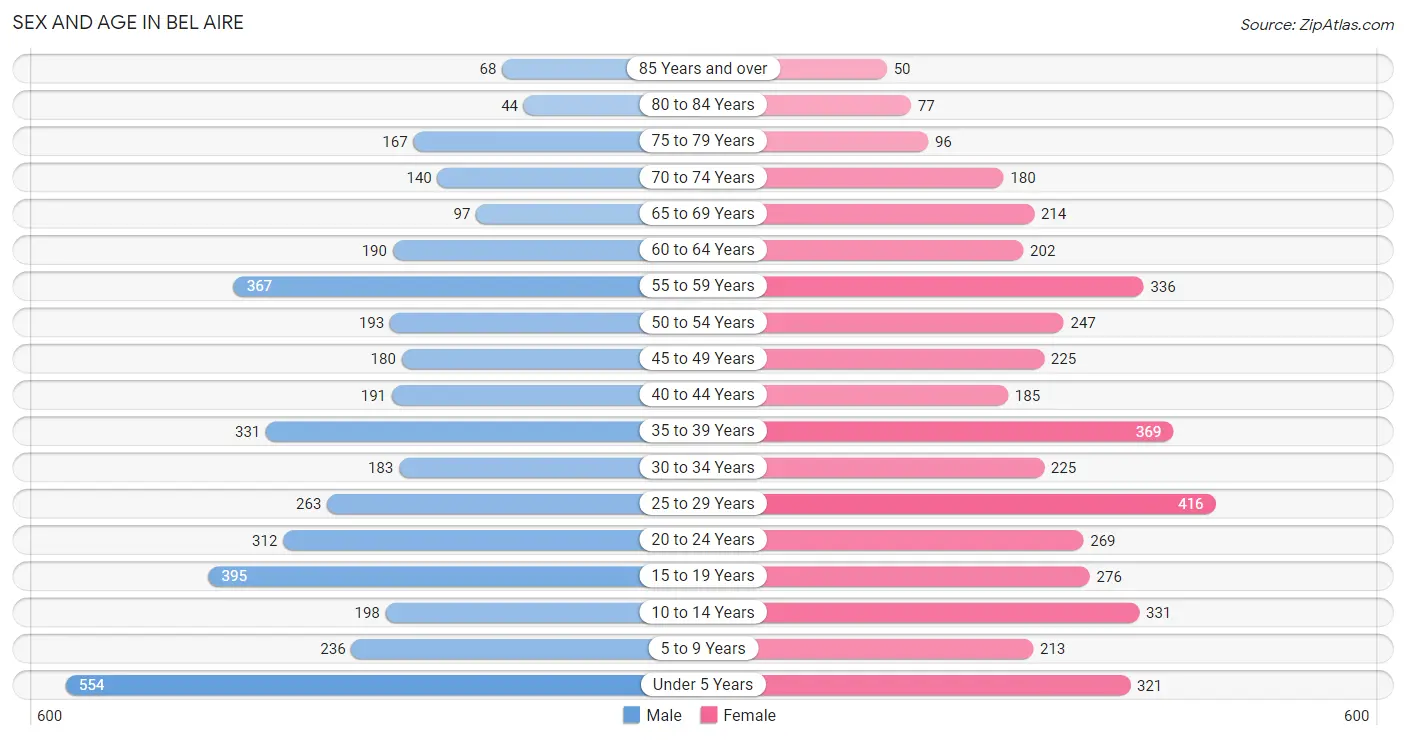
Sex and Age in Bel Aire
Sex and Age in Bel Aire
The most populous age groups in Bel Aire are Under 5 Years (554 | 13.5%) for men and 25 to 29 Years (416 | 9.8%) for women.
| Age Bracket | Male | Female |
| Under 5 Years | 554 (13.5%) | 321 (7.6%) |
| 5 to 9 Years | 236 (5.7%) | 213 (5.0%) |
| 10 to 14 Years | 198 (4.8%) | 331 (7.8%) |
| 15 to 19 Years | 395 (9.6%) | 276 (6.5%) |
| 20 to 24 Years | 312 (7.6%) | 269 (6.4%) |
| 25 to 29 Years | 263 (6.4%) | 416 (9.8%) |
| 30 to 34 Years | 183 (4.4%) | 225 (5.3%) |
| 35 to 39 Years | 331 (8.1%) | 369 (8.7%) |
| 40 to 44 Years | 191 (4.6%) | 185 (4.4%) |
| 45 to 49 Years | 180 (4.4%) | 225 (5.3%) |
| 50 to 54 Years | 193 (4.7%) | 247 (5.8%) |
| 55 to 59 Years | 367 (8.9%) | 336 (7.9%) |
| 60 to 64 Years | 190 (4.6%) | 202 (4.8%) |
| 65 to 69 Years | 97 (2.4%) | 214 (5.1%) |
| 70 to 74 Years | 140 (3.4%) | 180 (4.3%) |
| 75 to 79 Years | 167 (4.1%) | 96 (2.3%) |
| 80 to 84 Years | 44 (1.1%) | 77 (1.8%) |
| 85 Years and over | 68 (1.7%) | 50 (1.2%) |
| Total | 4,109 (100.0%) | 4,232 (100.0%) |
Families and Households in Bel Aire
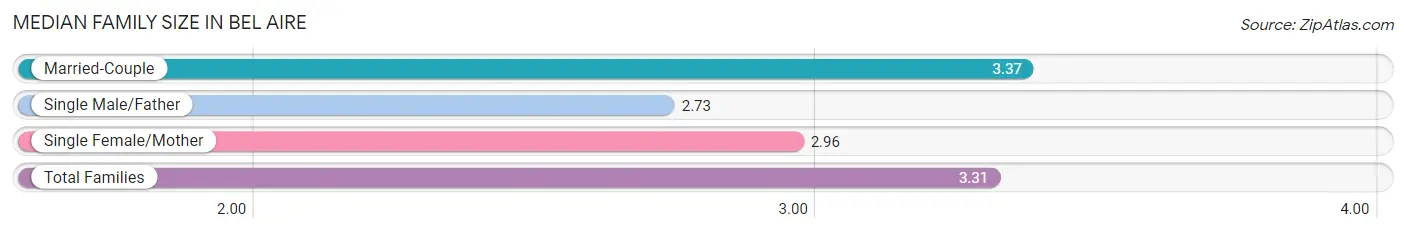
Median Family Size in Bel Aire
The median family size in Bel Aire is 3.31 persons per family, with married-couple families (1,891 | 86.5%) accounting for the largest median family size of 3.37 persons per family. On the other hand, single male/father families (26 | 1.2%) represent the smallest median family size with 2.73 persons per family.
| Family Type | # Families | Family Size |
| Married-Couple | 1,891 (86.5%) | 3.37 |
| Single Male/Father | 26 (1.2%) | 2.73 |
| Single Female/Mother | 268 (12.3%) | 2.96 |
| Total Families | 2,185 (100.0%) | 3.31 |
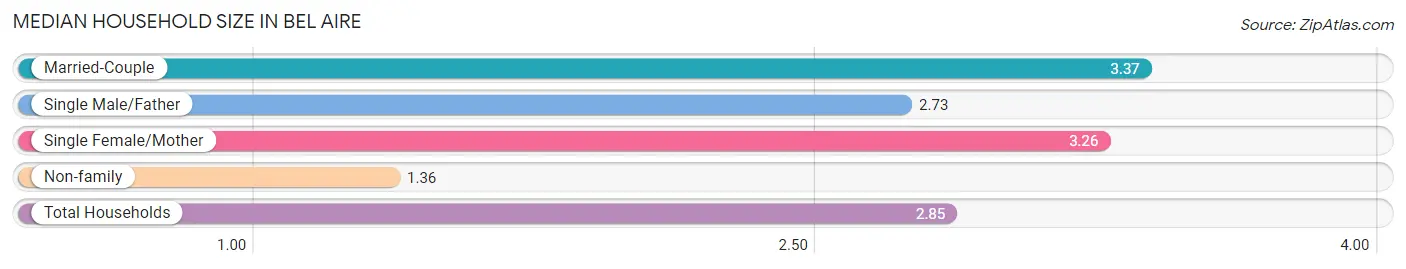
Median Household Size in Bel Aire
The median household size in Bel Aire is 2.85 persons per household, with married-couple households (1,891 | 65.0%) accounting for the largest median household size of 3.37 persons per household. non-family households (726 | 24.9%) represent the smallest median household size with 1.36 persons per household.
| Household Type | # Households | Household Size |
| Married-Couple | 1,891 (65.0%) | 3.37 |
| Single Male/Father | 26 (0.9%) | 2.73 |
| Single Female/Mother | 268 (9.2%) | 3.26 |
| Non-family | 726 (24.9%) | 1.36 |
| Total Households | 2,911 (100.0%) | 2.85 |
Household Size by Marriage Status in Bel Aire
Out of a total of 2,911 households in Bel Aire, 2,185 (75.1%) are family households, while 726 (24.9%) are nonfamily households. The most numerous type of family households are 2-person households, comprising 896, and the most common type of nonfamily households are 1-person households, comprising 519.
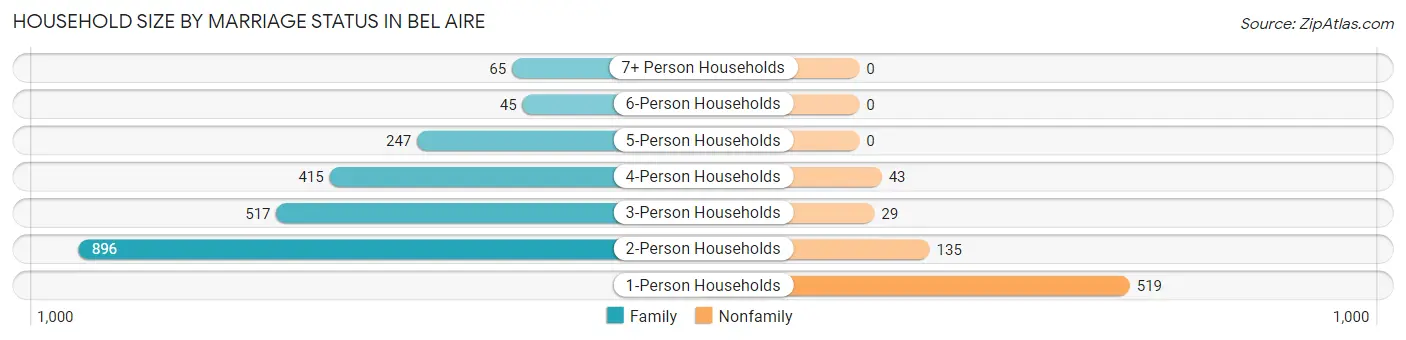
| Household Size | Family Households | Nonfamily Households |
| 1-Person Households | - | 519 (17.8%) |
| 2-Person Households | 896 (30.8%) | 135 (4.6%) |
| 3-Person Households | 517 (17.8%) | 29 (1.0%) |
| 4-Person Households | 415 (14.3%) | 43 (1.5%) |
| 5-Person Households | 247 (8.5%) | 0 (0.0%) |
| 6-Person Households | 45 (1.5%) | 0 (0.0%) |
| 7+ Person Households | 65 (2.2%) | 0 (0.0%) |
| Total | 2,185 (75.1%) | 726 (24.9%) |
Female Fertility in Bel Aire
Fertility by Age in Bel Aire
Average fertility rate in Bel Aire is 82.0 births per 1,000 women. Women in the age bracket of 20 to 34 years have the highest fertility rate with 102.0 births per 1,000 women. Women in the age bracket of 20 to 34 years acount for 56.0% of all women with births.
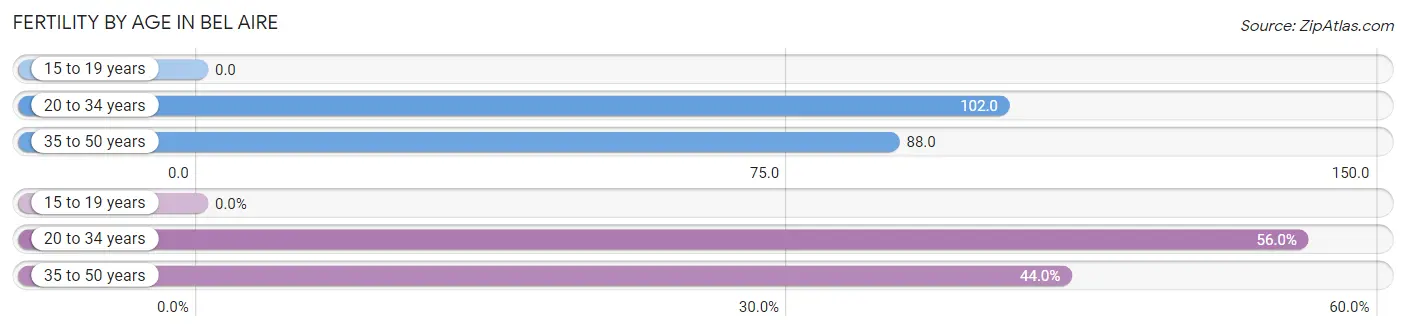
| Age Bracket | Women with Births | Births / 1,000 Women |
| 15 to 19 years | 0 (0.0%) | 0.0 |
| 20 to 34 years | 93 (56.0%) | 102.0 |
| 35 to 50 years | 73 (44.0%) | 88.0 |
| Total | 166 (100.0%) | 82.0 |
Fertility by Age by Marriage Status in Bel Aire
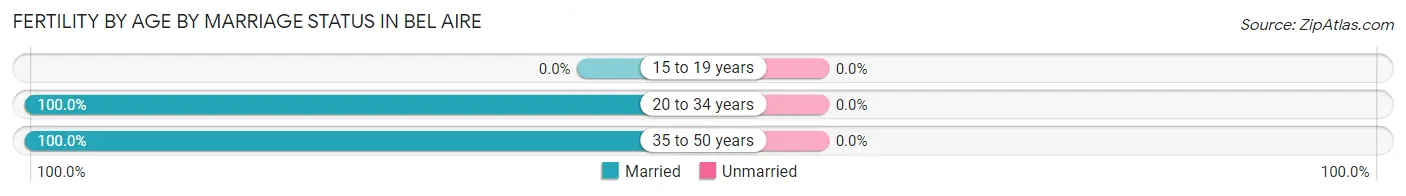
| Age Bracket | Married | Unmarried |
| 15 to 19 years | 0 (0.0%) | 0 (0.0%) |
| 20 to 34 years | 93 (100.0%) | 0 (0.0%) |
| 35 to 50 years | 73 (100.0%) | 0 (0.0%) |
| Total | 166 (100.0%) | 0 (0.0%) |
Fertility by Education in Bel Aire
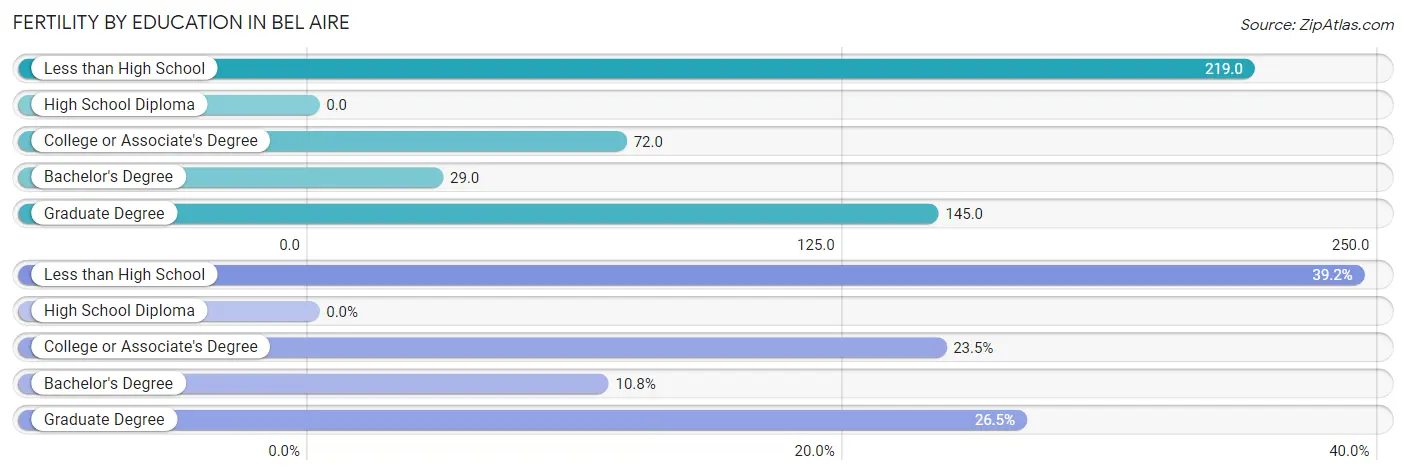
| Educational Attainment | Women with Births | Births / 1,000 Women |
| Less than High School | 65 (39.2%) | 219.0 |
| High School Diploma | 0 (0.0%) | 0.0 |
| College or Associate's Degree | 39 (23.5%) | 72.0 |
| Bachelor's Degree | 18 (10.8%) | 29.0 |
| Graduate Degree | 44 (26.5%) | 145.0 |
| Total | 166 (100.0%) | 82.0 |
Fertility by Education by Marriage Status in Bel Aire
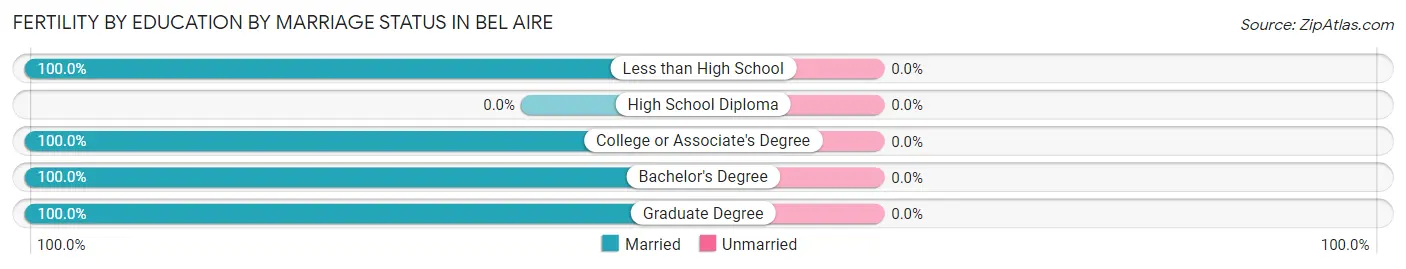
| Educational Attainment | Married | Unmarried |
| Less than High School | 65 (100.0%) | 0 (0.0%) |
| High School Diploma | 0 (0.0%) | 0 (0.0%) |
| College or Associate's Degree | 39 (100.0%) | 0 (0.0%) |
| Bachelor's Degree | 18 (100.0%) | 0 (0.0%) |
| Graduate Degree | 44 (100.0%) | 0 (0.0%) |
| Total | 166 (100.0%) | 0 (0.0%) |
Employment Characteristics in Bel Aire
Employment by Class of Employer in Bel Aire
Among the 4,223 employed individuals in Bel Aire, private company employees (2,921 | 69.2%), not-for-profit organizations (454 | 10.7%), and local government employees (265 | 6.3%) make up the most common classes of employment.
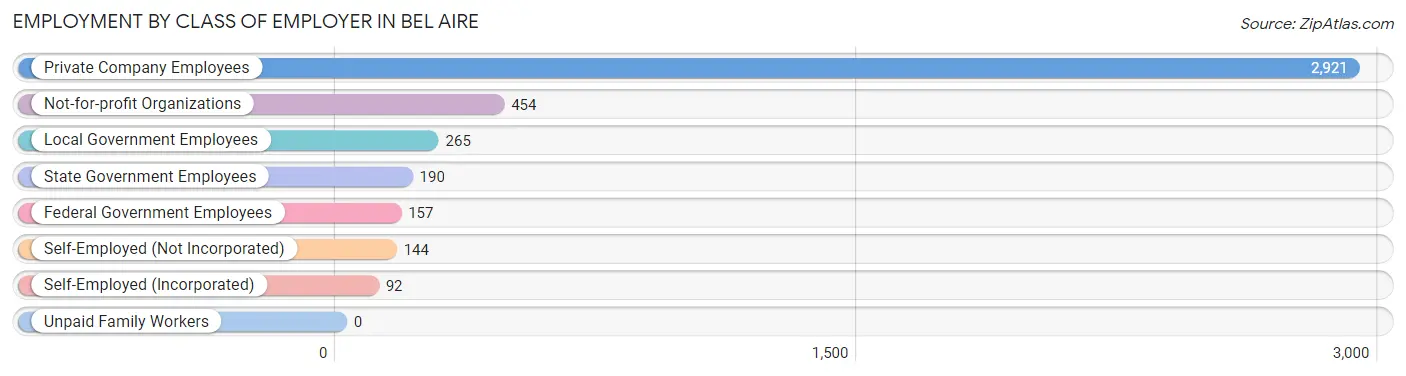
| Employer Class | # Employees | % Employees |
| Private Company Employees | 2,921 | 69.2% |
| Self-Employed (Incorporated) | 92 | 2.2% |
| Self-Employed (Not Incorporated) | 144 | 3.4% |
| Not-for-profit Organizations | 454 | 10.7% |
| Local Government Employees | 265 | 6.3% |
| State Government Employees | 190 | 4.5% |
| Federal Government Employees | 157 | 3.7% |
| Unpaid Family Workers | 0 | 0.0% |
| Total | 4,223 | 100.0% |
Employment Status by Age in Bel Aire
According to the labor force statistics for Bel Aire, out of the total population over 16 years of age (6,336), 69.7% or 4,416 individuals are in the labor force, with 2.3% or 102 of them unemployed. The age group with the highest labor force participation rate is 55 to 59 years, with 90.2% or 634 individuals in the labor force. Within the labor force, the 16 to 19 years age range has the highest percentage of unemployed individuals, with 12.8% or 30 of them being unemployed.
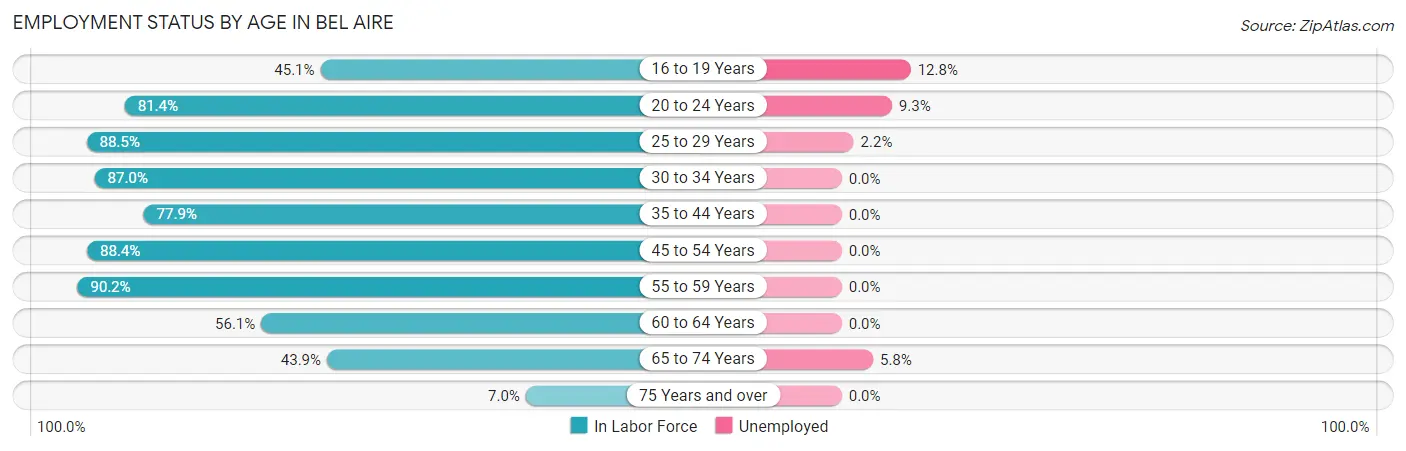
| Age Bracket | In Labor Force | Unemployed |
| 16 to 19 Years | 234 (45.1%) | 30 (12.8%) |
| 20 to 24 Years | 473 (81.4%) | 44 (9.3%) |
| 25 to 29 Years | 601 (88.5%) | 13 (2.2%) |
| 30 to 34 Years | 355 (87.0%) | 0 (0.0%) |
| 35 to 44 Years | 838 (77.9%) | 0 (0.0%) |
| 45 to 54 Years | 747 (88.4%) | 0 (0.0%) |
| 55 to 59 Years | 634 (90.2%) | 0 (0.0%) |
| 60 to 64 Years | 220 (56.1%) | 0 (0.0%) |
| 65 to 74 Years | 277 (43.9%) | 16 (5.8%) |
| 75 Years and over | 35 (7.0%) | 0 (0.0%) |
| Total | 4,416 (69.7%) | 102 (2.3%) |
Employment Status by Educational Attainment in Bel Aire
According to labor force statistics for Bel Aire, 82.7% of individuals (3,393) out of the total population between 25 and 64 years of age (4,103) are in the labor force, with 0.4% or 14 of them being unemployed. The group with the highest labor force participation rate are those with the educational attainment of bachelor's degree or higher, with 89.8% or 2,079 individuals in the labor force. Within the labor force, individuals with high school diploma education have the highest percentage of unemployment, with 4.3% or 13 of them being unemployed.
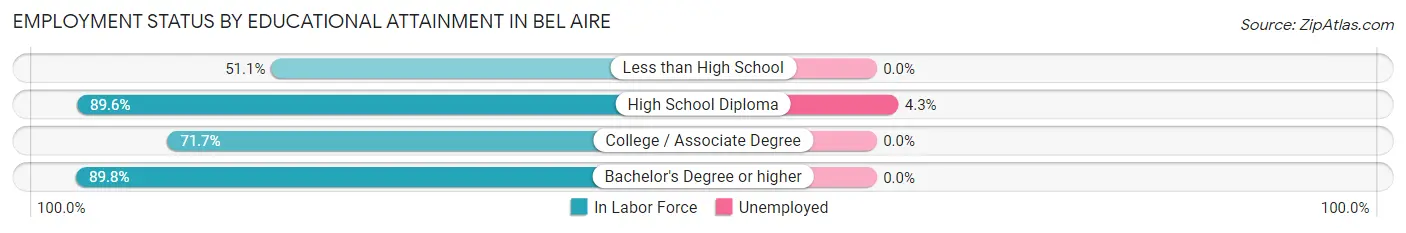
| Educational Attainment | In Labor Force | Unemployed |
| Less than High School | 68 (51.1%) | 0 (0.0%) |
| High School Diploma | 303 (89.6%) | 15 (4.3%) |
| College / Associate Degree | 944 (71.7%) | 0 (0.0%) |
| Bachelor's Degree or higher | 2,079 (89.8%) | 0 (0.0%) |
| Total | 3,393 (82.7%) | 16 (0.4%) |
Employment Occupations by Sex in Bel Aire
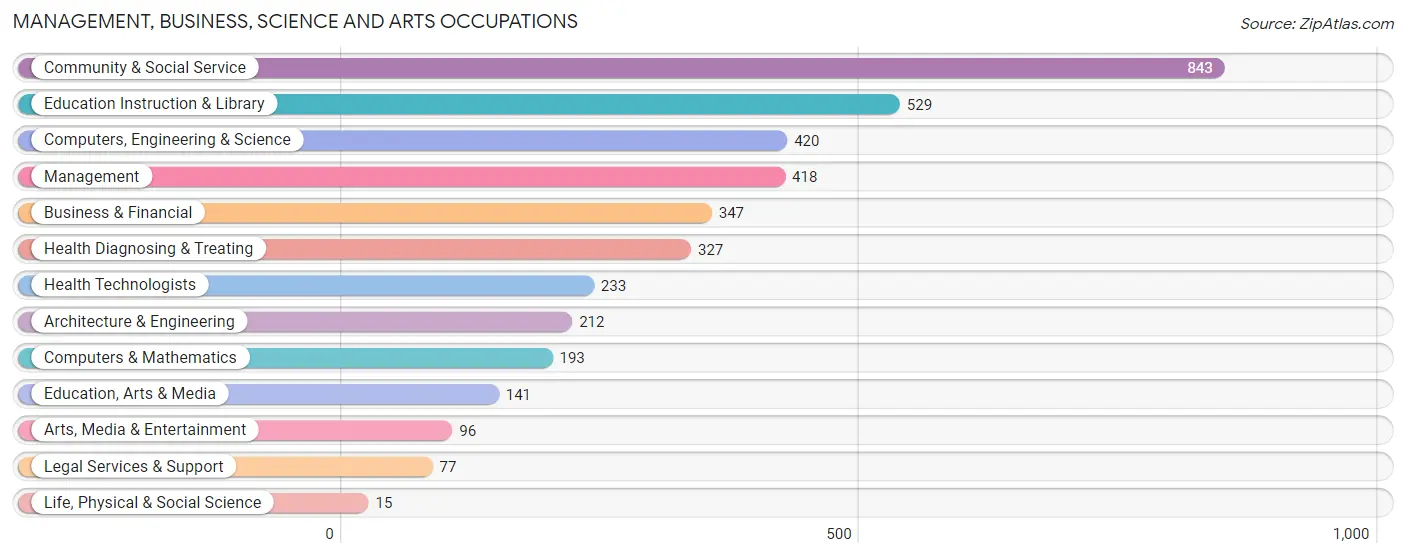
Management, Business, Science and Arts Occupations
The most common Management, Business, Science and Arts occupations in Bel Aire are Community & Social Service (843 | 19.7%), Education Instruction & Library (529 | 12.3%), Computers, Engineering & Science (420 | 9.8%), Management (418 | 9.8%), and Business & Financial (347 | 8.1%).
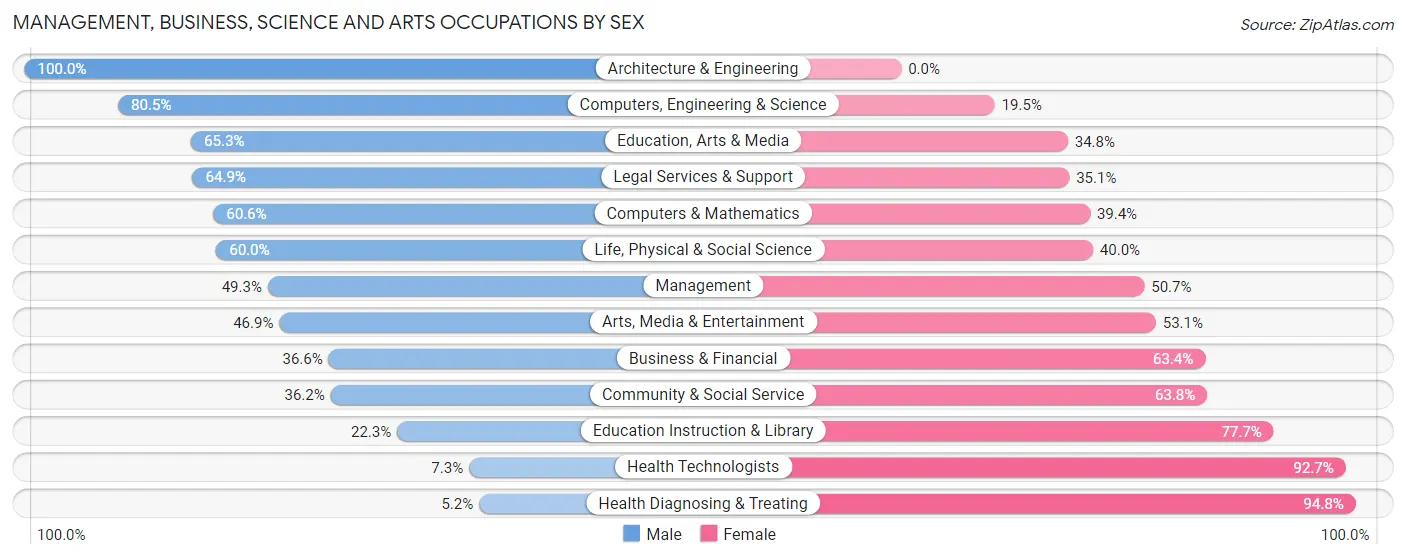
Management, Business, Science and Arts Occupations by Sex
Within the Management, Business, Science and Arts occupations in Bel Aire, the most male-oriented occupations are Architecture & Engineering (100.0%), Computers, Engineering & Science (80.5%), and Education, Arts & Media (65.2%), while the most female-oriented occupations are Health Diagnosing & Treating (94.8%), Health Technologists (92.7%), and Education Instruction & Library (77.7%).
| Occupation | Male | Female |
| Management | 206 (49.3%) | 212 (50.7%) |
| Business & Financial | 127 (36.6%) | 220 (63.4%) |
| Computers, Engineering & Science | 338 (80.5%) | 82 (19.5%) |
| Computers & Mathematics | 117 (60.6%) | 76 (39.4%) |
| Architecture & Engineering | 212 (100.0%) | 0 (0.0%) |
| Life, Physical & Social Science | 9 (60.0%) | 6 (40.0%) |
| Community & Social Service | 305 (36.2%) | 538 (63.8%) |
| Education, Arts & Media | 92 (65.2%) | 49 (34.7%) |
| Legal Services & Support | 50 (64.9%) | 27 (35.1%) |
| Education Instruction & Library | 118 (22.3%) | 411 (77.7%) |
| Arts, Media & Entertainment | 45 (46.9%) | 51 (53.1%) |
| Health Diagnosing & Treating | 17 (5.2%) | 310 (94.8%) |
| Health Technologists | 17 (7.3%) | 216 (92.7%) |
| Total (Category) | 993 (42.2%) | 1,362 (57.8%) |
| Total (Overall) | 2,148 (50.1%) | 2,138 (49.9%) |
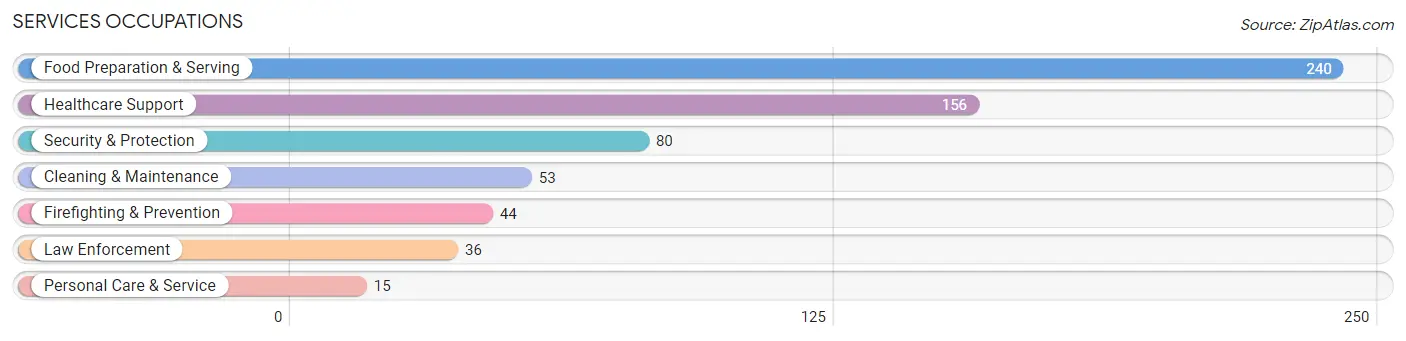
Services Occupations
The most common Services occupations in Bel Aire are Food Preparation & Serving (240 | 5.6%), Healthcare Support (156 | 3.6%), Security & Protection (80 | 1.9%), Cleaning & Maintenance (53 | 1.2%), and Firefighting & Prevention (44 | 1.0%).
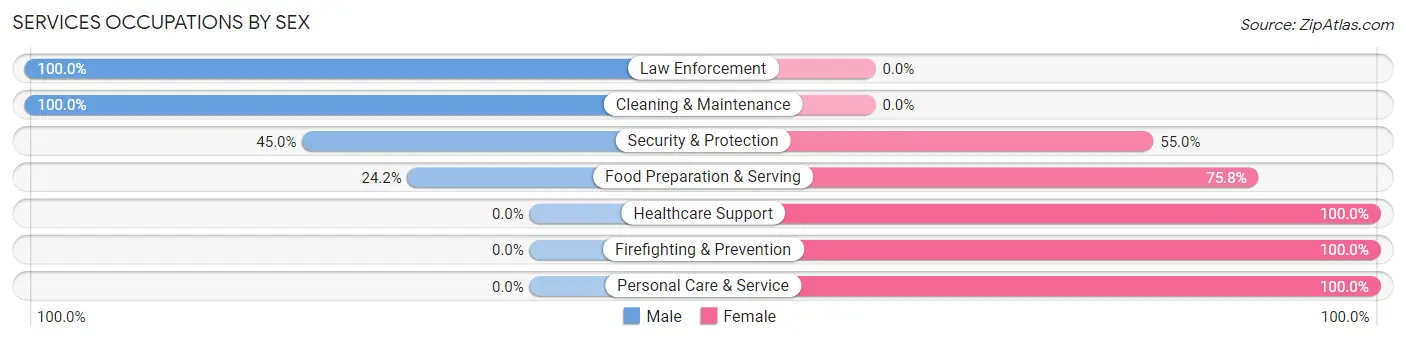
Services Occupations by Sex
Within the Services occupations in Bel Aire, the most male-oriented occupations are Law Enforcement (100.0%), Cleaning & Maintenance (100.0%), and Security & Protection (45.0%), while the most female-oriented occupations are Healthcare Support (100.0%), Firefighting & Prevention (100.0%), and Personal Care & Service (100.0%).
| Occupation | Male | Female |
| Healthcare Support | 0 (0.0%) | 156 (100.0%) |
| Security & Protection | 36 (45.0%) | 44 (55.0%) |
| Firefighting & Prevention | 0 (0.0%) | 44 (100.0%) |
| Law Enforcement | 36 (100.0%) | 0 (0.0%) |
| Food Preparation & Serving | 58 (24.2%) | 182 (75.8%) |
| Cleaning & Maintenance | 53 (100.0%) | 0 (0.0%) |
| Personal Care & Service | 0 (0.0%) | 15 (100.0%) |
| Total (Category) | 147 (27.0%) | 397 (73.0%) |
| Total (Overall) | 2,148 (50.1%) | 2,138 (49.9%) |
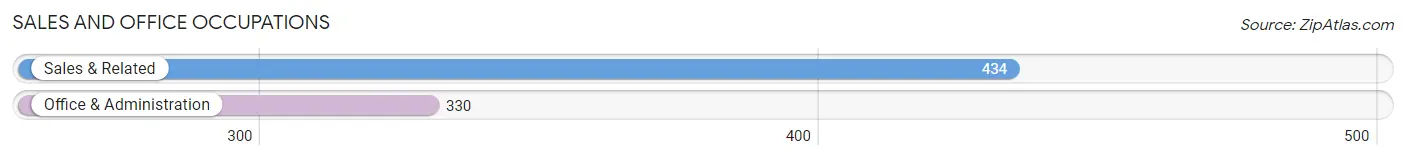
Sales and Office Occupations
The most common Sales and Office occupations in Bel Aire are Sales & Related (434 | 10.1%), and Office & Administration (330 | 7.7%).
Sales and Office Occupations by Sex
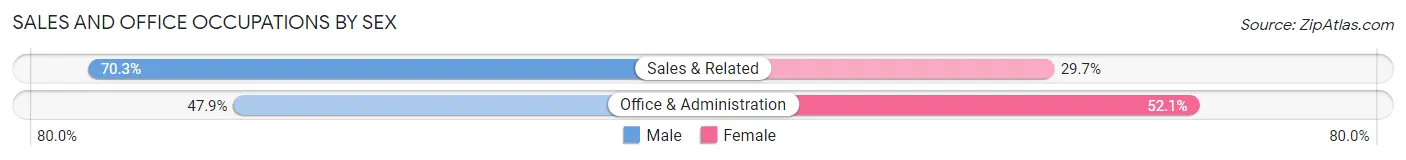
| Occupation | Male | Female |
| Sales & Related | 305 (70.3%) | 129 (29.7%) |
| Office & Administration | 158 (47.9%) | 172 (52.1%) |
| Total (Category) | 463 (60.6%) | 301 (39.4%) |
| Total (Overall) | 2,148 (50.1%) | 2,138 (49.9%) |
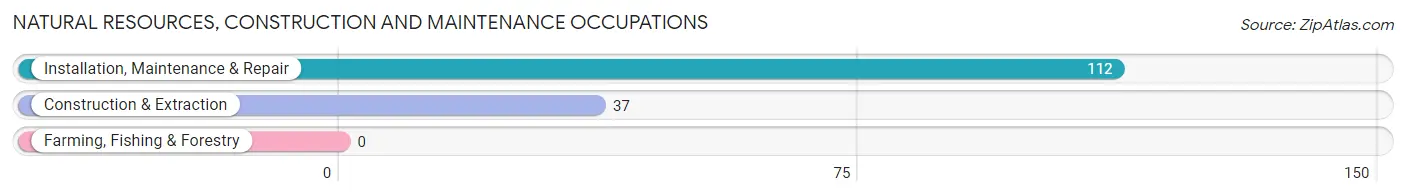
Natural Resources, Construction and Maintenance Occupations
The most common Natural Resources, Construction and Maintenance occupations in Bel Aire are Installation, Maintenance & Repair (112 | 2.6%), and Construction & Extraction (37 | 0.9%).
Natural Resources, Construction and Maintenance Occupations by Sex
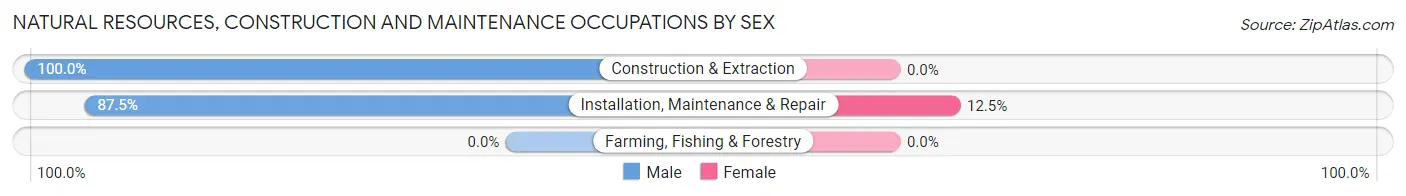
| Occupation | Male | Female |
| Farming, Fishing & Forestry | 0 (0.0%) | 0 (0.0%) |
| Construction & Extraction | 37 (100.0%) | 0 (0.0%) |
| Installation, Maintenance & Repair | 98 (87.5%) | 14 (12.5%) |
| Total (Category) | 135 (90.6%) | 14 (9.4%) |
| Total (Overall) | 2,148 (50.1%) | 2,138 (49.9%) |
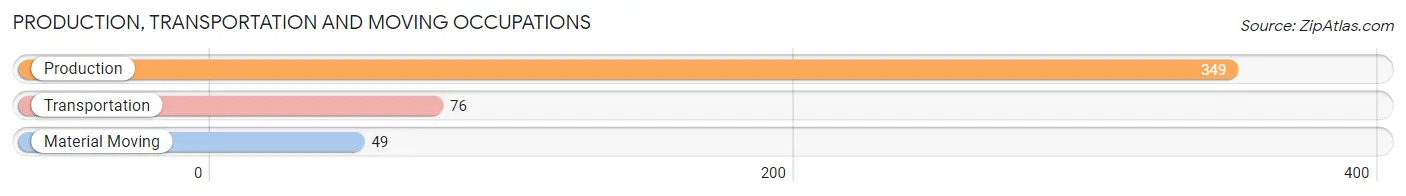
Production, Transportation and Moving Occupations
The most common Production, Transportation and Moving occupations in Bel Aire are Production (349 | 8.1%), Transportation (76 | 1.8%), and Material Moving (49 | 1.1%).
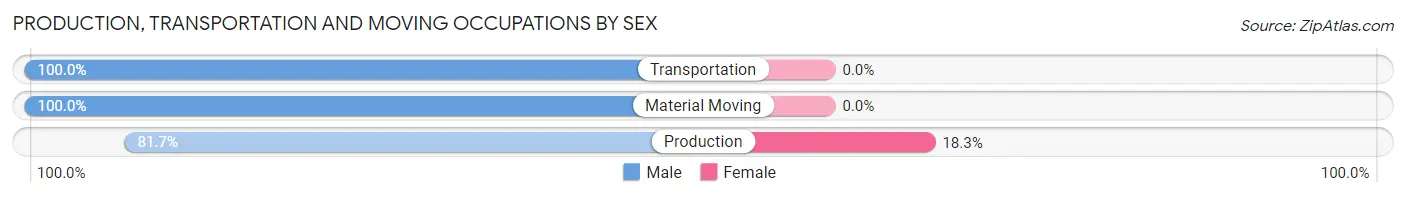
Production, Transportation and Moving Occupations by Sex
| Occupation | Male | Female |
| Production | 285 (81.7%) | 64 (18.3%) |
| Transportation | 76 (100.0%) | 0 (0.0%) |
| Material Moving | 49 (100.0%) | 0 (0.0%) |
| Total (Category) | 410 (86.5%) | 64 (13.5%) |
| Total (Overall) | 2,148 (50.1%) | 2,138 (49.9%) |
Employment Industries by Sex in Bel Aire
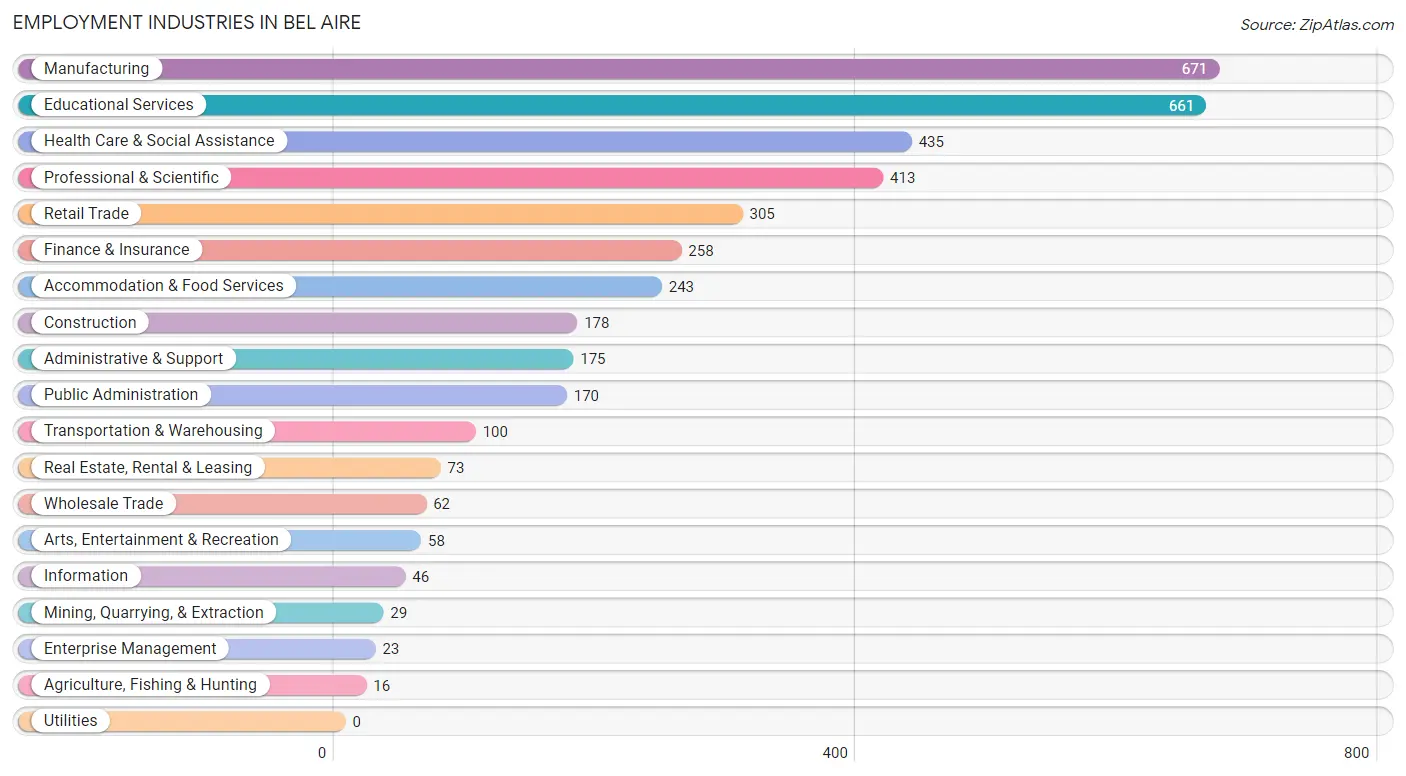
Employment Industries in Bel Aire
The major employment industries in Bel Aire include Manufacturing (671 | 15.7%), Educational Services (661 | 15.4%), Health Care & Social Assistance (435 | 10.2%), Professional & Scientific (413 | 9.6%), and Retail Trade (305 | 7.1%).
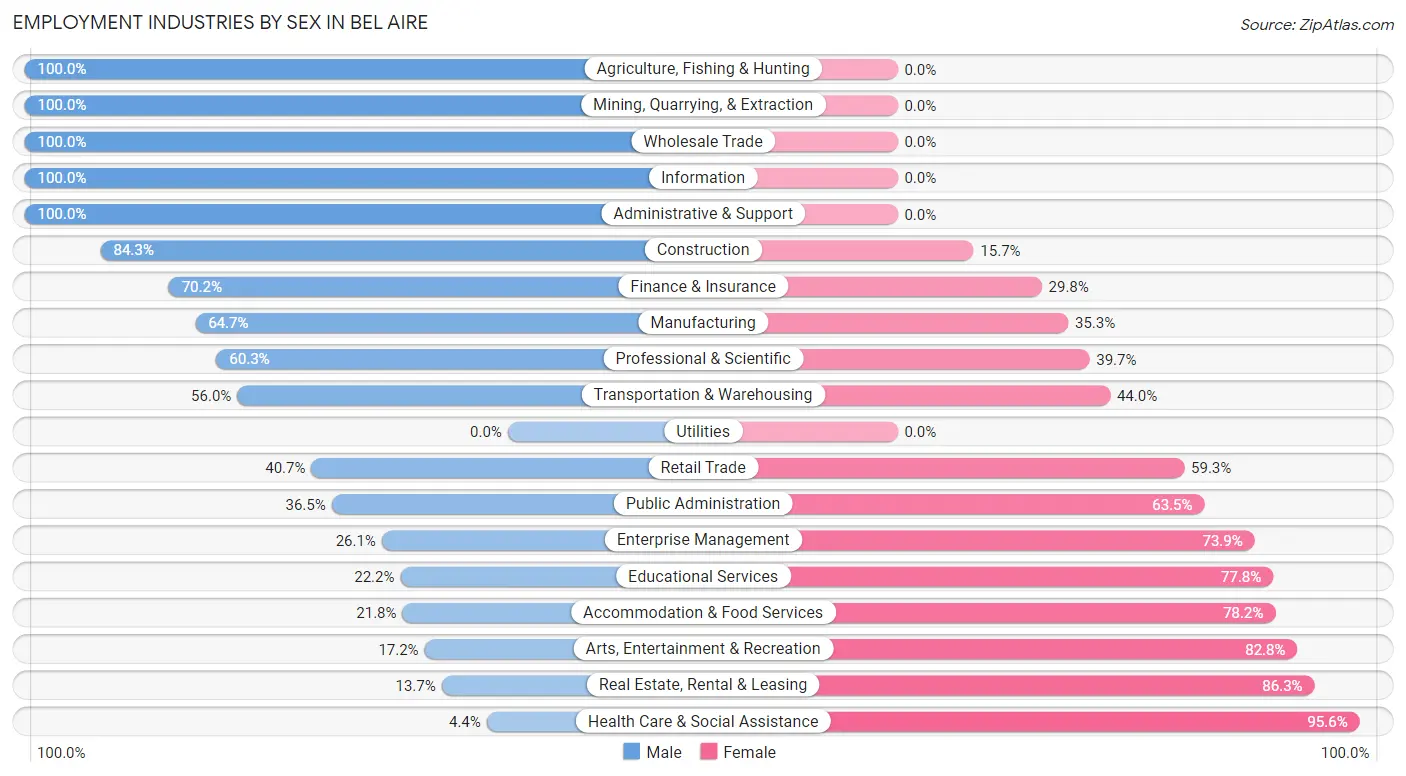
Employment Industries by Sex in Bel Aire
The Bel Aire industries that see more men than women are Agriculture, Fishing & Hunting (100.0%), Mining, Quarrying, & Extraction (100.0%), and Wholesale Trade (100.0%), whereas the industries that tend to have a higher number of women are Health Care & Social Assistance (95.6%), Real Estate, Rental & Leasing (86.3%), and Arts, Entertainment & Recreation (82.8%).
| Industry | Male | Female |
| Agriculture, Fishing & Hunting | 16 (100.0%) | 0 (0.0%) |
| Mining, Quarrying, & Extraction | 29 (100.0%) | 0 (0.0%) |
| Construction | 150 (84.3%) | 28 (15.7%) |
| Manufacturing | 434 (64.7%) | 237 (35.3%) |
| Wholesale Trade | 62 (100.0%) | 0 (0.0%) |
| Retail Trade | 124 (40.7%) | 181 (59.3%) |
| Transportation & Warehousing | 56 (56.0%) | 44 (44.0%) |
| Utilities | 0 (0.0%) | 0 (0.0%) |
| Information | 46 (100.0%) | 0 (0.0%) |
| Finance & Insurance | 181 (70.2%) | 77 (29.8%) |
| Real Estate, Rental & Leasing | 10 (13.7%) | 63 (86.3%) |
| Professional & Scientific | 249 (60.3%) | 164 (39.7%) |
| Enterprise Management | 6 (26.1%) | 17 (73.9%) |
| Administrative & Support | 175 (100.0%) | 0 (0.0%) |
| Educational Services | 147 (22.2%) | 514 (77.8%) |
| Health Care & Social Assistance | 19 (4.4%) | 416 (95.6%) |
| Arts, Entertainment & Recreation | 10 (17.2%) | 48 (82.8%) |
| Accommodation & Food Services | 53 (21.8%) | 190 (78.2%) |
| Public Administration | 62 (36.5%) | 108 (63.5%) |
| Total | 2,148 (50.1%) | 2,138 (49.9%) |
Education in Bel Aire
School Enrollment in Bel Aire
The most common levels of schooling among the 2,202 students in Bel Aire are high school (657 | 29.8%), middle school (391 | 17.8%), and college / undergraduate (371 | 16.9%).
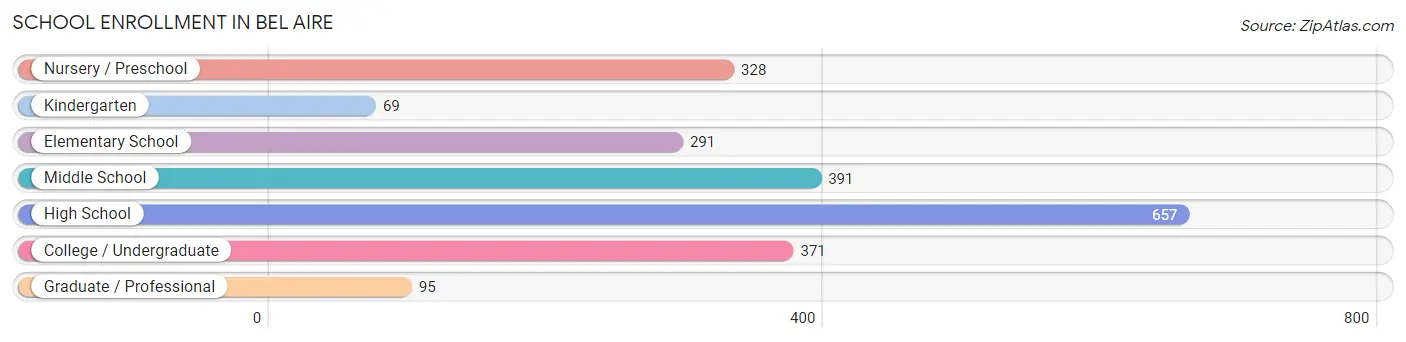
| School Level | # Students | % Students |
| Nursery / Preschool | 328 | 14.9% |
| Kindergarten | 69 | 3.1% |
| Elementary School | 291 | 13.2% |
| Middle School | 391 | 17.8% |
| High School | 657 | 29.8% |
| College / Undergraduate | 371 | 16.9% |
| Graduate / Professional | 95 | 4.3% |
| Total | 2,202 | 100.0% |
School Enrollment by Age by Funding Source in Bel Aire
Out of a total of 2,202 students who are enrolled in schools in Bel Aire, 777 (35.3%) attend a private institution, while the remaining 1,425 (64.7%) are enrolled in public schools. The age group of 18 to 19 year olds has the highest likelihood of being enrolled in private schools, with 172 (53.9% in the age bracket) enrolled. Conversely, the age group of 20 to 24 year olds has the lowest likelihood of being enrolled in a private school, with 184 (100.0% in the age bracket) attending a public institution.
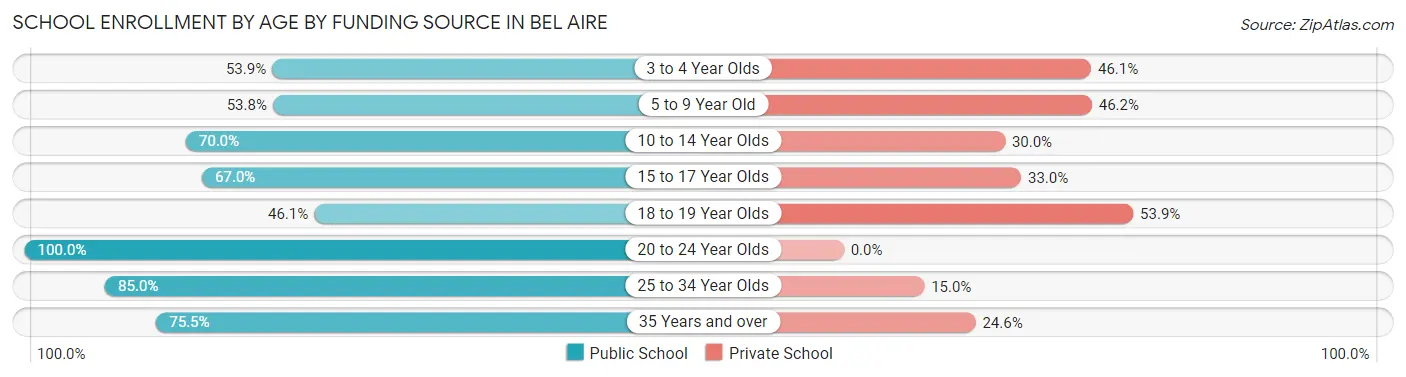
| Age Bracket | Public School | Private School |
| 3 to 4 Year Olds | 117 (53.9%) | 100 (46.1%) |
| 5 to 9 Year Old | 235 (53.8%) | 202 (46.2%) |
| 10 to 14 Year Olds | 347 (70.0%) | 149 (30.0%) |
| 15 to 17 Year Olds | 227 (67.0%) | 112 (33.0%) |
| 18 to 19 Year Olds | 147 (46.1%) | 172 (53.9%) |
| 20 to 24 Year Olds | 184 (100.0%) | 0 (0.0%) |
| 25 to 34 Year Olds | 85 (85.0%) | 15 (15.0%) |
| 35 Years and over | 83 (75.4%) | 27 (24.5%) |
| Total | 1,425 (64.7%) | 777 (35.3%) |
Educational Attainment by Field of Study in Bel Aire
Business (729 | 24.1%), education (444 | 14.7%), science & technology (376 | 12.4%), visual & performing arts (279 | 9.2%), and arts & humanities (194 | 6.4%) are the most common fields of study among 3,027 individuals in Bel Aire who have obtained a bachelor's degree or higher.

| Field of Study | # Graduates | % Graduates |
| Computers & Mathematics | 98 | 3.2% |
| Bio, Nature & Agricultural | 175 | 5.8% |
| Physical & Health Sciences | 65 | 2.1% |
| Psychology | 80 | 2.6% |
| Social Sciences | 166 | 5.5% |
| Engineering | 190 | 6.3% |
| Multidisciplinary Studies | 12 | 0.4% |
| Science & Technology | 376 | 12.4% |
| Business | 729 | 24.1% |
| Education | 444 | 14.7% |
| Literature & Languages | 66 | 2.2% |
| Liberal Arts & History | 89 | 2.9% |
| Visual & Performing Arts | 279 | 9.2% |
| Communications | 64 | 2.1% |
| Arts & Humanities | 194 | 6.4% |
| Total | 3,027 | 100.0% |
Transportation & Commute in Bel Aire
Vehicle Availability by Sex in Bel Aire
The most prevalent vehicle ownership categories in Bel Aire are males with 2 vehicles (995, accounting for 47.2%) and females with 2 vehicles (987, making up 47.1%).
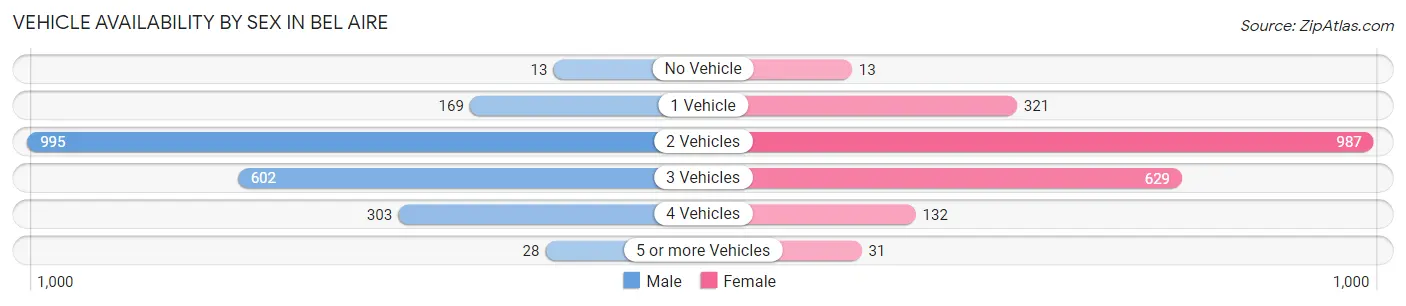
| Vehicles Available | Male | Female |
| No Vehicle | 13 (0.6%) | 13 (0.6%) |
| 1 Vehicle | 169 (8.0%) | 321 (15.2%) |
| 2 Vehicles | 995 (47.2%) | 987 (46.7%) |
| 3 Vehicles | 602 (28.5%) | 629 (29.8%) |
| 4 Vehicles | 303 (14.4%) | 132 (6.2%) |
| 5 or more Vehicles | 28 (1.3%) | 31 (1.5%) |
| Total | 2,110 (100.0%) | 2,113 (100.0%) |
Commute Time in Bel Aire
The most frequently occuring commute durations in Bel Aire are 20 to 24 minutes (1,007 commuters, 26.7%), 15 to 19 minutes (712 commuters, 18.9%), and 10 to 14 minutes (708 commuters, 18.8%).
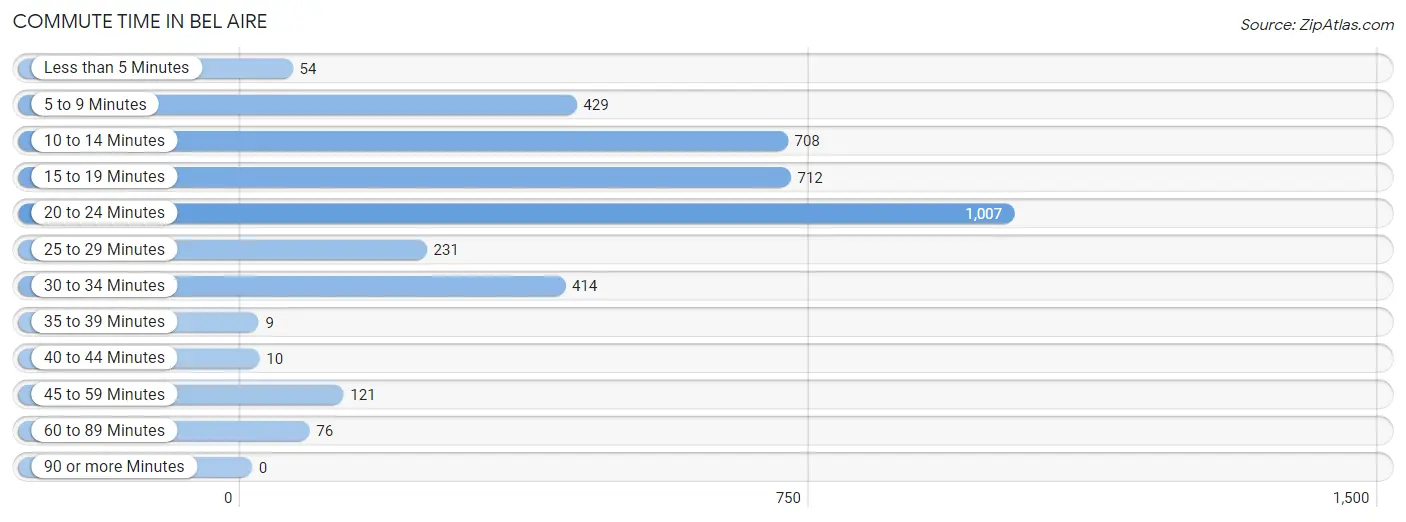
| Commute Time | # Commuters | % Commuters |
| Less than 5 Minutes | 54 | 1.4% |
| 5 to 9 Minutes | 429 | 11.4% |
| 10 to 14 Minutes | 708 | 18.8% |
| 15 to 19 Minutes | 712 | 18.9% |
| 20 to 24 Minutes | 1,007 | 26.7% |
| 25 to 29 Minutes | 231 | 6.1% |
| 30 to 34 Minutes | 414 | 11.0% |
| 35 to 39 Minutes | 9 | 0.2% |
| 40 to 44 Minutes | 10 | 0.3% |
| 45 to 59 Minutes | 121 | 3.2% |
| 60 to 89 Minutes | 76 | 2.0% |
| 90 or more Minutes | 0 | 0.0% |
Commute Time by Sex in Bel Aire
The most common commute times in Bel Aire are 15 to 19 minutes (434 commuters, 22.2%) for males and 20 to 24 minutes (605 commuters, 33.4%) for females.
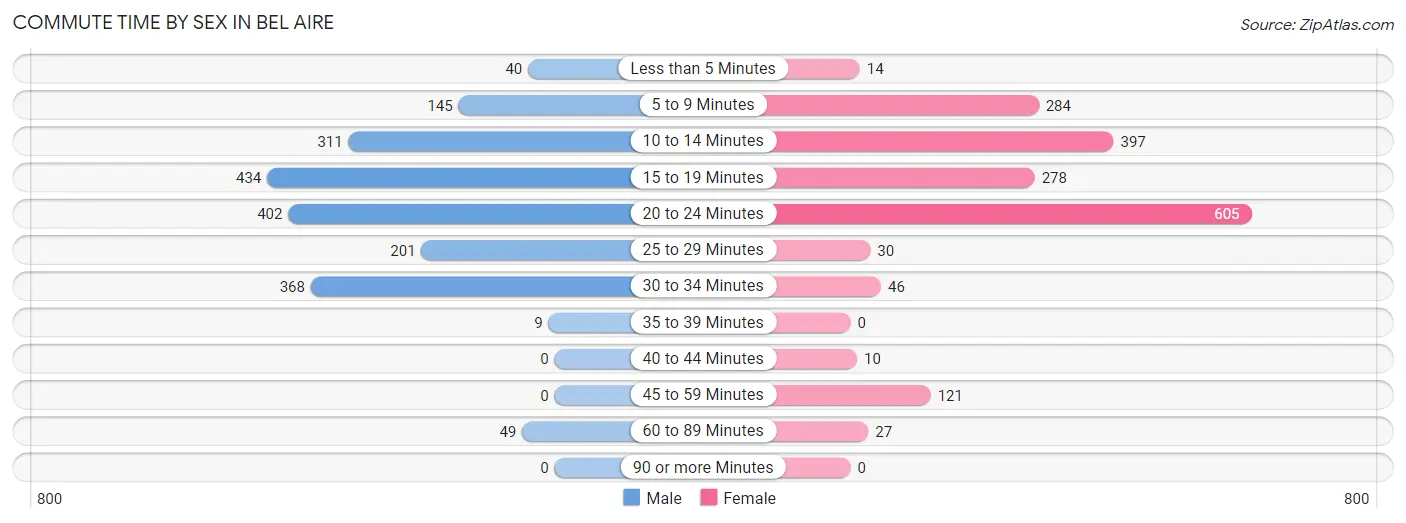
| Commute Time | Male | Female |
| Less than 5 Minutes | 40 (2.0%) | 14 (0.8%) |
| 5 to 9 Minutes | 145 (7.4%) | 284 (15.7%) |
| 10 to 14 Minutes | 311 (15.9%) | 397 (21.9%) |
| 15 to 19 Minutes | 434 (22.2%) | 278 (15.3%) |
| 20 to 24 Minutes | 402 (20.5%) | 605 (33.4%) |
| 25 to 29 Minutes | 201 (10.3%) | 30 (1.7%) |
| 30 to 34 Minutes | 368 (18.8%) | 46 (2.5%) |
| 35 to 39 Minutes | 9 (0.5%) | 0 (0.0%) |
| 40 to 44 Minutes | 0 (0.0%) | 10 (0.5%) |
| 45 to 59 Minutes | 0 (0.0%) | 121 (6.7%) |
| 60 to 89 Minutes | 49 (2.5%) | 27 (1.5%) |
| 90 or more Minutes | 0 (0.0%) | 0 (0.0%) |
Time of Departure to Work by Sex in Bel Aire
The most frequent times of departure to work in Bel Aire are 7:30 AM to 7:59 AM (488, 24.9%) for males and 7:30 AM to 7:59 AM (396, 21.8%) for females.
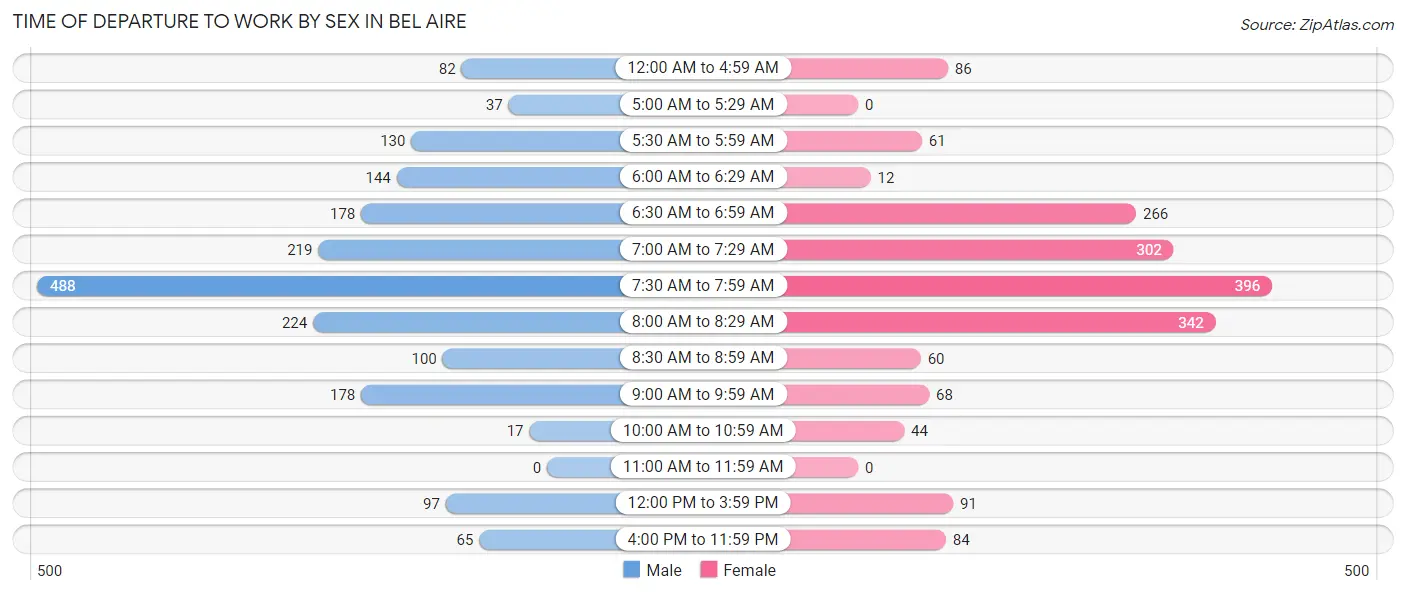
| Time of Departure | Male | Female |
| 12:00 AM to 4:59 AM | 82 (4.2%) | 86 (4.8%) |
| 5:00 AM to 5:29 AM | 37 (1.9%) | 0 (0.0%) |
| 5:30 AM to 5:59 AM | 130 (6.6%) | 61 (3.4%) |
| 6:00 AM to 6:29 AM | 144 (7.3%) | 12 (0.7%) |
| 6:30 AM to 6:59 AM | 178 (9.1%) | 266 (14.7%) |
| 7:00 AM to 7:29 AM | 219 (11.2%) | 302 (16.7%) |
| 7:30 AM to 7:59 AM | 488 (24.9%) | 396 (21.8%) |
| 8:00 AM to 8:29 AM | 224 (11.4%) | 342 (18.9%) |
| 8:30 AM to 8:59 AM | 100 (5.1%) | 60 (3.3%) |
| 9:00 AM to 9:59 AM | 178 (9.1%) | 68 (3.7%) |
| 10:00 AM to 10:59 AM | 17 (0.9%) | 44 (2.4%) |
| 11:00 AM to 11:59 AM | 0 (0.0%) | 0 (0.0%) |
| 12:00 PM to 3:59 PM | 97 (5.0%) | 91 (5.0%) |
| 4:00 PM to 11:59 PM | 65 (3.3%) | 84 (4.6%) |
| Total | 1,959 (100.0%) | 1,812 (100.0%) |
Housing Occupancy in Bel Aire
Occupancy by Ownership in Bel Aire
Of the total 2,911 dwellings in Bel Aire, owner-occupied units account for 2,269 (77.9%), while renter-occupied units make up 642 (22.1%).
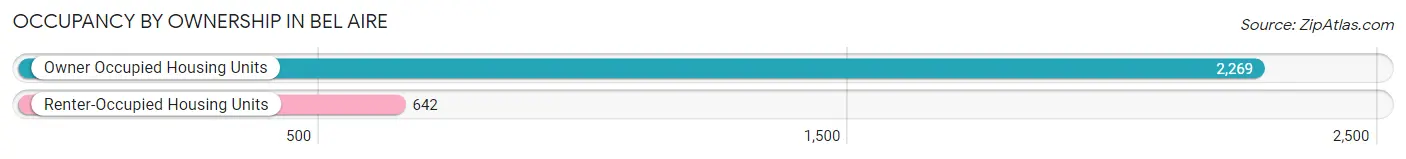
| Occupancy | # Housing Units | % Housing Units |
| Owner Occupied Housing Units | 2,269 | 77.9% |
| Renter-Occupied Housing Units | 642 | 22.1% |
| Total Occupied Housing Units | 2,911 | 100.0% |
Occupancy by Household Size in Bel Aire
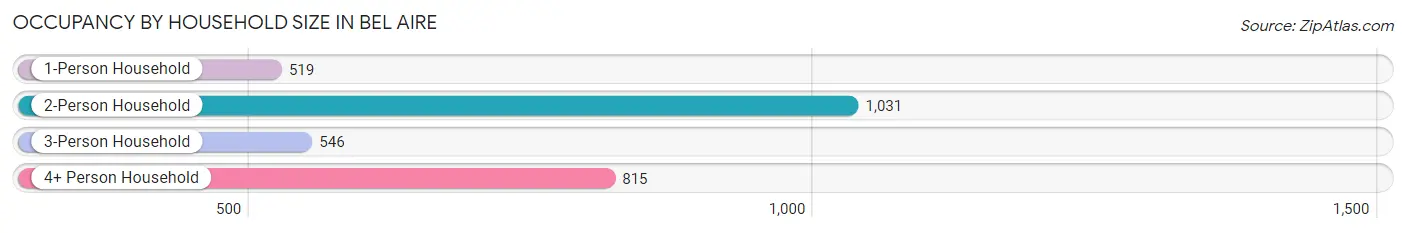
| Household Size | # Housing Units | % Housing Units |
| 1-Person Household | 519 | 17.8% |
| 2-Person Household | 1,031 | 35.4% |
| 3-Person Household | 546 | 18.8% |
| 4+ Person Household | 815 | 28.0% |
| Total Housing Units | 2,911 | 100.0% |
Occupancy by Ownership by Household Size in Bel Aire
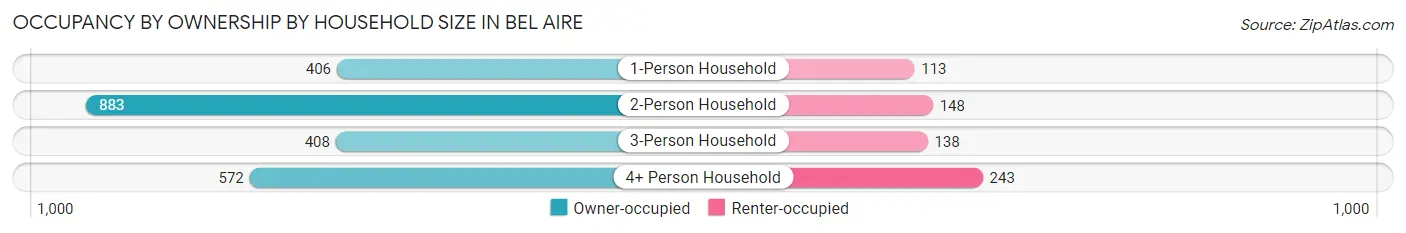
| Household Size | Owner-occupied | Renter-occupied |
| 1-Person Household | 406 (78.2%) | 113 (21.8%) |
| 2-Person Household | 883 (85.7%) | 148 (14.3%) |
| 3-Person Household | 408 (74.7%) | 138 (25.3%) |
| 4+ Person Household | 572 (70.2%) | 243 (29.8%) |
| Total Housing Units | 2,269 (77.9%) | 642 (22.1%) |
Occupancy by Educational Attainment in Bel Aire
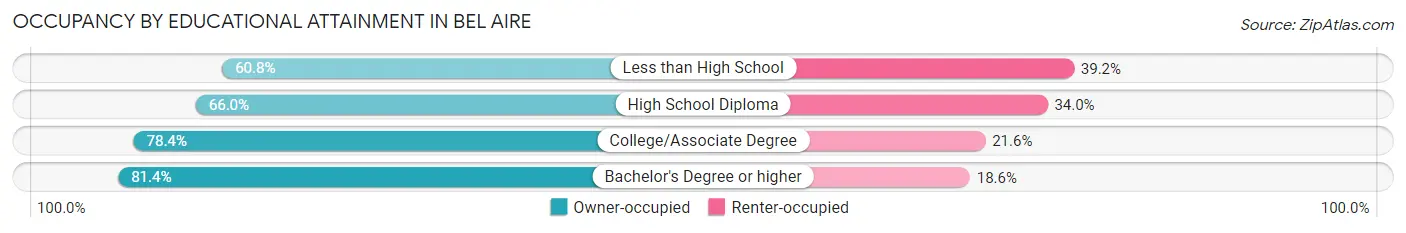
| Household Size | Owner-occupied | Renter-occupied |
| Less than High School | 45 (60.8%) | 29 (39.2%) |
| High School Diploma | 245 (66.0%) | 126 (34.0%) |
| College/Associate Degree | 747 (78.4%) | 206 (21.6%) |
| Bachelor's Degree or higher | 1,232 (81.4%) | 281 (18.6%) |
Occupancy by Age of Householder in Bel Aire
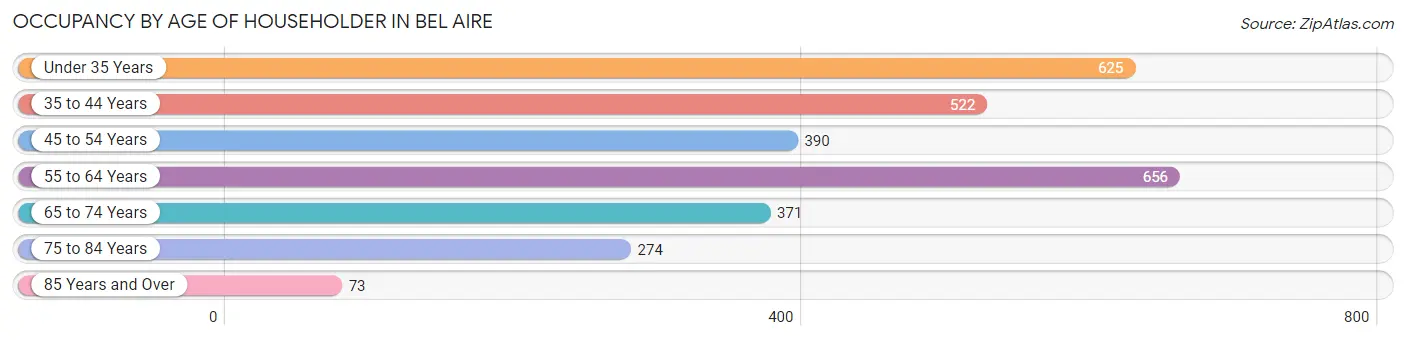
| Age Bracket | # Households | % Households |
| Under 35 Years | 625 | 21.5% |
| 35 to 44 Years | 522 | 17.9% |
| 45 to 54 Years | 390 | 13.4% |
| 55 to 64 Years | 656 | 22.5% |
| 65 to 74 Years | 371 | 12.7% |
| 75 to 84 Years | 274 | 9.4% |
| 85 Years and Over | 73 | 2.5% |
| Total | 2,911 | 100.0% |
Housing Finances in Bel Aire
Median Income by Occupancy in Bel Aire
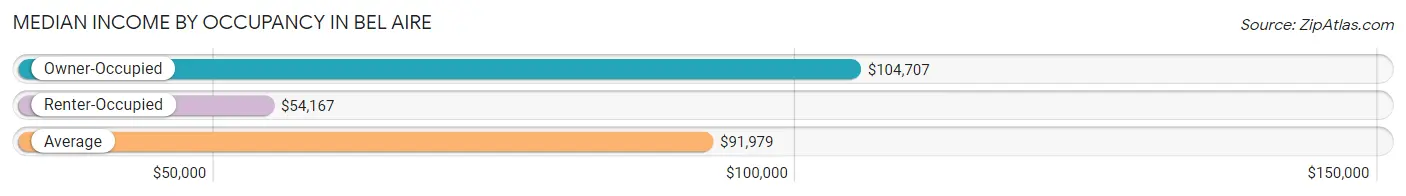
| Occupancy Type | # Households | Median Income |
| Owner-Occupied | 2,269 (77.9%) | $104,707 |
| Renter-Occupied | 642 (22.1%) | $54,167 |
| Average | 2,911 (100.0%) | $91,979 |
Occupancy by Householder Income Bracket in Bel Aire
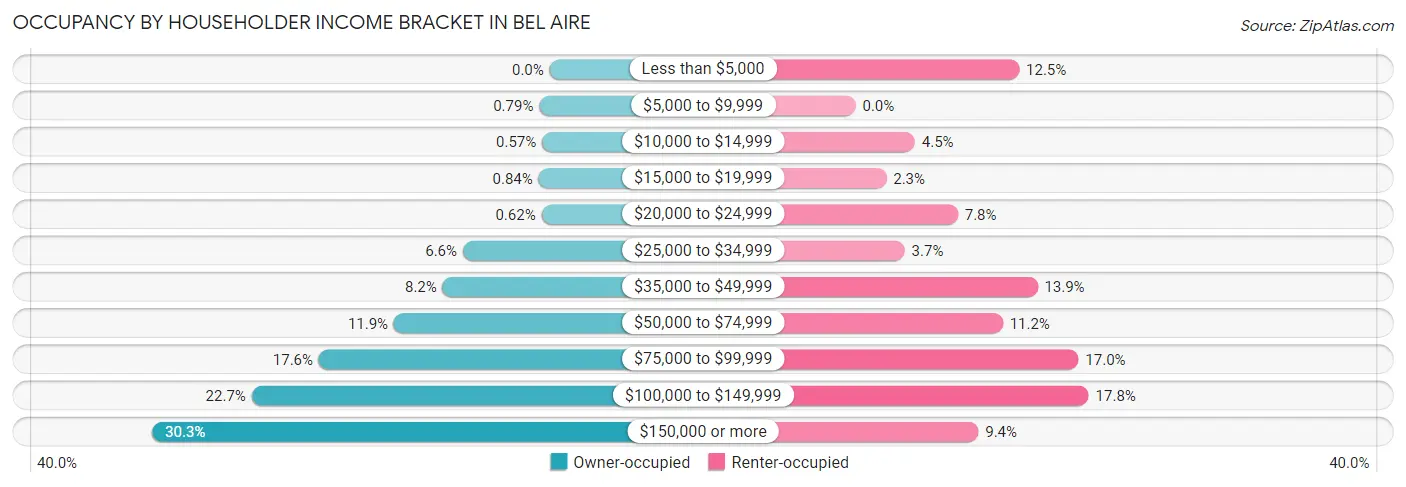
| Income Bracket | Owner-occupied | Renter-occupied |
| Less than $5,000 | 0 (0.0%) | 80 (12.5%) |
| $5,000 to $9,999 | 18 (0.8%) | 0 (0.0%) |
| $10,000 to $14,999 | 13 (0.6%) | 29 (4.5%) |
| $15,000 to $19,999 | 19 (0.8%) | 15 (2.3%) |
| $20,000 to $24,999 | 14 (0.6%) | 50 (7.8%) |
| $25,000 to $34,999 | 150 (6.6%) | 24 (3.7%) |
| $35,000 to $49,999 | 185 (8.2%) | 89 (13.9%) |
| $50,000 to $74,999 | 269 (11.9%) | 72 (11.2%) |
| $75,000 to $99,999 | 399 (17.6%) | 109 (17.0%) |
| $100,000 to $149,999 | 515 (22.7%) | 114 (17.8%) |
| $150,000 or more | 687 (30.3%) | 60 (9.3%) |
| Total | 2,269 (100.0%) | 642 (100.0%) |
Monthly Housing Cost Tiers in Bel Aire
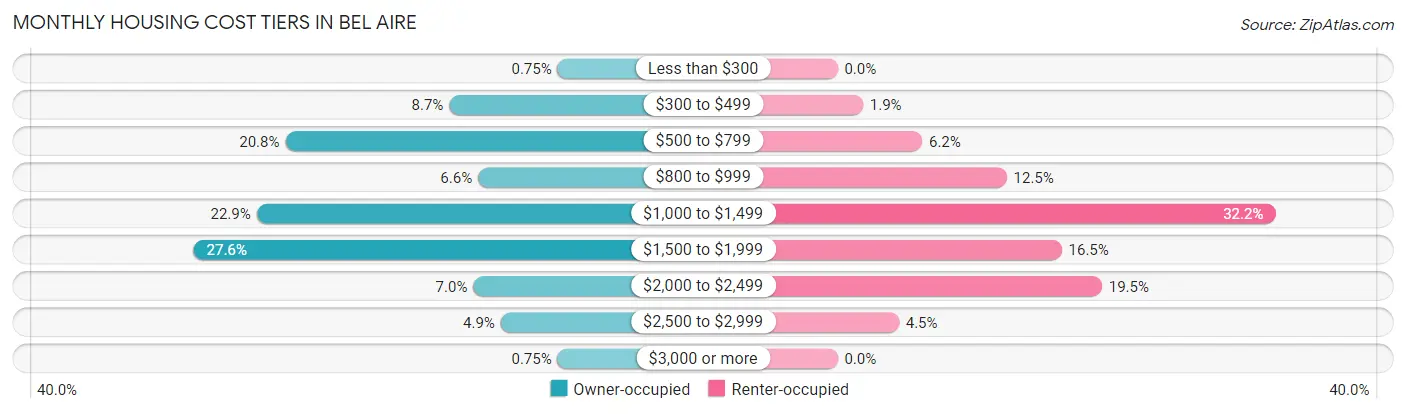
| Monthly Cost | Owner-occupied | Renter-occupied |
| Less than $300 | 17 (0.7%) | 0 (0.0%) |
| $300 to $499 | 198 (8.7%) | 12 (1.9%) |
| $500 to $799 | 472 (20.8%) | 40 (6.2%) |
| $800 to $999 | 150 (6.6%) | 80 (12.5%) |
| $1,000 to $1,499 | 520 (22.9%) | 207 (32.2%) |
| $1,500 to $1,999 | 625 (27.6%) | 106 (16.5%) |
| $2,000 to $2,499 | 158 (7.0%) | 125 (19.5%) |
| $2,500 to $2,999 | 112 (4.9%) | 29 (4.5%) |
| $3,000 or more | 17 (0.7%) | 0 (0.0%) |
| Total | 2,269 (100.0%) | 642 (100.0%) |
Physical Housing Characteristics in Bel Aire
Housing Structures in Bel Aire
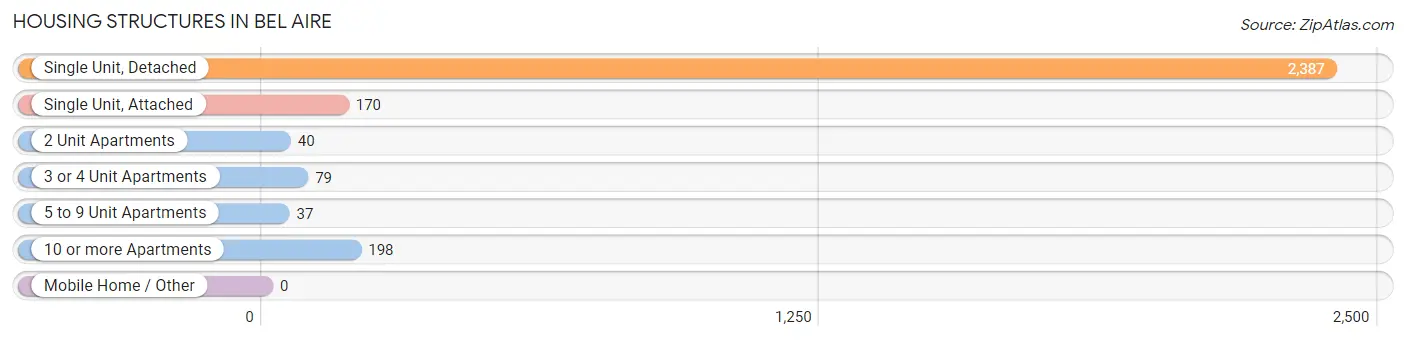
| Structure Type | # Housing Units | % Housing Units |
| Single Unit, Detached | 2,387 | 82.0% |
| Single Unit, Attached | 170 | 5.8% |
| 2 Unit Apartments | 40 | 1.4% |
| 3 or 4 Unit Apartments | 79 | 2.7% |
| 5 to 9 Unit Apartments | 37 | 1.3% |
| 10 or more Apartments | 198 | 6.8% |
| Mobile Home / Other | 0 | 0.0% |
| Total | 2,911 | 100.0% |
Housing Structures by Occupancy in Bel Aire
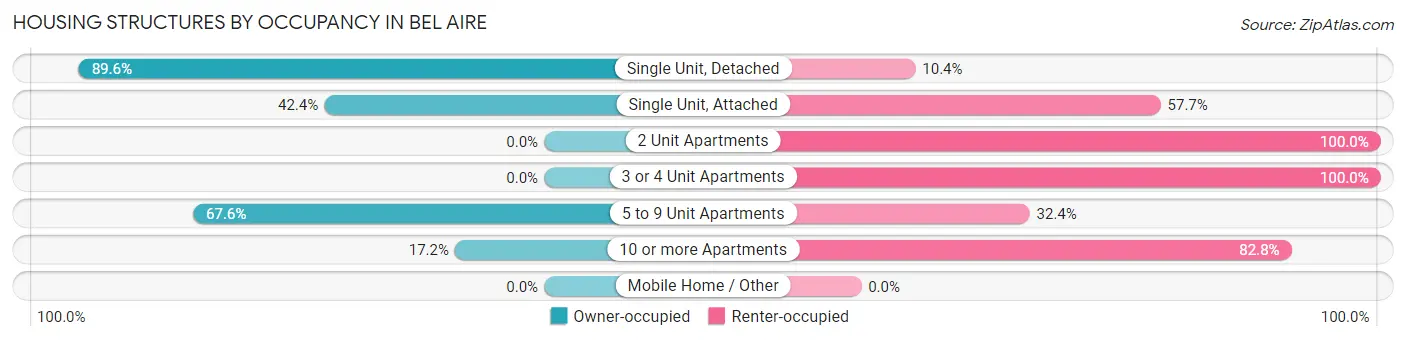
| Structure Type | Owner-occupied | Renter-occupied |
| Single Unit, Detached | 2,138 (89.6%) | 249 (10.4%) |
| Single Unit, Attached | 72 (42.3%) | 98 (57.7%) |
| 2 Unit Apartments | 0 (0.0%) | 40 (100.0%) |
| 3 or 4 Unit Apartments | 0 (0.0%) | 79 (100.0%) |
| 5 to 9 Unit Apartments | 25 (67.6%) | 12 (32.4%) |
| 10 or more Apartments | 34 (17.2%) | 164 (82.8%) |
| Mobile Home / Other | 0 (0.0%) | 0 (0.0%) |
| Total | 2,269 (77.9%) | 642 (22.1%) |
Housing Structures by Number of Rooms in Bel Aire
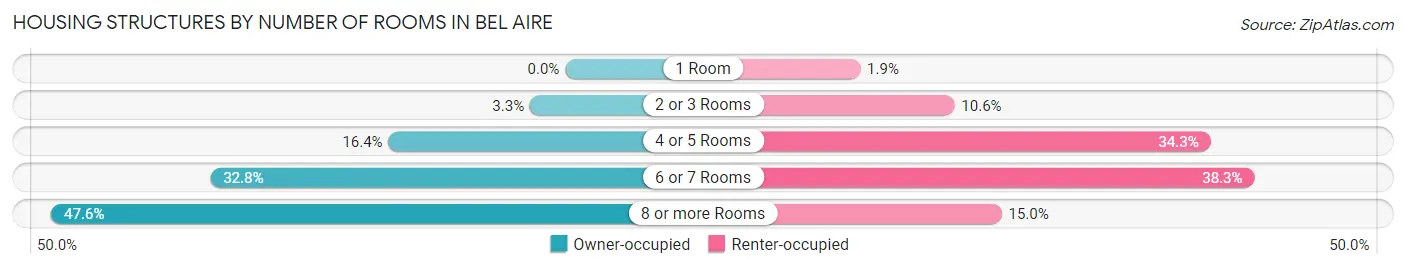
| Number of Rooms | Owner-occupied | Renter-occupied |
| 1 Room | 0 (0.0%) | 12 (1.9%) |
| 2 or 3 Rooms | 74 (3.3%) | 68 (10.6%) |
| 4 or 5 Rooms | 371 (16.4%) | 220 (34.3%) |
| 6 or 7 Rooms | 745 (32.8%) | 246 (38.3%) |
| 8 or more Rooms | 1,079 (47.5%) | 96 (14.9%) |
| Total | 2,269 (100.0%) | 642 (100.0%) |
Housing Structure by Heating Type in Bel Aire
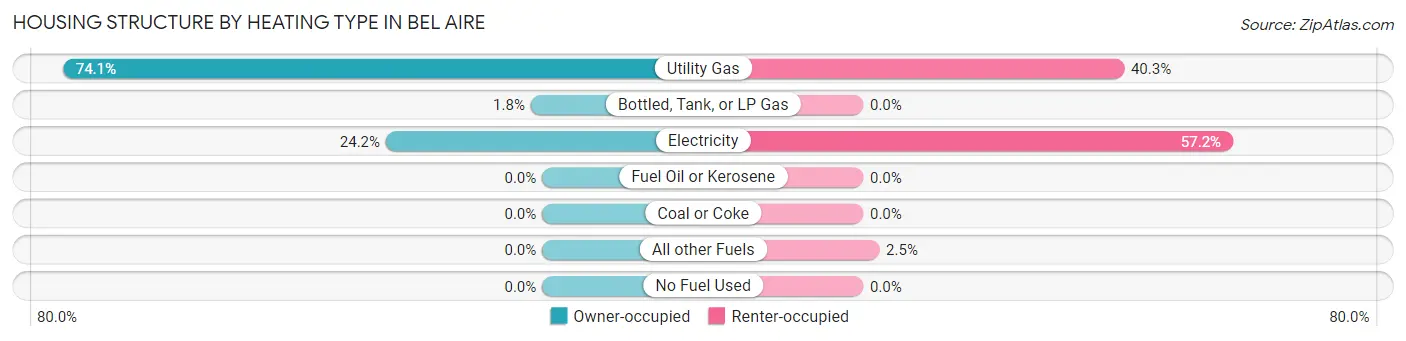
| Heating Type | Owner-occupied | Renter-occupied |
| Utility Gas | 1,681 (74.1%) | 259 (40.3%) |
| Bottled, Tank, or LP Gas | 40 (1.8%) | 0 (0.0%) |
| Electricity | 548 (24.1%) | 367 (57.2%) |
| Fuel Oil or Kerosene | 0 (0.0%) | 0 (0.0%) |
| Coal or Coke | 0 (0.0%) | 0 (0.0%) |
| All other Fuels | 0 (0.0%) | 16 (2.5%) |
| No Fuel Used | 0 (0.0%) | 0 (0.0%) |
| Total | 2,269 (100.0%) | 642 (100.0%) |
Household Vehicle Usage in Bel Aire
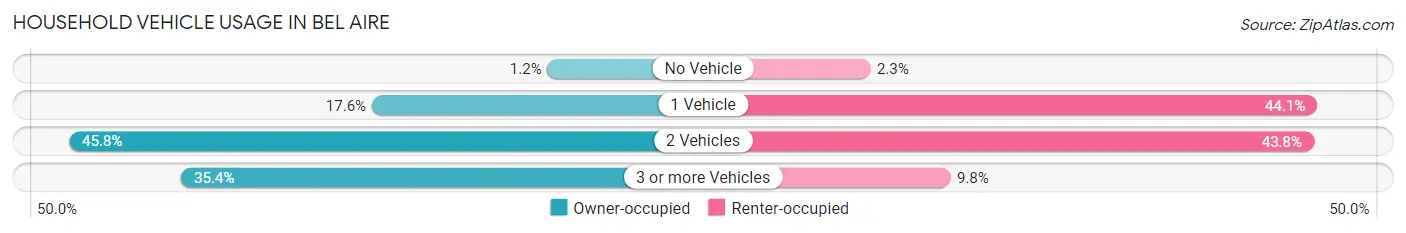
| Vehicles per Household | Owner-occupied | Renter-occupied |
| No Vehicle | 27 (1.2%) | 15 (2.3%) |
| 1 Vehicle | 399 (17.6%) | 283 (44.1%) |
| 2 Vehicles | 1,040 (45.8%) | 281 (43.8%) |
| 3 or more Vehicles | 803 (35.4%) | 63 (9.8%) |
| Total | 2,269 (100.0%) | 642 (100.0%) |
Real Estate & Mortgages in Bel Aire
Real Estate and Mortgage Overview in Bel Aire
| Characteristic | Without Mortgage | With Mortgage |
| Housing Units | 792 | 1,477 |
| Median Property Value | $185,800 | $188,900 |
| Median Household Income | $79,492 | $520 |
| Monthly Housing Costs | $709 | $17 |
| Real Estate Taxes | $2,665 | $9 |
Property Value by Mortgage Status in Bel Aire
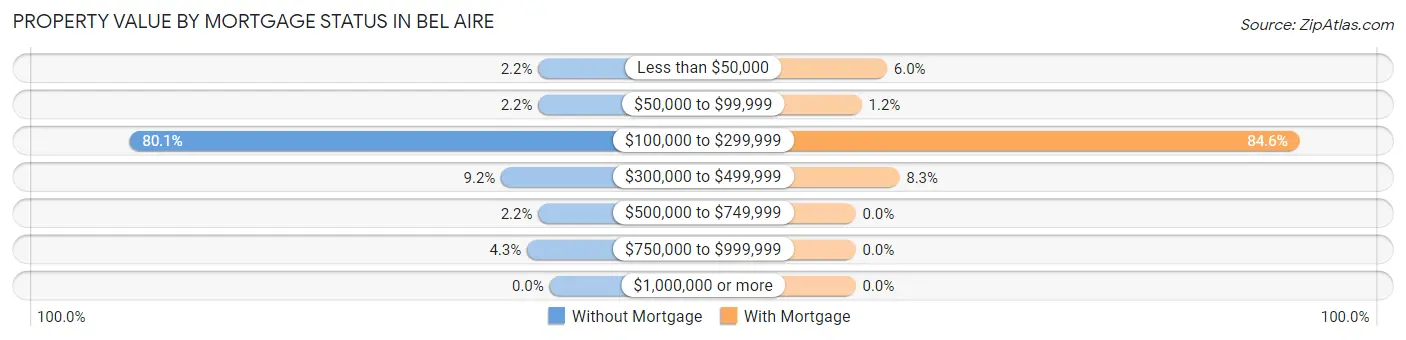
| Property Value | Without Mortgage | With Mortgage |
| Less than $50,000 | 17 (2.1%) | 88 (6.0%) |
| $50,000 to $99,999 | 17 (2.1%) | 17 (1.1%) |
| $100,000 to $299,999 | 634 (80.0%) | 1,249 (84.6%) |
| $300,000 to $499,999 | 73 (9.2%) | 123 (8.3%) |
| $500,000 to $749,999 | 17 (2.1%) | 0 (0.0%) |
| $750,000 to $999,999 | 34 (4.3%) | 0 (0.0%) |
| $1,000,000 or more | 0 (0.0%) | 0 (0.0%) |
| Total | 792 (100.0%) | 1,477 (100.0%) |
Household Income by Mortgage Status in Bel Aire
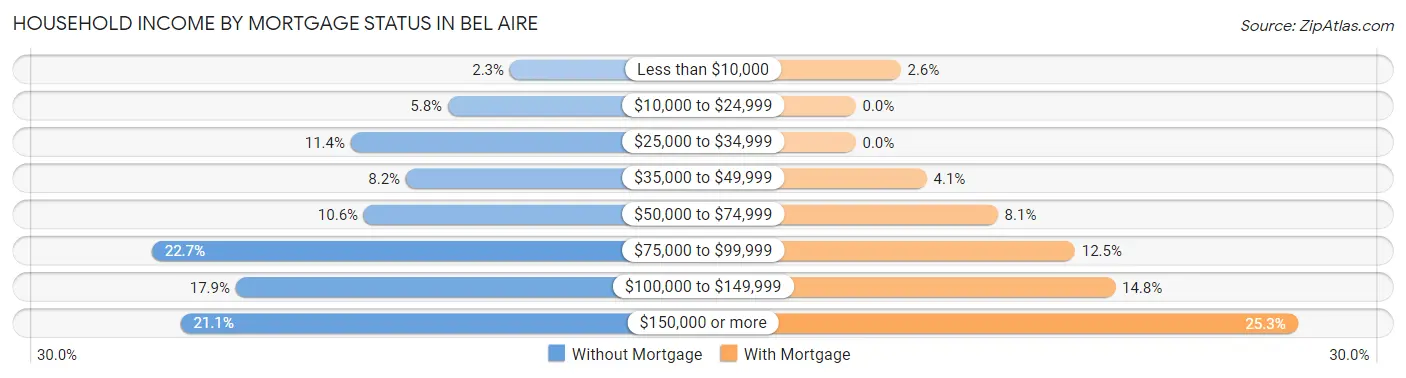
| Household Income | Without Mortgage | With Mortgage |
| Less than $10,000 | 18 (2.3%) | 38 (2.6%) |
| $10,000 to $24,999 | 46 (5.8%) | 0 (0.0%) |
| $25,000 to $34,999 | 90 (11.4%) | 0 (0.0%) |
| $35,000 to $49,999 | 65 (8.2%) | 60 (4.1%) |
| $50,000 to $74,999 | 84 (10.6%) | 120 (8.1%) |
| $75,000 to $99,999 | 180 (22.7%) | 185 (12.5%) |
| $100,000 to $149,999 | 142 (17.9%) | 219 (14.8%) |
| $150,000 or more | 167 (21.1%) | 373 (25.3%) |
| Total | 792 (100.0%) | 1,477 (100.0%) |
Property Value to Household Income Ratio in Bel Aire
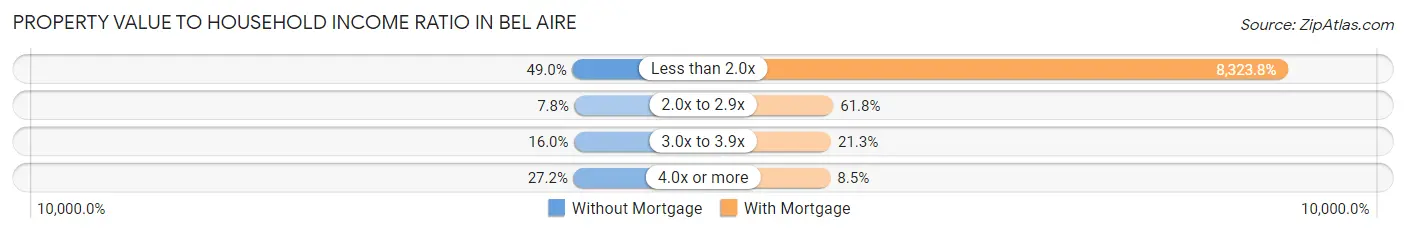
| Value-to-Income Ratio | Without Mortgage | With Mortgage |
| Less than 2.0x | 388 (49.0%) | 122,942 (8,323.8%) |
| 2.0x to 2.9x | 62 (7.8%) | 912 (61.8%) |
| 3.0x to 3.9x | 127 (16.0%) | 314 (21.3%) |
| 4.0x or more | 215 (27.2%) | 126 (8.5%) |
| Total | 792 (100.0%) | 1,477 (100.0%) |
Real Estate Taxes by Mortgage Status in Bel Aire
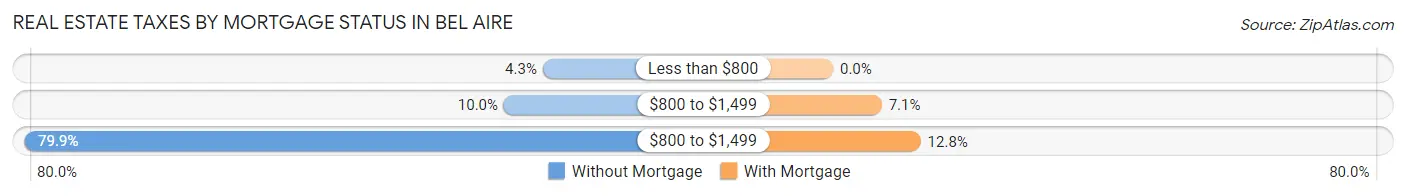
| Property Taxes | Without Mortgage | With Mortgage |
| Less than $800 | 34 (4.3%) | 0 (0.0%) |
| $800 to $1,499 | 79 (10.0%) | 105 (7.1%) |
| $800 to $1,499 | 633 (79.9%) | 189 (12.8%) |
| Total | 792 (100.0%) | 1,477 (100.0%) |
Health & Disability in Bel Aire
Health Insurance Coverage by Age in Bel Aire
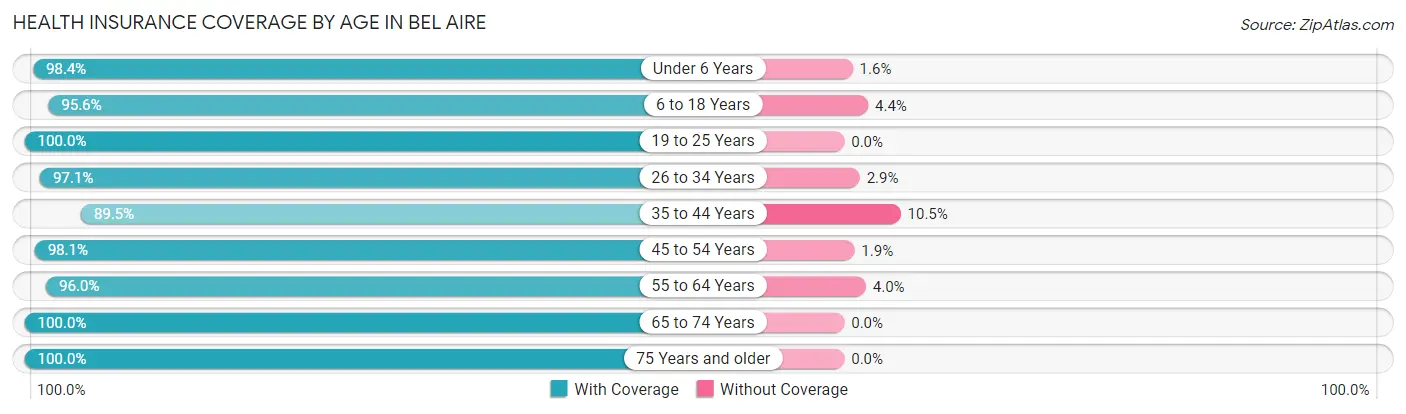
| Age Bracket | With Coverage | Without Coverage |
| Under 6 Years | 1,012 (98.4%) | 16 (1.6%) |
| 6 to 18 Years | 1,270 (95.6%) | 59 (4.4%) |
| 19 to 25 Years | 977 (100.0%) | 0 (0.0%) |
| 26 to 34 Years | 809 (97.1%) | 24 (2.9%) |
| 35 to 44 Years | 963 (89.5%) | 113 (10.5%) |
| 45 to 54 Years | 829 (98.1%) | 16 (1.9%) |
| 55 to 64 Years | 1,051 (96.0%) | 44 (4.0%) |
| 65 to 74 Years | 622 (100.0%) | 0 (0.0%) |
| 75 Years and older | 475 (100.0%) | 0 (0.0%) |
| Total | 8,008 (96.7%) | 272 (3.3%) |
Health Insurance Coverage by Citizenship Status in Bel Aire
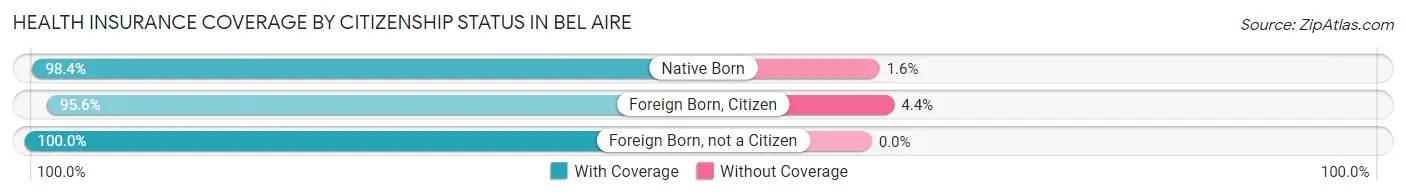
| Citizenship Status | With Coverage | Without Coverage |
| Native Born | 1,012 (98.4%) | 16 (1.6%) |
| Foreign Born, Citizen | 1,270 (95.6%) | 59 (4.4%) |
| Foreign Born, not a Citizen | 977 (100.0%) | 0 (0.0%) |
Health Insurance Coverage by Household Income in Bel Aire
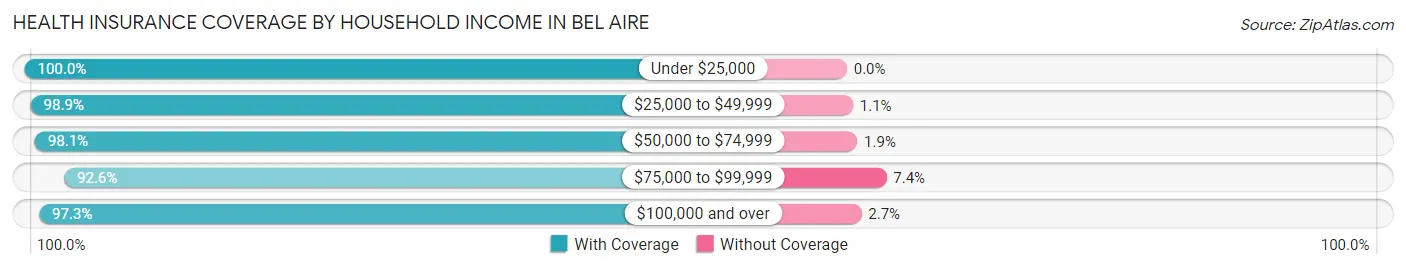
| Household Income | With Coverage | Without Coverage |
| Under $25,000 | 633 (100.0%) | 0 (0.0%) |
| $25,000 to $49,999 | 778 (98.9%) | 9 (1.1%) |
| $50,000 to $74,999 | 656 (98.1%) | 13 (1.9%) |
| $75,000 to $99,999 | 1,613 (92.6%) | 129 (7.4%) |
| $100,000 and over | 4,322 (97.3%) | 121 (2.7%) |
Public vs Private Health Insurance Coverage by Age in Bel Aire
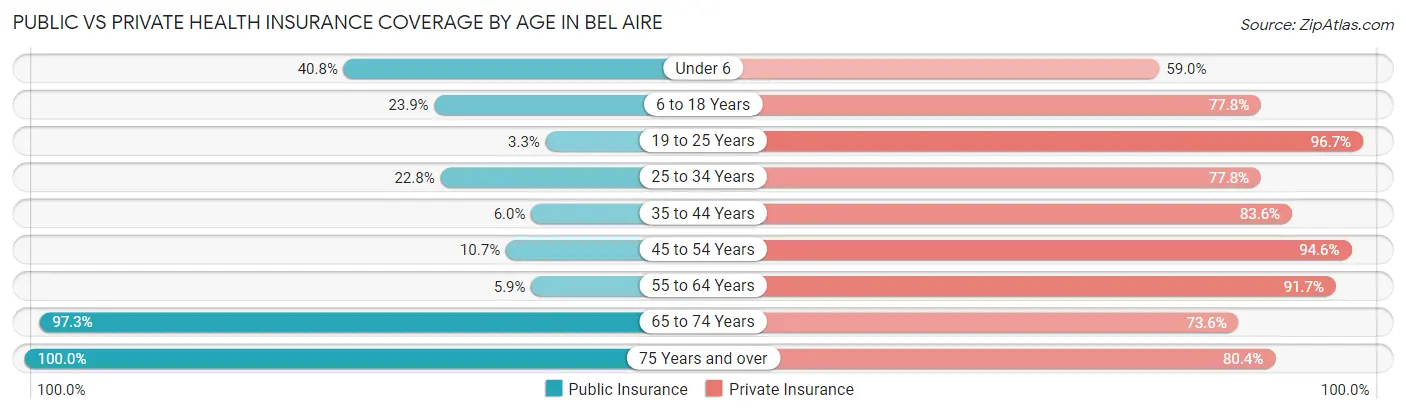
| Age Bracket | Public Insurance | Private Insurance |
| Under 6 | 419 (40.8%) | 606 (59.0%) |
| 6 to 18 Years | 318 (23.9%) | 1,034 (77.8%) |
| 19 to 25 Years | 32 (3.3%) | 945 (96.7%) |
| 25 to 34 Years | 190 (22.8%) | 648 (77.8%) |
| 35 to 44 Years | 64 (5.9%) | 899 (83.6%) |
| 45 to 54 Years | 90 (10.6%) | 799 (94.6%) |
| 55 to 64 Years | 65 (5.9%) | 1,004 (91.7%) |
| 65 to 74 Years | 605 (97.3%) | 458 (73.6%) |
| 75 Years and over | 475 (100.0%) | 382 (80.4%) |
| Total | 2,258 (27.3%) | 6,775 (81.8%) |
Disability Status by Sex by Age in Bel Aire
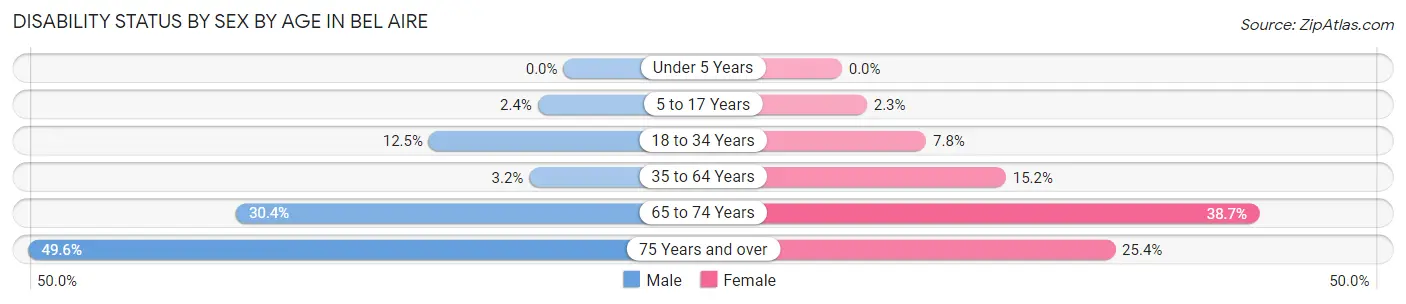
| Age Bracket | Male | Female |
| Under 5 Years | 0 (0.0%) | 0 (0.0%) |
| 5 to 17 Years | 17 (2.4%) | 14 (2.3%) |
| 18 to 34 Years | 106 (12.5%) | 88 (7.8%) |
| 35 to 64 Years | 46 (3.2%) | 238 (15.2%) |
| 65 to 74 Years | 72 (30.4%) | 149 (38.7%) |
| 75 Years and over | 134 (49.6%) | 52 (25.4%) |
Disability Class by Sex by Age in Bel Aire
Disability Class: Hearing Difficulty
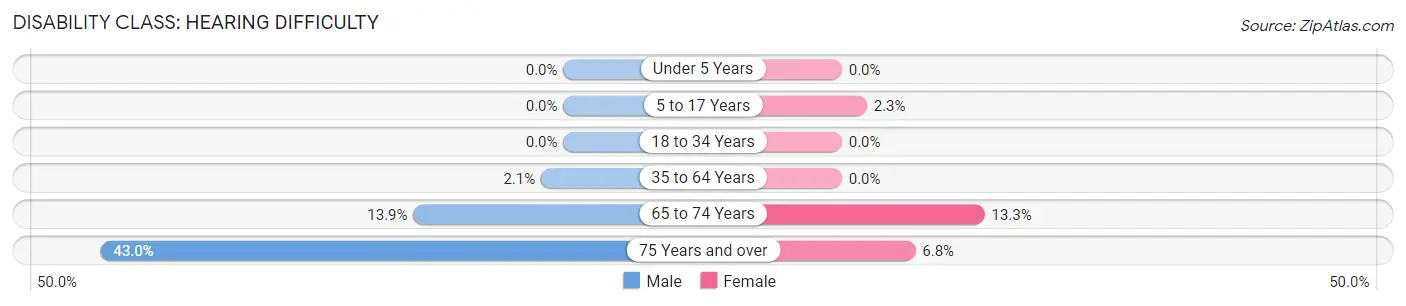
| Age Bracket | Male | Female |
| Under 5 Years | 0 (0.0%) | 0 (0.0%) |
| 5 to 17 Years | 0 (0.0%) | 14 (2.3%) |
| 18 to 34 Years | 0 (0.0%) | 0 (0.0%) |
| 35 to 64 Years | 30 (2.1%) | 0 (0.0%) |
| 65 to 74 Years | 33 (13.9%) | 51 (13.3%) |
| 75 Years and over | 116 (43.0%) | 14 (6.8%) |
Disability Class: Vision Difficulty
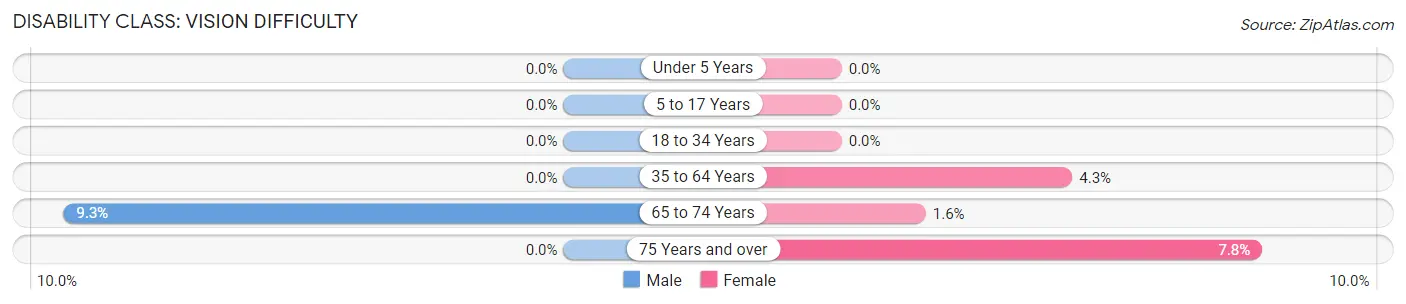
| Age Bracket | Male | Female |
| Under 5 Years | 0 (0.0%) | 0 (0.0%) |
| 5 to 17 Years | 0 (0.0%) | 0 (0.0%) |
| 18 to 34 Years | 0 (0.0%) | 0 (0.0%) |
| 35 to 64 Years | 0 (0.0%) | 67 (4.3%) |
| 65 to 74 Years | 22 (9.3%) | 6 (1.6%) |
| 75 Years and over | 0 (0.0%) | 16 (7.8%) |
Disability Class: Cognitive Difficulty
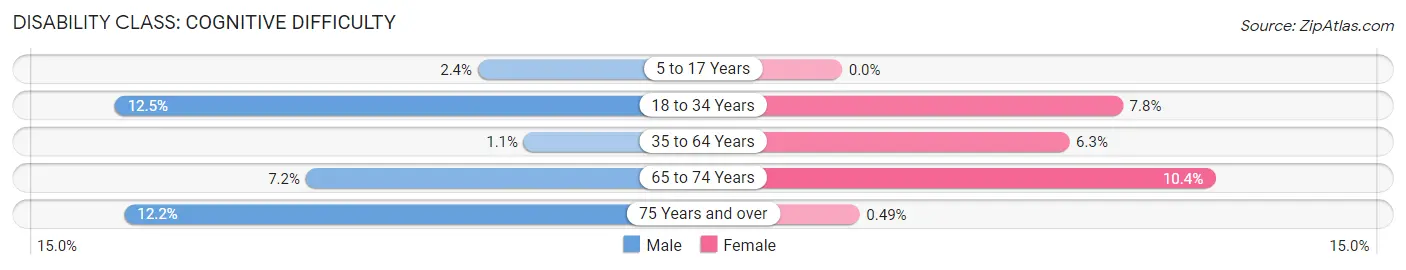
| Age Bracket | Male | Female |
| 5 to 17 Years | 17 (2.4%) | 0 (0.0%) |
| 18 to 34 Years | 106 (12.5%) | 88 (7.8%) |
| 35 to 64 Years | 16 (1.1%) | 99 (6.3%) |
| 65 to 74 Years | 17 (7.2%) | 40 (10.4%) |
| 75 Years and over | 33 (12.2%) | 1 (0.5%) |
Disability Class: Ambulatory Difficulty
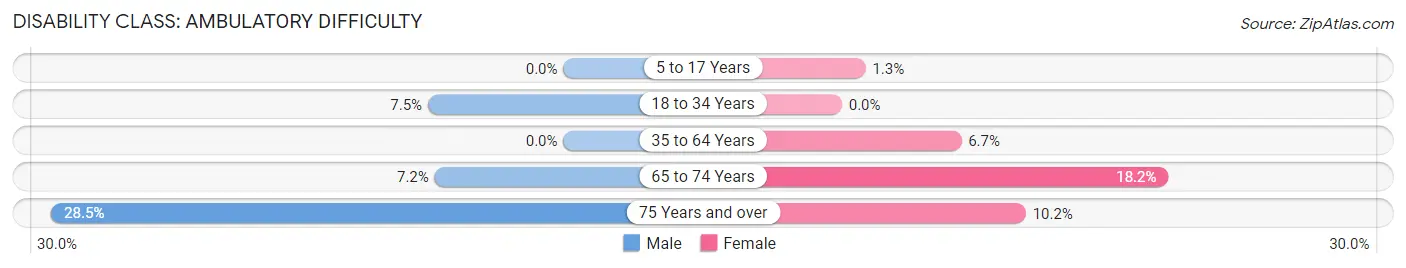
| Age Bracket | Male | Female |
| 5 to 17 Years | 0 (0.0%) | 8 (1.3%) |
| 18 to 34 Years | 64 (7.5%) | 0 (0.0%) |
| 35 to 64 Years | 0 (0.0%) | 104 (6.7%) |
| 65 to 74 Years | 17 (7.2%) | 70 (18.2%) |
| 75 Years and over | 77 (28.5%) | 21 (10.2%) |
Disability Class: Self-Care Difficulty
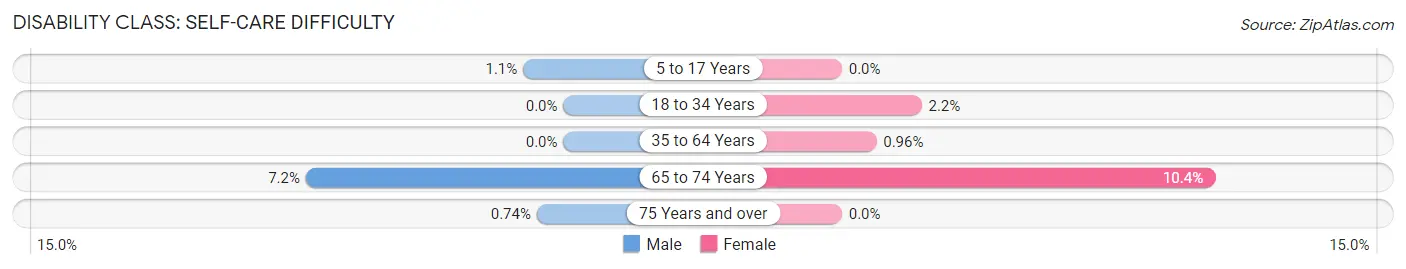
| Age Bracket | Male | Female |
| 5 to 17 Years | 8 (1.1%) | 0 (0.0%) |
| 18 to 34 Years | 0 (0.0%) | 25 (2.2%) |
| 35 to 64 Years | 0 (0.0%) | 15 (1.0%) |
| 65 to 74 Years | 17 (7.2%) | 40 (10.4%) |
| 75 Years and over | 2 (0.7%) | 0 (0.0%) |
Technology Access in Bel Aire
Computing Device Access in Bel Aire
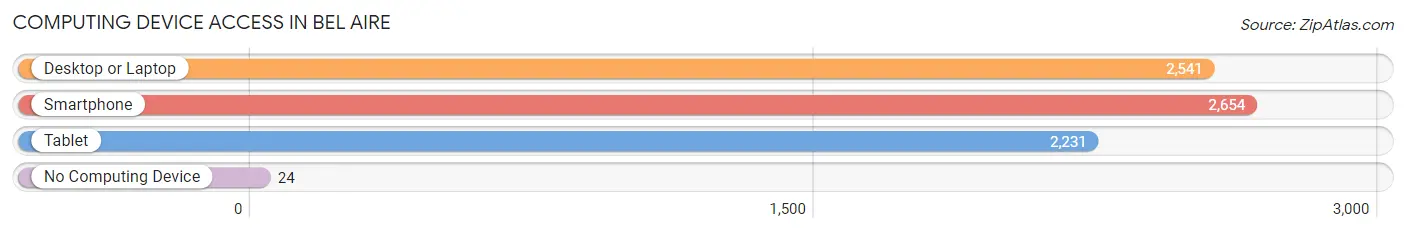
| Device Type | # Households | % Households |
| Desktop or Laptop | 2,541 | 87.3% |
| Smartphone | 2,654 | 91.2% |
| Tablet | 2,231 | 76.6% |
| No Computing Device | 24 | 0.8% |
| Total | 2,911 | 100.0% |
Internet Access in Bel Aire
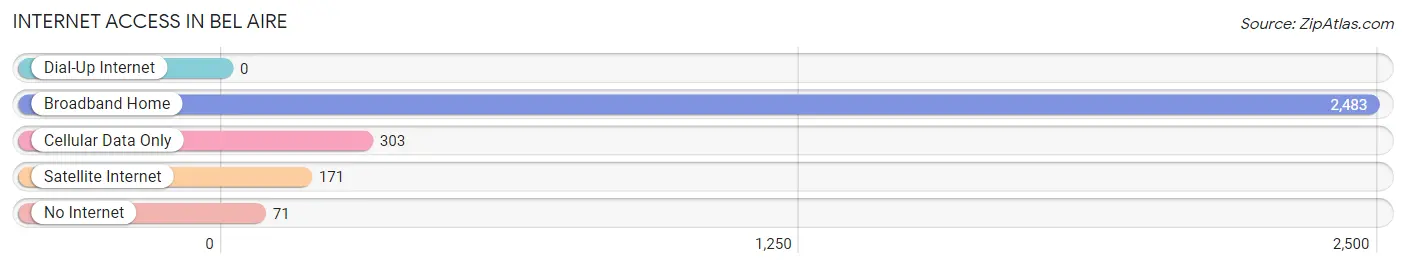
| Internet Type | # Households | % Households |
| Dial-Up Internet | 0 | 0.0% |
| Broadband Home | 2,483 | 85.3% |
| Cellular Data Only | 303 | 10.4% |
| Satellite Internet | 171 | 5.9% |
| No Internet | 71 | 2.4% |
| Total | 2,911 | 100.0% |
Bel Aire Summary
Bel Aire, Kansas is a small city located in the south-central part of the state, just north of Wichita. It is part of the Wichita metropolitan area and has a population of approximately 7,000 people. The city was founded in the late 19th century and has a rich history of agriculture and industry.
Geography
Bel Aire is located in the south-central part of Kansas, just north of Wichita. It is part of the Wichita metropolitan area and is bordered by the cities of Park City, Andover, and Wichita. The city is situated on the Arkansas River and is surrounded by rolling hills and prairies. The climate is characterized by hot summers and cold winters, with an average annual temperature of 54 degrees Fahrenheit.
Economy
Bel Aire’s economy is largely based on agriculture and industry. The city is home to several large agricultural operations, including grain elevators, feed mills, and livestock farms. The city is also home to several manufacturing companies, including a steel mill, a plastics plant, and a paper mill. In addition, Bel Aire is home to several retail stores, restaurants, and other businesses.
Demographics
As of the 2010 census, Bel Aire had a population of 7,000 people. The racial makeup of the city was 87.3% White, 5.2% African American, 0.7% Native American, 0.7% Asian, 0.1% Pacific Islander, and 4.9% from other races. The median household income was $45,000, and the median family income was $50,000.
History
Bel Aire was founded in the late 19th century by a group of settlers from the Midwest. The city was originally known as “Bel Aire” because of its location on the Arkansas River. The city was incorporated in 1909 and quickly grew to become a major agricultural center. In the early 20th century, the city was home to several large grain elevators, feed mills, and livestock farms.
In the mid-20th century, Bel Aire began to diversify its economy with the addition of several manufacturing companies. The city is now home to a steel mill, a plastics plant, and a paper mill. In addition, Bel Aire is home to several retail stores, restaurants, and other businesses.
Bel Aire is a small city with a rich history and a diverse economy. It is home to several large agricultural operations, manufacturing companies, and other businesses. The city has a population of approximately 7,000 people and is part of the Wichita metropolitan area. Bel Aire is a great place to live and work, and it is sure to continue to grow and prosper in the years to come.
Common Questions
What is Per Capita Income in Bel Aire?
Per Capita income in Bel Aire is $38,514.
What is the Median Family Income in Bel Aire?
Median Family Income in Bel Aire is $109,438.
What is the Median Household income in Bel Aire?
Median Household Income in Bel Aire is $91,979.
What is Income or Wage Gap in Bel Aire?
Income or Wage Gap in Bel Aire is 31.5%.
Women in Bel Aire earn 68.5 cents for every dollar earned by a man.
What is Inequality or Gini Index in Bel Aire?
Inequality or Gini Index in Bel Aire is 0.37.
What is the Total Population of Bel Aire?
Total Population of Bel Aire is 8,341.
What is the Total Male Population of Bel Aire?
Total Male Population of Bel Aire is 4,109.
What is the Total Female Population of Bel Aire?
Total Female Population of Bel Aire is 4,232.
What is the Ratio of Males per 100 Females in Bel Aire?
There are 97.09 Males per 100 Females in Bel Aire.
What is the Ratio of Females per 100 Males in Bel Aire?
There are 102.99 Females per 100 Males in Bel Aire.
What is the Median Population Age in Bel Aire?
Median Population Age in Bel Aire is 34.7 Years.
What is the Average Family Size in Bel Aire
Average Family Size in Bel Aire is 3.3 People.
What is the Average Household Size in Bel Aire
Average Household Size in Bel Aire is 2.9 People.
How Large is the Labor Force in Bel Aire?
There are 4,416 People in the Labor Forcein in Bel Aire.
What is the Percentage of People in the Labor Force in Bel Aire?
69.7% of People are in the Labor Force in Bel Aire.
What is the Unemployment Rate in Bel Aire?
Unemployment Rate in Bel Aire is 2.3%.