Fulton, KS Map & Demographics
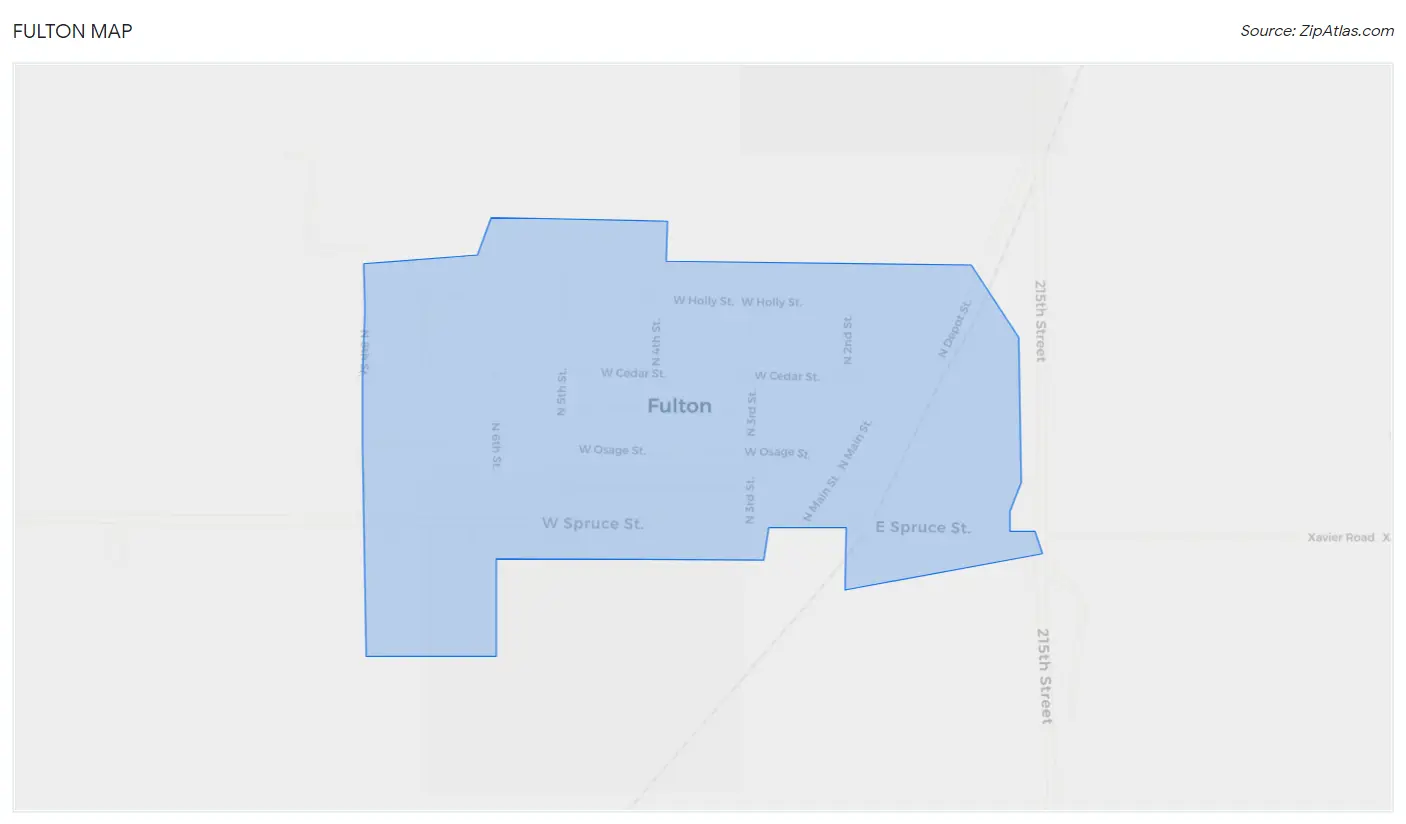
Fulton Map
Fulton Overview
$27,600
PER CAPITA INCOME
$63,750
AVG FAMILY INCOME
$52,000
AVG HOUSEHOLD INCOME
30.4%
WAGE / INCOME GAP [ % ]
69.6¢/ $1
WAGE / INCOME GAP [ $ ]
0.45
INEQUALITY / GINI INDEX
95
TOTAL POPULATION
62
MALE POPULATION
33
FEMALE POPULATION
187.88
MALES / 100 FEMALES
53.23
FEMALES / 100 MALES
31.8
MEDIAN AGE
3.2
AVG FAMILY SIZE
2.6
AVG HOUSEHOLD SIZE
33
LABOR FORCE [ PEOPLE ]
47.8%
PERCENT IN LABOR FORCE
Fulton Zip Codes
Income in Fulton
Income Overview in Fulton
Per Capita Income in Fulton is $27,600, while median incomes of families and households are $63,750 and $52,000 respectively.
| Characteristic | Number | Measure |
| Per Capita Income | 95 | $27,600 |
| Median Family Income | 26 | $63,750 |
| Mean Family Income | 26 | $88,300 |
| Median Household Income | 36 | $52,000 |
| Mean Household Income | 36 | $77,547 |
| Income Deficit | 26 | $0 |
| Wage / Income Gap (%) | 95 | 30.38% |
| Wage / Income Gap ($) | 95 | 69.62¢ per $1 |
| Gini / Inequality Index | 95 | 0.45 |
Earnings by Sex in Fulton
Average Earnings in Fulton are $47,750, $49,500 for men and $34,464 for women, a difference of 30.4%.
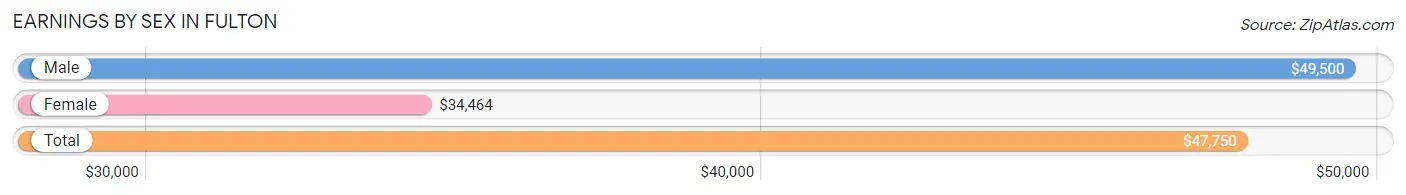
| Sex | Number | Average Earnings |
| Male | 22 (59.5%) | $49,500 |
| Female | 15 (40.5%) | $34,464 |
| Total | 37 (100.0%) | $47,750 |
Earnings by Sex by Income Bracket in Fulton
The most common earnings brackets in Fulton are $50,000 to $54,999 for men (6 | 27.3%) and $30,000 to $34,999 for women (7 | 46.7%).
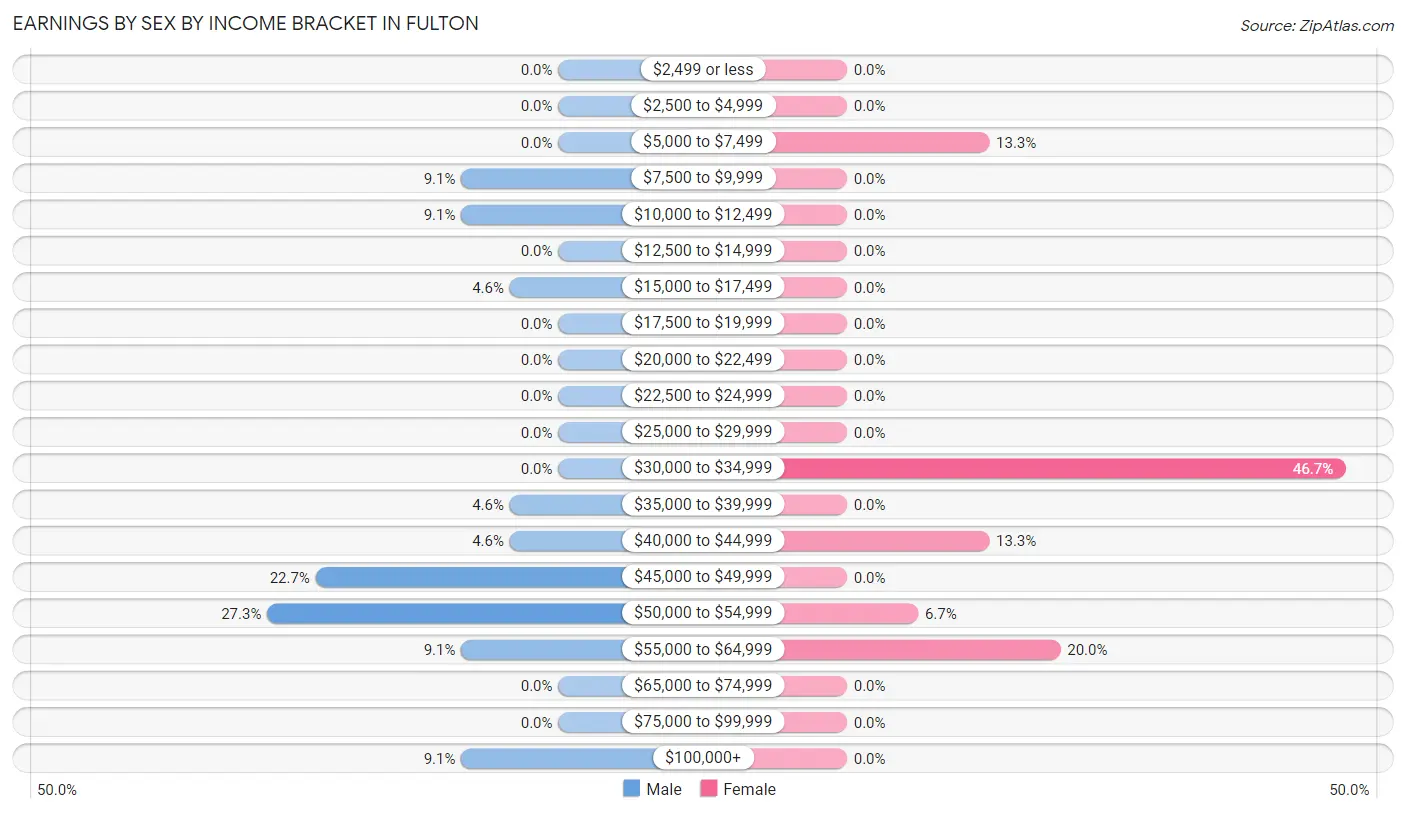
| Income | Male | Female |
| $2,499 or less | 0 (0.0%) | 0 (0.0%) |
| $2,500 to $4,999 | 0 (0.0%) | 0 (0.0%) |
| $5,000 to $7,499 | 0 (0.0%) | 2 (13.3%) |
| $7,500 to $9,999 | 2 (9.1%) | 0 (0.0%) |
| $10,000 to $12,499 | 2 (9.1%) | 0 (0.0%) |
| $12,500 to $14,999 | 0 (0.0%) | 0 (0.0%) |
| $15,000 to $17,499 | 1 (4.5%) | 0 (0.0%) |
| $17,500 to $19,999 | 0 (0.0%) | 0 (0.0%) |
| $20,000 to $22,499 | 0 (0.0%) | 0 (0.0%) |
| $22,500 to $24,999 | 0 (0.0%) | 0 (0.0%) |
| $25,000 to $29,999 | 0 (0.0%) | 0 (0.0%) |
| $30,000 to $34,999 | 0 (0.0%) | 7 (46.7%) |
| $35,000 to $39,999 | 1 (4.5%) | 0 (0.0%) |
| $40,000 to $44,999 | 1 (4.5%) | 2 (13.3%) |
| $45,000 to $49,999 | 5 (22.7%) | 0 (0.0%) |
| $50,000 to $54,999 | 6 (27.3%) | 1 (6.7%) |
| $55,000 to $64,999 | 2 (9.1%) | 3 (20.0%) |
| $65,000 to $74,999 | 0 (0.0%) | 0 (0.0%) |
| $75,000 to $99,999 | 0 (0.0%) | 0 (0.0%) |
| $100,000+ | 2 (9.1%) | 0 (0.0%) |
| Total | 22 (100.0%) | 15 (100.0%) |
Earnings by Sex by Educational Attainment in Fulton
| Educational Attainment | Male Income | Female Income |
| Less than High School | - | - |
| High School Diploma | - | - |
| College or Associate's Degree | - | - |
| Bachelor's Degree | - | - |
| Graduate Degree | - | - |
| Total | $49,500 | $34,464 |
Family Income in Fulton
Family Income Brackets in Fulton
According to the Fulton family income data, there are 9 families falling into the $50,000 to $74,999 income range, which is the most common income bracket and makes up 34.6% of all families.
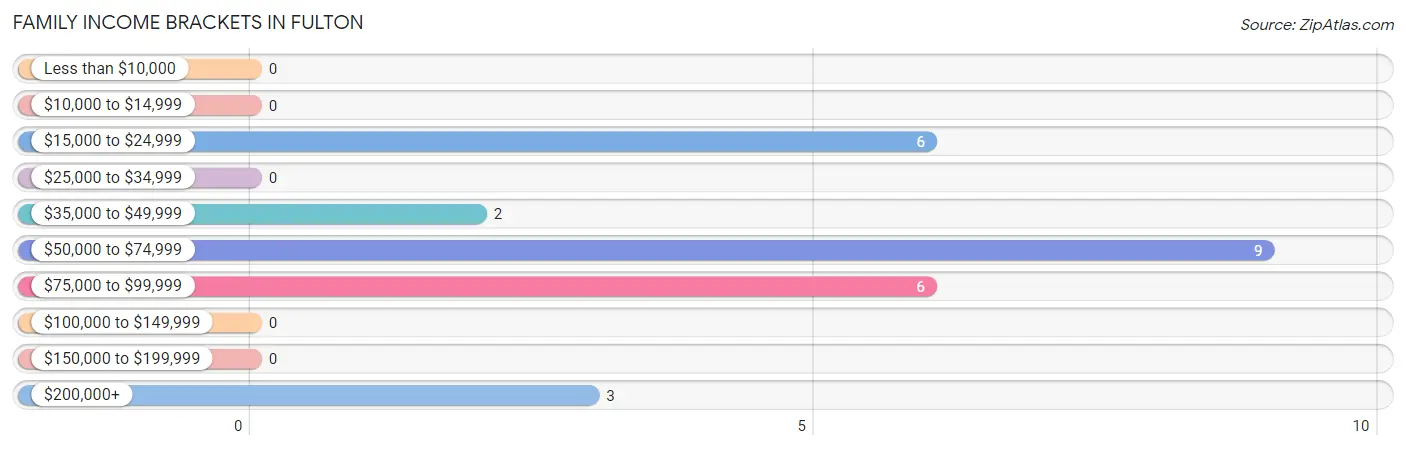
| Income Bracket | # Families | % Families |
| Less than $10,000 | 0 | 0.0% |
| $10,000 to $14,999 | 0 | 0.0% |
| $15,000 to $24,999 | 6 | 23.1% |
| $25,000 to $34,999 | 0 | 0.0% |
| $35,000 to $49,999 | 2 | 7.7% |
| $50,000 to $74,999 | 9 | 34.6% |
| $75,000 to $99,999 | 6 | 23.1% |
| $100,000 to $149,999 | 0 | 0.0% |
| $150,000 to $199,999 | 0 | 0.0% |
| $200,000+ | 3 | 11.5% |
Family Income by Famaliy Size in Fulton
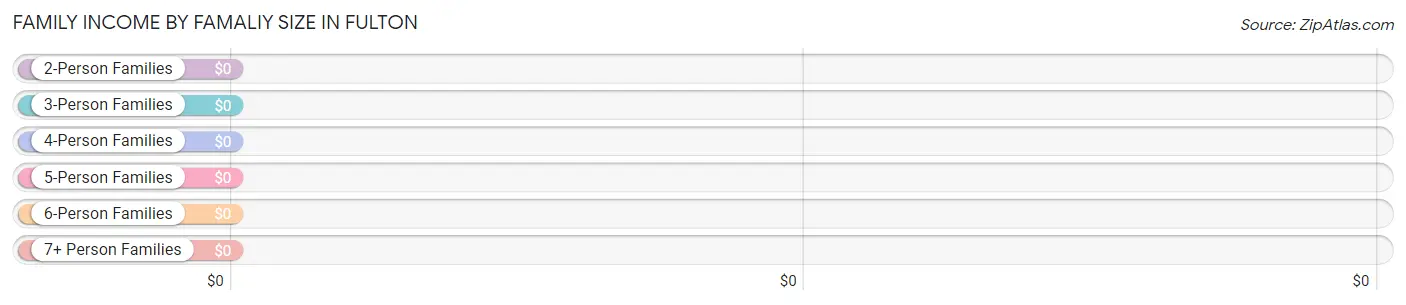
| Income Bracket | # Families | Median Income |
| 2-Person Families | 9 (34.6%) | $0 |
| 3-Person Families | 8 (30.8%) | $0 |
| 4-Person Families | 7 (26.9%) | $0 |
| 5-Person Families | 2 (7.7%) | $0 |
| 6-Person Families | 0 (0.0%) | $0 |
| 7+ Person Families | 0 (0.0%) | $0 |
| Total | 26 (100.0%) | $63,750 |
Family Income by Number of Earners in Fulton
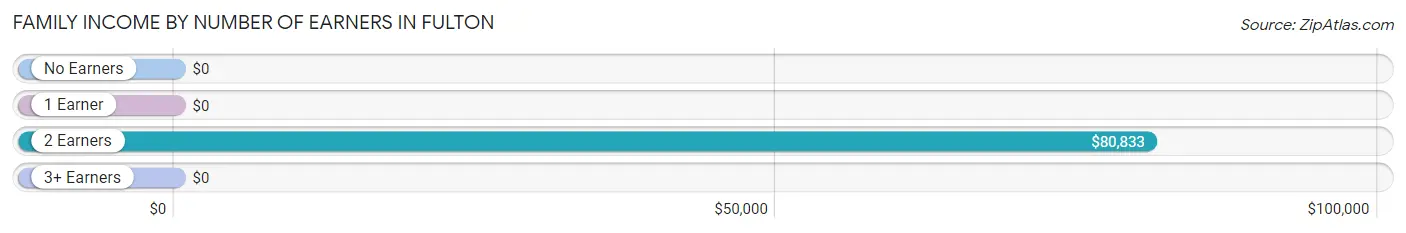
| Number of Earners | # Families | Median Income |
| No Earners | 8 (30.8%) | $0 |
| 1 Earner | 10 (38.5%) | $0 |
| 2 Earners | 8 (30.8%) | $80,833 |
| 3+ Earners | 0 (0.0%) | $0 |
| Total | 26 (100.0%) | $63,750 |
Household Income in Fulton
Household Income Brackets in Fulton
With 11 households falling in the category, the $50,000 to $74,999 income range is the most frequent in Fulton, accounting for 30.6% of all households.
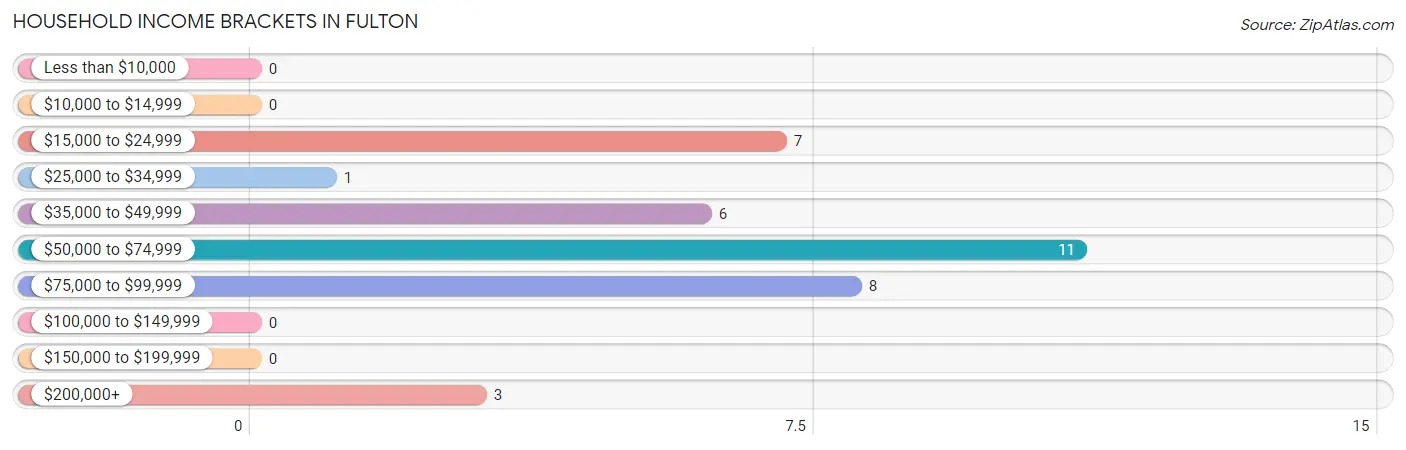
| Income Bracket | # Households | % Households |
| Less than $10,000 | 0 | 0.0% |
| $10,000 to $14,999 | 0 | 0.0% |
| $15,000 to $24,999 | 7 | 19.4% |
| $25,000 to $34,999 | 1 | 2.8% |
| $35,000 to $49,999 | 6 | 16.7% |
| $50,000 to $74,999 | 11 | 30.6% |
| $75,000 to $99,999 | 8 | 22.2% |
| $100,000 to $149,999 | 0 | 0.0% |
| $150,000 to $199,999 | 0 | 0.0% |
| $200,000+ | 3 | 8.3% |
Household Income by Householder Age in Fulton
The median household income in Fulton is $52,000, with the highest median household income of $58,750 found in the 45 to 64 years age bracket for the primary householder. A total of 16 households (44.4%) fall into this category.
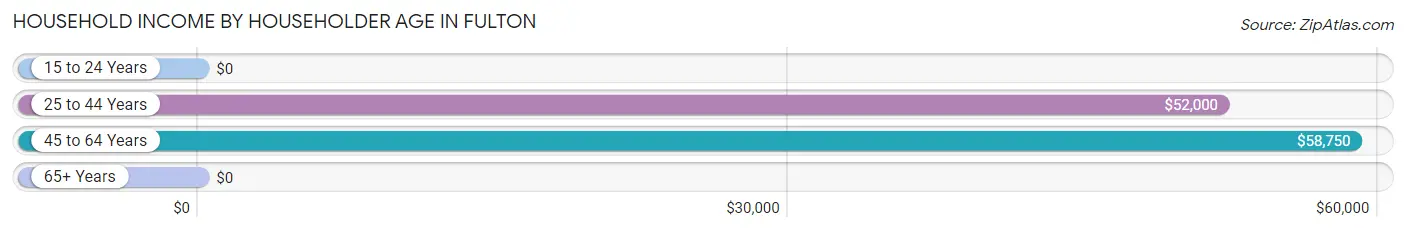
| Income Bracket | # Households | Median Income |
| 15 to 24 Years | 0 (0.0%) | $0 |
| 25 to 44 Years | 12 (33.3%) | $52,000 |
| 45 to 64 Years | 16 (44.4%) | $58,750 |
| 65+ Years | 8 (22.2%) | $0 |
| Total | 36 (100.0%) | $52,000 |
Poverty in Fulton
Income Below Poverty by Sex and Age in Fulton
With 12.9% poverty level for males and 21.2% for females among the residents of Fulton, 18 to 24 year old males and 55 to 64 year old females are the most vulnerable to poverty, with 2 males (100.0%) and 4 females (44.4%) in their respective age groups living below the poverty level.
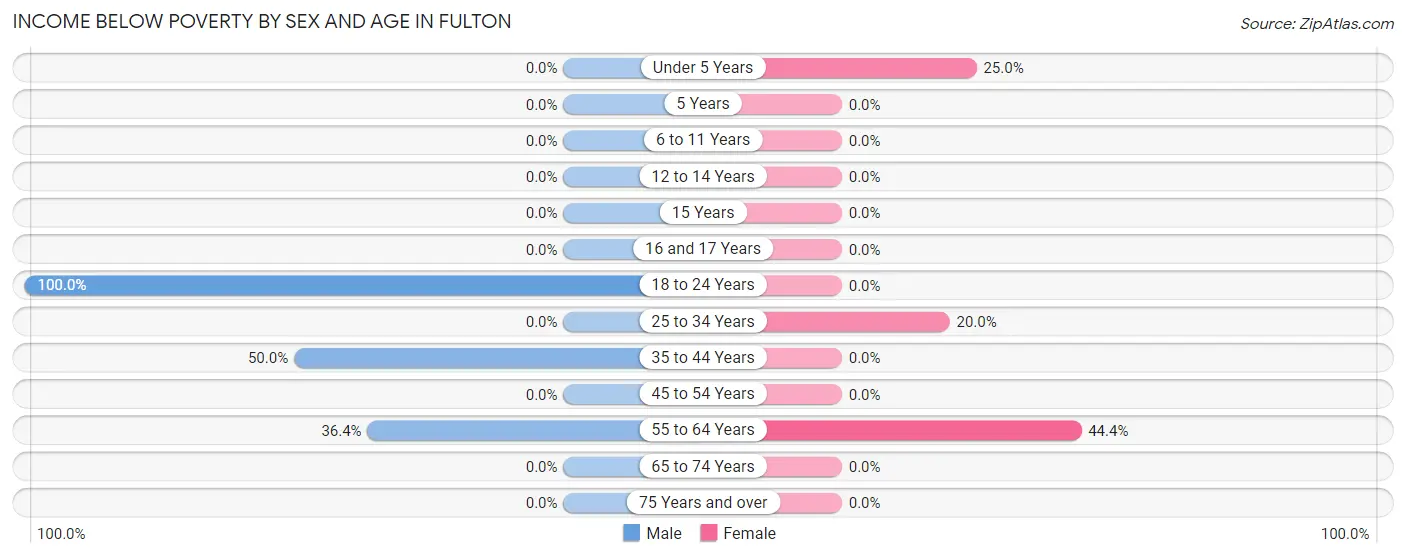
| Age Bracket | Male | Female |
| Under 5 Years | 0 (0.0%) | 1 (25.0%) |
| 5 Years | 0 (0.0%) | 0 (0.0%) |
| 6 to 11 Years | 0 (0.0%) | 0 (0.0%) |
| 12 to 14 Years | 0 (0.0%) | 0 (0.0%) |
| 15 Years | 0 (0.0%) | 0 (0.0%) |
| 16 and 17 Years | 0 (0.0%) | 0 (0.0%) |
| 18 to 24 Years | 2 (100.0%) | 0 (0.0%) |
| 25 to 34 Years | 0 (0.0%) | 2 (20.0%) |
| 35 to 44 Years | 2 (50.0%) | 0 (0.0%) |
| 45 to 54 Years | 0 (0.0%) | 0 (0.0%) |
| 55 to 64 Years | 4 (36.4%) | 4 (44.4%) |
| 65 to 74 Years | 0 (0.0%) | 0 (0.0%) |
| 75 Years and over | 0 (0.0%) | 0 (0.0%) |
| Total | 8 (12.9%) | 7 (21.2%) |
Income Above Poverty by Sex and Age in Fulton
According to the poverty statistics in Fulton, males aged under 5 years and females aged 35 to 44 years are the age groups that are most secure financially, with 100.0% of males and 100.0% of females in these age groups living above the poverty line.
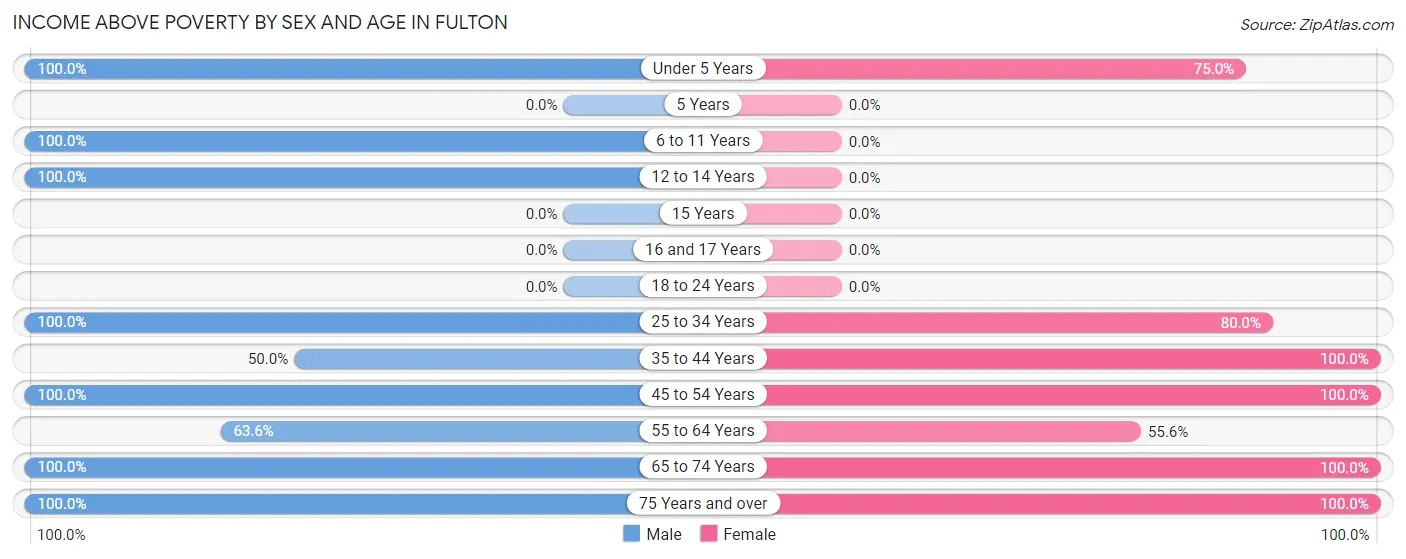
| Age Bracket | Male | Female |
| Under 5 Years | 18 (100.0%) | 3 (75.0%) |
| 5 Years | 0 (0.0%) | 0 (0.0%) |
| 6 to 11 Years | 2 (100.0%) | 0 (0.0%) |
| 12 to 14 Years | 2 (100.0%) | 0 (0.0%) |
| 15 Years | 0 (0.0%) | 0 (0.0%) |
| 16 and 17 Years | 0 (0.0%) | 0 (0.0%) |
| 18 to 24 Years | 0 (0.0%) | 0 (0.0%) |
| 25 to 34 Years | 11 (100.0%) | 8 (80.0%) |
| 35 to 44 Years | 2 (50.0%) | 2 (100.0%) |
| 45 to 54 Years | 5 (100.0%) | 3 (100.0%) |
| 55 to 64 Years | 7 (63.6%) | 5 (55.6%) |
| 65 to 74 Years | 4 (100.0%) | 4 (100.0%) |
| 75 Years and over | 3 (100.0%) | 1 (100.0%) |
| Total | 54 (87.1%) | 26 (78.8%) |
Income Below Poverty Among Married-Couple Families in Fulton
The poverty statistics for married-couple families in Fulton show that 30.0% or 6 of the total 20 families live below the poverty line. Families with no children have the highest poverty rate of 44.4%, comprising of 4 families. On the other hand, families with 3 or 4 children have the lowest poverty rate of 0.0%, which includes 0 families.
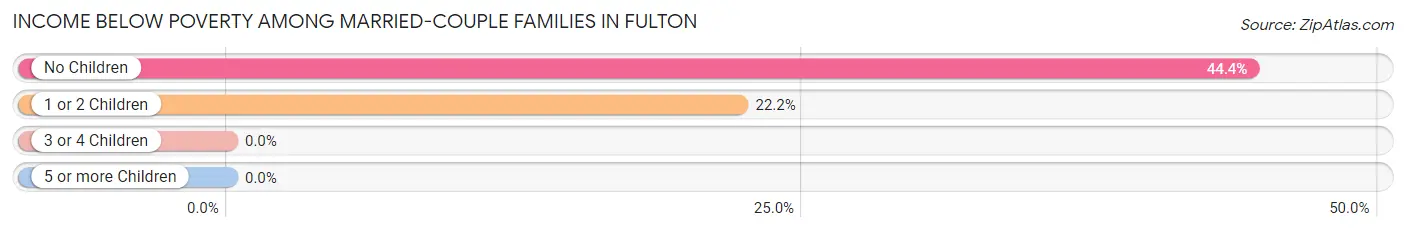
| Children | Above Poverty | Below Poverty |
| No Children | 5 (55.6%) | 4 (44.4%) |
| 1 or 2 Children | 7 (77.8%) | 2 (22.2%) |
| 3 or 4 Children | 2 (100.0%) | 0 (0.0%) |
| 5 or more Children | 0 (0.0%) | 0 (0.0%) |
| Total | 14 (70.0%) | 6 (30.0%) |
Income Below Poverty Among Single-Parent Households in Fulton
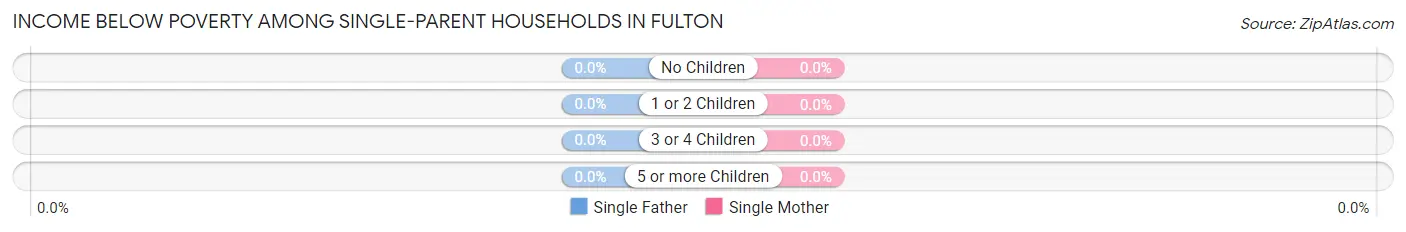
| Children | Single Father | Single Mother |
| No Children | 0 (0.0%) | 0 (0.0%) |
| 1 or 2 Children | 0 (0.0%) | 0 (0.0%) |
| 3 or 4 Children | 0 (0.0%) | 0 (0.0%) |
| 5 or more Children | 0 (0.0%) | 0 (0.0%) |
| Total | 0 (0.0%) | 0 (0.0%) |
Income Below Poverty Among Married-Couple vs Single-Parent Households in Fulton
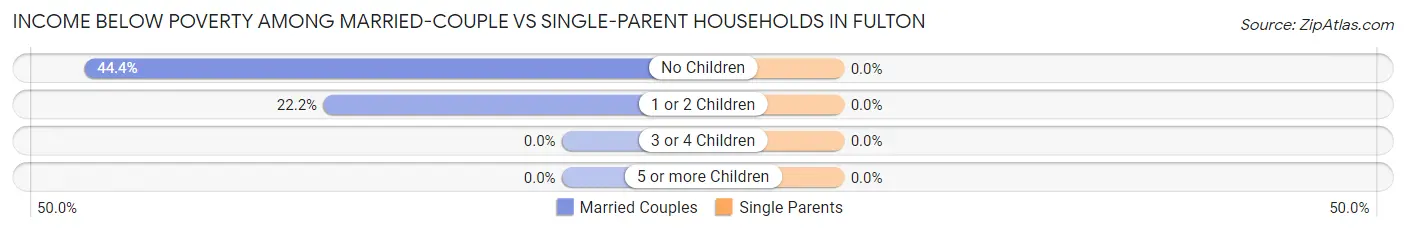
| Children | Married-Couple Families | Single-Parent Households |
| No Children | 4 (44.4%) | 0 (0.0%) |
| 1 or 2 Children | 2 (22.2%) | 0 (0.0%) |
| 3 or 4 Children | 0 (0.0%) | 0 (0.0%) |
| 5 or more Children | 0 (0.0%) | 0 (0.0%) |
| Total | 6 (30.0%) | 0 (0.0%) |
Race in Fulton
The most populous races in Fulton are White / Caucasian (87 | 91.6%), and Two or more Races (8 | 8.4%).
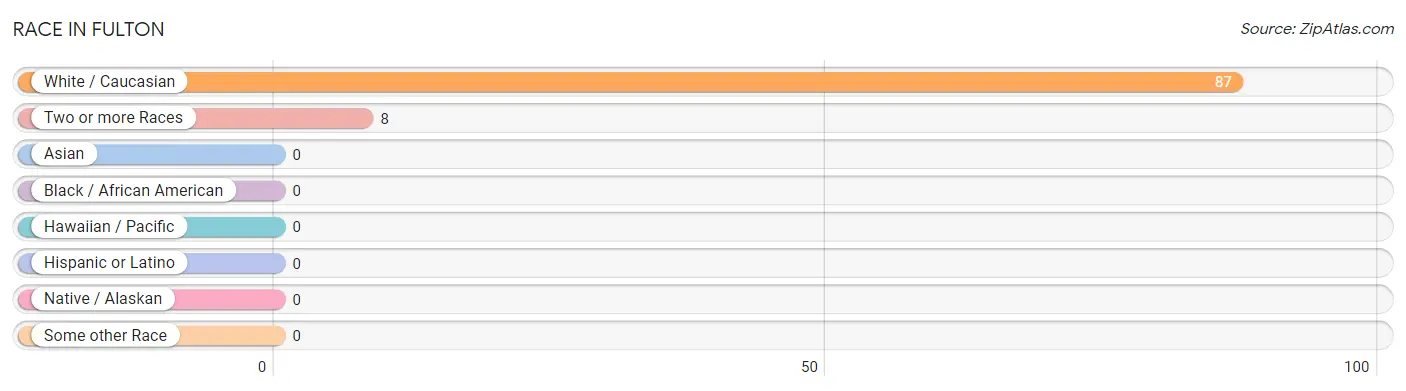
| Race | # Population | % Population |
| Asian | 0 | 0.0% |
| Black / African American | 0 | 0.0% |
| Hawaiian / Pacific | 0 | 0.0% |
| Hispanic or Latino | 0 | 0.0% |
| Native / Alaskan | 0 | 0.0% |
| White / Caucasian | 87 | 91.6% |
| Two or more Races | 8 | 8.4% |
| Some other Race | 0 | 0.0% |
| Total | 95 | 100.0% |
Ancestry in Fulton
The most populous ancestries reported in Fulton are German (11 | 11.6%), English (9 | 9.5%), Bhutanese (6 | 6.3%), Irish (4 | 4.2%), and Welsh (4 | 4.2%), together accounting for 35.8% of all Fulton residents.
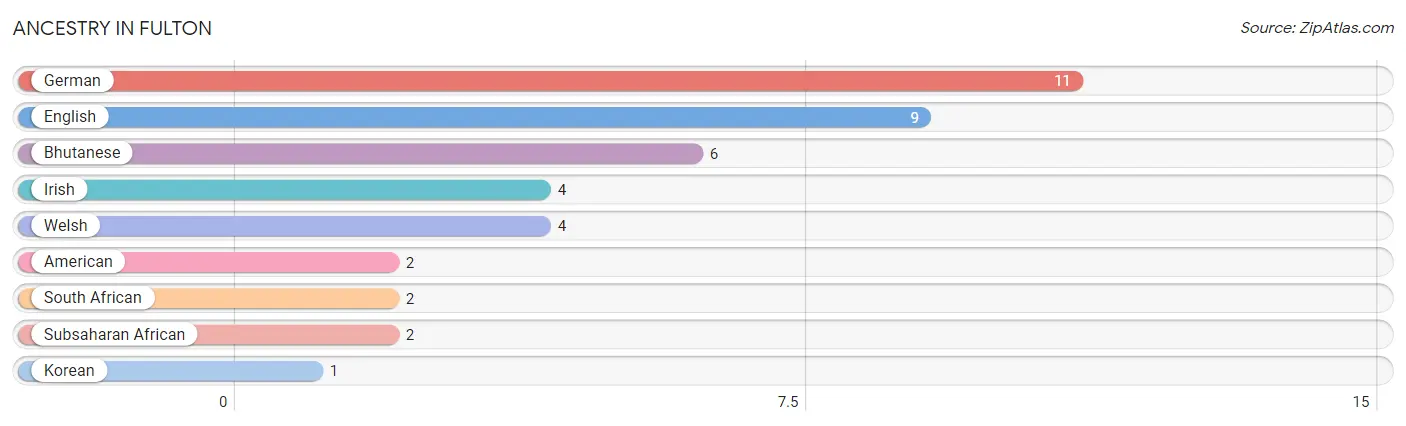
| Ancestry | # Population | % Population |
| American | 2 | 2.1% |
| Bhutanese | 6 | 6.3% |
| English | 9 | 9.5% |
| German | 11 | 11.6% |
| Irish | 4 | 4.2% |
| Korean | 1 | 1.1% |
| South African | 2 | 2.1% |
| Subsaharan African | 2 | 2.1% |
| Welsh | 4 | 4.2% | View All 9 Rows |
Immigrants in Fulton

| Immigration Origin | # Population | % Population | View All 0 Rows |
Sex and Age in Fulton
Sex and Age in Fulton
The most populous age groups in Fulton are Under 5 Years (18 | 29.0%) for men and 30 to 34 Years (6 | 18.2%) for women.
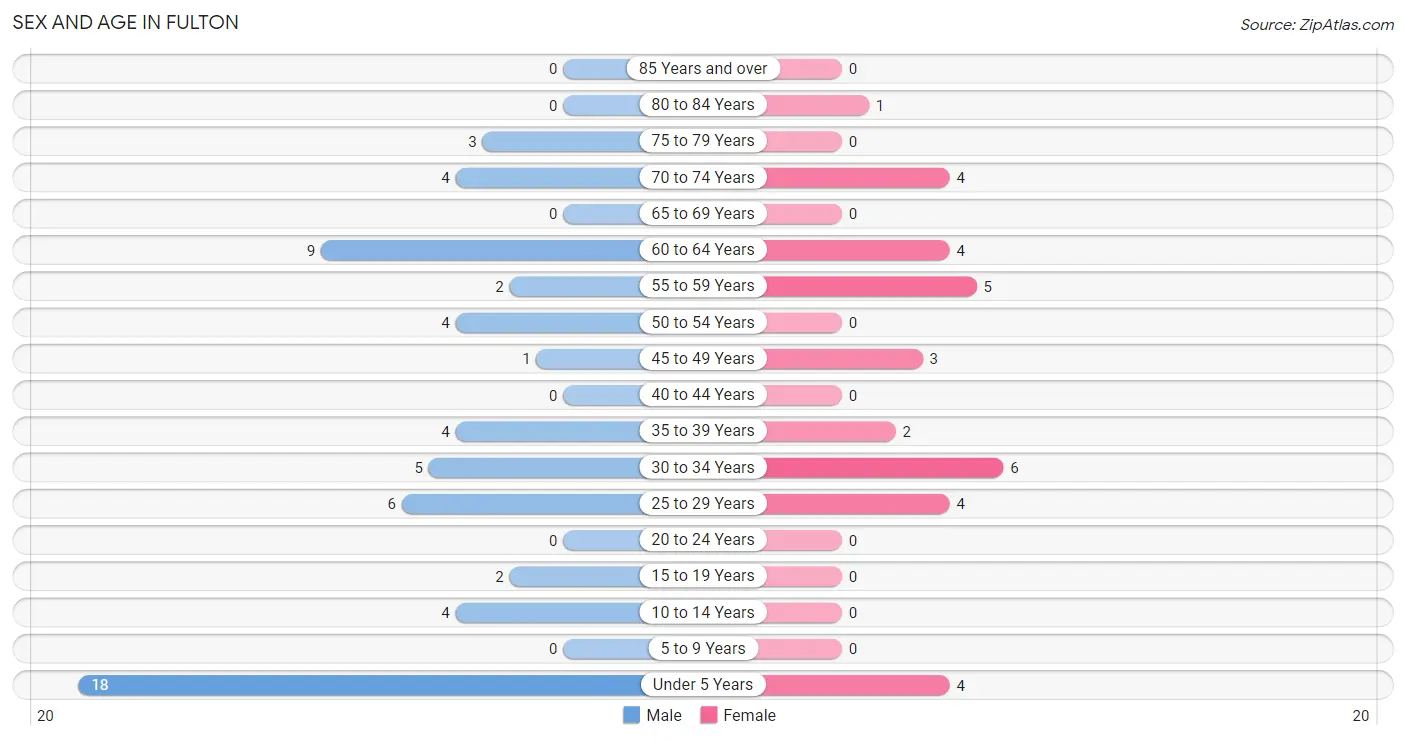
| Age Bracket | Male | Female |
| Under 5 Years | 18 (29.0%) | 4 (12.1%) |
| 5 to 9 Years | 0 (0.0%) | 0 (0.0%) |
| 10 to 14 Years | 4 (6.5%) | 0 (0.0%) |
| 15 to 19 Years | 2 (3.2%) | 0 (0.0%) |
| 20 to 24 Years | 0 (0.0%) | 0 (0.0%) |
| 25 to 29 Years | 6 (9.7%) | 4 (12.1%) |
| 30 to 34 Years | 5 (8.1%) | 6 (18.2%) |
| 35 to 39 Years | 4 (6.5%) | 2 (6.1%) |
| 40 to 44 Years | 0 (0.0%) | 0 (0.0%) |
| 45 to 49 Years | 1 (1.6%) | 3 (9.1%) |
| 50 to 54 Years | 4 (6.5%) | 0 (0.0%) |
| 55 to 59 Years | 2 (3.2%) | 5 (15.1%) |
| 60 to 64 Years | 9 (14.5%) | 4 (12.1%) |
| 65 to 69 Years | 0 (0.0%) | 0 (0.0%) |
| 70 to 74 Years | 4 (6.5%) | 4 (12.1%) |
| 75 to 79 Years | 3 (4.8%) | 0 (0.0%) |
| 80 to 84 Years | 0 (0.0%) | 1 (3.0%) |
| 85 Years and over | 0 (0.0%) | 0 (0.0%) |
| Total | 62 (100.0%) | 33 (100.0%) |
Families and Households in Fulton
Median Family Size in Fulton
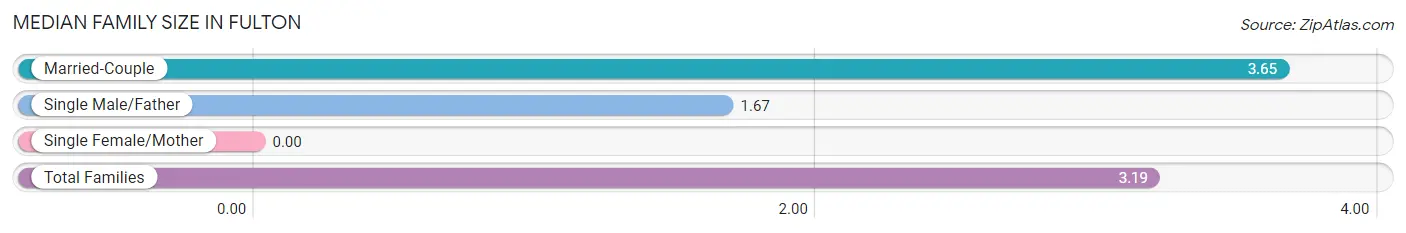
| Family Type | # Families | Family Size |
| Married-Couple | 20 (76.9%) | 3.65 |
| Single Male/Father | 6 (23.1%) | 1.67 |
| Single Female/Mother | 0 (0.0%) | - |
| Total Families | 26 (100.0%) | 3.19 |
Median Household Size in Fulton
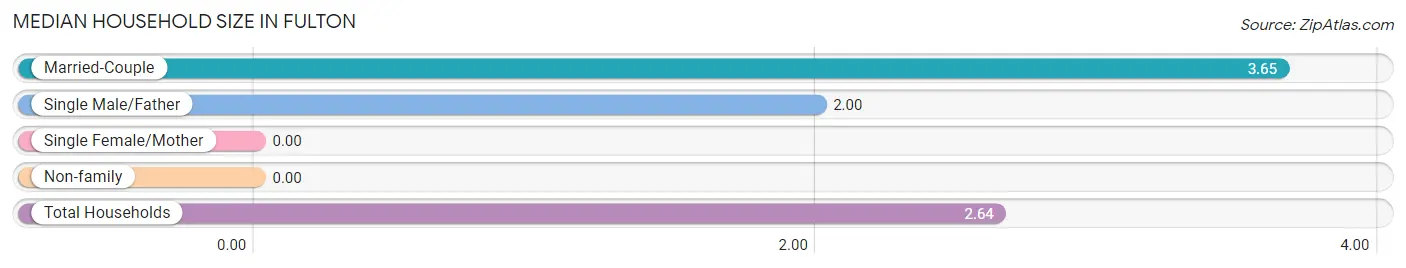
| Household Type | # Households | Household Size |
| Married-Couple | 20 (55.6%) | 3.65 |
| Single Male/Father | 6 (16.7%) | 2.00 |
| Single Female/Mother | 0 (0.0%) | - |
| Non-family | 10 (27.8%) | - |
| Total Households | 36 (100.0%) | 2.64 |
Household Size by Marriage Status in Fulton
Out of a total of 36 households in Fulton, 26 (72.2%) are family households, while 10 (27.8%) are nonfamily households. The most numerous type of family households are 3-person households, comprising 10, and the most common type of nonfamily households are 1-person households, comprising 10.
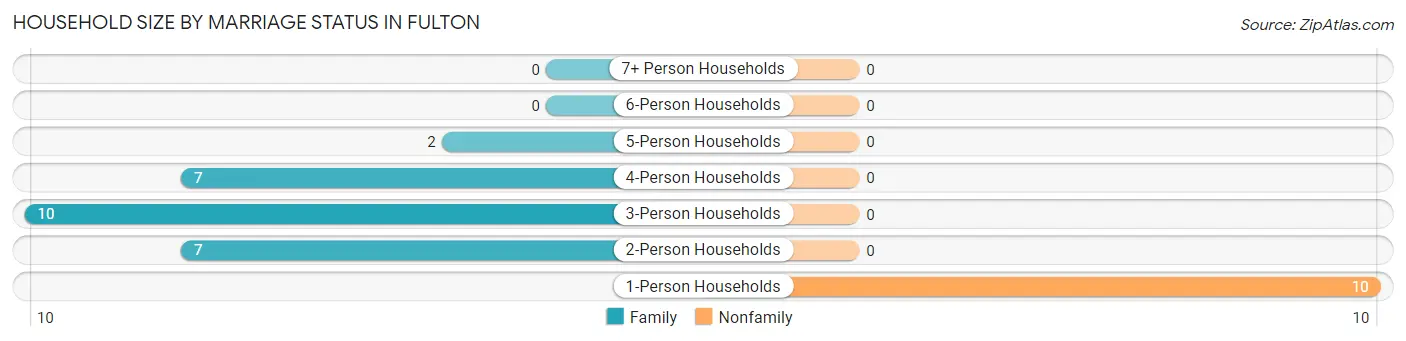
| Household Size | Family Households | Nonfamily Households |
| 1-Person Households | - | 10 (27.8%) |
| 2-Person Households | 7 (19.4%) | 0 (0.0%) |
| 3-Person Households | 10 (27.8%) | 0 (0.0%) |
| 4-Person Households | 7 (19.4%) | 0 (0.0%) |
| 5-Person Households | 2 (5.6%) | 0 (0.0%) |
| 6-Person Households | 0 (0.0%) | 0 (0.0%) |
| 7+ Person Households | 0 (0.0%) | 0 (0.0%) |
| Total | 26 (72.2%) | 10 (27.8%) |
Female Fertility in Fulton
Fertility by Age in Fulton
Average fertility rate in Fulton is 267.0 births per 1,000 women. Women in the age bracket of 20 to 34 years have the highest fertility rate with 400.0 births per 1,000 women. Women in the age bracket of 20 to 34 years acount for 100.0% of all women with births.
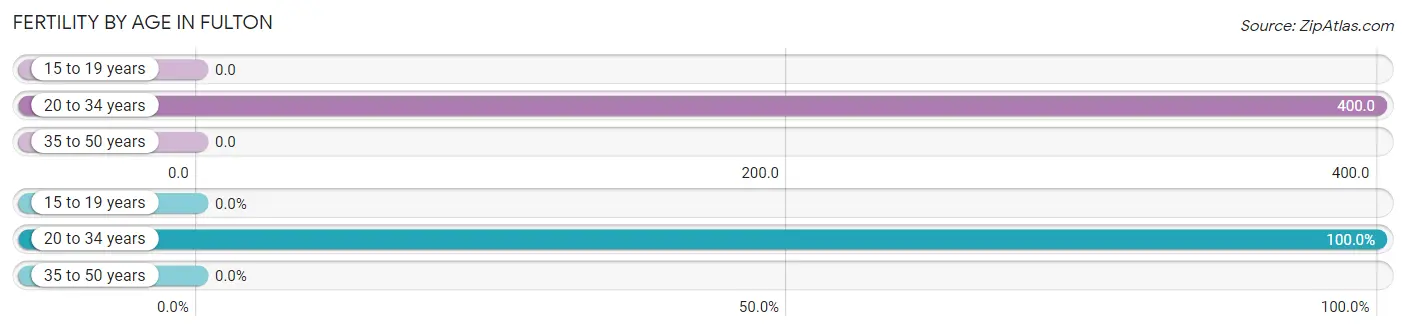
| Age Bracket | Women with Births | Births / 1,000 Women |
| 15 to 19 years | 0 (0.0%) | 0.0 |
| 20 to 34 years | 4 (100.0%) | 400.0 |
| 35 to 50 years | 0 (0.0%) | 0.0 |
| Total | 4 (100.0%) | 267.0 |
Fertility by Age by Marriage Status in Fulton
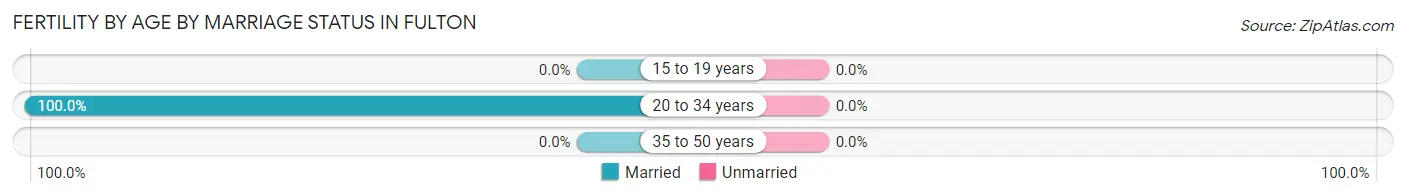
| Age Bracket | Married | Unmarried |
| 15 to 19 years | 0 (0.0%) | 0 (0.0%) |
| 20 to 34 years | 4 (100.0%) | 0 (0.0%) |
| 35 to 50 years | 0 (0.0%) | 0 (0.0%) |
| Total | 4 (100.0%) | 0 (0.0%) |
Fertility by Education in Fulton

| Educational Attainment | Women with Births | Births / 1,000 Women |
| Less than High School | 0 (0.0%) | 0.0 |
| High School Diploma | 4 (100.0%) | 500.0 |
| College or Associate's Degree | 0 (0.0%) | 0.0 |
| Bachelor's Degree | 0 (0.0%) | 0.0 |
| Graduate Degree | 0 (0.0%) | 0.0 |
| Total | 4 (100.0%) | 267.0 |
Fertility by Education by Marriage Status in Fulton
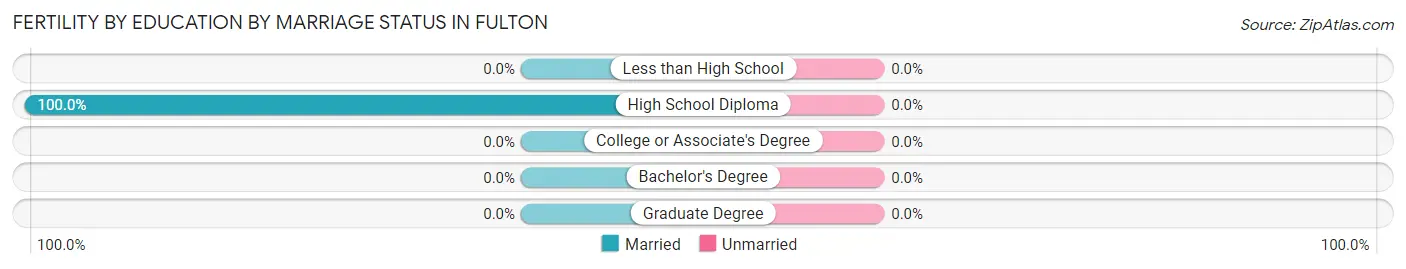
| Educational Attainment | Married | Unmarried |
| Less than High School | 0 (0.0%) | 0 (0.0%) |
| High School Diploma | 4 (100.0%) | 0 (0.0%) |
| College or Associate's Degree | 0 (0.0%) | 0 (0.0%) |
| Bachelor's Degree | 0 (0.0%) | 0 (0.0%) |
| Graduate Degree | 0 (0.0%) | 0 (0.0%) |
| Total | 4 (100.0%) | 0 (0.0%) |
Employment Characteristics in Fulton
Employment by Class of Employer in Fulton
Among the 31 employed individuals in Fulton, private company employees (23 | 74.2%), not-for-profit organizations (4 | 12.9%), and local government employees (3 | 9.7%) make up the most common classes of employment.
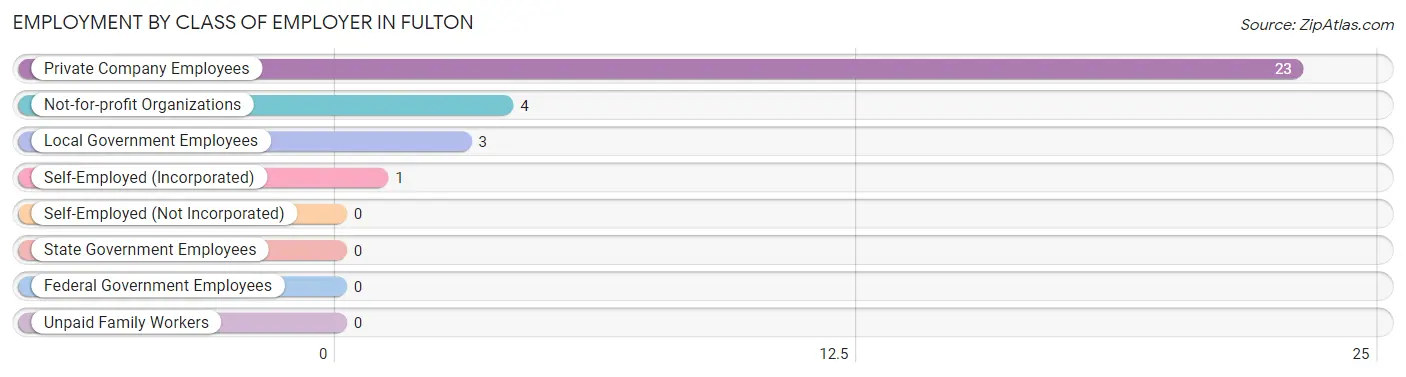
| Employer Class | # Employees | % Employees |
| Private Company Employees | 23 | 74.2% |
| Self-Employed (Incorporated) | 1 | 3.2% |
| Self-Employed (Not Incorporated) | 0 | 0.0% |
| Not-for-profit Organizations | 4 | 12.9% |
| Local Government Employees | 3 | 9.7% |
| State Government Employees | 0 | 0.0% |
| Federal Government Employees | 0 | 0.0% |
| Unpaid Family Workers | 0 | 0.0% |
| Total | 31 | 100.0% |
Employment Status by Age in Fulton
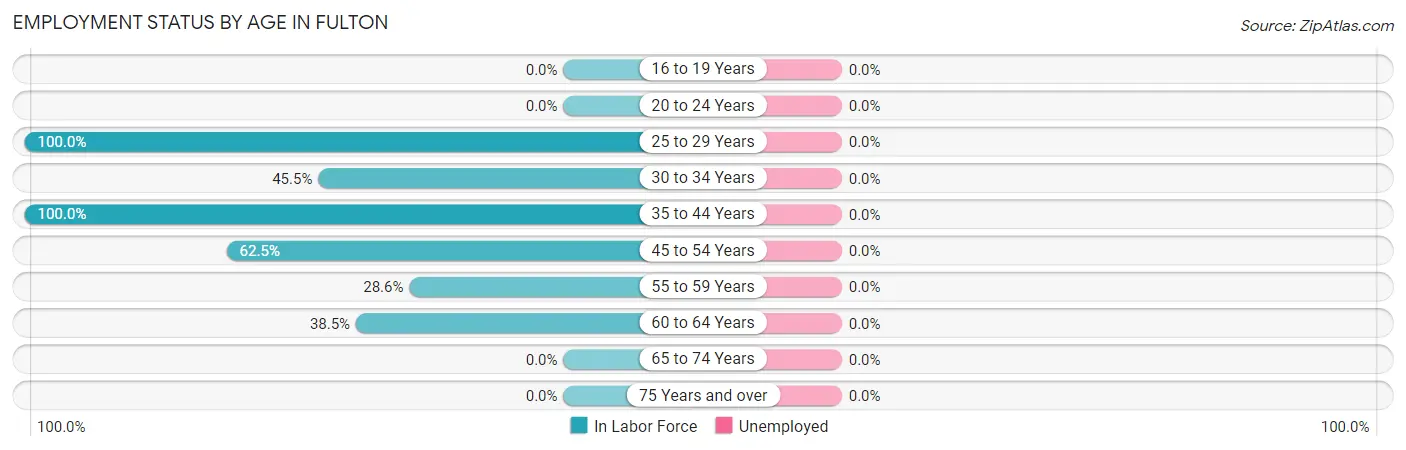
| Age Bracket | In Labor Force | Unemployed |
| 16 to 19 Years | 0 (0.0%) | 0 (0.0%) |
| 20 to 24 Years | 0 (0.0%) | 0 (0.0%) |
| 25 to 29 Years | 10 (100.0%) | 0 (0.0%) |
| 30 to 34 Years | 5 (45.5%) | 0 (0.0%) |
| 35 to 44 Years | 6 (100.0%) | 0 (0.0%) |
| 45 to 54 Years | 5 (62.5%) | 0 (0.0%) |
| 55 to 59 Years | 2 (28.6%) | 0 (0.0%) |
| 60 to 64 Years | 5 (38.5%) | 0 (0.0%) |
| 65 to 74 Years | 0 (0.0%) | 0 (0.0%) |
| 75 Years and over | 0 (0.0%) | 0 (0.0%) |
| Total | 33 (47.8%) | 0 (0.0%) |
Employment Status by Educational Attainment in Fulton
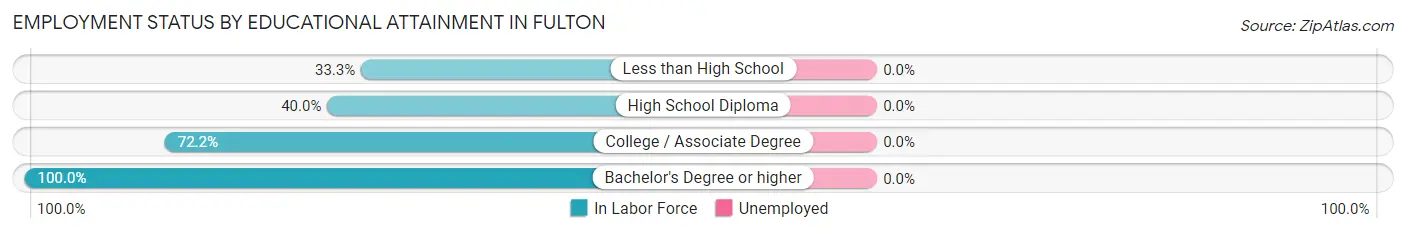
| Educational Attainment | In Labor Force | Unemployed |
| Less than High School | 1 (33.3%) | 0 (0.0%) |
| High School Diploma | 10 (40.0%) | 0 (0.0%) |
| College / Associate Degree | 13 (72.2%) | 0 (0.0%) |
| Bachelor's Degree or higher | 9 (100.0%) | 0 (0.0%) |
| Total | 33 (60.0%) | 0 (0.0%) |
Employment Occupations by Sex in Fulton
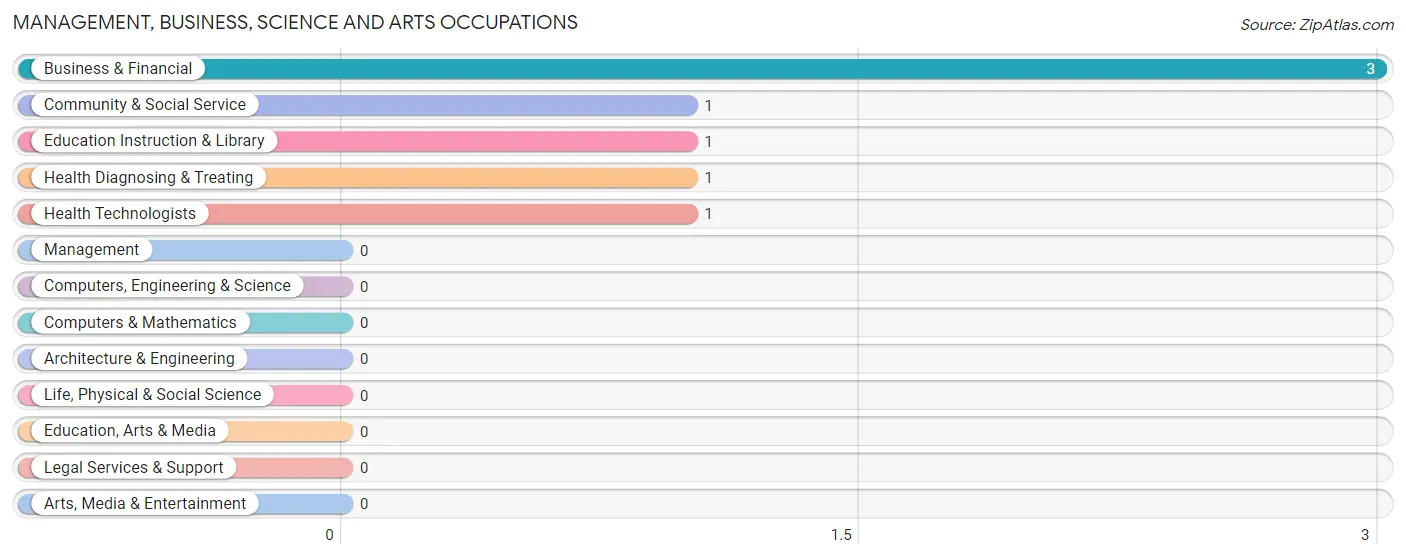
Management, Business, Science and Arts Occupations
The most common Management, Business, Science and Arts occupations in Fulton are Business & Financial (3 | 9.1%), Community & Social Service (1 | 3.0%), Education Instruction & Library (1 | 3.0%), Health Diagnosing & Treating (1 | 3.0%), and Health Technologists (1 | 3.0%).
Management, Business, Science and Arts Occupations by Sex
Within the Management, Business, Science and Arts occupations in Fulton, the most male-oriented occupations are Community & Social Service (100.0%), and Education Instruction & Library (100.0%), while the most female-oriented occupations are Business & Financial (100.0%), Health Diagnosing & Treating (100.0%), and Health Technologists (100.0%).
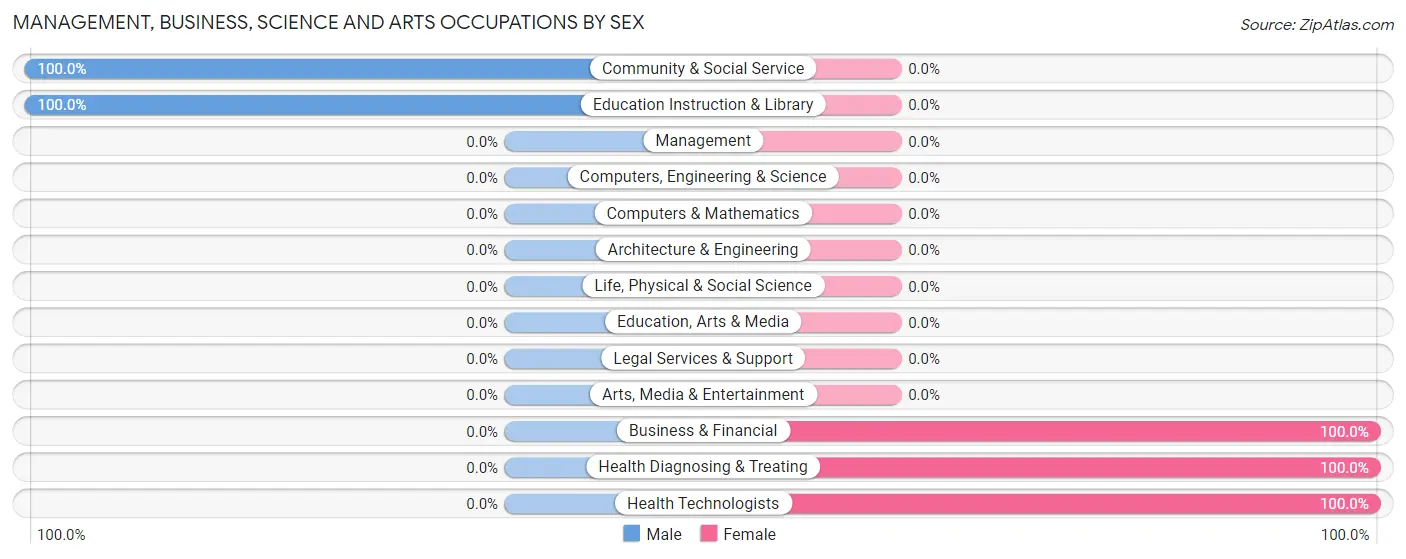
| Occupation | Male | Female |
| Management | 0 (0.0%) | 0 (0.0%) |
| Business & Financial | 0 (0.0%) | 3 (100.0%) |
| Computers, Engineering & Science | 0 (0.0%) | 0 (0.0%) |
| Computers & Mathematics | 0 (0.0%) | 0 (0.0%) |
| Architecture & Engineering | 0 (0.0%) | 0 (0.0%) |
| Life, Physical & Social Science | 0 (0.0%) | 0 (0.0%) |
| Community & Social Service | 1 (100.0%) | 0 (0.0%) |
| Education, Arts & Media | 0 (0.0%) | 0 (0.0%) |
| Legal Services & Support | 0 (0.0%) | 0 (0.0%) |
| Education Instruction & Library | 1 (100.0%) | 0 (0.0%) |
| Arts, Media & Entertainment | 0 (0.0%) | 0 (0.0%) |
| Health Diagnosing & Treating | 0 (0.0%) | 1 (100.0%) |
| Health Technologists | 0 (0.0%) | 1 (100.0%) |
| Total (Category) | 1 (20.0%) | 4 (80.0%) |
| Total (Overall) | 20 (60.6%) | 13 (39.4%) |
Services Occupations
Services Occupations by Sex
| Occupation | Male | Female |
| Healthcare Support | 0 (0.0%) | 0 (0.0%) |
| Security & Protection | 0 (0.0%) | 0 (0.0%) |
| Firefighting & Prevention | 0 (0.0%) | 0 (0.0%) |
| Law Enforcement | 0 (0.0%) | 0 (0.0%) |
| Food Preparation & Serving | 0 (0.0%) | 0 (0.0%) |
| Cleaning & Maintenance | 0 (0.0%) | 0 (0.0%) |
| Personal Care & Service | 0 (0.0%) | 0 (0.0%) |
| Total (Category) | 0 (0.0%) | 0 (0.0%) |
| Total (Overall) | 20 (60.6%) | 13 (39.4%) |
Sales and Office Occupations
The most common Sales and Office occupations in Fulton are Office & Administration (7 | 21.2%), and Sales & Related (2 | 6.1%).
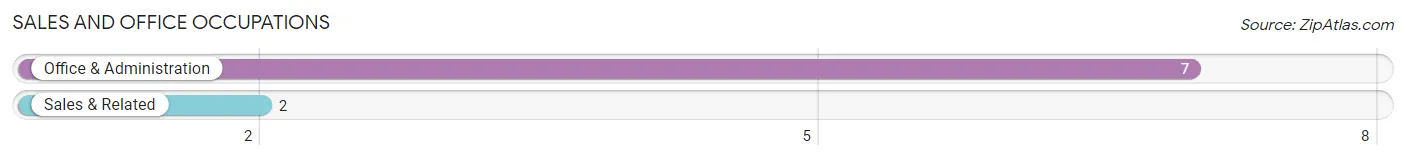
Sales and Office Occupations by Sex

| Occupation | Male | Female |
| Sales & Related | 2 (100.0%) | 0 (0.0%) |
| Office & Administration | 0 (0.0%) | 7 (100.0%) |
| Total (Category) | 2 (22.2%) | 7 (77.8%) |
| Total (Overall) | 20 (60.6%) | 13 (39.4%) |
Natural Resources, Construction and Maintenance Occupations
The most common Natural Resources, Construction and Maintenance occupations in Fulton are Construction & Extraction (7 | 21.2%), and Installation, Maintenance & Repair (7 | 21.2%).
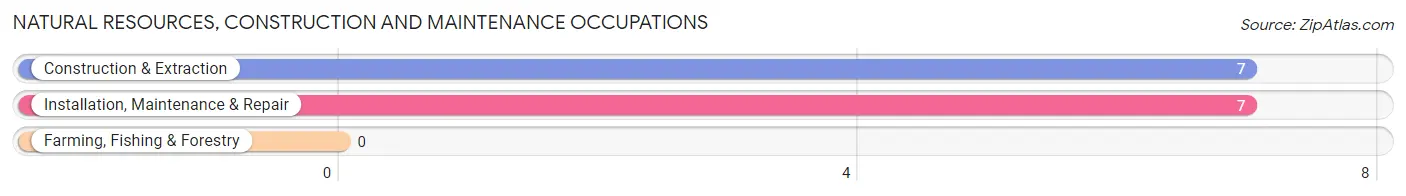
Natural Resources, Construction and Maintenance Occupations by Sex
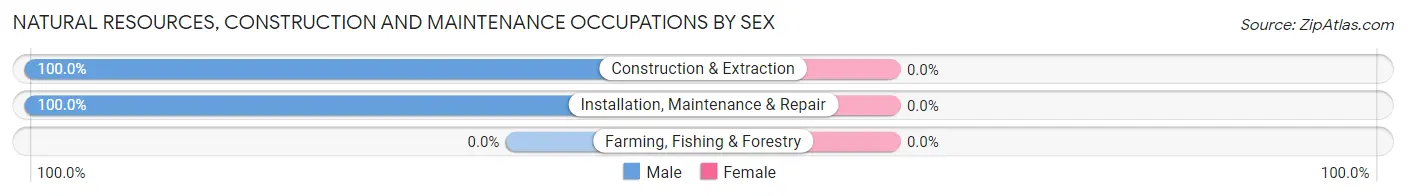
| Occupation | Male | Female |
| Farming, Fishing & Forestry | 0 (0.0%) | 0 (0.0%) |
| Construction & Extraction | 7 (100.0%) | 0 (0.0%) |
| Installation, Maintenance & Repair | 7 (100.0%) | 0 (0.0%) |
| Total (Category) | 14 (100.0%) | 0 (0.0%) |
| Total (Overall) | 20 (60.6%) | 13 (39.4%) |
Production, Transportation and Moving Occupations
The most common Production, Transportation and Moving occupations in Fulton are , and Production (5 | 15.1%).
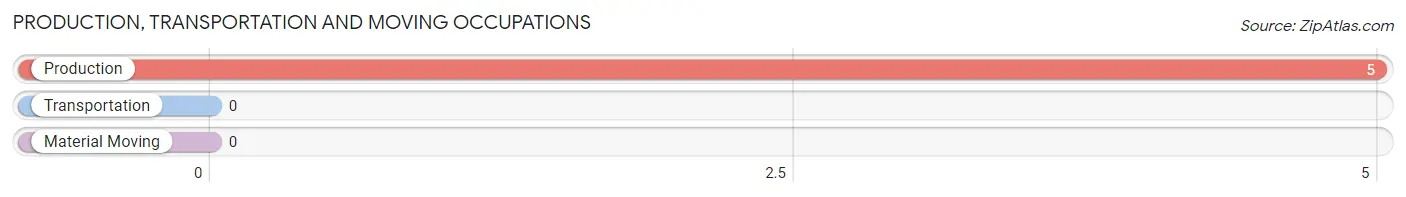
Production, Transportation and Moving Occupations by Sex
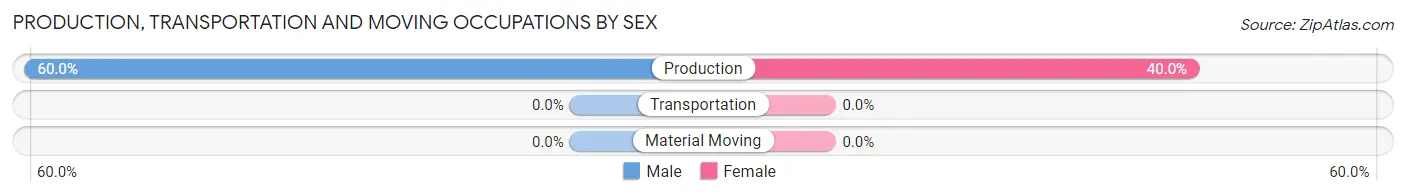
| Occupation | Male | Female |
| Production | 3 (60.0%) | 2 (40.0%) |
| Transportation | 0 (0.0%) | 0 (0.0%) |
| Material Moving | 0 (0.0%) | 0 (0.0%) |
| Total (Category) | 3 (60.0%) | 2 (40.0%) |
| Total (Overall) | 20 (60.6%) | 13 (39.4%) |
Employment Industries by Sex in Fulton
Employment Industries in Fulton
The major employment industries in Fulton include Construction (7 | 21.2%), Retail Trade (6 | 18.2%), Finance & Insurance (6 | 18.2%), Manufacturing (4 | 12.1%), and Information (3 | 9.1%).
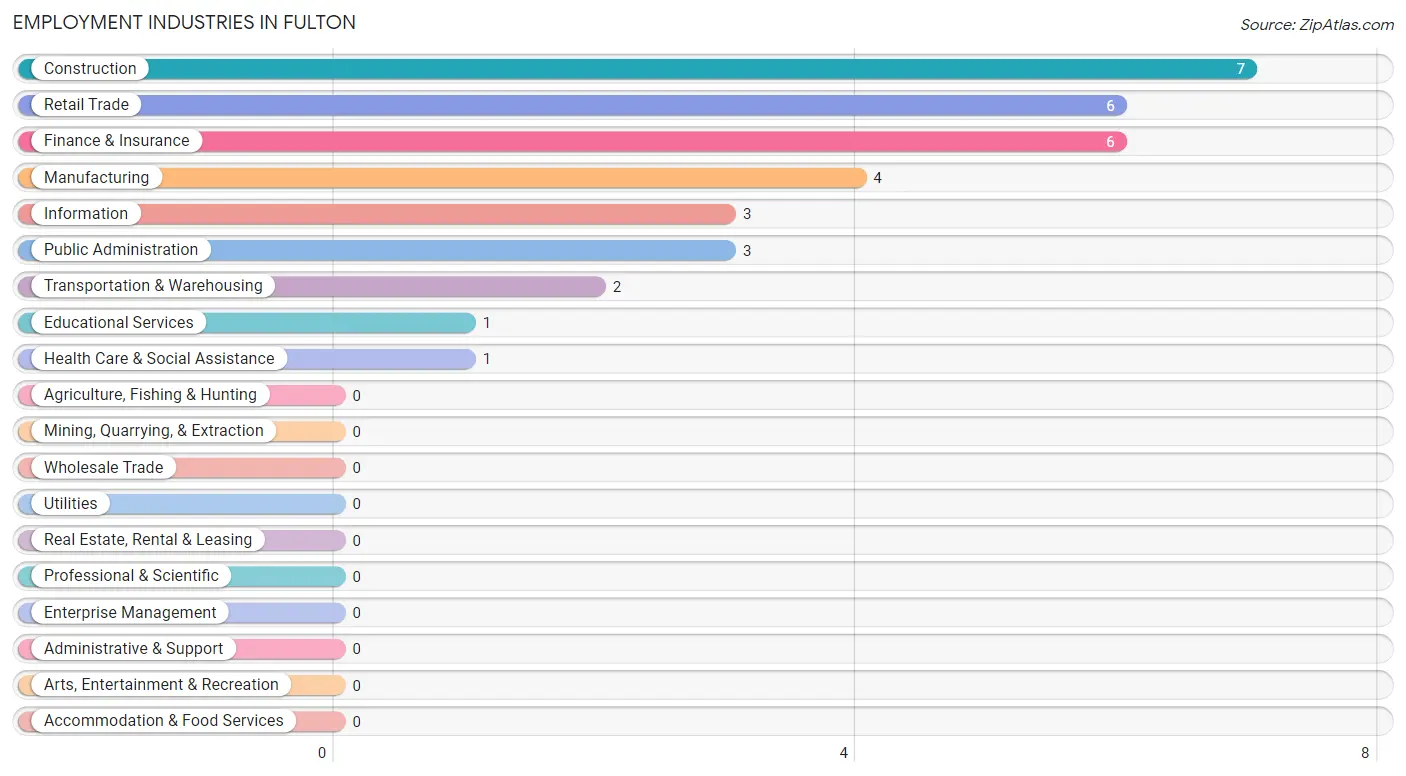
Employment Industries by Sex in Fulton
The Fulton industries that see more men than women are Construction (100.0%), Manufacturing (100.0%), and Retail Trade (100.0%), whereas the industries that tend to have a higher number of women are Transportation & Warehousing (100.0%), Information (100.0%), and Health Care & Social Assistance (100.0%).
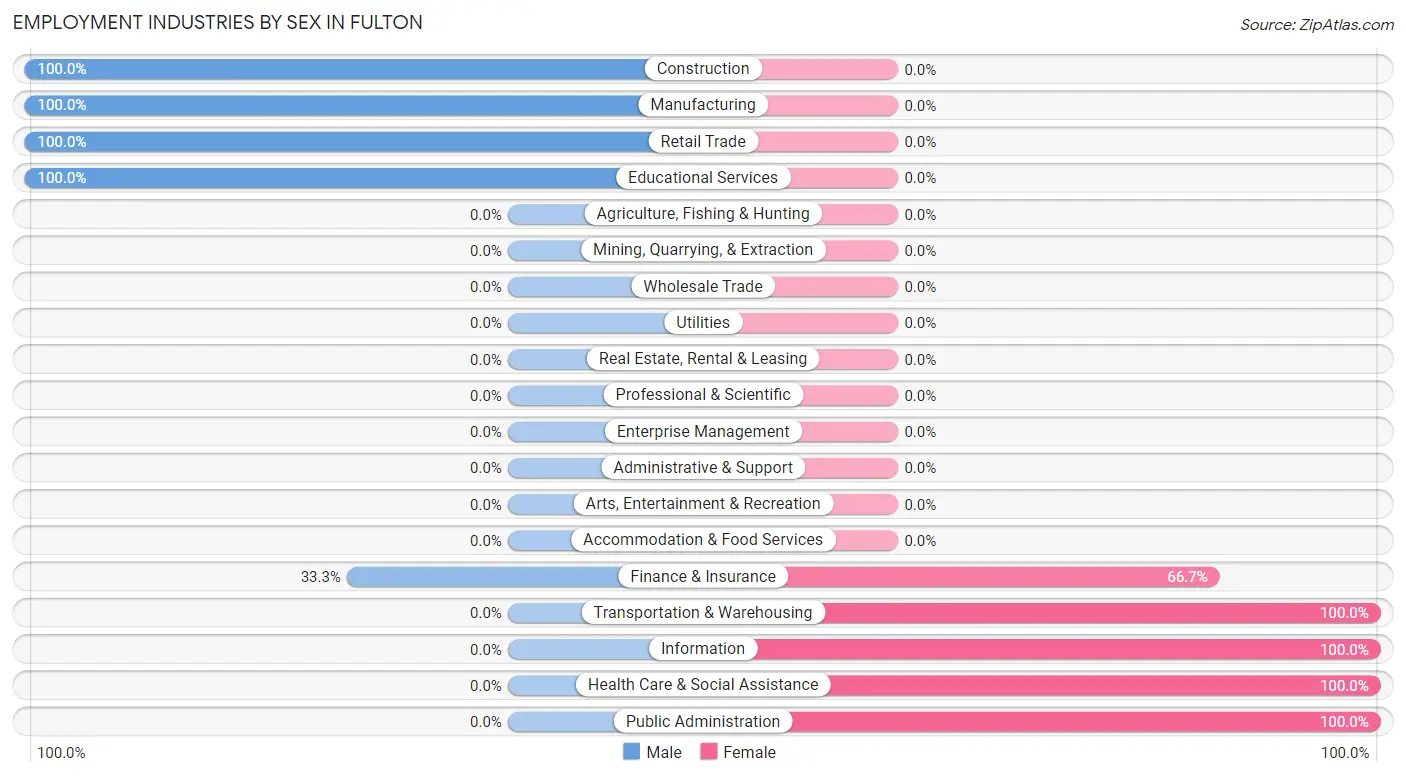
| Industry | Male | Female |
| Agriculture, Fishing & Hunting | 0 (0.0%) | 0 (0.0%) |
| Mining, Quarrying, & Extraction | 0 (0.0%) | 0 (0.0%) |
| Construction | 7 (100.0%) | 0 (0.0%) |
| Manufacturing | 4 (100.0%) | 0 (0.0%) |
| Wholesale Trade | 0 (0.0%) | 0 (0.0%) |
| Retail Trade | 6 (100.0%) | 0 (0.0%) |
| Transportation & Warehousing | 0 (0.0%) | 2 (100.0%) |
| Utilities | 0 (0.0%) | 0 (0.0%) |
| Information | 0 (0.0%) | 3 (100.0%) |
| Finance & Insurance | 2 (33.3%) | 4 (66.7%) |
| Real Estate, Rental & Leasing | 0 (0.0%) | 0 (0.0%) |
| Professional & Scientific | 0 (0.0%) | 0 (0.0%) |
| Enterprise Management | 0 (0.0%) | 0 (0.0%) |
| Administrative & Support | 0 (0.0%) | 0 (0.0%) |
| Educational Services | 1 (100.0%) | 0 (0.0%) |
| Health Care & Social Assistance | 0 (0.0%) | 1 (100.0%) |
| Arts, Entertainment & Recreation | 0 (0.0%) | 0 (0.0%) |
| Accommodation & Food Services | 0 (0.0%) | 0 (0.0%) |
| Public Administration | 0 (0.0%) | 3 (100.0%) |
| Total | 20 (60.6%) | 13 (39.4%) |
Education in Fulton
School Enrollment in Fulton
| School Level | # Students | % Students |
| Nursery / Preschool | 0 | 0.0% |
| Kindergarten | 0 | 0.0% |
| Elementary School | 0 | 0.0% |
| Middle School | 0 | 0.0% |
| High School | 0 | 0.0% |
| College / Undergraduate | 0 | 0.0% |
| Graduate / Professional | 0 | 0.0% |
| Total | 0 | 0.0% |
School Enrollment by Age by Funding Source in Fulton
| Age Bracket | Public School | Private School |
| 3 to 4 Year Olds | 0 (0.0%) | 0 (0.0%) |
| 5 to 9 Year Old | 0 (0.0%) | 0 (0.0%) |
| 10 to 14 Year Olds | 0 (0.0%) | 0 (0.0%) |
| 15 to 17 Year Olds | 0 (0.0%) | 0 (0.0%) |
| 18 to 19 Year Olds | 0 (0.0%) | 0 (0.0%) |
| 20 to 24 Year Olds | 0 (0.0%) | 0 (0.0%) |
| 25 to 34 Year Olds | 0 (0.0%) | 0 (0.0%) |
| 35 Years and over | 0 (0.0%) | 0 (0.0%) |
| Total | 0 (0.0%) | 0 (0.0%) |
Educational Attainment by Field of Study in Fulton
Science & technology (5 | 50.0%), business (4 | 40.0%), and psychology (1 | 10.0%) are the most common fields of study among 10 individuals in Fulton who have obtained a bachelor's degree or higher.
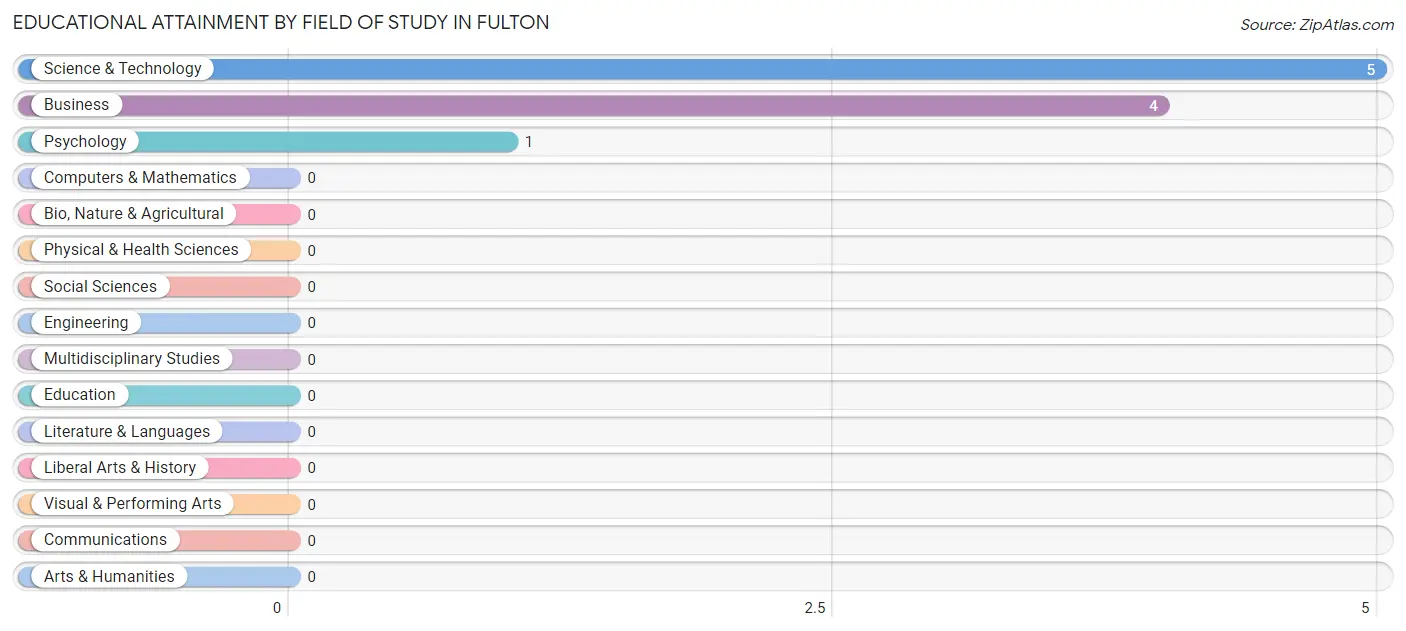
| Field of Study | # Graduates | % Graduates |
| Computers & Mathematics | 0 | 0.0% |
| Bio, Nature & Agricultural | 0 | 0.0% |
| Physical & Health Sciences | 0 | 0.0% |
| Psychology | 1 | 10.0% |
| Social Sciences | 0 | 0.0% |
| Engineering | 0 | 0.0% |
| Multidisciplinary Studies | 0 | 0.0% |
| Science & Technology | 5 | 50.0% |
| Business | 4 | 40.0% |
| Education | 0 | 0.0% |
| Literature & Languages | 0 | 0.0% |
| Liberal Arts & History | 0 | 0.0% |
| Visual & Performing Arts | 0 | 0.0% |
| Communications | 0 | 0.0% |
| Arts & Humanities | 0 | 0.0% |
| Total | 10 | 100.0% |
Transportation & Commute in Fulton
Vehicle Availability by Sex in Fulton
The most prevalent vehicle ownership categories in Fulton are males with 2 vehicles (14, accounting for 77.8%) and females with 2 vehicles (3, making up 107.7%).
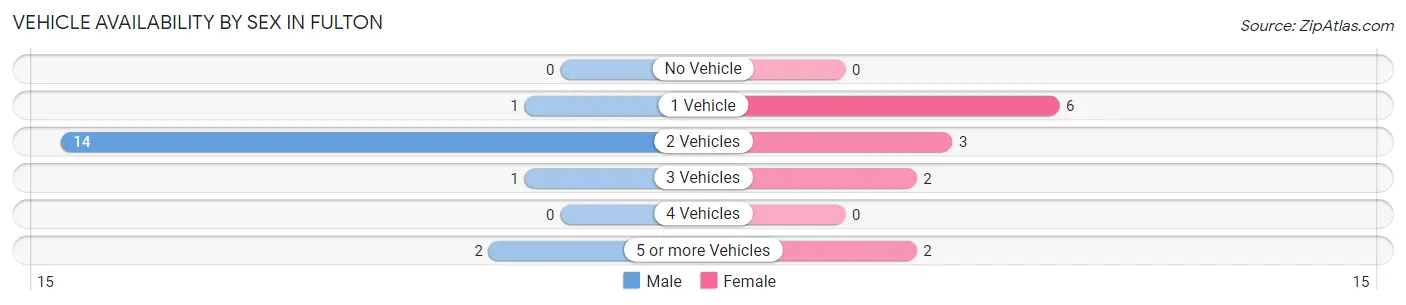
| Vehicles Available | Male | Female |
| No Vehicle | 0 (0.0%) | 0 (0.0%) |
| 1 Vehicle | 1 (5.6%) | 6 (46.2%) |
| 2 Vehicles | 14 (77.8%) | 3 (23.1%) |
| 3 Vehicles | 1 (5.6%) | 2 (15.4%) |
| 4 Vehicles | 0 (0.0%) | 0 (0.0%) |
| 5 or more Vehicles | 2 (11.1%) | 2 (15.4%) |
| Total | 18 (100.0%) | 13 (100.0%) |
Commute Time in Fulton
The most frequently occuring commute durations in Fulton are 15 to 19 minutes (14 commuters, 45.2%), 30 to 34 minutes (7 commuters, 22.6%), and 90 or more minutes (6 commuters, 19.4%).
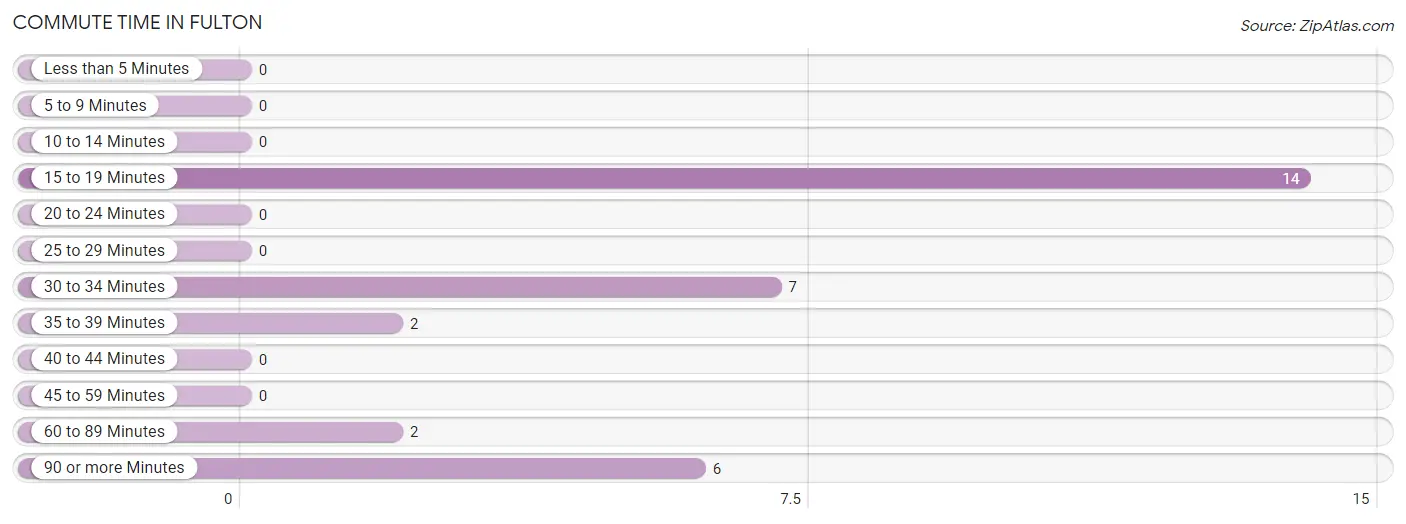
| Commute Time | # Commuters | % Commuters |
| Less than 5 Minutes | 0 | 0.0% |
| 5 to 9 Minutes | 0 | 0.0% |
| 10 to 14 Minutes | 0 | 0.0% |
| 15 to 19 Minutes | 14 | 45.2% |
| 20 to 24 Minutes | 0 | 0.0% |
| 25 to 29 Minutes | 0 | 0.0% |
| 30 to 34 Minutes | 7 | 22.6% |
| 35 to 39 Minutes | 2 | 6.5% |
| 40 to 44 Minutes | 0 | 0.0% |
| 45 to 59 Minutes | 0 | 0.0% |
| 60 to 89 Minutes | 2 | 6.5% |
| 90 or more Minutes | 6 | 19.4% |
Commute Time by Sex in Fulton
The most common commute times in Fulton are 30 to 34 minutes (7 commuters, 38.9%) for males and 15 to 19 minutes (11 commuters, 84.6%) for females.
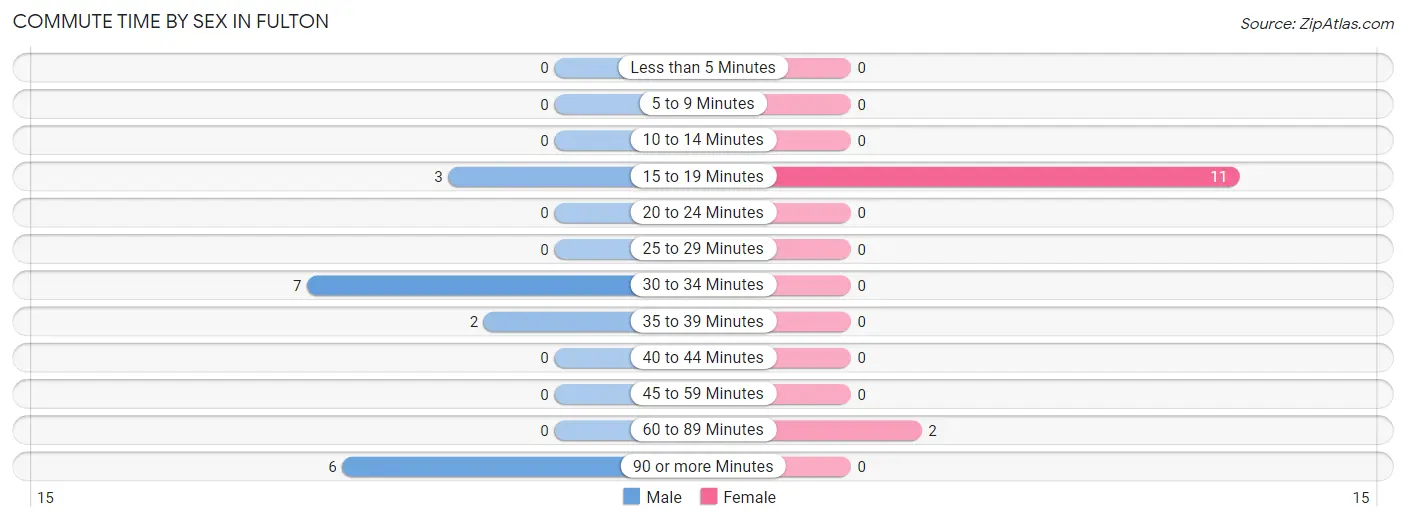
| Commute Time | Male | Female |
| Less than 5 Minutes | 0 (0.0%) | 0 (0.0%) |
| 5 to 9 Minutes | 0 (0.0%) | 0 (0.0%) |
| 10 to 14 Minutes | 0 (0.0%) | 0 (0.0%) |
| 15 to 19 Minutes | 3 (16.7%) | 11 (84.6%) |
| 20 to 24 Minutes | 0 (0.0%) | 0 (0.0%) |
| 25 to 29 Minutes | 0 (0.0%) | 0 (0.0%) |
| 30 to 34 Minutes | 7 (38.9%) | 0 (0.0%) |
| 35 to 39 Minutes | 2 (11.1%) | 0 (0.0%) |
| 40 to 44 Minutes | 0 (0.0%) | 0 (0.0%) |
| 45 to 59 Minutes | 0 (0.0%) | 0 (0.0%) |
| 60 to 89 Minutes | 0 (0.0%) | 2 (15.4%) |
| 90 or more Minutes | 6 (33.3%) | 0 (0.0%) |
Time of Departure to Work by Sex in Fulton
The most frequent times of departure to work in Fulton are 6:30 AM to 6:59 AM (9, 50.0%) for males and 7:00 AM to 7:29 AM (5, 38.5%) for females.
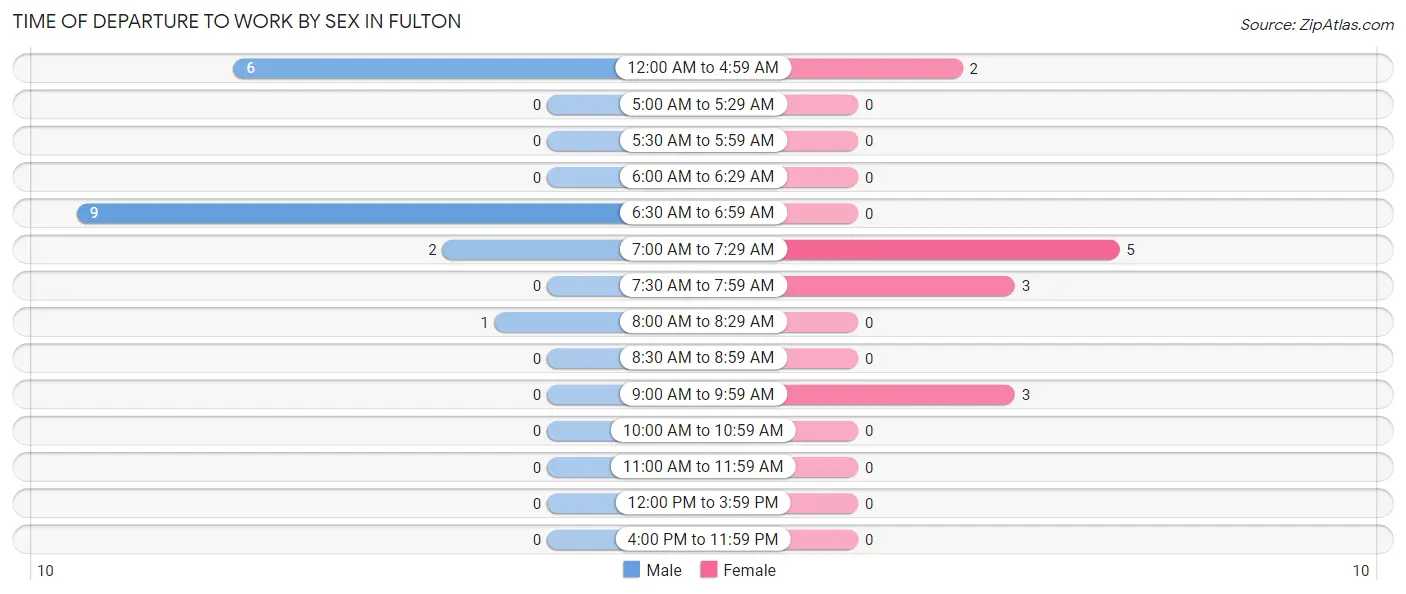
| Time of Departure | Male | Female |
| 12:00 AM to 4:59 AM | 6 (33.3%) | 2 (15.4%) |
| 5:00 AM to 5:29 AM | 0 (0.0%) | 0 (0.0%) |
| 5:30 AM to 5:59 AM | 0 (0.0%) | 0 (0.0%) |
| 6:00 AM to 6:29 AM | 0 (0.0%) | 0 (0.0%) |
| 6:30 AM to 6:59 AM | 9 (50.0%) | 0 (0.0%) |
| 7:00 AM to 7:29 AM | 2 (11.1%) | 5 (38.5%) |
| 7:30 AM to 7:59 AM | 0 (0.0%) | 3 (23.1%) |
| 8:00 AM to 8:29 AM | 1 (5.6%) | 0 (0.0%) |
| 8:30 AM to 8:59 AM | 0 (0.0%) | 0 (0.0%) |
| 9:00 AM to 9:59 AM | 0 (0.0%) | 3 (23.1%) |
| 10:00 AM to 10:59 AM | 0 (0.0%) | 0 (0.0%) |
| 11:00 AM to 11:59 AM | 0 (0.0%) | 0 (0.0%) |
| 12:00 PM to 3:59 PM | 0 (0.0%) | 0 (0.0%) |
| 4:00 PM to 11:59 PM | 0 (0.0%) | 0 (0.0%) |
| Total | 18 (100.0%) | 13 (100.0%) |
Housing Occupancy in Fulton
Occupancy by Ownership in Fulton
Of the total 36 dwellings in Fulton, owner-occupied units account for 32 (88.9%), while renter-occupied units make up 4 (11.1%).
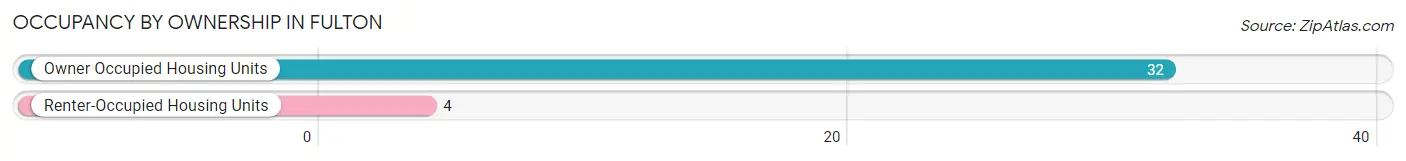
| Occupancy | # Housing Units | % Housing Units |
| Owner Occupied Housing Units | 32 | 88.9% |
| Renter-Occupied Housing Units | 4 | 11.1% |
| Total Occupied Housing Units | 36 | 100.0% |
Occupancy by Household Size in Fulton
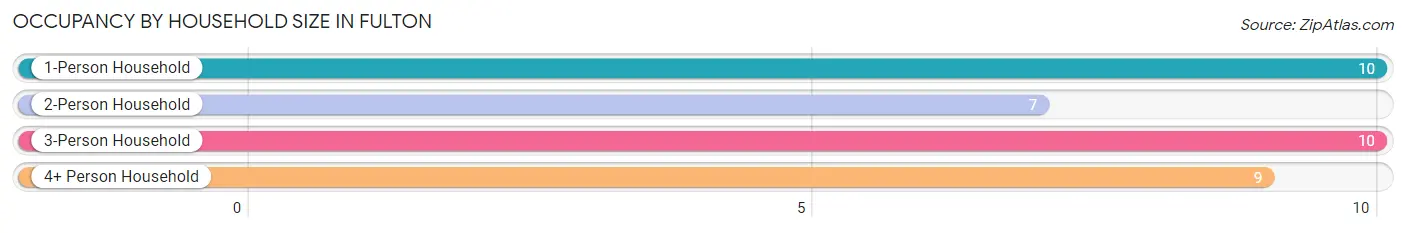
| Household Size | # Housing Units | % Housing Units |
| 1-Person Household | 10 | 27.8% |
| 2-Person Household | 7 | 19.4% |
| 3-Person Household | 10 | 27.8% |
| 4+ Person Household | 9 | 25.0% |
| Total Housing Units | 36 | 100.0% |
Occupancy by Ownership by Household Size in Fulton
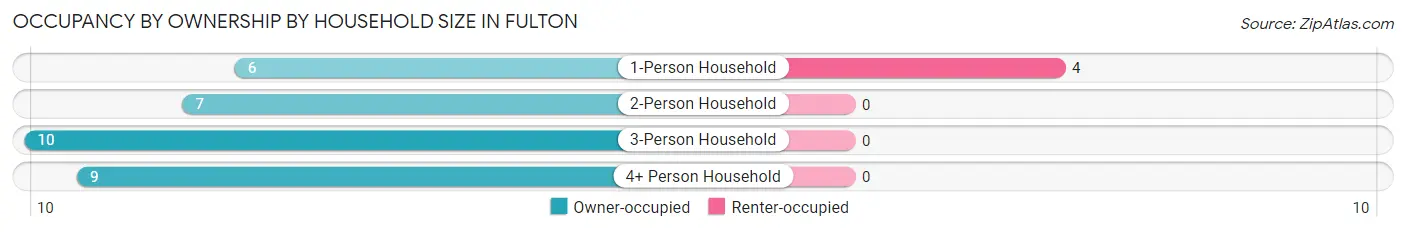
| Household Size | Owner-occupied | Renter-occupied |
| 1-Person Household | 6 (60.0%) | 4 (40.0%) |
| 2-Person Household | 7 (100.0%) | 0 (0.0%) |
| 3-Person Household | 10 (100.0%) | 0 (0.0%) |
| 4+ Person Household | 9 (100.0%) | 0 (0.0%) |
| Total Housing Units | 32 (88.9%) | 4 (11.1%) |
Occupancy by Educational Attainment in Fulton
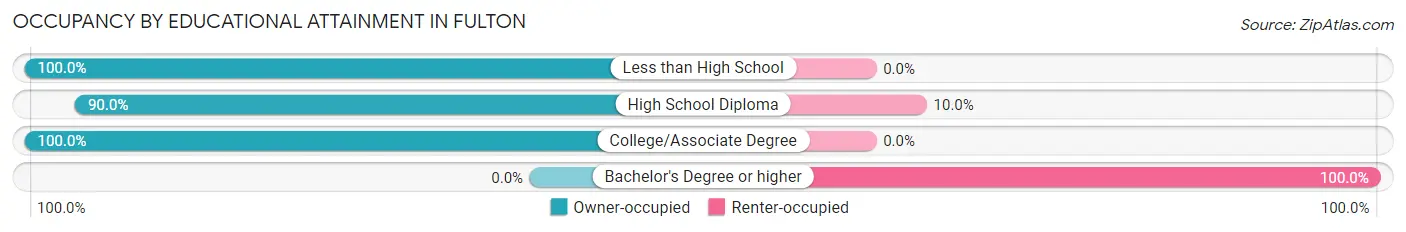
| Household Size | Owner-occupied | Renter-occupied |
| Less than High School | 3 (100.0%) | 0 (0.0%) |
| High School Diploma | 18 (90.0%) | 2 (10.0%) |
| College/Associate Degree | 11 (100.0%) | 0 (0.0%) |
| Bachelor's Degree or higher | 0 (0.0%) | 2 (100.0%) |
Occupancy by Age of Householder in Fulton
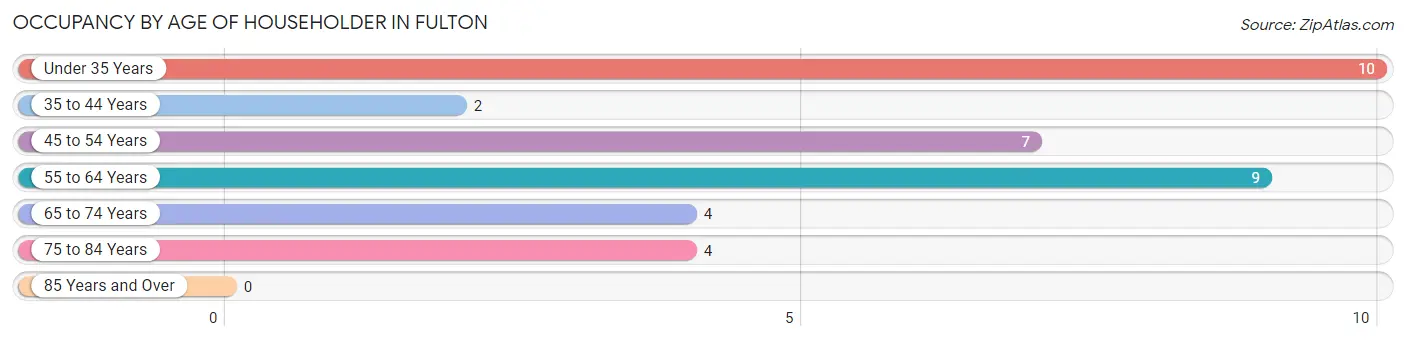
| Age Bracket | # Households | % Households |
| Under 35 Years | 10 | 27.8% |
| 35 to 44 Years | 2 | 5.6% |
| 45 to 54 Years | 7 | 19.4% |
| 55 to 64 Years | 9 | 25.0% |
| 65 to 74 Years | 4 | 11.1% |
| 75 to 84 Years | 4 | 11.1% |
| 85 Years and Over | 0 | 0.0% |
| Total | 36 | 100.0% |
Housing Finances in Fulton
Median Income by Occupancy in Fulton
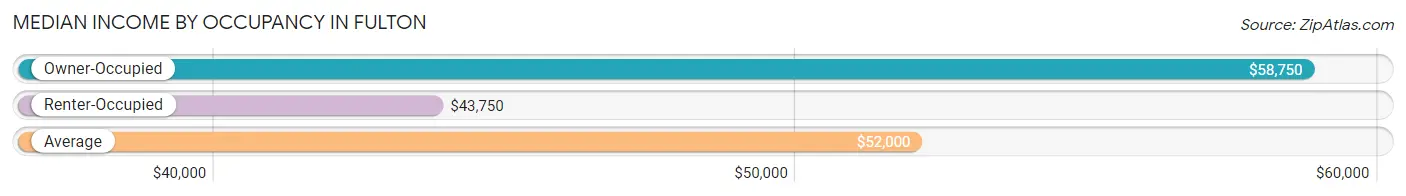
| Occupancy Type | # Households | Median Income |
| Owner-Occupied | 32 (88.9%) | $58,750 |
| Renter-Occupied | 4 (11.1%) | $43,750 |
| Average | 36 (100.0%) | $52,000 |
Occupancy by Householder Income Bracket in Fulton
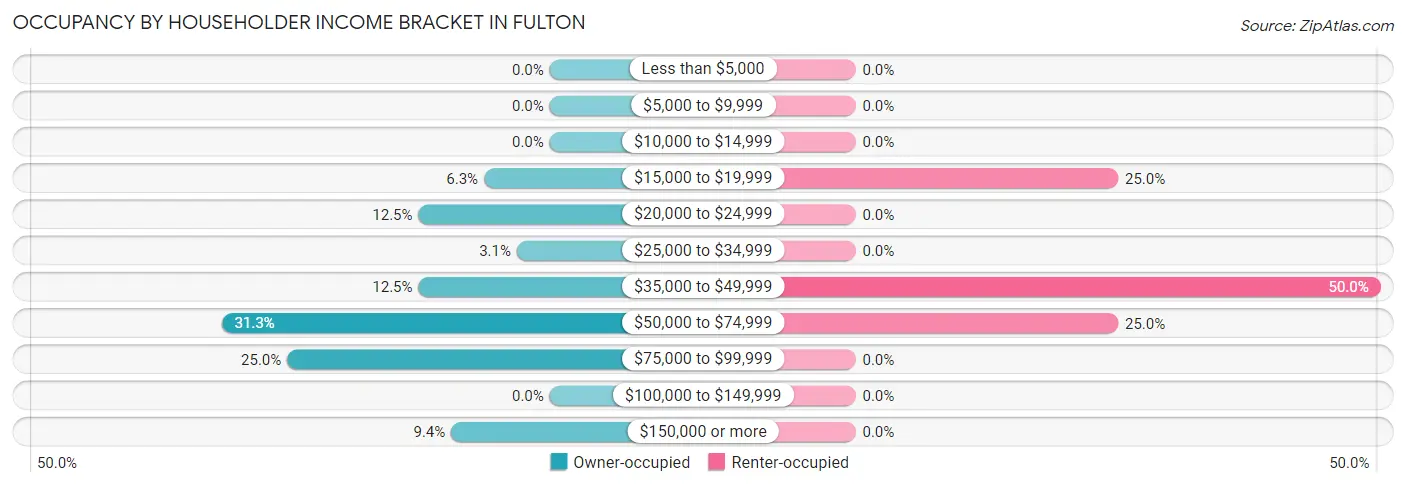
| Income Bracket | Owner-occupied | Renter-occupied |
| Less than $5,000 | 0 (0.0%) | 0 (0.0%) |
| $5,000 to $9,999 | 0 (0.0%) | 0 (0.0%) |
| $10,000 to $14,999 | 0 (0.0%) | 0 (0.0%) |
| $15,000 to $19,999 | 2 (6.2%) | 1 (25.0%) |
| $20,000 to $24,999 | 4 (12.5%) | 0 (0.0%) |
| $25,000 to $34,999 | 1 (3.1%) | 0 (0.0%) |
| $35,000 to $49,999 | 4 (12.5%) | 2 (50.0%) |
| $50,000 to $74,999 | 10 (31.2%) | 1 (25.0%) |
| $75,000 to $99,999 | 8 (25.0%) | 0 (0.0%) |
| $100,000 to $149,999 | 0 (0.0%) | 0 (0.0%) |
| $150,000 or more | 3 (9.4%) | 0 (0.0%) |
| Total | 32 (100.0%) | 4 (100.0%) |
Monthly Housing Cost Tiers in Fulton
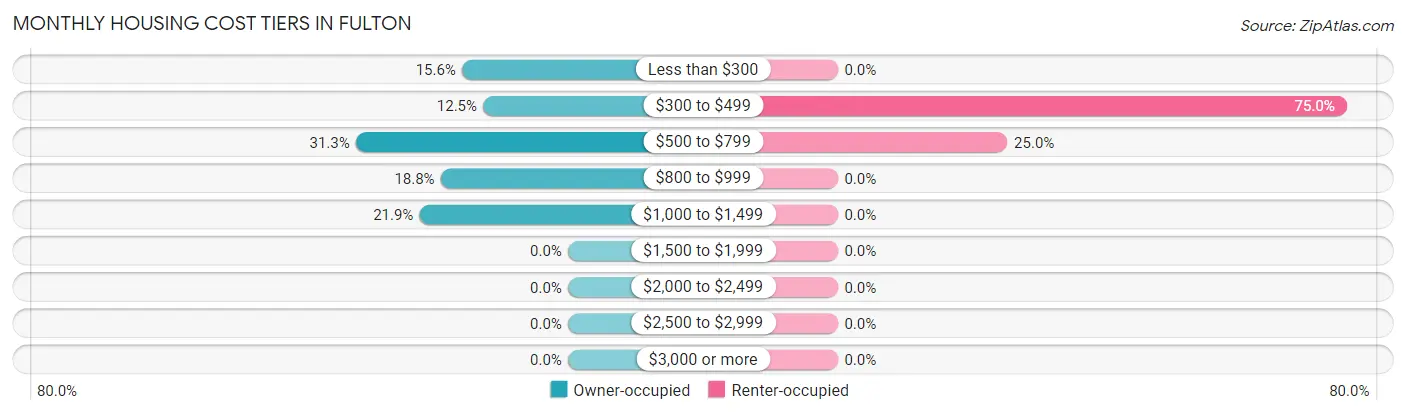
| Monthly Cost | Owner-occupied | Renter-occupied |
| Less than $300 | 5 (15.6%) | 0 (0.0%) |
| $300 to $499 | 4 (12.5%) | 3 (75.0%) |
| $500 to $799 | 10 (31.2%) | 1 (25.0%) |
| $800 to $999 | 6 (18.8%) | 0 (0.0%) |
| $1,000 to $1,499 | 7 (21.9%) | 0 (0.0%) |
| $1,500 to $1,999 | 0 (0.0%) | 0 (0.0%) |
| $2,000 to $2,499 | 0 (0.0%) | 0 (0.0%) |
| $2,500 to $2,999 | 0 (0.0%) | 0 (0.0%) |
| $3,000 or more | 0 (0.0%) | 0 (0.0%) |
| Total | 32 (100.0%) | 4 (100.0%) |
Physical Housing Characteristics in Fulton
Housing Structures in Fulton
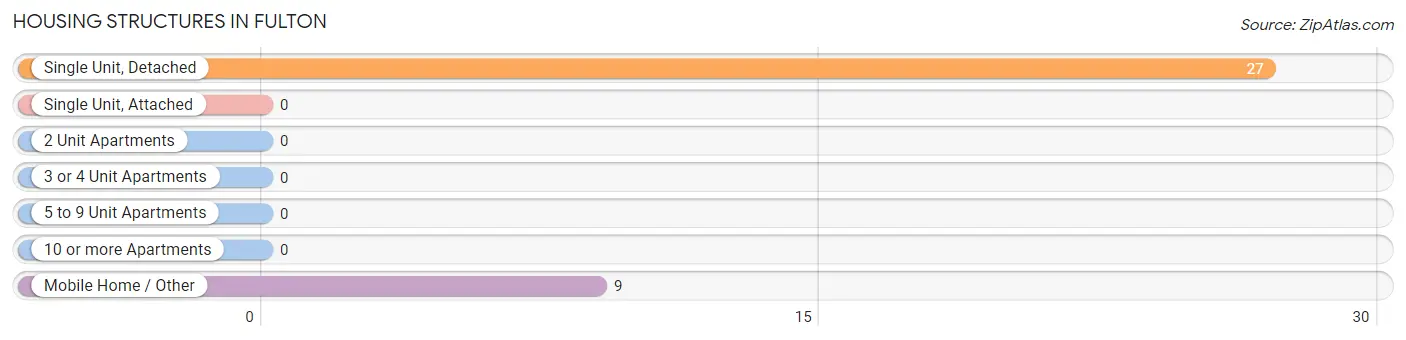
| Structure Type | # Housing Units | % Housing Units |
| Single Unit, Detached | 27 | 75.0% |
| Single Unit, Attached | 0 | 0.0% |
| 2 Unit Apartments | 0 | 0.0% |
| 3 or 4 Unit Apartments | 0 | 0.0% |
| 5 to 9 Unit Apartments | 0 | 0.0% |
| 10 or more Apartments | 0 | 0.0% |
| Mobile Home / Other | 9 | 25.0% |
| Total | 36 | 100.0% |
Housing Structures by Occupancy in Fulton
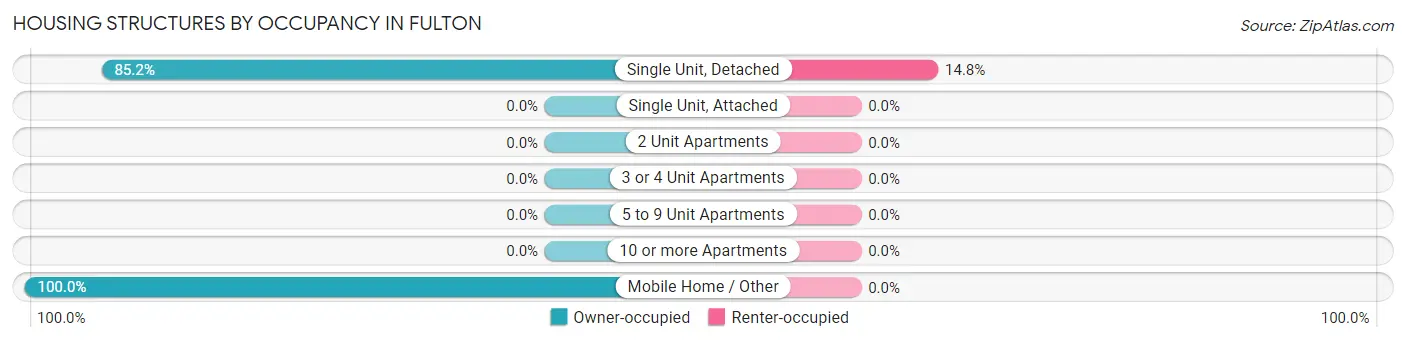
| Structure Type | Owner-occupied | Renter-occupied |
| Single Unit, Detached | 23 (85.2%) | 4 (14.8%) |
| Single Unit, Attached | 0 (0.0%) | 0 (0.0%) |
| 2 Unit Apartments | 0 (0.0%) | 0 (0.0%) |
| 3 or 4 Unit Apartments | 0 (0.0%) | 0 (0.0%) |
| 5 to 9 Unit Apartments | 0 (0.0%) | 0 (0.0%) |
| 10 or more Apartments | 0 (0.0%) | 0 (0.0%) |
| Mobile Home / Other | 9 (100.0%) | 0 (0.0%) |
| Total | 32 (88.9%) | 4 (11.1%) |
Housing Structures by Number of Rooms in Fulton
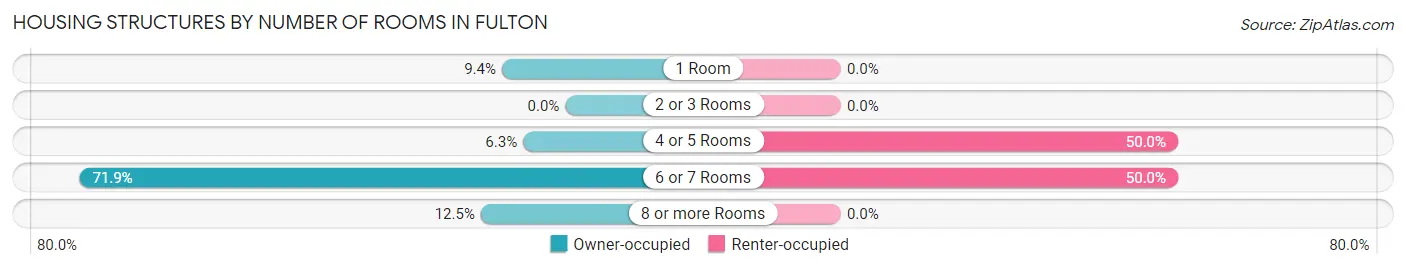
| Number of Rooms | Owner-occupied | Renter-occupied |
| 1 Room | 3 (9.4%) | 0 (0.0%) |
| 2 or 3 Rooms | 0 (0.0%) | 0 (0.0%) |
| 4 or 5 Rooms | 2 (6.2%) | 2 (50.0%) |
| 6 or 7 Rooms | 23 (71.9%) | 2 (50.0%) |
| 8 or more Rooms | 4 (12.5%) | 0 (0.0%) |
| Total | 32 (100.0%) | 4 (100.0%) |
Housing Structure by Heating Type in Fulton
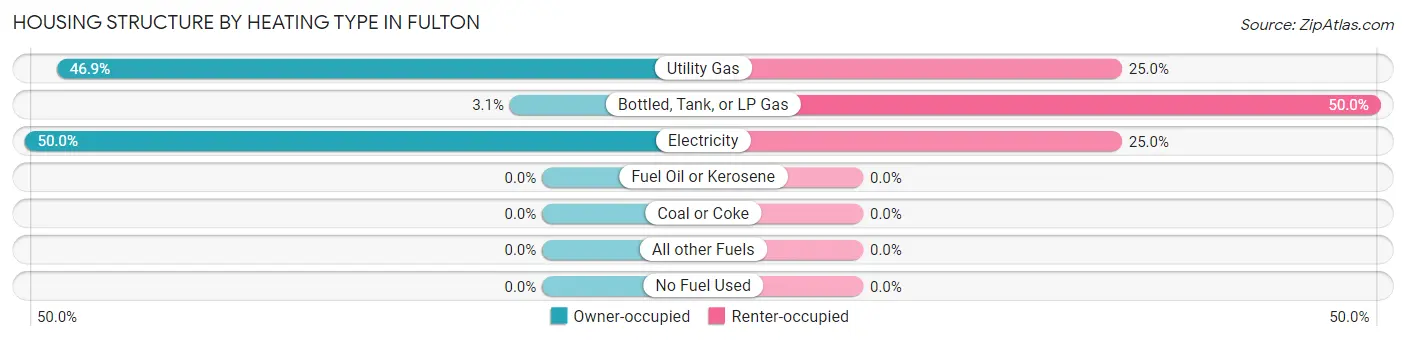
| Heating Type | Owner-occupied | Renter-occupied |
| Utility Gas | 15 (46.9%) | 1 (25.0%) |
| Bottled, Tank, or LP Gas | 1 (3.1%) | 2 (50.0%) |
| Electricity | 16 (50.0%) | 1 (25.0%) |
| Fuel Oil or Kerosene | 0 (0.0%) | 0 (0.0%) |
| Coal or Coke | 0 (0.0%) | 0 (0.0%) |
| All other Fuels | 0 (0.0%) | 0 (0.0%) |
| No Fuel Used | 0 (0.0%) | 0 (0.0%) |
| Total | 32 (100.0%) | 4 (100.0%) |
Household Vehicle Usage in Fulton

| Vehicles per Household | Owner-occupied | Renter-occupied |
| No Vehicle | 0 (0.0%) | 0 (0.0%) |
| 1 Vehicle | 7 (21.9%) | 4 (100.0%) |
| 2 Vehicles | 15 (46.9%) | 0 (0.0%) |
| 3 or more Vehicles | 10 (31.2%) | 0 (0.0%) |
| Total | 32 (100.0%) | 4 (100.0%) |
Real Estate & Mortgages in Fulton
Real Estate and Mortgage Overview in Fulton
| Characteristic | Without Mortgage | With Mortgage |
| Housing Units | 17 | 15 |
| Median Property Value | $46,300 | $0 |
| Median Household Income | $64,583 | $0 |
| Monthly Housing Costs | $394 | $0 |
| Real Estate Taxes | $967 | $4 |
Property Value by Mortgage Status in Fulton
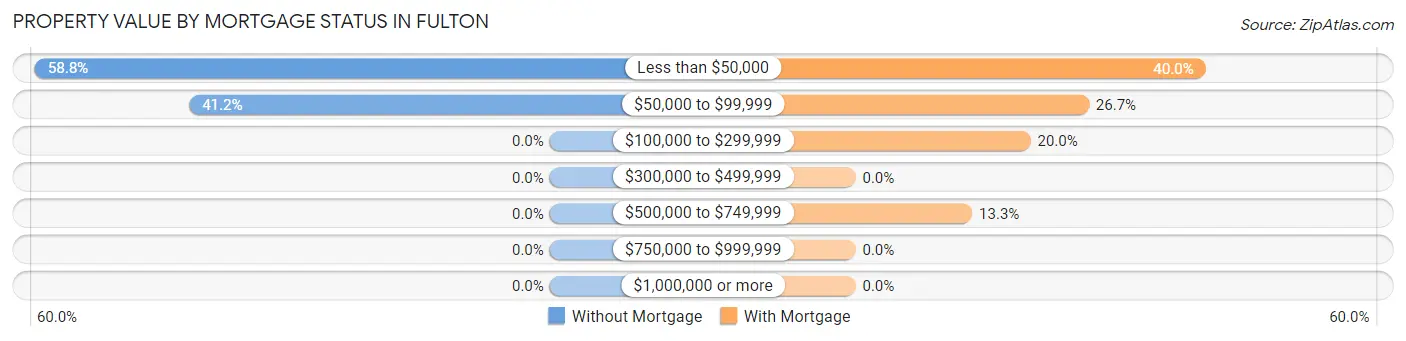
| Property Value | Without Mortgage | With Mortgage |
| Less than $50,000 | 10 (58.8%) | 6 (40.0%) |
| $50,000 to $99,999 | 7 (41.2%) | 4 (26.7%) |
| $100,000 to $299,999 | 0 (0.0%) | 3 (20.0%) |
| $300,000 to $499,999 | 0 (0.0%) | 0 (0.0%) |
| $500,000 to $749,999 | 0 (0.0%) | 2 (13.3%) |
| $750,000 to $999,999 | 0 (0.0%) | 0 (0.0%) |
| $1,000,000 or more | 0 (0.0%) | 0 (0.0%) |
| Total | 17 (100.0%) | 15 (100.0%) |
Household Income by Mortgage Status in Fulton
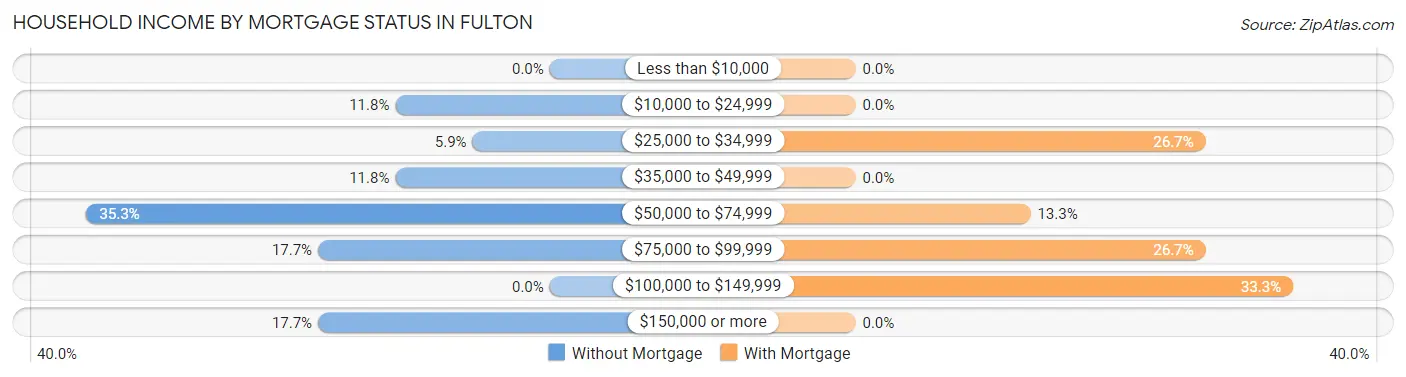
| Household Income | Without Mortgage | With Mortgage |
| Less than $10,000 | 0 (0.0%) | 0 (0.0%) |
| $10,000 to $24,999 | 2 (11.8%) | 0 (0.0%) |
| $25,000 to $34,999 | 1 (5.9%) | 4 (26.7%) |
| $35,000 to $49,999 | 2 (11.8%) | 0 (0.0%) |
| $50,000 to $74,999 | 6 (35.3%) | 2 (13.3%) |
| $75,000 to $99,999 | 3 (17.6%) | 4 (26.7%) |
| $100,000 to $149,999 | 0 (0.0%) | 5 (33.3%) |
| $150,000 or more | 3 (17.6%) | 0 (0.0%) |
| Total | 17 (100.0%) | 15 (100.0%) |
Property Value to Household Income Ratio in Fulton
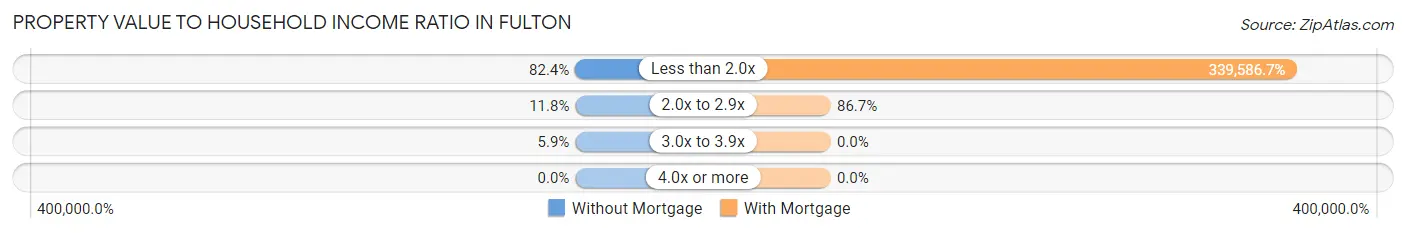
| Value-to-Income Ratio | Without Mortgage | With Mortgage |
| Less than 2.0x | 14 (82.4%) | 50,938 (339,586.7%) |
| 2.0x to 2.9x | 2 (11.8%) | 13 (86.7%) |
| 3.0x to 3.9x | 1 (5.9%) | 0 (0.0%) |
| 4.0x or more | 0 (0.0%) | 0 (0.0%) |
| Total | 17 (100.0%) | 15 (100.0%) |
Real Estate Taxes by Mortgage Status in Fulton
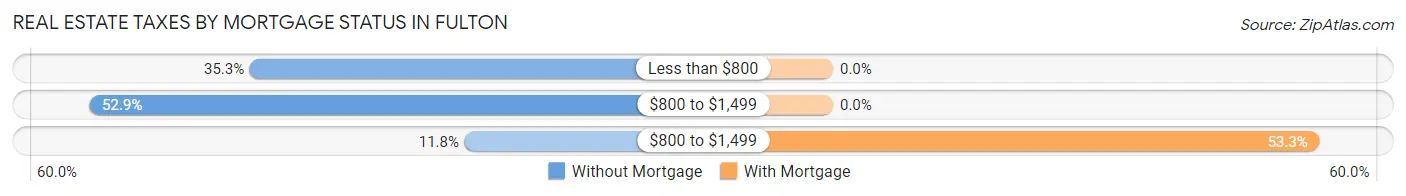
| Property Taxes | Without Mortgage | With Mortgage |
| Less than $800 | 6 (35.3%) | 0 (0.0%) |
| $800 to $1,499 | 9 (52.9%) | 0 (0.0%) |
| $800 to $1,499 | 2 (11.8%) | 8 (53.3%) |
| Total | 17 (100.0%) | 15 (100.0%) |
Health & Disability in Fulton
Health Insurance Coverage by Age in Fulton
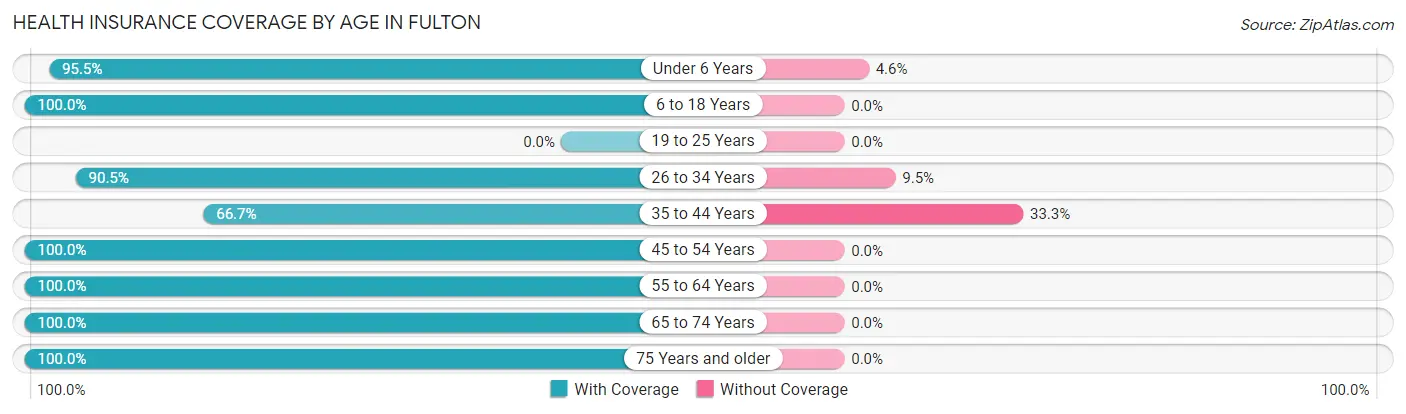
| Age Bracket | With Coverage | Without Coverage |
| Under 6 Years | 21 (95.5%) | 1 (4.5%) |
| 6 to 18 Years | 6 (100.0%) | 0 (0.0%) |
| 19 to 25 Years | 0 (0.0%) | 0 (0.0%) |
| 26 to 34 Years | 19 (90.5%) | 2 (9.5%) |
| 35 to 44 Years | 4 (66.7%) | 2 (33.3%) |
| 45 to 54 Years | 8 (100.0%) | 0 (0.0%) |
| 55 to 64 Years | 20 (100.0%) | 0 (0.0%) |
| 65 to 74 Years | 8 (100.0%) | 0 (0.0%) |
| 75 Years and older | 4 (100.0%) | 0 (0.0%) |
| Total | 90 (94.7%) | 5 (5.3%) |
Health Insurance Coverage by Citizenship Status in Fulton
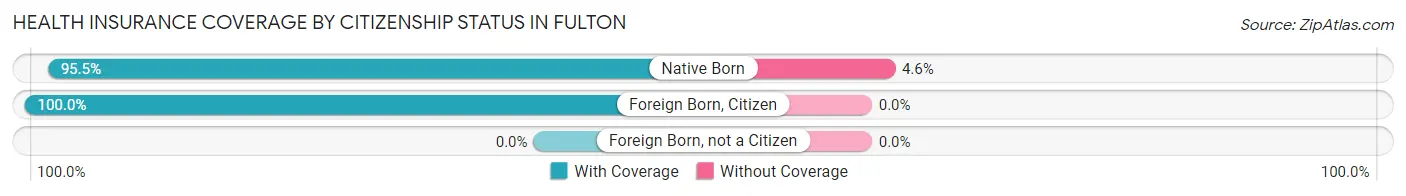
| Citizenship Status | With Coverage | Without Coverage |
| Native Born | 21 (95.5%) | 1 (4.5%) |
| Foreign Born, Citizen | 6 (100.0%) | 0 (0.0%) |
| Foreign Born, not a Citizen | 0 (0.0%) | 0 (0.0%) |
Health Insurance Coverage by Household Income in Fulton
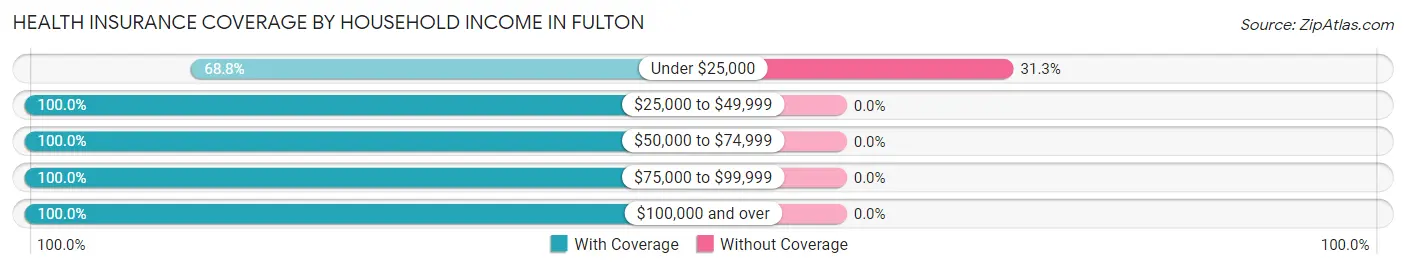
| Household Income | With Coverage | Without Coverage |
| Under $25,000 | 11 (68.8%) | 5 (31.2%) |
| $25,000 to $49,999 | 8 (100.0%) | 0 (0.0%) |
| $50,000 to $74,999 | 31 (100.0%) | 0 (0.0%) |
| $75,000 to $99,999 | 35 (100.0%) | 0 (0.0%) |
| $100,000 and over | 5 (100.0%) | 0 (0.0%) |
Public vs Private Health Insurance Coverage by Age in Fulton
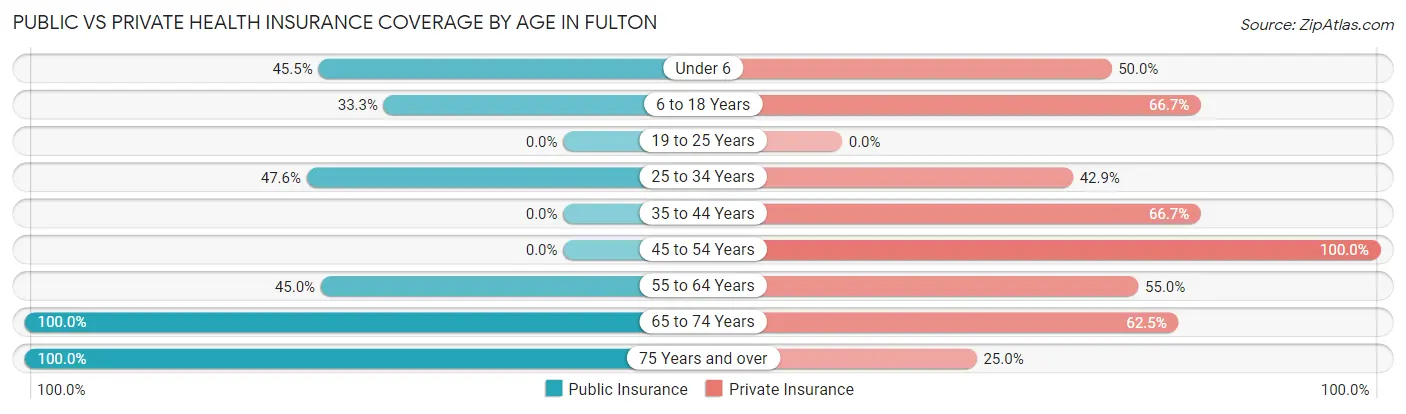
| Age Bracket | Public Insurance | Private Insurance |
| Under 6 | 10 (45.5%) | 11 (50.0%) |
| 6 to 18 Years | 2 (33.3%) | 4 (66.7%) |
| 19 to 25 Years | 0 (0.0%) | 0 (0.0%) |
| 25 to 34 Years | 10 (47.6%) | 9 (42.9%) |
| 35 to 44 Years | 0 (0.0%) | 4 (66.7%) |
| 45 to 54 Years | 0 (0.0%) | 8 (100.0%) |
| 55 to 64 Years | 9 (45.0%) | 11 (55.0%) |
| 65 to 74 Years | 8 (100.0%) | 5 (62.5%) |
| 75 Years and over | 4 (100.0%) | 1 (25.0%) |
| Total | 43 (45.3%) | 53 (55.8%) |
Disability Status by Sex by Age in Fulton
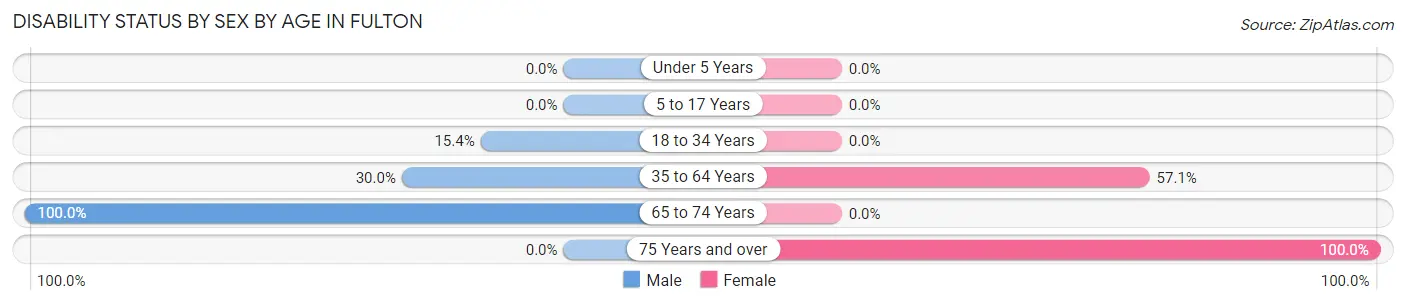
| Age Bracket | Male | Female |
| Under 5 Years | 0 (0.0%) | 0 (0.0%) |
| 5 to 17 Years | 0 (0.0%) | 0 (0.0%) |
| 18 to 34 Years | 2 (15.4%) | 0 (0.0%) |
| 35 to 64 Years | 6 (30.0%) | 8 (57.1%) |
| 65 to 74 Years | 4 (100.0%) | 0 (0.0%) |
| 75 Years and over | 0 (0.0%) | 1 (100.0%) |
Disability Class by Sex by Age in Fulton
Disability Class: Hearing Difficulty
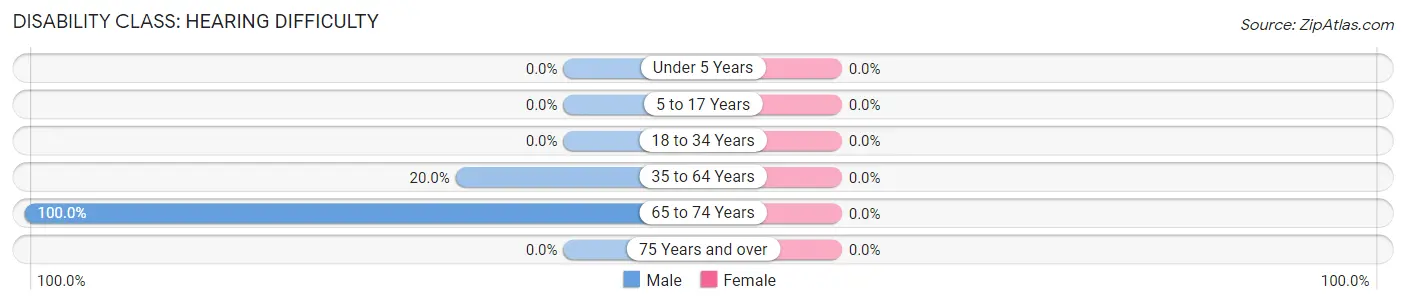
| Age Bracket | Male | Female |
| Under 5 Years | 0 (0.0%) | 0 (0.0%) |
| 5 to 17 Years | 0 (0.0%) | 0 (0.0%) |
| 18 to 34 Years | 0 (0.0%) | 0 (0.0%) |
| 35 to 64 Years | 4 (20.0%) | 0 (0.0%) |
| 65 to 74 Years | 4 (100.0%) | 0 (0.0%) |
| 75 Years and over | 0 (0.0%) | 0 (0.0%) |
Disability Class: Vision Difficulty
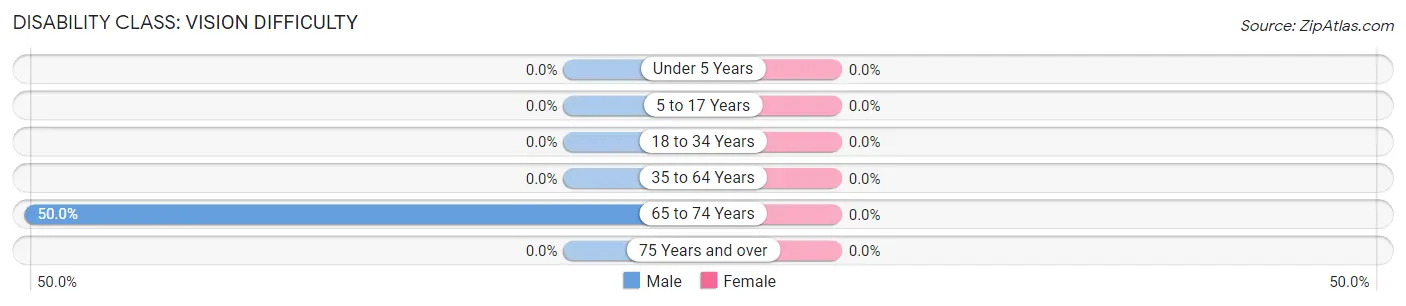
| Age Bracket | Male | Female |
| Under 5 Years | 0 (0.0%) | 0 (0.0%) |
| 5 to 17 Years | 0 (0.0%) | 0 (0.0%) |
| 18 to 34 Years | 0 (0.0%) | 0 (0.0%) |
| 35 to 64 Years | 0 (0.0%) | 0 (0.0%) |
| 65 to 74 Years | 2 (50.0%) | 0 (0.0%) |
| 75 Years and over | 0 (0.0%) | 0 (0.0%) |
Disability Class: Cognitive Difficulty
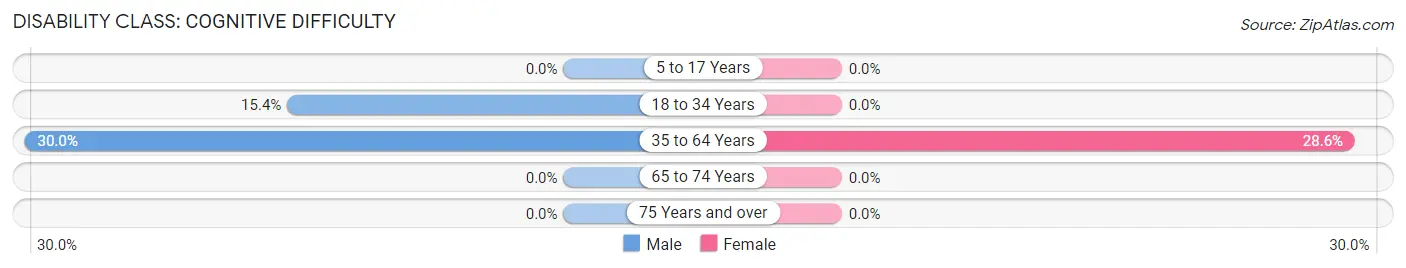
| Age Bracket | Male | Female |
| 5 to 17 Years | 0 (0.0%) | 0 (0.0%) |
| 18 to 34 Years | 2 (15.4%) | 0 (0.0%) |
| 35 to 64 Years | 6 (30.0%) | 4 (28.6%) |
| 65 to 74 Years | 0 (0.0%) | 0 (0.0%) |
| 75 Years and over | 0 (0.0%) | 0 (0.0%) |
Disability Class: Ambulatory Difficulty
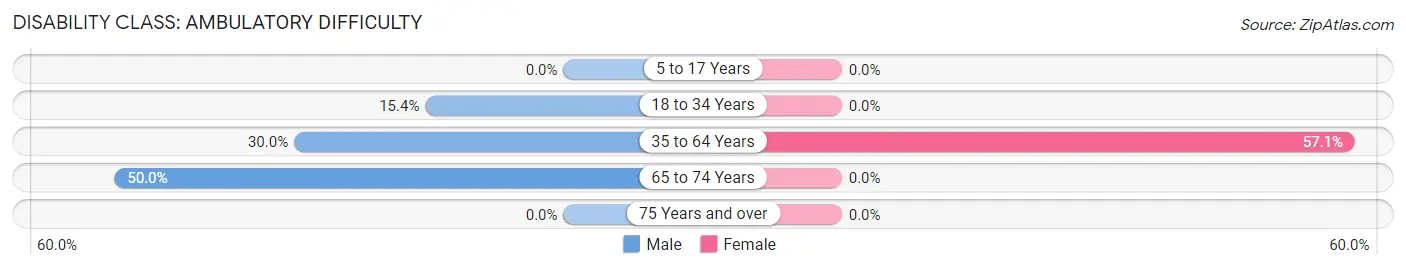
| Age Bracket | Male | Female |
| 5 to 17 Years | 0 (0.0%) | 0 (0.0%) |
| 18 to 34 Years | 2 (15.4%) | 0 (0.0%) |
| 35 to 64 Years | 6 (30.0%) | 8 (57.1%) |
| 65 to 74 Years | 2 (50.0%) | 0 (0.0%) |
| 75 Years and over | 0 (0.0%) | 0 (0.0%) |
Disability Class: Self-Care Difficulty
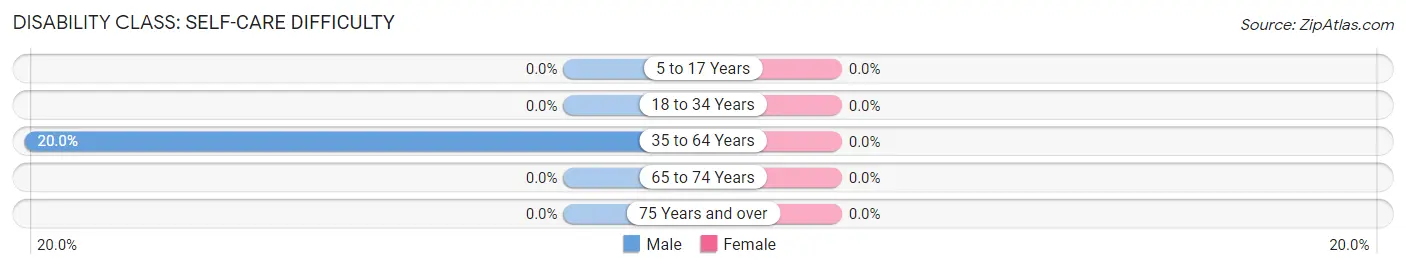
| Age Bracket | Male | Female |
| 5 to 17 Years | 0 (0.0%) | 0 (0.0%) |
| 18 to 34 Years | 0 (0.0%) | 0 (0.0%) |
| 35 to 64 Years | 4 (20.0%) | 0 (0.0%) |
| 65 to 74 Years | 0 (0.0%) | 0 (0.0%) |
| 75 Years and over | 0 (0.0%) | 0 (0.0%) |
Technology Access in Fulton
Computing Device Access in Fulton
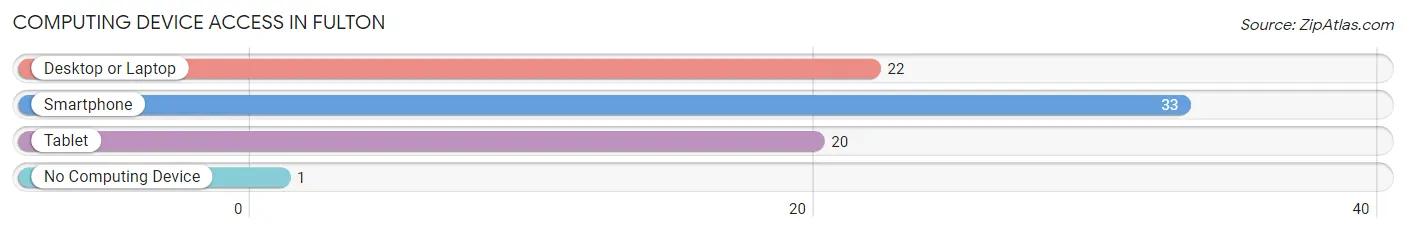
| Device Type | # Households | % Households |
| Desktop or Laptop | 22 | 61.1% |
| Smartphone | 33 | 91.7% |
| Tablet | 20 | 55.6% |
| No Computing Device | 1 | 2.8% |
| Total | 36 | 100.0% |
Internet Access in Fulton
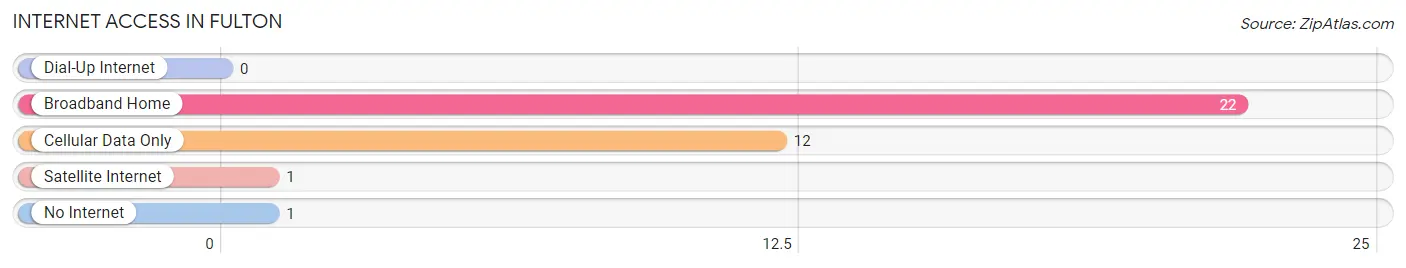
| Internet Type | # Households | % Households |
| Dial-Up Internet | 0 | 0.0% |
| Broadband Home | 22 | 61.1% |
| Cellular Data Only | 12 | 33.3% |
| Satellite Internet | 1 | 2.8% |
| No Internet | 1 | 2.8% |
| Total | 36 | 100.0% |
Fulton Summary
Fulton, Kansas is a small town located in Bourbon County, Kansas. It is situated in the southeastern corner of the state, near the Missouri border. The town was founded in 1871 and has a population of approximately 1,000 people.
Fulton is located in the Flint Hills region of Kansas, which is known for its rolling hills and prairies. The town is situated on the banks of the Marmaton River, which is a tributary of the Missouri River. The town is surrounded by agricultural land, and the main crops grown in the area are corn, soybeans, and wheat.
The economy of Fulton is largely based on agriculture. The town is home to several grain elevators, which are used to store and transport grain. There are also several small businesses in the town, including a grocery store, a hardware store, and a few restaurants.
The demographics of Fulton are largely white, with a small percentage of African Americans and Hispanics. The median household income in Fulton is $37,000, and the median home value is $90,000. The town has a low unemployment rate, and the majority of the population is employed in the agricultural industry.
Fulton is served by the Marmaton Valley Unified School District, which includes two elementary schools, a middle school, and a high school. The town also has a public library, a post office, and a few churches.
Fulton is a small town with a rich history and a strong sense of community. The town is home to many festivals and events throughout the year, including the annual Fulton County Fair. The town is also home to several historical sites, including the Marmaton Valley Museum and the Fulton County Courthouse.
Fulton is a great place to live and work, and it offers a variety of activities and attractions for residents and visitors alike. The town is a great place to raise a family, and it is a great place to retire. With its rich history, beautiful scenery, and friendly people, Fulton is a great place to call home.
Common Questions
What is Per Capita Income in Fulton?
Per Capita income in Fulton is $27,600.
What is the Median Family Income in Fulton?
Median Family Income in Fulton is $63,750.
What is the Median Household income in Fulton?
Median Household Income in Fulton is $52,000.
What is Income or Wage Gap in Fulton?
Income or Wage Gap in Fulton is 30.4%.
Women in Fulton earn 69.6 cents for every dollar earned by a man.
What is Inequality or Gini Index in Fulton?
Inequality or Gini Index in Fulton is 0.45.
What is the Total Population of Fulton?
Total Population of Fulton is 95.
What is the Total Male Population of Fulton?
Total Male Population of Fulton is 62.
What is the Total Female Population of Fulton?
Total Female Population of Fulton is 33.
What is the Ratio of Males per 100 Females in Fulton?
There are 187.88 Males per 100 Females in Fulton.
What is the Ratio of Females per 100 Males in Fulton?
There are 53.23 Females per 100 Males in Fulton.
What is the Median Population Age in Fulton?
Median Population Age in Fulton is 31.8 Years.
What is the Average Family Size in Fulton
Average Family Size in Fulton is 3.2 People.
What is the Average Household Size in Fulton
Average Household Size in Fulton is 2.6 People.
How Large is the Labor Force in Fulton?
There are 33 People in the Labor Forcein in Fulton.
What is the Percentage of People in the Labor Force in Fulton?
47.8% of People are in the Labor Force in Fulton.