Brookville, KS Map & Demographics
Brookville Map
Brookville Overview
$32,125
PER CAPITA INCOME
$81,875
AVG FAMILY INCOME
$80,625
AVG HOUSEHOLD INCOME
6.2%
WAGE / INCOME GAP [ % ]
93.8¢/ $1
WAGE / INCOME GAP [ $ ]
0.35
INEQUALITY / GINI INDEX
245
TOTAL POPULATION
136
MALE POPULATION
109
FEMALE POPULATION
124.77
MALES / 100 FEMALES
80.15
FEMALES / 100 MALES
33.0
MEDIAN AGE
4.2
AVG FAMILY SIZE
3.2
AVG HOUSEHOLD SIZE
147
LABOR FORCE [ PEOPLE ]
72.8%
PERCENT IN LABOR FORCE
Brookville Zip Codes
Brookville Area Codes
Income in Brookville
Income Overview in Brookville
Per Capita Income in Brookville is $32,125, while median incomes of families and households are $81,875 and $80,625 respectively.
| Characteristic | Number | Measure |
| Per Capita Income | 245 | $32,125 |
| Median Family Income | 48 | $81,875 |
| Mean Family Income | 48 | $97,431 |
| Median Household Income | 76 | $80,625 |
| Mean Household Income | 76 | $83,659 |
| Income Deficit | 48 | $0 |
| Wage / Income Gap (%) | 245 | 6.22% |
| Wage / Income Gap ($) | 245 | 93.78¢ per $1 |
| Gini / Inequality Index | 245 | 0.35 |
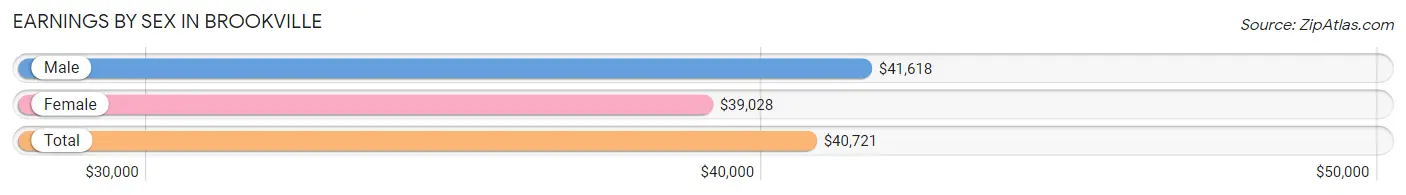
Earnings by Sex in Brookville
Average Earnings in Brookville are $40,721, $41,618 for men and $39,028 for women, a difference of 6.2%.
| Sex | Number | Average Earnings |
| Male | 84 (56.4%) | $41,618 |
| Female | 65 (43.6%) | $39,028 |
| Total | 149 (100.0%) | $40,721 |
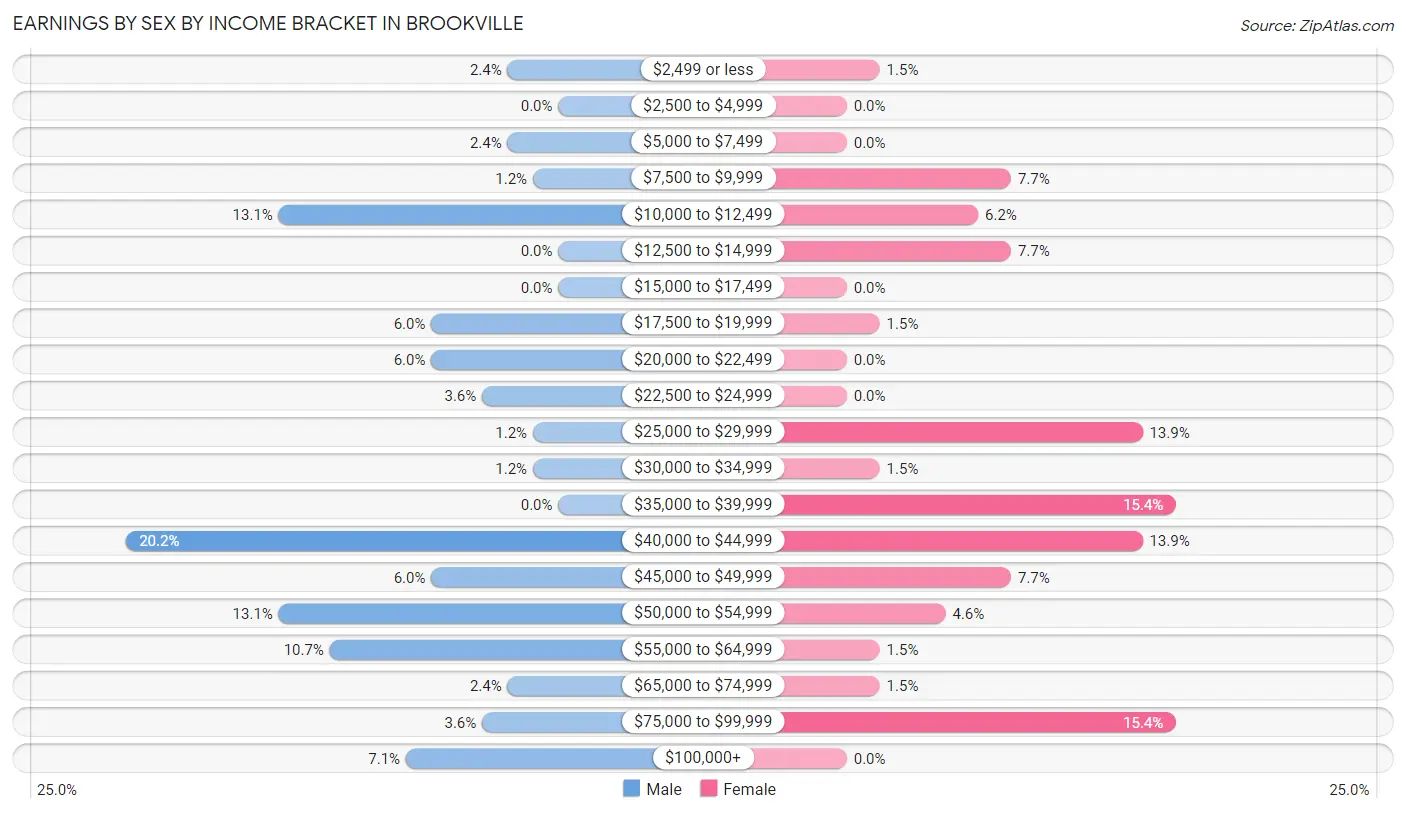
Earnings by Sex by Income Bracket in Brookville
The most common earnings brackets in Brookville are $40,000 to $44,999 for men (17 | 20.2%) and $35,000 to $39,999 for women (10 | 15.4%).
| Income | Male | Female |
| $2,499 or less | 2 (2.4%) | 1 (1.5%) |
| $2,500 to $4,999 | 0 (0.0%) | 0 (0.0%) |
| $5,000 to $7,499 | 2 (2.4%) | 0 (0.0%) |
| $7,500 to $9,999 | 1 (1.2%) | 5 (7.7%) |
| $10,000 to $12,499 | 11 (13.1%) | 4 (6.1%) |
| $12,500 to $14,999 | 0 (0.0%) | 5 (7.7%) |
| $15,000 to $17,499 | 0 (0.0%) | 0 (0.0%) |
| $17,500 to $19,999 | 5 (5.9%) | 1 (1.5%) |
| $20,000 to $22,499 | 5 (5.9%) | 0 (0.0%) |
| $22,500 to $24,999 | 3 (3.6%) | 0 (0.0%) |
| $25,000 to $29,999 | 1 (1.2%) | 9 (13.9%) |
| $30,000 to $34,999 | 1 (1.2%) | 1 (1.5%) |
| $35,000 to $39,999 | 0 (0.0%) | 10 (15.4%) |
| $40,000 to $44,999 | 17 (20.2%) | 9 (13.9%) |
| $45,000 to $49,999 | 5 (5.9%) | 5 (7.7%) |
| $50,000 to $54,999 | 11 (13.1%) | 3 (4.6%) |
| $55,000 to $64,999 | 9 (10.7%) | 1 (1.5%) |
| $65,000 to $74,999 | 2 (2.4%) | 1 (1.5%) |
| $75,000 to $99,999 | 3 (3.6%) | 10 (15.4%) |
| $100,000+ | 6 (7.1%) | 0 (0.0%) |
| Total | 84 (100.0%) | 65 (100.0%) |
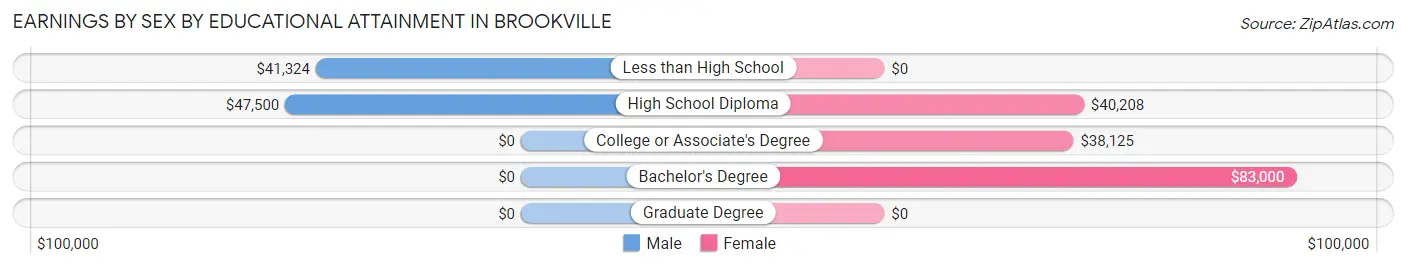
Earnings by Sex by Educational Attainment in Brookville
Average earnings in Brookville are $42,279 for men and $40,694 for women, a difference of 3.7%. Men with an educational attainment of high school diploma enjoy the highest average annual earnings of $47,500, while those with less than high school education earn the least with $41,324. Women with an educational attainment of bachelor's degree earn the most with the average annual earnings of $83,000, while those with college or associate's degree education have the smallest earnings of $38,125.
| Educational Attainment | Male Income | Female Income |
| Less than High School | $41,324 | $0 |
| High School Diploma | $47,500 | $40,208 |
| College or Associate's Degree | - | - |
| Bachelor's Degree | - | - |
| Graduate Degree | - | - |
| Total | $42,279 | $40,694 |
Family Income in Brookville
Family Income Brackets in Brookville
According to the Brookville family income data, there are 14 families falling into the $75,000 to $99,999 income range, which is the most common income bracket and makes up 29.2% of all families.
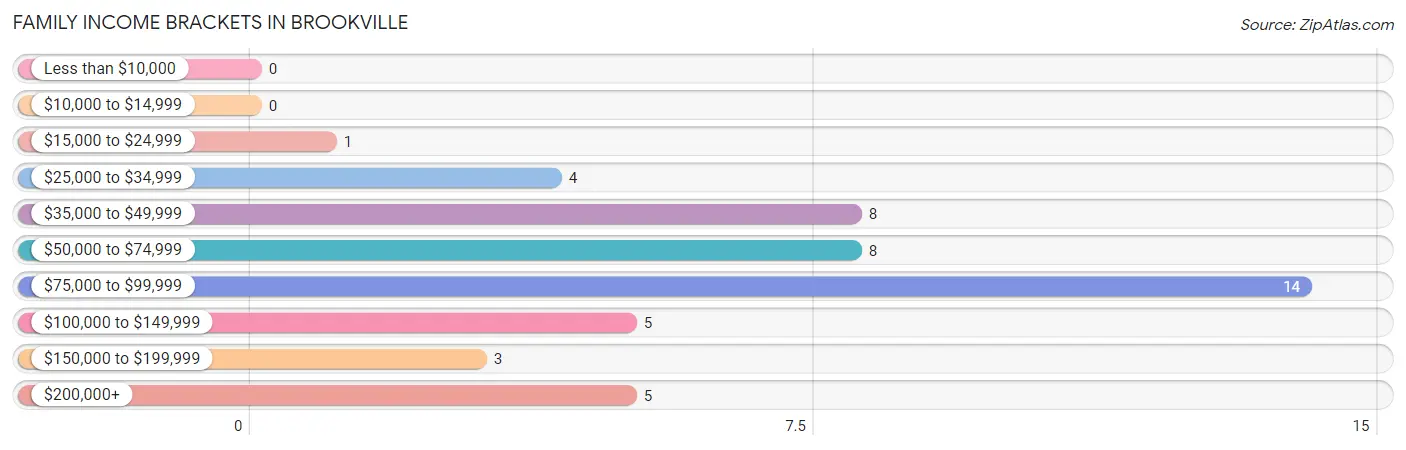
| Income Bracket | # Families | % Families |
| Less than $10,000 | 0 | 0.0% |
| $10,000 to $14,999 | 0 | 0.0% |
| $15,000 to $24,999 | 1 | 2.1% |
| $25,000 to $34,999 | 4 | 8.3% |
| $35,000 to $49,999 | 8 | 16.7% |
| $50,000 to $74,999 | 8 | 16.7% |
| $75,000 to $99,999 | 14 | 29.2% |
| $100,000 to $149,999 | 5 | 10.4% |
| $150,000 to $199,999 | 3 | 6.3% |
| $200,000+ | 5 | 10.4% |
Family Income by Famaliy Size in Brookville
4-person families (6 | 12.5%) account for the highest median family income in Brookville with $112,500 per family, while 2-person families (28 | 58.3%) have the highest median income of $40,625 per family member.
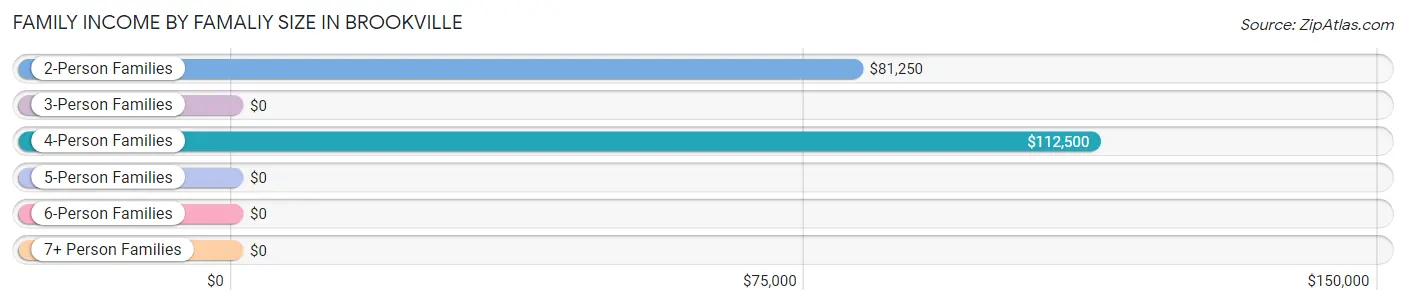
| Income Bracket | # Families | Median Income |
| 2-Person Families | 28 (58.3%) | $81,250 |
| 3-Person Families | 8 (16.7%) | $0 |
| 4-Person Families | 6 (12.5%) | $112,500 |
| 5-Person Families | 2 (4.2%) | $0 |
| 6-Person Families | 0 (0.0%) | $0 |
| 7+ Person Families | 4 (8.3%) | $0 |
| Total | 48 (100.0%) | $81,875 |
Family Income by Number of Earners in Brookville
The median family income in Brookville is $81,875, with families comprising 3+ earners (8) having the highest median family income of $250,001, while families with 1 earner (12) have the lowest median family income of $38,750, accounting for 16.7% and 25.0% of families, respectively.
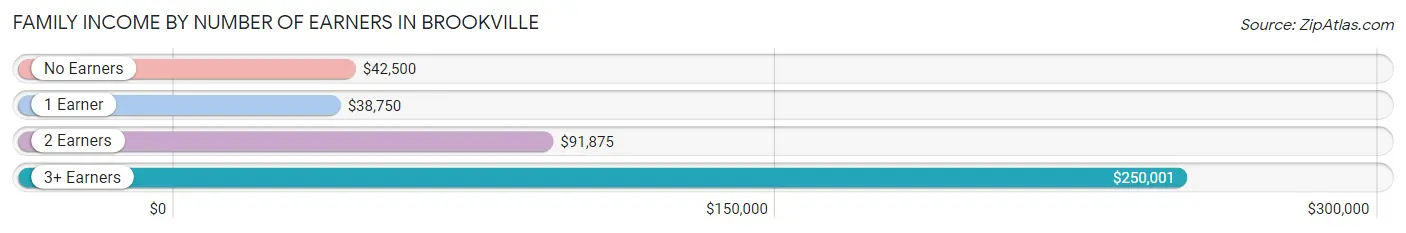
| Number of Earners | # Families | Median Income |
| No Earners | 6 (12.5%) | $42,500 |
| 1 Earner | 12 (25.0%) | $38,750 |
| 2 Earners | 22 (45.8%) | $91,875 |
| 3+ Earners | 8 (16.7%) | $250,001 |
| Total | 48 (100.0%) | $81,875 |
Household Income in Brookville
Household Income Brackets in Brookville
With 28 households falling in the category, the $75,000 to $99,999 income range is the most frequent in Brookville, accounting for 36.8% of all households. In contrast, only 1 households (1.3%) fall into the less than $10,000 income bracket, making it the least populous group.
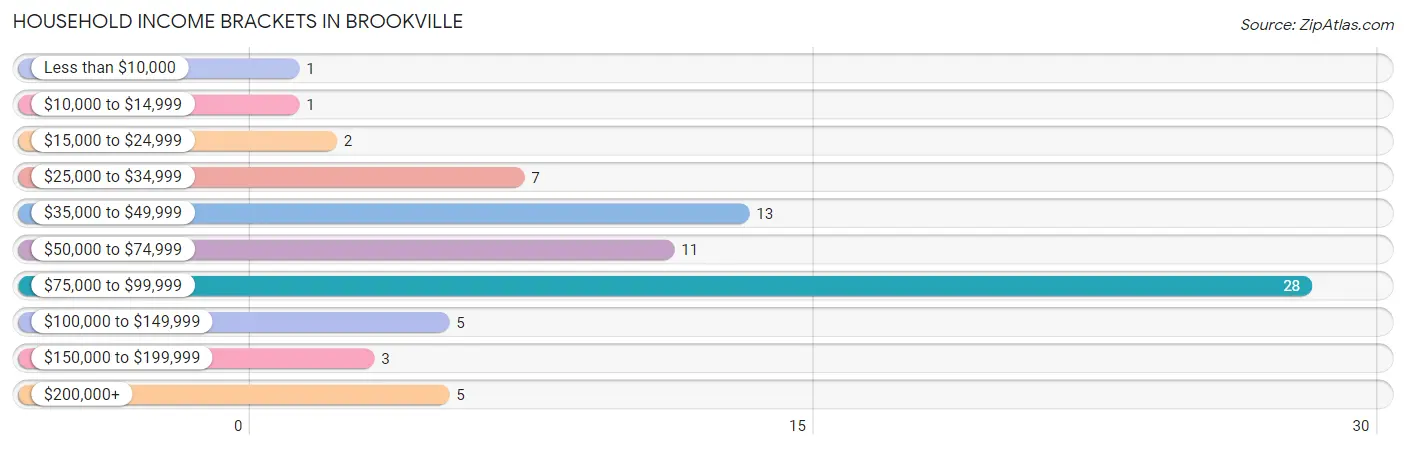
| Income Bracket | # Households | % Households |
| Less than $10,000 | 1 | 1.3% |
| $10,000 to $14,999 | 1 | 1.3% |
| $15,000 to $24,999 | 2 | 2.6% |
| $25,000 to $34,999 | 7 | 9.2% |
| $35,000 to $49,999 | 13 | 17.1% |
| $50,000 to $74,999 | 11 | 14.5% |
| $75,000 to $99,999 | 28 | 36.8% |
| $100,000 to $149,999 | 5 | 6.6% |
| $150,000 to $199,999 | 3 | 3.9% |
| $200,000+ | 5 | 6.6% |
Household Income by Householder Age in Brookville
The median household income in Brookville is $80,625, with the highest median household income of $83,500 found in the 45 to 64 years age bracket for the primary householder. A total of 40 households (52.6%) fall into this category.
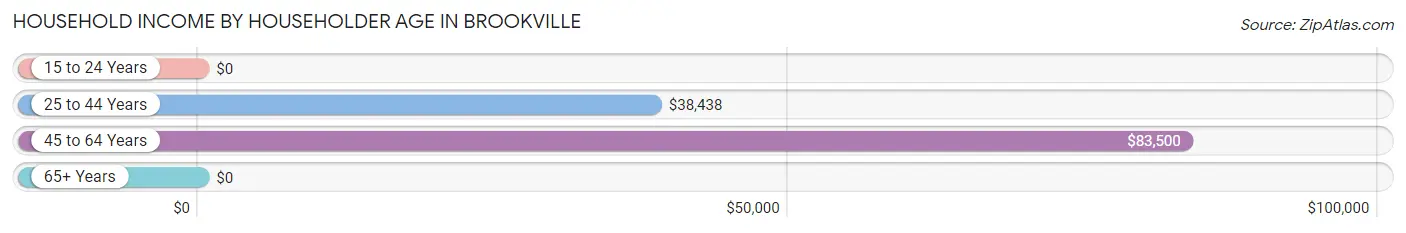
| Income Bracket | # Households | Median Income |
| 15 to 24 Years | 0 (0.0%) | $0 |
| 25 to 44 Years | 19 (25.0%) | $38,438 |
| 45 to 64 Years | 40 (52.6%) | $83,500 |
| 65+ Years | 17 (22.4%) | $0 |
| Total | 76 (100.0%) | $80,625 |
Poverty in Brookville
Income Below Poverty by Sex and Age in Brookville
With 3.0% poverty level for males and 16.5% for females among the residents of Brookville, 75 year old and over males and 18 to 24 year old females are the most vulnerable to poverty, with 1 males (20.0%) and 9 females (75.0%) in their respective age groups living below the poverty level.
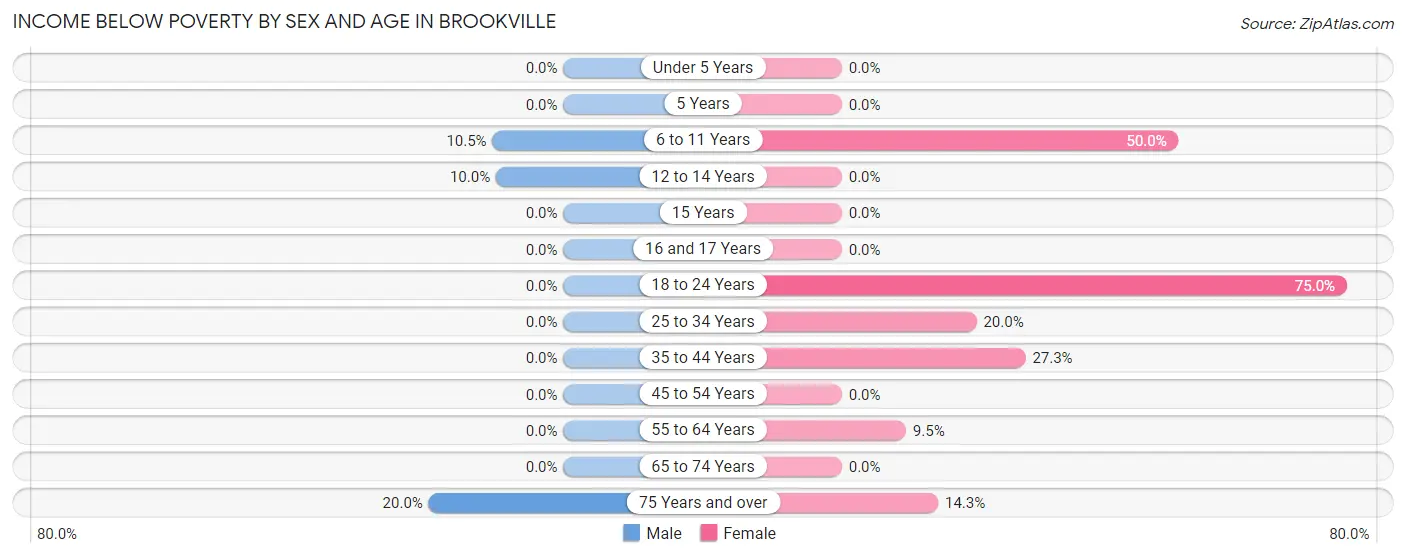
| Age Bracket | Male | Female |
| Under 5 Years | 0 (0.0%) | 0 (0.0%) |
| 5 Years | 0 (0.0%) | 0 (0.0%) |
| 6 to 11 Years | 2 (10.5%) | 1 (50.0%) |
| 12 to 14 Years | 1 (10.0%) | 0 (0.0%) |
| 15 Years | 0 (0.0%) | 0 (0.0%) |
| 16 and 17 Years | 0 (0.0%) | 0 (0.0%) |
| 18 to 24 Years | 0 (0.0%) | 9 (75.0%) |
| 25 to 34 Years | 0 (0.0%) | 2 (20.0%) |
| 35 to 44 Years | 0 (0.0%) | 3 (27.3%) |
| 45 to 54 Years | 0 (0.0%) | 0 (0.0%) |
| 55 to 64 Years | 0 (0.0%) | 2 (9.5%) |
| 65 to 74 Years | 0 (0.0%) | 0 (0.0%) |
| 75 Years and over | 1 (20.0%) | 1 (14.3%) |
| Total | 4 (3.0%) | 18 (16.5%) |
Income Above Poverty by Sex and Age in Brookville
According to the poverty statistics in Brookville, males aged under 5 years and females aged under 5 years are the age groups that are most secure financially, with 100.0% of males and 100.0% of females in these age groups living above the poverty line.
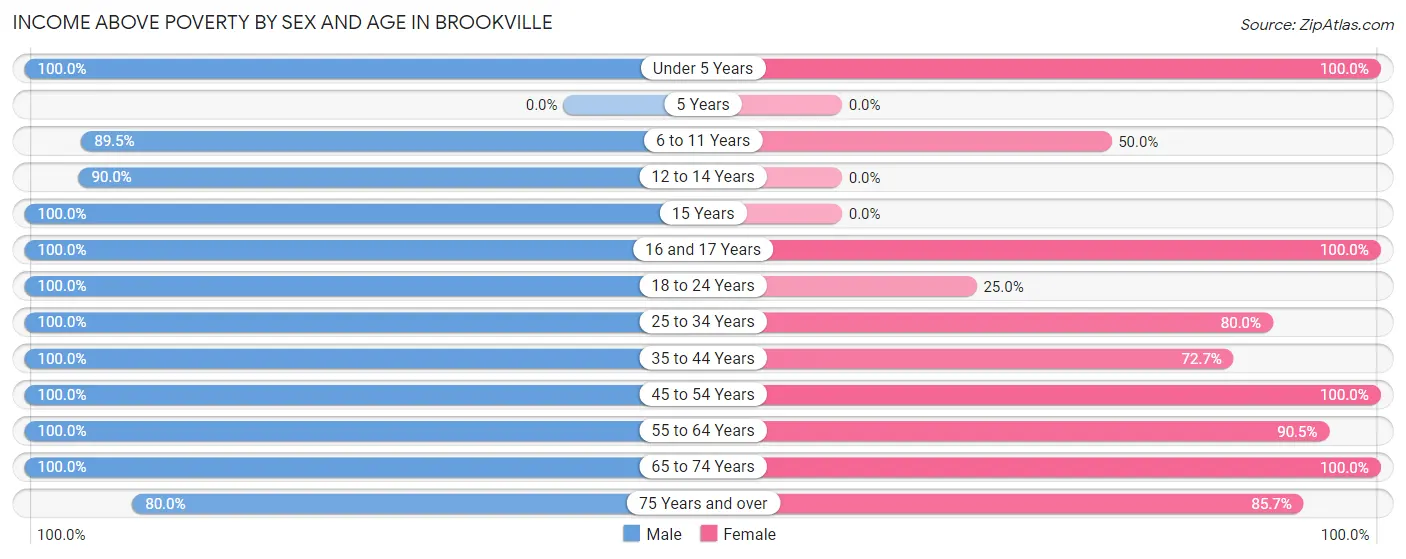
| Age Bracket | Male | Female |
| Under 5 Years | 6 (100.0%) | 4 (100.0%) |
| 5 Years | 0 (0.0%) | 0 (0.0%) |
| 6 to 11 Years | 17 (89.5%) | 1 (50.0%) |
| 12 to 14 Years | 9 (90.0%) | 0 (0.0%) |
| 15 Years | 1 (100.0%) | 0 (0.0%) |
| 16 and 17 Years | 3 (100.0%) | 11 (100.0%) |
| 18 to 24 Years | 9 (100.0%) | 3 (25.0%) |
| 25 to 34 Years | 38 (100.0%) | 8 (80.0%) |
| 35 to 44 Years | 2 (100.0%) | 8 (72.7%) |
| 45 to 54 Years | 17 (100.0%) | 28 (100.0%) |
| 55 to 64 Years | 15 (100.0%) | 19 (90.5%) |
| 65 to 74 Years | 10 (100.0%) | 3 (100.0%) |
| 75 Years and over | 4 (80.0%) | 6 (85.7%) |
| Total | 131 (97.0%) | 91 (83.5%) |
Income Below Poverty Among Married-Couple Families in Brookville
The poverty statistics for married-couple families in Brookville show that 2.9% or 1 of the total 34 families live below the poverty line. Families with no children have the highest poverty rate of 4.2%, comprising of 1 families. On the other hand, families with 1 or 2 children have the lowest poverty rate of 0.0%, which includes 0 families.
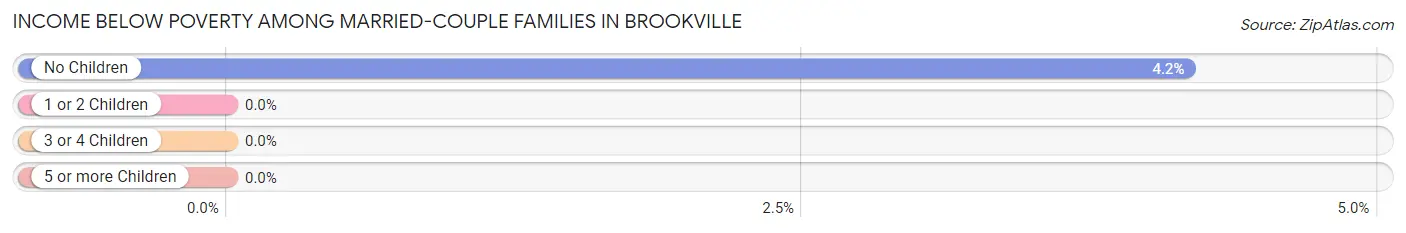
| Children | Above Poverty | Below Poverty |
| No Children | 23 (95.8%) | 1 (4.2%) |
| 1 or 2 Children | 4 (100.0%) | 0 (0.0%) |
| 3 or 4 Children | 6 (100.0%) | 0 (0.0%) |
| 5 or more Children | 0 (0.0%) | 0 (0.0%) |
| Total | 33 (97.1%) | 1 (2.9%) |
Income Below Poverty Among Single-Parent Households in Brookville
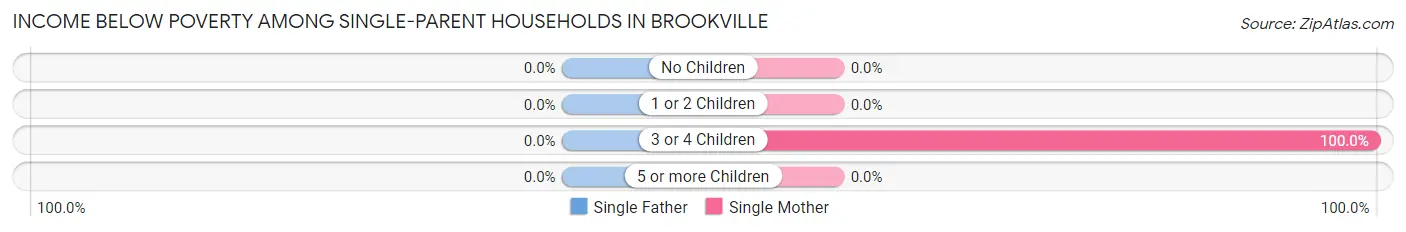
| Children | Single Father | Single Mother |
| No Children | 0 (0.0%) | 0 (0.0%) |
| 1 or 2 Children | 0 (0.0%) | 0 (0.0%) |
| 3 or 4 Children | 0 (0.0%) | 2 (100.0%) |
| 5 or more Children | 0 (0.0%) | 0 (0.0%) |
| Total | 0 (0.0%) | 2 (20.0%) |
Income Below Poverty Among Married-Couple vs Single-Parent Households in Brookville
The poverty data for Brookville shows that 1 of the married-couple family households (2.9%) and 2 of the single-parent households (14.3%) are living below the poverty level. Within the married-couple family households, those with no children have the highest poverty rate, with 1 households (4.2%) falling below the poverty line. Among the single-parent households, those with 3 or 4 children have the highest poverty rate, with 2 household (100.0%) living below poverty.
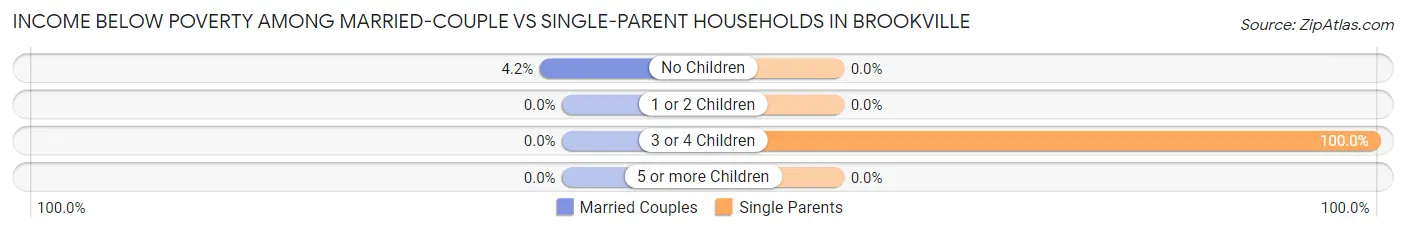
| Children | Married-Couple Families | Single-Parent Households |
| No Children | 1 (4.2%) | 0 (0.0%) |
| 1 or 2 Children | 0 (0.0%) | 0 (0.0%) |
| 3 or 4 Children | 0 (0.0%) | 2 (100.0%) |
| 5 or more Children | 0 (0.0%) | 0 (0.0%) |
| Total | 1 (2.9%) | 2 (14.3%) |
Race in Brookville
The most populous races in Brookville are White / Caucasian (188 | 76.7%), Two or more Races (54 | 22.0%), and Hispanic or Latino (44 | 18.0%).
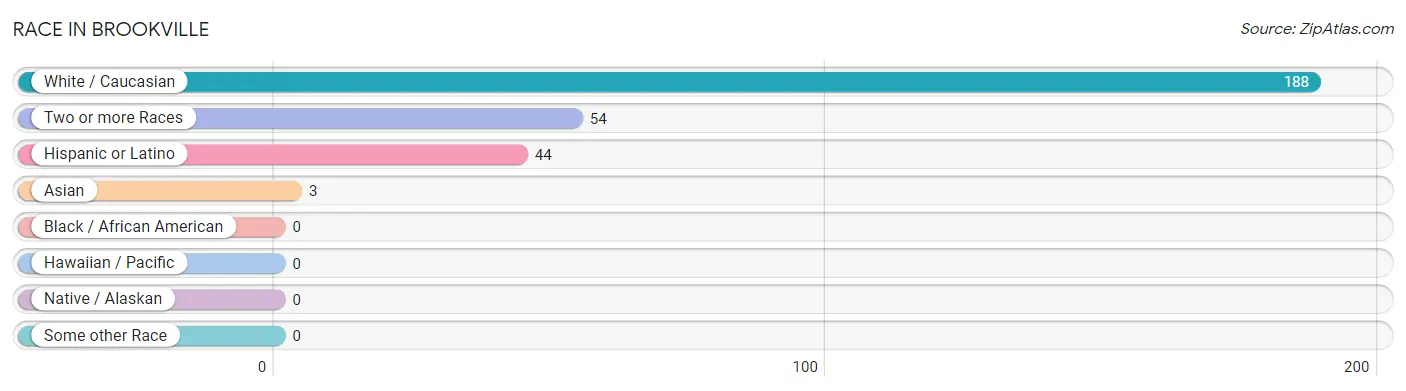
| Race | # Population | % Population |
| Asian | 3 | 1.2% |
| Black / African American | 0 | 0.0% |
| Hawaiian / Pacific | 0 | 0.0% |
| Hispanic or Latino | 44 | 18.0% |
| Native / Alaskan | 0 | 0.0% |
| White / Caucasian | 188 | 76.7% |
| Two or more Races | 54 | 22.0% |
| Some other Race | 0 | 0.0% |
| Total | 245 | 100.0% |
Ancestry in Brookville
The most populous ancestries reported in Brookville are German (48 | 19.6%), Spaniard (31 | 12.7%), English (21 | 8.6%), American (17 | 6.9%), and Mexican (13 | 5.3%), together accounting for 53.1% of all Brookville residents.
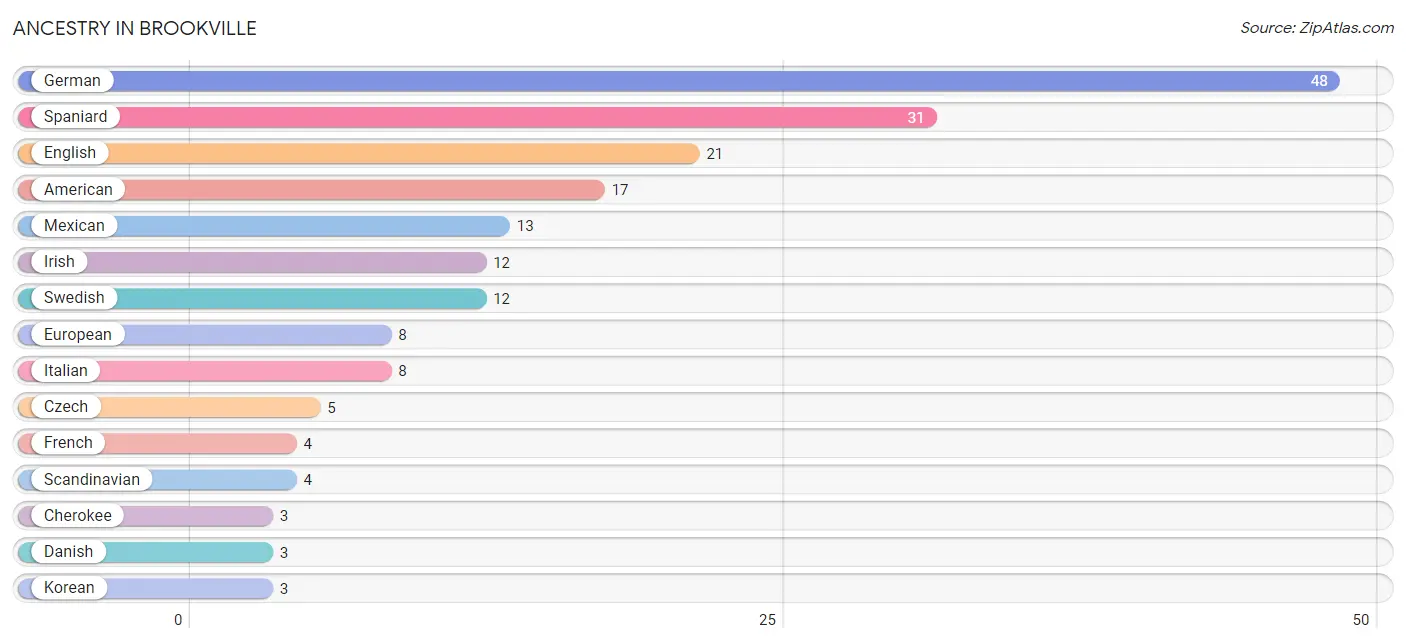
| Ancestry | # Population | % Population |
| American | 17 | 6.9% |
| Belgian | 2 | 0.8% |
| Cherokee | 3 | 1.2% |
| Czech | 5 | 2.0% |
| Danish | 3 | 1.2% |
| Dutch | 2 | 0.8% |
| English | 21 | 8.6% |
| European | 8 | 3.3% |
| French | 4 | 1.6% |
| German | 48 | 19.6% |
| Irish | 12 | 4.9% |
| Italian | 8 | 3.3% |
| Korean | 3 | 1.2% |
| Lithuanian | 1 | 0.4% |
| Mexican | 13 | 5.3% |
| Norwegian | 1 | 0.4% |
| Polish | 2 | 0.8% |
| Scandinavian | 4 | 1.6% |
| Scottish | 3 | 1.2% |
| Slovene | 1 | 0.4% |
| Spaniard | 31 | 12.7% |
| Swedish | 12 | 4.9% | View All 22 Rows |
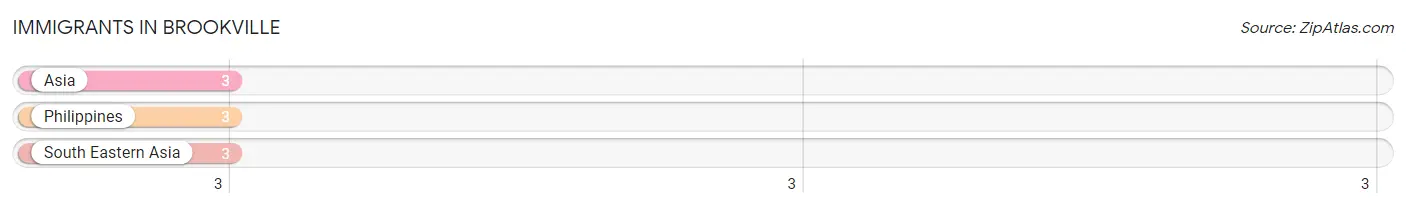
Immigrants in Brookville
The most numerous immigrant groups reported in Brookville came from Asia (3 | 1.2%), Philippines (3 | 1.2%), and South Eastern Asia (3 | 1.2%), together accounting for 3.7% of all Brookville residents.
| Immigration Origin | # Population | % Population |
| Asia | 3 | 1.2% |
| Philippines | 3 | 1.2% |
| South Eastern Asia | 3 | 1.2% | View All 3 Rows |
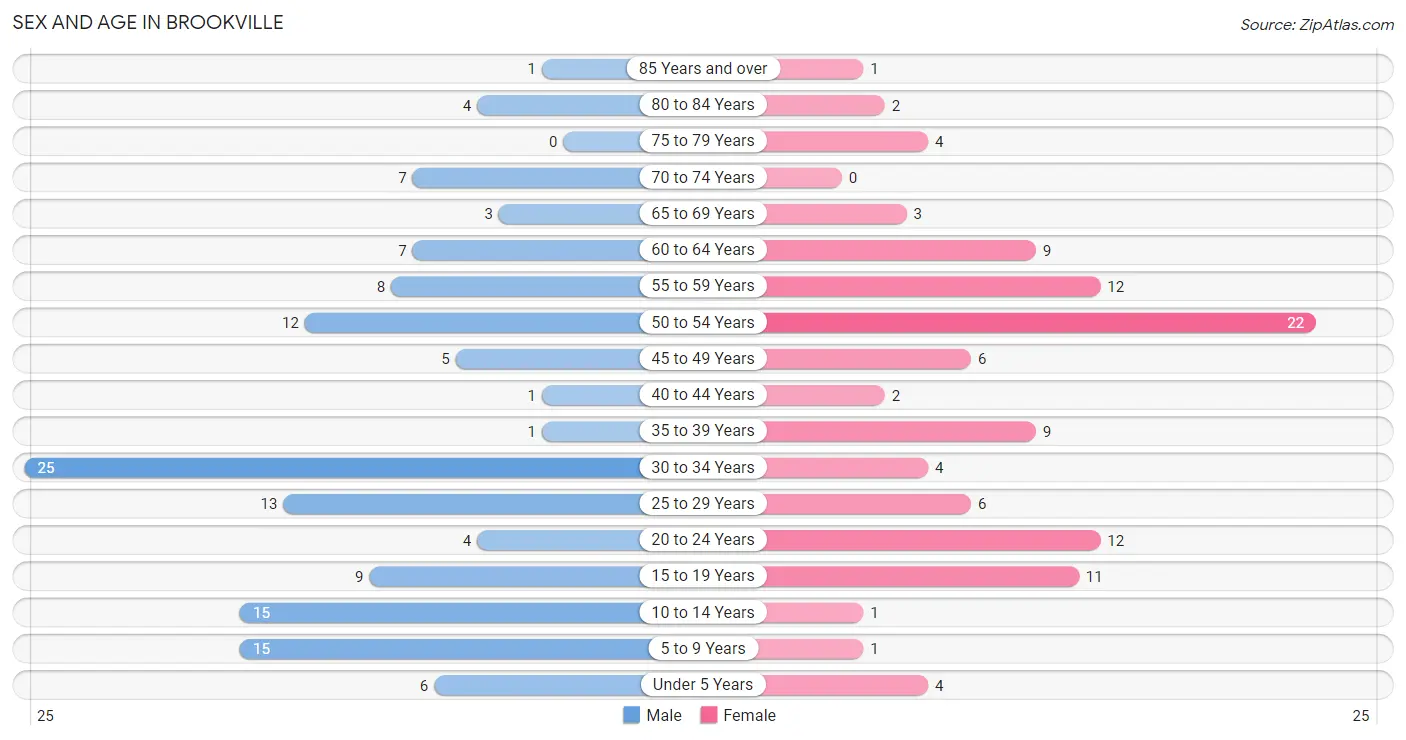
Sex and Age in Brookville
Sex and Age in Brookville
The most populous age groups in Brookville are 30 to 34 Years (25 | 18.4%) for men and 50 to 54 Years (22 | 20.2%) for women.
| Age Bracket | Male | Female |
| Under 5 Years | 6 (4.4%) | 4 (3.7%) |
| 5 to 9 Years | 15 (11.0%) | 1 (0.9%) |
| 10 to 14 Years | 15 (11.0%) | 1 (0.9%) |
| 15 to 19 Years | 9 (6.6%) | 11 (10.1%) |
| 20 to 24 Years | 4 (2.9%) | 12 (11.0%) |
| 25 to 29 Years | 13 (9.6%) | 6 (5.5%) |
| 30 to 34 Years | 25 (18.4%) | 4 (3.7%) |
| 35 to 39 Years | 1 (0.7%) | 9 (8.3%) |
| 40 to 44 Years | 1 (0.7%) | 2 (1.8%) |
| 45 to 49 Years | 5 (3.7%) | 6 (5.5%) |
| 50 to 54 Years | 12 (8.8%) | 22 (20.2%) |
| 55 to 59 Years | 8 (5.9%) | 12 (11.0%) |
| 60 to 64 Years | 7 (5.1%) | 9 (8.3%) |
| 65 to 69 Years | 3 (2.2%) | 3 (2.8%) |
| 70 to 74 Years | 7 (5.1%) | 0 (0.0%) |
| 75 to 79 Years | 0 (0.0%) | 4 (3.7%) |
| 80 to 84 Years | 4 (2.9%) | 2 (1.8%) |
| 85 Years and over | 1 (0.7%) | 1 (0.9%) |
| Total | 136 (100.0%) | 109 (100.0%) |
Families and Households in Brookville
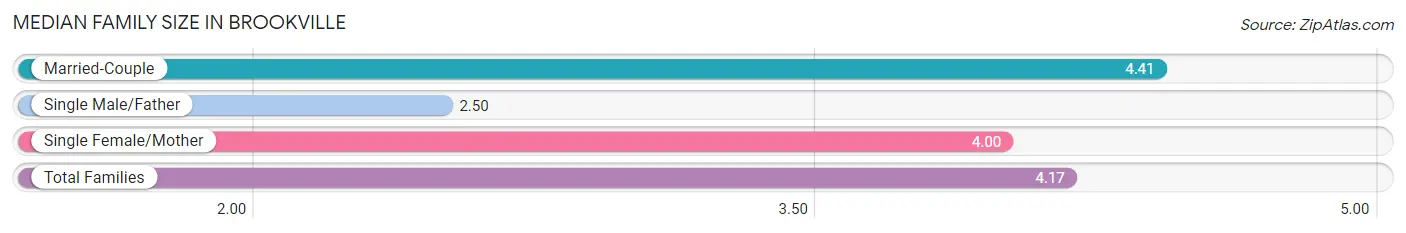
Median Family Size in Brookville
The median family size in Brookville is 4.17 persons per family, with married-couple families (34 | 70.8%) accounting for the largest median family size of 4.41 persons per family. On the other hand, single male/father families (4 | 8.3%) represent the smallest median family size with 2.50 persons per family.
| Family Type | # Families | Family Size |
| Married-Couple | 34 (70.8%) | 4.41 |
| Single Male/Father | 4 (8.3%) | 2.50 |
| Single Female/Mother | 10 (20.8%) | 4.00 |
| Total Families | 48 (100.0%) | 4.17 |
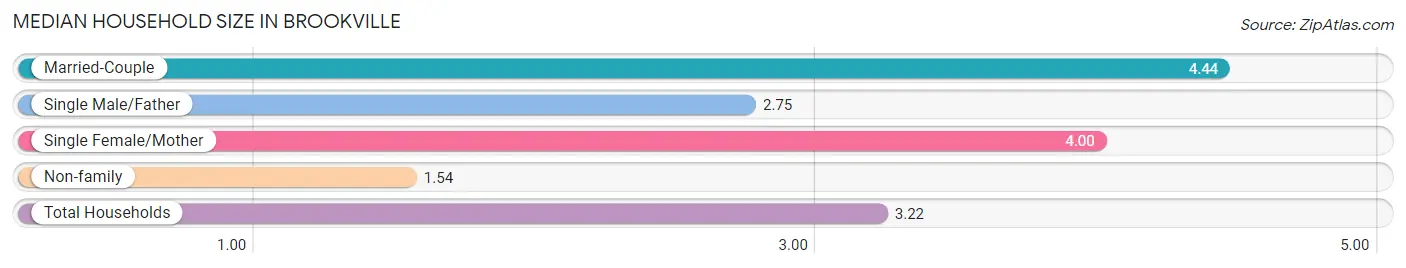
Median Household Size in Brookville
The median household size in Brookville is 3.22 persons per household, with married-couple households (34 | 44.7%) accounting for the largest median household size of 4.44 persons per household. non-family households (28 | 36.8%) represent the smallest median household size with 1.54 persons per household.
| Household Type | # Households | Household Size |
| Married-Couple | 34 (44.7%) | 4.44 |
| Single Male/Father | 4 (5.3%) | 2.75 |
| Single Female/Mother | 10 (13.2%) | 4.00 |
| Non-family | 28 (36.8%) | 1.54 |
| Total Households | 76 (100.0%) | 3.22 |
Household Size by Marriage Status in Brookville
Out of a total of 76 households in Brookville, 48 (63.2%) are family households, while 28 (36.8%) are nonfamily households. The most numerous type of family households are 2-person households, comprising 28, and the most common type of nonfamily households are 1-person households, comprising 19.
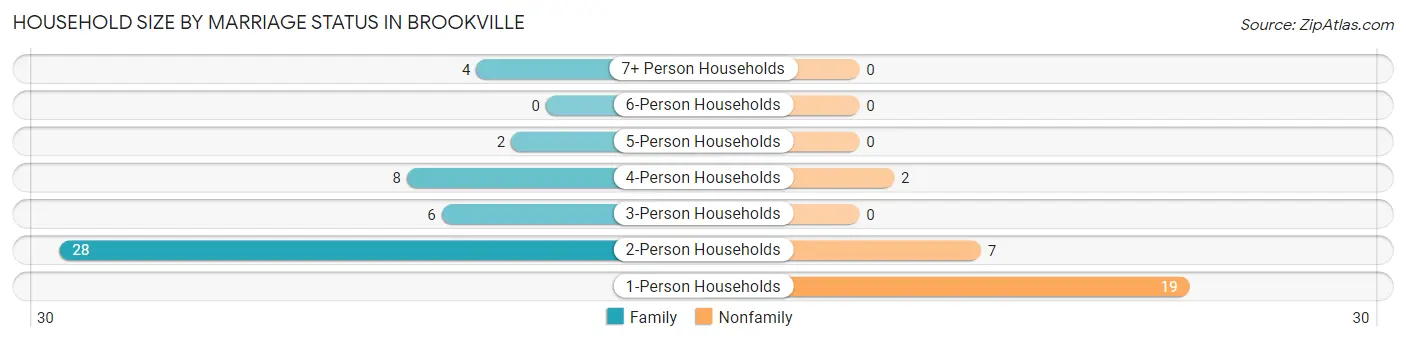
| Household Size | Family Households | Nonfamily Households |
| 1-Person Households | - | 19 (25.0%) |
| 2-Person Households | 28 (36.8%) | 7 (9.2%) |
| 3-Person Households | 6 (7.9%) | 0 (0.0%) |
| 4-Person Households | 8 (10.5%) | 2 (2.6%) |
| 5-Person Households | 2 (2.6%) | 0 (0.0%) |
| 6-Person Households | 0 (0.0%) | 0 (0.0%) |
| 7+ Person Households | 4 (5.3%) | 0 (0.0%) |
| Total | 48 (63.2%) | 28 (36.8%) |
Female Fertility in Brookville
Fertility by Age in Brookville
| Age Bracket | Women with Births | Births / 1,000 Women |
| 15 to 19 years | 0 (0.0%) | 0.0 |
| 20 to 34 years | 0 (0.0%) | 0.0 |
| 35 to 50 years | 0 (0.0%) | 0.0 |
| Total | 0 (0.0%) | 0.0 |
Fertility by Age by Marriage Status in Brookville
| Age Bracket | Married | Unmarried |
| 15 to 19 years | 0 (0.0%) | 0 (0.0%) |
| 20 to 34 years | 0 (0.0%) | 0 (0.0%) |
| 35 to 50 years | 0 (0.0%) | 0 (0.0%) |
| Total | 0 (0.0%) | 0 (0.0%) |
Fertility by Education in Brookville
| Educational Attainment | Women with Births | Births / 1,000 Women |
| Less than High School | 0 (0.0%) | 0.0 |
| High School Diploma | 0 (0.0%) | 0.0 |
| College or Associate's Degree | 0 (0.0%) | 0.0 |
| Bachelor's Degree | 0 (0.0%) | 0.0 |
| Graduate Degree | 0 (0.0%) | 0.0 |
| Total | 0 (0.0%) | 0.0 |
Fertility by Education by Marriage Status in Brookville
| Educational Attainment | Married | Unmarried |
| Less than High School | 0 (0.0%) | 0 (0.0%) |
| High School Diploma | 0 (0.0%) | 0 (0.0%) |
| College or Associate's Degree | 0 (0.0%) | 0 (0.0%) |
| Bachelor's Degree | 0 (0.0%) | 0 (0.0%) |
| Graduate Degree | 0 (0.0%) | 0 (0.0%) |
| Total | 0 (0.0%) | 0 (0.0%) |
Employment Characteristics in Brookville
Employment by Class of Employer in Brookville
Among the 143 employed individuals in Brookville, private company employees (113 | 79.0%), local government employees (14 | 9.8%), and self-employed (not incorporated) (7 | 4.9%) make up the most common classes of employment.
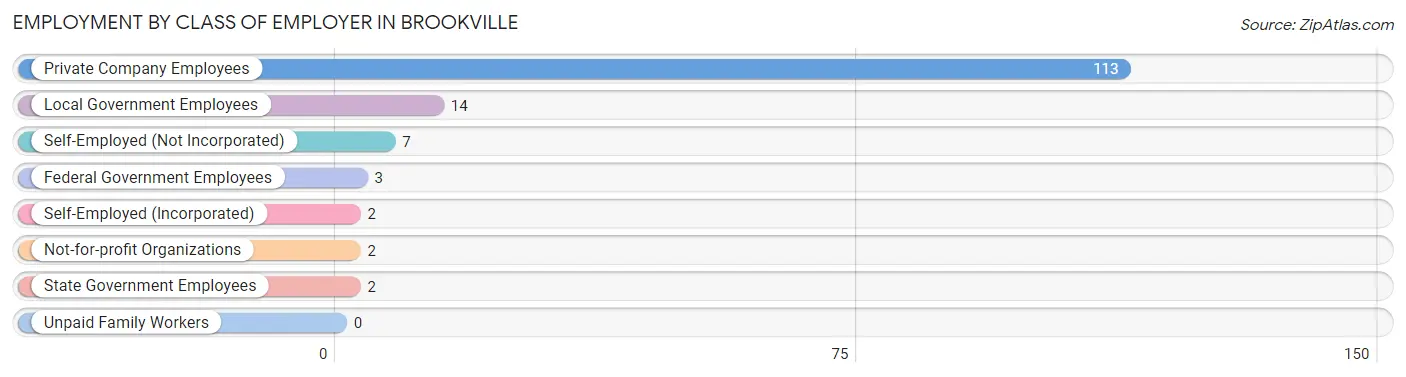
| Employer Class | # Employees | % Employees |
| Private Company Employees | 113 | 79.0% |
| Self-Employed (Incorporated) | 2 | 1.4% |
| Self-Employed (Not Incorporated) | 7 | 4.9% |
| Not-for-profit Organizations | 2 | 1.4% |
| Local Government Employees | 14 | 9.8% |
| State Government Employees | 2 | 1.4% |
| Federal Government Employees | 3 | 2.1% |
| Unpaid Family Workers | 0 | 0.0% |
| Total | 143 | 100.0% |
Employment Status by Age in Brookville
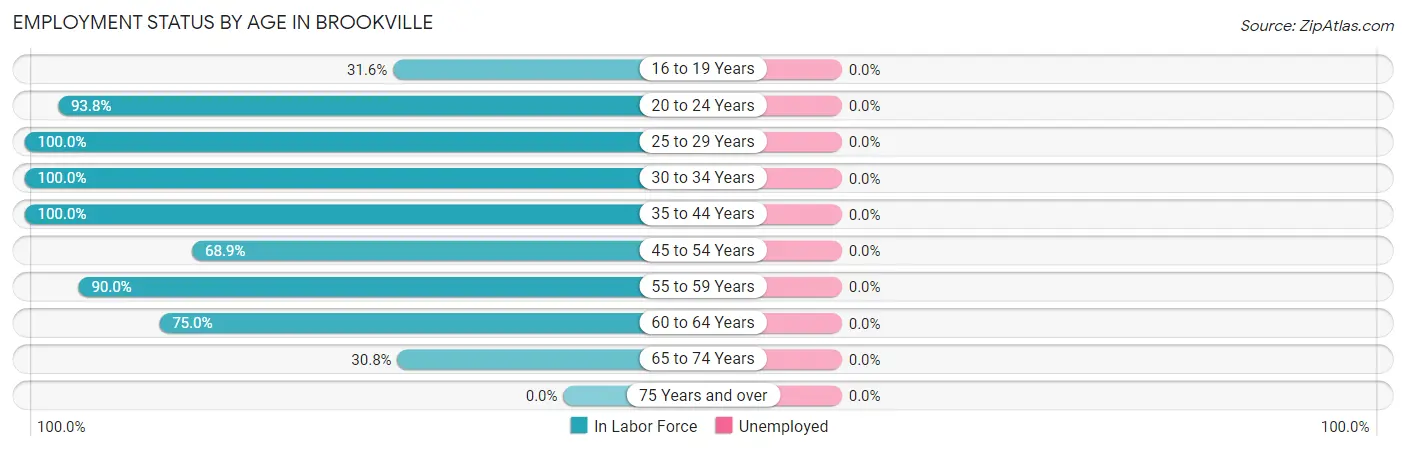
| Age Bracket | In Labor Force | Unemployed |
| 16 to 19 Years | 6 (31.6%) | 0 (0.0%) |
| 20 to 24 Years | 15 (93.8%) | 0 (0.0%) |
| 25 to 29 Years | 19 (100.0%) | 0 (0.0%) |
| 30 to 34 Years | 29 (100.0%) | 0 (0.0%) |
| 35 to 44 Years | 13 (100.0%) | 0 (0.0%) |
| 45 to 54 Years | 31 (68.9%) | 0 (0.0%) |
| 55 to 59 Years | 18 (90.0%) | 0 (0.0%) |
| 60 to 64 Years | 12 (75.0%) | 0 (0.0%) |
| 65 to 74 Years | 4 (30.8%) | 0 (0.0%) |
| 75 Years and over | 0 (0.0%) | 0 (0.0%) |
| Total | 147 (72.8%) | 0 (0.0%) |
Employment Status by Educational Attainment in Brookville
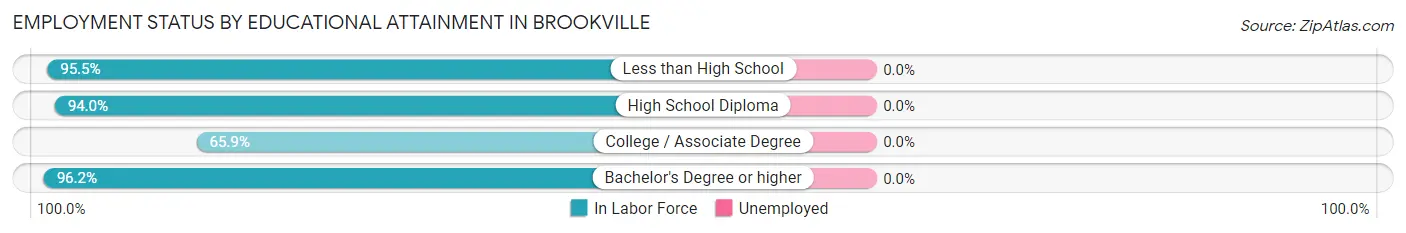
| Educational Attainment | In Labor Force | Unemployed |
| Less than High School | 21 (95.5%) | 0 (0.0%) |
| High School Diploma | 47 (94.0%) | 0 (0.0%) |
| College / Associate Degree | 29 (65.9%) | 0 (0.0%) |
| Bachelor's Degree or higher | 25 (96.2%) | 0 (0.0%) |
| Total | 122 (85.9%) | 0 (0.0%) |
Employment Occupations by Sex in Brookville
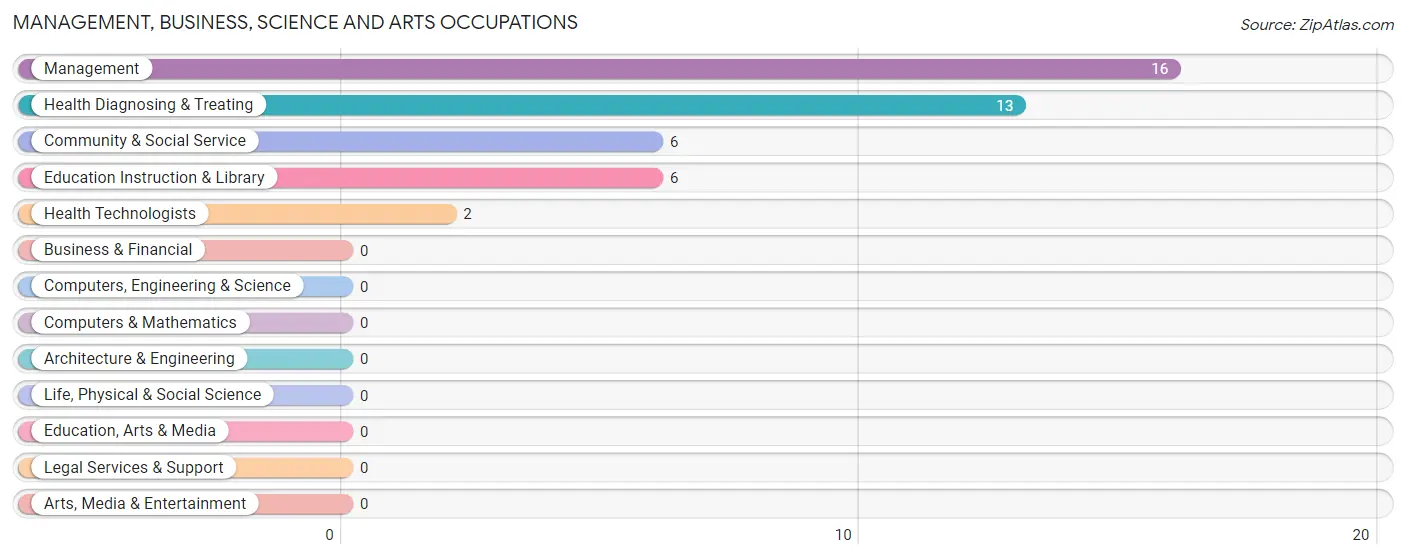
Management, Business, Science and Arts Occupations
The most common Management, Business, Science and Arts occupations in Brookville are Management (16 | 11.0%), Health Diagnosing & Treating (13 | 8.9%), Community & Social Service (6 | 4.1%), Education Instruction & Library (6 | 4.1%), and Health Technologists (2 | 1.4%).
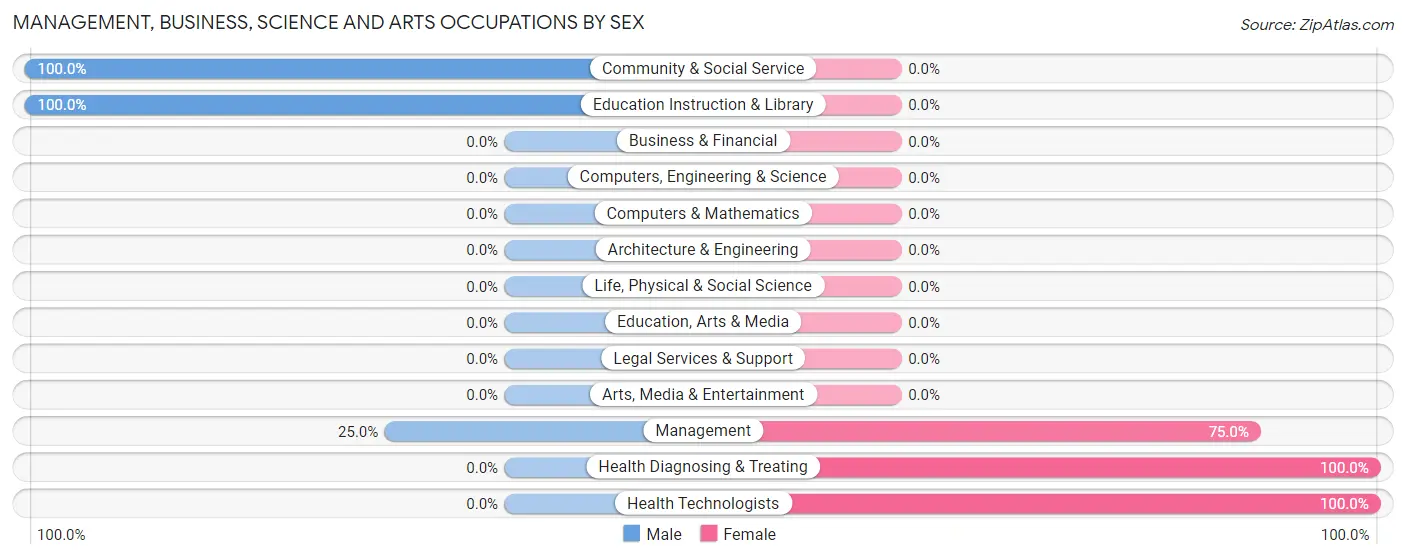
Management, Business, Science and Arts Occupations by Sex
Within the Management, Business, Science and Arts occupations in Brookville, the most male-oriented occupations are Community & Social Service (100.0%), Education Instruction & Library (100.0%), and Management (25.0%), while the most female-oriented occupations are Health Diagnosing & Treating (100.0%), Health Technologists (100.0%), and Management (75.0%).
| Occupation | Male | Female |
| Management | 4 (25.0%) | 12 (75.0%) |
| Business & Financial | 0 (0.0%) | 0 (0.0%) |
| Computers, Engineering & Science | 0 (0.0%) | 0 (0.0%) |
| Computers & Mathematics | 0 (0.0%) | 0 (0.0%) |
| Architecture & Engineering | 0 (0.0%) | 0 (0.0%) |
| Life, Physical & Social Science | 0 (0.0%) | 0 (0.0%) |
| Community & Social Service | 6 (100.0%) | 0 (0.0%) |
| Education, Arts & Media | 0 (0.0%) | 0 (0.0%) |
| Legal Services & Support | 0 (0.0%) | 0 (0.0%) |
| Education Instruction & Library | 6 (100.0%) | 0 (0.0%) |
| Arts, Media & Entertainment | 0 (0.0%) | 0 (0.0%) |
| Health Diagnosing & Treating | 0 (0.0%) | 13 (100.0%) |
| Health Technologists | 0 (0.0%) | 2 (100.0%) |
| Total (Category) | 10 (28.6%) | 25 (71.4%) |
| Total (Overall) | 82 (56.2%) | 64 (43.8%) |
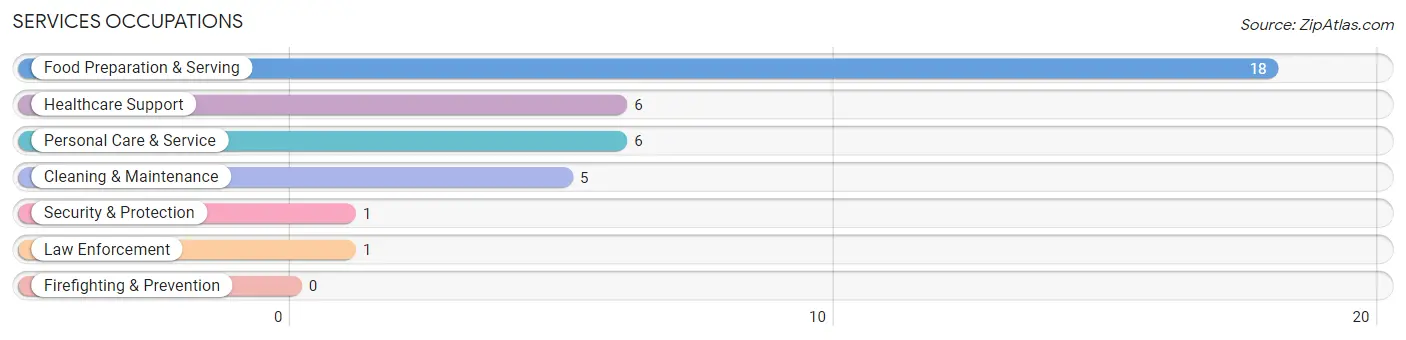
Services Occupations
The most common Services occupations in Brookville are Food Preparation & Serving (18 | 12.3%), Healthcare Support (6 | 4.1%), Personal Care & Service (6 | 4.1%), Cleaning & Maintenance (5 | 3.4%), and Security & Protection (1 | 0.7%).
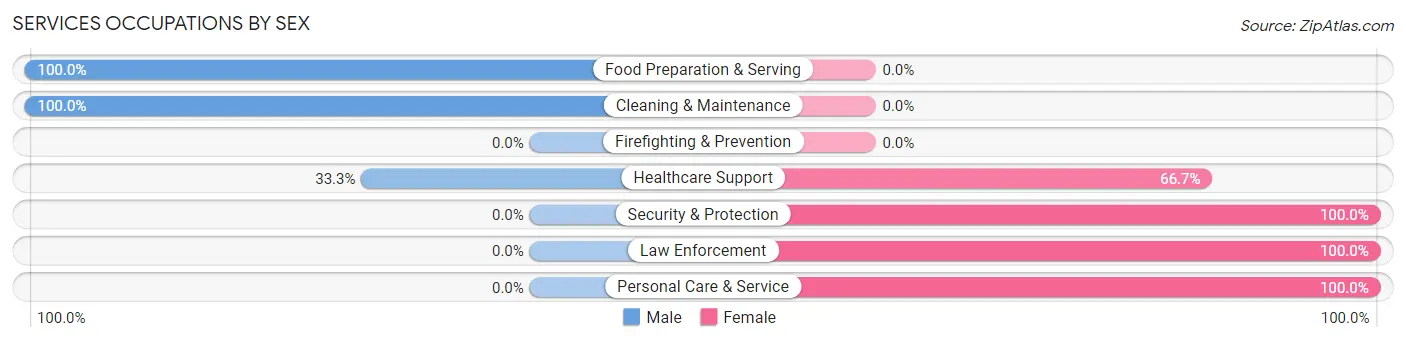
Services Occupations by Sex
Within the Services occupations in Brookville, the most male-oriented occupations are Food Preparation & Serving (100.0%), Cleaning & Maintenance (100.0%), and Healthcare Support (33.3%), while the most female-oriented occupations are Security & Protection (100.0%), Law Enforcement (100.0%), and Personal Care & Service (100.0%).
| Occupation | Male | Female |
| Healthcare Support | 2 (33.3%) | 4 (66.7%) |
| Security & Protection | 0 (0.0%) | 1 (100.0%) |
| Firefighting & Prevention | 0 (0.0%) | 0 (0.0%) |
| Law Enforcement | 0 (0.0%) | 1 (100.0%) |
| Food Preparation & Serving | 18 (100.0%) | 0 (0.0%) |
| Cleaning & Maintenance | 5 (100.0%) | 0 (0.0%) |
| Personal Care & Service | 0 (0.0%) | 6 (100.0%) |
| Total (Category) | 25 (69.4%) | 11 (30.6%) |
| Total (Overall) | 82 (56.2%) | 64 (43.8%) |
Sales and Office Occupations
The most common Sales and Office occupations in Brookville are Office & Administration (15 | 10.3%), and Sales & Related (13 | 8.9%).
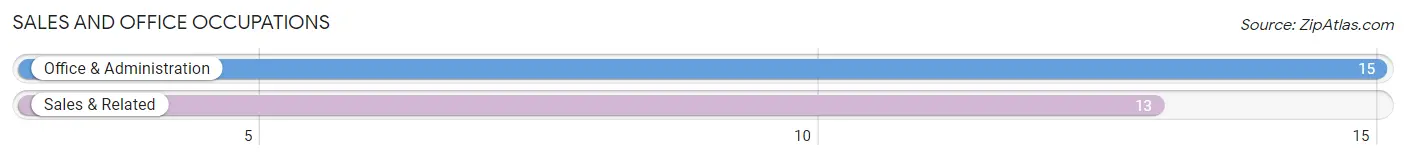
Sales and Office Occupations by Sex
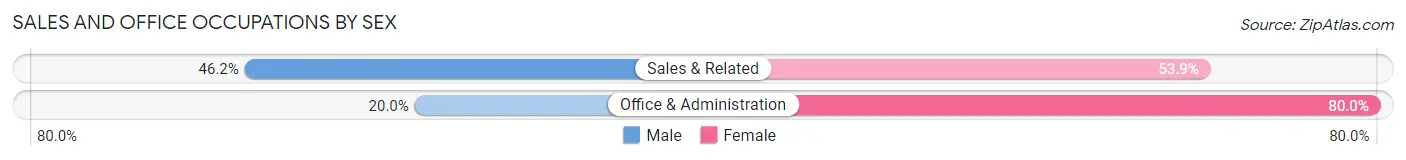
| Occupation | Male | Female |
| Sales & Related | 6 (46.2%) | 7 (53.8%) |
| Office & Administration | 3 (20.0%) | 12 (80.0%) |
| Total (Category) | 9 (32.1%) | 19 (67.9%) |
| Total (Overall) | 82 (56.2%) | 64 (43.8%) |
Natural Resources, Construction and Maintenance Occupations
The most common Natural Resources, Construction and Maintenance occupations in Brookville are Installation, Maintenance & Repair (23 | 15.8%), and Construction & Extraction (7 | 4.8%).
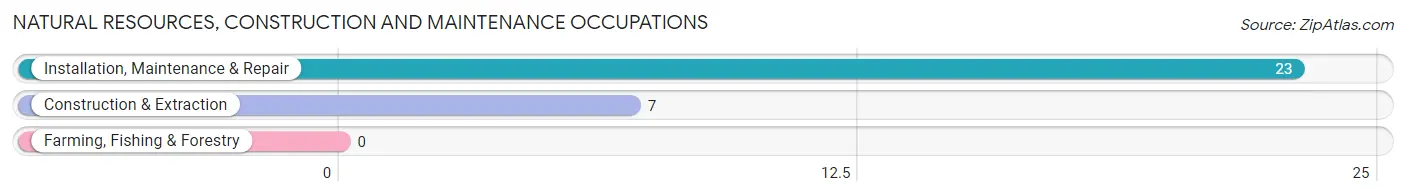
Natural Resources, Construction and Maintenance Occupations by Sex
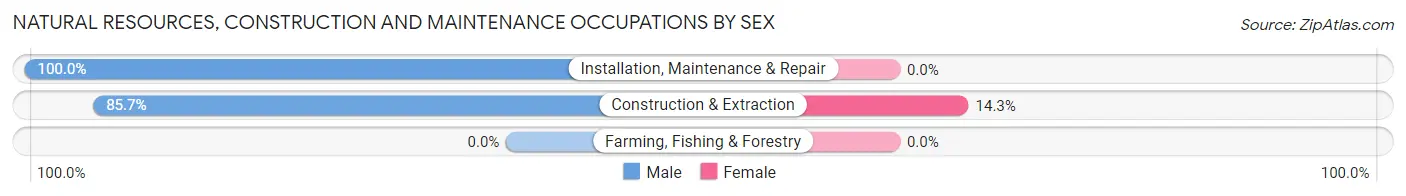
| Occupation | Male | Female |
| Farming, Fishing & Forestry | 0 (0.0%) | 0 (0.0%) |
| Construction & Extraction | 6 (85.7%) | 1 (14.3%) |
| Installation, Maintenance & Repair | 23 (100.0%) | 0 (0.0%) |
| Total (Category) | 29 (96.7%) | 1 (3.3%) |
| Total (Overall) | 82 (56.2%) | 64 (43.8%) |
Production, Transportation and Moving Occupations
The most common Production, Transportation and Moving occupations in Brookville are Production (9 | 6.2%), Transportation (5 | 3.4%), and Material Moving (3 | 2.1%).
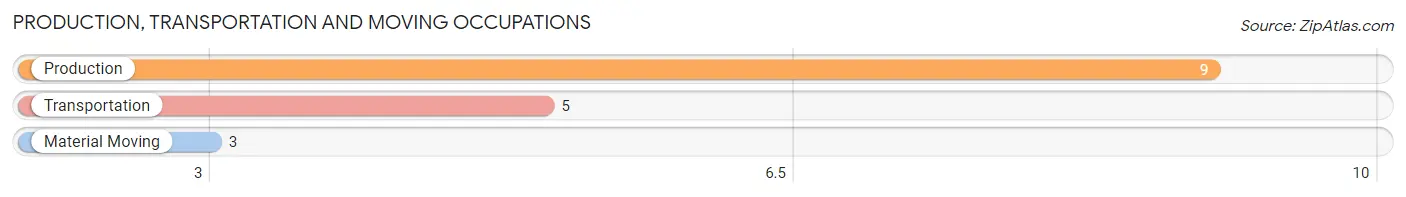
Production, Transportation and Moving Occupations by Sex
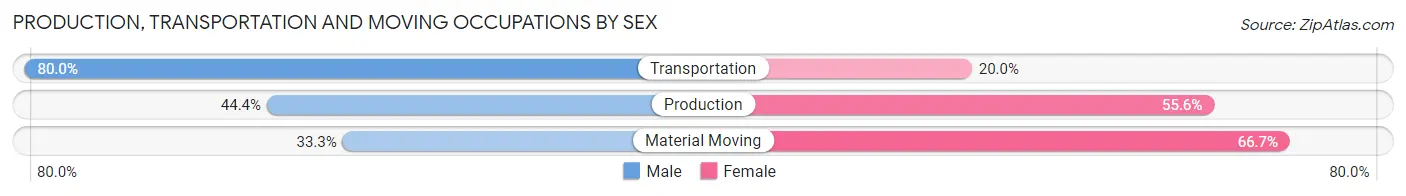
| Occupation | Male | Female |
| Production | 4 (44.4%) | 5 (55.6%) |
| Transportation | 4 (80.0%) | 1 (20.0%) |
| Material Moving | 1 (33.3%) | 2 (66.7%) |
| Total (Category) | 9 (52.9%) | 8 (47.1%) |
| Total (Overall) | 82 (56.2%) | 64 (43.8%) |
Employment Industries by Sex in Brookville
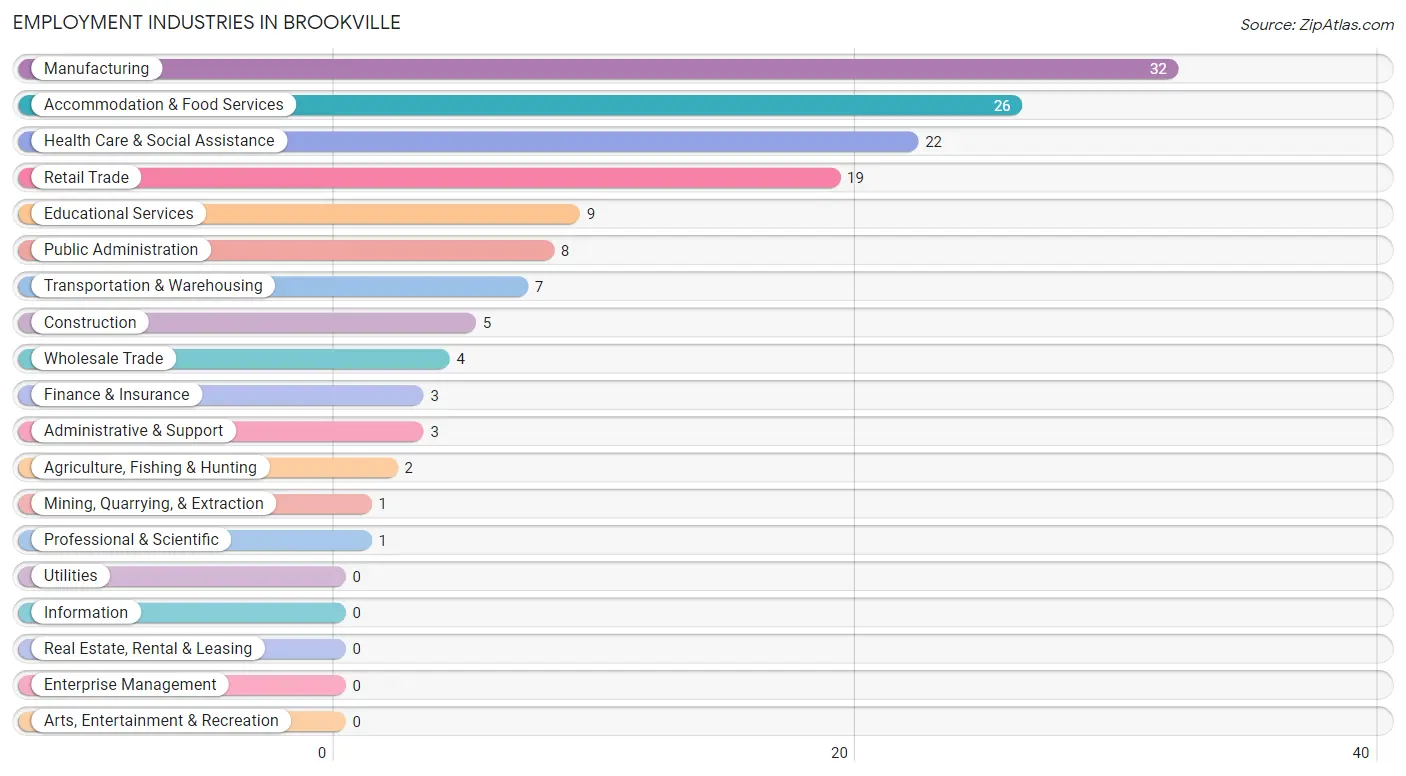
Employment Industries in Brookville
The major employment industries in Brookville include Manufacturing (32 | 21.9%), Accommodation & Food Services (26 | 17.8%), Health Care & Social Assistance (22 | 15.1%), Retail Trade (19 | 13.0%), and Educational Services (9 | 6.2%).
Employment Industries by Sex in Brookville
The Brookville industries that see more men than women are Agriculture, Fishing & Hunting (100.0%), Mining, Quarrying, & Extraction (100.0%), and Construction (100.0%), whereas the industries that tend to have a higher number of women are Finance & Insurance (100.0%), Professional & Scientific (100.0%), and Health Care & Social Assistance (90.9%).
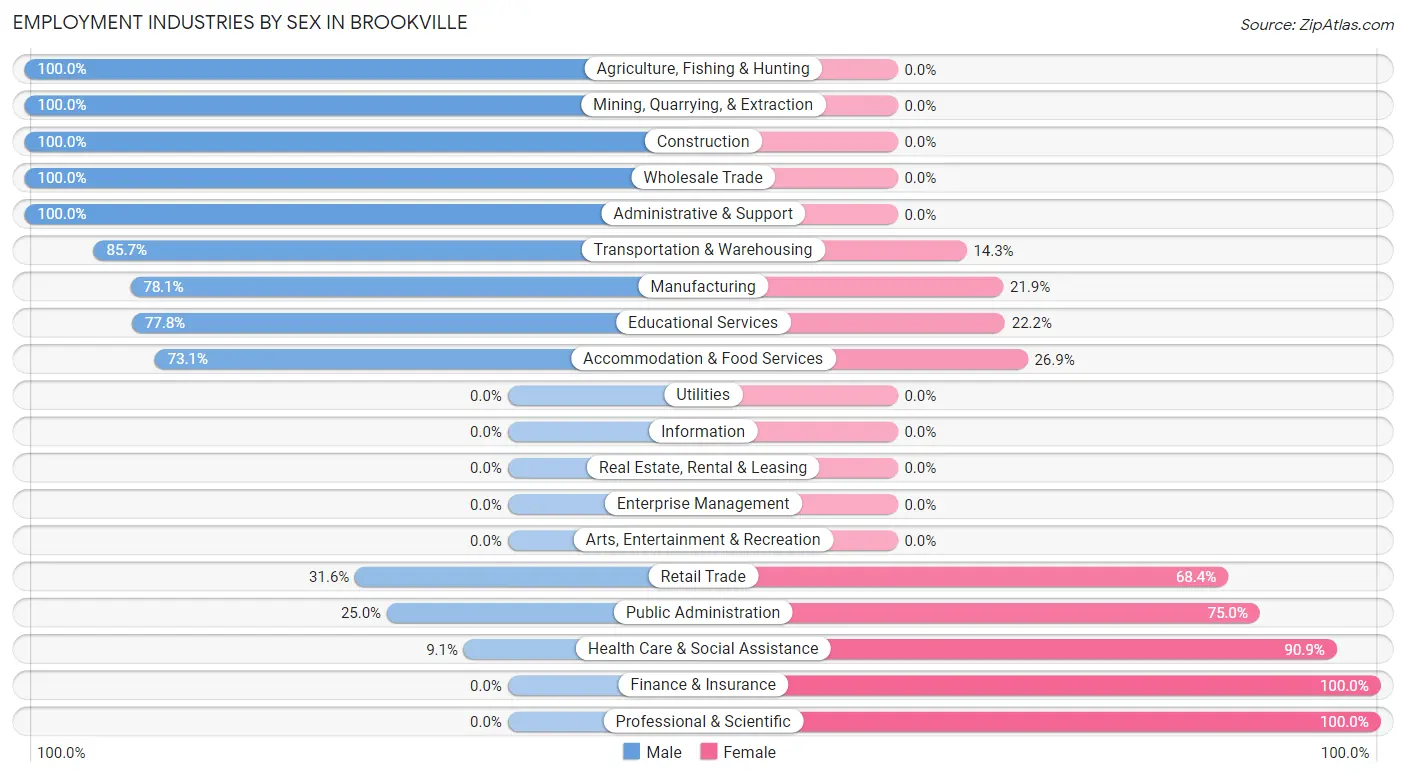
| Industry | Male | Female |
| Agriculture, Fishing & Hunting | 2 (100.0%) | 0 (0.0%) |
| Mining, Quarrying, & Extraction | 1 (100.0%) | 0 (0.0%) |
| Construction | 5 (100.0%) | 0 (0.0%) |
| Manufacturing | 25 (78.1%) | 7 (21.9%) |
| Wholesale Trade | 4 (100.0%) | 0 (0.0%) |
| Retail Trade | 6 (31.6%) | 13 (68.4%) |
| Transportation & Warehousing | 6 (85.7%) | 1 (14.3%) |
| Utilities | 0 (0.0%) | 0 (0.0%) |
| Information | 0 (0.0%) | 0 (0.0%) |
| Finance & Insurance | 0 (0.0%) | 3 (100.0%) |
| Real Estate, Rental & Leasing | 0 (0.0%) | 0 (0.0%) |
| Professional & Scientific | 0 (0.0%) | 1 (100.0%) |
| Enterprise Management | 0 (0.0%) | 0 (0.0%) |
| Administrative & Support | 3 (100.0%) | 0 (0.0%) |
| Educational Services | 7 (77.8%) | 2 (22.2%) |
| Health Care & Social Assistance | 2 (9.1%) | 20 (90.9%) |
| Arts, Entertainment & Recreation | 0 (0.0%) | 0 (0.0%) |
| Accommodation & Food Services | 19 (73.1%) | 7 (26.9%) |
| Public Administration | 2 (25.0%) | 6 (75.0%) |
| Total | 82 (56.2%) | 64 (43.8%) |
Education in Brookville
School Enrollment in Brookville
The most common levels of schooling among the 59 students in Brookville are high school (19 | 32.2%), middle school (14 | 23.7%), and elementary school (12 | 20.3%).
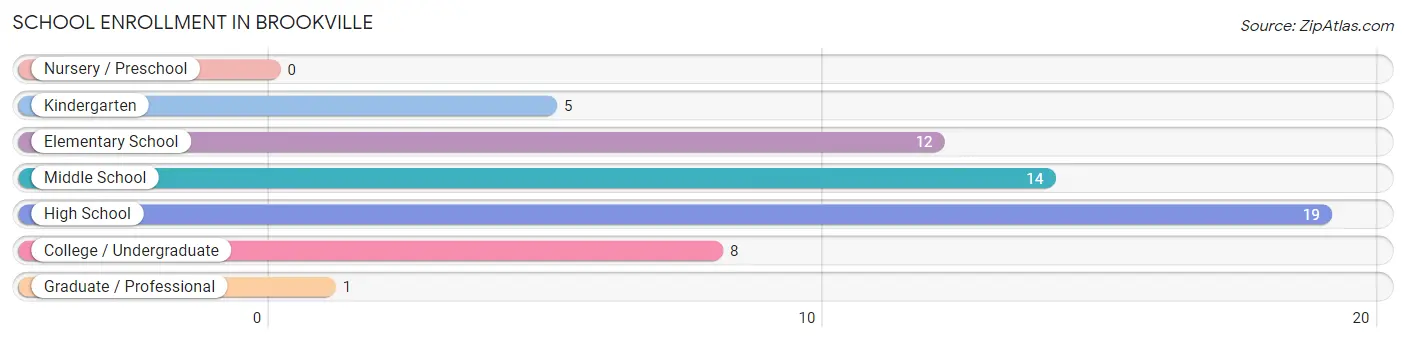
| School Level | # Students | % Students |
| Nursery / Preschool | 0 | 0.0% |
| Kindergarten | 5 | 8.5% |
| Elementary School | 12 | 20.3% |
| Middle School | 14 | 23.7% |
| High School | 19 | 32.2% |
| College / Undergraduate | 8 | 13.6% |
| Graduate / Professional | 1 | 1.7% |
| Total | 59 | 100.0% |
School Enrollment by Age by Funding Source in Brookville
Out of a total of 59 students who are enrolled in schools in Brookville, 12 (20.3%) attend a private institution, while the remaining 47 (79.7%) are enrolled in public schools. The age group of 25 to 34 year olds has the highest likelihood of being enrolled in private schools, with 2 (100.0% in the age bracket) enrolled. Conversely, the age group of 15 to 17 year olds has the lowest likelihood of being enrolled in a private school, with 15 (100.0% in the age bracket) attending a public institution.
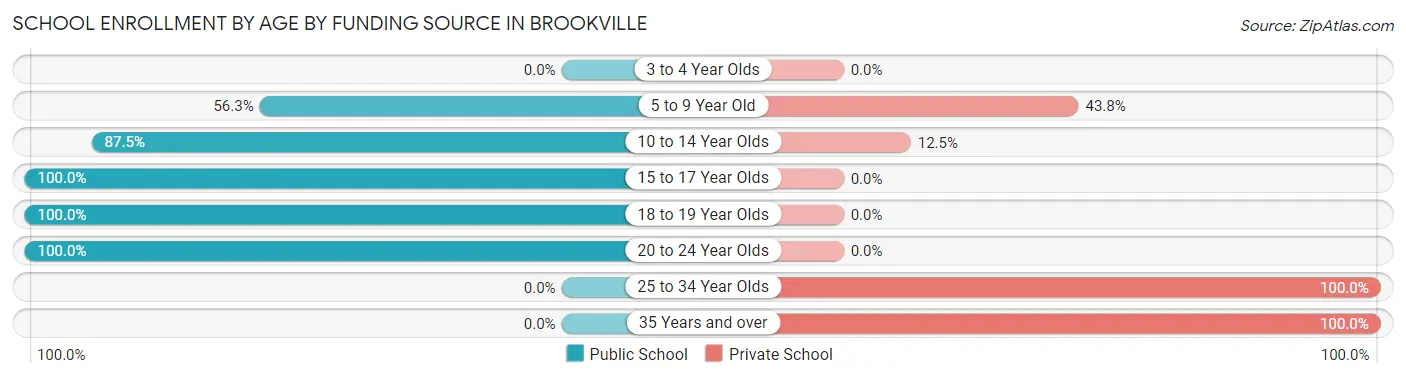
| Age Bracket | Public School | Private School |
| 3 to 4 Year Olds | 0 (0.0%) | 0 (0.0%) |
| 5 to 9 Year Old | 9 (56.2%) | 7 (43.8%) |
| 10 to 14 Year Olds | 14 (87.5%) | 2 (12.5%) |
| 15 to 17 Year Olds | 15 (100.0%) | 0 (0.0%) |
| 18 to 19 Year Olds | 5 (100.0%) | 0 (0.0%) |
| 20 to 24 Year Olds | 4 (100.0%) | 0 (0.0%) |
| 25 to 34 Year Olds | 0 (0.0%) | 2 (100.0%) |
| 35 Years and over | 0 (0.0%) | 1 (100.0%) |
| Total | 47 (79.7%) | 12 (20.3%) |
Educational Attainment by Field of Study in Brookville
Science & technology (10 | 35.7%), education (9 | 32.1%), computers & mathematics (4 | 14.3%), arts & humanities (3 | 10.7%), and bio, nature & agricultural (2 | 7.1%) are the most common fields of study among 28 individuals in Brookville who have obtained a bachelor's degree or higher.
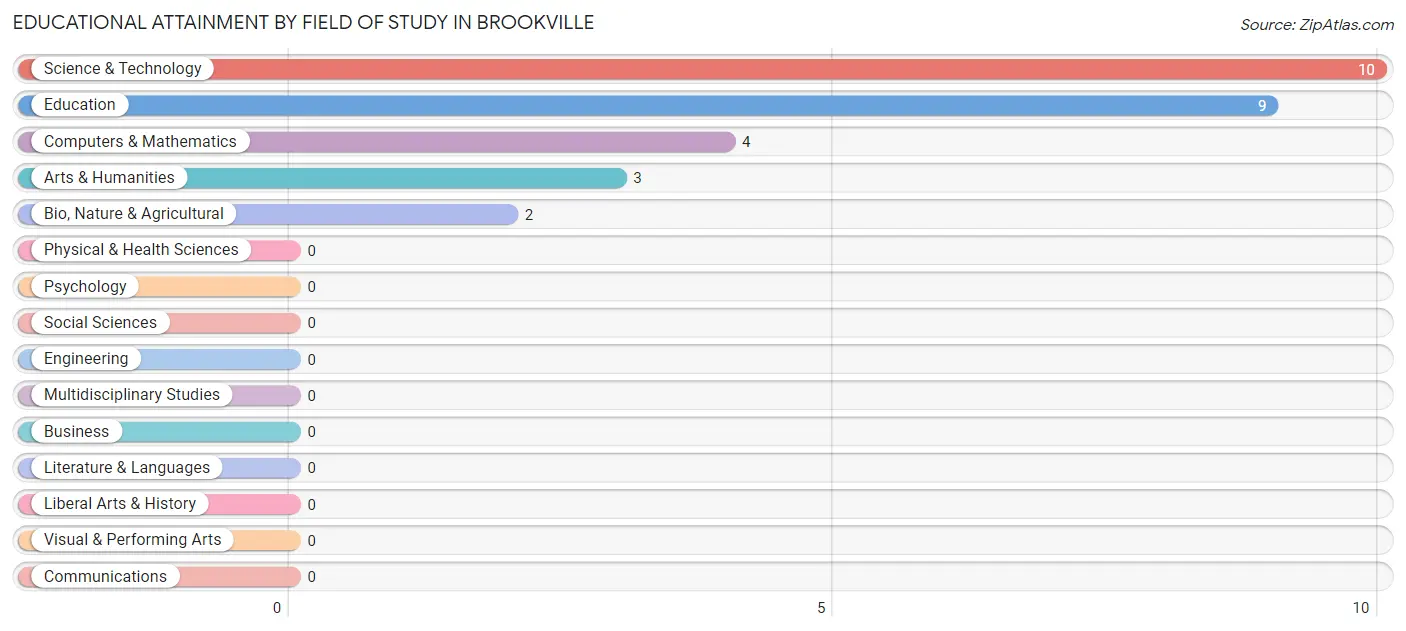
| Field of Study | # Graduates | % Graduates |
| Computers & Mathematics | 4 | 14.3% |
| Bio, Nature & Agricultural | 2 | 7.1% |
| Physical & Health Sciences | 0 | 0.0% |
| Psychology | 0 | 0.0% |
| Social Sciences | 0 | 0.0% |
| Engineering | 0 | 0.0% |
| Multidisciplinary Studies | 0 | 0.0% |
| Science & Technology | 10 | 35.7% |
| Business | 0 | 0.0% |
| Education | 9 | 32.1% |
| Literature & Languages | 0 | 0.0% |
| Liberal Arts & History | 0 | 0.0% |
| Visual & Performing Arts | 0 | 0.0% |
| Communications | 0 | 0.0% |
| Arts & Humanities | 3 | 10.7% |
| Total | 28 | 100.0% |
Transportation & Commute in Brookville
Vehicle Availability by Sex in Brookville
The most prevalent vehicle ownership categories in Brookville are males with 2 vehicles (36, accounting for 45.6%) and females with 2 vehicles (20, making up 56.2%).
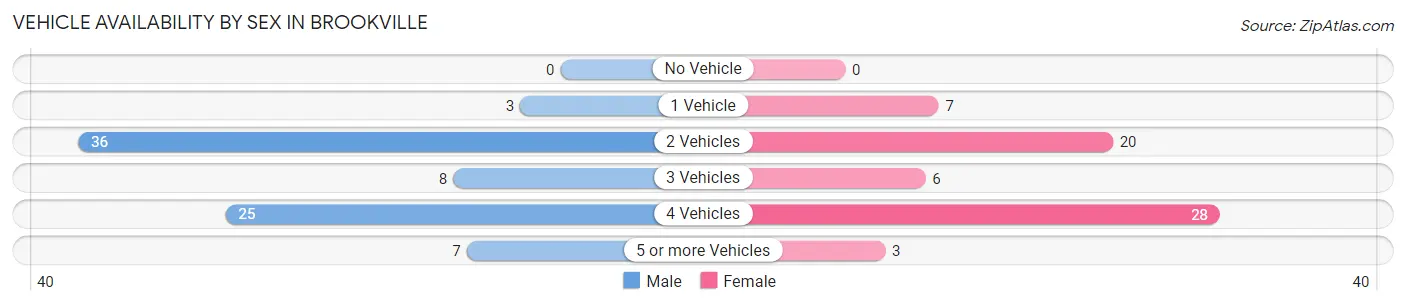
| Vehicles Available | Male | Female |
| No Vehicle | 0 (0.0%) | 0 (0.0%) |
| 1 Vehicle | 3 (3.8%) | 7 (10.9%) |
| 2 Vehicles | 36 (45.6%) | 20 (31.2%) |
| 3 Vehicles | 8 (10.1%) | 6 (9.4%) |
| 4 Vehicles | 25 (31.7%) | 28 (43.8%) |
| 5 or more Vehicles | 7 (8.9%) | 3 (4.7%) |
| Total | 79 (100.0%) | 64 (100.0%) |
Commute Time in Brookville
The most frequently occuring commute durations in Brookville are 20 to 24 minutes (62 commuters, 44.3%), 25 to 29 minutes (25 commuters, 17.9%), and 30 to 34 minutes (11 commuters, 7.9%).
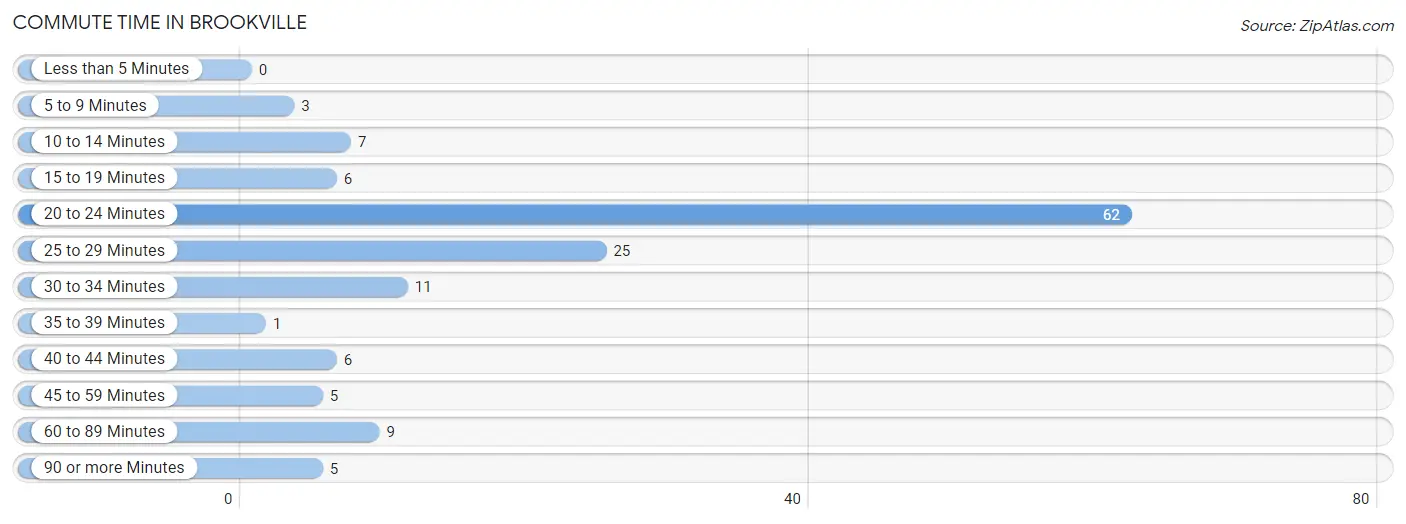
| Commute Time | # Commuters | % Commuters |
| Less than 5 Minutes | 0 | 0.0% |
| 5 to 9 Minutes | 3 | 2.1% |
| 10 to 14 Minutes | 7 | 5.0% |
| 15 to 19 Minutes | 6 | 4.3% |
| 20 to 24 Minutes | 62 | 44.3% |
| 25 to 29 Minutes | 25 | 17.9% |
| 30 to 34 Minutes | 11 | 7.9% |
| 35 to 39 Minutes | 1 | 0.7% |
| 40 to 44 Minutes | 6 | 4.3% |
| 45 to 59 Minutes | 5 | 3.6% |
| 60 to 89 Minutes | 9 | 6.4% |
| 90 or more Minutes | 5 | 3.6% |
Commute Time by Sex in Brookville
The most common commute times in Brookville are 20 to 24 minutes (42 commuters, 53.8%) for males and 20 to 24 minutes (20 commuters, 32.3%) for females.
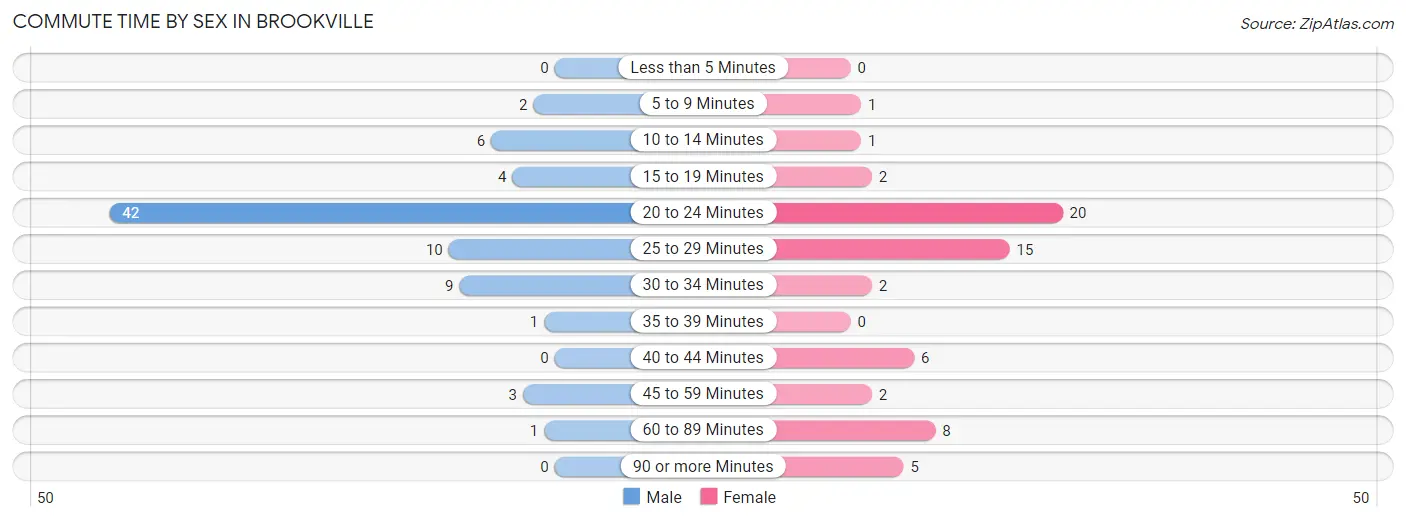
| Commute Time | Male | Female |
| Less than 5 Minutes | 0 (0.0%) | 0 (0.0%) |
| 5 to 9 Minutes | 2 (2.6%) | 1 (1.6%) |
| 10 to 14 Minutes | 6 (7.7%) | 1 (1.6%) |
| 15 to 19 Minutes | 4 (5.1%) | 2 (3.2%) |
| 20 to 24 Minutes | 42 (53.8%) | 20 (32.3%) |
| 25 to 29 Minutes | 10 (12.8%) | 15 (24.2%) |
| 30 to 34 Minutes | 9 (11.5%) | 2 (3.2%) |
| 35 to 39 Minutes | 1 (1.3%) | 0 (0.0%) |
| 40 to 44 Minutes | 0 (0.0%) | 6 (9.7%) |
| 45 to 59 Minutes | 3 (3.8%) | 2 (3.2%) |
| 60 to 89 Minutes | 1 (1.3%) | 8 (12.9%) |
| 90 or more Minutes | 0 (0.0%) | 5 (8.1%) |
Time of Departure to Work by Sex in Brookville
The most frequent times of departure to work in Brookville are 5:00 AM to 5:29 AM (21, 26.9%) for males and 12:00 PM to 3:59 PM (12, 19.4%) for females.
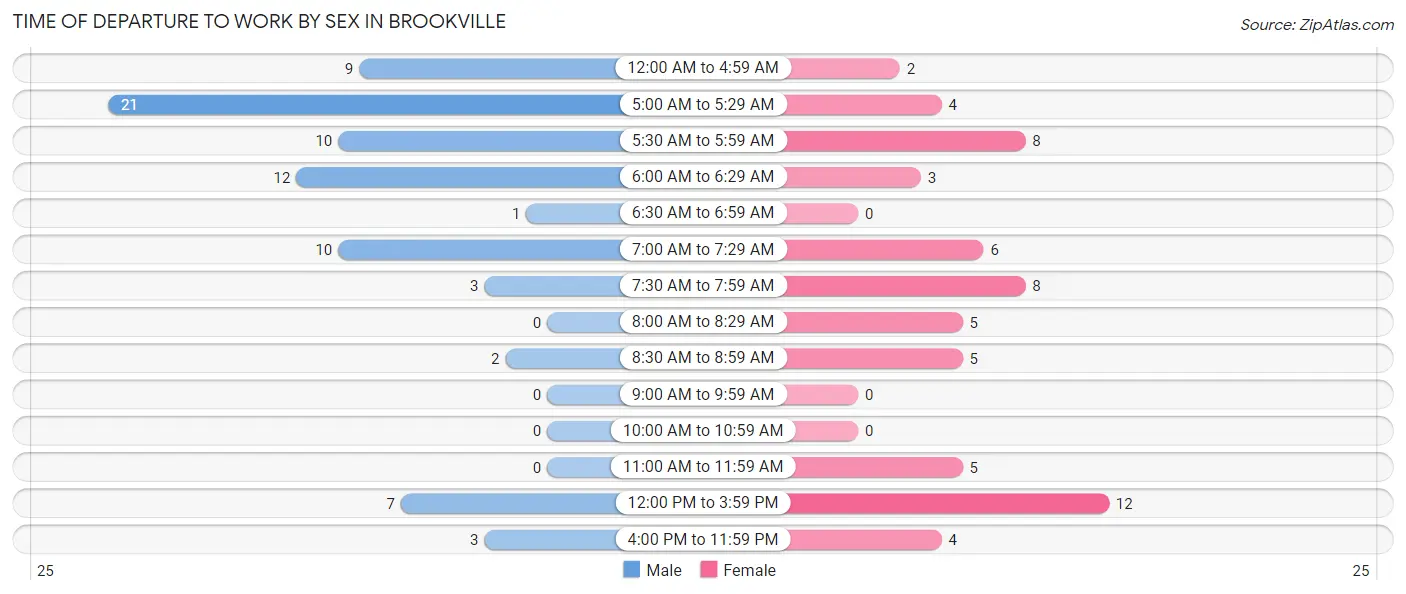
| Time of Departure | Male | Female |
| 12:00 AM to 4:59 AM | 9 (11.5%) | 2 (3.2%) |
| 5:00 AM to 5:29 AM | 21 (26.9%) | 4 (6.5%) |
| 5:30 AM to 5:59 AM | 10 (12.8%) | 8 (12.9%) |
| 6:00 AM to 6:29 AM | 12 (15.4%) | 3 (4.8%) |
| 6:30 AM to 6:59 AM | 1 (1.3%) | 0 (0.0%) |
| 7:00 AM to 7:29 AM | 10 (12.8%) | 6 (9.7%) |
| 7:30 AM to 7:59 AM | 3 (3.8%) | 8 (12.9%) |
| 8:00 AM to 8:29 AM | 0 (0.0%) | 5 (8.1%) |
| 8:30 AM to 8:59 AM | 2 (2.6%) | 5 (8.1%) |
| 9:00 AM to 9:59 AM | 0 (0.0%) | 0 (0.0%) |
| 10:00 AM to 10:59 AM | 0 (0.0%) | 0 (0.0%) |
| 11:00 AM to 11:59 AM | 0 (0.0%) | 5 (8.1%) |
| 12:00 PM to 3:59 PM | 7 (9.0%) | 12 (19.4%) |
| 4:00 PM to 11:59 PM | 3 (3.8%) | 4 (6.5%) |
| Total | 78 (100.0%) | 62 (100.0%) |
Housing Occupancy in Brookville
Occupancy by Ownership in Brookville
Of the total 76 dwellings in Brookville, owner-occupied units account for 67 (88.2%), while renter-occupied units make up 9 (11.8%).
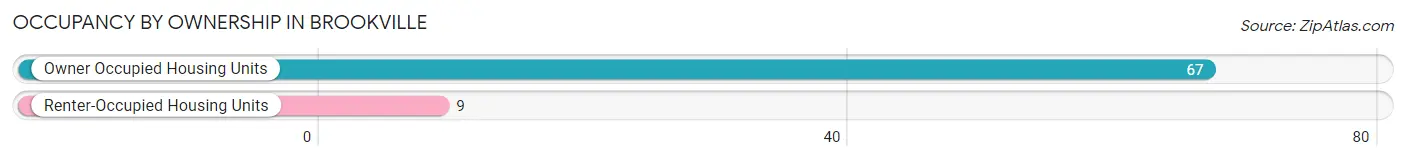
| Occupancy | # Housing Units | % Housing Units |
| Owner Occupied Housing Units | 67 | 88.2% |
| Renter-Occupied Housing Units | 9 | 11.8% |
| Total Occupied Housing Units | 76 | 100.0% |
Occupancy by Household Size in Brookville
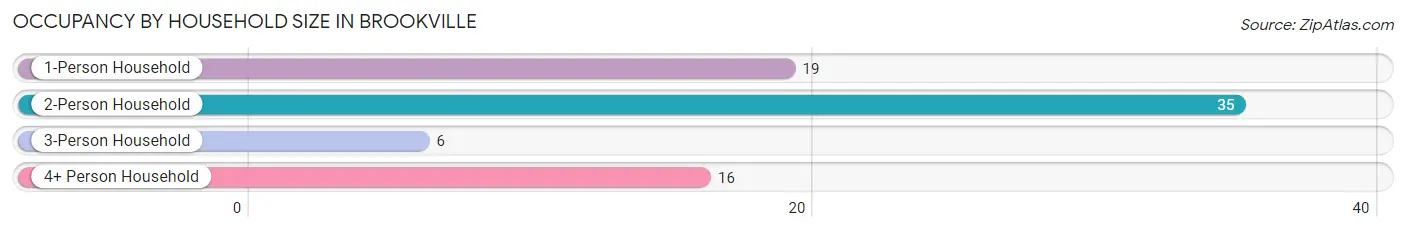
| Household Size | # Housing Units | % Housing Units |
| 1-Person Household | 19 | 25.0% |
| 2-Person Household | 35 | 46.1% |
| 3-Person Household | 6 | 7.9% |
| 4+ Person Household | 16 | 21.0% |
| Total Housing Units | 76 | 100.0% |
Occupancy by Ownership by Household Size in Brookville
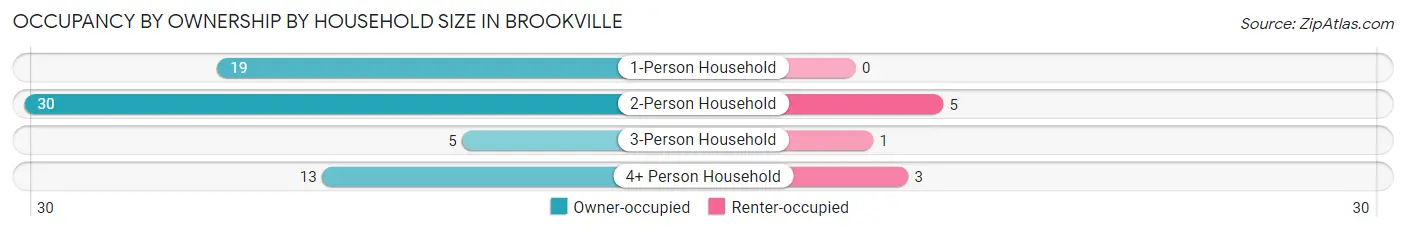
| Household Size | Owner-occupied | Renter-occupied |
| 1-Person Household | 19 (100.0%) | 0 (0.0%) |
| 2-Person Household | 30 (85.7%) | 5 (14.3%) |
| 3-Person Household | 5 (83.3%) | 1 (16.7%) |
| 4+ Person Household | 13 (81.2%) | 3 (18.8%) |
| Total Housing Units | 67 (88.2%) | 9 (11.8%) |
Occupancy by Educational Attainment in Brookville
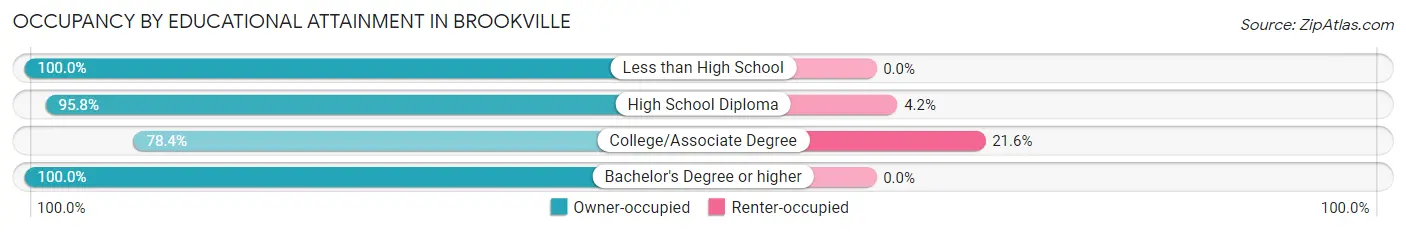
| Household Size | Owner-occupied | Renter-occupied |
| Less than High School | 1 (100.0%) | 0 (0.0%) |
| High School Diploma | 23 (95.8%) | 1 (4.2%) |
| College/Associate Degree | 29 (78.4%) | 8 (21.6%) |
| Bachelor's Degree or higher | 14 (100.0%) | 0 (0.0%) |
Occupancy by Age of Householder in Brookville
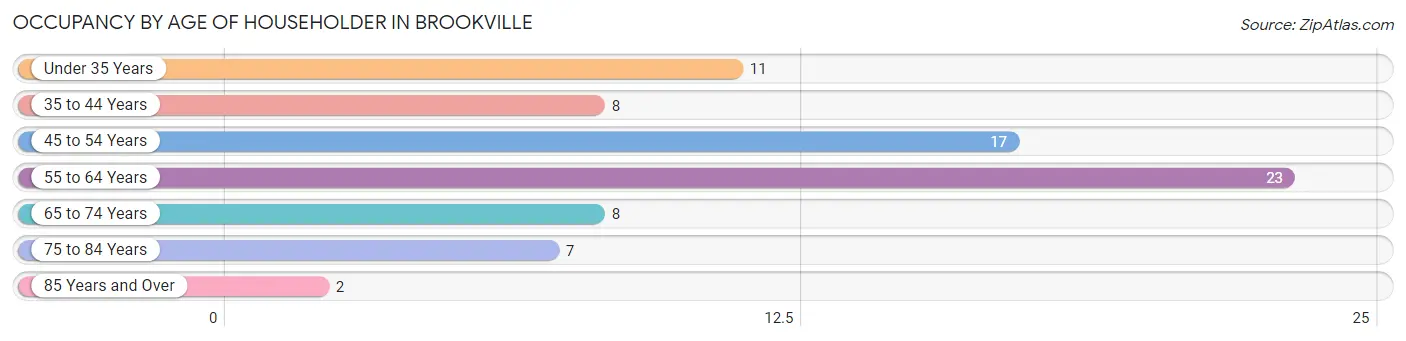
| Age Bracket | # Households | % Households |
| Under 35 Years | 11 | 14.5% |
| 35 to 44 Years | 8 | 10.5% |
| 45 to 54 Years | 17 | 22.4% |
| 55 to 64 Years | 23 | 30.3% |
| 65 to 74 Years | 8 | 10.5% |
| 75 to 84 Years | 7 | 9.2% |
| 85 Years and Over | 2 | 2.6% |
| Total | 76 | 100.0% |
Housing Finances in Brookville
Median Income by Occupancy in Brookville
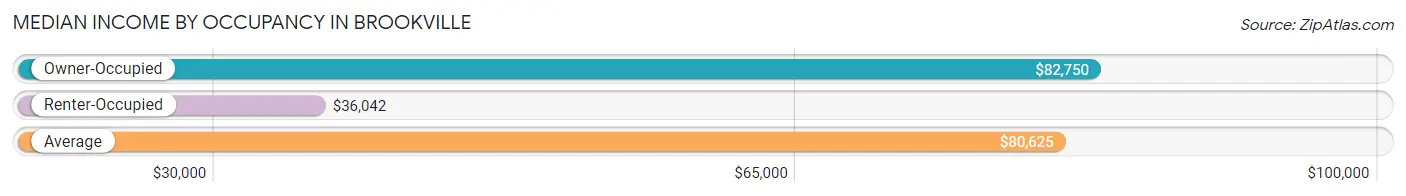
| Occupancy Type | # Households | Median Income |
| Owner-Occupied | 67 (88.2%) | $82,750 |
| Renter-Occupied | 9 (11.8%) | $36,042 |
| Average | 76 (100.0%) | $80,625 |
Occupancy by Householder Income Bracket in Brookville
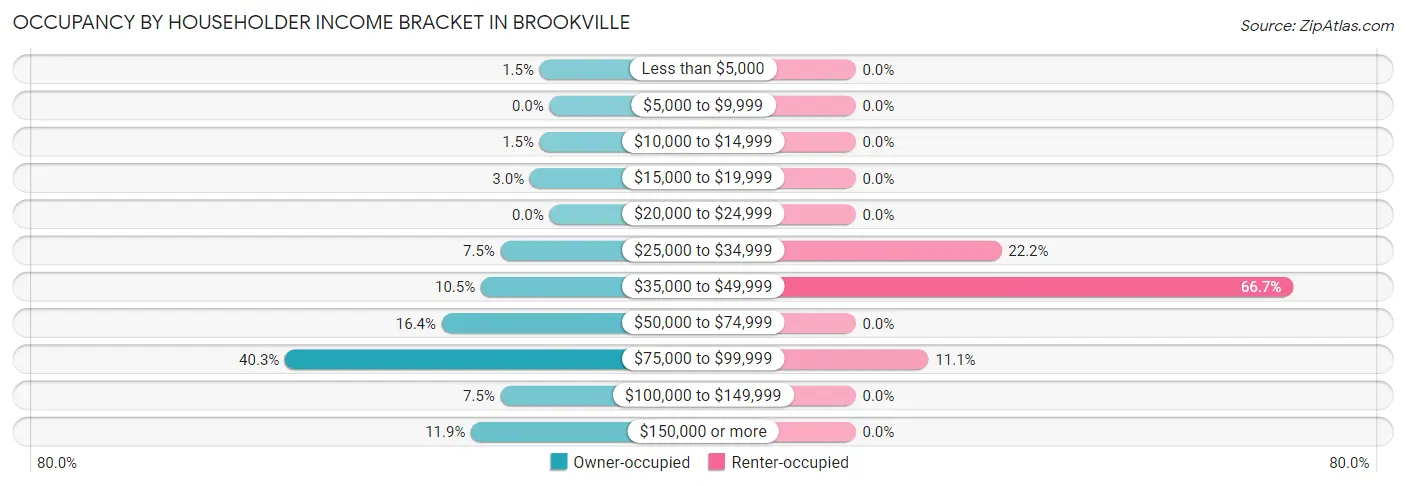
| Income Bracket | Owner-occupied | Renter-occupied |
| Less than $5,000 | 1 (1.5%) | 0 (0.0%) |
| $5,000 to $9,999 | 0 (0.0%) | 0 (0.0%) |
| $10,000 to $14,999 | 1 (1.5%) | 0 (0.0%) |
| $15,000 to $19,999 | 2 (3.0%) | 0 (0.0%) |
| $20,000 to $24,999 | 0 (0.0%) | 0 (0.0%) |
| $25,000 to $34,999 | 5 (7.5%) | 2 (22.2%) |
| $35,000 to $49,999 | 7 (10.4%) | 6 (66.7%) |
| $50,000 to $74,999 | 11 (16.4%) | 0 (0.0%) |
| $75,000 to $99,999 | 27 (40.3%) | 1 (11.1%) |
| $100,000 to $149,999 | 5 (7.5%) | 0 (0.0%) |
| $150,000 or more | 8 (11.9%) | 0 (0.0%) |
| Total | 67 (100.0%) | 9 (100.0%) |
Monthly Housing Cost Tiers in Brookville
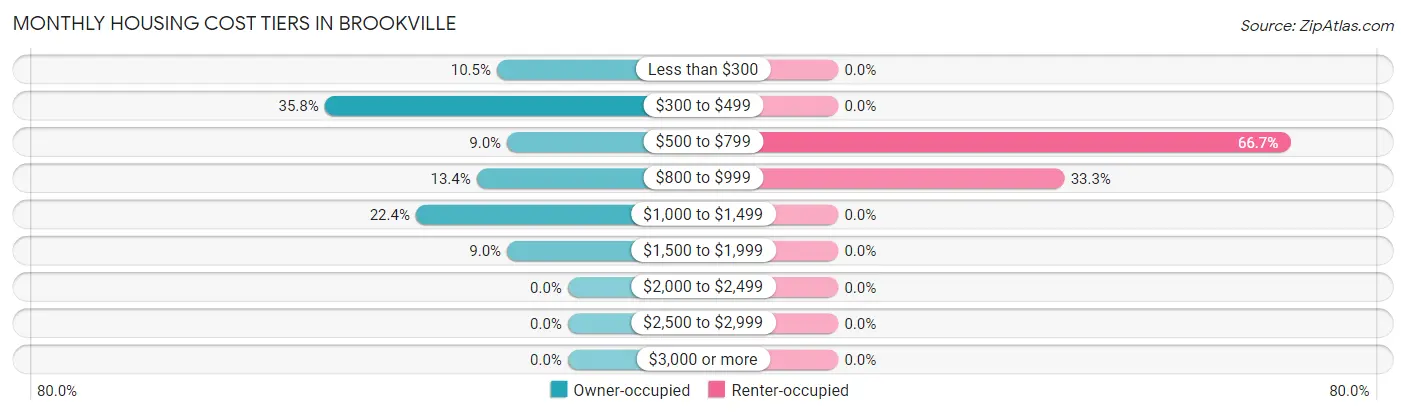
| Monthly Cost | Owner-occupied | Renter-occupied |
| Less than $300 | 7 (10.4%) | 0 (0.0%) |
| $300 to $499 | 24 (35.8%) | 0 (0.0%) |
| $500 to $799 | 6 (9.0%) | 6 (66.7%) |
| $800 to $999 | 9 (13.4%) | 3 (33.3%) |
| $1,000 to $1,499 | 15 (22.4%) | 0 (0.0%) |
| $1,500 to $1,999 | 6 (9.0%) | 0 (0.0%) |
| $2,000 to $2,499 | 0 (0.0%) | 0 (0.0%) |
| $2,500 to $2,999 | 0 (0.0%) | 0 (0.0%) |
| $3,000 or more | 0 (0.0%) | 0 (0.0%) |
| Total | 67 (100.0%) | 9 (100.0%) |
Physical Housing Characteristics in Brookville
Housing Structures in Brookville
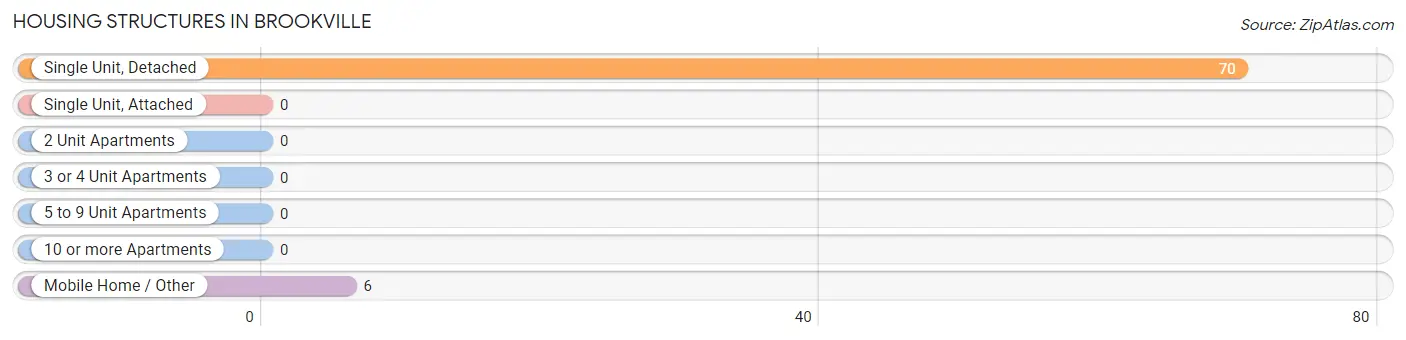
| Structure Type | # Housing Units | % Housing Units |
| Single Unit, Detached | 70 | 92.1% |
| Single Unit, Attached | 0 | 0.0% |
| 2 Unit Apartments | 0 | 0.0% |
| 3 or 4 Unit Apartments | 0 | 0.0% |
| 5 to 9 Unit Apartments | 0 | 0.0% |
| 10 or more Apartments | 0 | 0.0% |
| Mobile Home / Other | 6 | 7.9% |
| Total | 76 | 100.0% |
Housing Structures by Occupancy in Brookville
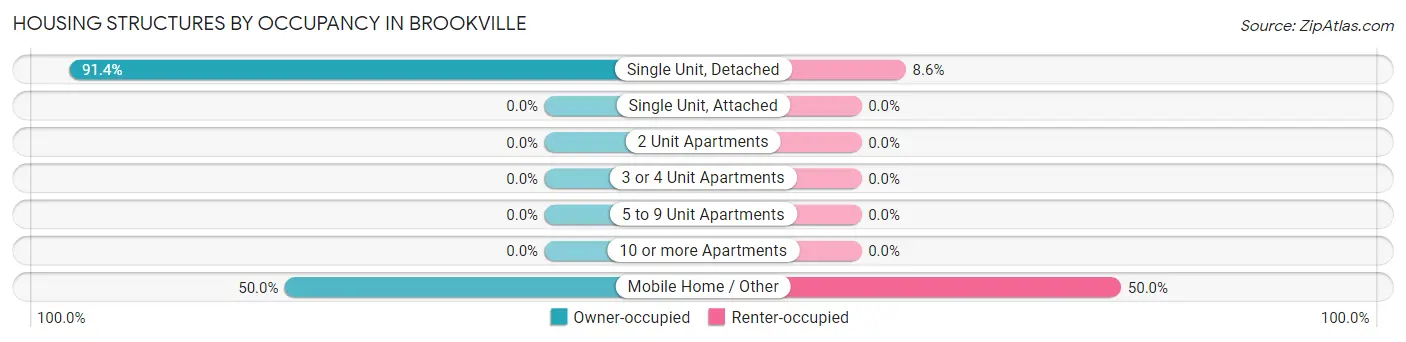
| Structure Type | Owner-occupied | Renter-occupied |
| Single Unit, Detached | 64 (91.4%) | 6 (8.6%) |
| Single Unit, Attached | 0 (0.0%) | 0 (0.0%) |
| 2 Unit Apartments | 0 (0.0%) | 0 (0.0%) |
| 3 or 4 Unit Apartments | 0 (0.0%) | 0 (0.0%) |
| 5 to 9 Unit Apartments | 0 (0.0%) | 0 (0.0%) |
| 10 or more Apartments | 0 (0.0%) | 0 (0.0%) |
| Mobile Home / Other | 3 (50.0%) | 3 (50.0%) |
| Total | 67 (88.2%) | 9 (11.8%) |
Housing Structures by Number of Rooms in Brookville
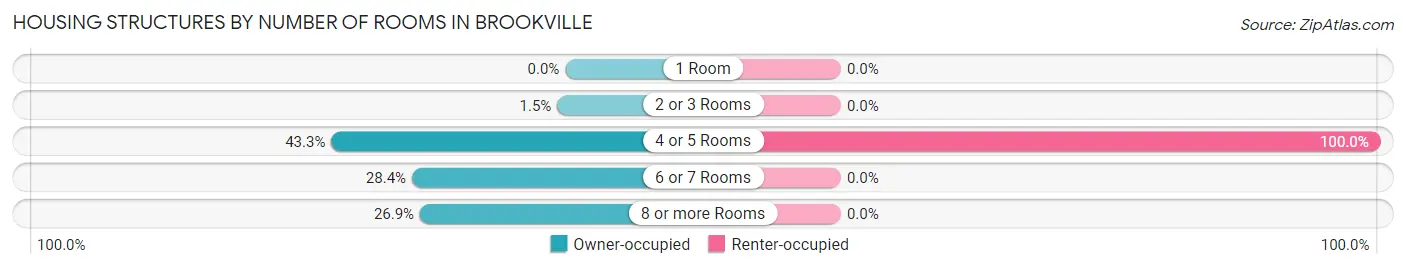
| Number of Rooms | Owner-occupied | Renter-occupied |
| 1 Room | 0 (0.0%) | 0 (0.0%) |
| 2 or 3 Rooms | 1 (1.5%) | 0 (0.0%) |
| 4 or 5 Rooms | 29 (43.3%) | 9 (100.0%) |
| 6 or 7 Rooms | 19 (28.4%) | 0 (0.0%) |
| 8 or more Rooms | 18 (26.9%) | 0 (0.0%) |
| Total | 67 (100.0%) | 9 (100.0%) |
Housing Structure by Heating Type in Brookville
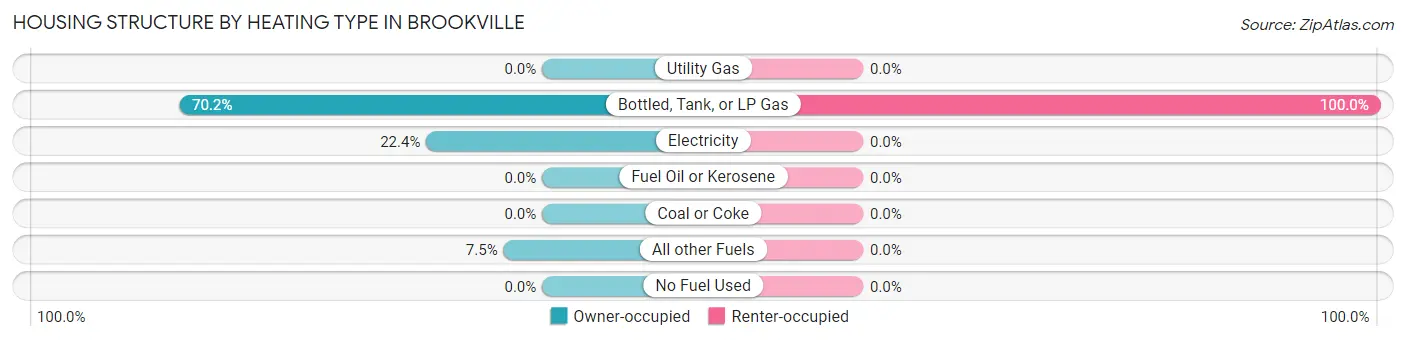
| Heating Type | Owner-occupied | Renter-occupied |
| Utility Gas | 0 (0.0%) | 0 (0.0%) |
| Bottled, Tank, or LP Gas | 47 (70.2%) | 9 (100.0%) |
| Electricity | 15 (22.4%) | 0 (0.0%) |
| Fuel Oil or Kerosene | 0 (0.0%) | 0 (0.0%) |
| Coal or Coke | 0 (0.0%) | 0 (0.0%) |
| All other Fuels | 5 (7.5%) | 0 (0.0%) |
| No Fuel Used | 0 (0.0%) | 0 (0.0%) |
| Total | 67 (100.0%) | 9 (100.0%) |
Household Vehicle Usage in Brookville
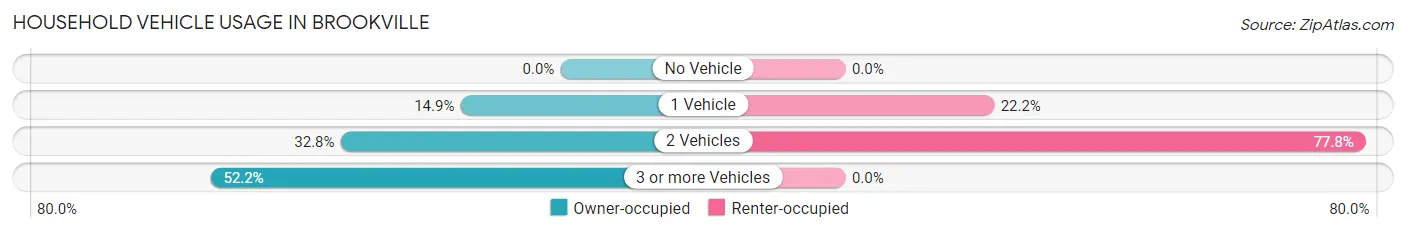
| Vehicles per Household | Owner-occupied | Renter-occupied |
| No Vehicle | 0 (0.0%) | 0 (0.0%) |
| 1 Vehicle | 10 (14.9%) | 2 (22.2%) |
| 2 Vehicles | 22 (32.8%) | 7 (77.8%) |
| 3 or more Vehicles | 35 (52.2%) | 0 (0.0%) |
| Total | 67 (100.0%) | 9 (100.0%) |
Real Estate & Mortgages in Brookville
Real Estate and Mortgage Overview in Brookville
| Characteristic | Without Mortgage | With Mortgage |
| Housing Units | 36 | 31 |
| Median Property Value | $76,000 | $92,500 |
| Median Household Income | $83,000 | $5 |
| Monthly Housing Costs | $424 | $0 |
| Real Estate Taxes | $1,000 | $0 |
Property Value by Mortgage Status in Brookville
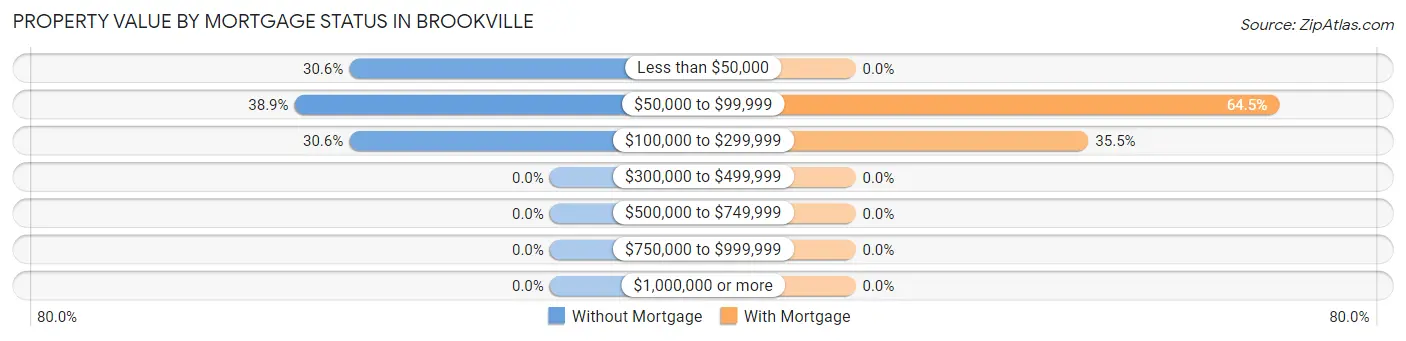
| Property Value | Without Mortgage | With Mortgage |
| Less than $50,000 | 11 (30.6%) | 0 (0.0%) |
| $50,000 to $99,999 | 14 (38.9%) | 20 (64.5%) |
| $100,000 to $299,999 | 11 (30.6%) | 11 (35.5%) |
| $300,000 to $499,999 | 0 (0.0%) | 0 (0.0%) |
| $500,000 to $749,999 | 0 (0.0%) | 0 (0.0%) |
| $750,000 to $999,999 | 0 (0.0%) | 0 (0.0%) |
| $1,000,000 or more | 0 (0.0%) | 0 (0.0%) |
| Total | 36 (100.0%) | 31 (100.0%) |
Household Income by Mortgage Status in Brookville
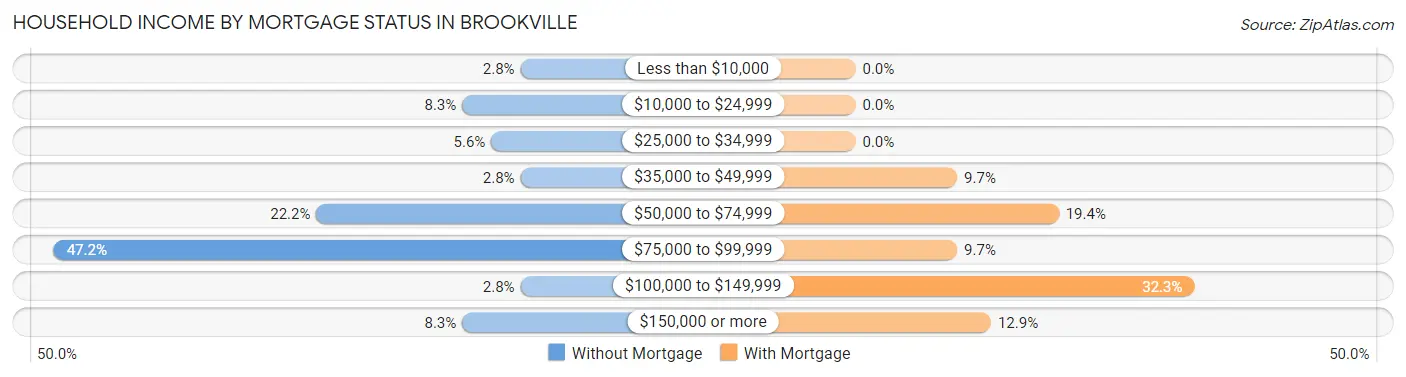
| Household Income | Without Mortgage | With Mortgage |
| Less than $10,000 | 1 (2.8%) | 0 (0.0%) |
| $10,000 to $24,999 | 3 (8.3%) | 0 (0.0%) |
| $25,000 to $34,999 | 2 (5.6%) | 0 (0.0%) |
| $35,000 to $49,999 | 1 (2.8%) | 3 (9.7%) |
| $50,000 to $74,999 | 8 (22.2%) | 6 (19.4%) |
| $75,000 to $99,999 | 17 (47.2%) | 3 (9.7%) |
| $100,000 to $149,999 | 1 (2.8%) | 10 (32.3%) |
| $150,000 or more | 3 (8.3%) | 4 (12.9%) |
| Total | 36 (100.0%) | 31 (100.0%) |
Property Value to Household Income Ratio in Brookville
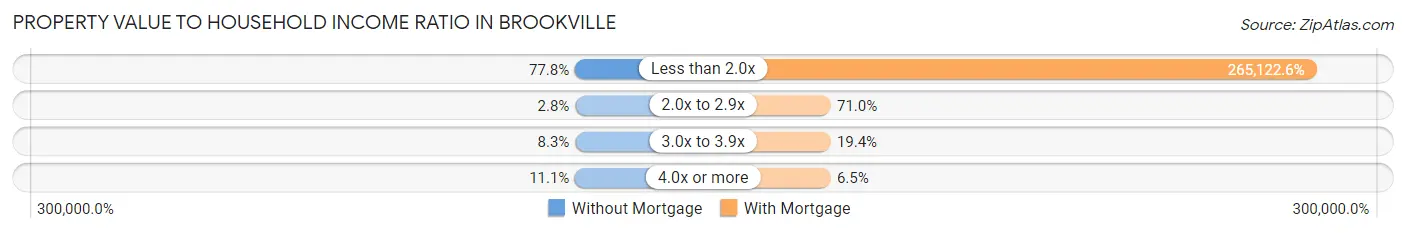
| Value-to-Income Ratio | Without Mortgage | With Mortgage |
| Less than 2.0x | 28 (77.8%) | 82,188 (265,122.6%) |
| 2.0x to 2.9x | 1 (2.8%) | 22 (71.0%) |
| 3.0x to 3.9x | 3 (8.3%) | 6 (19.4%) |
| 4.0x or more | 4 (11.1%) | 2 (6.5%) |
| Total | 36 (100.0%) | 31 (100.0%) |
Real Estate Taxes by Mortgage Status in Brookville
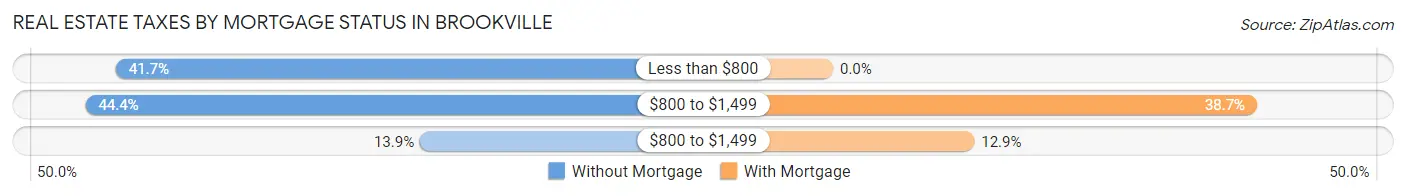
| Property Taxes | Without Mortgage | With Mortgage |
| Less than $800 | 15 (41.7%) | 0 (0.0%) |
| $800 to $1,499 | 16 (44.4%) | 12 (38.7%) |
| $800 to $1,499 | 5 (13.9%) | 4 (12.9%) |
| Total | 36 (100.0%) | 31 (100.0%) |
Health & Disability in Brookville
Health Insurance Coverage by Age in Brookville
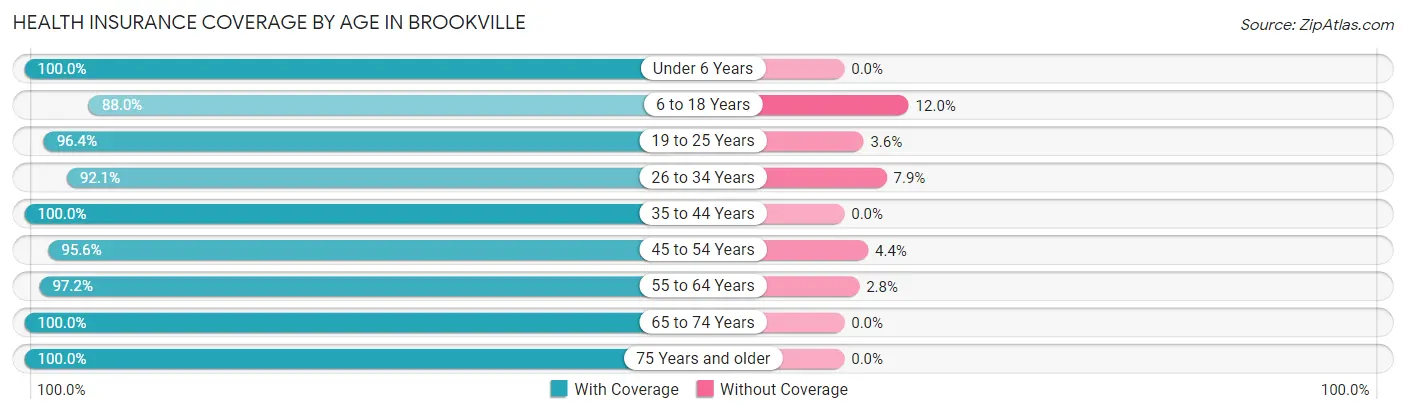
| Age Bracket | With Coverage | Without Coverage |
| Under 6 Years | 10 (100.0%) | 0 (0.0%) |
| 6 to 18 Years | 44 (88.0%) | 6 (12.0%) |
| 19 to 25 Years | 27 (96.4%) | 1 (3.6%) |
| 26 to 34 Years | 35 (92.1%) | 3 (7.9%) |
| 35 to 44 Years | 12 (100.0%) | 0 (0.0%) |
| 45 to 54 Years | 43 (95.6%) | 2 (4.4%) |
| 55 to 64 Years | 35 (97.2%) | 1 (2.8%) |
| 65 to 74 Years | 13 (100.0%) | 0 (0.0%) |
| 75 Years and older | 12 (100.0%) | 0 (0.0%) |
| Total | 231 (94.7%) | 13 (5.3%) |
Health Insurance Coverage by Citizenship Status in Brookville
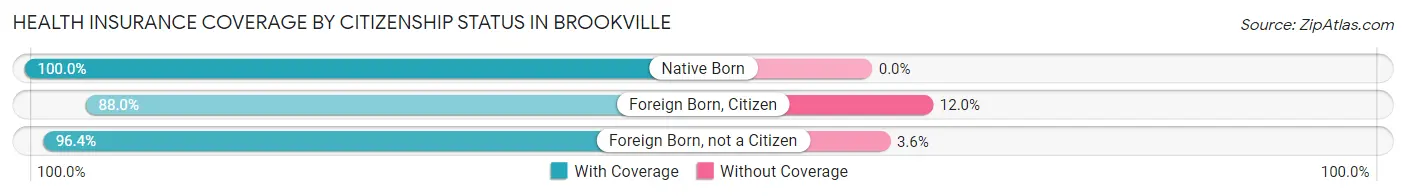
| Citizenship Status | With Coverage | Without Coverage |
| Native Born | 10 (100.0%) | 0 (0.0%) |
| Foreign Born, Citizen | 44 (88.0%) | 6 (12.0%) |
| Foreign Born, not a Citizen | 27 (96.4%) | 1 (3.6%) |
Health Insurance Coverage by Household Income in Brookville
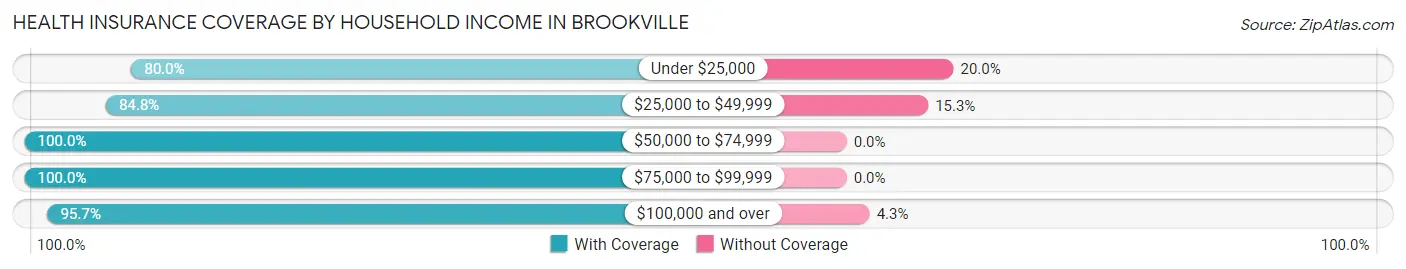
| Household Income | With Coverage | Without Coverage |
| Under $25,000 | 4 (80.0%) | 1 (20.0%) |
| $25,000 to $49,999 | 50 (84.8%) | 9 (15.2%) |
| $50,000 to $74,999 | 22 (100.0%) | 0 (0.0%) |
| $75,000 to $99,999 | 88 (100.0%) | 0 (0.0%) |
| $100,000 and over | 67 (95.7%) | 3 (4.3%) |
Public vs Private Health Insurance Coverage by Age in Brookville
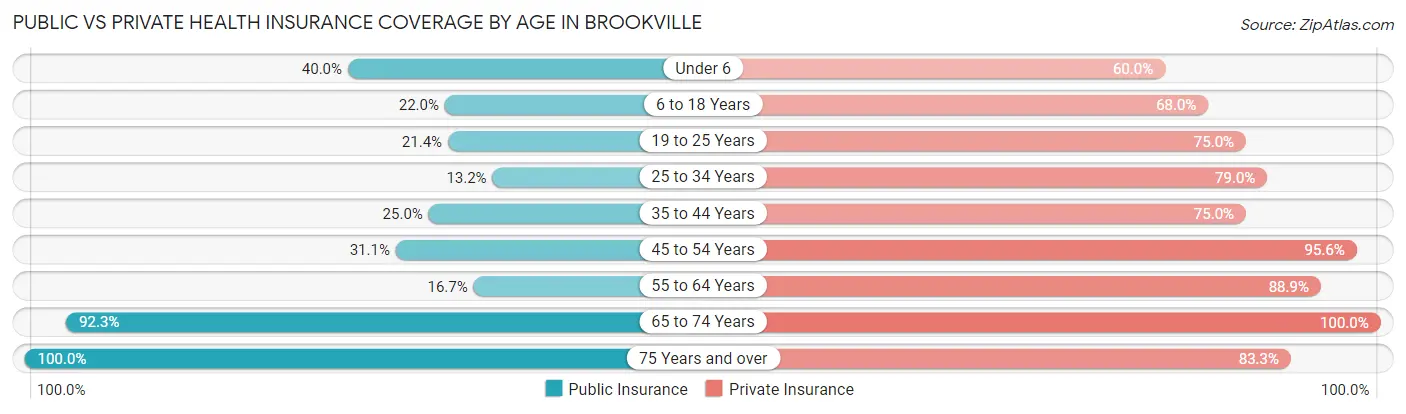
| Age Bracket | Public Insurance | Private Insurance |
| Under 6 | 4 (40.0%) | 6 (60.0%) |
| 6 to 18 Years | 11 (22.0%) | 34 (68.0%) |
| 19 to 25 Years | 6 (21.4%) | 21 (75.0%) |
| 25 to 34 Years | 5 (13.2%) | 30 (78.9%) |
| 35 to 44 Years | 3 (25.0%) | 9 (75.0%) |
| 45 to 54 Years | 14 (31.1%) | 43 (95.6%) |
| 55 to 64 Years | 6 (16.7%) | 32 (88.9%) |
| 65 to 74 Years | 12 (92.3%) | 13 (100.0%) |
| 75 Years and over | 12 (100.0%) | 10 (83.3%) |
| Total | 73 (29.9%) | 198 (81.1%) |
Disability Status by Sex by Age in Brookville
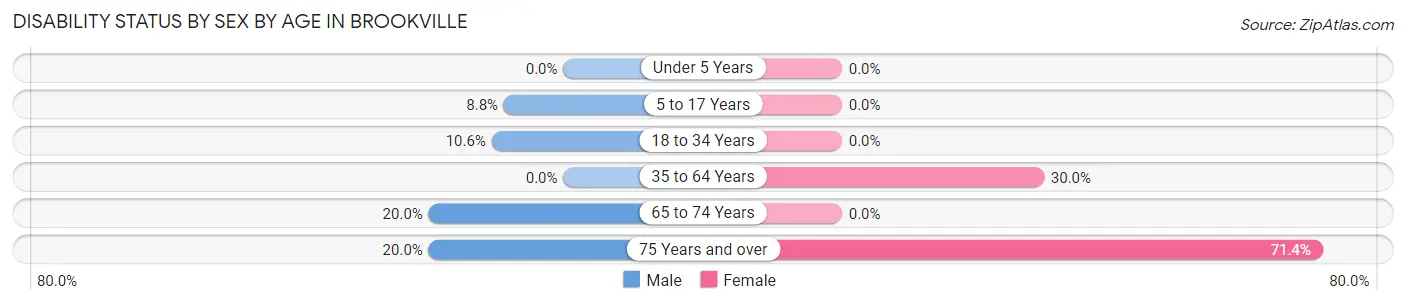
| Age Bracket | Male | Female |
| Under 5 Years | 0 (0.0%) | 0 (0.0%) |
| 5 to 17 Years | 3 (8.8%) | 0 (0.0%) |
| 18 to 34 Years | 5 (10.6%) | 0 (0.0%) |
| 35 to 64 Years | 0 (0.0%) | 18 (30.0%) |
| 65 to 74 Years | 2 (20.0%) | 0 (0.0%) |
| 75 Years and over | 1 (20.0%) | 5 (71.4%) |
Disability Class by Sex by Age in Brookville
Disability Class: Hearing Difficulty
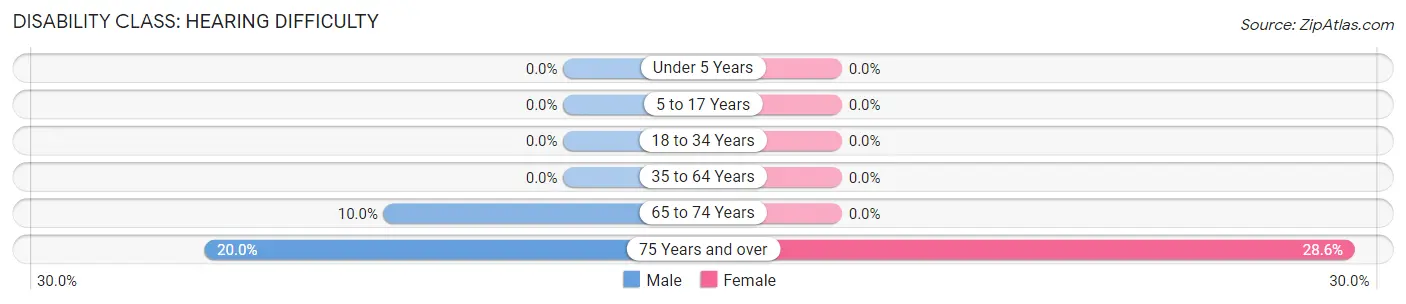
| Age Bracket | Male | Female |
| Under 5 Years | 0 (0.0%) | 0 (0.0%) |
| 5 to 17 Years | 0 (0.0%) | 0 (0.0%) |
| 18 to 34 Years | 0 (0.0%) | 0 (0.0%) |
| 35 to 64 Years | 0 (0.0%) | 0 (0.0%) |
| 65 to 74 Years | 1 (10.0%) | 0 (0.0%) |
| 75 Years and over | 1 (20.0%) | 2 (28.6%) |
Disability Class: Vision Difficulty
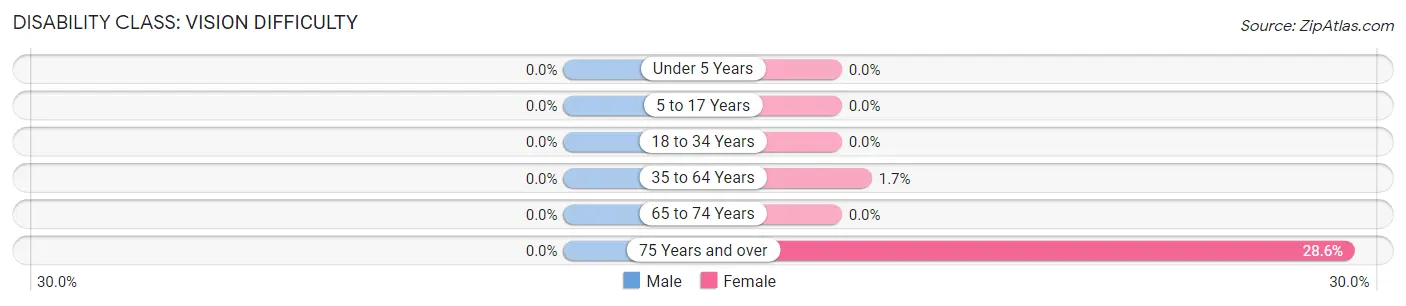
| Age Bracket | Male | Female |
| Under 5 Years | 0 (0.0%) | 0 (0.0%) |
| 5 to 17 Years | 0 (0.0%) | 0 (0.0%) |
| 18 to 34 Years | 0 (0.0%) | 0 (0.0%) |
| 35 to 64 Years | 0 (0.0%) | 1 (1.7%) |
| 65 to 74 Years | 0 (0.0%) | 0 (0.0%) |
| 75 Years and over | 0 (0.0%) | 2 (28.6%) |
Disability Class: Cognitive Difficulty
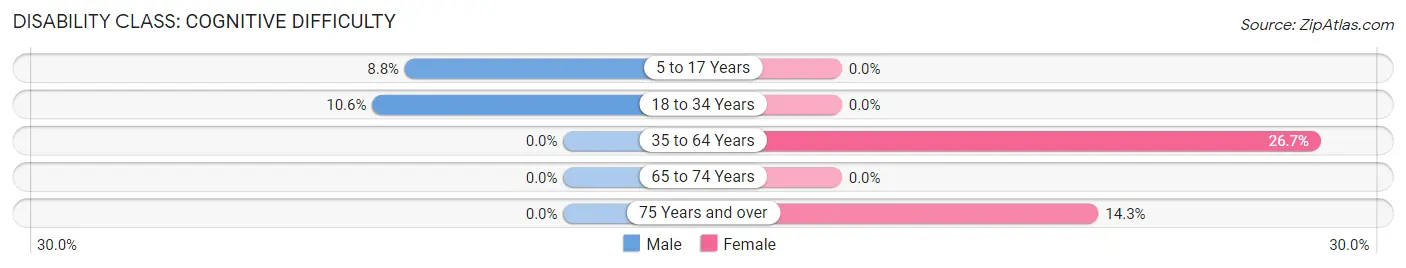
| Age Bracket | Male | Female |
| 5 to 17 Years | 3 (8.8%) | 0 (0.0%) |
| 18 to 34 Years | 5 (10.6%) | 0 (0.0%) |
| 35 to 64 Years | 0 (0.0%) | 16 (26.7%) |
| 65 to 74 Years | 0 (0.0%) | 0 (0.0%) |
| 75 Years and over | 0 (0.0%) | 1 (14.3%) |
Disability Class: Ambulatory Difficulty
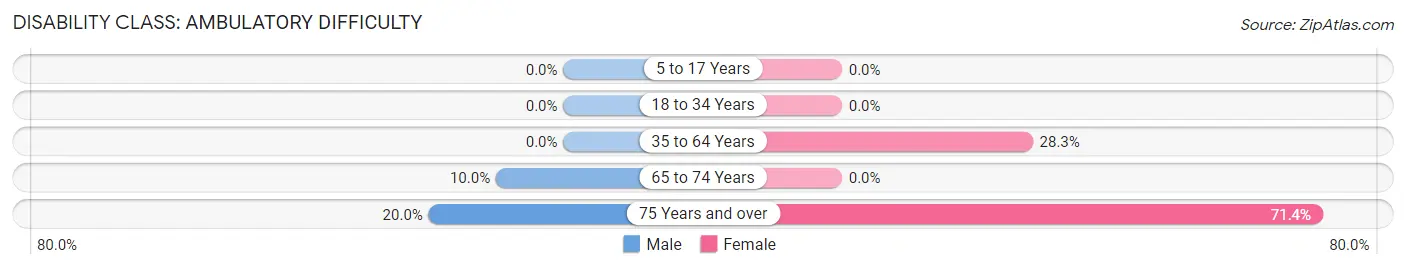
| Age Bracket | Male | Female |
| 5 to 17 Years | 0 (0.0%) | 0 (0.0%) |
| 18 to 34 Years | 0 (0.0%) | 0 (0.0%) |
| 35 to 64 Years | 0 (0.0%) | 17 (28.3%) |
| 65 to 74 Years | 1 (10.0%) | 0 (0.0%) |
| 75 Years and over | 1 (20.0%) | 5 (71.4%) |
Disability Class: Self-Care Difficulty
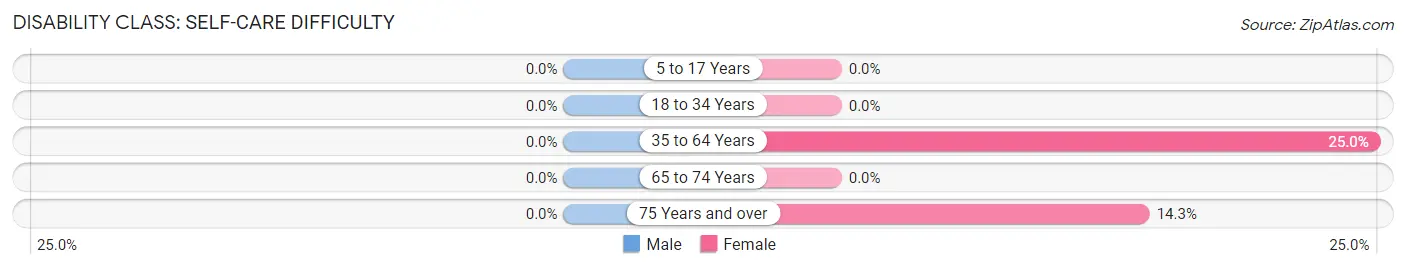
| Age Bracket | Male | Female |
| 5 to 17 Years | 0 (0.0%) | 0 (0.0%) |
| 18 to 34 Years | 0 (0.0%) | 0 (0.0%) |
| 35 to 64 Years | 0 (0.0%) | 15 (25.0%) |
| 65 to 74 Years | 0 (0.0%) | 0 (0.0%) |
| 75 Years and over | 0 (0.0%) | 1 (14.3%) |
Technology Access in Brookville
Computing Device Access in Brookville
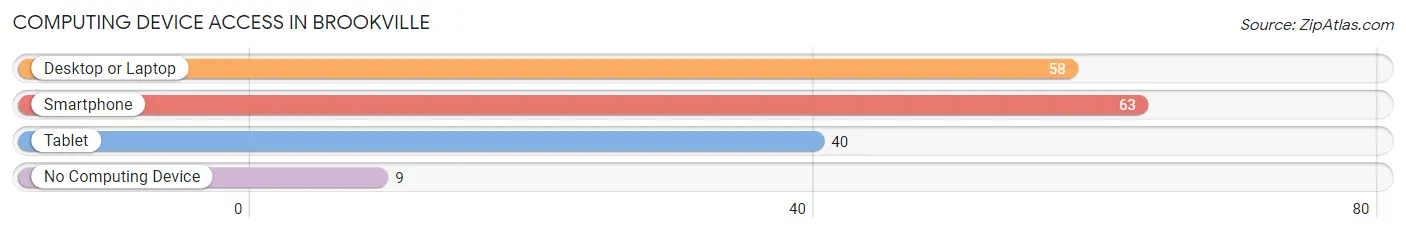
| Device Type | # Households | % Households |
| Desktop or Laptop | 58 | 76.3% |
| Smartphone | 63 | 82.9% |
| Tablet | 40 | 52.6% |
| No Computing Device | 9 | 11.8% |
| Total | 76 | 100.0% |
Internet Access in Brookville
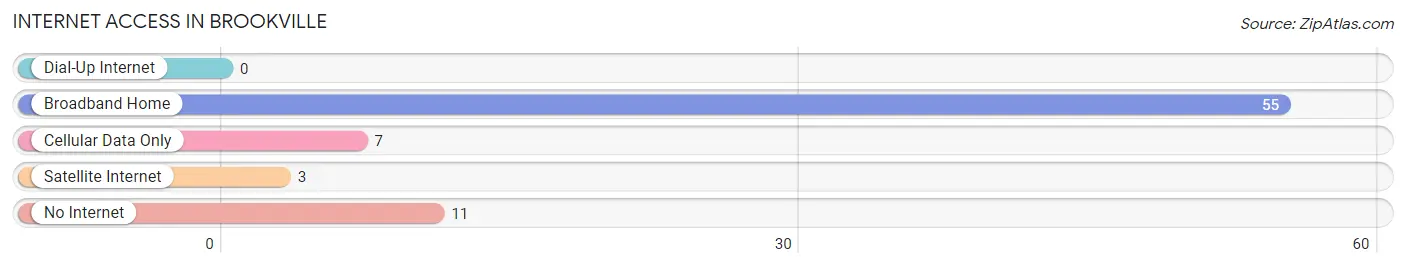
| Internet Type | # Households | % Households |
| Dial-Up Internet | 0 | 0.0% |
| Broadband Home | 55 | 72.4% |
| Cellular Data Only | 7 | 9.2% |
| Satellite Internet | 3 | 4.0% |
| No Internet | 11 | 14.5% |
| Total | 76 | 100.0% |
Brookville Summary
History
The small town of Brookville, Kansas is located in the north-central part of the state, in the county of Clay. It is situated on the banks of the Republican River, and is surrounded by rolling hills and farmland. The town was founded in 1871, when the first settlers arrived in the area. The town was named after the nearby Brookville Creek, which was named after the local Native American tribe, the Kaw.
The first settlers in the area were mostly farmers, who were attracted to the fertile soil and abundant water supply. The town quickly grew, and by the early 1900s, it had become a thriving agricultural center. The town was home to several businesses, including a general store, a blacksmith shop, a hotel, and a bank.
In the early 1900s, the town was also home to a large number of German immigrants, who had come to the area to work in the local coal mines. The town was also home to a large number of Native Americans, who had been living in the area for centuries.
The town continued to grow throughout the 20th century, and by the year 2000, it had a population of just over 500 people. The town is still largely agricultural, and is home to several small businesses, including a grocery store, a hardware store, and a few restaurants.
Geography
Brookville is located in the north-central part of Kansas, in Clay County. It is situated on the banks of the Republican River, and is surrounded by rolling hills and farmland. The town is located about 25 miles south of the Nebraska border, and about 50 miles west of the Missouri border.
The town is located at an elevation of 1,400 feet above sea level, and has an average annual temperature of around 50 degrees Fahrenheit. The town receives an average of around 30 inches of precipitation each year, and has an average annual snowfall of around 10 inches.
Economy
The economy of Brookville is largely based on agriculture. The town is home to several small farms, which produce a variety of crops, including corn, wheat, soybeans, and hay. The town is also home to several small businesses, including a grocery store, a hardware store, and a few restaurants.
The town is also home to a few manufacturing companies, which produce a variety of products, including furniture, clothing, and automotive parts. The town is also home to a few small service businesses, including a gas station, a post office, and a few auto repair shops.
Demographics
As of the year 2000, the population of Brookville was just over 500 people. The town is predominantly white, with around 95% of the population being of European descent. The town is also home to a small number of Native Americans, who make up around 2% of the population.
The median household income in Brookville is around $35,000, and the median home value is around $90,000. The town has a low unemployment rate, and the majority of the population is employed in either agriculture or small businesses. The town is also home to a few retirees, who make up around 10% of the population.
Common Questions
What is Per Capita Income in Brookville?
Per Capita income in Brookville is $32,125.
What is the Median Family Income in Brookville?
Median Family Income in Brookville is $81,875.
What is the Median Household income in Brookville?
Median Household Income in Brookville is $80,625.
What is Income or Wage Gap in Brookville?
Income or Wage Gap in Brookville is 6.2%.
Women in Brookville earn 93.8 cents for every dollar earned by a man.
What is Inequality or Gini Index in Brookville?
Inequality or Gini Index in Brookville is 0.35.
What is the Total Population of Brookville?
Total Population of Brookville is 245.
What is the Total Male Population of Brookville?
Total Male Population of Brookville is 136.
What is the Total Female Population of Brookville?
Total Female Population of Brookville is 109.
What is the Ratio of Males per 100 Females in Brookville?
There are 124.77 Males per 100 Females in Brookville.
What is the Ratio of Females per 100 Males in Brookville?
There are 80.15 Females per 100 Males in Brookville.
What is the Median Population Age in Brookville?
Median Population Age in Brookville is 33.0 Years.
What is the Average Family Size in Brookville
Average Family Size in Brookville is 4.2 People.
What is the Average Household Size in Brookville
Average Household Size in Brookville is 3.2 People.
How Large is the Labor Force in Brookville?
There are 147 People in the Labor Forcein in Brookville.
What is the Percentage of People in the Labor Force in Brookville?
72.8% of People are in the Labor Force in Brookville.