Willowbrook, KS Map & Demographics
Willowbrook Map
Willowbrook Overview
$96,861
PER CAPITA INCOME
$158,125
AVG FAMILY INCOME
$158,125
AVG HOUSEHOLD INCOME
0.53
INEQUALITY / GINI INDEX
88
TOTAL POPULATION
36
MALE POPULATION
52
FEMALE POPULATION
69.23
MALES / 100 FEMALES
144.44
FEMALES / 100 MALES
69.5
MEDIAN AGE
3.6
AVG FAMILY SIZE
3.0
AVG HOUSEHOLD SIZE
31
LABOR FORCE [ PEOPLE ]
37.3%
PERCENT IN LABOR FORCE
Willowbrook Area Codes
Income in Willowbrook
Income Overview in Willowbrook
Per Capita Income in Willowbrook is $96,861, while median incomes of families and households are $158,125 and $158,125 respectively.
| Characteristic | Number | Measure |
| Per Capita Income | 88 | $96,861 |
| Median Family Income | 23 | $158,125 |
| Mean Family Income | 23 | $253,374 |
| Median Household Income | 29 | $158,125 |
| Mean Household Income | 29 | $262,848 |
| Income Deficit | 23 | $0 |
| Wage / Income Gap (%) | 88 | 0.00% |
| Wage / Income Gap ($) | 88 | 100.00¢ per $1 |
| Gini / Inequality Index | 88 | 0.53 |
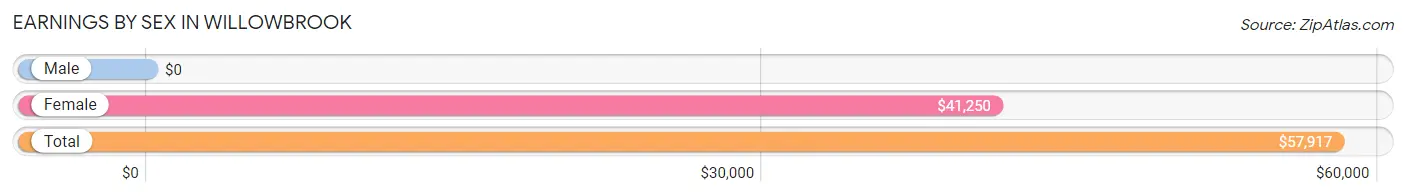
Earnings by Sex in Willowbrook
| Sex | Number | Average Earnings |
| Male | 24 (64.9%) | $0 |
| Female | 13 (35.1%) | $41,250 |
| Total | 37 (100.0%) | $57,917 |
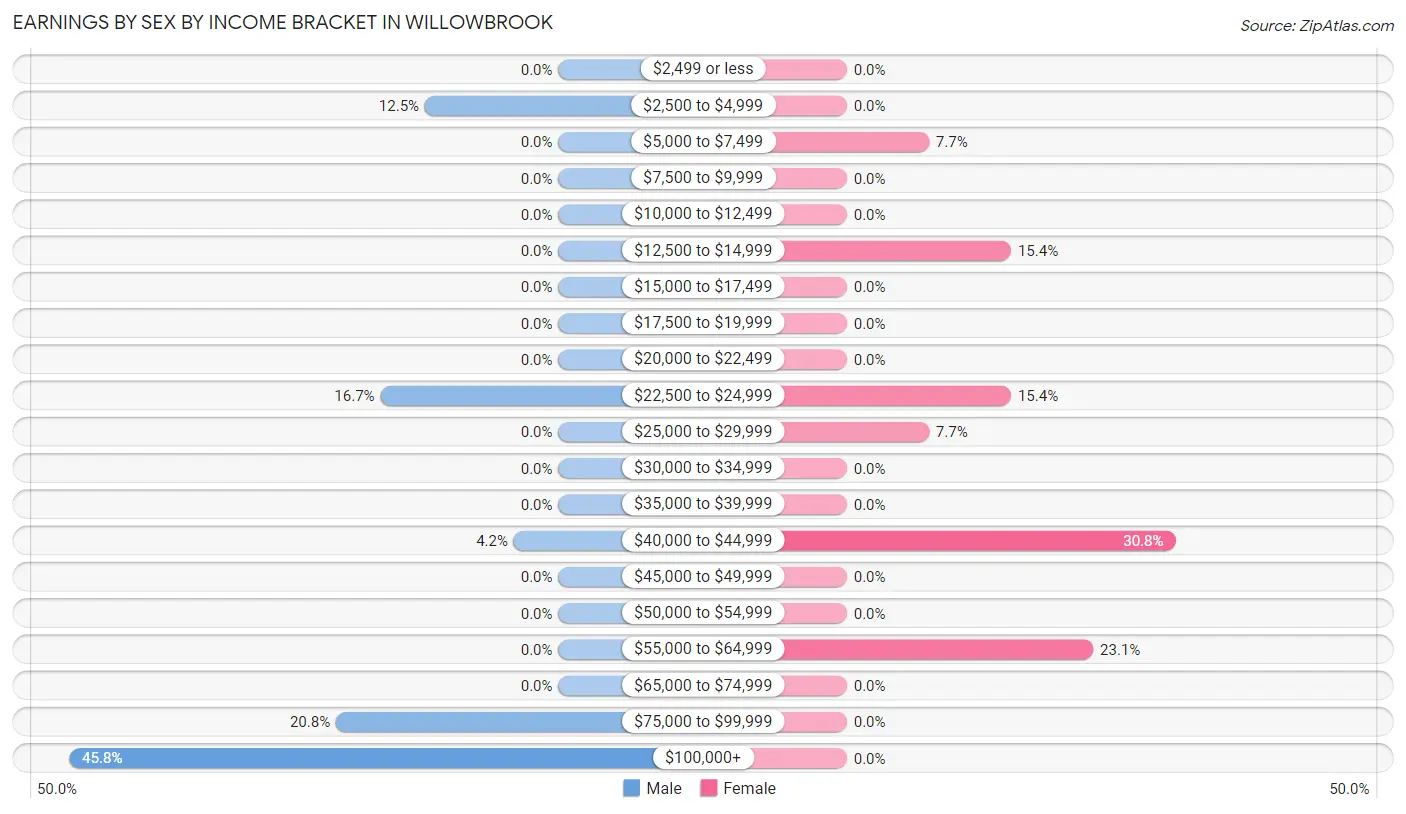
Earnings by Sex by Income Bracket in Willowbrook
The most common earnings brackets in Willowbrook are $100,000+ for men (11 | 45.8%) and $40,000 to $44,999 for women (4 | 30.8%).
| Income | Male | Female |
| $2,499 or less | 0 (0.0%) | 0 (0.0%) |
| $2,500 to $4,999 | 3 (12.5%) | 0 (0.0%) |
| $5,000 to $7,499 | 0 (0.0%) | 1 (7.7%) |
| $7,500 to $9,999 | 0 (0.0%) | 0 (0.0%) |
| $10,000 to $12,499 | 0 (0.0%) | 0 (0.0%) |
| $12,500 to $14,999 | 0 (0.0%) | 2 (15.4%) |
| $15,000 to $17,499 | 0 (0.0%) | 0 (0.0%) |
| $17,500 to $19,999 | 0 (0.0%) | 0 (0.0%) |
| $20,000 to $22,499 | 0 (0.0%) | 0 (0.0%) |
| $22,500 to $24,999 | 4 (16.7%) | 2 (15.4%) |
| $25,000 to $29,999 | 0 (0.0%) | 1 (7.7%) |
| $30,000 to $34,999 | 0 (0.0%) | 0 (0.0%) |
| $35,000 to $39,999 | 0 (0.0%) | 0 (0.0%) |
| $40,000 to $44,999 | 1 (4.2%) | 4 (30.8%) |
| $45,000 to $49,999 | 0 (0.0%) | 0 (0.0%) |
| $50,000 to $54,999 | 0 (0.0%) | 0 (0.0%) |
| $55,000 to $64,999 | 0 (0.0%) | 3 (23.1%) |
| $65,000 to $74,999 | 0 (0.0%) | 0 (0.0%) |
| $75,000 to $99,999 | 5 (20.8%) | 0 (0.0%) |
| $100,000+ | 11 (45.8%) | 0 (0.0%) |
| Total | 24 (100.0%) | 13 (100.0%) |
Earnings by Sex by Educational Attainment in Willowbrook
| Educational Attainment | Male Income | Female Income |
| Less than High School | - | - |
| High School Diploma | - | - |
| College or Associate's Degree | - | - |
| Bachelor's Degree | - | - |
| Graduate Degree | - | - |
| Total | - | - |
Family Income in Willowbrook
Family Income Brackets in Willowbrook
According to the Willowbrook family income data, there are 8 families falling into the $200,000+ income range, which is the most common income bracket and makes up 34.8% of all families.
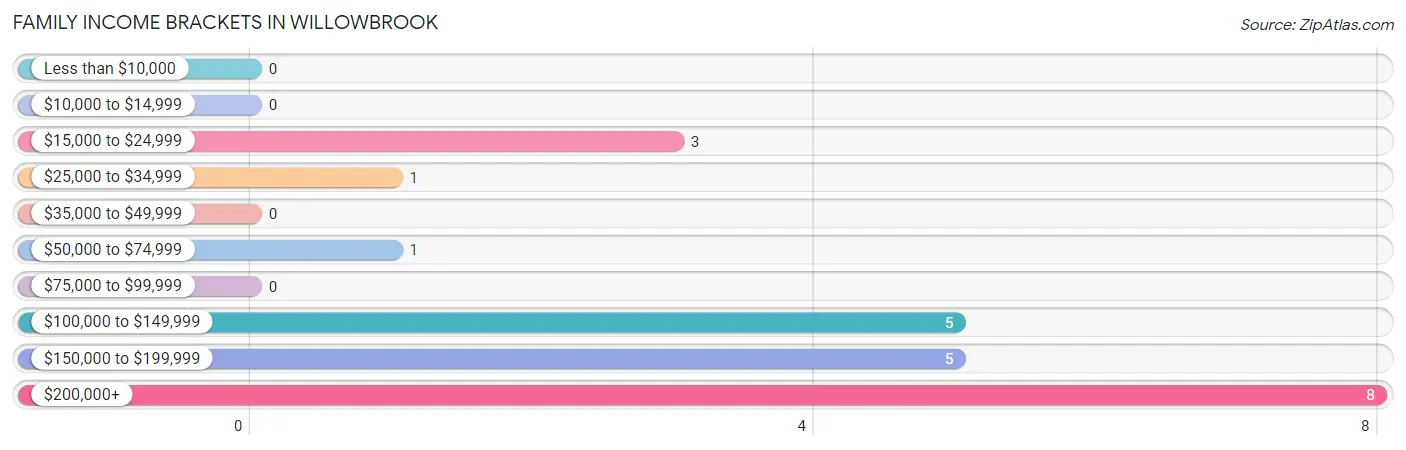
| Income Bracket | # Families | % Families |
| Less than $10,000 | 0 | 0.0% |
| $10,000 to $14,999 | 0 | 0.0% |
| $15,000 to $24,999 | 3 | 13.0% |
| $25,000 to $34,999 | 1 | 4.3% |
| $35,000 to $49,999 | 0 | 0.0% |
| $50,000 to $74,999 | 1 | 4.3% |
| $75,000 to $99,999 | 0 | 0.0% |
| $100,000 to $149,999 | 5 | 21.7% |
| $150,000 to $199,999 | 5 | 21.7% |
| $200,000+ | 8 | 34.8% |
Family Income by Famaliy Size in Willowbrook
2-person families (18 | 78.3%) account for the highest median family income in Willowbrook with $158,750 per family, while 2-person families (18 | 78.3%) have the highest median income of $79,375 per family member.
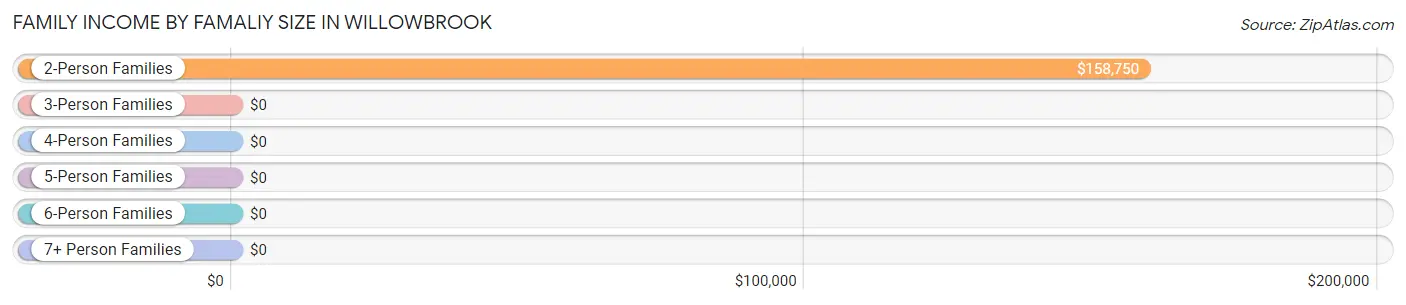
| Income Bracket | # Families | Median Income |
| 2-Person Families | 18 (78.3%) | $158,750 |
| 3-Person Families | 3 (13.0%) | $0 |
| 4-Person Families | 0 (0.0%) | $0 |
| 5-Person Families | 2 (8.7%) | $0 |
| 6-Person Families | 0 (0.0%) | $0 |
| 7+ Person Families | 0 (0.0%) | $0 |
| Total | 23 (100.0%) | $158,125 |
Family Income by Number of Earners in Willowbrook
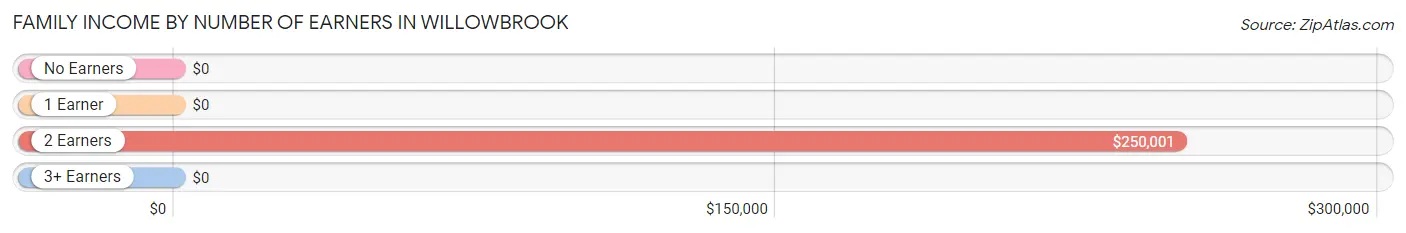
| Number of Earners | # Families | Median Income |
| No Earners | 6 (26.1%) | $0 |
| 1 Earner | 8 (34.8%) | $0 |
| 2 Earners | 5 (21.7%) | $250,001 |
| 3+ Earners | 4 (17.4%) | $0 |
| Total | 23 (100.0%) | $158,125 |
Household Income in Willowbrook
Household Income Brackets in Willowbrook
With 11 households falling in the category, the $200,000+ income range is the most frequent in Willowbrook, accounting for 37.9% of all households.
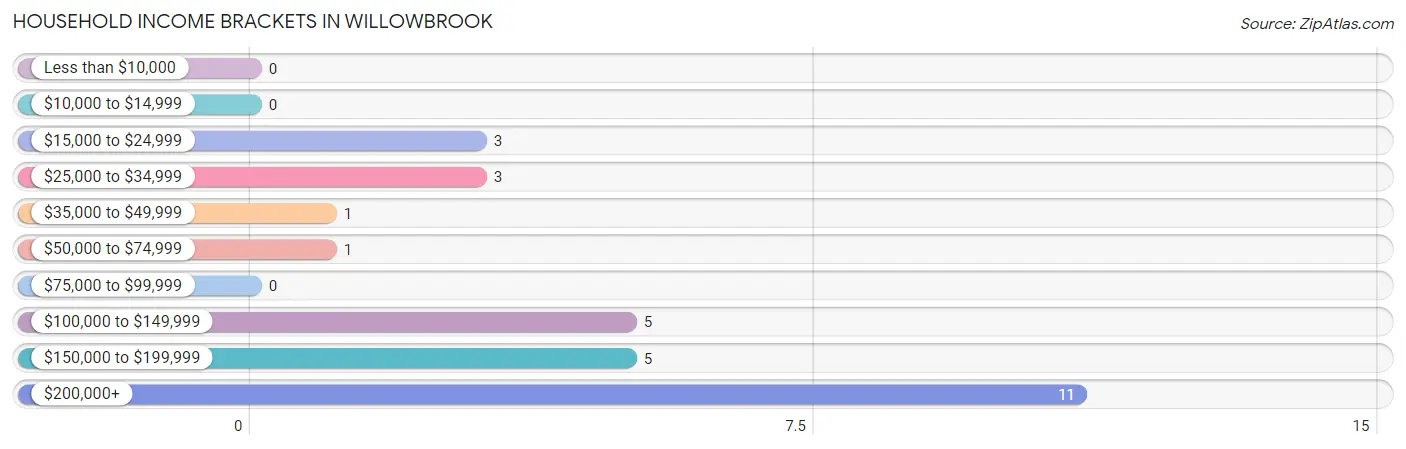
| Income Bracket | # Households | % Households |
| Less than $10,000 | 0 | 0.0% |
| $10,000 to $14,999 | 0 | 0.0% |
| $15,000 to $24,999 | 3 | 10.3% |
| $25,000 to $34,999 | 3 | 10.3% |
| $35,000 to $49,999 | 1 | 3.4% |
| $50,000 to $74,999 | 1 | 3.4% |
| $75,000 to $99,999 | 0 | 0.0% |
| $100,000 to $149,999 | 5 | 17.2% |
| $150,000 to $199,999 | 5 | 17.2% |
| $200,000+ | 11 | 37.9% |
Household Income by Householder Age in Willowbrook
The median household income in Willowbrook is $158,125, with the highest median household income of $205,000 found in the 45 to 64 years age bracket for the primary householder. A total of 14 households (48.3%) fall into this category.
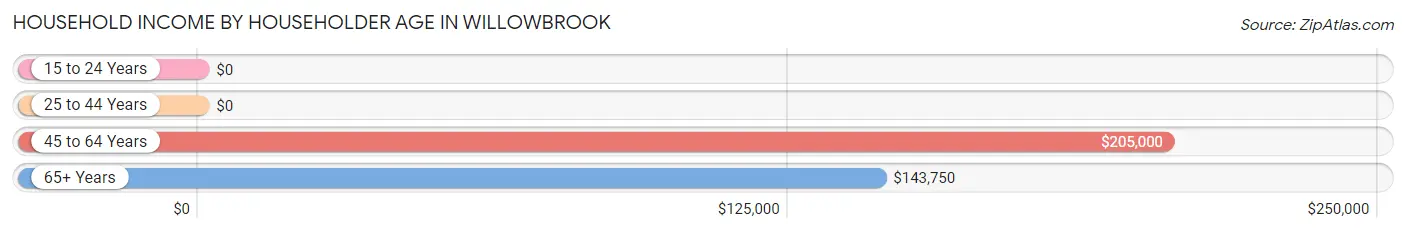
| Income Bracket | # Households | Median Income |
| 15 to 24 Years | 0 (0.0%) | $0 |
| 25 to 44 Years | 0 (0.0%) | $0 |
| 45 to 64 Years | 14 (48.3%) | $205,000 |
| 65+ Years | 15 (51.7%) | $143,750 |
| Total | 29 (100.0%) | $158,125 |
Poverty in Willowbrook
Income Below Poverty by Sex and Age in Willowbrook
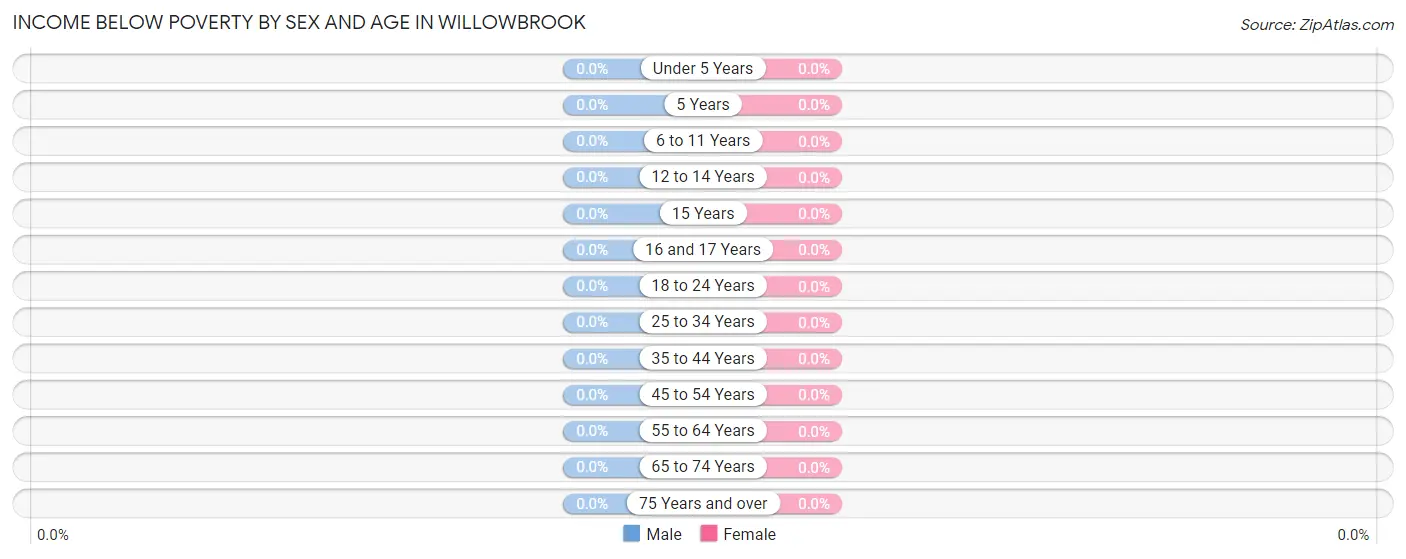
| Age Bracket | Male | Female |
| Under 5 Years | 0 (0.0%) | 0 (0.0%) |
| 5 Years | 0 (0.0%) | 0 (0.0%) |
| 6 to 11 Years | 0 (0.0%) | 0 (0.0%) |
| 12 to 14 Years | 0 (0.0%) | 0 (0.0%) |
| 15 Years | 0 (0.0%) | 0 (0.0%) |
| 16 and 17 Years | 0 (0.0%) | 0 (0.0%) |
| 18 to 24 Years | 0 (0.0%) | 0 (0.0%) |
| 25 to 34 Years | 0 (0.0%) | 0 (0.0%) |
| 35 to 44 Years | 0 (0.0%) | 0 (0.0%) |
| 45 to 54 Years | 0 (0.0%) | 0 (0.0%) |
| 55 to 64 Years | 0 (0.0%) | 0 (0.0%) |
| 65 to 74 Years | 0 (0.0%) | 0 (0.0%) |
| 75 Years and over | 0 (0.0%) | 0 (0.0%) |
| Total | 0 (0.0%) | 0 (0.0%) |
Income Above Poverty by Sex and Age in Willowbrook
According to the poverty statistics in Willowbrook, males aged 16 and 17 years and females aged 12 to 14 years are the age groups that are most secure financially, with 100.0% of males and 100.0% of females in these age groups living above the poverty line.
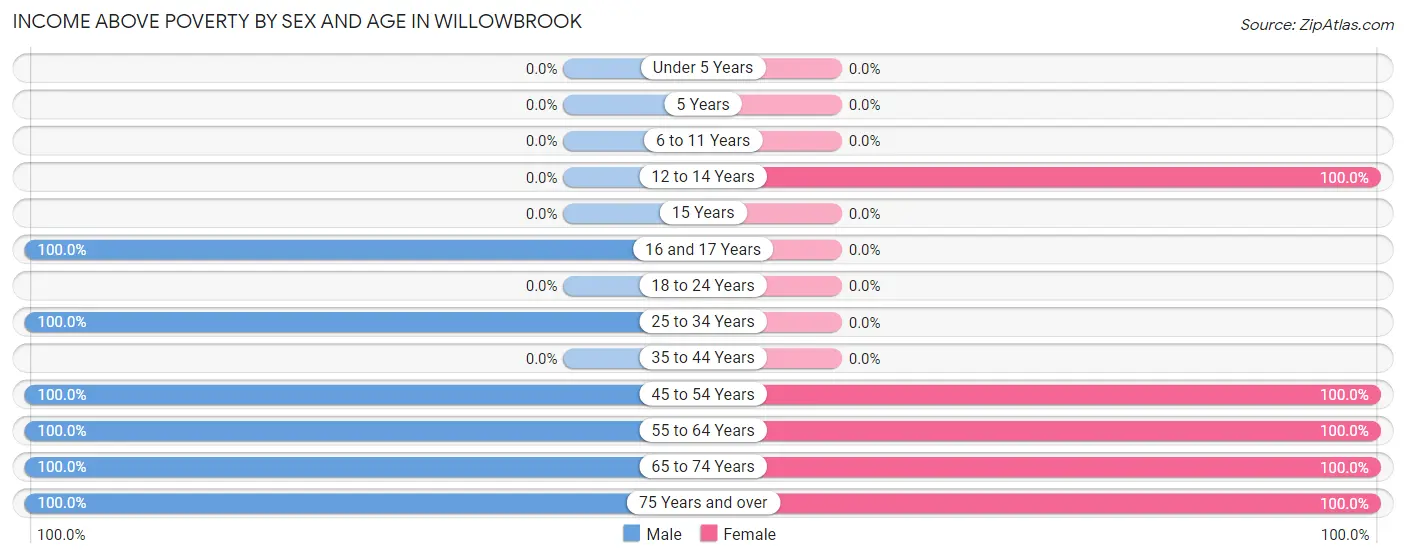
| Age Bracket | Male | Female |
| Under 5 Years | 0 (0.0%) | 0 (0.0%) |
| 5 Years | 0 (0.0%) | 0 (0.0%) |
| 6 to 11 Years | 0 (0.0%) | 0 (0.0%) |
| 12 to 14 Years | 0 (0.0%) | 5 (100.0%) |
| 15 Years | 0 (0.0%) | 0 (0.0%) |
| 16 and 17 Years | 4 (100.0%) | 0 (0.0%) |
| 18 to 24 Years | 0 (0.0%) | 0 (0.0%) |
| 25 to 34 Years | 4 (100.0%) | 0 (0.0%) |
| 35 to 44 Years | 0 (0.0%) | 0 (0.0%) |
| 45 to 54 Years | 4 (100.0%) | 6 (100.0%) |
| 55 to 64 Years | 10 (100.0%) | 8 (100.0%) |
| 65 to 74 Years | 7 (100.0%) | 26 (100.0%) |
| 75 Years and over | 7 (100.0%) | 7 (100.0%) |
| Total | 36 (100.0%) | 52 (100.0%) |
Income Below Poverty Among Married-Couple Families in Willowbrook
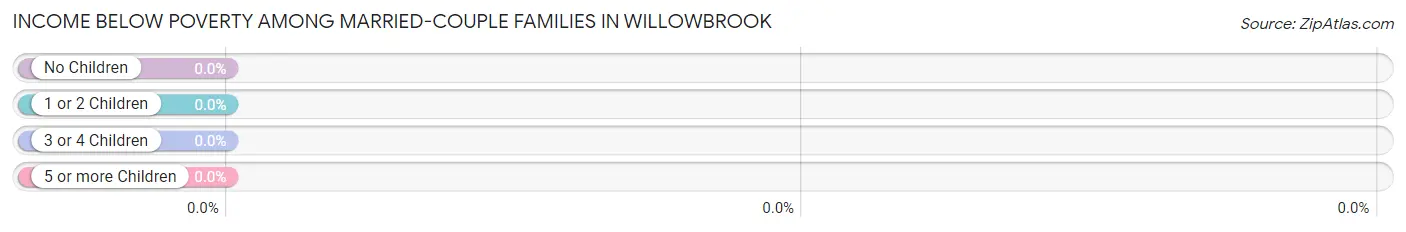
| Children | Above Poverty | Below Poverty |
| No Children | 20 (100.0%) | 0 (0.0%) |
| 1 or 2 Children | 1 (100.0%) | 0 (0.0%) |
| 3 or 4 Children | 2 (100.0%) | 0 (0.0%) |
| 5 or more Children | 0 (0.0%) | 0 (0.0%) |
| Total | 23 (100.0%) | 0 (0.0%) |
Income Below Poverty Among Single-Parent Households in Willowbrook
| Children | Single Father | Single Mother |
| No Children | 0 (0.0%) | 0 (0.0%) |
| 1 or 2 Children | 0 (0.0%) | 0 (0.0%) |
| 3 or 4 Children | 0 (0.0%) | 0 (0.0%) |
| 5 or more Children | 0 (0.0%) | 0 (0.0%) |
| Total | 0 (0.0%) | 0 (0.0%) |
Income Below Poverty Among Married-Couple vs Single-Parent Households in Willowbrook
| Children | Married-Couple Families | Single-Parent Households |
| No Children | 0 (0.0%) | 0 (0.0%) |
| 1 or 2 Children | 0 (0.0%) | 0 (0.0%) |
| 3 or 4 Children | 0 (0.0%) | 0 (0.0%) |
| 5 or more Children | 0 (0.0%) | 0 (0.0%) |
| Total | 0 (0.0%) | 0 (0.0%) |
Race in Willowbrook
The most populous races in Willowbrook are White / Caucasian (82 | 93.2%), Two or more Races (4 | 4.5%), and Some other Race (2 | 2.3%).
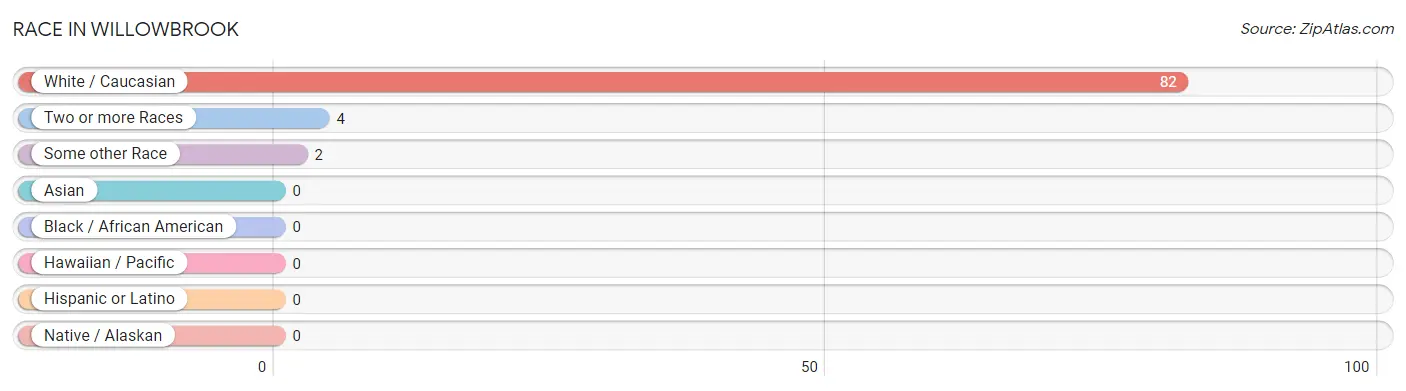
| Race | # Population | % Population |
| Asian | 0 | 0.0% |
| Black / African American | 0 | 0.0% |
| Hawaiian / Pacific | 0 | 0.0% |
| Hispanic or Latino | 0 | 0.0% |
| Native / Alaskan | 0 | 0.0% |
| White / Caucasian | 82 | 93.2% |
| Two or more Races | 4 | 4.5% |
| Some other Race | 2 | 2.3% |
| Total | 88 | 100.0% |
Ancestry in Willowbrook
The most populous ancestries reported in Willowbrook are German (32 | 36.4%), English (30 | 34.1%), European (5 | 5.7%), Irish (5 | 5.7%), and Dutch (3 | 3.4%), together accounting for 85.2% of all Willowbrook residents.
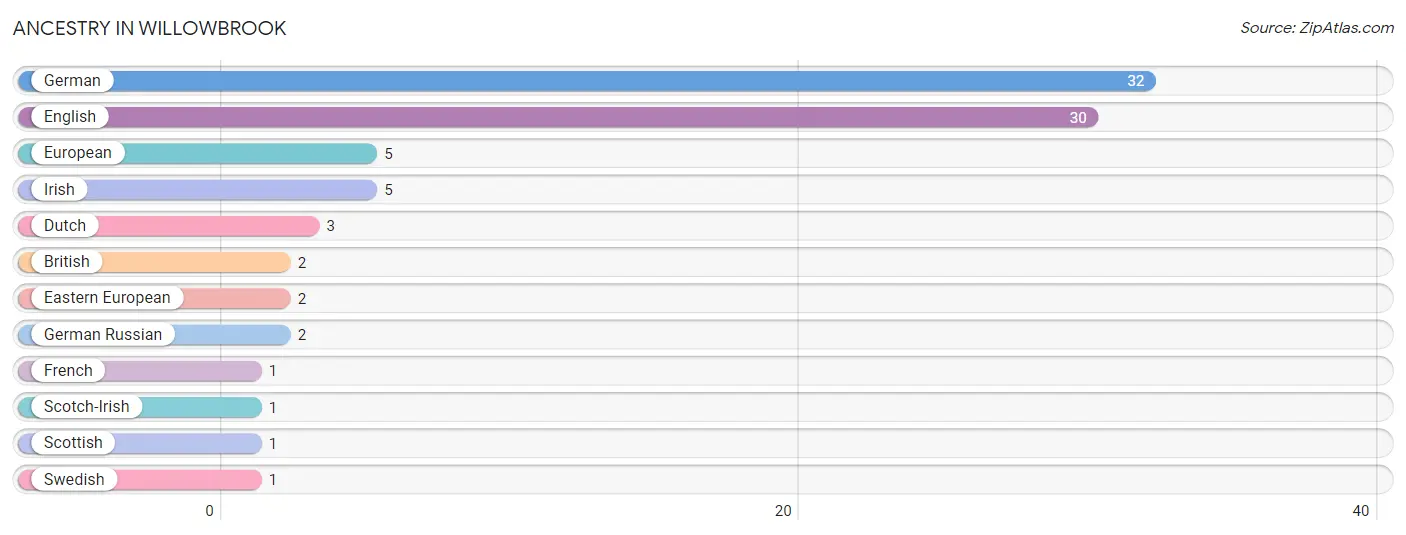
| Ancestry | # Population | % Population |
| British | 2 | 2.3% |
| Dutch | 3 | 3.4% |
| Eastern European | 2 | 2.3% |
| English | 30 | 34.1% |
| European | 5 | 5.7% |
| French | 1 | 1.1% |
| German | 32 | 36.4% |
| German Russian | 2 | 2.3% |
| Irish | 5 | 5.7% |
| Scotch-Irish | 1 | 1.1% |
| Scottish | 1 | 1.1% |
| Swedish | 1 | 1.1% | View All 12 Rows |
Immigrants in Willowbrook

| Immigration Origin | # Population | % Population | View All 0 Rows |
Sex and Age in Willowbrook
Sex and Age in Willowbrook
The most populous age groups in Willowbrook are 60 to 64 Years (7 | 19.4%) for men and 70 to 74 Years (26 | 50.0%) for women.
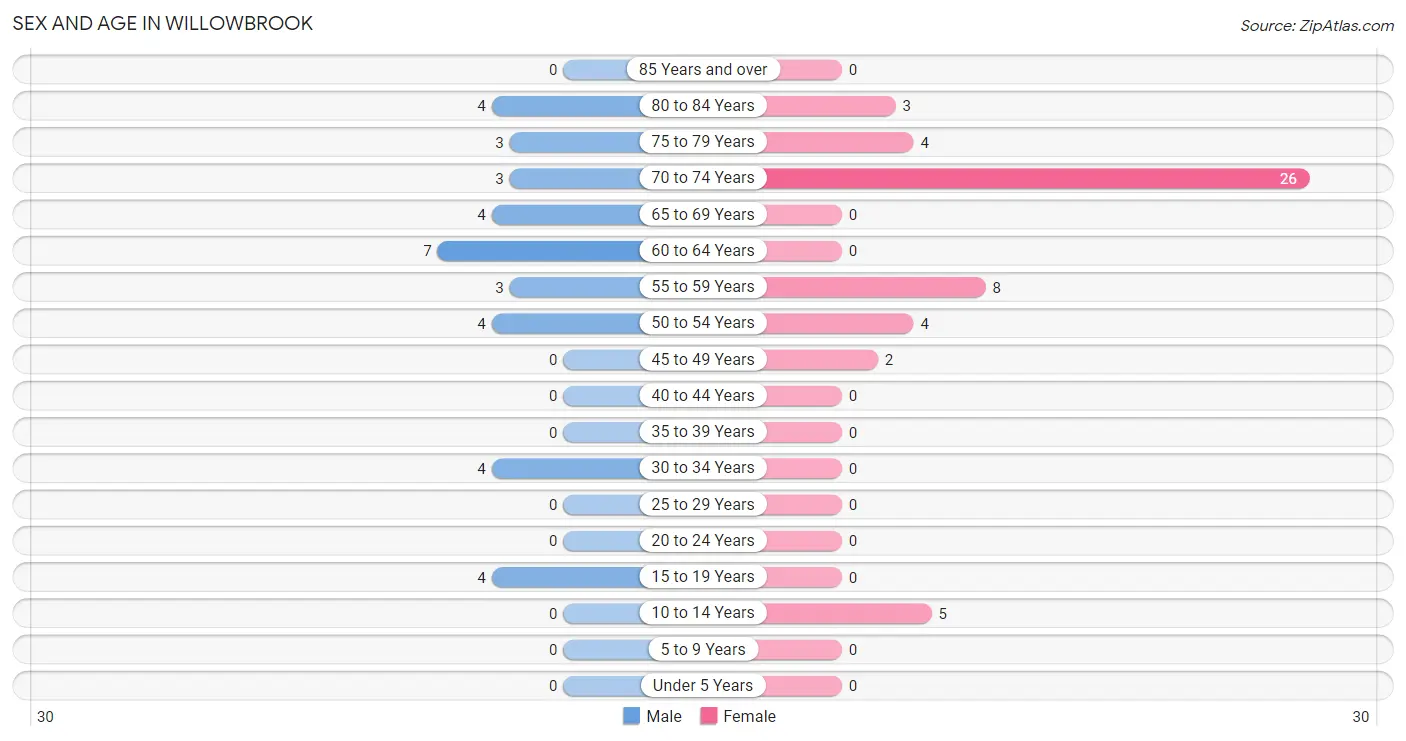
| Age Bracket | Male | Female |
| Under 5 Years | 0 (0.0%) | 0 (0.0%) |
| 5 to 9 Years | 0 (0.0%) | 0 (0.0%) |
| 10 to 14 Years | 0 (0.0%) | 5 (9.6%) |
| 15 to 19 Years | 4 (11.1%) | 0 (0.0%) |
| 20 to 24 Years | 0 (0.0%) | 0 (0.0%) |
| 25 to 29 Years | 0 (0.0%) | 0 (0.0%) |
| 30 to 34 Years | 4 (11.1%) | 0 (0.0%) |
| 35 to 39 Years | 0 (0.0%) | 0 (0.0%) |
| 40 to 44 Years | 0 (0.0%) | 0 (0.0%) |
| 45 to 49 Years | 0 (0.0%) | 2 (3.8%) |
| 50 to 54 Years | 4 (11.1%) | 4 (7.7%) |
| 55 to 59 Years | 3 (8.3%) | 8 (15.4%) |
| 60 to 64 Years | 7 (19.4%) | 0 (0.0%) |
| 65 to 69 Years | 4 (11.1%) | 0 (0.0%) |
| 70 to 74 Years | 3 (8.3%) | 26 (50.0%) |
| 75 to 79 Years | 3 (8.3%) | 4 (7.7%) |
| 80 to 84 Years | 4 (11.1%) | 3 (5.8%) |
| 85 Years and over | 0 (0.0%) | 0 (0.0%) |
| Total | 36 (100.0%) | 52 (100.0%) |
Families and Households in Willowbrook
Median Family Size in Willowbrook
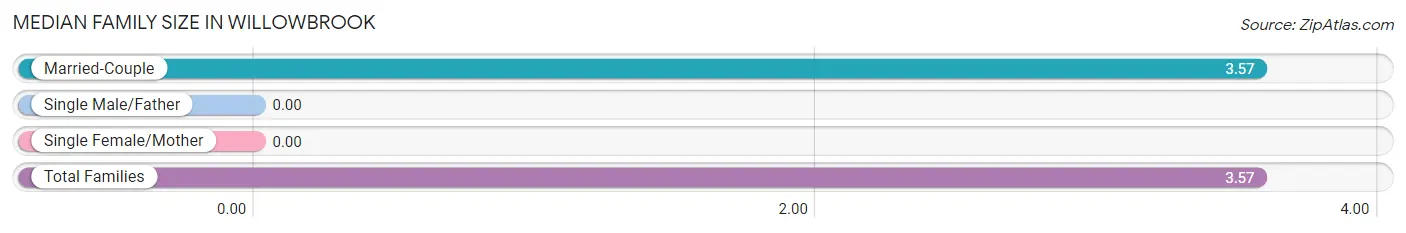
| Family Type | # Families | Family Size |
| Married-Couple | 23 (100.0%) | 3.57 |
| Single Male/Father | 0 (0.0%) | - |
| Single Female/Mother | 0 (0.0%) | - |
| Total Families | 23 (100.0%) | 3.57 |
Median Household Size in Willowbrook
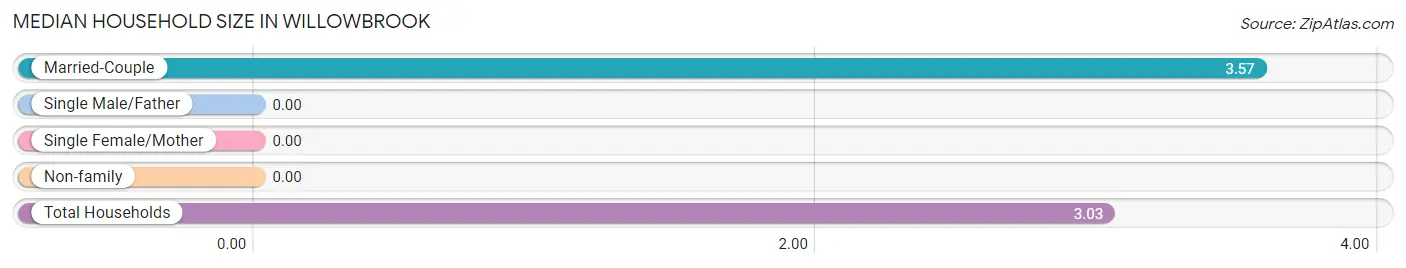
| Household Type | # Households | Household Size |
| Married-Couple | 23 (79.3%) | 3.57 |
| Single Male/Father | 0 (0.0%) | - |
| Single Female/Mother | 0 (0.0%) | - |
| Non-family | 6 (20.7%) | - |
| Total Households | 29 (100.0%) | 3.03 |
Household Size by Marriage Status in Willowbrook
Out of a total of 29 households in Willowbrook, 23 (79.3%) are family households, while 6 (20.7%) are nonfamily households. The most numerous type of family households are 2-person households, comprising 18, and the most common type of nonfamily households are 1-person households, comprising 6.
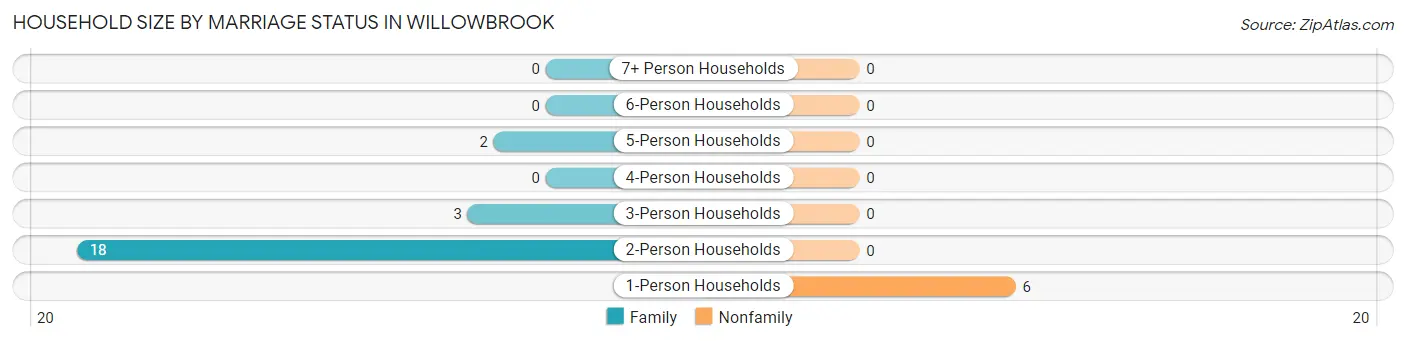
| Household Size | Family Households | Nonfamily Households |
| 1-Person Households | - | 6 (20.7%) |
| 2-Person Households | 18 (62.1%) | 0 (0.0%) |
| 3-Person Households | 3 (10.3%) | 0 (0.0%) |
| 4-Person Households | 0 (0.0%) | 0 (0.0%) |
| 5-Person Households | 2 (6.9%) | 0 (0.0%) |
| 6-Person Households | 0 (0.0%) | 0 (0.0%) |
| 7+ Person Households | 0 (0.0%) | 0 (0.0%) |
| Total | 23 (79.3%) | 6 (20.7%) |
Female Fertility in Willowbrook
Fertility by Age in Willowbrook
| Age Bracket | Women with Births | Births / 1,000 Women |
| 15 to 19 years | 0 (0.0%) | 0.0 |
| 20 to 34 years | 0 (0.0%) | 0.0 |
| 35 to 50 years | 0 (0.0%) | 0.0 |
| Total | 0 (0.0%) | 0.0 |
Fertility by Age by Marriage Status in Willowbrook
| Age Bracket | Married | Unmarried |
| 15 to 19 years | 0 (0.0%) | 0 (0.0%) |
| 20 to 34 years | 0 (0.0%) | 0 (0.0%) |
| 35 to 50 years | 0 (0.0%) | 0 (0.0%) |
| Total | 0 (0.0%) | 0 (0.0%) |
Fertility by Education in Willowbrook
| Educational Attainment | Women with Births | Births / 1,000 Women |
| Less than High School | 0 (0.0%) | 0.0 |
| High School Diploma | 0 (0.0%) | 0.0 |
| College or Associate's Degree | 0 (0.0%) | 0.0 |
| Bachelor's Degree | 0 (0.0%) | 0.0 |
| Graduate Degree | 0 (0.0%) | 0.0 |
| Total | 0 (0.0%) | 0.0 |
Fertility by Education by Marriage Status in Willowbrook
| Educational Attainment | Married | Unmarried |
| Less than High School | 0 (0.0%) | 0 (0.0%) |
| High School Diploma | 0 (0.0%) | 0 (0.0%) |
| College or Associate's Degree | 0 (0.0%) | 0 (0.0%) |
| Bachelor's Degree | 0 (0.0%) | 0 (0.0%) |
| Graduate Degree | 0 (0.0%) | 0 (0.0%) |
| Total | 0 (0.0%) | 0 (0.0%) |
Employment Characteristics in Willowbrook
Employment by Class of Employer in Willowbrook
Among the 29 employed individuals in Willowbrook, private company employees (16 | 55.2%), self-employed (incorporated) (6 | 20.7%), and not-for-profit organizations (4 | 13.8%) make up the most common classes of employment.
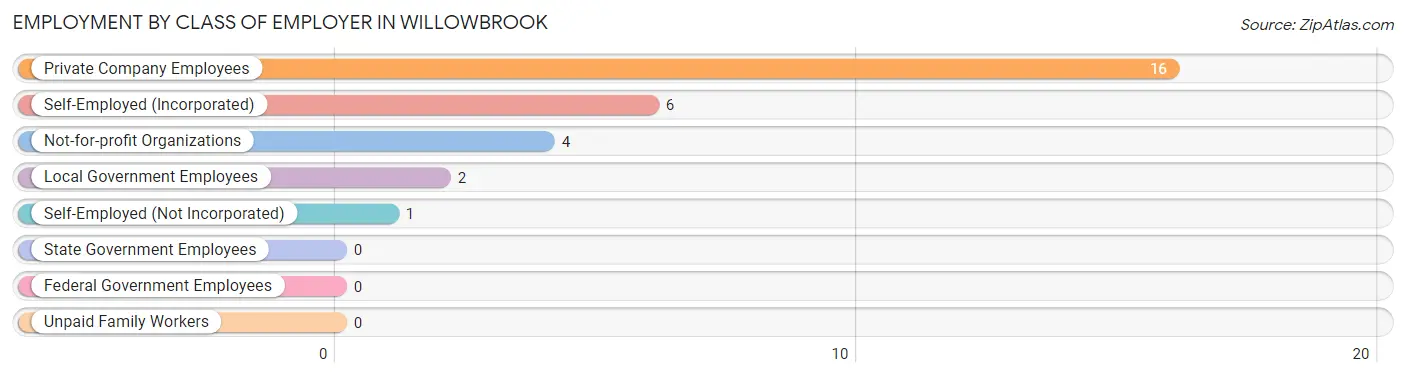
| Employer Class | # Employees | % Employees |
| Private Company Employees | 16 | 55.2% |
| Self-Employed (Incorporated) | 6 | 20.7% |
| Self-Employed (Not Incorporated) | 1 | 3.5% |
| Not-for-profit Organizations | 4 | 13.8% |
| Local Government Employees | 2 | 6.9% |
| State Government Employees | 0 | 0.0% |
| Federal Government Employees | 0 | 0.0% |
| Unpaid Family Workers | 0 | 0.0% |
| Total | 29 | 100.0% |
Employment Status by Age in Willowbrook
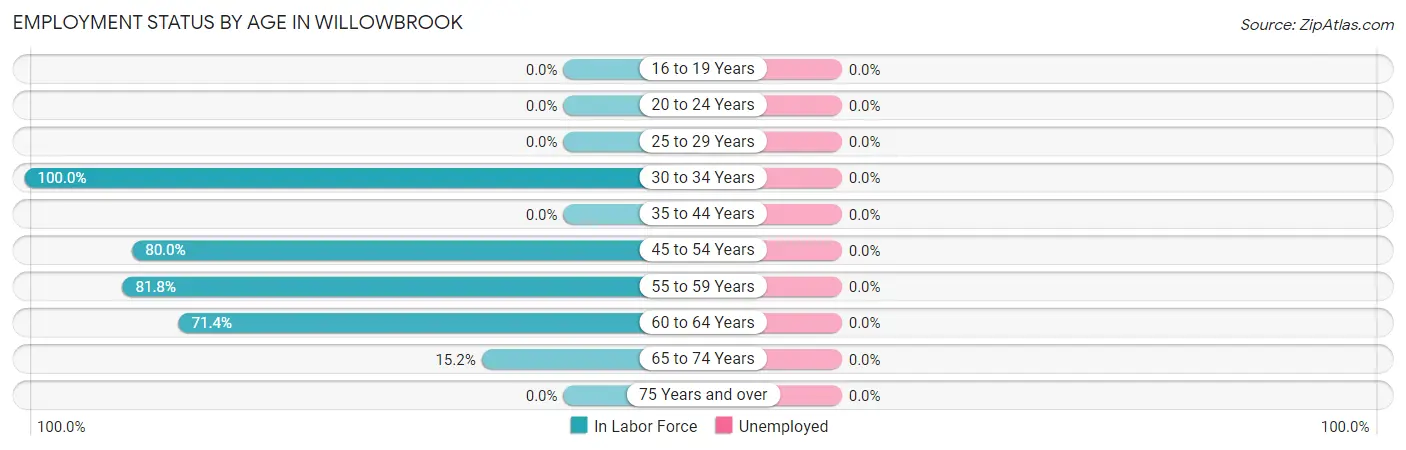
| Age Bracket | In Labor Force | Unemployed |
| 16 to 19 Years | 0 (0.0%) | 0 (0.0%) |
| 20 to 24 Years | 0 (0.0%) | 0 (0.0%) |
| 25 to 29 Years | 0 (0.0%) | 0 (0.0%) |
| 30 to 34 Years | 4 (100.0%) | 0 (0.0%) |
| 35 to 44 Years | 0 (0.0%) | 0 (0.0%) |
| 45 to 54 Years | 8 (80.0%) | 0 (0.0%) |
| 55 to 59 Years | 9 (81.8%) | 0 (0.0%) |
| 60 to 64 Years | 5 (71.4%) | 0 (0.0%) |
| 65 to 74 Years | 5 (15.2%) | 0 (0.0%) |
| 75 Years and over | 0 (0.0%) | 0 (0.0%) |
| Total | 31 (37.3%) | 0 (0.0%) |
Employment Status by Educational Attainment in Willowbrook
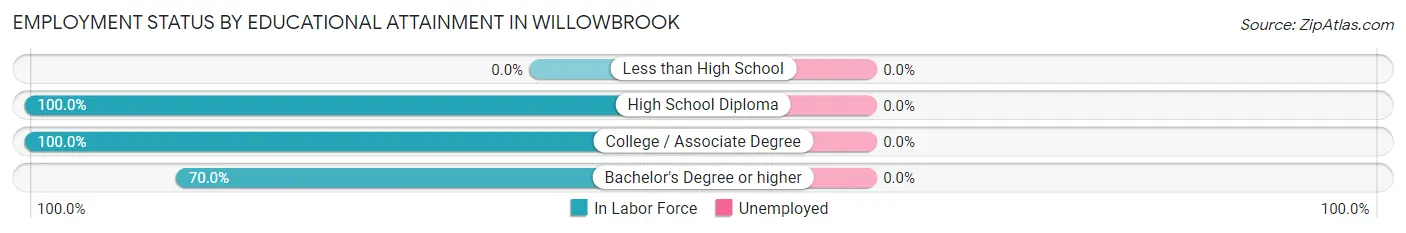
| Educational Attainment | In Labor Force | Unemployed |
| Less than High School | 0 (0.0%) | 0 (0.0%) |
| High School Diploma | 3 (100.0%) | 0 (0.0%) |
| College / Associate Degree | 9 (100.0%) | 0 (0.0%) |
| Bachelor's Degree or higher | 14 (70.0%) | 0 (0.0%) |
| Total | 26 (81.3%) | 0 (0.0%) |
Employment Occupations by Sex in Willowbrook
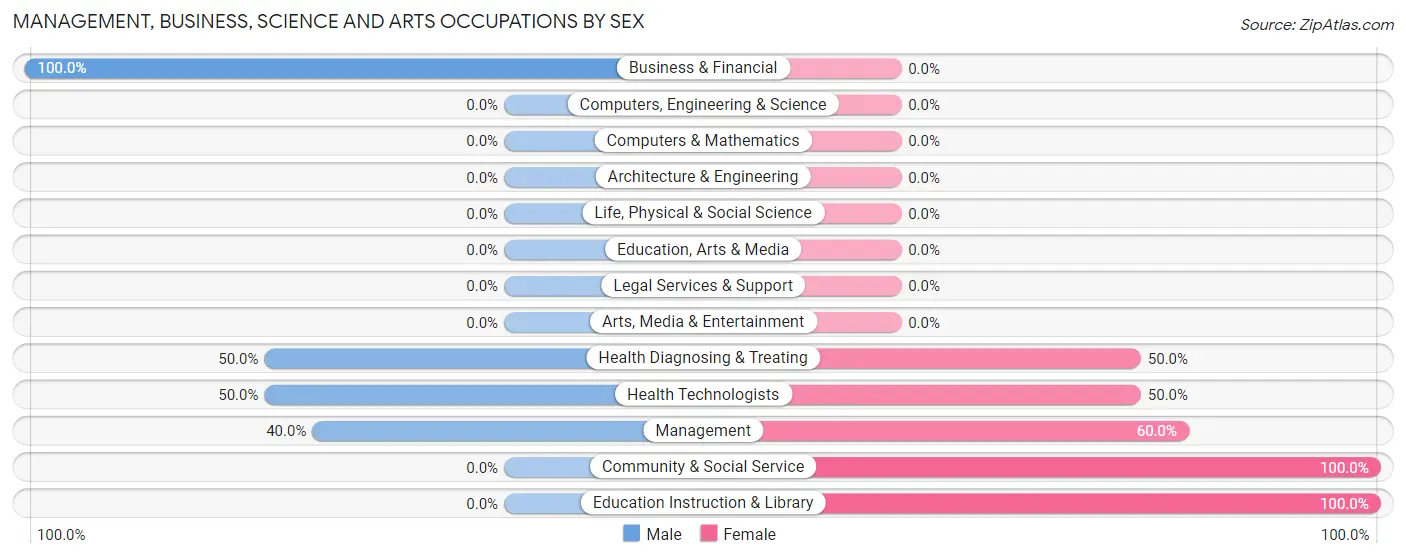
Management, Business, Science and Arts Occupations
The most common Management, Business, Science and Arts occupations in Willowbrook are Management (5 | 16.1%), Community & Social Service (4 | 12.9%), Education Instruction & Library (4 | 12.9%), Health Diagnosing & Treating (4 | 12.9%), and Health Technologists (4 | 12.9%).
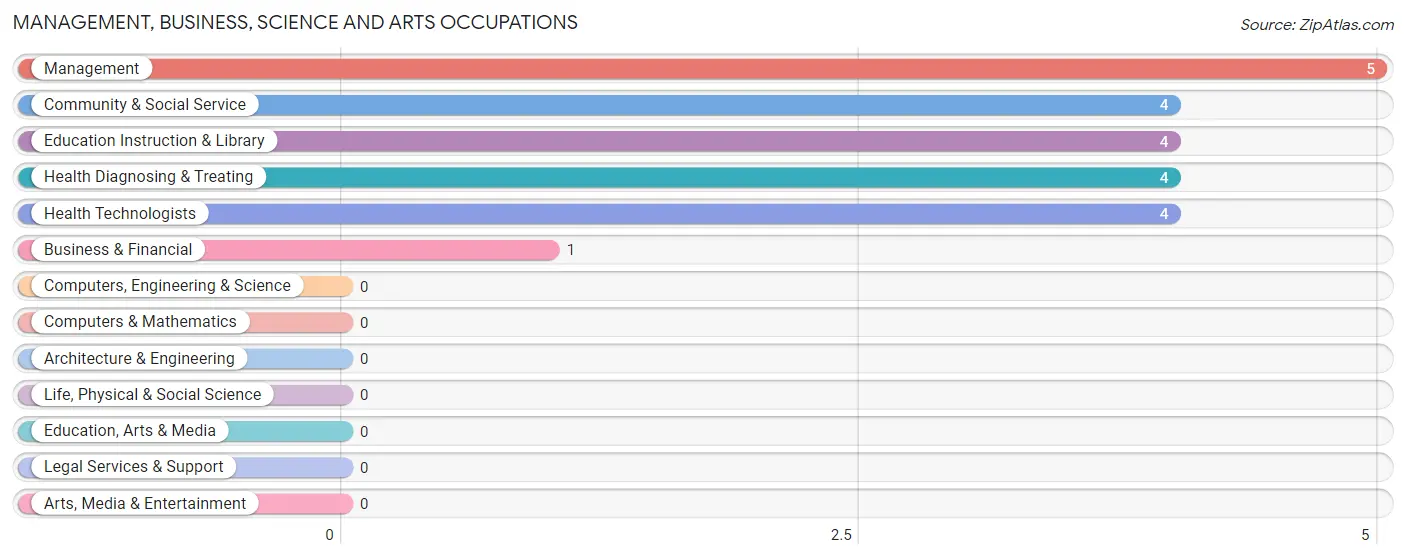
Management, Business, Science and Arts Occupations by Sex
Within the Management, Business, Science and Arts occupations in Willowbrook, the most male-oriented occupations are Business & Financial (100.0%), Health Diagnosing & Treating (50.0%), and Health Technologists (50.0%), while the most female-oriented occupations are Community & Social Service (100.0%), Education Instruction & Library (100.0%), and Management (60.0%).
| Occupation | Male | Female |
| Management | 2 (40.0%) | 3 (60.0%) |
| Business & Financial | 1 (100.0%) | 0 (0.0%) |
| Computers, Engineering & Science | 0 (0.0%) | 0 (0.0%) |
| Computers & Mathematics | 0 (0.0%) | 0 (0.0%) |
| Architecture & Engineering | 0 (0.0%) | 0 (0.0%) |
| Life, Physical & Social Science | 0 (0.0%) | 0 (0.0%) |
| Community & Social Service | 0 (0.0%) | 4 (100.0%) |
| Education, Arts & Media | 0 (0.0%) | 0 (0.0%) |
| Legal Services & Support | 0 (0.0%) | 0 (0.0%) |
| Education Instruction & Library | 0 (0.0%) | 4 (100.0%) |
| Arts, Media & Entertainment | 0 (0.0%) | 0 (0.0%) |
| Health Diagnosing & Treating | 2 (50.0%) | 2 (50.0%) |
| Health Technologists | 2 (50.0%) | 2 (50.0%) |
| Total (Category) | 5 (35.7%) | 9 (64.3%) |
| Total (Overall) | 18 (58.1%) | 13 (41.9%) |
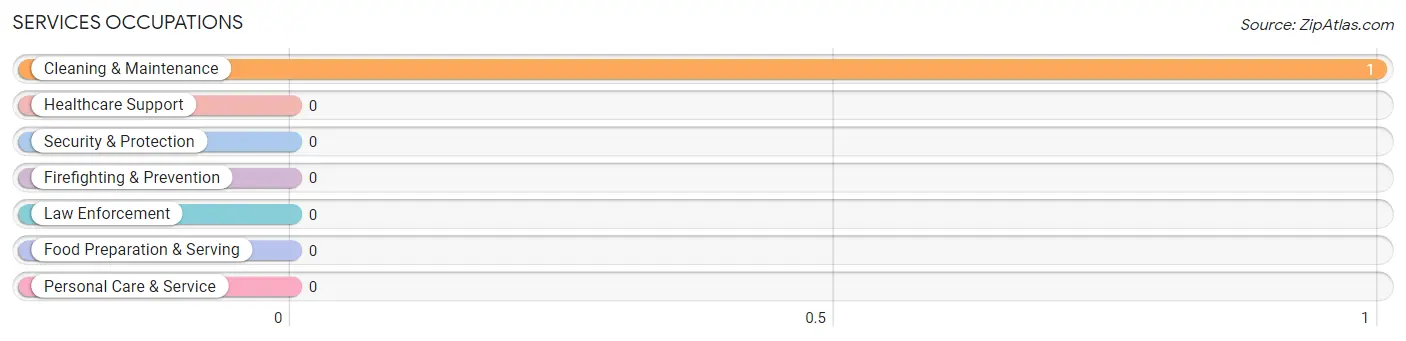
Services Occupations
The most common Services occupations in Willowbrook are , and Cleaning & Maintenance (1 | 3.2%).
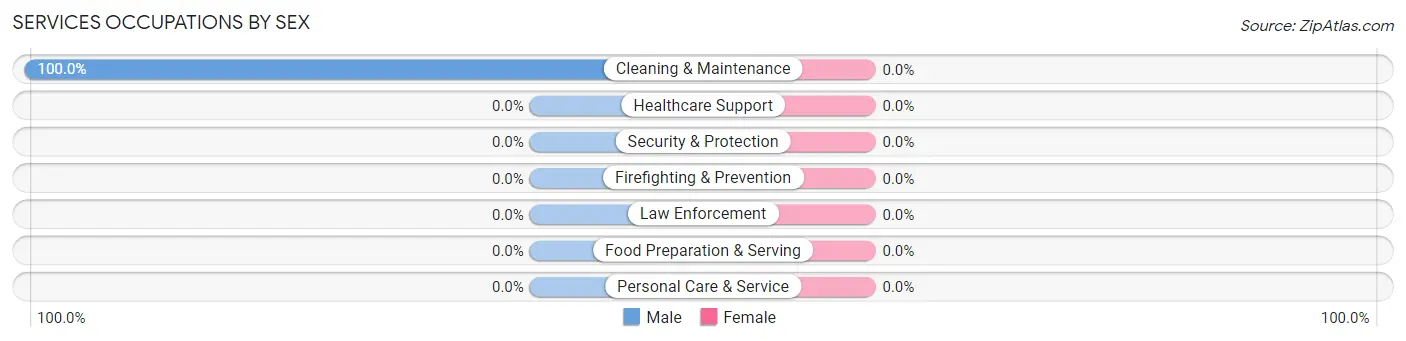
Services Occupations by Sex
| Occupation | Male | Female |
| Healthcare Support | 0 (0.0%) | 0 (0.0%) |
| Security & Protection | 0 (0.0%) | 0 (0.0%) |
| Firefighting & Prevention | 0 (0.0%) | 0 (0.0%) |
| Law Enforcement | 0 (0.0%) | 0 (0.0%) |
| Food Preparation & Serving | 0 (0.0%) | 0 (0.0%) |
| Cleaning & Maintenance | 1 (100.0%) | 0 (0.0%) |
| Personal Care & Service | 0 (0.0%) | 0 (0.0%) |
| Total (Category) | 1 (100.0%) | 0 (0.0%) |
| Total (Overall) | 18 (58.1%) | 13 (41.9%) |
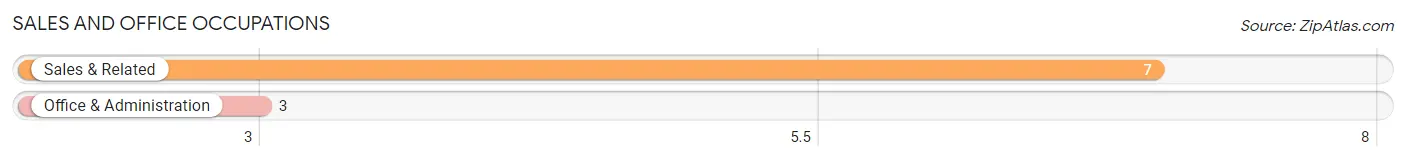
Sales and Office Occupations
The most common Sales and Office occupations in Willowbrook are Sales & Related (7 | 22.6%), and Office & Administration (3 | 9.7%).
Sales and Office Occupations by Sex

| Occupation | Male | Female |
| Sales & Related | 6 (85.7%) | 1 (14.3%) |
| Office & Administration | 0 (0.0%) | 3 (100.0%) |
| Total (Category) | 6 (60.0%) | 4 (40.0%) |
| Total (Overall) | 18 (58.1%) | 13 (41.9%) |
Natural Resources, Construction and Maintenance Occupations
The most common Natural Resources, Construction and Maintenance occupations in Willowbrook are , and Installation, Maintenance & Repair (2 | 6.5%).
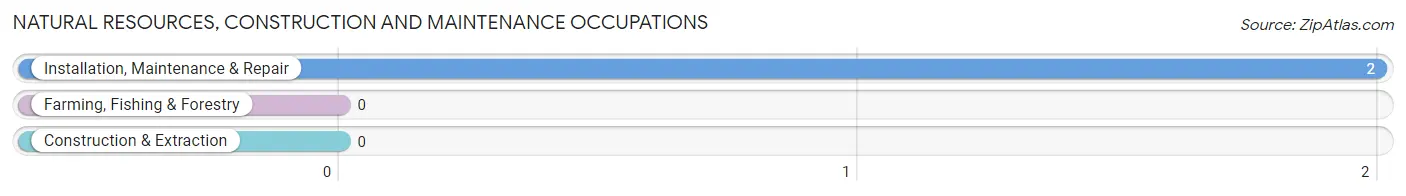
Natural Resources, Construction and Maintenance Occupations by Sex
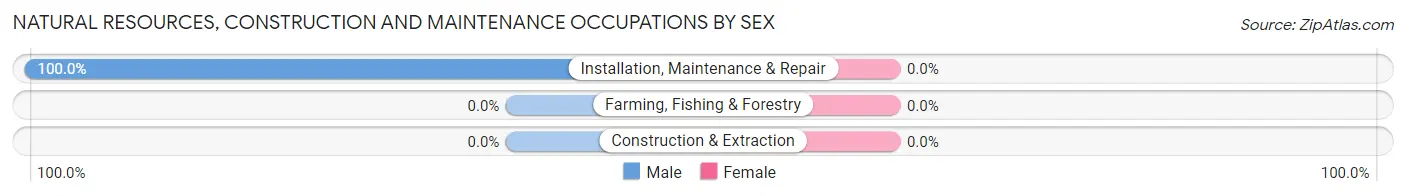
| Occupation | Male | Female |
| Farming, Fishing & Forestry | 0 (0.0%) | 0 (0.0%) |
| Construction & Extraction | 0 (0.0%) | 0 (0.0%) |
| Installation, Maintenance & Repair | 2 (100.0%) | 0 (0.0%) |
| Total (Category) | 2 (100.0%) | 0 (0.0%) |
| Total (Overall) | 18 (58.1%) | 13 (41.9%) |
Production, Transportation and Moving Occupations
The most common Production, Transportation and Moving occupations in Willowbrook are , and Production (4 | 12.9%).
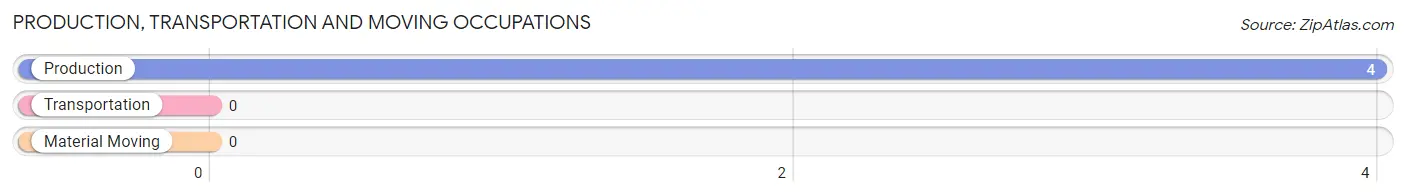
Production, Transportation and Moving Occupations by Sex
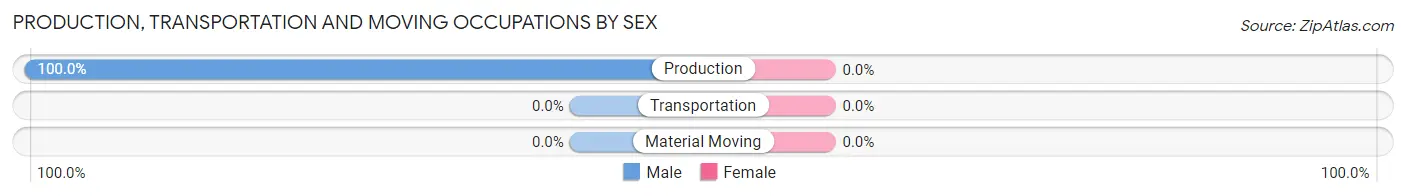
| Occupation | Male | Female |
| Production | 4 (100.0%) | 0 (0.0%) |
| Transportation | 0 (0.0%) | 0 (0.0%) |
| Material Moving | 0 (0.0%) | 0 (0.0%) |
| Total (Category) | 4 (100.0%) | 0 (0.0%) |
| Total (Overall) | 18 (58.1%) | 13 (41.9%) |
Employment Industries by Sex in Willowbrook
Employment Industries in Willowbrook
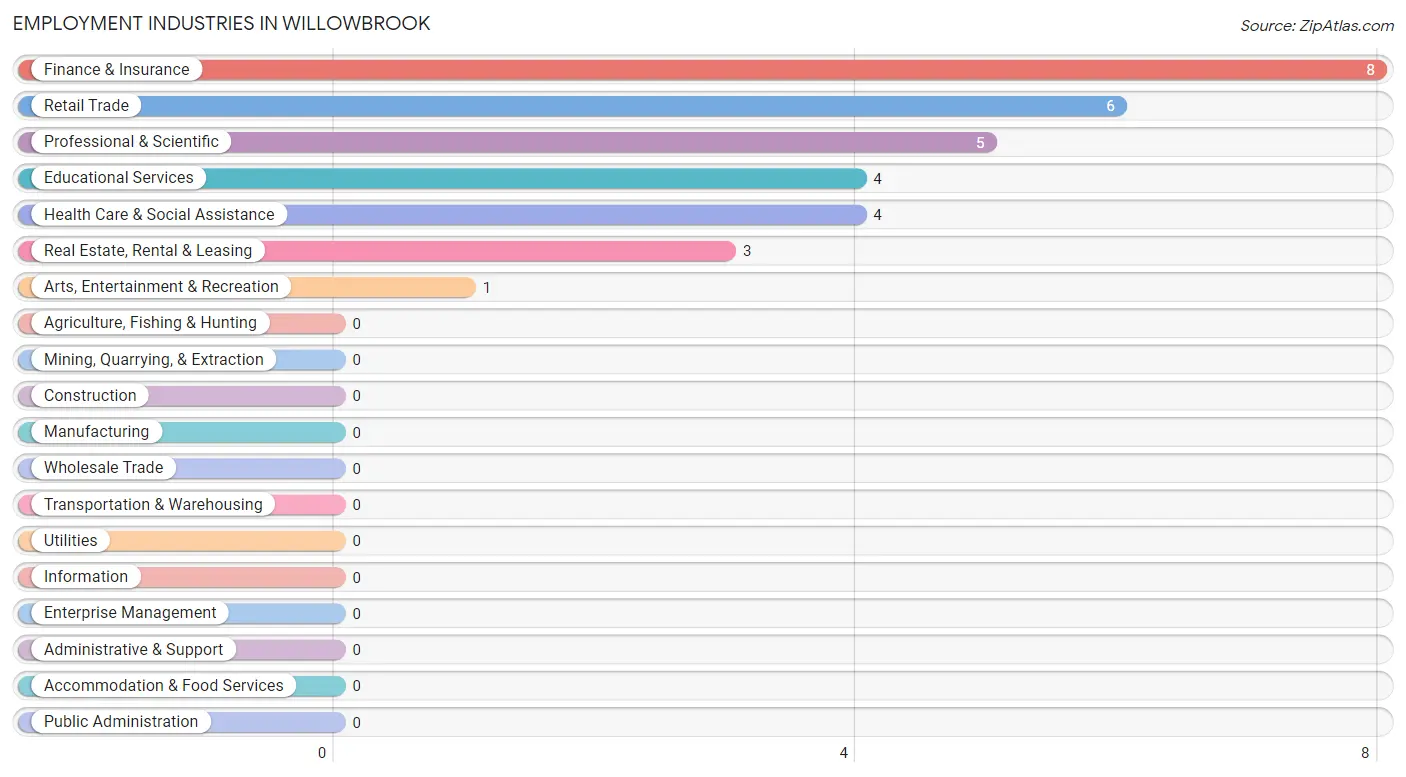
The major employment industries in Willowbrook include Finance & Insurance (8 | 25.8%), Retail Trade (6 | 19.4%), Professional & Scientific (5 | 16.1%), Educational Services (4 | 12.9%), and Health Care & Social Assistance (4 | 12.9%).
Employment Industries by Sex in Willowbrook
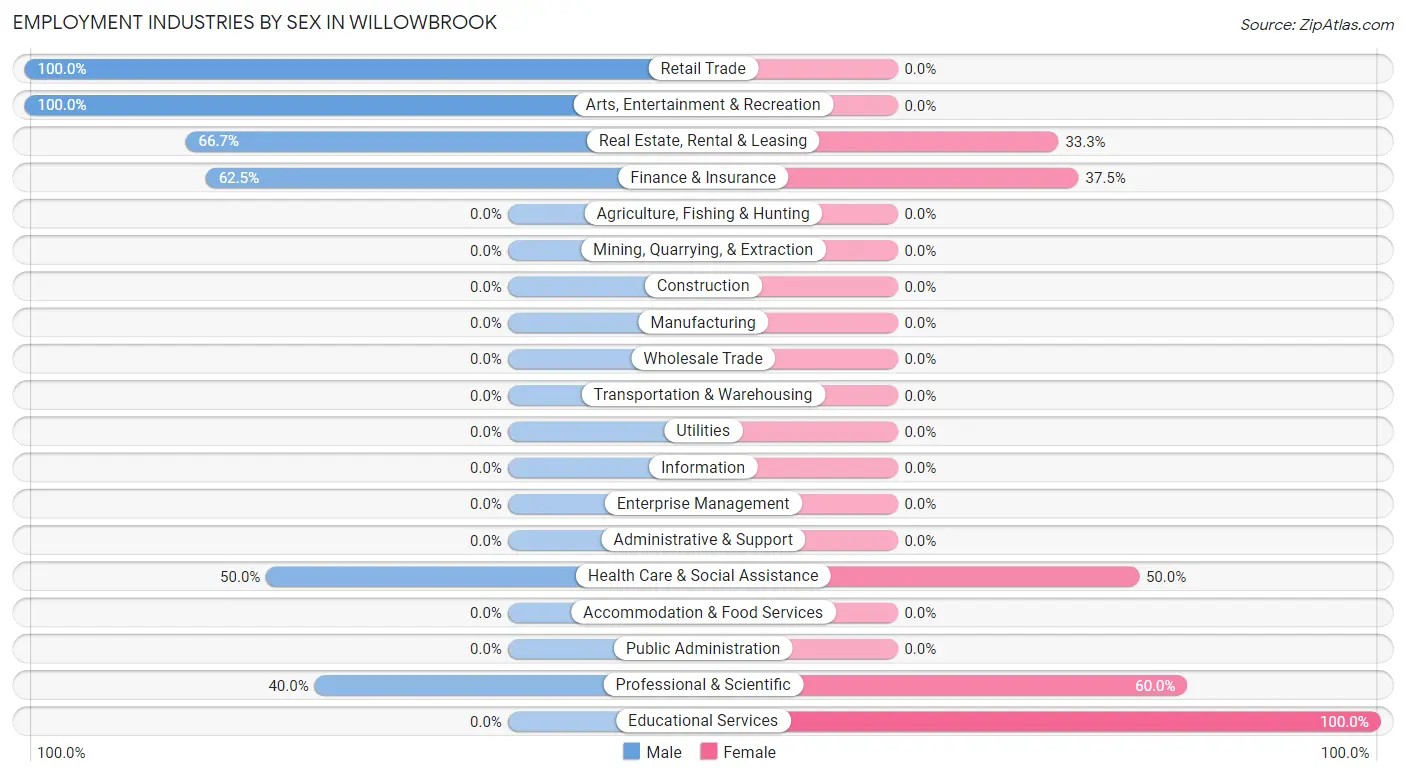
The Willowbrook industries that see more men than women are Retail Trade (100.0%), Arts, Entertainment & Recreation (100.0%), and Real Estate, Rental & Leasing (66.7%), whereas the industries that tend to have a higher number of women are Educational Services (100.0%), Professional & Scientific (60.0%), and Health Care & Social Assistance (50.0%).
| Industry | Male | Female |
| Agriculture, Fishing & Hunting | 0 (0.0%) | 0 (0.0%) |
| Mining, Quarrying, & Extraction | 0 (0.0%) | 0 (0.0%) |
| Construction | 0 (0.0%) | 0 (0.0%) |
| Manufacturing | 0 (0.0%) | 0 (0.0%) |
| Wholesale Trade | 0 (0.0%) | 0 (0.0%) |
| Retail Trade | 6 (100.0%) | 0 (0.0%) |
| Transportation & Warehousing | 0 (0.0%) | 0 (0.0%) |
| Utilities | 0 (0.0%) | 0 (0.0%) |
| Information | 0 (0.0%) | 0 (0.0%) |
| Finance & Insurance | 5 (62.5%) | 3 (37.5%) |
| Real Estate, Rental & Leasing | 2 (66.7%) | 1 (33.3%) |
| Professional & Scientific | 2 (40.0%) | 3 (60.0%) |
| Enterprise Management | 0 (0.0%) | 0 (0.0%) |
| Administrative & Support | 0 (0.0%) | 0 (0.0%) |
| Educational Services | 0 (0.0%) | 4 (100.0%) |
| Health Care & Social Assistance | 2 (50.0%) | 2 (50.0%) |
| Arts, Entertainment & Recreation | 1 (100.0%) | 0 (0.0%) |
| Accommodation & Food Services | 0 (0.0%) | 0 (0.0%) |
| Public Administration | 0 (0.0%) | 0 (0.0%) |
| Total | 18 (58.1%) | 13 (41.9%) |
Education in Willowbrook
School Enrollment in Willowbrook
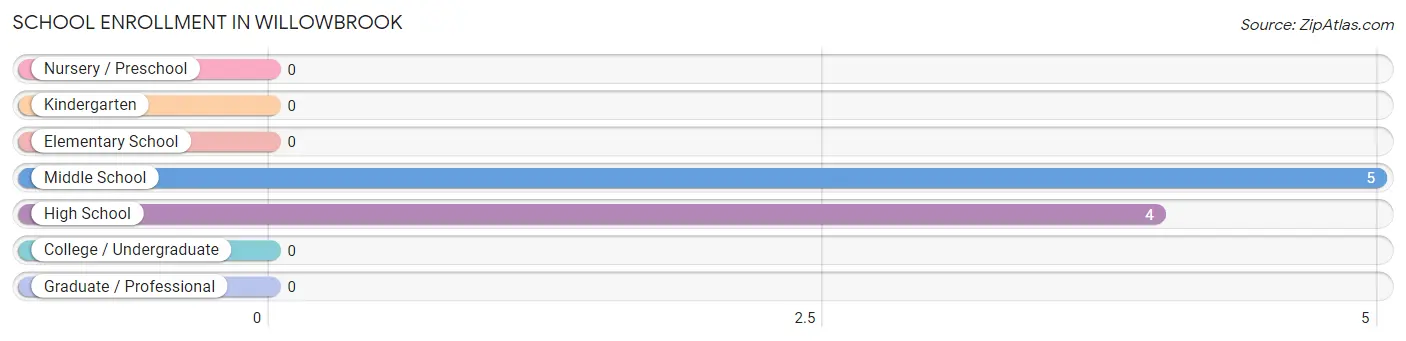
The most common levels of schooling among the 9 students in Willowbrook are middle school (5 | 55.6%), and high school (4 | 44.4%).
| School Level | # Students | % Students |
| Nursery / Preschool | 0 | 0.0% |
| Kindergarten | 0 | 0.0% |
| Elementary School | 0 | 0.0% |
| Middle School | 5 | 55.6% |
| High School | 4 | 44.4% |
| College / Undergraduate | 0 | 0.0% |
| Graduate / Professional | 0 | 0.0% |
| Total | 9 | 100.0% |
School Enrollment by Age by Funding Source in Willowbrook
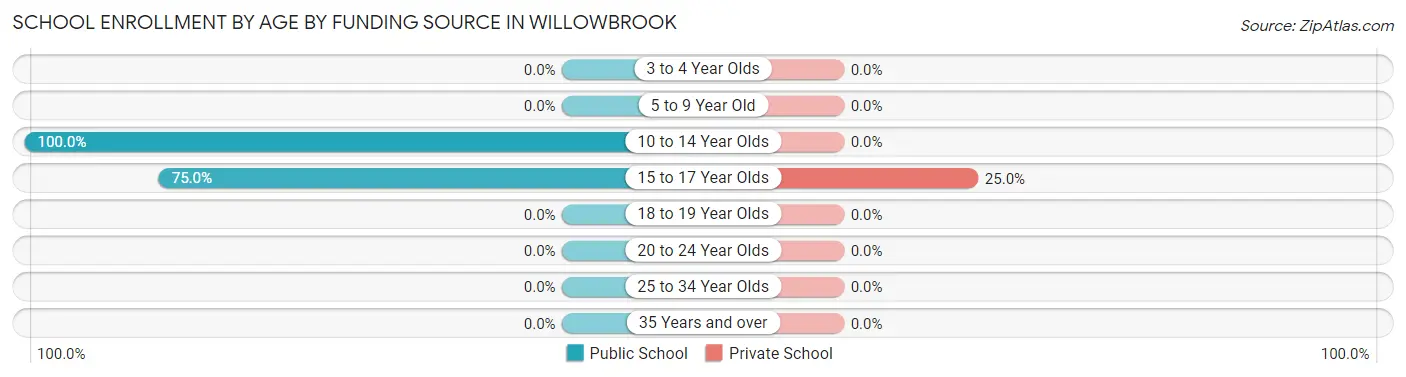
Out of a total of 9 students who are enrolled in schools in Willowbrook, 1 (11.1%) attend a private institution, while the remaining 8 (88.9%) are enrolled in public schools. The age group of 15 to 17 year olds has the highest likelihood of being enrolled in private schools, with 1 (25.0% in the age bracket) enrolled. Conversely, the age group of 10 to 14 year olds has the lowest likelihood of being enrolled in a private school, with 5 (100.0% in the age bracket) attending a public institution.
| Age Bracket | Public School | Private School |
| 3 to 4 Year Olds | 0 (0.0%) | 0 (0.0%) |
| 5 to 9 Year Old | 0 (0.0%) | 0 (0.0%) |
| 10 to 14 Year Olds | 5 (100.0%) | 0 (0.0%) |
| 15 to 17 Year Olds | 3 (75.0%) | 1 (25.0%) |
| 18 to 19 Year Olds | 0 (0.0%) | 0 (0.0%) |
| 20 to 24 Year Olds | 0 (0.0%) | 0 (0.0%) |
| 25 to 34 Year Olds | 0 (0.0%) | 0 (0.0%) |
| 35 Years and over | 0 (0.0%) | 0 (0.0%) |
| Total | 8 (88.9%) | 1 (11.1%) |
Educational Attainment by Field of Study in Willowbrook
Business (13 | 35.1%), education (5 | 13.5%), social sciences (4 | 10.8%), liberal arts & history (4 | 10.8%), and bio, nature & agricultural (3 | 8.1%) are the most common fields of study among 37 individuals in Willowbrook who have obtained a bachelor's degree or higher.
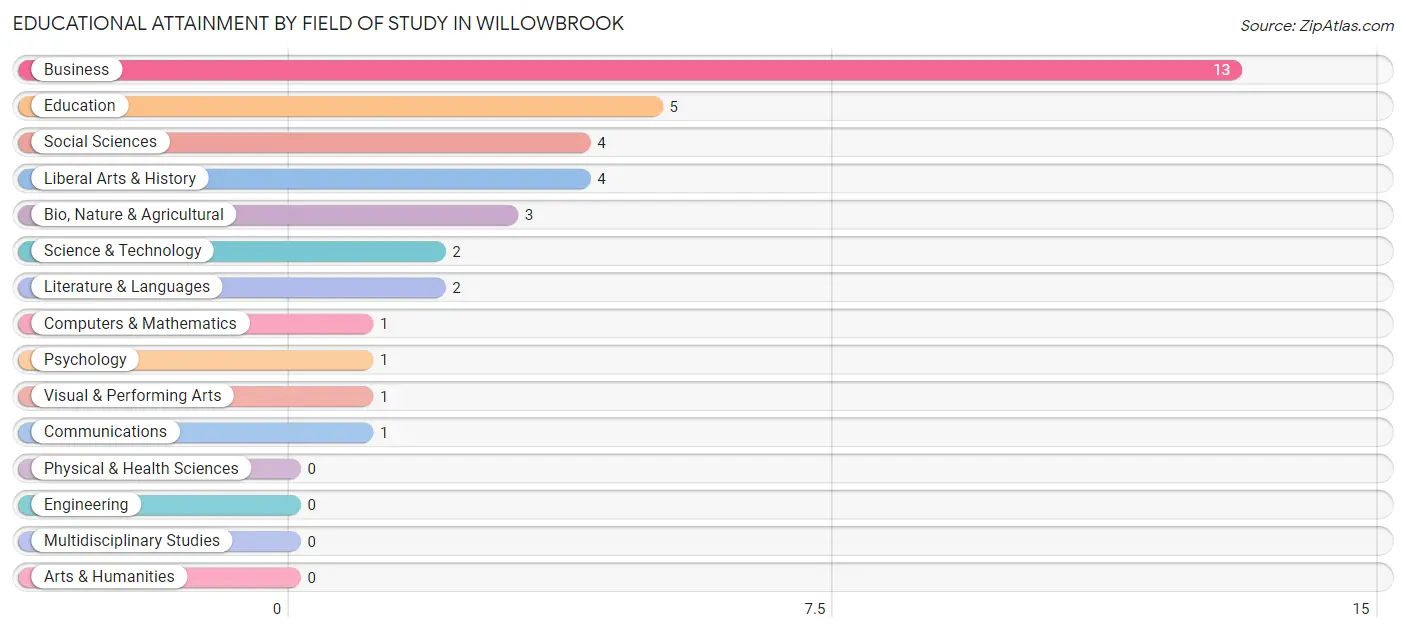
| Field of Study | # Graduates | % Graduates |
| Computers & Mathematics | 1 | 2.7% |
| Bio, Nature & Agricultural | 3 | 8.1% |
| Physical & Health Sciences | 0 | 0.0% |
| Psychology | 1 | 2.7% |
| Social Sciences | 4 | 10.8% |
| Engineering | 0 | 0.0% |
| Multidisciplinary Studies | 0 | 0.0% |
| Science & Technology | 2 | 5.4% |
| Business | 13 | 35.1% |
| Education | 5 | 13.5% |
| Literature & Languages | 2 | 5.4% |
| Liberal Arts & History | 4 | 10.8% |
| Visual & Performing Arts | 1 | 2.7% |
| Communications | 1 | 2.7% |
| Arts & Humanities | 0 | 0.0% |
| Total | 37 | 100.0% |
Transportation & Commute in Willowbrook
Vehicle Availability by Sex in Willowbrook
The most prevalent vehicle ownership categories in Willowbrook are males with 4 vehicles (7, accounting for 38.9%) and females with 4 vehicles (4, making up 63.6%).
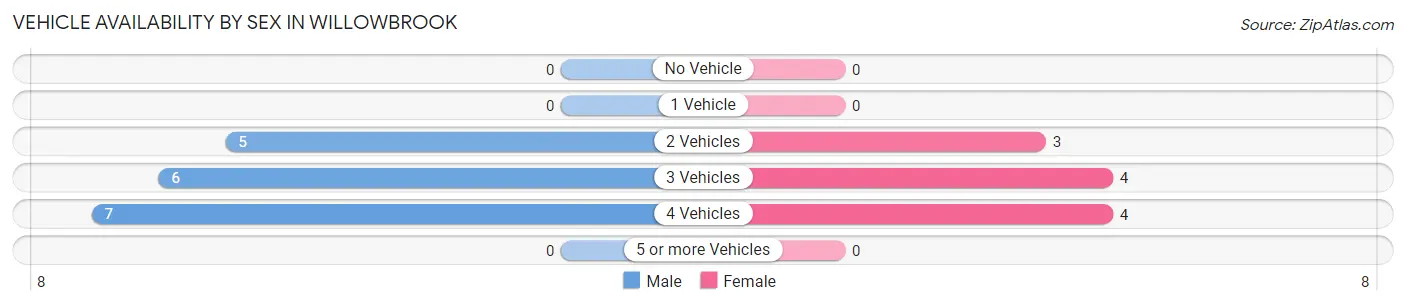
| Vehicles Available | Male | Female |
| No Vehicle | 0 (0.0%) | 0 (0.0%) |
| 1 Vehicle | 0 (0.0%) | 0 (0.0%) |
| 2 Vehicles | 5 (27.8%) | 3 (27.3%) |
| 3 Vehicles | 6 (33.3%) | 4 (36.4%) |
| 4 Vehicles | 7 (38.9%) | 4 (36.4%) |
| 5 or more Vehicles | 0 (0.0%) | 0 (0.0%) |
| Total | 18 (100.0%) | 11 (100.0%) |
Commute Time in Willowbrook
The most frequently occuring commute durations in Willowbrook are 15 to 19 minutes (14 commuters, 48.3%), 10 to 14 minutes (10 commuters, 34.5%), and 5 to 9 minutes (3 commuters, 10.3%).
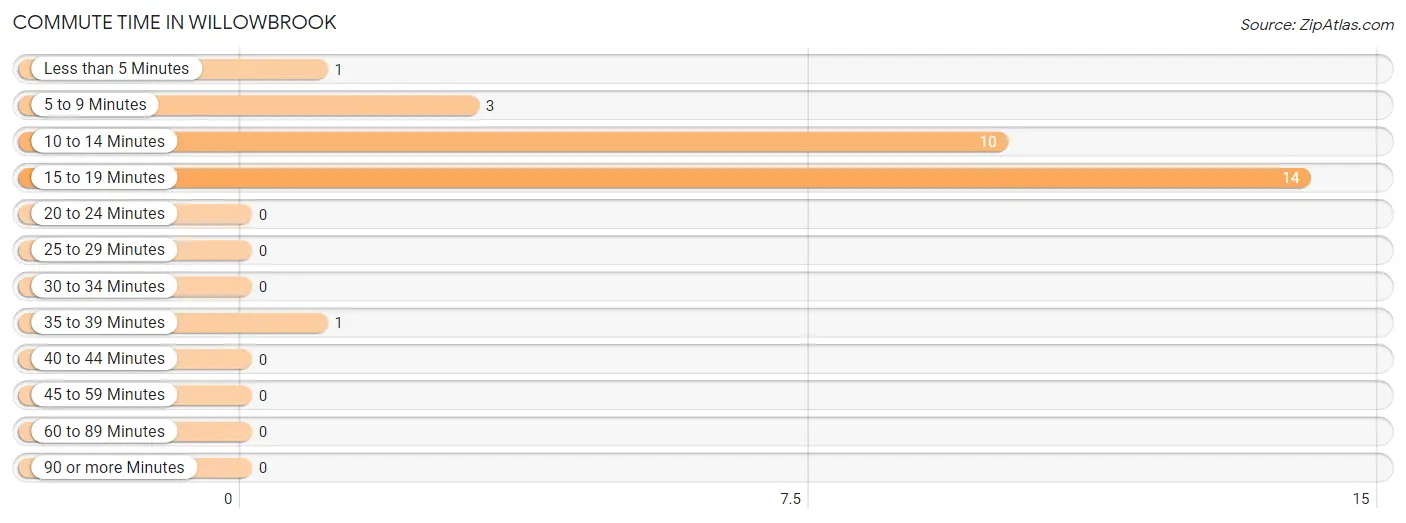
| Commute Time | # Commuters | % Commuters |
| Less than 5 Minutes | 1 | 3.5% |
| 5 to 9 Minutes | 3 | 10.3% |
| 10 to 14 Minutes | 10 | 34.5% |
| 15 to 19 Minutes | 14 | 48.3% |
| 20 to 24 Minutes | 0 | 0.0% |
| 25 to 29 Minutes | 0 | 0.0% |
| 30 to 34 Minutes | 0 | 0.0% |
| 35 to 39 Minutes | 1 | 3.5% |
| 40 to 44 Minutes | 0 | 0.0% |
| 45 to 59 Minutes | 0 | 0.0% |
| 60 to 89 Minutes | 0 | 0.0% |
| 90 or more Minutes | 0 | 0.0% |
Commute Time by Sex in Willowbrook
The most common commute times in Willowbrook are 15 to 19 minutes (8 commuters, 44.4%) for males and 15 to 19 minutes (6 commuters, 54.5%) for females.
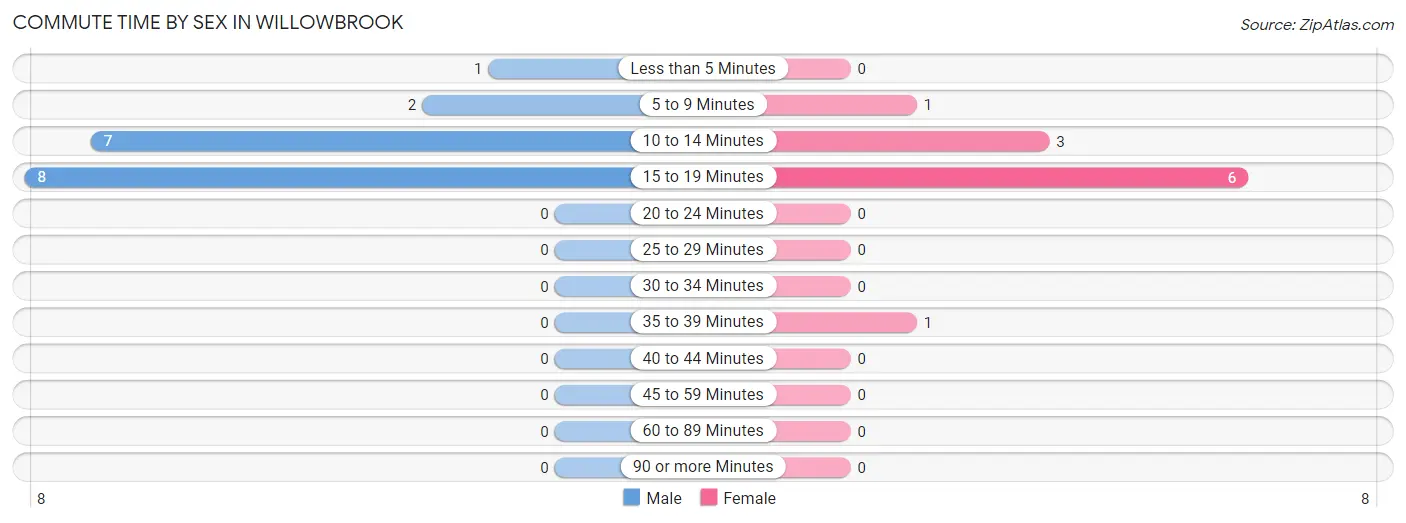
| Commute Time | Male | Female |
| Less than 5 Minutes | 1 (5.6%) | 0 (0.0%) |
| 5 to 9 Minutes | 2 (11.1%) | 1 (9.1%) |
| 10 to 14 Minutes | 7 (38.9%) | 3 (27.3%) |
| 15 to 19 Minutes | 8 (44.4%) | 6 (54.5%) |
| 20 to 24 Minutes | 0 (0.0%) | 0 (0.0%) |
| 25 to 29 Minutes | 0 (0.0%) | 0 (0.0%) |
| 30 to 34 Minutes | 0 (0.0%) | 0 (0.0%) |
| 35 to 39 Minutes | 0 (0.0%) | 1 (9.1%) |
| 40 to 44 Minutes | 0 (0.0%) | 0 (0.0%) |
| 45 to 59 Minutes | 0 (0.0%) | 0 (0.0%) |
| 60 to 89 Minutes | 0 (0.0%) | 0 (0.0%) |
| 90 or more Minutes | 0 (0.0%) | 0 (0.0%) |
Time of Departure to Work by Sex in Willowbrook
The most frequent times of departure to work in Willowbrook are 7:00 AM to 7:29 AM (4, 22.2%) for males and 7:00 AM to 7:29 AM (5, 45.5%) for females.
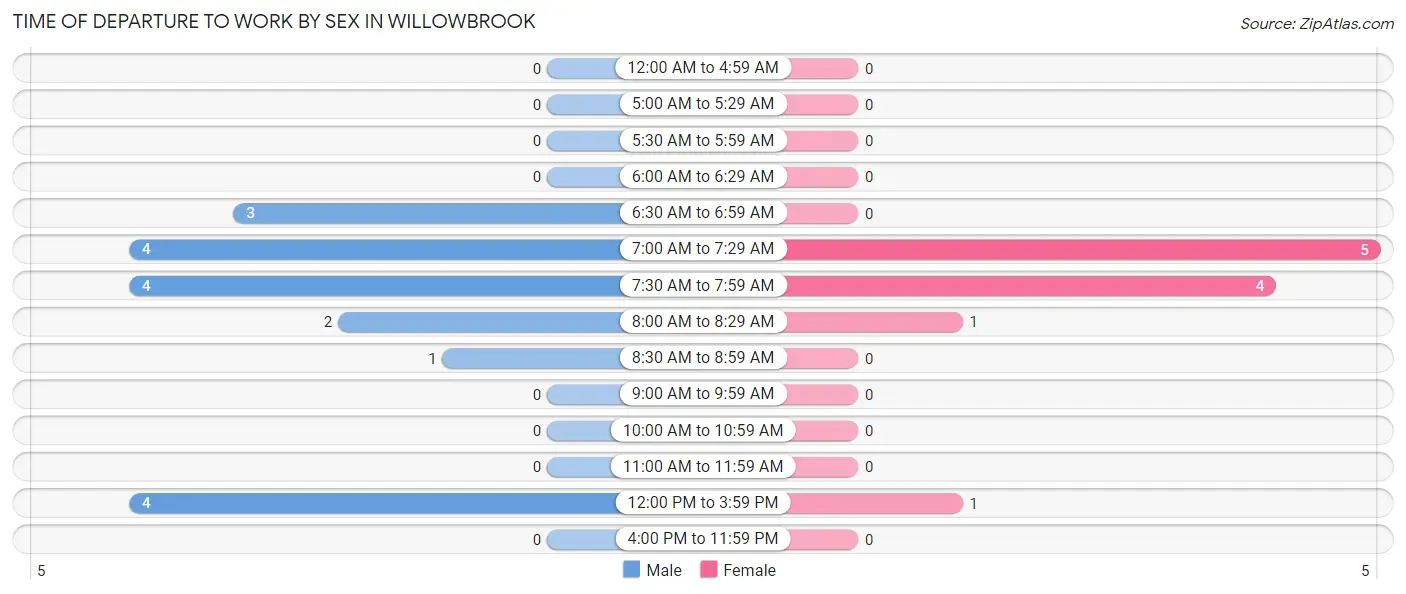
| Time of Departure | Male | Female |
| 12:00 AM to 4:59 AM | 0 (0.0%) | 0 (0.0%) |
| 5:00 AM to 5:29 AM | 0 (0.0%) | 0 (0.0%) |
| 5:30 AM to 5:59 AM | 0 (0.0%) | 0 (0.0%) |
| 6:00 AM to 6:29 AM | 0 (0.0%) | 0 (0.0%) |
| 6:30 AM to 6:59 AM | 3 (16.7%) | 0 (0.0%) |
| 7:00 AM to 7:29 AM | 4 (22.2%) | 5 (45.5%) |
| 7:30 AM to 7:59 AM | 4 (22.2%) | 4 (36.4%) |
| 8:00 AM to 8:29 AM | 2 (11.1%) | 1 (9.1%) |
| 8:30 AM to 8:59 AM | 1 (5.6%) | 0 (0.0%) |
| 9:00 AM to 9:59 AM | 0 (0.0%) | 0 (0.0%) |
| 10:00 AM to 10:59 AM | 0 (0.0%) | 0 (0.0%) |
| 11:00 AM to 11:59 AM | 0 (0.0%) | 0 (0.0%) |
| 12:00 PM to 3:59 PM | 4 (22.2%) | 1 (9.1%) |
| 4:00 PM to 11:59 PM | 0 (0.0%) | 0 (0.0%) |
| Total | 18 (100.0%) | 11 (100.0%) |
Housing Occupancy in Willowbrook
Occupancy by Ownership in Willowbrook
Of the total 29 dwellings in Willowbrook, owner-occupied units account for 28 (96.6%), while renter-occupied units make up 1 (3.5%).
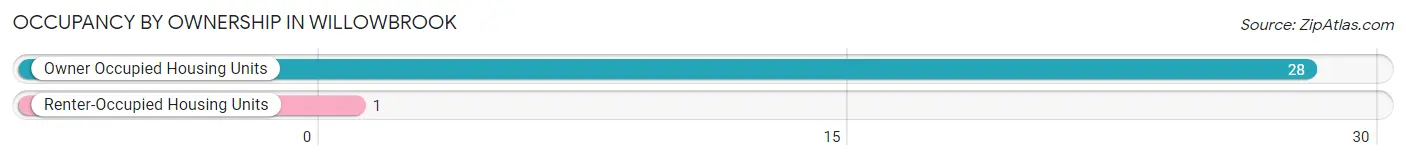
| Occupancy | # Housing Units | % Housing Units |
| Owner Occupied Housing Units | 28 | 96.6% |
| Renter-Occupied Housing Units | 1 | 3.5% |
| Total Occupied Housing Units | 29 | 100.0% |
Occupancy by Household Size in Willowbrook
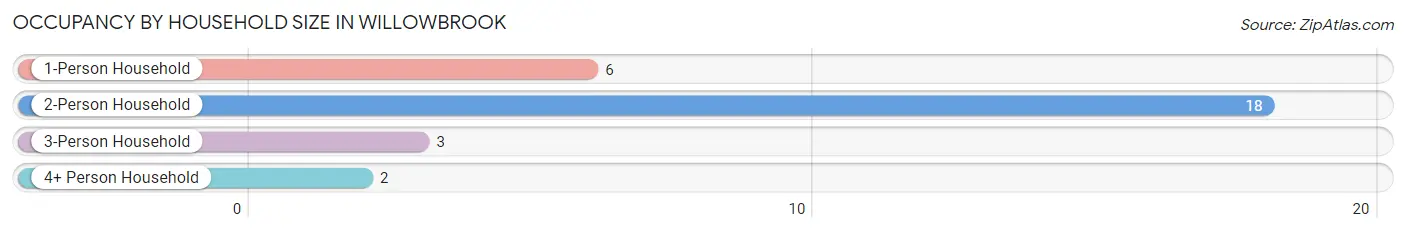
| Household Size | # Housing Units | % Housing Units |
| 1-Person Household | 6 | 20.7% |
| 2-Person Household | 18 | 62.1% |
| 3-Person Household | 3 | 10.3% |
| 4+ Person Household | 2 | 6.9% |
| Total Housing Units | 29 | 100.0% |
Occupancy by Ownership by Household Size in Willowbrook
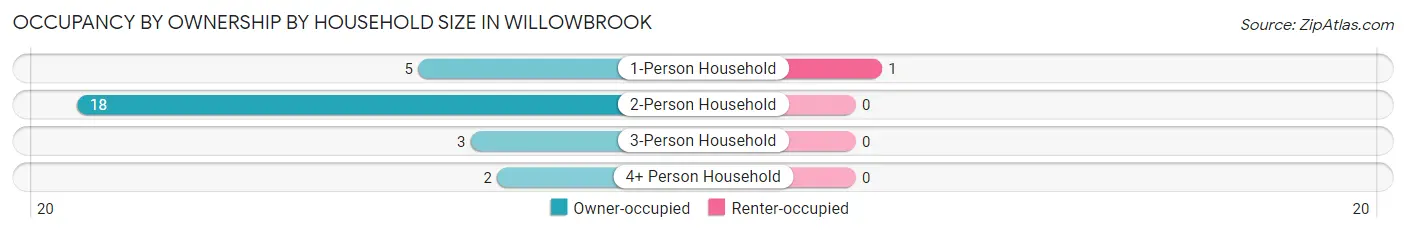
| Household Size | Owner-occupied | Renter-occupied |
| 1-Person Household | 5 (83.3%) | 1 (16.7%) |
| 2-Person Household | 18 (100.0%) | 0 (0.0%) |
| 3-Person Household | 3 (100.0%) | 0 (0.0%) |
| 4+ Person Household | 2 (100.0%) | 0 (0.0%) |
| Total Housing Units | 28 (96.6%) | 1 (3.5%) |
Occupancy by Educational Attainment in Willowbrook
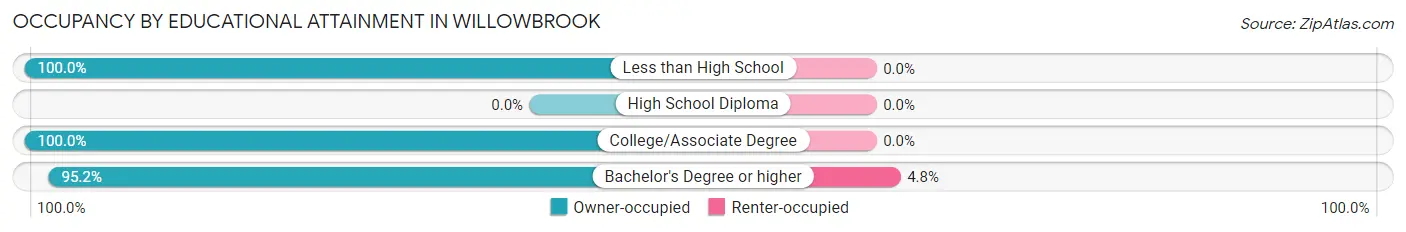
| Household Size | Owner-occupied | Renter-occupied |
| Less than High School | 2 (100.0%) | 0 (0.0%) |
| High School Diploma | 0 (0.0%) | 0 (0.0%) |
| College/Associate Degree | 6 (100.0%) | 0 (0.0%) |
| Bachelor's Degree or higher | 20 (95.2%) | 1 (4.8%) |
Occupancy by Age of Householder in Willowbrook
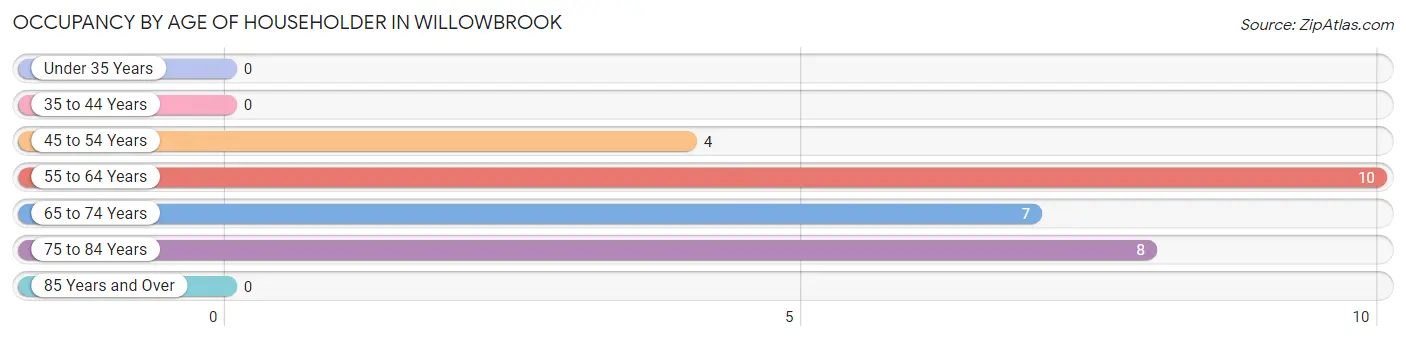
| Age Bracket | # Households | % Households |
| Under 35 Years | 0 | 0.0% |
| 35 to 44 Years | 0 | 0.0% |
| 45 to 54 Years | 4 | 13.8% |
| 55 to 64 Years | 10 | 34.5% |
| 65 to 74 Years | 7 | 24.1% |
| 75 to 84 Years | 8 | 27.6% |
| 85 Years and Over | 0 | 0.0% |
| Total | 29 | 100.0% |
Housing Finances in Willowbrook
Median Income by Occupancy in Willowbrook
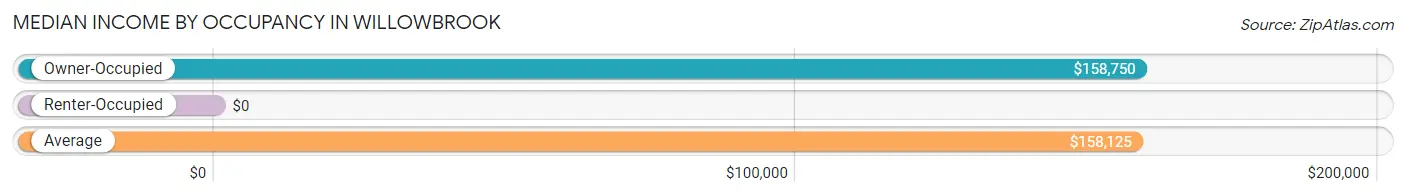
| Occupancy Type | # Households | Median Income |
| Owner-Occupied | 28 (96.6%) | $158,750 |
| Renter-Occupied | 1 (3.5%) | $0 |
| Average | 29 (100.0%) | $158,125 |
Occupancy by Householder Income Bracket in Willowbrook
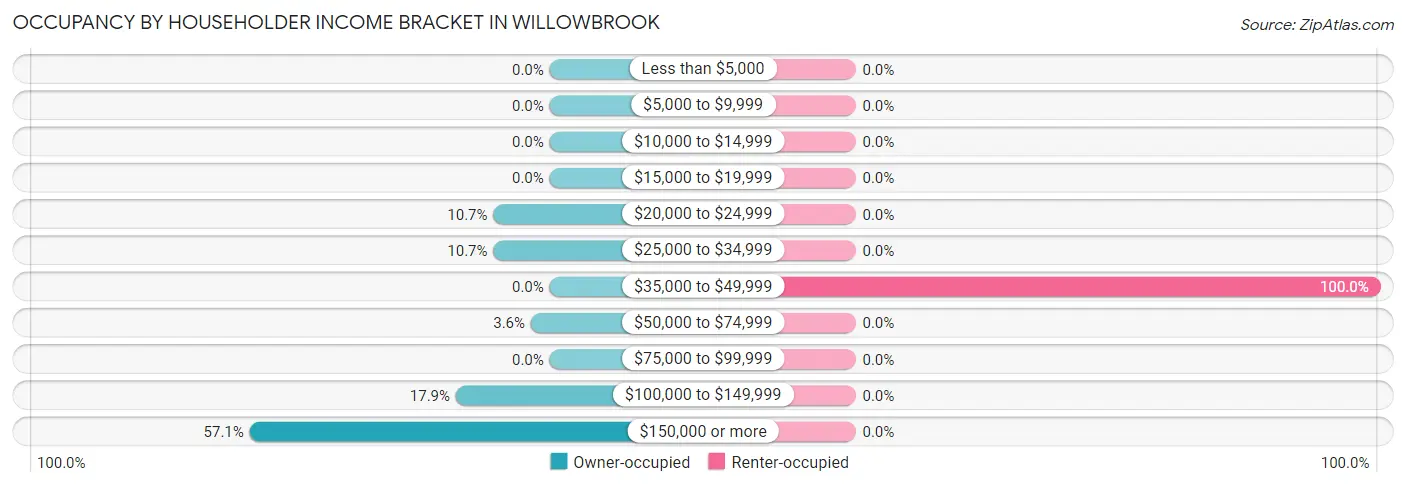
| Income Bracket | Owner-occupied | Renter-occupied |
| Less than $5,000 | 0 (0.0%) | 0 (0.0%) |
| $5,000 to $9,999 | 0 (0.0%) | 0 (0.0%) |
| $10,000 to $14,999 | 0 (0.0%) | 0 (0.0%) |
| $15,000 to $19,999 | 0 (0.0%) | 0 (0.0%) |
| $20,000 to $24,999 | 3 (10.7%) | 0 (0.0%) |
| $25,000 to $34,999 | 3 (10.7%) | 0 (0.0%) |
| $35,000 to $49,999 | 0 (0.0%) | 1 (100.0%) |
| $50,000 to $74,999 | 1 (3.6%) | 0 (0.0%) |
| $75,000 to $99,999 | 0 (0.0%) | 0 (0.0%) |
| $100,000 to $149,999 | 5 (17.9%) | 0 (0.0%) |
| $150,000 or more | 16 (57.1%) | 0 (0.0%) |
| Total | 28 (100.0%) | 1 (100.0%) |
Monthly Housing Cost Tiers in Willowbrook
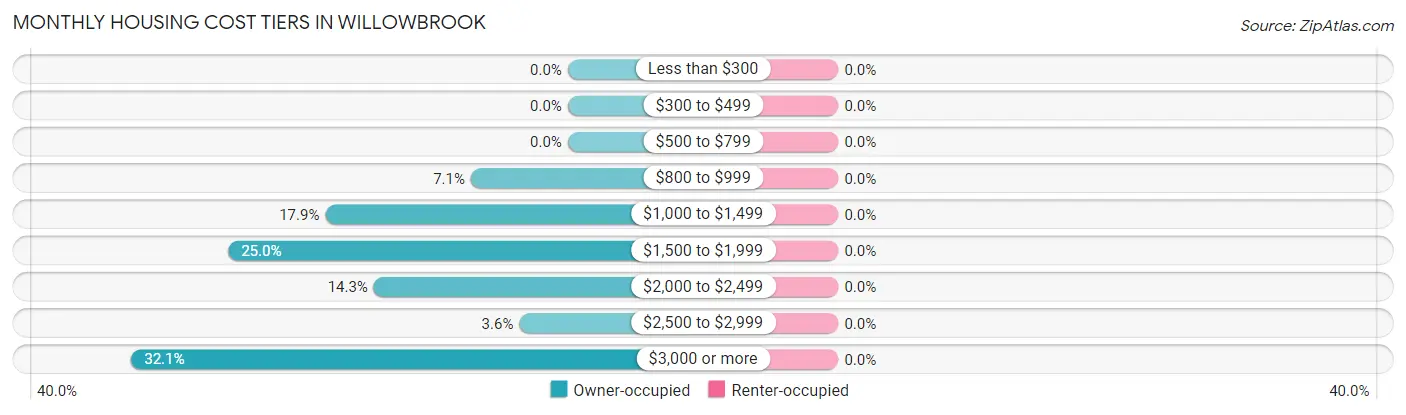
| Monthly Cost | Owner-occupied | Renter-occupied |
| Less than $300 | 0 (0.0%) | 0 (0.0%) |
| $300 to $499 | 0 (0.0%) | 0 (0.0%) |
| $500 to $799 | 0 (0.0%) | 0 (0.0%) |
| $800 to $999 | 2 (7.1%) | 0 (0.0%) |
| $1,000 to $1,499 | 5 (17.9%) | 0 (0.0%) |
| $1,500 to $1,999 | 7 (25.0%) | 0 (0.0%) |
| $2,000 to $2,499 | 4 (14.3%) | 0 (0.0%) |
| $2,500 to $2,999 | 1 (3.6%) | 0 (0.0%) |
| $3,000 or more | 9 (32.1%) | 0 (0.0%) |
| Total | 28 (100.0%) | 1 (100.0%) |
Physical Housing Characteristics in Willowbrook
Housing Structures in Willowbrook
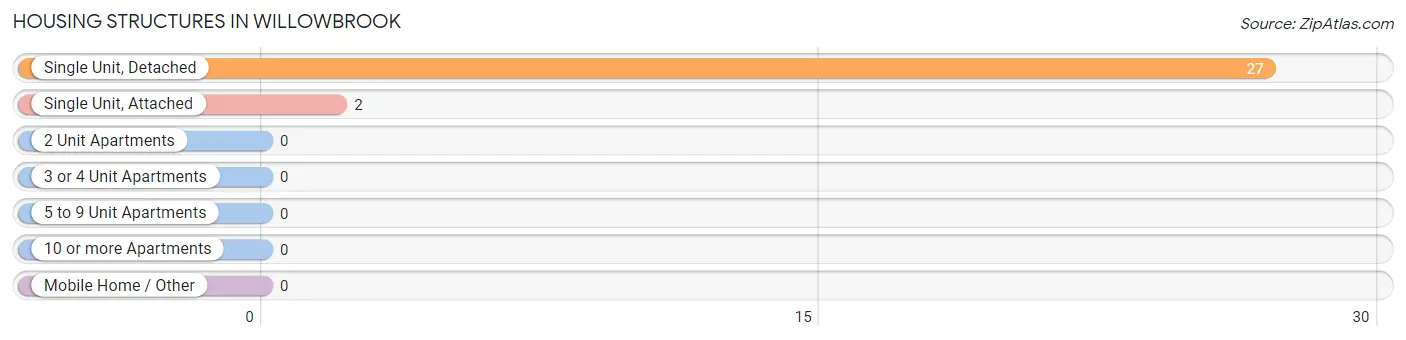
| Structure Type | # Housing Units | % Housing Units |
| Single Unit, Detached | 27 | 93.1% |
| Single Unit, Attached | 2 | 6.9% |
| 2 Unit Apartments | 0 | 0.0% |
| 3 or 4 Unit Apartments | 0 | 0.0% |
| 5 to 9 Unit Apartments | 0 | 0.0% |
| 10 or more Apartments | 0 | 0.0% |
| Mobile Home / Other | 0 | 0.0% |
| Total | 29 | 100.0% |
Housing Structures by Occupancy in Willowbrook
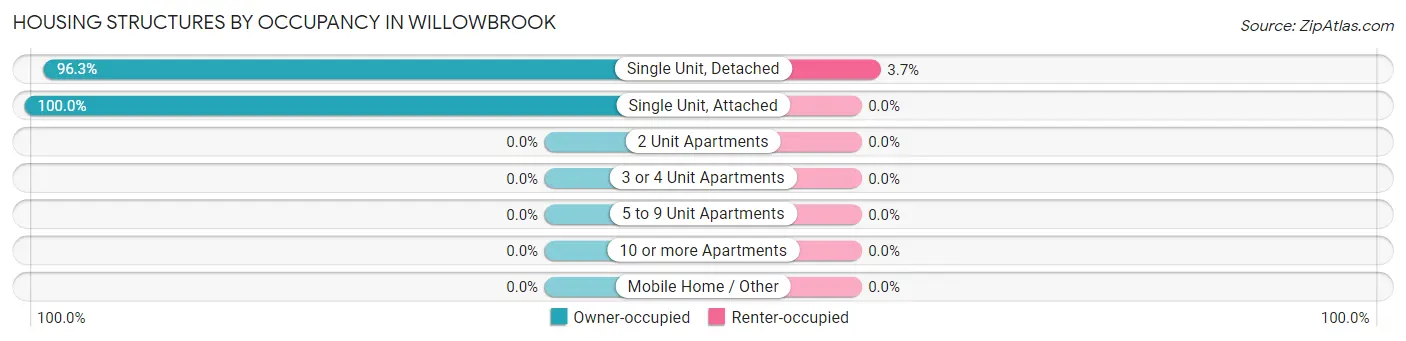
| Structure Type | Owner-occupied | Renter-occupied |
| Single Unit, Detached | 26 (96.3%) | 1 (3.7%) |
| Single Unit, Attached | 2 (100.0%) | 0 (0.0%) |
| 2 Unit Apartments | 0 (0.0%) | 0 (0.0%) |
| 3 or 4 Unit Apartments | 0 (0.0%) | 0 (0.0%) |
| 5 to 9 Unit Apartments | 0 (0.0%) | 0 (0.0%) |
| 10 or more Apartments | 0 (0.0%) | 0 (0.0%) |
| Mobile Home / Other | 0 (0.0%) | 0 (0.0%) |
| Total | 28 (96.6%) | 1 (3.5%) |
Housing Structures by Number of Rooms in Willowbrook
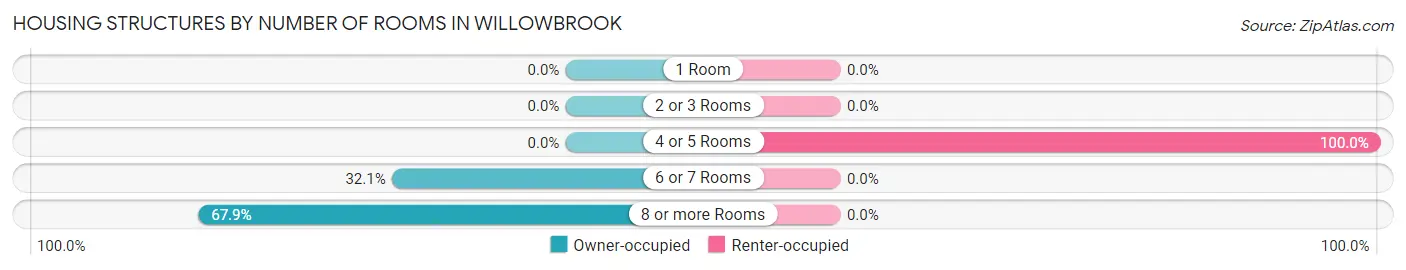
| Number of Rooms | Owner-occupied | Renter-occupied |
| 1 Room | 0 (0.0%) | 0 (0.0%) |
| 2 or 3 Rooms | 0 (0.0%) | 0 (0.0%) |
| 4 or 5 Rooms | 0 (0.0%) | 1 (100.0%) |
| 6 or 7 Rooms | 9 (32.1%) | 0 (0.0%) |
| 8 or more Rooms | 19 (67.9%) | 0 (0.0%) |
| Total | 28 (100.0%) | 1 (100.0%) |
Housing Structure by Heating Type in Willowbrook
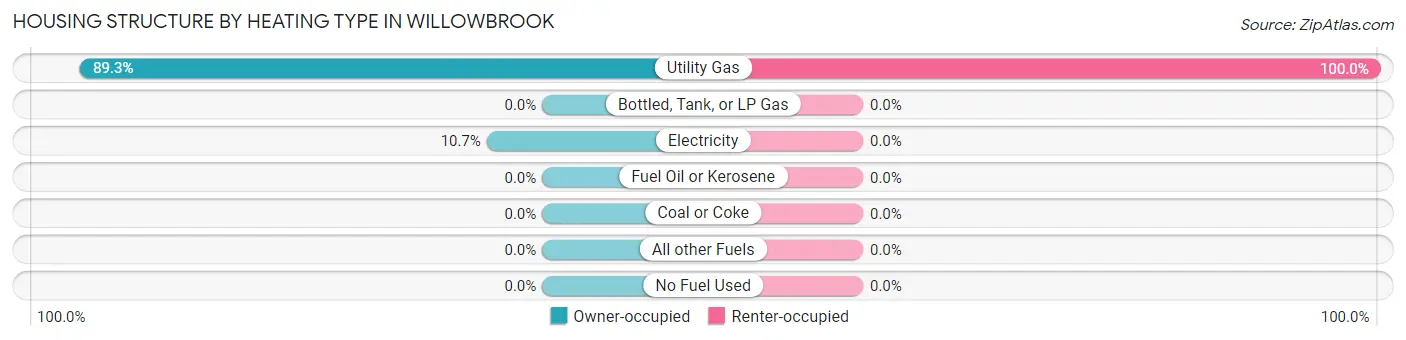
| Heating Type | Owner-occupied | Renter-occupied |
| Utility Gas | 25 (89.3%) | 1 (100.0%) |
| Bottled, Tank, or LP Gas | 0 (0.0%) | 0 (0.0%) |
| Electricity | 3 (10.7%) | 0 (0.0%) |
| Fuel Oil or Kerosene | 0 (0.0%) | 0 (0.0%) |
| Coal or Coke | 0 (0.0%) | 0 (0.0%) |
| All other Fuels | 0 (0.0%) | 0 (0.0%) |
| No Fuel Used | 0 (0.0%) | 0 (0.0%) |
| Total | 28 (100.0%) | 1 (100.0%) |
Household Vehicle Usage in Willowbrook
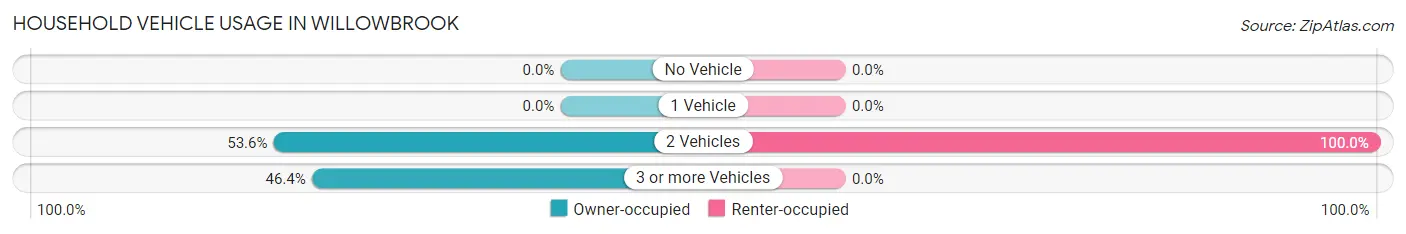
| Vehicles per Household | Owner-occupied | Renter-occupied |
| No Vehicle | 0 (0.0%) | 0 (0.0%) |
| 1 Vehicle | 0 (0.0%) | 0 (0.0%) |
| 2 Vehicles | 15 (53.6%) | 1 (100.0%) |
| 3 or more Vehicles | 13 (46.4%) | 0 (0.0%) |
| Total | 28 (100.0%) | 1 (100.0%) |
Real Estate & Mortgages in Willowbrook
Real Estate and Mortgage Overview in Willowbrook
| Characteristic | Without Mortgage | With Mortgage |
| Housing Units | 15 | 13 |
| Median Property Value | $437,500 | $475,000 |
| Median Household Income | $153,750 | $8 |
| Monthly Housing Costs | $1,501 | $9 |
| Real Estate Taxes | $10,001 | $0 |
Property Value by Mortgage Status in Willowbrook
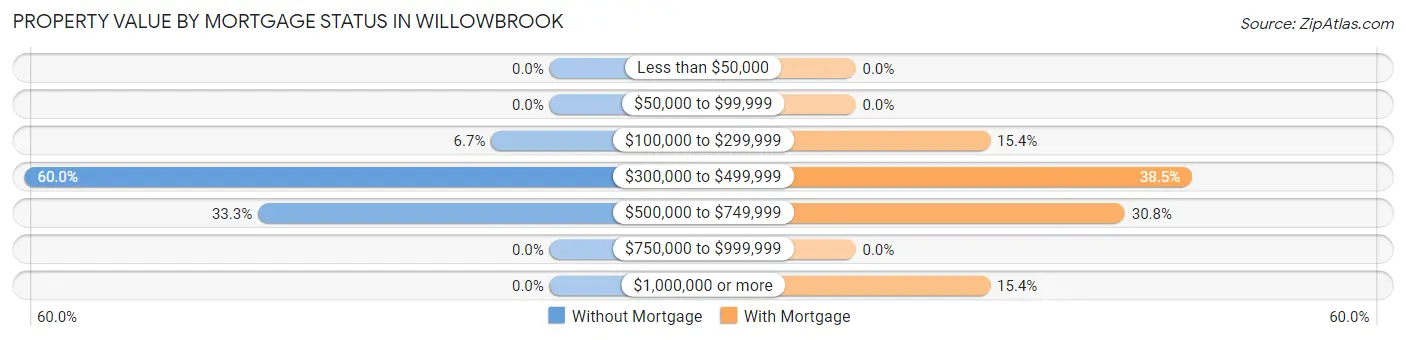
| Property Value | Without Mortgage | With Mortgage |
| Less than $50,000 | 0 (0.0%) | 0 (0.0%) |
| $50,000 to $99,999 | 0 (0.0%) | 0 (0.0%) |
| $100,000 to $299,999 | 1 (6.7%) | 2 (15.4%) |
| $300,000 to $499,999 | 9 (60.0%) | 5 (38.5%) |
| $500,000 to $749,999 | 5 (33.3%) | 4 (30.8%) |
| $750,000 to $999,999 | 0 (0.0%) | 0 (0.0%) |
| $1,000,000 or more | 0 (0.0%) | 2 (15.4%) |
| Total | 15 (100.0%) | 13 (100.0%) |
Household Income by Mortgage Status in Willowbrook
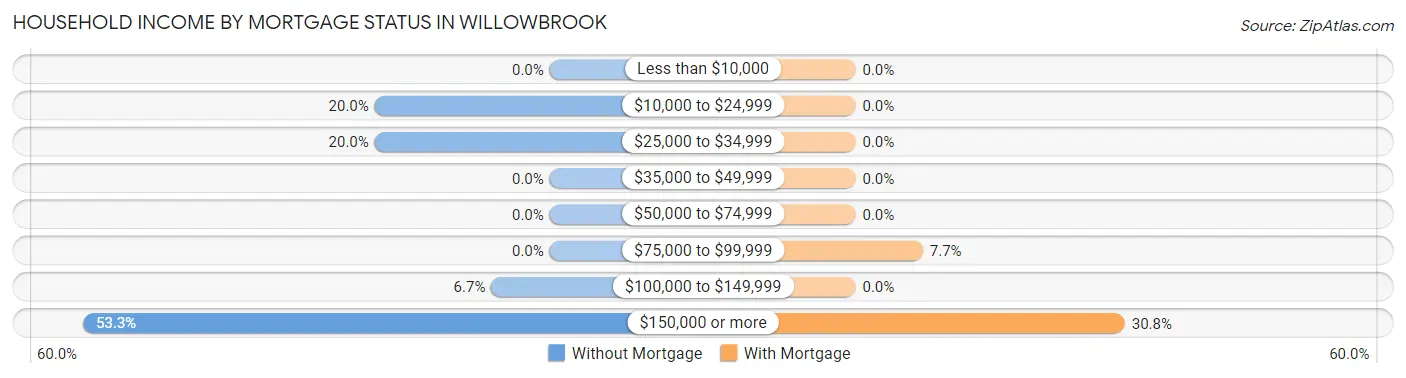
| Household Income | Without Mortgage | With Mortgage |
| Less than $10,000 | 0 (0.0%) | 0 (0.0%) |
| $10,000 to $24,999 | 3 (20.0%) | 0 (0.0%) |
| $25,000 to $34,999 | 3 (20.0%) | 0 (0.0%) |
| $35,000 to $49,999 | 0 (0.0%) | 0 (0.0%) |
| $50,000 to $74,999 | 0 (0.0%) | 0 (0.0%) |
| $75,000 to $99,999 | 0 (0.0%) | 1 (7.7%) |
| $100,000 to $149,999 | 1 (6.7%) | 0 (0.0%) |
| $150,000 or more | 8 (53.3%) | 4 (30.8%) |
| Total | 15 (100.0%) | 13 (100.0%) |
Property Value to Household Income Ratio in Willowbrook
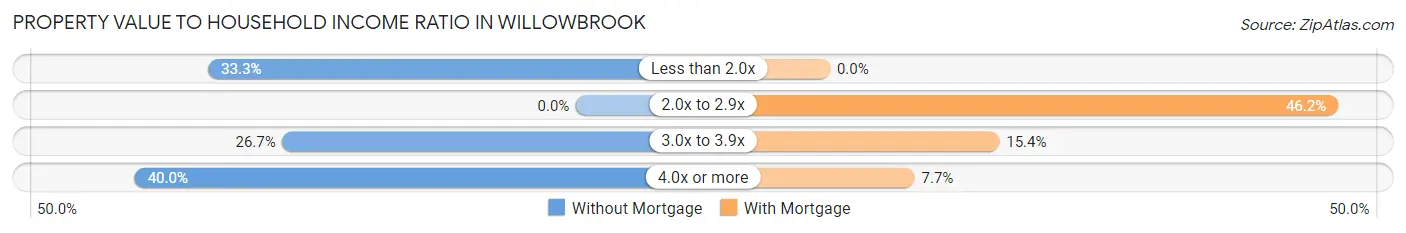
| Value-to-Income Ratio | Without Mortgage | With Mortgage |
| Less than 2.0x | 5 (33.3%) | 0 (0.0%) |
| 2.0x to 2.9x | 0 (0.0%) | 6 (46.2%) |
| 3.0x to 3.9x | 4 (26.7%) | 2 (15.4%) |
| 4.0x or more | 6 (40.0%) | 1 (7.7%) |
| Total | 15 (100.0%) | 13 (100.0%) |
Real Estate Taxes by Mortgage Status in Willowbrook
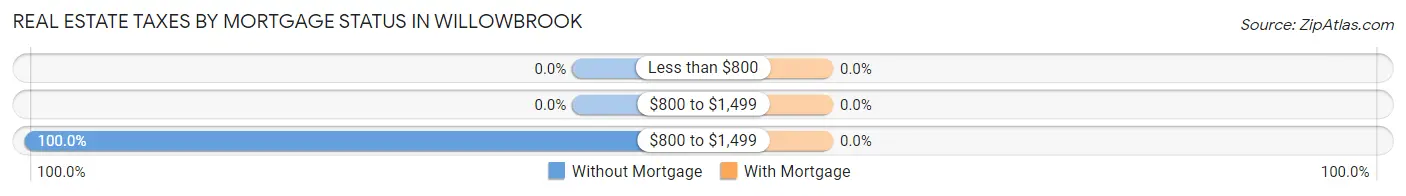
| Property Taxes | Without Mortgage | With Mortgage |
| Less than $800 | 0 (0.0%) | 0 (0.0%) |
| $800 to $1,499 | 0 (0.0%) | 0 (0.0%) |
| $800 to $1,499 | 15 (100.0%) | 0 (0.0%) |
| Total | 15 (100.0%) | 13 (100.0%) |
Health & Disability in Willowbrook
Health Insurance Coverage by Age in Willowbrook
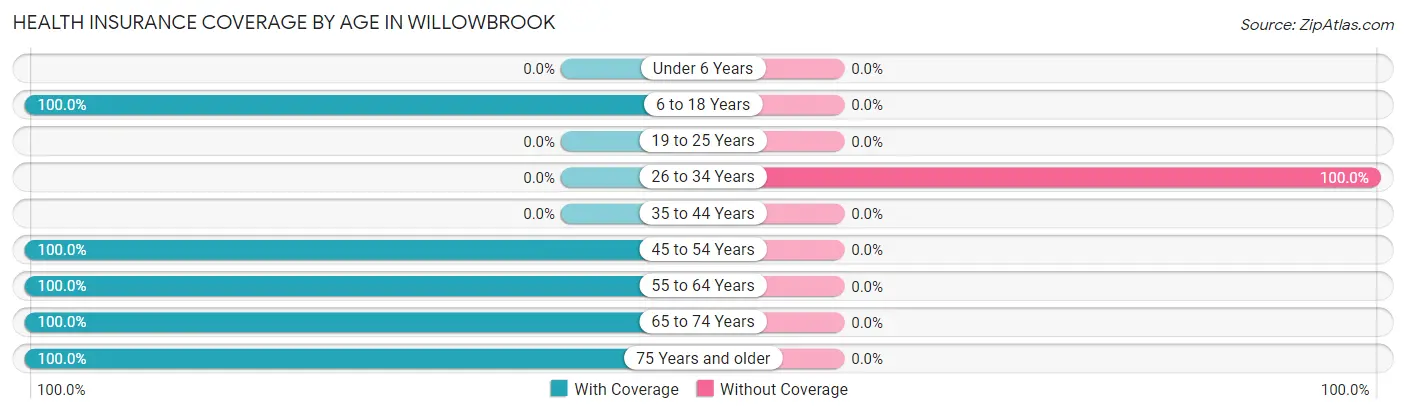
| Age Bracket | With Coverage | Without Coverage |
| Under 6 Years | 0 (0.0%) | 0 (0.0%) |
| 6 to 18 Years | 9 (100.0%) | 0 (0.0%) |
| 19 to 25 Years | 0 (0.0%) | 0 (0.0%) |
| 26 to 34 Years | 0 (0.0%) | 4 (100.0%) |
| 35 to 44 Years | 0 (0.0%) | 0 (0.0%) |
| 45 to 54 Years | 10 (100.0%) | 0 (0.0%) |
| 55 to 64 Years | 18 (100.0%) | 0 (0.0%) |
| 65 to 74 Years | 33 (100.0%) | 0 (0.0%) |
| 75 Years and older | 14 (100.0%) | 0 (0.0%) |
| Total | 84 (95.5%) | 4 (4.5%) |
Health Insurance Coverage by Citizenship Status in Willowbrook
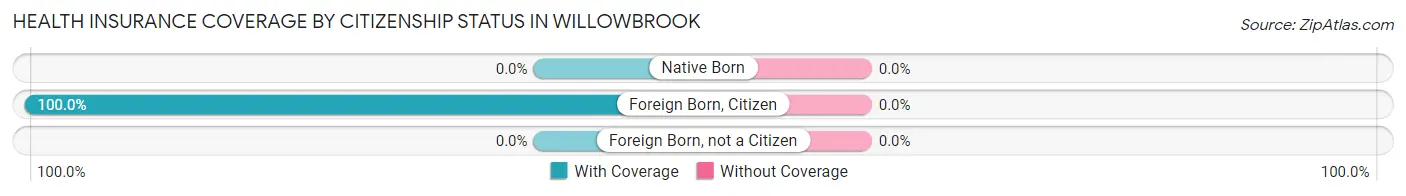
| Citizenship Status | With Coverage | Without Coverage |
| Native Born | 0 (0.0%) | 0 (0.0%) |
| Foreign Born, Citizen | 9 (100.0%) | 0 (0.0%) |
| Foreign Born, not a Citizen | 0 (0.0%) | 0 (0.0%) |
Health Insurance Coverage by Household Income in Willowbrook
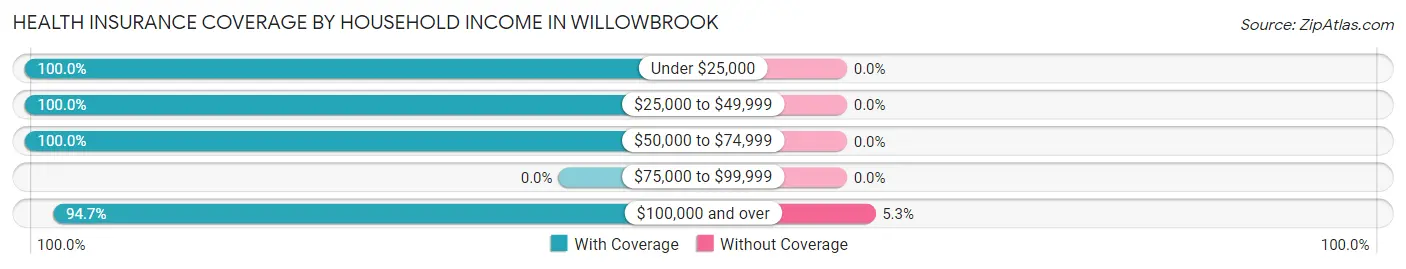
| Household Income | With Coverage | Without Coverage |
| Under $25,000 | 6 (100.0%) | 0 (0.0%) |
| $25,000 to $49,999 | 5 (100.0%) | 0 (0.0%) |
| $50,000 to $74,999 | 2 (100.0%) | 0 (0.0%) |
| $75,000 to $99,999 | 0 (0.0%) | 0 (0.0%) |
| $100,000 and over | 71 (94.7%) | 4 (5.3%) |
Public vs Private Health Insurance Coverage by Age in Willowbrook
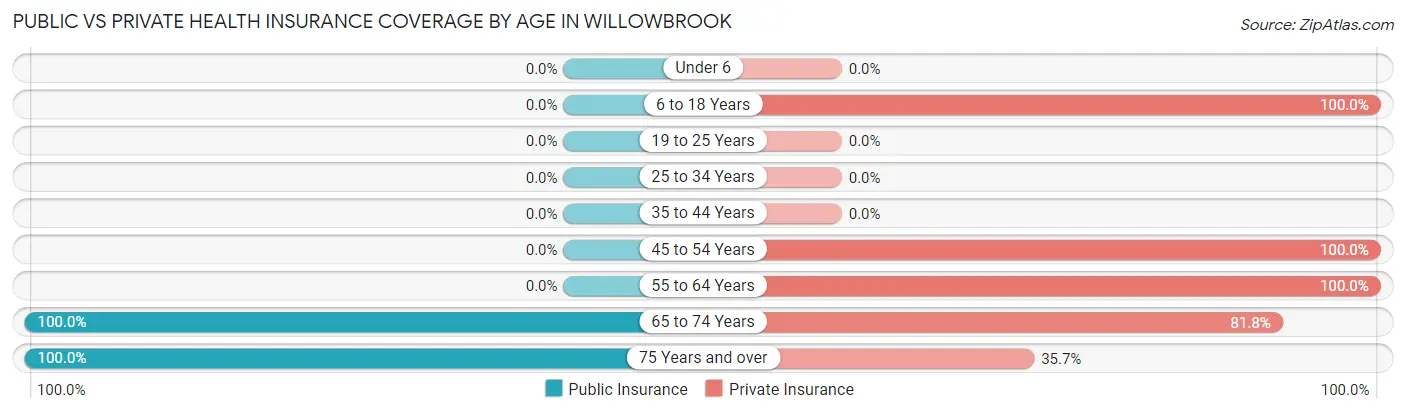
| Age Bracket | Public Insurance | Private Insurance |
| Under 6 | 0 (0.0%) | 0 (0.0%) |
| 6 to 18 Years | 0 (0.0%) | 9 (100.0%) |
| 19 to 25 Years | 0 (0.0%) | 0 (0.0%) |
| 25 to 34 Years | 0 (0.0%) | 0 (0.0%) |
| 35 to 44 Years | 0 (0.0%) | 0 (0.0%) |
| 45 to 54 Years | 0 (0.0%) | 10 (100.0%) |
| 55 to 64 Years | 0 (0.0%) | 18 (100.0%) |
| 65 to 74 Years | 33 (100.0%) | 27 (81.8%) |
| 75 Years and over | 14 (100.0%) | 5 (35.7%) |
| Total | 47 (53.4%) | 69 (78.4%) |
Disability Status by Sex by Age in Willowbrook
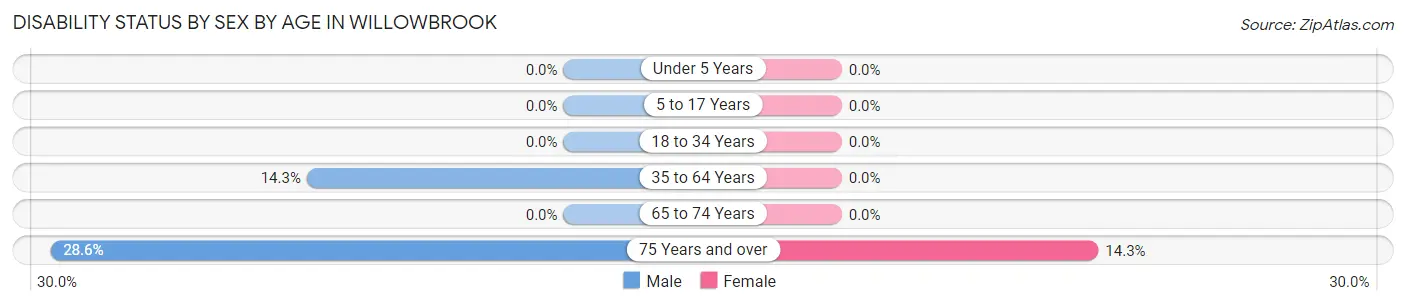
| Age Bracket | Male | Female |
| Under 5 Years | 0 (0.0%) | 0 (0.0%) |
| 5 to 17 Years | 0 (0.0%) | 0 (0.0%) |
| 18 to 34 Years | 0 (0.0%) | 0 (0.0%) |
| 35 to 64 Years | 2 (14.3%) | 0 (0.0%) |
| 65 to 74 Years | 0 (0.0%) | 0 (0.0%) |
| 75 Years and over | 2 (28.6%) | 1 (14.3%) |
Disability Class by Sex by Age in Willowbrook
Disability Class: Hearing Difficulty
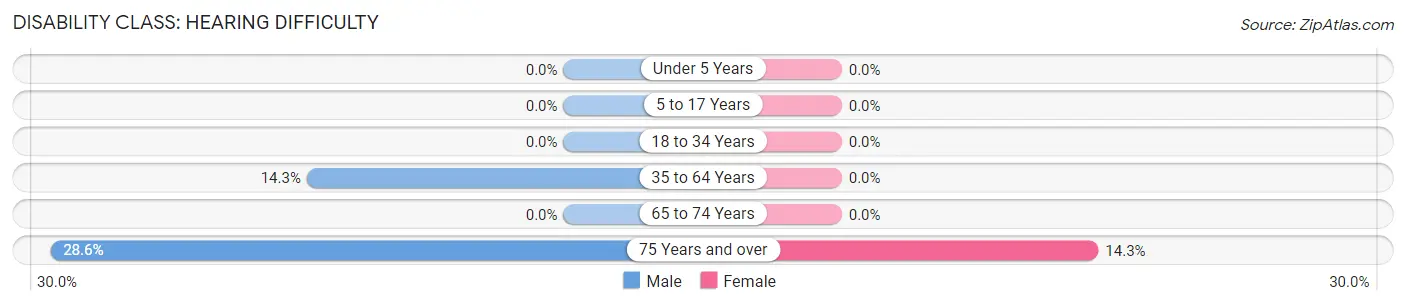
| Age Bracket | Male | Female |
| Under 5 Years | 0 (0.0%) | 0 (0.0%) |
| 5 to 17 Years | 0 (0.0%) | 0 (0.0%) |
| 18 to 34 Years | 0 (0.0%) | 0 (0.0%) |
| 35 to 64 Years | 2 (14.3%) | 0 (0.0%) |
| 65 to 74 Years | 0 (0.0%) | 0 (0.0%) |
| 75 Years and over | 2 (28.6%) | 1 (14.3%) |
Disability Class: Vision Difficulty
| Age Bracket | Male | Female |
| Under 5 Years | 0 (0.0%) | 0 (0.0%) |
| 5 to 17 Years | 0 (0.0%) | 0 (0.0%) |
| 18 to 34 Years | 0 (0.0%) | 0 (0.0%) |
| 35 to 64 Years | 0 (0.0%) | 0 (0.0%) |
| 65 to 74 Years | 0 (0.0%) | 0 (0.0%) |
| 75 Years and over | 0 (0.0%) | 0 (0.0%) |
Disability Class: Cognitive Difficulty
| Age Bracket | Male | Female |
| 5 to 17 Years | 0 (0.0%) | 0 (0.0%) |
| 18 to 34 Years | 0 (0.0%) | 0 (0.0%) |
| 35 to 64 Years | 0 (0.0%) | 0 (0.0%) |
| 65 to 74 Years | 0 (0.0%) | 0 (0.0%) |
| 75 Years and over | 1 (14.3%) | 0 (0.0%) |
Disability Class: Ambulatory Difficulty
| Age Bracket | Male | Female |
| 5 to 17 Years | 0 (0.0%) | 0 (0.0%) |
| 18 to 34 Years | 0 (0.0%) | 0 (0.0%) |
| 35 to 64 Years | 0 (0.0%) | 0 (0.0%) |
| 65 to 74 Years | 0 (0.0%) | 0 (0.0%) |
| 75 Years and over | 0 (0.0%) | 0 (0.0%) |
Disability Class: Self-Care Difficulty
| Age Bracket | Male | Female |
| 5 to 17 Years | 0 (0.0%) | 0 (0.0%) |
| 18 to 34 Years | 0 (0.0%) | 0 (0.0%) |
| 35 to 64 Years | 0 (0.0%) | 0 (0.0%) |
| 65 to 74 Years | 0 (0.0%) | 0 (0.0%) |
| 75 Years and over | 1 (14.3%) | 0 (0.0%) |
Technology Access in Willowbrook
Computing Device Access in Willowbrook
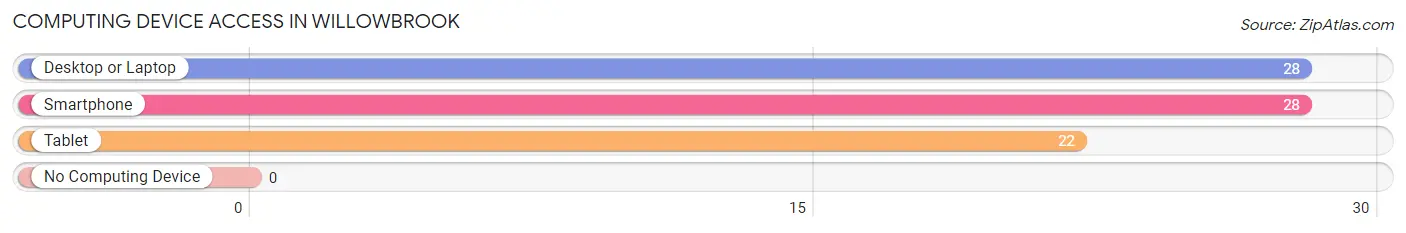
| Device Type | # Households | % Households |
| Desktop or Laptop | 28 | 96.6% |
| Smartphone | 28 | 96.6% |
| Tablet | 22 | 75.9% |
| No Computing Device | 0 | 0.0% |
| Total | 29 | 100.0% |
Internet Access in Willowbrook
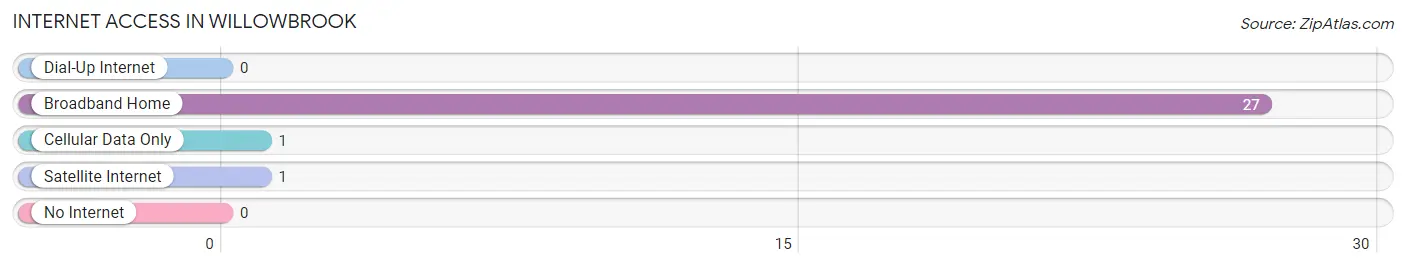
| Internet Type | # Households | % Households |
| Dial-Up Internet | 0 | 0.0% |
| Broadband Home | 27 | 93.1% |
| Cellular Data Only | 1 | 3.5% |
| Satellite Internet | 1 | 3.5% |
| No Internet | 0 | 0.0% |
| Total | 29 | 100.0% |
Willowbrook Summary
Willowbrook, Kansas is a small town located in the south-central part of the state. It is situated in the Flint Hills region of Kansas, and is part of the Manhattan metropolitan area. The town has a population of just over 1,000 people, and is known for its rural charm and friendly atmosphere.
History
Willowbrook was founded in 1887 by a group of settlers from the nearby town of Manhattan. The town was named after the nearby Willowbrook Creek, which was named for the abundance of willow trees that grew along its banks. The town was originally a farming community, and the settlers quickly established a post office, a general store, and a school.
In the early 1900s, the town began to grow and prosper. The railroad came to town in 1906, and the town was incorporated in 1909. The railroad brought new businesses and industries to the area, and the town began to grow and develop.
Geography
Willowbrook is located in the Flint Hills region of Kansas. The town is situated in the south-central part of the state, and is part of the Manhattan metropolitan area. The town is located on the banks of the Willowbrook Creek, and is surrounded by rolling hills and prairies. The town is located about 25 miles south of Manhattan, and about 50 miles west of Topeka.
Economy
Willowbrook’s economy is largely based on agriculture. The town is home to several farms, and the surrounding area is known for its production of wheat, corn, and soybeans. The town also has a few small businesses, including a grocery store, a hardware store, and a few restaurants.
Demographics
As of the 2010 census, the population of Willowbrook was 1,072. The town is predominantly white, with about 95% of the population being white. The median household income is $41,250, and the median home value is $90,000. The town has a low unemployment rate, and the poverty rate is below the national average.
Willowbrook is a small town with a rich history and a friendly atmosphere. The town is known for its rural charm and its close-knit community. The town is home to a variety of businesses and industries, and the surrounding area is known for its agricultural production. The town has a population of just over 1,000 people, and is a great place to live and work.
Common Questions
What is Per Capita Income in Willowbrook?
Per Capita income in Willowbrook is $96,861.
What is the Median Family Income in Willowbrook?
Median Family Income in Willowbrook is $158,125.
What is the Median Household income in Willowbrook?
Median Household Income in Willowbrook is $158,125.
What is Inequality or Gini Index in Willowbrook?
Inequality or Gini Index in Willowbrook is 0.53.
What is the Total Population of Willowbrook?
Total Population of Willowbrook is 88.
What is the Total Male Population of Willowbrook?
Total Male Population of Willowbrook is 36.
What is the Total Female Population of Willowbrook?
Total Female Population of Willowbrook is 52.
What is the Ratio of Males per 100 Females in Willowbrook?
There are 69.23 Males per 100 Females in Willowbrook.
What is the Ratio of Females per 100 Males in Willowbrook?
There are 144.44 Females per 100 Males in Willowbrook.
What is the Median Population Age in Willowbrook?
Median Population Age in Willowbrook is 69.5 Years.
What is the Average Family Size in Willowbrook
Average Family Size in Willowbrook is 3.6 People.
What is the Average Household Size in Willowbrook
Average Household Size in Willowbrook is 3.0 People.
How Large is the Labor Force in Willowbrook?
There are 31 People in the Labor Forcein in Willowbrook.
What is the Percentage of People in the Labor Force in Willowbrook?
37.3% of People are in the Labor Force in Willowbrook.