Mission Woods, KS Map & Demographics
Mission Woods Map
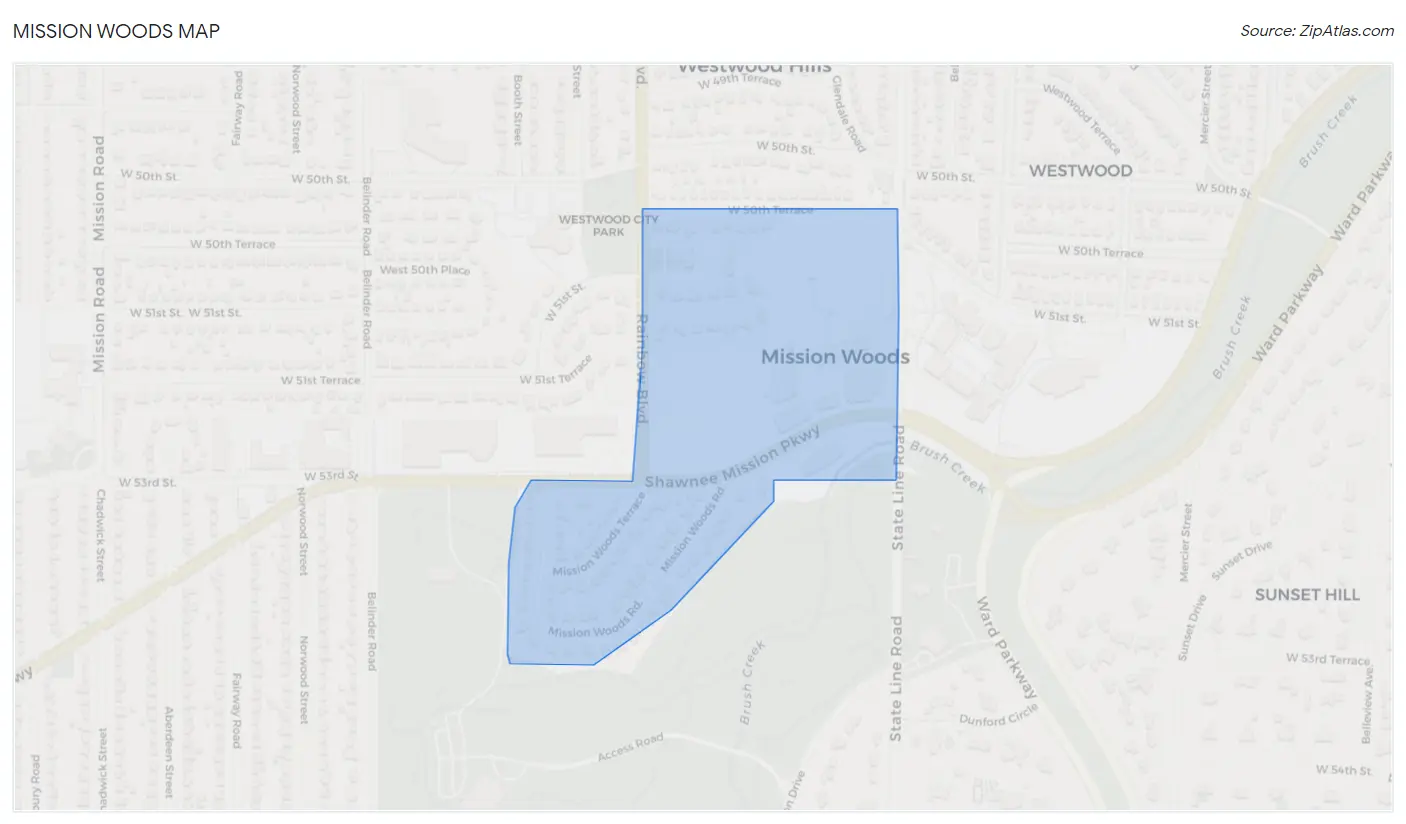
Mission Woods Overview
$166,879
PER CAPITA INCOME
$250,001
AVG FAMILY INCOME
$198,750
AVG HOUSEHOLD INCOME
0.54
INEQUALITY / GINI INDEX
155
TOTAL POPULATION
80
MALE POPULATION
75
FEMALE POPULATION
106.67
MALES / 100 FEMALES
93.75
FEMALES / 100 MALES
46.2
MEDIAN AGE
2.8
AVG FAMILY SIZE
2.5
AVG HOUSEHOLD SIZE
86
LABOR FORCE [ PEOPLE ]
71.7%
PERCENT IN LABOR FORCE
5.8%
UNEMPLOYMENT RATE
Mission Woods Area Codes
Income in Mission Woods
Income Overview in Mission Woods
Per Capita Income in Mission Woods is $166,879, while median incomes of families and households are $250,001 and $198,750 respectively.
| Characteristic | Number | Measure |
| Per Capita Income | 155 | $166,879 |
| Median Family Income | 49 | $250,001 |
| Mean Family Income | 49 | $412,192 |
| Median Household Income | 61 | $198,750 |
| Mean Household Income | 61 | $412,266 |
| Income Deficit | 49 | $0 |
| Wage / Income Gap (%) | 155 | 0.00% |
| Wage / Income Gap ($) | 155 | 100.00¢ per $1 |
| Gini / Inequality Index | 155 | 0.54 |
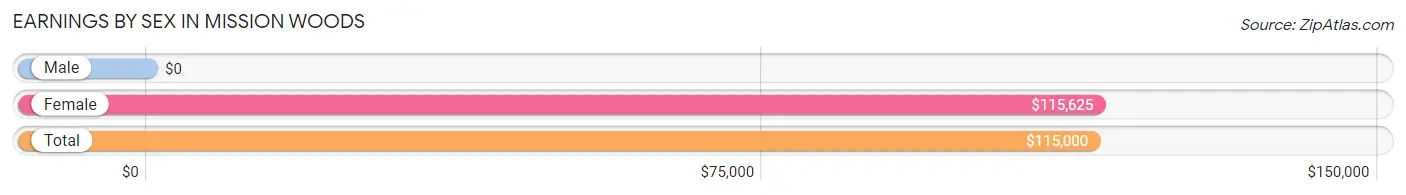
Earnings by Sex in Mission Woods
| Sex | Number | Average Earnings |
| Male | 53 (63.1%) | $0 |
| Female | 31 (36.9%) | $115,625 |
| Total | 84 (100.0%) | $115,000 |
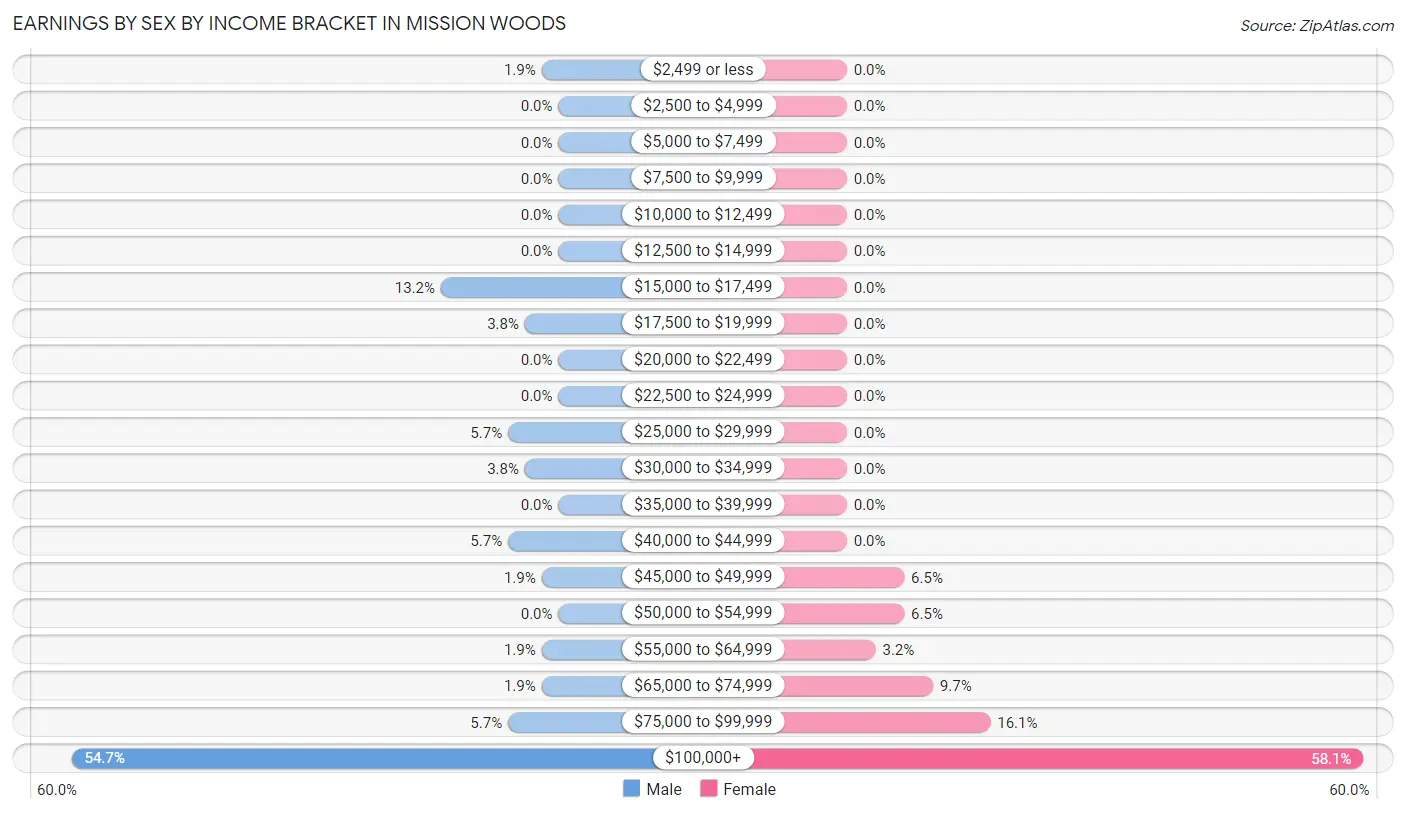
Earnings by Sex by Income Bracket in Mission Woods
The most common earnings brackets in Mission Woods are $100,000+ for men (29 | 54.7%) and $100,000+ for women (18 | 58.1%).
| Income | Male | Female |
| $2,499 or less | 1 (1.9%) | 0 (0.0%) |
| $2,500 to $4,999 | 0 (0.0%) | 0 (0.0%) |
| $5,000 to $7,499 | 0 (0.0%) | 0 (0.0%) |
| $7,500 to $9,999 | 0 (0.0%) | 0 (0.0%) |
| $10,000 to $12,499 | 0 (0.0%) | 0 (0.0%) |
| $12,500 to $14,999 | 0 (0.0%) | 0 (0.0%) |
| $15,000 to $17,499 | 7 (13.2%) | 0 (0.0%) |
| $17,500 to $19,999 | 2 (3.8%) | 0 (0.0%) |
| $20,000 to $22,499 | 0 (0.0%) | 0 (0.0%) |
| $22,500 to $24,999 | 0 (0.0%) | 0 (0.0%) |
| $25,000 to $29,999 | 3 (5.7%) | 0 (0.0%) |
| $30,000 to $34,999 | 2 (3.8%) | 0 (0.0%) |
| $35,000 to $39,999 | 0 (0.0%) | 0 (0.0%) |
| $40,000 to $44,999 | 3 (5.7%) | 0 (0.0%) |
| $45,000 to $49,999 | 1 (1.9%) | 2 (6.5%) |
| $50,000 to $54,999 | 0 (0.0%) | 2 (6.5%) |
| $55,000 to $64,999 | 1 (1.9%) | 1 (3.2%) |
| $65,000 to $74,999 | 1 (1.9%) | 3 (9.7%) |
| $75,000 to $99,999 | 3 (5.7%) | 5 (16.1%) |
| $100,000+ | 29 (54.7%) | 18 (58.1%) |
| Total | 53 (100.0%) | 31 (100.0%) |
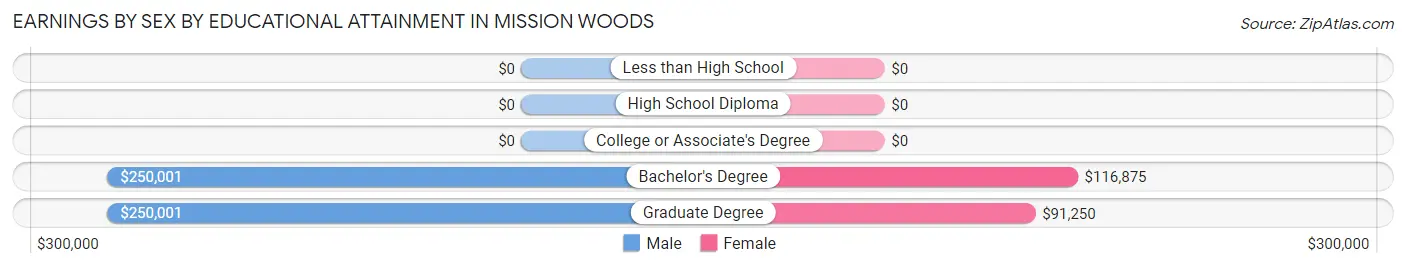
Earnings by Sex by Educational Attainment in Mission Woods
| Educational Attainment | Male Income | Female Income |
| Less than High School | - | - |
| High School Diploma | - | - |
| College or Associate's Degree | - | - |
| Bachelor's Degree | $250,001 | $116,875 |
| Graduate Degree | $250,001 | $91,250 |
| Total | - | - |
Family Income in Mission Woods
Family Income Brackets in Mission Woods
According to the Mission Woods family income data, there are 27 families falling into the $200,000+ income range, which is the most common income bracket and makes up 55.1% of all families.
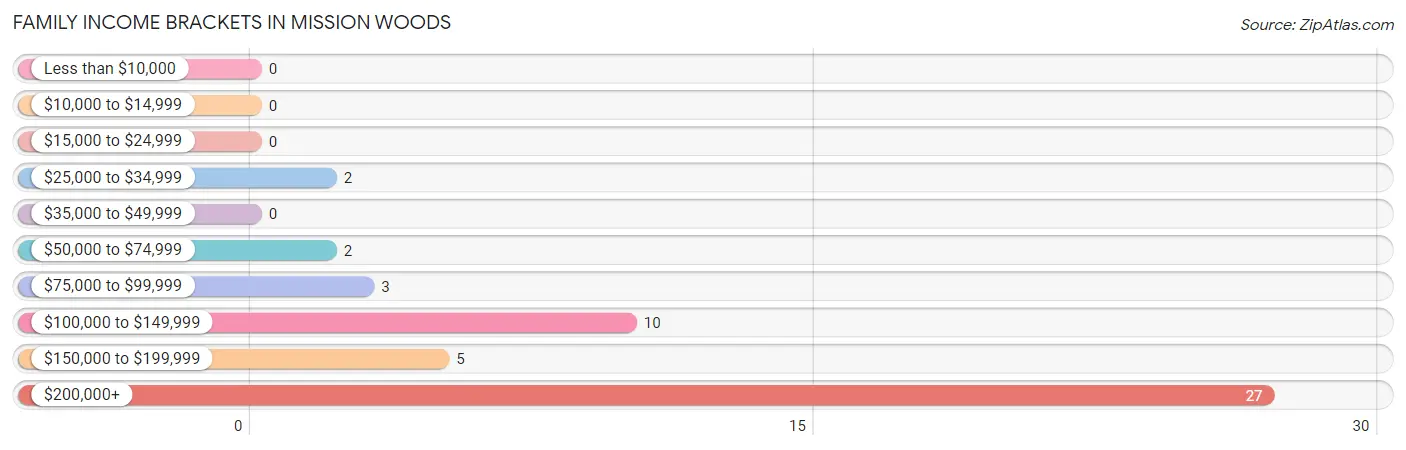
| Income Bracket | # Families | % Families |
| Less than $10,000 | 0 | 0.0% |
| $10,000 to $14,999 | 0 | 0.0% |
| $15,000 to $24,999 | 0 | 0.0% |
| $25,000 to $34,999 | 2 | 4.1% |
| $35,000 to $49,999 | 0 | 0.0% |
| $50,000 to $74,999 | 2 | 4.1% |
| $75,000 to $99,999 | 3 | 6.1% |
| $100,000 to $149,999 | 10 | 20.4% |
| $150,000 to $199,999 | 5 | 10.2% |
| $200,000+ | 27 | 55.1% |
Family Income by Famaliy Size in Mission Woods
4-person families (9 | 18.4%) account for the highest median family income in Mission Woods with $250,001 per family, while 2-person families (24 | 49.0%) have the highest median income of $106,250 per family member.
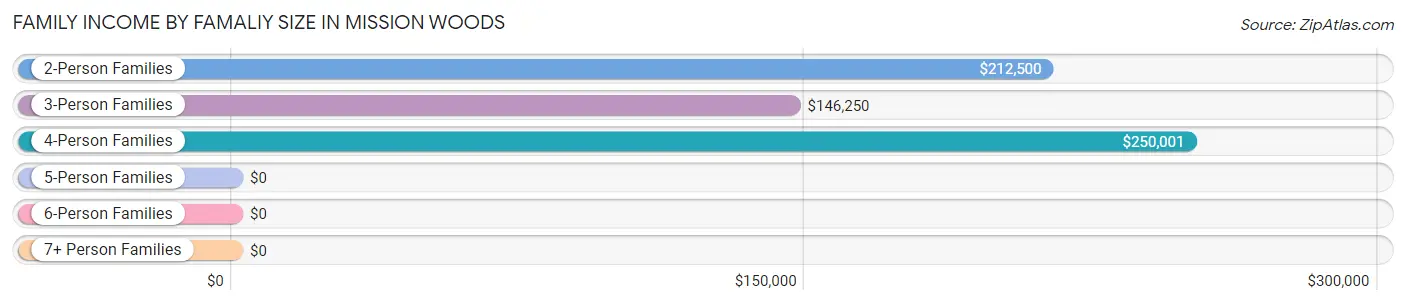
| Income Bracket | # Families | Median Income |
| 2-Person Families | 24 (49.0%) | $212,500 |
| 3-Person Families | 14 (28.6%) | $146,250 |
| 4-Person Families | 9 (18.4%) | $250,001 |
| 5-Person Families | 2 (4.1%) | $0 |
| 6-Person Families | 0 (0.0%) | $0 |
| 7+ Person Families | 0 (0.0%) | $0 |
| Total | 49 (100.0%) | $250,001 |
Family Income by Number of Earners in Mission Woods
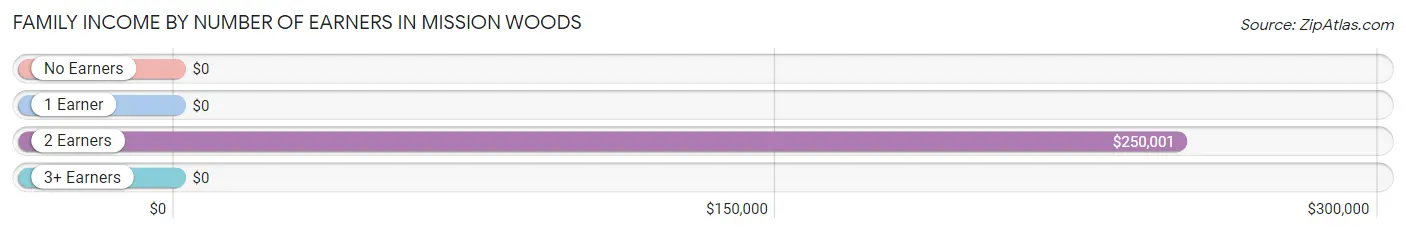
| Number of Earners | # Families | Median Income |
| No Earners | 9 (18.4%) | $0 |
| 1 Earner | 12 (24.5%) | $0 |
| 2 Earners | 26 (53.1%) | $250,001 |
| 3+ Earners | 2 (4.1%) | $0 |
| Total | 49 (100.0%) | $250,001 |
Household Income in Mission Woods
Household Income Brackets in Mission Woods
With 30 households falling in the category, the $200,000+ income range is the most frequent in Mission Woods, accounting for 49.2% of all households.
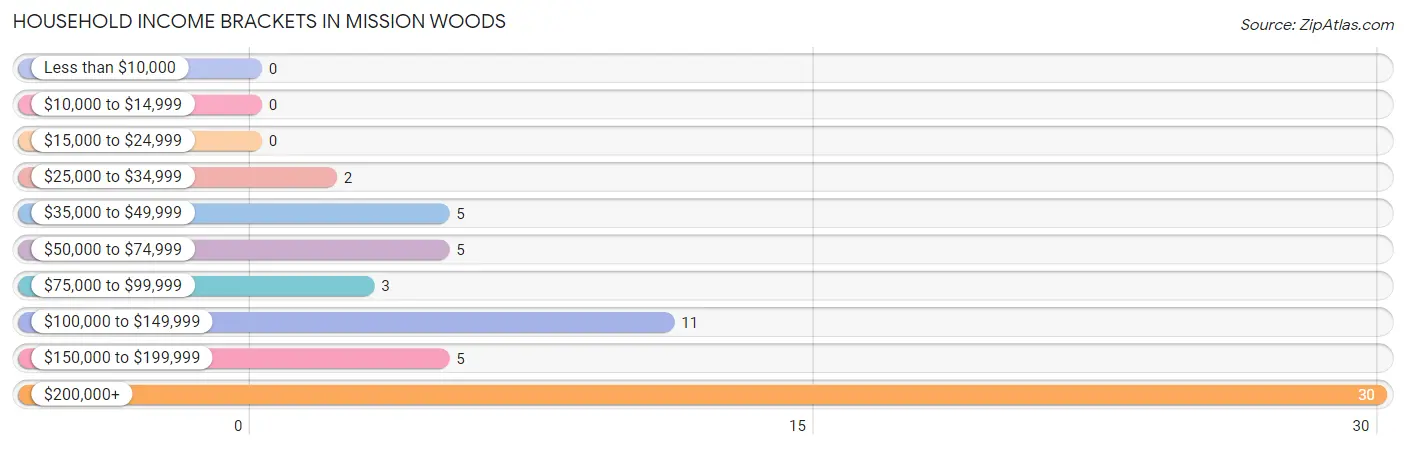
| Income Bracket | # Households | % Households |
| Less than $10,000 | 0 | 0.0% |
| $10,000 to $14,999 | 0 | 0.0% |
| $15,000 to $24,999 | 0 | 0.0% |
| $25,000 to $34,999 | 2 | 3.3% |
| $35,000 to $49,999 | 5 | 8.2% |
| $50,000 to $74,999 | 5 | 8.2% |
| $75,000 to $99,999 | 3 | 4.9% |
| $100,000 to $149,999 | 11 | 18.0% |
| $150,000 to $199,999 | 5 | 8.2% |
| $200,000+ | 30 | 49.2% |
Household Income by Householder Age in Mission Woods
The median household income in Mission Woods is $198,750, with the highest median household income of $250,001 found in the 45 to 64 years age bracket for the primary householder. A total of 26 households (42.6%) fall into this category.
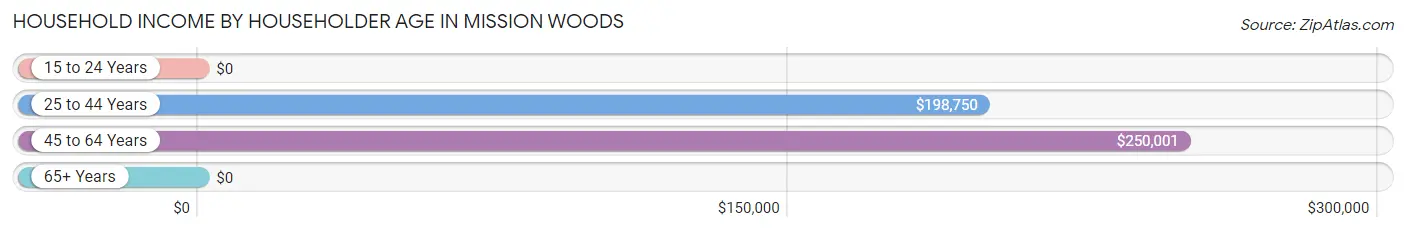
| Income Bracket | # Households | Median Income |
| 15 to 24 Years | 0 (0.0%) | $0 |
| 25 to 44 Years | 15 (24.6%) | $198,750 |
| 45 to 64 Years | 26 (42.6%) | $250,001 |
| 65+ Years | 20 (32.8%) | $0 |
| Total | 61 (100.0%) | $198,750 |
Poverty in Mission Woods
Income Below Poverty by Sex and Age in Mission Woods
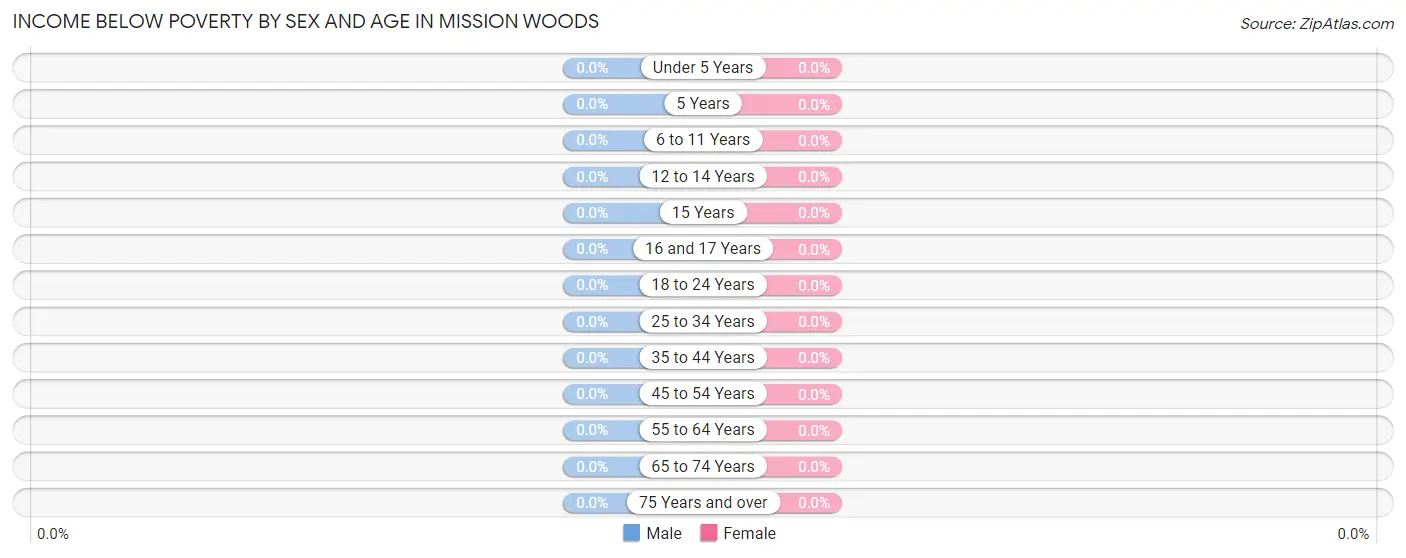
| Age Bracket | Male | Female |
| Under 5 Years | 0 (0.0%) | 0 (0.0%) |
| 5 Years | 0 (0.0%) | 0 (0.0%) |
| 6 to 11 Years | 0 (0.0%) | 0 (0.0%) |
| 12 to 14 Years | 0 (0.0%) | 0 (0.0%) |
| 15 Years | 0 (0.0%) | 0 (0.0%) |
| 16 and 17 Years | 0 (0.0%) | 0 (0.0%) |
| 18 to 24 Years | 0 (0.0%) | 0 (0.0%) |
| 25 to 34 Years | 0 (0.0%) | 0 (0.0%) |
| 35 to 44 Years | 0 (0.0%) | 0 (0.0%) |
| 45 to 54 Years | 0 (0.0%) | 0 (0.0%) |
| 55 to 64 Years | 0 (0.0%) | 0 (0.0%) |
| 65 to 74 Years | 0 (0.0%) | 0 (0.0%) |
| 75 Years and over | 0 (0.0%) | 0 (0.0%) |
| Total | 0 (0.0%) | 0 (0.0%) |
Income Above Poverty by Sex and Age in Mission Woods
According to the poverty statistics in Mission Woods, males aged under 5 years and females aged under 5 years are the age groups that are most secure financially, with 100.0% of males and 100.0% of females in these age groups living above the poverty line.
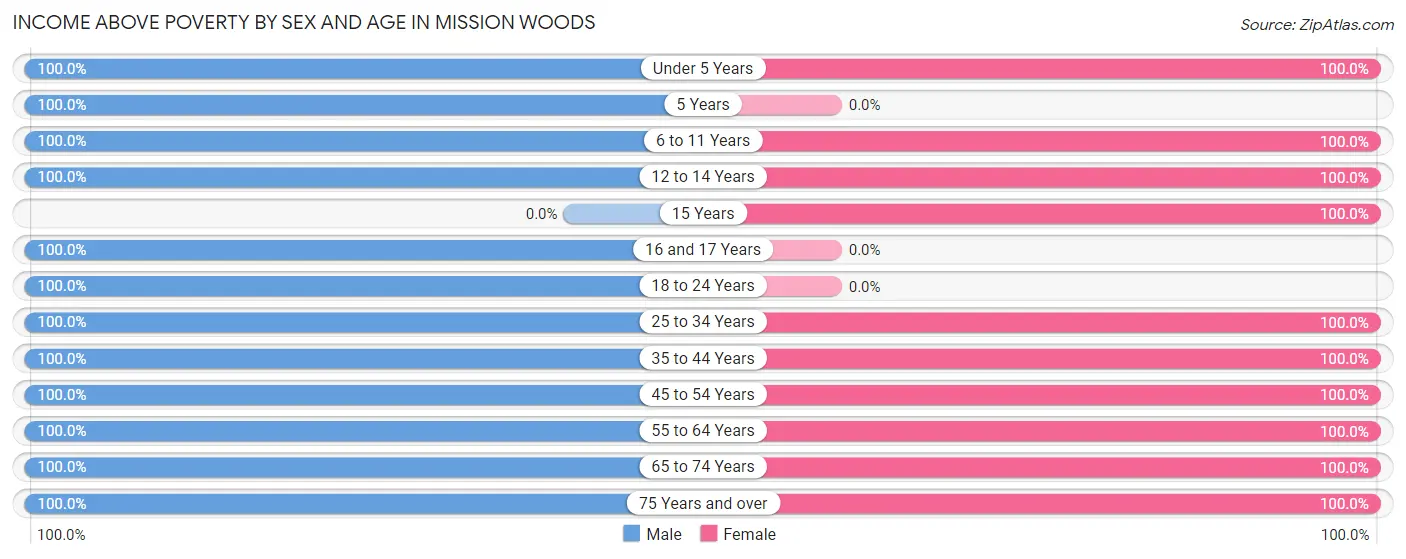
| Age Bracket | Male | Female |
| Under 5 Years | 4 (100.0%) | 5 (100.0%) |
| 5 Years | 2 (100.0%) | 0 (0.0%) |
| 6 to 11 Years | 5 (100.0%) | 6 (100.0%) |
| 12 to 14 Years | 3 (100.0%) | 6 (100.0%) |
| 15 Years | 0 (0.0%) | 4 (100.0%) |
| 16 and 17 Years | 1 (100.0%) | 0 (0.0%) |
| 18 to 24 Years | 2 (100.0%) | 0 (0.0%) |
| 25 to 34 Years | 7 (100.0%) | 3 (100.0%) |
| 35 to 44 Years | 9 (100.0%) | 14 (100.0%) |
| 45 to 54 Years | 13 (100.0%) | 6 (100.0%) |
| 55 to 64 Years | 13 (100.0%) | 12 (100.0%) |
| 65 to 74 Years | 17 (100.0%) | 14 (100.0%) |
| 75 Years and over | 4 (100.0%) | 5 (100.0%) |
| Total | 80 (100.0%) | 75 (100.0%) |
Income Below Poverty Among Married-Couple Families in Mission Woods
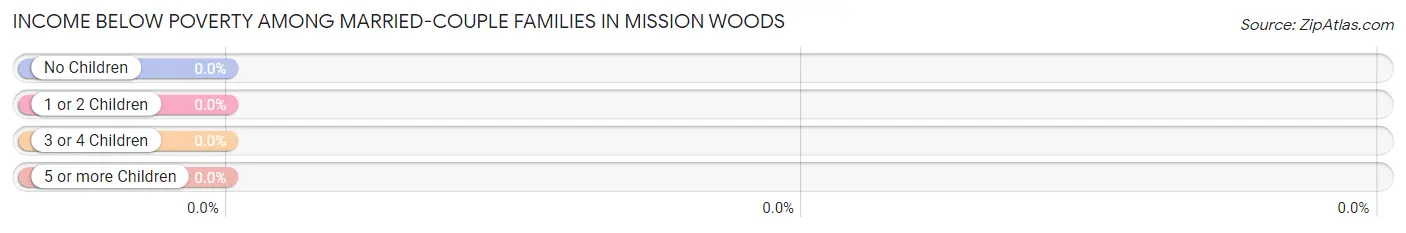
| Children | Above Poverty | Below Poverty |
| No Children | 27 (100.0%) | 0 (0.0%) |
| 1 or 2 Children | 13 (100.0%) | 0 (0.0%) |
| 3 or 4 Children | 2 (100.0%) | 0 (0.0%) |
| 5 or more Children | 0 (0.0%) | 0 (0.0%) |
| Total | 42 (100.0%) | 0 (0.0%) |
Income Below Poverty Among Single-Parent Households in Mission Woods
| Children | Single Father | Single Mother |
| No Children | 0 (0.0%) | 0 (0.0%) |
| 1 or 2 Children | 0 (0.0%) | 0 (0.0%) |
| 3 or 4 Children | 0 (0.0%) | 0 (0.0%) |
| 5 or more Children | 0 (0.0%) | 0 (0.0%) |
| Total | 0 (0.0%) | 0 (0.0%) |
Income Below Poverty Among Married-Couple vs Single-Parent Households in Mission Woods
| Children | Married-Couple Families | Single-Parent Households |
| No Children | 0 (0.0%) | 0 (0.0%) |
| 1 or 2 Children | 0 (0.0%) | 0 (0.0%) |
| 3 or 4 Children | 0 (0.0%) | 0 (0.0%) |
| 5 or more Children | 0 (0.0%) | 0 (0.0%) |
| Total | 0 (0.0%) | 0 (0.0%) |
Race in Mission Woods
The most populous races in Mission Woods are White / Caucasian (137 | 88.4%), Two or more Races (15 | 9.7%), and Asian (3 | 1.9%).
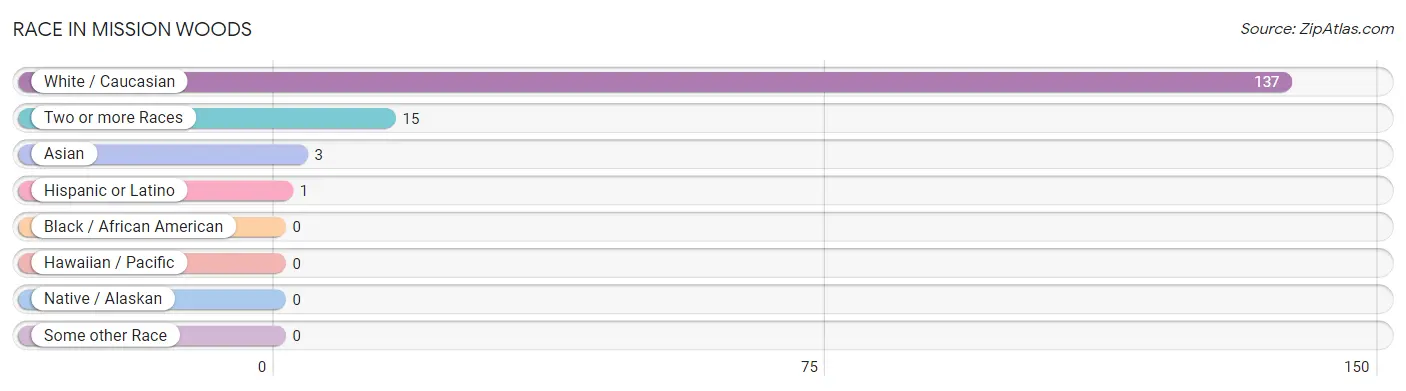
| Race | # Population | % Population |
| Asian | 3 | 1.9% |
| Black / African American | 0 | 0.0% |
| Hawaiian / Pacific | 0 | 0.0% |
| Hispanic or Latino | 1 | 0.6% |
| Native / Alaskan | 0 | 0.0% |
| White / Caucasian | 137 | 88.4% |
| Two or more Races | 15 | 9.7% |
| Some other Race | 0 | 0.0% |
| Total | 155 | 100.0% |
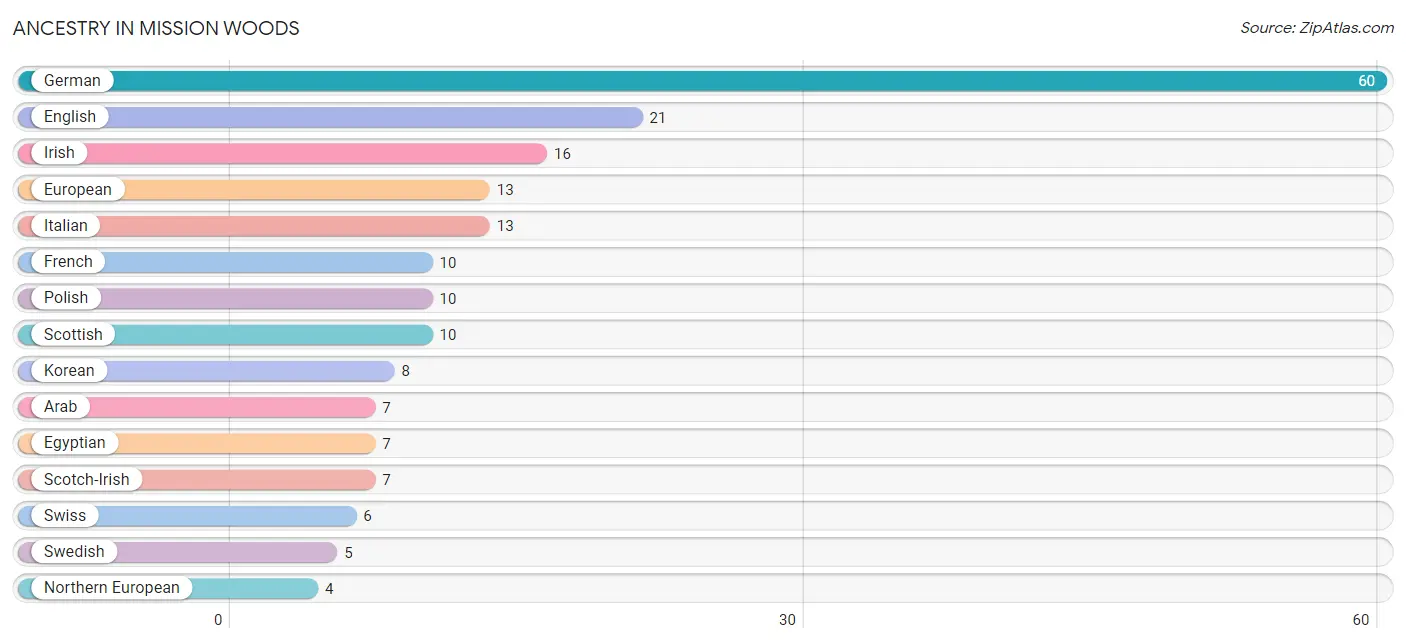
Ancestry in Mission Woods
The most populous ancestries reported in Mission Woods are German (60 | 38.7%), English (21 | 13.6%), Irish (16 | 10.3%), European (13 | 8.4%), and Italian (13 | 8.4%), together accounting for 79.4% of all Mission Woods residents.
| Ancestry | # Population | % Population |
| American | 3 | 1.9% |
| Arab | 7 | 4.5% |
| Brazilian | 1 | 0.6% |
| Croatian | 1 | 0.6% |
| Cuban | 1 | 0.6% |
| Danish | 2 | 1.3% |
| Eastern European | 2 | 1.3% |
| Egyptian | 7 | 4.5% |
| English | 21 | 13.6% |
| European | 13 | 8.4% |
| French | 10 | 6.5% |
| French Canadian | 1 | 0.6% |
| German | 60 | 38.7% |
| Greek | 2 | 1.3% |
| Irish | 16 | 10.3% |
| Italian | 13 | 8.4% |
| Korean | 8 | 5.2% |
| Northern European | 4 | 2.6% |
| Norwegian | 4 | 2.6% |
| Polish | 10 | 6.5% |
| Russian | 1 | 0.6% |
| Scotch-Irish | 7 | 4.5% |
| Scottish | 10 | 6.5% |
| Slovak | 2 | 1.3% |
| Swedish | 5 | 3.2% |
| Swiss | 6 | 3.9% |
| Thai | 3 | 1.9% | View All 27 Rows |
Immigrants in Mission Woods
The most numerous immigrant groups reported in Mission Woods came from Asia (3 | 1.9%), India (3 | 1.9%), South Central Asia (3 | 1.9%), Europe (2 | 1.3%), and Latin America (2 | 1.3%), together accounting for 8.4% of all Mission Woods residents.
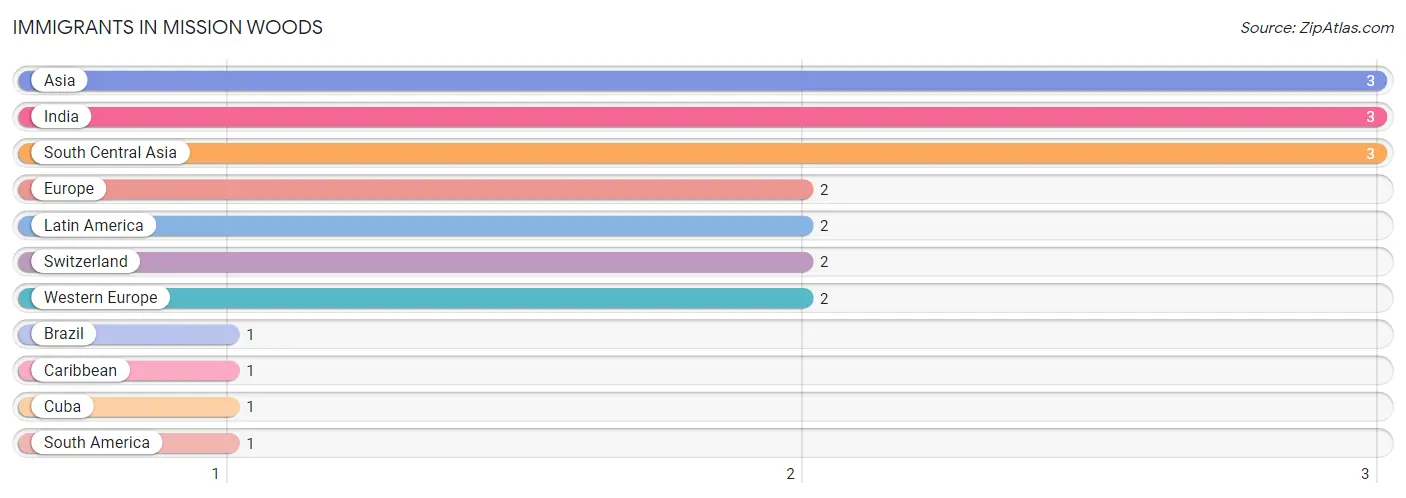
| Immigration Origin | # Population | % Population |
| Asia | 3 | 1.9% |
| Brazil | 1 | 0.6% |
| Caribbean | 1 | 0.6% |
| Cuba | 1 | 0.6% |
| Europe | 2 | 1.3% |
| India | 3 | 1.9% |
| Latin America | 2 | 1.3% |
| South America | 1 | 0.6% |
| South Central Asia | 3 | 1.9% |
| Switzerland | 2 | 1.3% |
| Western Europe | 2 | 1.3% | View All 11 Rows |
Sex and Age in Mission Woods
Sex and Age in Mission Woods
The most populous age groups in Mission Woods are 65 to 69 Years (13 | 16.3%) for men and 40 to 44 Years (11 | 14.7%) for women.
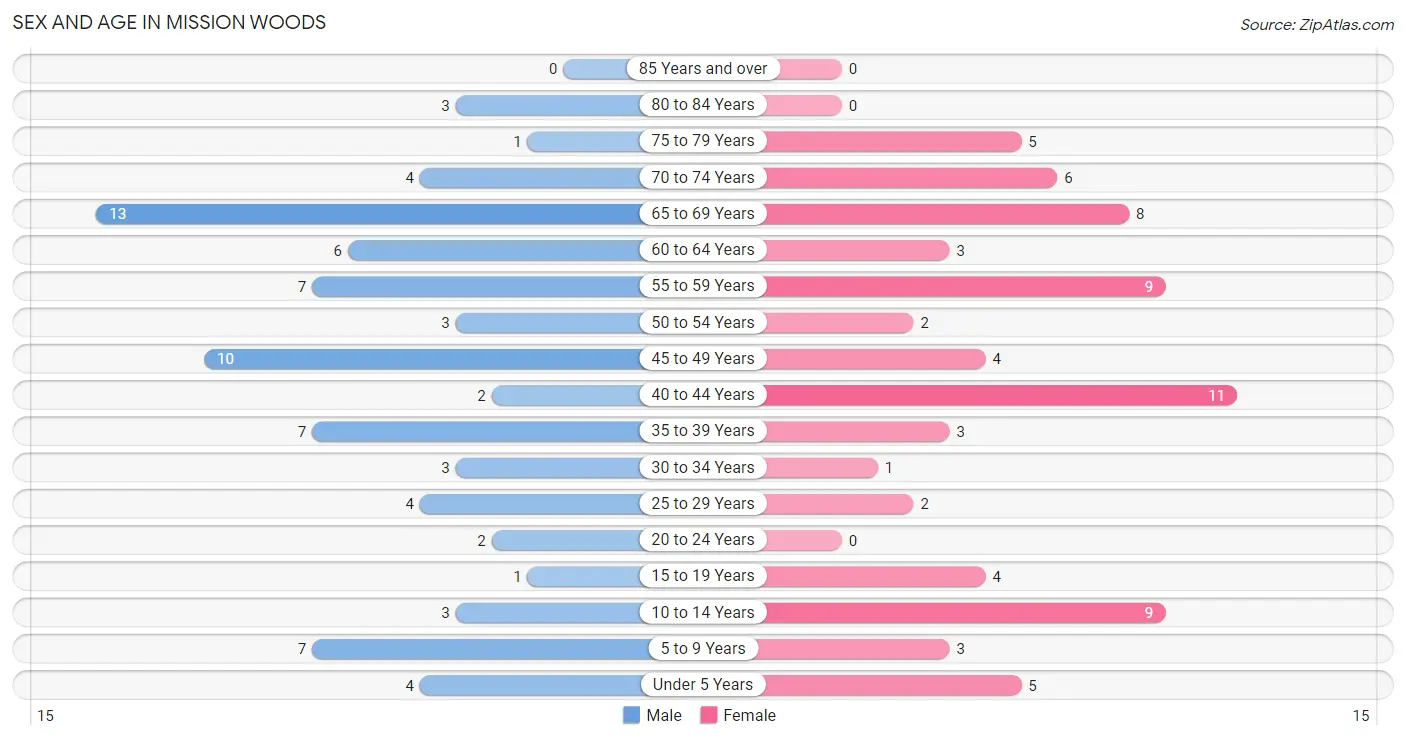
| Age Bracket | Male | Female |
| Under 5 Years | 4 (5.0%) | 5 (6.7%) |
| 5 to 9 Years | 7 (8.7%) | 3 (4.0%) |
| 10 to 14 Years | 3 (3.7%) | 9 (12.0%) |
| 15 to 19 Years | 1 (1.3%) | 4 (5.3%) |
| 20 to 24 Years | 2 (2.5%) | 0 (0.0%) |
| 25 to 29 Years | 4 (5.0%) | 2 (2.7%) |
| 30 to 34 Years | 3 (3.7%) | 1 (1.3%) |
| 35 to 39 Years | 7 (8.7%) | 3 (4.0%) |
| 40 to 44 Years | 2 (2.5%) | 11 (14.7%) |
| 45 to 49 Years | 10 (12.5%) | 4 (5.3%) |
| 50 to 54 Years | 3 (3.7%) | 2 (2.7%) |
| 55 to 59 Years | 7 (8.7%) | 9 (12.0%) |
| 60 to 64 Years | 6 (7.5%) | 3 (4.0%) |
| 65 to 69 Years | 13 (16.3%) | 8 (10.7%) |
| 70 to 74 Years | 4 (5.0%) | 6 (8.0%) |
| 75 to 79 Years | 1 (1.3%) | 5 (6.7%) |
| 80 to 84 Years | 3 (3.7%) | 0 (0.0%) |
| 85 Years and over | 0 (0.0%) | 0 (0.0%) |
| Total | 80 (100.0%) | 75 (100.0%) |
Families and Households in Mission Woods
Median Family Size in Mission Woods
The median family size in Mission Woods is 2.80 persons per family, with single male/father families (1 | 2.0%) accounting for the largest median family size of 4 persons per family. On the other hand, single female/mother families (6 | 12.2%) represent the smallest median family size with 2.50 persons per family.
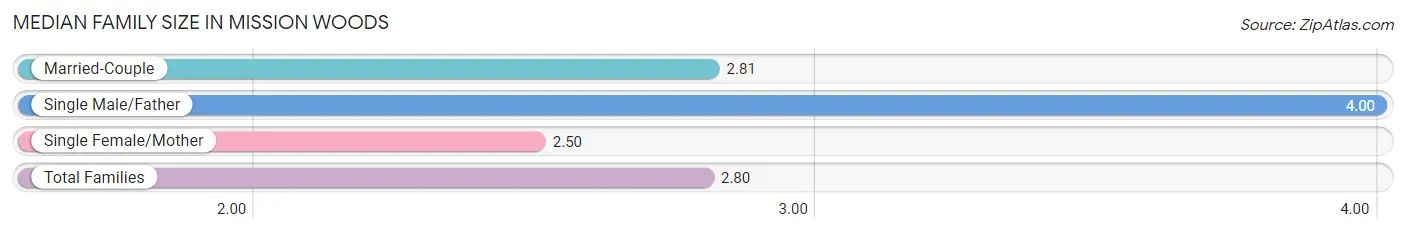
| Family Type | # Families | Family Size |
| Married-Couple | 42 (85.7%) | 2.81 |
| Single Male/Father | 1 (2.0%) | 4.00 |
| Single Female/Mother | 6 (12.2%) | 2.50 |
| Total Families | 49 (100.0%) | 2.80 |
Median Household Size in Mission Woods
The median household size in Mission Woods is 2.54 persons per household, with single male/father households (1 | 1.6%) accounting for the largest median household size of 4 persons per household. non-family households (12 | 19.7%) represent the smallest median household size with 1.50 persons per household.
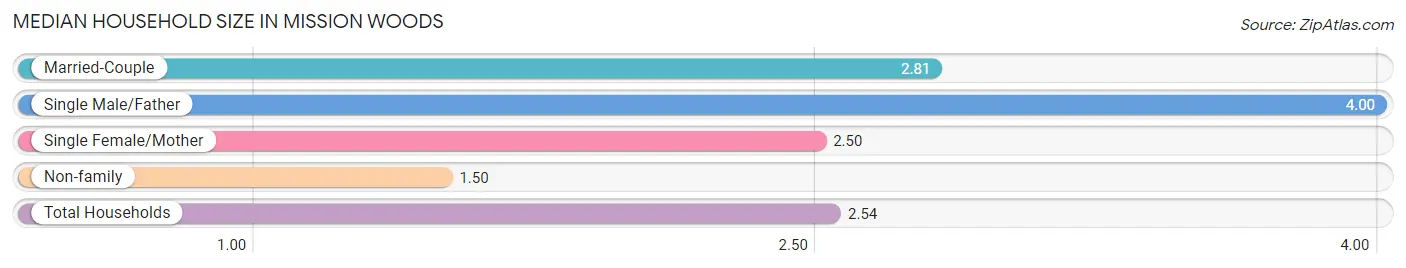
| Household Type | # Households | Household Size |
| Married-Couple | 42 (68.9%) | 2.81 |
| Single Male/Father | 1 (1.6%) | 4.00 |
| Single Female/Mother | 6 (9.8%) | 2.50 |
| Non-family | 12 (19.7%) | 1.50 |
| Total Households | 61 (100.0%) | 2.54 |
Household Size by Marriage Status in Mission Woods
Out of a total of 61 households in Mission Woods, 49 (80.3%) are family households, while 12 (19.7%) are nonfamily households. The most numerous type of family households are 2-person households, comprising 24, and the most common type of nonfamily households are 1-person households, comprising 8.
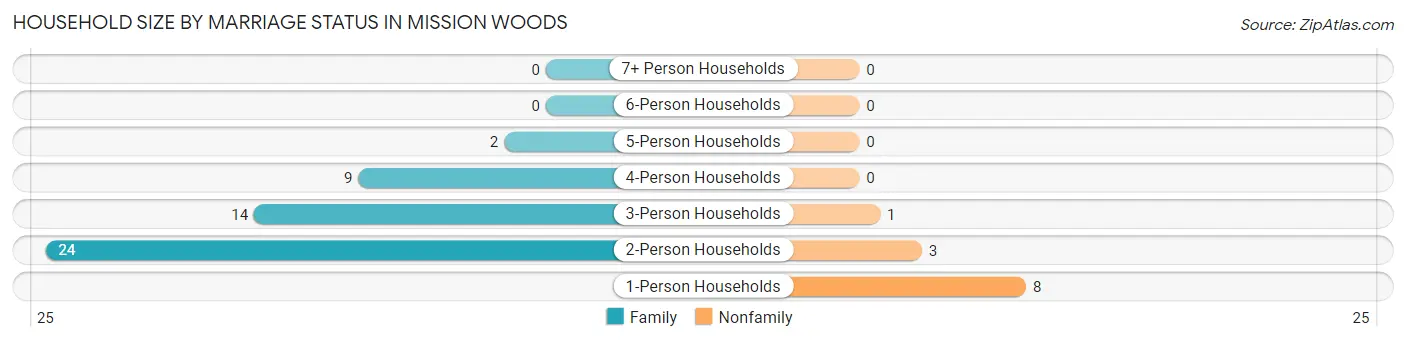
| Household Size | Family Households | Nonfamily Households |
| 1-Person Households | - | 8 (13.1%) |
| 2-Person Households | 24 (39.3%) | 3 (4.9%) |
| 3-Person Households | 14 (23.0%) | 1 (1.6%) |
| 4-Person Households | 9 (14.7%) | 0 (0.0%) |
| 5-Person Households | 2 (3.3%) | 0 (0.0%) |
| 6-Person Households | 0 (0.0%) | 0 (0.0%) |
| 7+ Person Households | 0 (0.0%) | 0 (0.0%) |
| Total | 49 (80.3%) | 12 (19.7%) |
Female Fertility in Mission Woods
Fertility by Age in Mission Woods
Average fertility rate in Mission Woods is 38.0 births per 1,000 women. Women in the age bracket of 35 to 50 years have the highest fertility rate with 53.0 births per 1,000 women. Women in the age bracket of 35 to 50 years acount for 100.0% of all women with births.
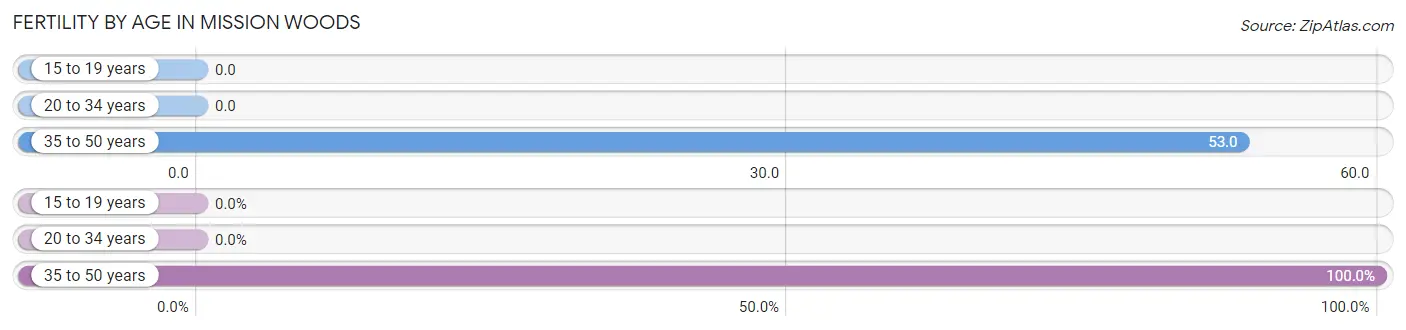
| Age Bracket | Women with Births | Births / 1,000 Women |
| 15 to 19 years | 0 (0.0%) | 0.0 |
| 20 to 34 years | 0 (0.0%) | 0.0 |
| 35 to 50 years | 1 (100.0%) | 53.0 |
| Total | 1 (100.0%) | 38.0 |
Fertility by Age by Marriage Status in Mission Woods
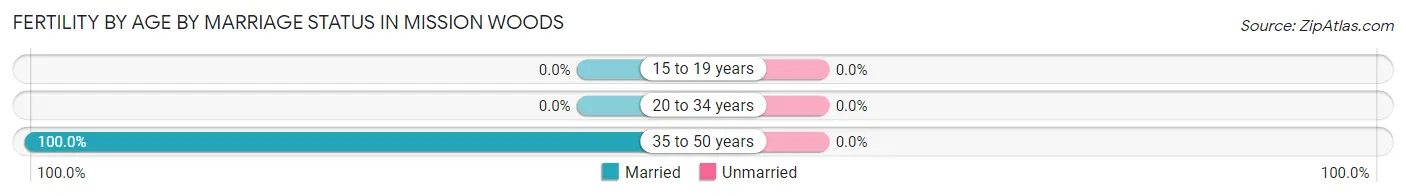
| Age Bracket | Married | Unmarried |
| 15 to 19 years | 0 (0.0%) | 0 (0.0%) |
| 20 to 34 years | 0 (0.0%) | 0 (0.0%) |
| 35 to 50 years | 1 (100.0%) | 0 (0.0%) |
| Total | 1 (100.0%) | 0 (0.0%) |
Fertility by Education in Mission Woods
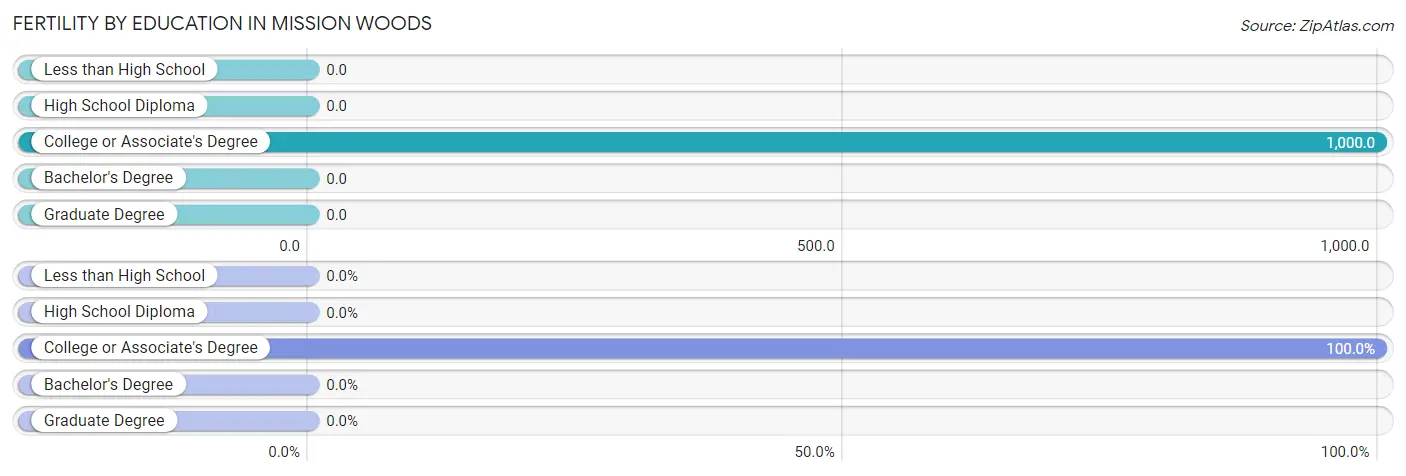
| Educational Attainment | Women with Births | Births / 1,000 Women |
| Less than High School | 0 (0.0%) | 0.0 |
| High School Diploma | 0 (0.0%) | 0.0 |
| College or Associate's Degree | 1 (100.0%) | 1,000.0 |
| Bachelor's Degree | 0 (0.0%) | 0.0 |
| Graduate Degree | 0 (0.0%) | 0.0 |
| Total | 1 (100.0%) | 38.0 |
Fertility by Education by Marriage Status in Mission Woods
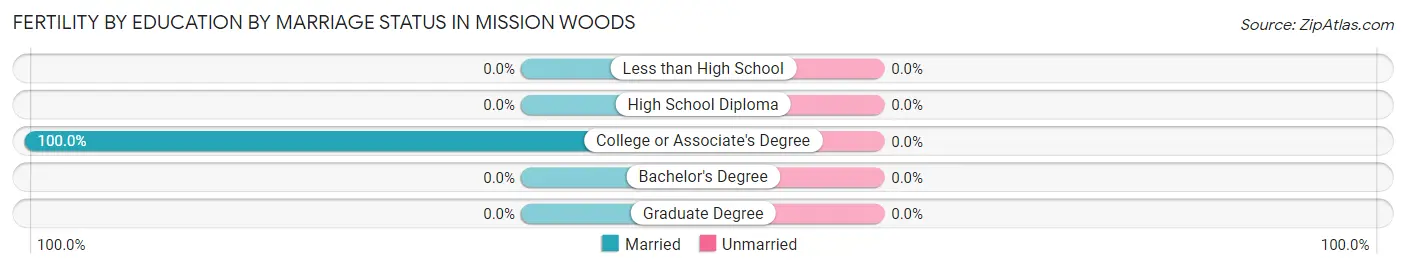
| Educational Attainment | Married | Unmarried |
| Less than High School | 0 (0.0%) | 0 (0.0%) |
| High School Diploma | 0 (0.0%) | 0 (0.0%) |
| College or Associate's Degree | 1 (100.0%) | 0 (0.0%) |
| Bachelor's Degree | 0 (0.0%) | 0 (0.0%) |
| Graduate Degree | 0 (0.0%) | 0 (0.0%) |
| Total | 1 (100.0%) | 0 (0.0%) |
Employment Characteristics in Mission Woods
Employment by Class of Employer in Mission Woods
Among the 81 employed individuals in Mission Woods, private company employees (35 | 43.2%), not-for-profit organizations (19 | 23.5%), and self-employed (incorporated) (14 | 17.3%) make up the most common classes of employment.
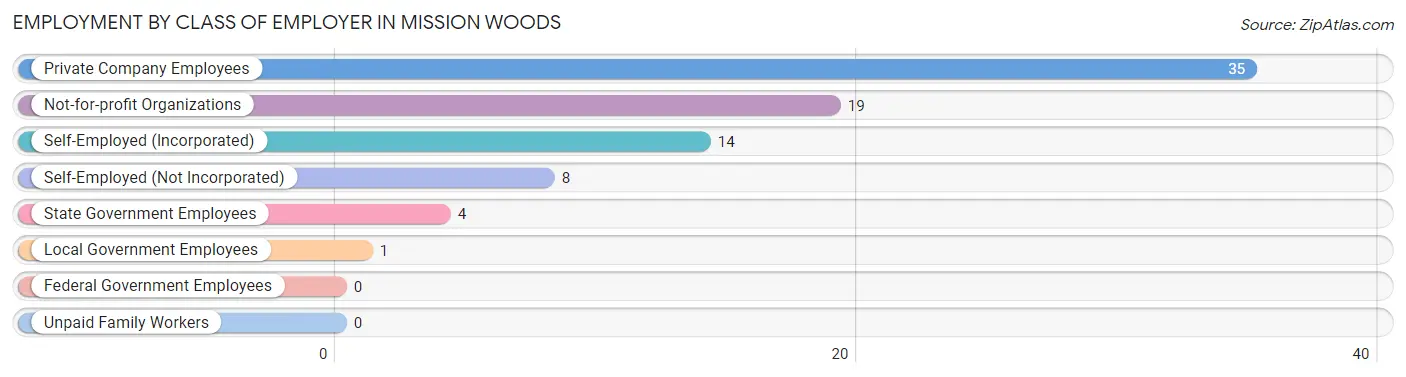
| Employer Class | # Employees | % Employees |
| Private Company Employees | 35 | 43.2% |
| Self-Employed (Incorporated) | 14 | 17.3% |
| Self-Employed (Not Incorporated) | 8 | 9.9% |
| Not-for-profit Organizations | 19 | 23.5% |
| Local Government Employees | 1 | 1.2% |
| State Government Employees | 4 | 4.9% |
| Federal Government Employees | 0 | 0.0% |
| Unpaid Family Workers | 0 | 0.0% |
| Total | 81 | 100.0% |
Employment Status by Age in Mission Woods
According to the labor force statistics for Mission Woods, out of the total population over 16 years of age (120), 71.7% or 86 individuals are in the labor force, with 5.8% or 5 of them unemployed. The age group with the highest labor force participation rate is 16 to 19 years, with 100.0% or 1 individuals in the labor force. Within the labor force, the 20 to 24 years age range has the highest percentage of unemployed individuals, with 100.0% or 2 of them being unemployed.
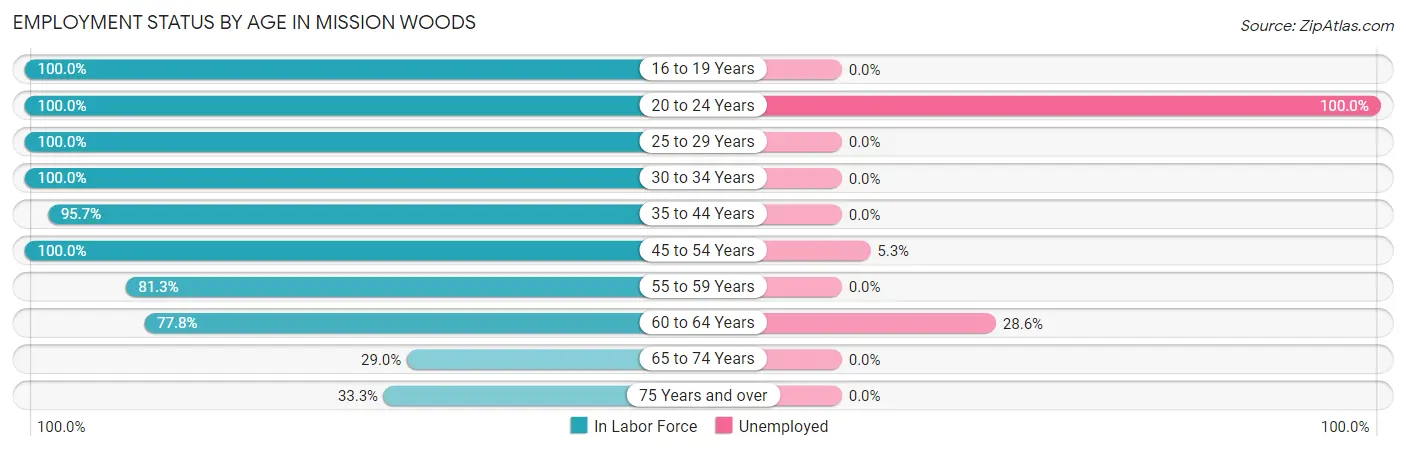
| Age Bracket | In Labor Force | Unemployed |
| 16 to 19 Years | 1 (100.0%) | 0 (0.0%) |
| 20 to 24 Years | 2 (100.0%) | 2 (100.0%) |
| 25 to 29 Years | 6 (100.0%) | 0 (0.0%) |
| 30 to 34 Years | 4 (100.0%) | 0 (0.0%) |
| 35 to 44 Years | 22 (95.7%) | 0 (0.0%) |
| 45 to 54 Years | 19 (100.0%) | 1 (5.3%) |
| 55 to 59 Years | 13 (81.3%) | 0 (0.0%) |
| 60 to 64 Years | 7 (77.8%) | 2 (28.6%) |
| 65 to 74 Years | 9 (29.0%) | 0 (0.0%) |
| 75 Years and over | 3 (33.3%) | 0 (0.0%) |
| Total | 86 (71.7%) | 5 (5.8%) |
Employment Status by Educational Attainment in Mission Woods
According to labor force statistics for Mission Woods, 92.2% of individuals (71) out of the total population between 25 and 64 years of age (77) are in the labor force, with 4.2% or 3 of them being unemployed. The group with the highest labor force participation rate are those with the educational attainment of high school diploma, with 100.0% or 3 individuals in the labor force. Within the labor force, individuals with bachelor's degree or higher education have the highest percentage of unemployment, with 4.8% or 3 of them being unemployed.
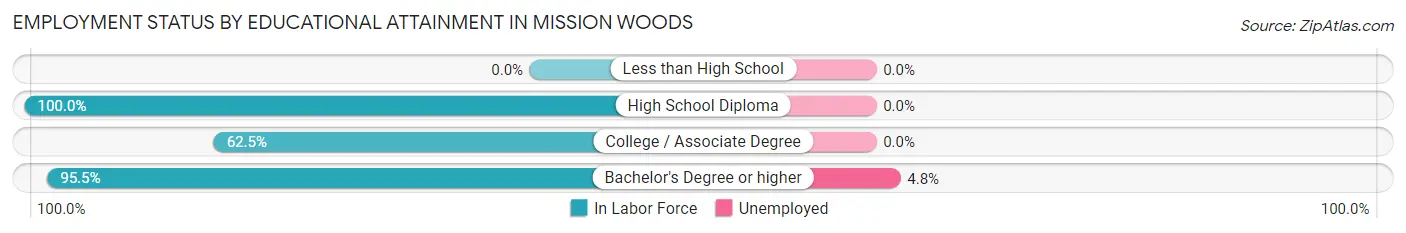
| Educational Attainment | In Labor Force | Unemployed |
| Less than High School | 0 (0.0%) | 0 (0.0%) |
| High School Diploma | 3 (100.0%) | 0 (0.0%) |
| College / Associate Degree | 5 (62.5%) | 0 (0.0%) |
| Bachelor's Degree or higher | 63 (95.5%) | 3 (4.8%) |
| Total | 71 (92.2%) | 3 (4.2%) |
Employment Occupations by Sex in Mission Woods
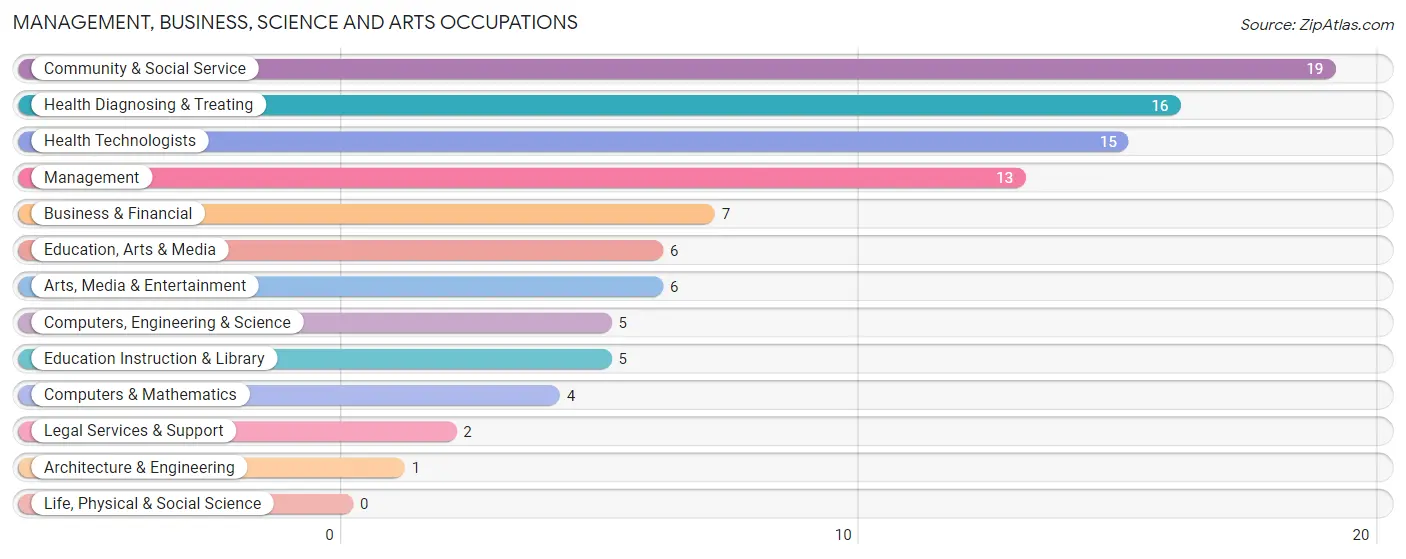
Management, Business, Science and Arts Occupations
The most common Management, Business, Science and Arts occupations in Mission Woods are Community & Social Service (19 | 23.5%), Health Diagnosing & Treating (16 | 19.8%), Health Technologists (15 | 18.5%), Management (13 | 16.1%), and Business & Financial (7 | 8.6%).
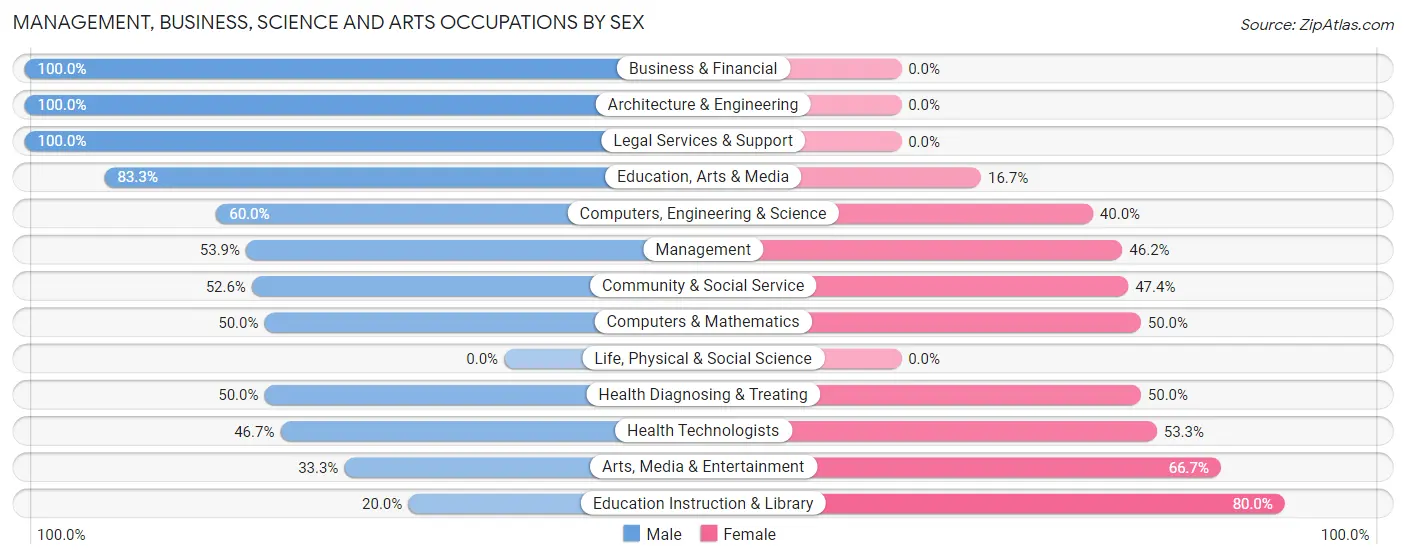
Management, Business, Science and Arts Occupations by Sex
Within the Management, Business, Science and Arts occupations in Mission Woods, the most male-oriented occupations are Business & Financial (100.0%), Architecture & Engineering (100.0%), and Legal Services & Support (100.0%), while the most female-oriented occupations are Education Instruction & Library (80.0%), Arts, Media & Entertainment (66.7%), and Health Technologists (53.3%).
| Occupation | Male | Female |
| Management | 7 (53.8%) | 6 (46.2%) |
| Business & Financial | 7 (100.0%) | 0 (0.0%) |
| Computers, Engineering & Science | 3 (60.0%) | 2 (40.0%) |
| Computers & Mathematics | 2 (50.0%) | 2 (50.0%) |
| Architecture & Engineering | 1 (100.0%) | 0 (0.0%) |
| Life, Physical & Social Science | 0 (0.0%) | 0 (0.0%) |
| Community & Social Service | 10 (52.6%) | 9 (47.4%) |
| Education, Arts & Media | 5 (83.3%) | 1 (16.7%) |
| Legal Services & Support | 2 (100.0%) | 0 (0.0%) |
| Education Instruction & Library | 1 (20.0%) | 4 (80.0%) |
| Arts, Media & Entertainment | 2 (33.3%) | 4 (66.7%) |
| Health Diagnosing & Treating | 8 (50.0%) | 8 (50.0%) |
| Health Technologists | 7 (46.7%) | 8 (53.3%) |
| Total (Category) | 35 (58.3%) | 25 (41.7%) |
| Total (Overall) | 50 (61.7%) | 31 (38.3%) |
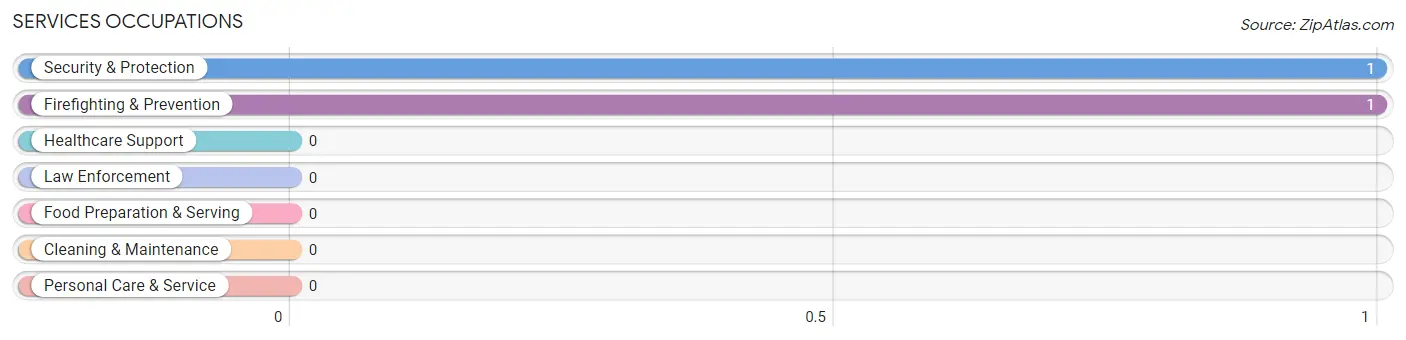
Services Occupations
The most common Services occupations in Mission Woods are Security & Protection (1 | 1.2%), and Firefighting & Prevention (1 | 1.2%).
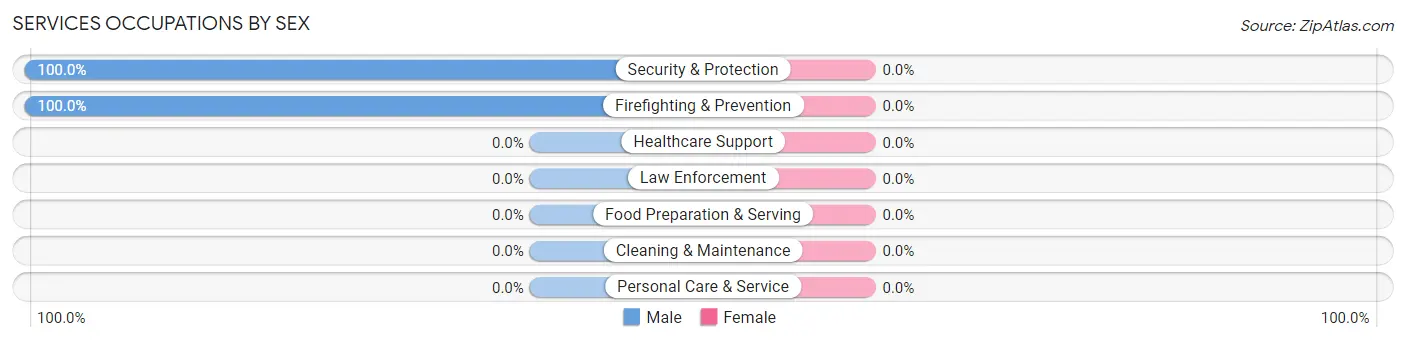
Services Occupations by Sex
| Occupation | Male | Female |
| Healthcare Support | 0 (0.0%) | 0 (0.0%) |
| Security & Protection | 1 (100.0%) | 0 (0.0%) |
| Firefighting & Prevention | 1 (100.0%) | 0 (0.0%) |
| Law Enforcement | 0 (0.0%) | 0 (0.0%) |
| Food Preparation & Serving | 0 (0.0%) | 0 (0.0%) |
| Cleaning & Maintenance | 0 (0.0%) | 0 (0.0%) |
| Personal Care & Service | 0 (0.0%) | 0 (0.0%) |
| Total (Category) | 1 (100.0%) | 0 (0.0%) |
| Total (Overall) | 50 (61.7%) | 31 (38.3%) |
Sales and Office Occupations
The most common Sales and Office occupations in Mission Woods are , and Sales & Related (13 | 16.1%).
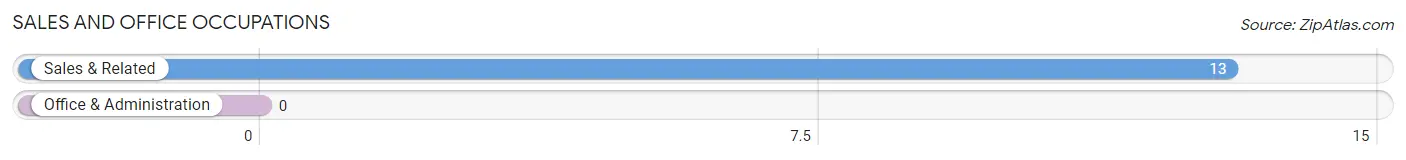
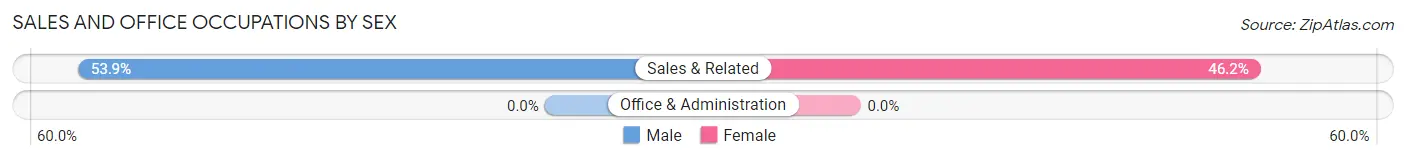
Sales and Office Occupations by Sex
| Occupation | Male | Female |
| Sales & Related | 7 (53.8%) | 6 (46.2%) |
| Office & Administration | 0 (0.0%) | 0 (0.0%) |
| Total (Category) | 7 (53.8%) | 6 (46.2%) |
| Total (Overall) | 50 (61.7%) | 31 (38.3%) |
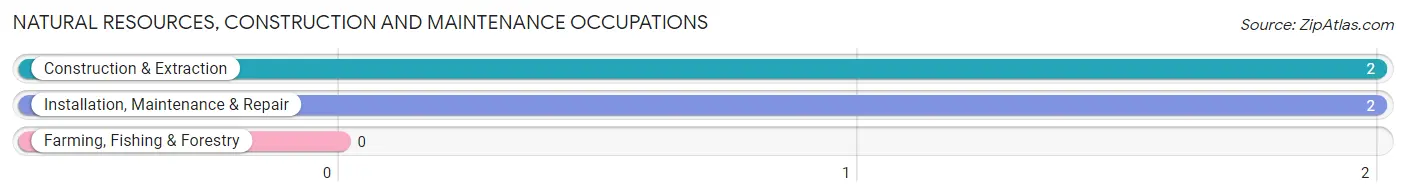
Natural Resources, Construction and Maintenance Occupations
The most common Natural Resources, Construction and Maintenance occupations in Mission Woods are Construction & Extraction (2 | 2.5%), and Installation, Maintenance & Repair (2 | 2.5%).
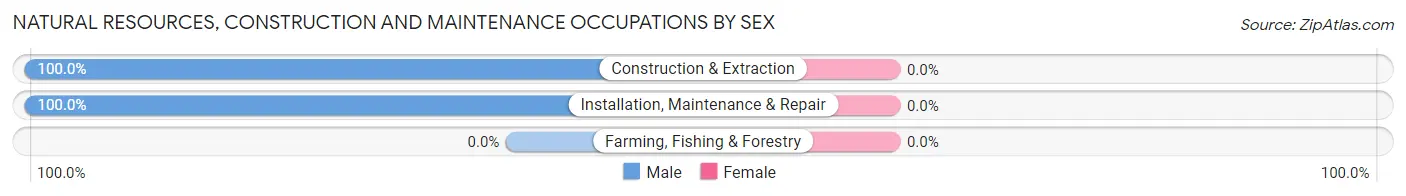
Natural Resources, Construction and Maintenance Occupations by Sex
| Occupation | Male | Female |
| Farming, Fishing & Forestry | 0 (0.0%) | 0 (0.0%) |
| Construction & Extraction | 2 (100.0%) | 0 (0.0%) |
| Installation, Maintenance & Repair | 2 (100.0%) | 0 (0.0%) |
| Total (Category) | 4 (100.0%) | 0 (0.0%) |
| Total (Overall) | 50 (61.7%) | 31 (38.3%) |
Production, Transportation and Moving Occupations
The most common Production, Transportation and Moving occupations in Mission Woods are Production (2 | 2.5%), and Transportation (1 | 1.2%).
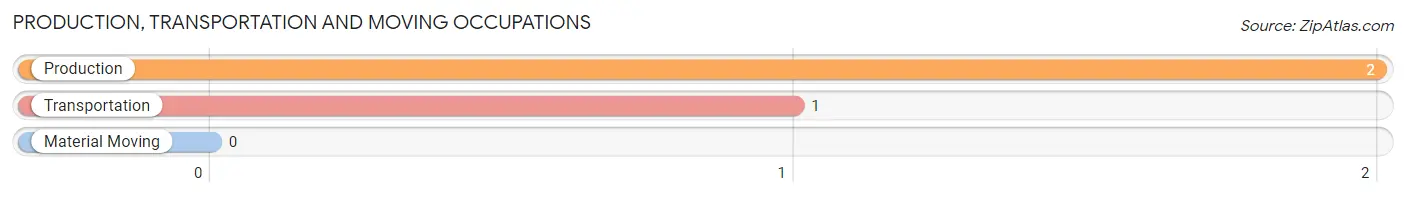
Production, Transportation and Moving Occupations by Sex
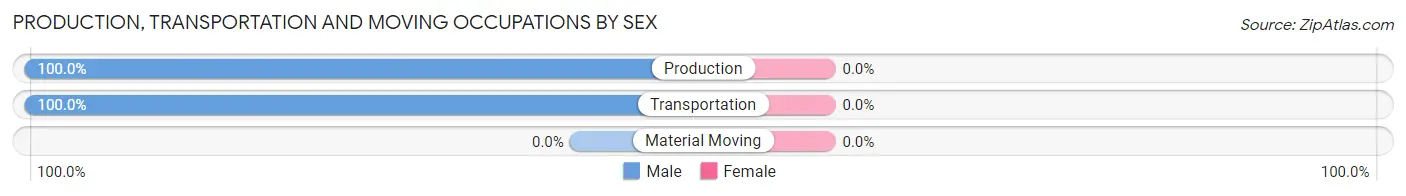
| Occupation | Male | Female |
| Production | 2 (100.0%) | 0 (0.0%) |
| Transportation | 1 (100.0%) | 0 (0.0%) |
| Material Moving | 0 (0.0%) | 0 (0.0%) |
| Total (Category) | 3 (100.0%) | 0 (0.0%) |
| Total (Overall) | 50 (61.7%) | 31 (38.3%) |
Employment Industries by Sex in Mission Woods
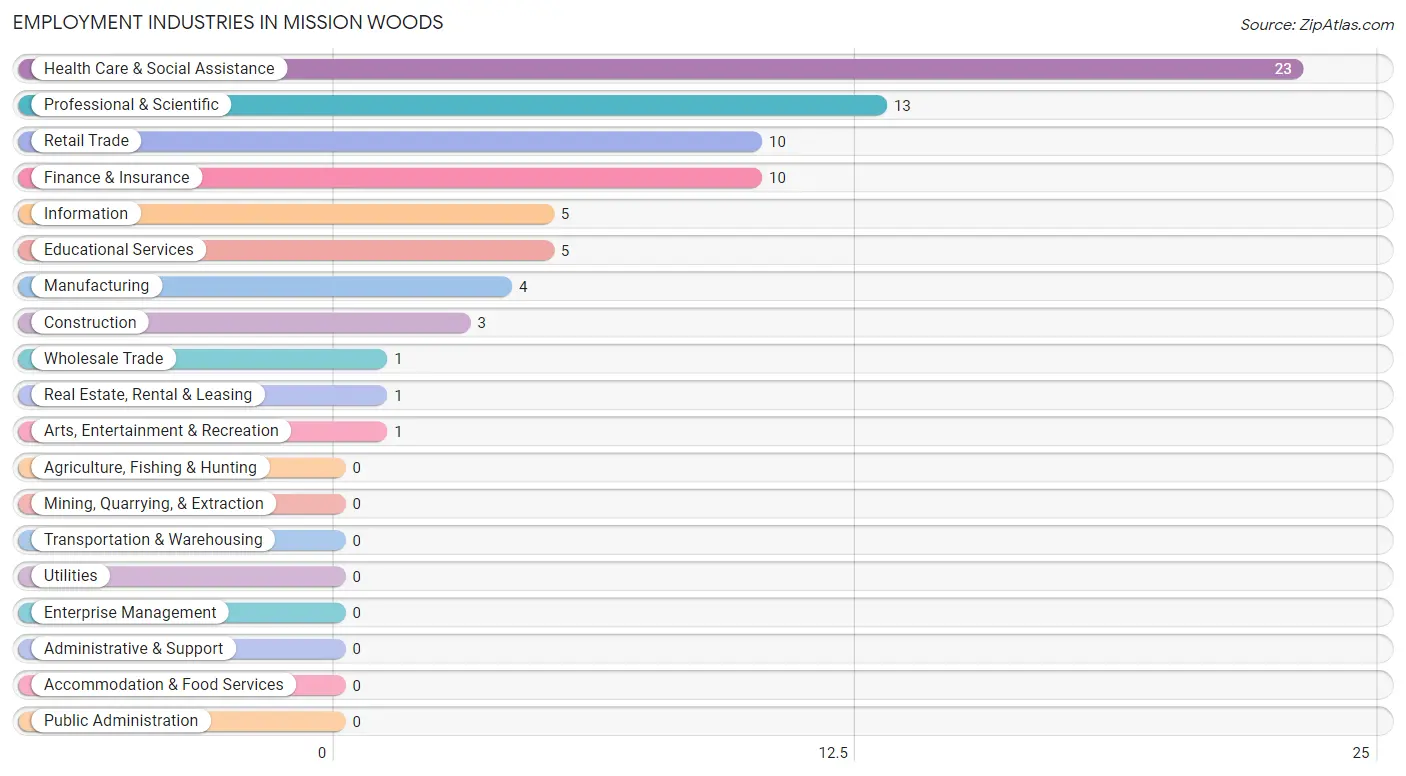
Employment Industries in Mission Woods
The major employment industries in Mission Woods include Health Care & Social Assistance (23 | 28.4%), Professional & Scientific (13 | 16.1%), Retail Trade (10 | 12.3%), Finance & Insurance (10 | 12.3%), and Information (5 | 6.2%).
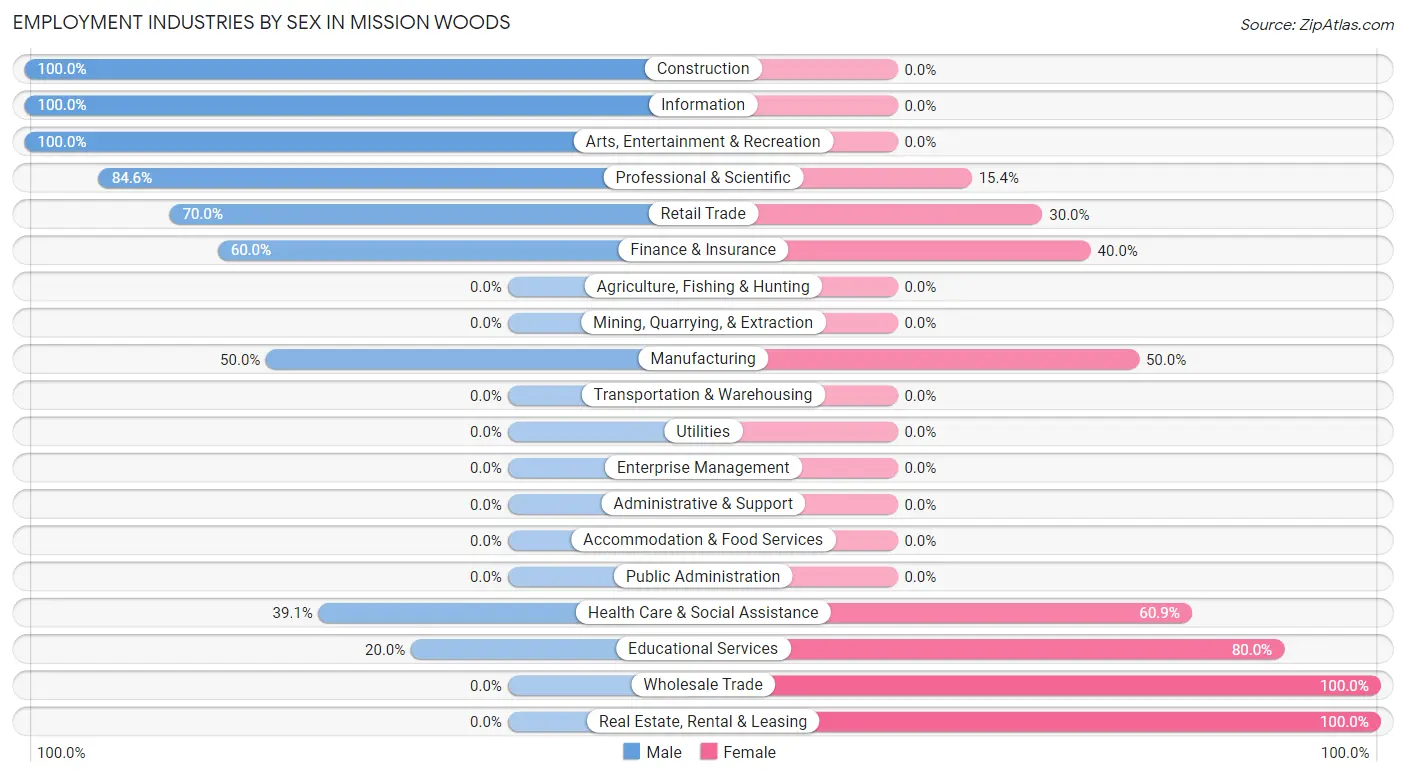
Employment Industries by Sex in Mission Woods
The Mission Woods industries that see more men than women are Construction (100.0%), Information (100.0%), and Arts, Entertainment & Recreation (100.0%), whereas the industries that tend to have a higher number of women are Wholesale Trade (100.0%), Real Estate, Rental & Leasing (100.0%), and Educational Services (80.0%).
| Industry | Male | Female |
| Agriculture, Fishing & Hunting | 0 (0.0%) | 0 (0.0%) |
| Mining, Quarrying, & Extraction | 0 (0.0%) | 0 (0.0%) |
| Construction | 3 (100.0%) | 0 (0.0%) |
| Manufacturing | 2 (50.0%) | 2 (50.0%) |
| Wholesale Trade | 0 (0.0%) | 1 (100.0%) |
| Retail Trade | 7 (70.0%) | 3 (30.0%) |
| Transportation & Warehousing | 0 (0.0%) | 0 (0.0%) |
| Utilities | 0 (0.0%) | 0 (0.0%) |
| Information | 5 (100.0%) | 0 (0.0%) |
| Finance & Insurance | 6 (60.0%) | 4 (40.0%) |
| Real Estate, Rental & Leasing | 0 (0.0%) | 1 (100.0%) |
| Professional & Scientific | 11 (84.6%) | 2 (15.4%) |
| Enterprise Management | 0 (0.0%) | 0 (0.0%) |
| Administrative & Support | 0 (0.0%) | 0 (0.0%) |
| Educational Services | 1 (20.0%) | 4 (80.0%) |
| Health Care & Social Assistance | 9 (39.1%) | 14 (60.9%) |
| Arts, Entertainment & Recreation | 1 (100.0%) | 0 (0.0%) |
| Accommodation & Food Services | 0 (0.0%) | 0 (0.0%) |
| Public Administration | 0 (0.0%) | 0 (0.0%) |
| Total | 50 (61.7%) | 31 (38.3%) |
Education in Mission Woods
School Enrollment in Mission Woods
The most common levels of schooling among the 29 students in Mission Woods are elementary school (11 | 37.9%), middle school (9 | 31.0%), and high school (5 | 17.2%).
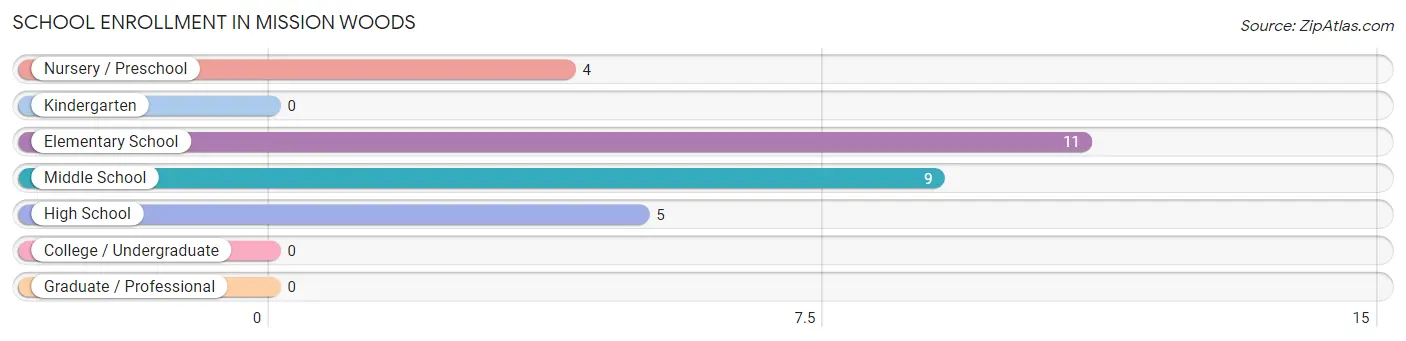
| School Level | # Students | % Students |
| Nursery / Preschool | 4 | 13.8% |
| Kindergarten | 0 | 0.0% |
| Elementary School | 11 | 37.9% |
| Middle School | 9 | 31.0% |
| High School | 5 | 17.2% |
| College / Undergraduate | 0 | 0.0% |
| Graduate / Professional | 0 | 0.0% |
| Total | 29 | 100.0% |
School Enrollment by Age by Funding Source in Mission Woods
Out of a total of 29 students who are enrolled in schools in Mission Woods, 6 (20.7%) attend a private institution, while the remaining 23 (79.3%) are enrolled in public schools. The age group of 5 to 9 year old has the highest likelihood of being enrolled in private schools, with 5 (50.0% in the age bracket) enrolled. Conversely, the age group of 3 to 4 year olds has the lowest likelihood of being enrolled in a private school, with 2 (100.0% in the age bracket) attending a public institution.
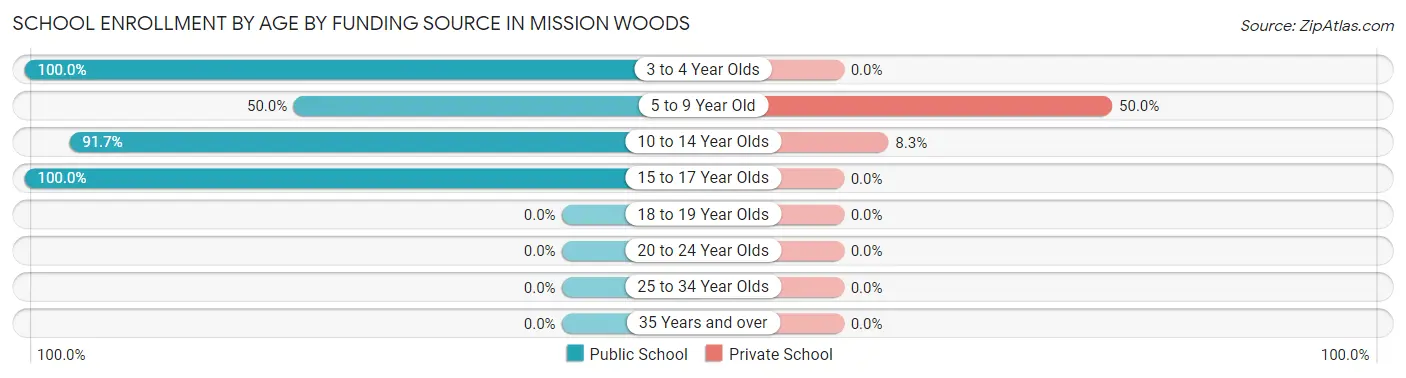
| Age Bracket | Public School | Private School |
| 3 to 4 Year Olds | 2 (100.0%) | 0 (0.0%) |
| 5 to 9 Year Old | 5 (50.0%) | 5 (50.0%) |
| 10 to 14 Year Olds | 11 (91.7%) | 1 (8.3%) |
| 15 to 17 Year Olds | 5 (100.0%) | 0 (0.0%) |
| 18 to 19 Year Olds | 0 (0.0%) | 0 (0.0%) |
| 20 to 24 Year Olds | 0 (0.0%) | 0 (0.0%) |
| 25 to 34 Year Olds | 0 (0.0%) | 0 (0.0%) |
| 35 Years and over | 0 (0.0%) | 0 (0.0%) |
| Total | 23 (79.3%) | 6 (20.7%) |
Educational Attainment by Field of Study in Mission Woods
Business (31 | 27.9%), bio, nature & agricultural (13 | 11.7%), communications (11 | 9.9%), science & technology (10 | 9.0%), and social sciences (7 | 6.3%) are the most common fields of study among 111 individuals in Mission Woods who have obtained a bachelor's degree or higher.
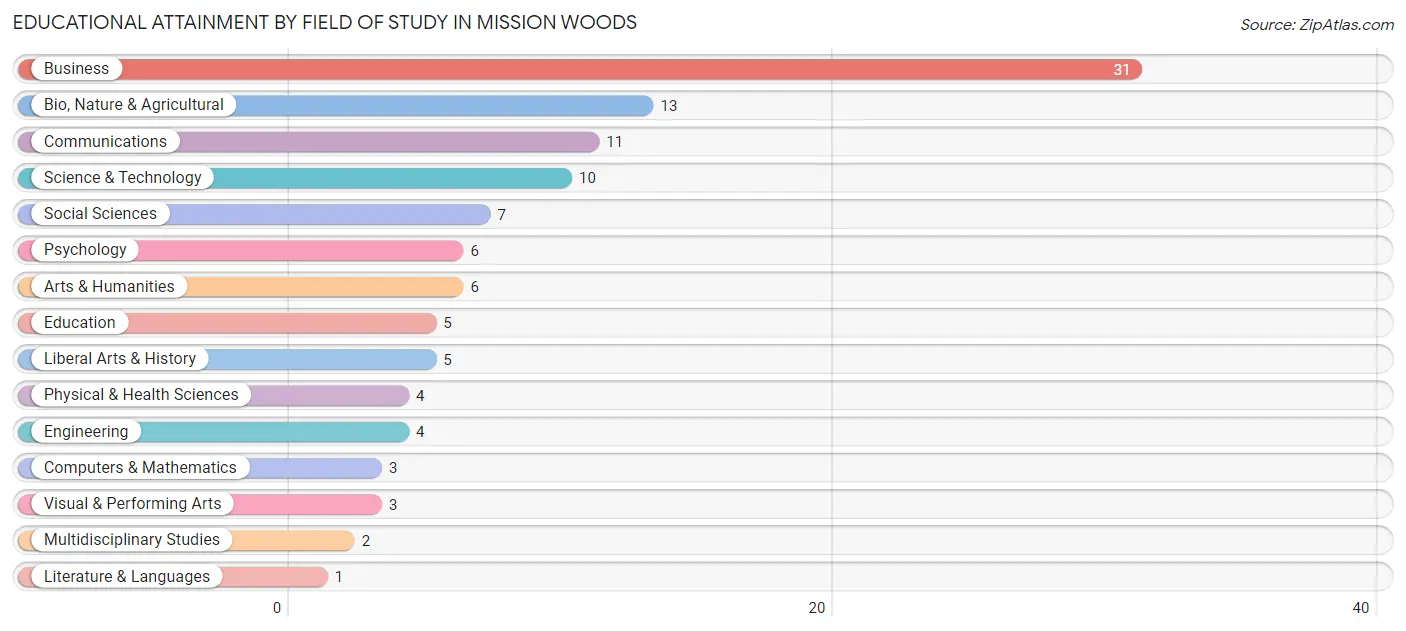
| Field of Study | # Graduates | % Graduates |
| Computers & Mathematics | 3 | 2.7% |
| Bio, Nature & Agricultural | 13 | 11.7% |
| Physical & Health Sciences | 4 | 3.6% |
| Psychology | 6 | 5.4% |
| Social Sciences | 7 | 6.3% |
| Engineering | 4 | 3.6% |
| Multidisciplinary Studies | 2 | 1.8% |
| Science & Technology | 10 | 9.0% |
| Business | 31 | 27.9% |
| Education | 5 | 4.5% |
| Literature & Languages | 1 | 0.9% |
| Liberal Arts & History | 5 | 4.5% |
| Visual & Performing Arts | 3 | 2.7% |
| Communications | 11 | 9.9% |
| Arts & Humanities | 6 | 5.4% |
| Total | 111 | 100.0% |
Transportation & Commute in Mission Woods
Vehicle Availability by Sex in Mission Woods
The most prevalent vehicle ownership categories in Mission Woods are males with 2 vehicles (32, accounting for 64.0%) and females with 2 vehicles (19, making up 103.2%).
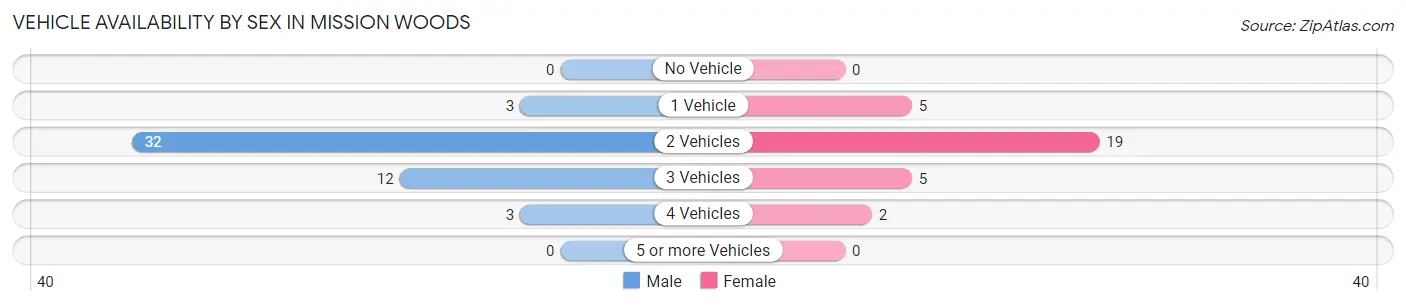
| Vehicles Available | Male | Female |
| No Vehicle | 0 (0.0%) | 0 (0.0%) |
| 1 Vehicle | 3 (6.0%) | 5 (16.1%) |
| 2 Vehicles | 32 (64.0%) | 19 (61.3%) |
| 3 Vehicles | 12 (24.0%) | 5 (16.1%) |
| 4 Vehicles | 3 (6.0%) | 2 (6.5%) |
| 5 or more Vehicles | 0 (0.0%) | 0 (0.0%) |
| Total | 50 (100.0%) | 31 (100.0%) |
Commute Time in Mission Woods
The most frequently occuring commute durations in Mission Woods are 5 to 9 minutes (20 commuters, 29.0%), 15 to 19 minutes (15 commuters, 21.7%), and 20 to 24 minutes (12 commuters, 17.4%).
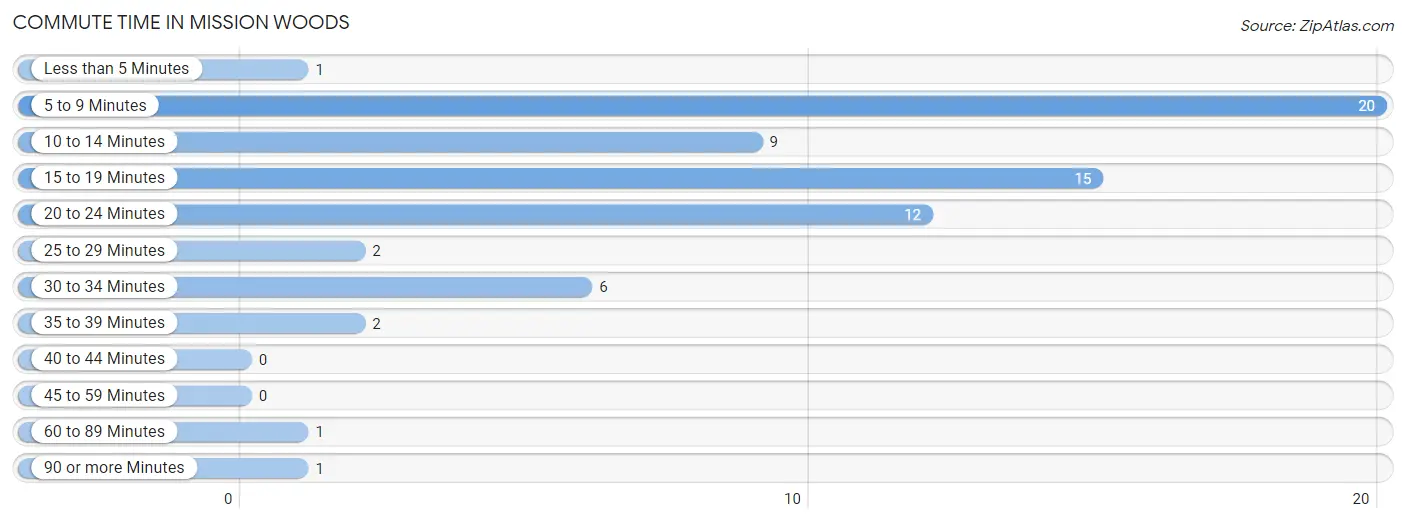
| Commute Time | # Commuters | % Commuters |
| Less than 5 Minutes | 1 | 1.5% |
| 5 to 9 Minutes | 20 | 29.0% |
| 10 to 14 Minutes | 9 | 13.0% |
| 15 to 19 Minutes | 15 | 21.7% |
| 20 to 24 Minutes | 12 | 17.4% |
| 25 to 29 Minutes | 2 | 2.9% |
| 30 to 34 Minutes | 6 | 8.7% |
| 35 to 39 Minutes | 2 | 2.9% |
| 40 to 44 Minutes | 0 | 0.0% |
| 45 to 59 Minutes | 0 | 0.0% |
| 60 to 89 Minutes | 1 | 1.5% |
| 90 or more Minutes | 1 | 1.5% |
Commute Time by Sex in Mission Woods
The most common commute times in Mission Woods are 5 to 9 minutes (14 commuters, 32.6%) for males and 15 to 19 minutes (9 commuters, 34.6%) for females.
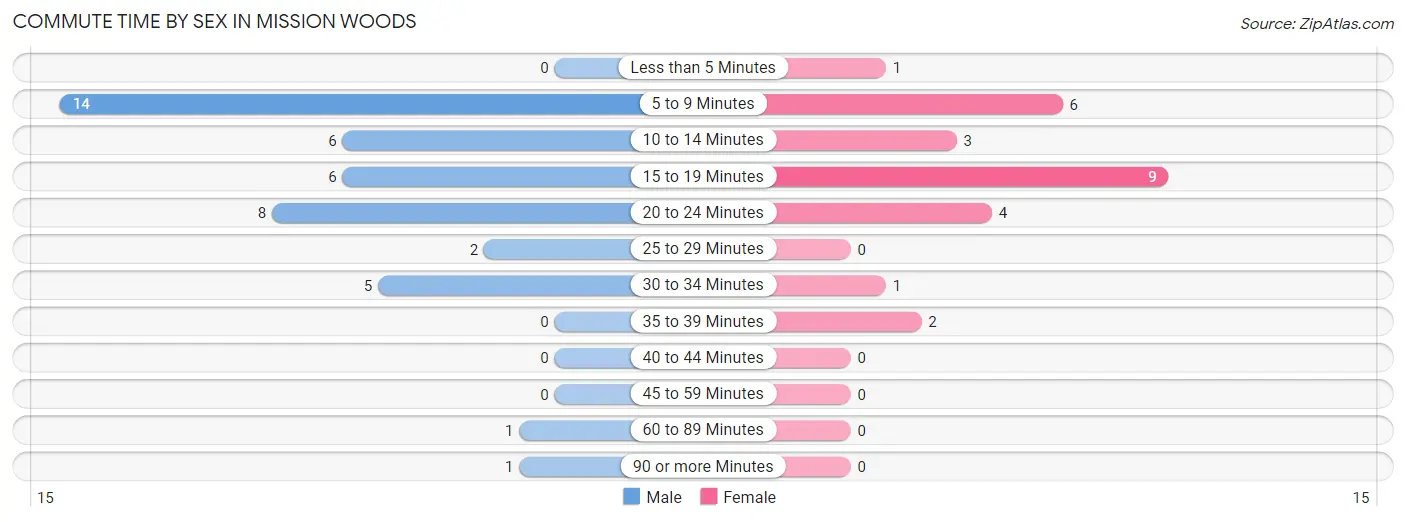
| Commute Time | Male | Female |
| Less than 5 Minutes | 0 (0.0%) | 1 (3.8%) |
| 5 to 9 Minutes | 14 (32.6%) | 6 (23.1%) |
| 10 to 14 Minutes | 6 (14.0%) | 3 (11.5%) |
| 15 to 19 Minutes | 6 (14.0%) | 9 (34.6%) |
| 20 to 24 Minutes | 8 (18.6%) | 4 (15.4%) |
| 25 to 29 Minutes | 2 (4.6%) | 0 (0.0%) |
| 30 to 34 Minutes | 5 (11.6%) | 1 (3.8%) |
| 35 to 39 Minutes | 0 (0.0%) | 2 (7.7%) |
| 40 to 44 Minutes | 0 (0.0%) | 0 (0.0%) |
| 45 to 59 Minutes | 0 (0.0%) | 0 (0.0%) |
| 60 to 89 Minutes | 1 (2.3%) | 0 (0.0%) |
| 90 or more Minutes | 1 (2.3%) | 0 (0.0%) |
Time of Departure to Work by Sex in Mission Woods
The most frequent times of departure to work in Mission Woods are 8:00 AM to 8:29 AM (16, 37.2%) for males and 8:30 AM to 8:59 AM (8, 30.8%) for females.
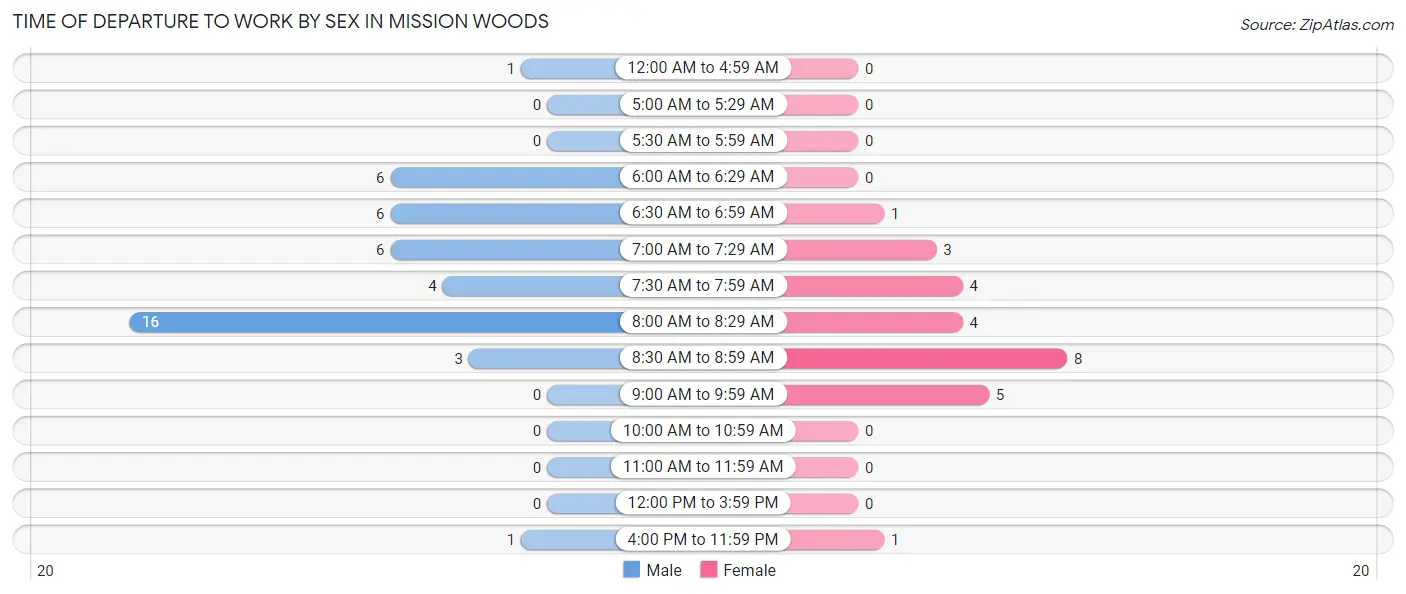
| Time of Departure | Male | Female |
| 12:00 AM to 4:59 AM | 1 (2.3%) | 0 (0.0%) |
| 5:00 AM to 5:29 AM | 0 (0.0%) | 0 (0.0%) |
| 5:30 AM to 5:59 AM | 0 (0.0%) | 0 (0.0%) |
| 6:00 AM to 6:29 AM | 6 (14.0%) | 0 (0.0%) |
| 6:30 AM to 6:59 AM | 6 (14.0%) | 1 (3.8%) |
| 7:00 AM to 7:29 AM | 6 (14.0%) | 3 (11.5%) |
| 7:30 AM to 7:59 AM | 4 (9.3%) | 4 (15.4%) |
| 8:00 AM to 8:29 AM | 16 (37.2%) | 4 (15.4%) |
| 8:30 AM to 8:59 AM | 3 (7.0%) | 8 (30.8%) |
| 9:00 AM to 9:59 AM | 0 (0.0%) | 5 (19.2%) |
| 10:00 AM to 10:59 AM | 0 (0.0%) | 0 (0.0%) |
| 11:00 AM to 11:59 AM | 0 (0.0%) | 0 (0.0%) |
| 12:00 PM to 3:59 PM | 0 (0.0%) | 0 (0.0%) |
| 4:00 PM to 11:59 PM | 1 (2.3%) | 1 (3.8%) |
| Total | 43 (100.0%) | 26 (100.0%) |
Housing Occupancy in Mission Woods
Occupancy by Ownership in Mission Woods
Of the total 61 dwellings in Mission Woods, owner-occupied units account for 60 (98.4%), while renter-occupied units make up 1 (1.6%).
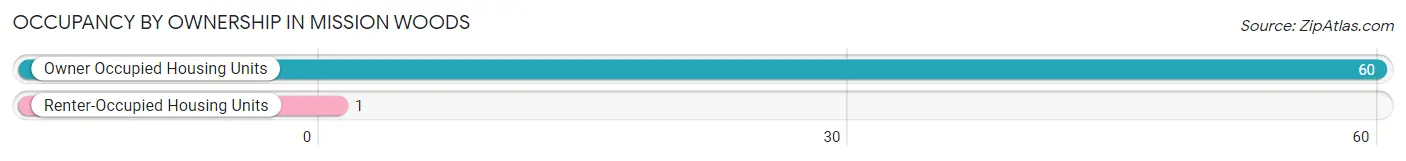
| Occupancy | # Housing Units | % Housing Units |
| Owner Occupied Housing Units | 60 | 98.4% |
| Renter-Occupied Housing Units | 1 | 1.6% |
| Total Occupied Housing Units | 61 | 100.0% |
Occupancy by Household Size in Mission Woods
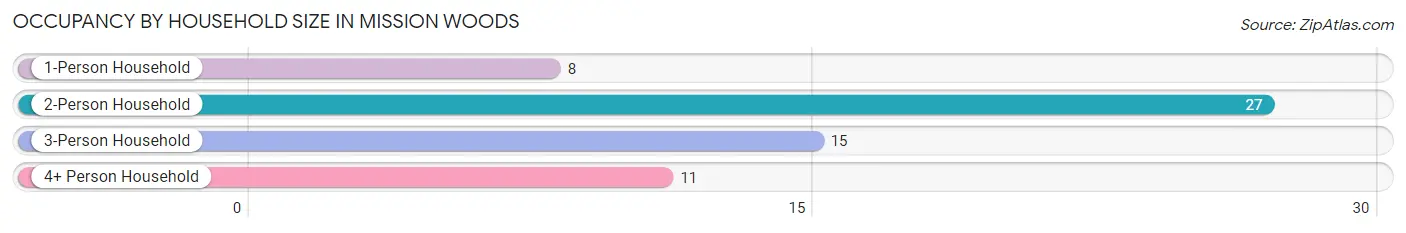
| Household Size | # Housing Units | % Housing Units |
| 1-Person Household | 8 | 13.1% |
| 2-Person Household | 27 | 44.3% |
| 3-Person Household | 15 | 24.6% |
| 4+ Person Household | 11 | 18.0% |
| Total Housing Units | 61 | 100.0% |
Occupancy by Ownership by Household Size in Mission Woods
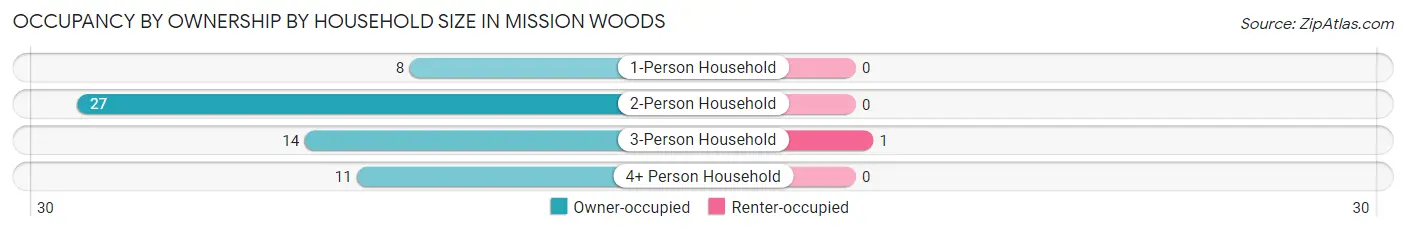
| Household Size | Owner-occupied | Renter-occupied |
| 1-Person Household | 8 (100.0%) | 0 (0.0%) |
| 2-Person Household | 27 (100.0%) | 0 (0.0%) |
| 3-Person Household | 14 (93.3%) | 1 (6.7%) |
| 4+ Person Household | 11 (100.0%) | 0 (0.0%) |
| Total Housing Units | 60 (98.4%) | 1 (1.6%) |
Occupancy by Educational Attainment in Mission Woods
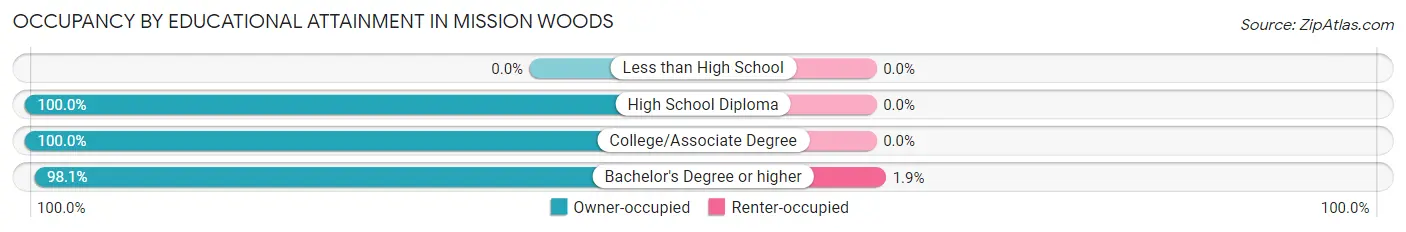
| Household Size | Owner-occupied | Renter-occupied |
| Less than High School | 0 (0.0%) | 0 (0.0%) |
| High School Diploma | 3 (100.0%) | 0 (0.0%) |
| College/Associate Degree | 5 (100.0%) | 0 (0.0%) |
| Bachelor's Degree or higher | 52 (98.1%) | 1 (1.9%) |
Occupancy by Age of Householder in Mission Woods
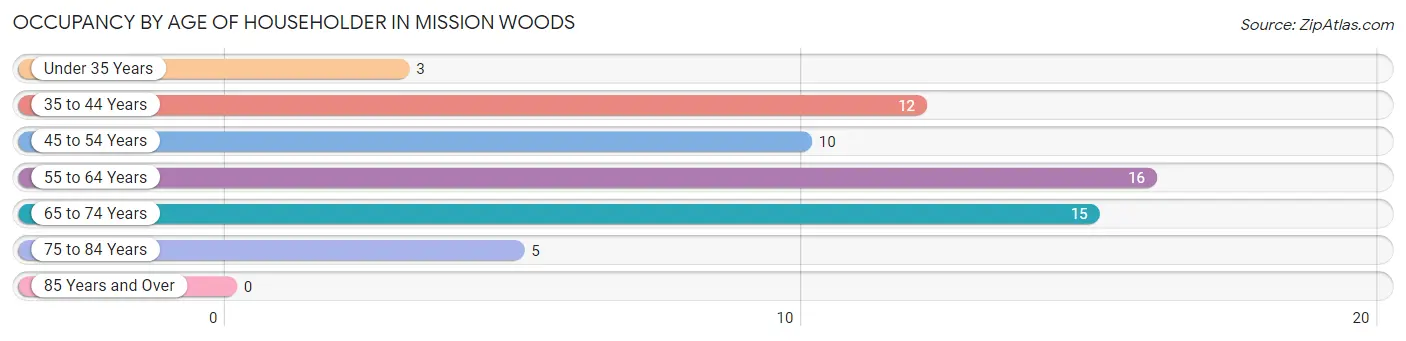
| Age Bracket | # Households | % Households |
| Under 35 Years | 3 | 4.9% |
| 35 to 44 Years | 12 | 19.7% |
| 45 to 54 Years | 10 | 16.4% |
| 55 to 64 Years | 16 | 26.2% |
| 65 to 74 Years | 15 | 24.6% |
| 75 to 84 Years | 5 | 8.2% |
| 85 Years and Over | 0 | 0.0% |
| Total | 61 | 100.0% |
Housing Finances in Mission Woods
Median Income by Occupancy in Mission Woods
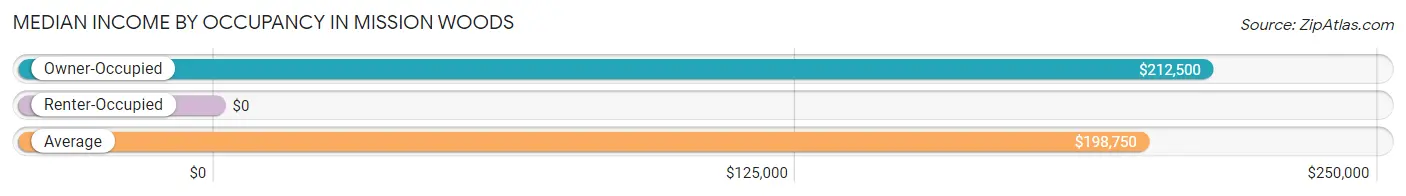
| Occupancy Type | # Households | Median Income |
| Owner-Occupied | 60 (98.4%) | $212,500 |
| Renter-Occupied | 1 (1.6%) | $0 |
| Average | 61 (100.0%) | $198,750 |
Occupancy by Householder Income Bracket in Mission Woods
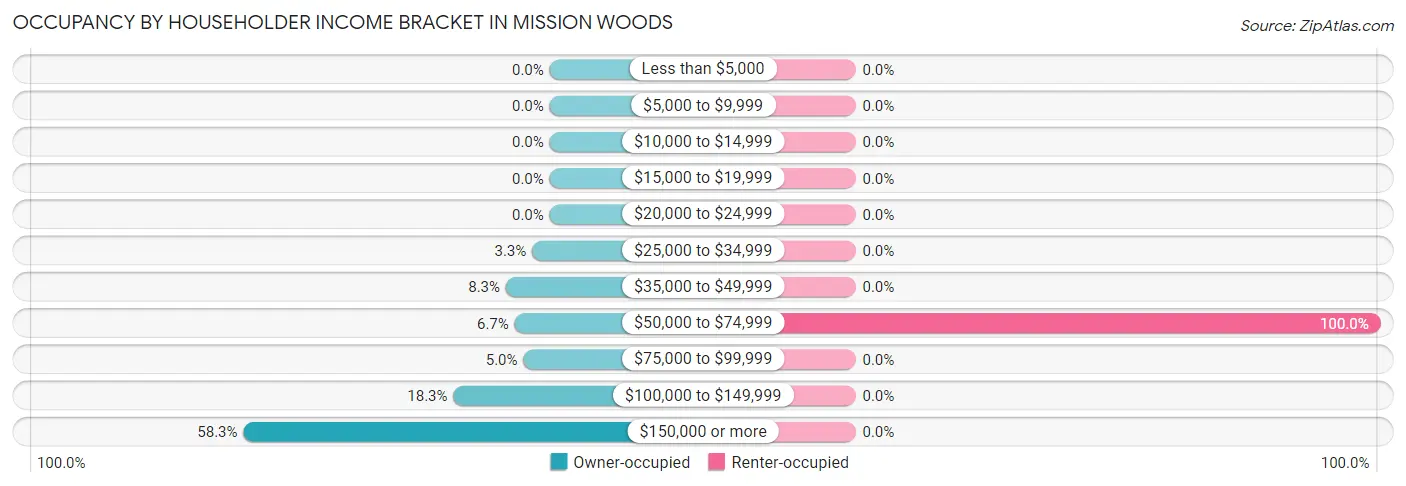
| Income Bracket | Owner-occupied | Renter-occupied |
| Less than $5,000 | 0 (0.0%) | 0 (0.0%) |
| $5,000 to $9,999 | 0 (0.0%) | 0 (0.0%) |
| $10,000 to $14,999 | 0 (0.0%) | 0 (0.0%) |
| $15,000 to $19,999 | 0 (0.0%) | 0 (0.0%) |
| $20,000 to $24,999 | 0 (0.0%) | 0 (0.0%) |
| $25,000 to $34,999 | 2 (3.3%) | 0 (0.0%) |
| $35,000 to $49,999 | 5 (8.3%) | 0 (0.0%) |
| $50,000 to $74,999 | 4 (6.7%) | 1 (100.0%) |
| $75,000 to $99,999 | 3 (5.0%) | 0 (0.0%) |
| $100,000 to $149,999 | 11 (18.3%) | 0 (0.0%) |
| $150,000 or more | 35 (58.3%) | 0 (0.0%) |
| Total | 60 (100.0%) | 1 (100.0%) |
Monthly Housing Cost Tiers in Mission Woods
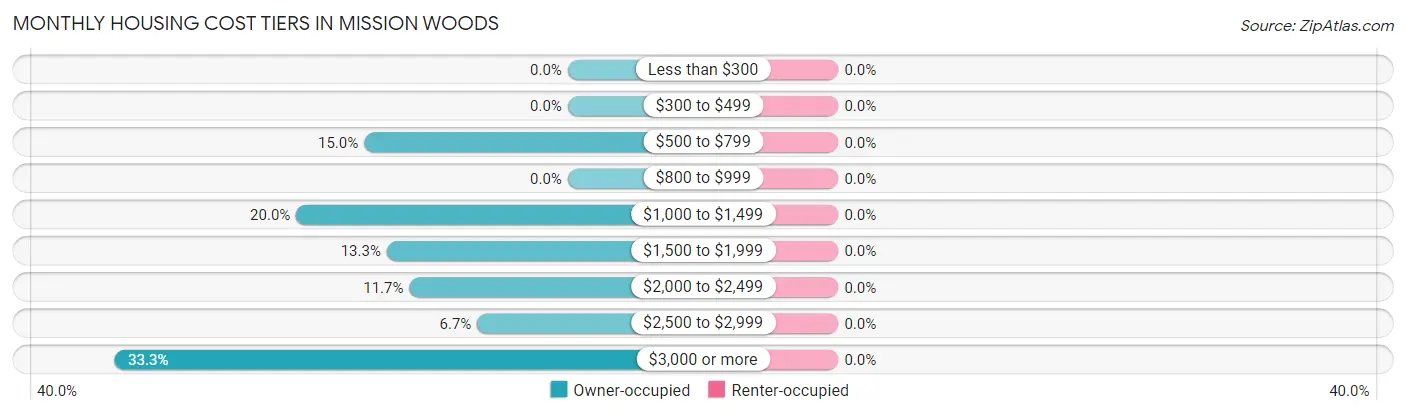
| Monthly Cost | Owner-occupied | Renter-occupied |
| Less than $300 | 0 (0.0%) | 0 (0.0%) |
| $300 to $499 | 0 (0.0%) | 0 (0.0%) |
| $500 to $799 | 9 (15.0%) | 0 (0.0%) |
| $800 to $999 | 0 (0.0%) | 0 (0.0%) |
| $1,000 to $1,499 | 12 (20.0%) | 0 (0.0%) |
| $1,500 to $1,999 | 8 (13.3%) | 0 (0.0%) |
| $2,000 to $2,499 | 7 (11.7%) | 0 (0.0%) |
| $2,500 to $2,999 | 4 (6.7%) | 0 (0.0%) |
| $3,000 or more | 20 (33.3%) | 0 (0.0%) |
| Total | 60 (100.0%) | 1 (100.0%) |
Physical Housing Characteristics in Mission Woods
Housing Structures in Mission Woods
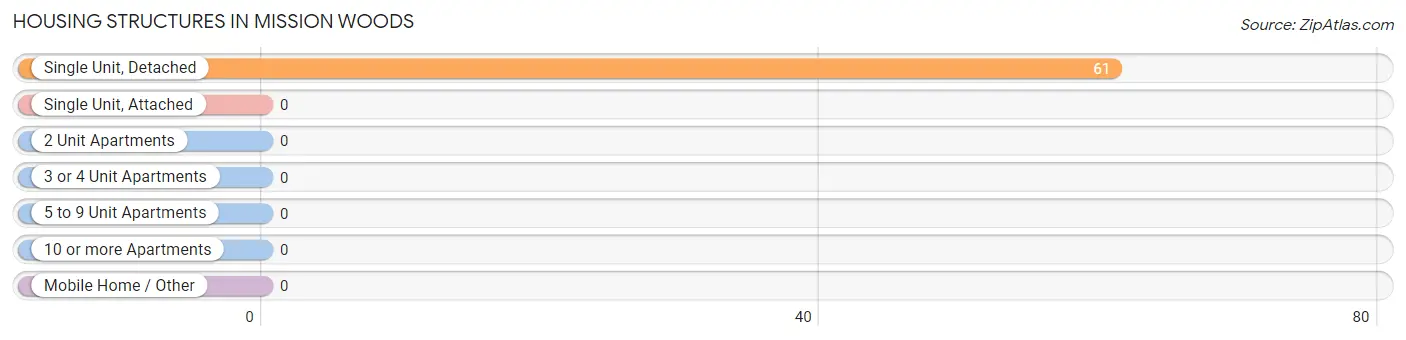
| Structure Type | # Housing Units | % Housing Units |
| Single Unit, Detached | 61 | 100.0% |
| Single Unit, Attached | 0 | 0.0% |
| 2 Unit Apartments | 0 | 0.0% |
| 3 or 4 Unit Apartments | 0 | 0.0% |
| 5 to 9 Unit Apartments | 0 | 0.0% |
| 10 or more Apartments | 0 | 0.0% |
| Mobile Home / Other | 0 | 0.0% |
| Total | 61 | 100.0% |
Housing Structures by Occupancy in Mission Woods
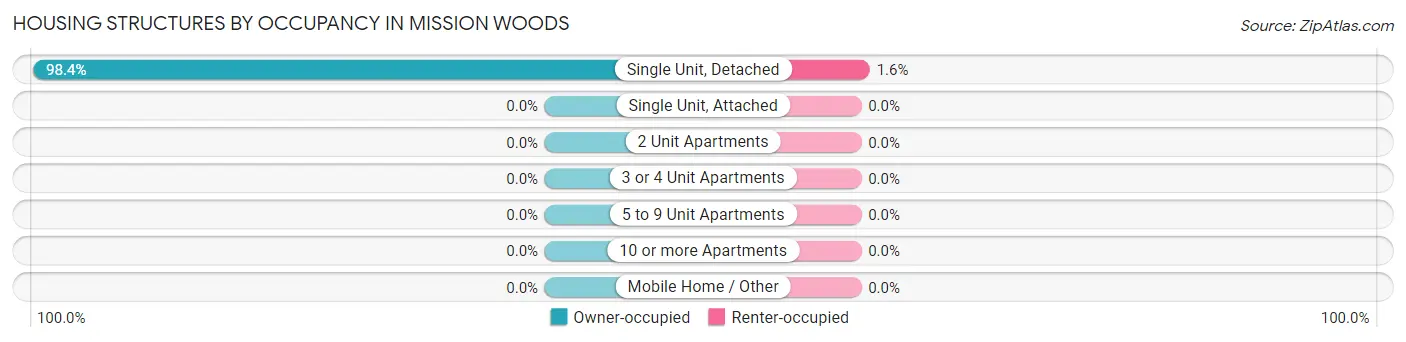
| Structure Type | Owner-occupied | Renter-occupied |
| Single Unit, Detached | 60 (98.4%) | 1 (1.6%) |
| Single Unit, Attached | 0 (0.0%) | 0 (0.0%) |
| 2 Unit Apartments | 0 (0.0%) | 0 (0.0%) |
| 3 or 4 Unit Apartments | 0 (0.0%) | 0 (0.0%) |
| 5 to 9 Unit Apartments | 0 (0.0%) | 0 (0.0%) |
| 10 or more Apartments | 0 (0.0%) | 0 (0.0%) |
| Mobile Home / Other | 0 (0.0%) | 0 (0.0%) |
| Total | 60 (98.4%) | 1 (1.6%) |
Housing Structures by Number of Rooms in Mission Woods
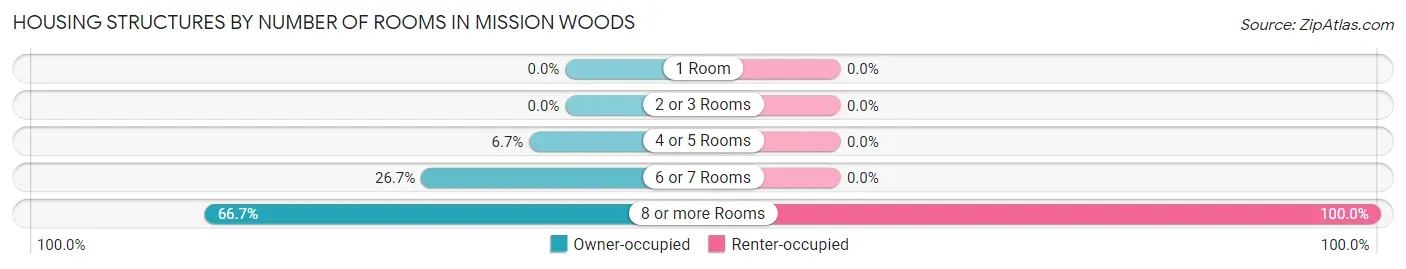
| Number of Rooms | Owner-occupied | Renter-occupied |
| 1 Room | 0 (0.0%) | 0 (0.0%) |
| 2 or 3 Rooms | 0 (0.0%) | 0 (0.0%) |
| 4 or 5 Rooms | 4 (6.7%) | 0 (0.0%) |
| 6 or 7 Rooms | 16 (26.7%) | 0 (0.0%) |
| 8 or more Rooms | 40 (66.7%) | 1 (100.0%) |
| Total | 60 (100.0%) | 1 (100.0%) |
Housing Structure by Heating Type in Mission Woods
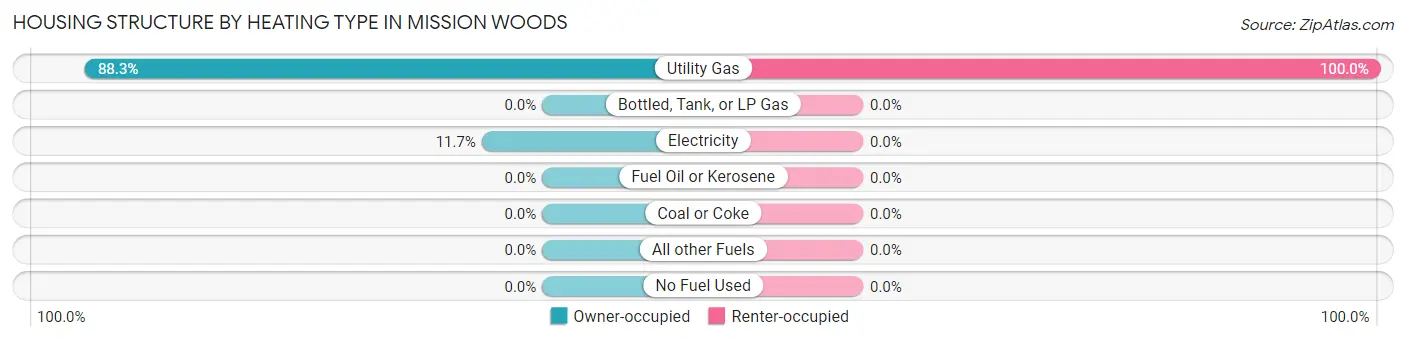
| Heating Type | Owner-occupied | Renter-occupied |
| Utility Gas | 53 (88.3%) | 1 (100.0%) |
| Bottled, Tank, or LP Gas | 0 (0.0%) | 0 (0.0%) |
| Electricity | 7 (11.7%) | 0 (0.0%) |
| Fuel Oil or Kerosene | 0 (0.0%) | 0 (0.0%) |
| Coal or Coke | 0 (0.0%) | 0 (0.0%) |
| All other Fuels | 0 (0.0%) | 0 (0.0%) |
| No Fuel Used | 0 (0.0%) | 0 (0.0%) |
| Total | 60 (100.0%) | 1 (100.0%) |
Household Vehicle Usage in Mission Woods
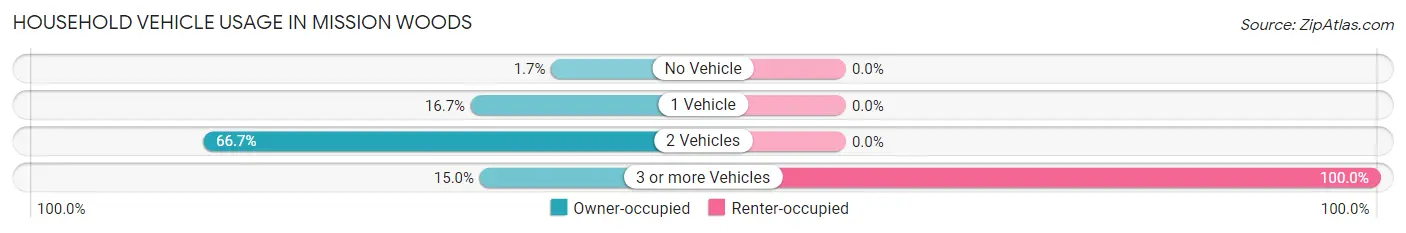
| Vehicles per Household | Owner-occupied | Renter-occupied |
| No Vehicle | 1 (1.7%) | 0 (0.0%) |
| 1 Vehicle | 10 (16.7%) | 0 (0.0%) |
| 2 Vehicles | 40 (66.7%) | 0 (0.0%) |
| 3 or more Vehicles | 9 (15.0%) | 1 (100.0%) |
| Total | 60 (100.0%) | 1 (100.0%) |
Real Estate & Mortgages in Mission Woods
Real Estate and Mortgage Overview in Mission Woods
| Characteristic | Without Mortgage | With Mortgage |
| Housing Units | 28 | 32 |
| Median Property Value | $625,000 | $781,300 |
| Median Household Income | $220,000 | $17 |
| Monthly Housing Costs | $1,333 | $20 |
| Real Estate Taxes | $8,000 | $0 |
Property Value by Mortgage Status in Mission Woods
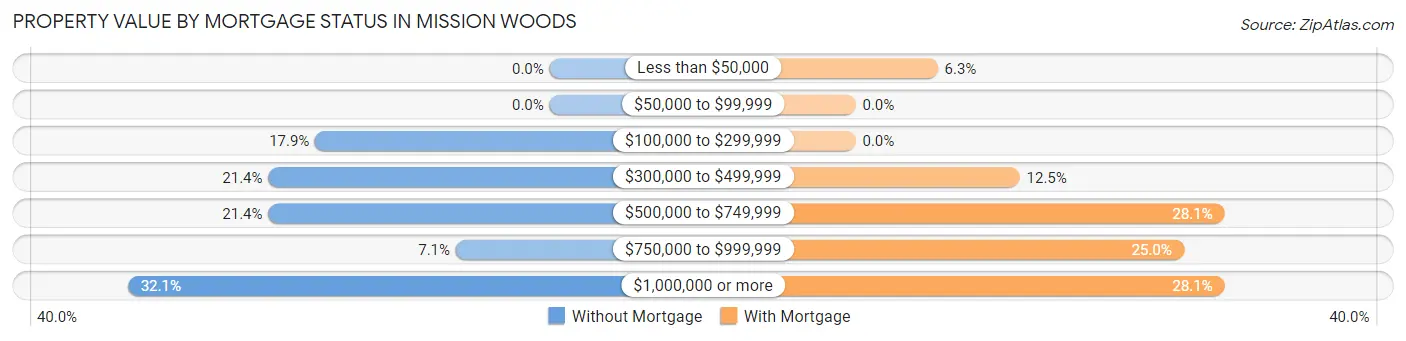
| Property Value | Without Mortgage | With Mortgage |
| Less than $50,000 | 0 (0.0%) | 2 (6.2%) |
| $50,000 to $99,999 | 0 (0.0%) | 0 (0.0%) |
| $100,000 to $299,999 | 5 (17.9%) | 0 (0.0%) |
| $300,000 to $499,999 | 6 (21.4%) | 4 (12.5%) |
| $500,000 to $749,999 | 6 (21.4%) | 9 (28.1%) |
| $750,000 to $999,999 | 2 (7.1%) | 8 (25.0%) |
| $1,000,000 or more | 9 (32.1%) | 9 (28.1%) |
| Total | 28 (100.0%) | 32 (100.0%) |
Household Income by Mortgage Status in Mission Woods
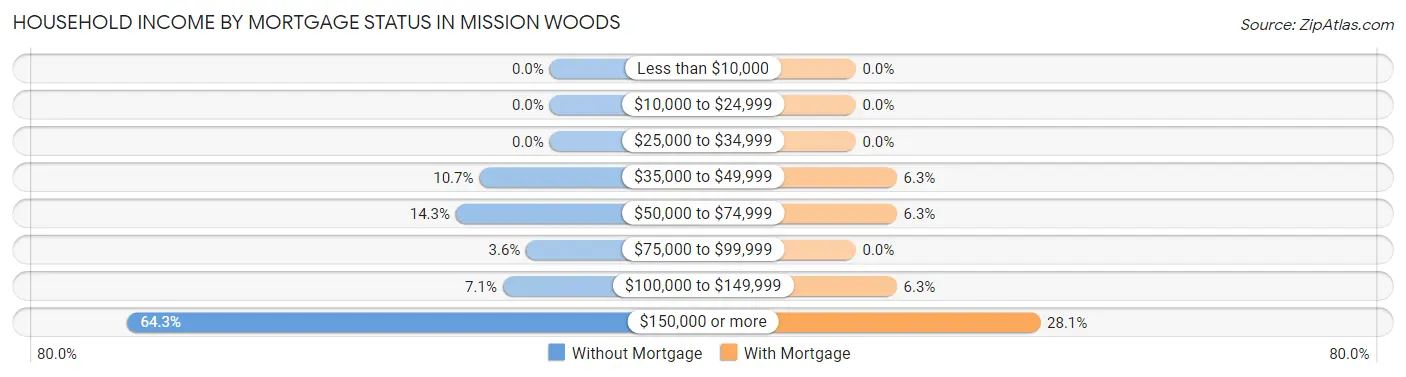
| Household Income | Without Mortgage | With Mortgage |
| Less than $10,000 | 0 (0.0%) | 0 (0.0%) |
| $10,000 to $24,999 | 0 (0.0%) | 0 (0.0%) |
| $25,000 to $34,999 | 0 (0.0%) | 0 (0.0%) |
| $35,000 to $49,999 | 3 (10.7%) | 2 (6.2%) |
| $50,000 to $74,999 | 4 (14.3%) | 2 (6.2%) |
| $75,000 to $99,999 | 1 (3.6%) | 0 (0.0%) |
| $100,000 to $149,999 | 2 (7.1%) | 2 (6.2%) |
| $150,000 or more | 18 (64.3%) | 9 (28.1%) |
| Total | 28 (100.0%) | 32 (100.0%) |
Property Value to Household Income Ratio in Mission Woods
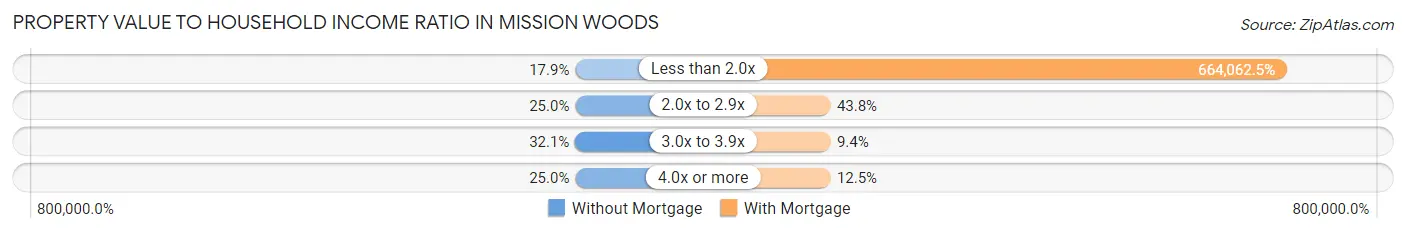
| Value-to-Income Ratio | Without Mortgage | With Mortgage |
| Less than 2.0x | 5 (17.9%) | 212,500 (664,062.5%) |
| 2.0x to 2.9x | 7 (25.0%) | 14 (43.8%) |
| 3.0x to 3.9x | 9 (32.1%) | 3 (9.4%) |
| 4.0x or more | 7 (25.0%) | 4 (12.5%) |
| Total | 28 (100.0%) | 32 (100.0%) |
Real Estate Taxes by Mortgage Status in Mission Woods
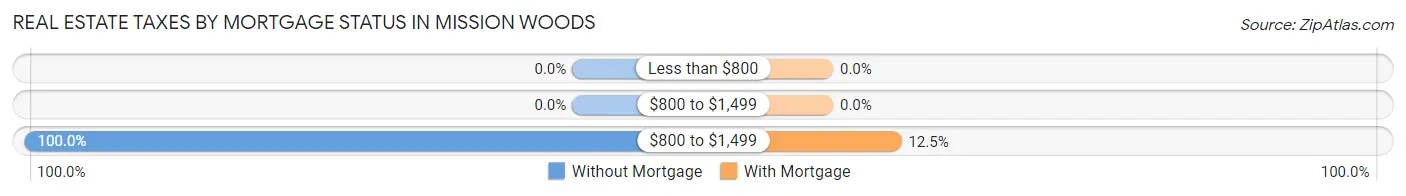
| Property Taxes | Without Mortgage | With Mortgage |
| Less than $800 | 0 (0.0%) | 0 (0.0%) |
| $800 to $1,499 | 0 (0.0%) | 0 (0.0%) |
| $800 to $1,499 | 28 (100.0%) | 4 (12.5%) |
| Total | 28 (100.0%) | 32 (100.0%) |
Health & Disability in Mission Woods
Health Insurance Coverage by Age in Mission Woods
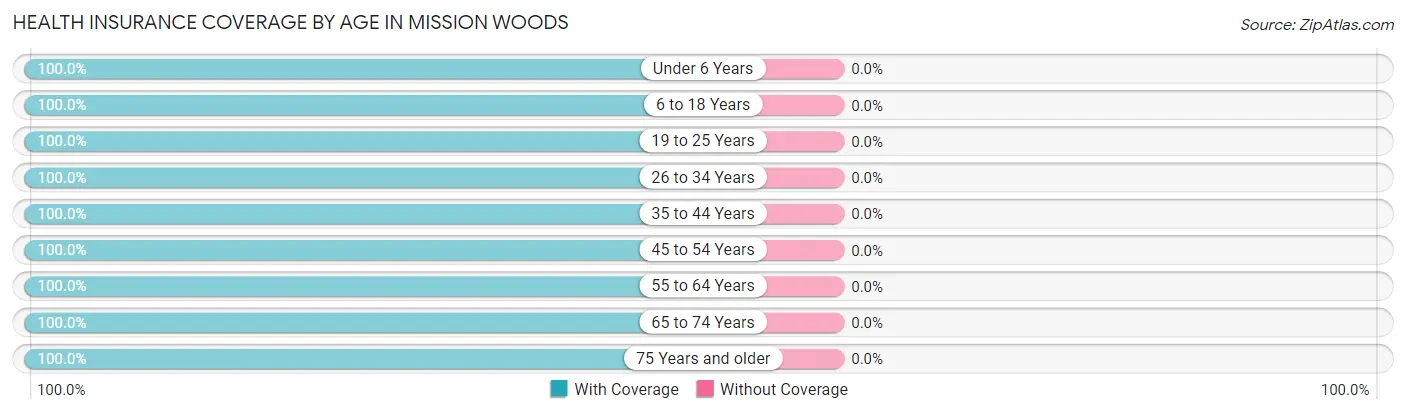
| Age Bracket | With Coverage | Without Coverage |
| Under 6 Years | 11 (100.0%) | 0 (0.0%) |
| 6 to 18 Years | 25 (100.0%) | 0 (0.0%) |
| 19 to 25 Years | 2 (100.0%) | 0 (0.0%) |
| 26 to 34 Years | 10 (100.0%) | 0 (0.0%) |
| 35 to 44 Years | 23 (100.0%) | 0 (0.0%) |
| 45 to 54 Years | 19 (100.0%) | 0 (0.0%) |
| 55 to 64 Years | 25 (100.0%) | 0 (0.0%) |
| 65 to 74 Years | 31 (100.0%) | 0 (0.0%) |
| 75 Years and older | 9 (100.0%) | 0 (0.0%) |
| Total | 155 (100.0%) | 0 (0.0%) |
Health Insurance Coverage by Citizenship Status in Mission Woods
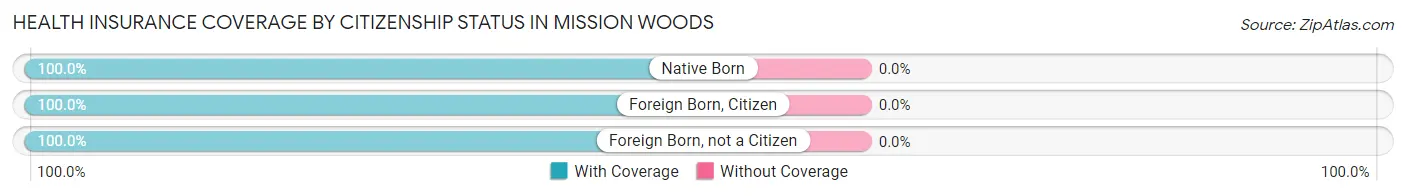
| Citizenship Status | With Coverage | Without Coverage |
| Native Born | 11 (100.0%) | 0 (0.0%) |
| Foreign Born, Citizen | 25 (100.0%) | 0 (0.0%) |
| Foreign Born, not a Citizen | 2 (100.0%) | 0 (0.0%) |
Health Insurance Coverage by Household Income in Mission Woods
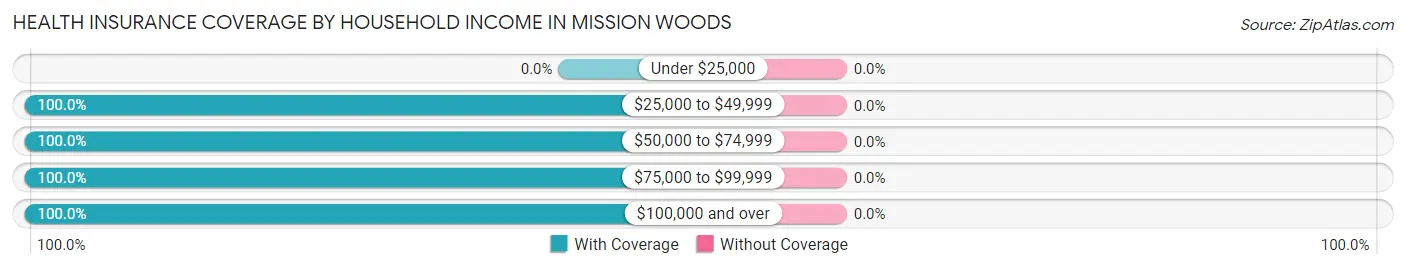
| Household Income | With Coverage | Without Coverage |
| Under $25,000 | 0 (0.0%) | 0 (0.0%) |
| $25,000 to $49,999 | 9 (100.0%) | 0 (0.0%) |
| $50,000 to $74,999 | 12 (100.0%) | 0 (0.0%) |
| $75,000 to $99,999 | 14 (100.0%) | 0 (0.0%) |
| $100,000 and over | 120 (100.0%) | 0 (0.0%) |
Public vs Private Health Insurance Coverage by Age in Mission Woods
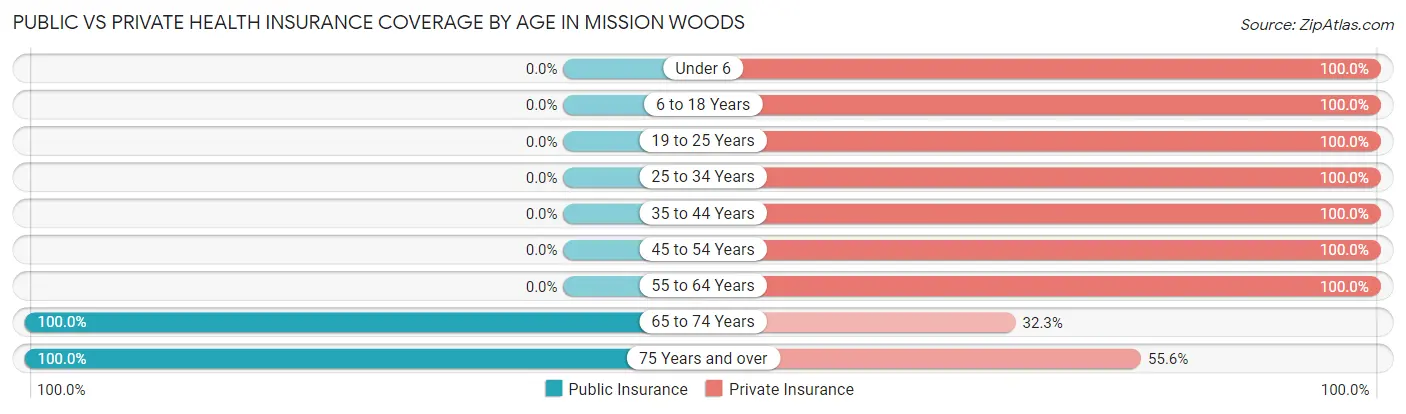
| Age Bracket | Public Insurance | Private Insurance |
| Under 6 | 0 (0.0%) | 11 (100.0%) |
| 6 to 18 Years | 0 (0.0%) | 25 (100.0%) |
| 19 to 25 Years | 0 (0.0%) | 2 (100.0%) |
| 25 to 34 Years | 0 (0.0%) | 10 (100.0%) |
| 35 to 44 Years | 0 (0.0%) | 23 (100.0%) |
| 45 to 54 Years | 0 (0.0%) | 19 (100.0%) |
| 55 to 64 Years | 0 (0.0%) | 25 (100.0%) |
| 65 to 74 Years | 31 (100.0%) | 10 (32.3%) |
| 75 Years and over | 9 (100.0%) | 5 (55.6%) |
| Total | 40 (25.8%) | 130 (83.9%) |
Disability Status by Sex by Age in Mission Woods
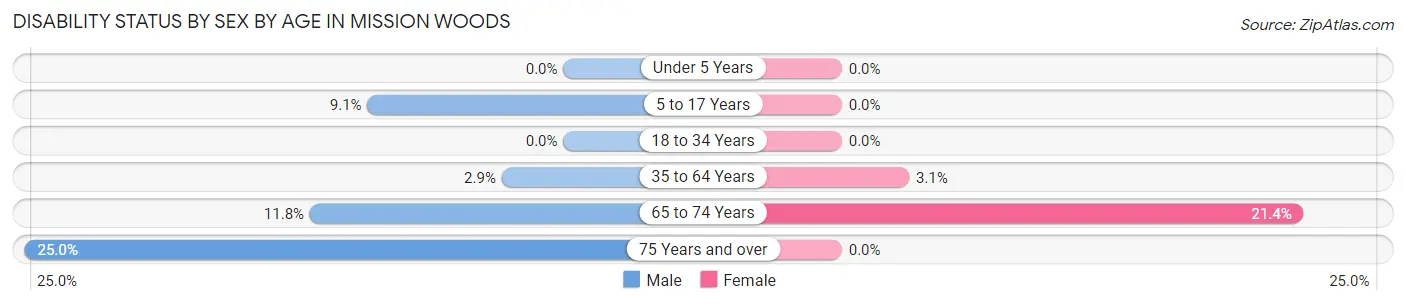
| Age Bracket | Male | Female |
| Under 5 Years | 0 (0.0%) | 0 (0.0%) |
| 5 to 17 Years | 1 (9.1%) | 0 (0.0%) |
| 18 to 34 Years | 0 (0.0%) | 0 (0.0%) |
| 35 to 64 Years | 1 (2.9%) | 1 (3.1%) |
| 65 to 74 Years | 2 (11.8%) | 3 (21.4%) |
| 75 Years and over | 1 (25.0%) | 0 (0.0%) |
Disability Class by Sex by Age in Mission Woods
Disability Class: Hearing Difficulty
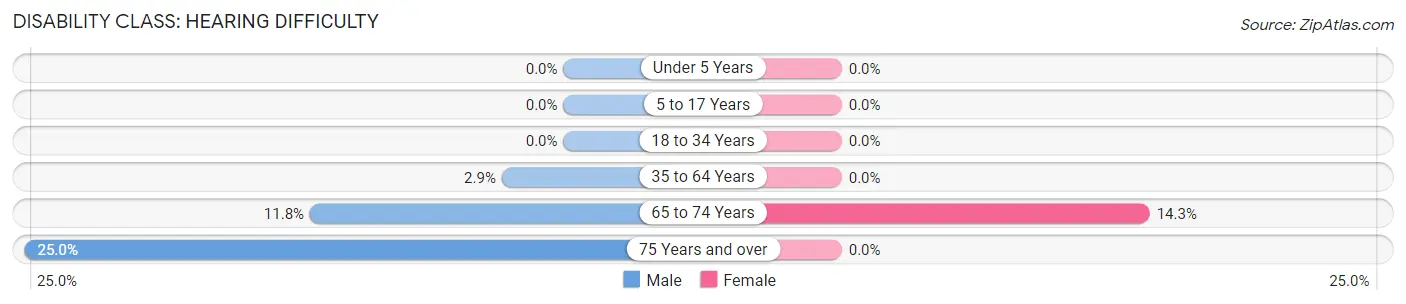
| Age Bracket | Male | Female |
| Under 5 Years | 0 (0.0%) | 0 (0.0%) |
| 5 to 17 Years | 0 (0.0%) | 0 (0.0%) |
| 18 to 34 Years | 0 (0.0%) | 0 (0.0%) |
| 35 to 64 Years | 1 (2.9%) | 0 (0.0%) |
| 65 to 74 Years | 2 (11.8%) | 2 (14.3%) |
| 75 Years and over | 1 (25.0%) | 0 (0.0%) |
Disability Class: Vision Difficulty
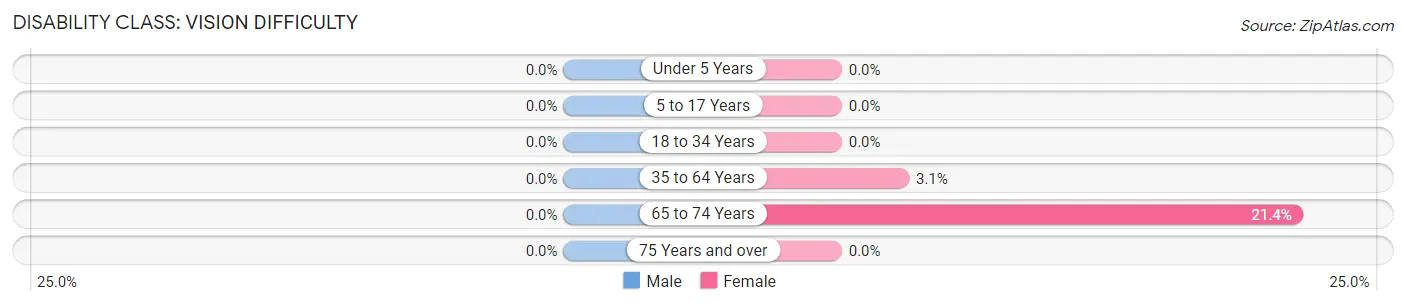
| Age Bracket | Male | Female |
| Under 5 Years | 0 (0.0%) | 0 (0.0%) |
| 5 to 17 Years | 0 (0.0%) | 0 (0.0%) |
| 18 to 34 Years | 0 (0.0%) | 0 (0.0%) |
| 35 to 64 Years | 0 (0.0%) | 1 (3.1%) |
| 65 to 74 Years | 0 (0.0%) | 3 (21.4%) |
| 75 Years and over | 0 (0.0%) | 0 (0.0%) |
Disability Class: Cognitive Difficulty
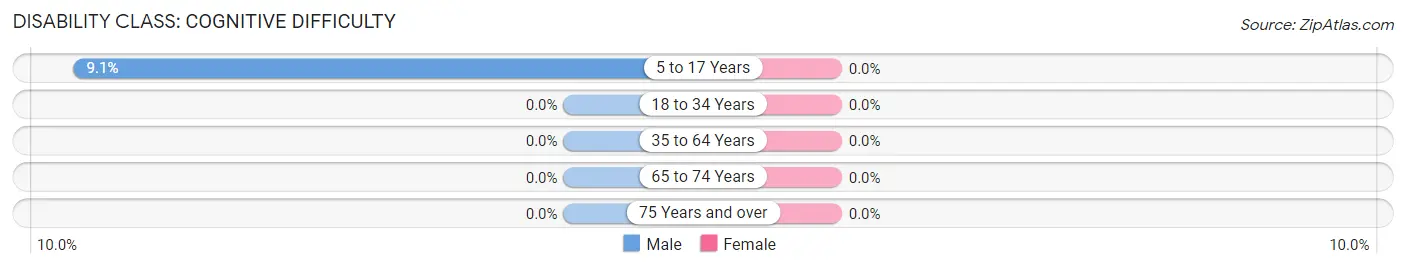
| Age Bracket | Male | Female |
| 5 to 17 Years | 1 (9.1%) | 0 (0.0%) |
| 18 to 34 Years | 0 (0.0%) | 0 (0.0%) |
| 35 to 64 Years | 0 (0.0%) | 0 (0.0%) |
| 65 to 74 Years | 0 (0.0%) | 0 (0.0%) |
| 75 Years and over | 0 (0.0%) | 0 (0.0%) |
Disability Class: Ambulatory Difficulty
| Age Bracket | Male | Female |
| 5 to 17 Years | 0 (0.0%) | 0 (0.0%) |
| 18 to 34 Years | 0 (0.0%) | 0 (0.0%) |
| 35 to 64 Years | 0 (0.0%) | 0 (0.0%) |
| 65 to 74 Years | 0 (0.0%) | 0 (0.0%) |
| 75 Years and over | 0 (0.0%) | 0 (0.0%) |
Disability Class: Self-Care Difficulty
| Age Bracket | Male | Female |
| 5 to 17 Years | 0 (0.0%) | 0 (0.0%) |
| 18 to 34 Years | 0 (0.0%) | 0 (0.0%) |
| 35 to 64 Years | 0 (0.0%) | 0 (0.0%) |
| 65 to 74 Years | 0 (0.0%) | 0 (0.0%) |
| 75 Years and over | 0 (0.0%) | 0 (0.0%) |
Technology Access in Mission Woods
Computing Device Access in Mission Woods
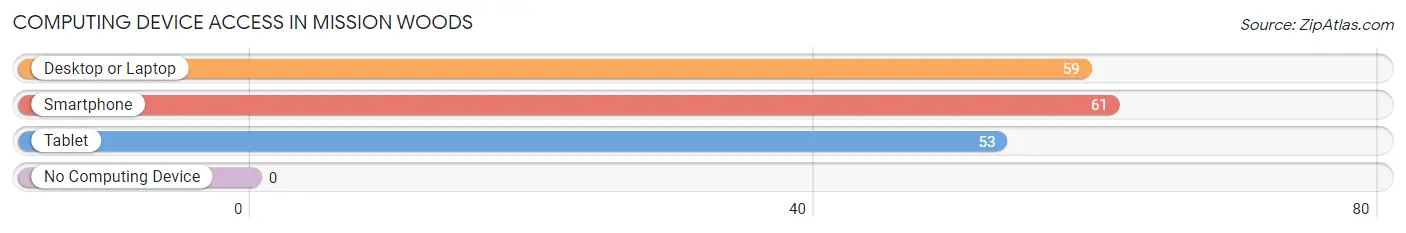
| Device Type | # Households | % Households |
| Desktop or Laptop | 59 | 96.7% |
| Smartphone | 61 | 100.0% |
| Tablet | 53 | 86.9% |
| No Computing Device | 0 | 0.0% |
| Total | 61 | 100.0% |
Internet Access in Mission Woods
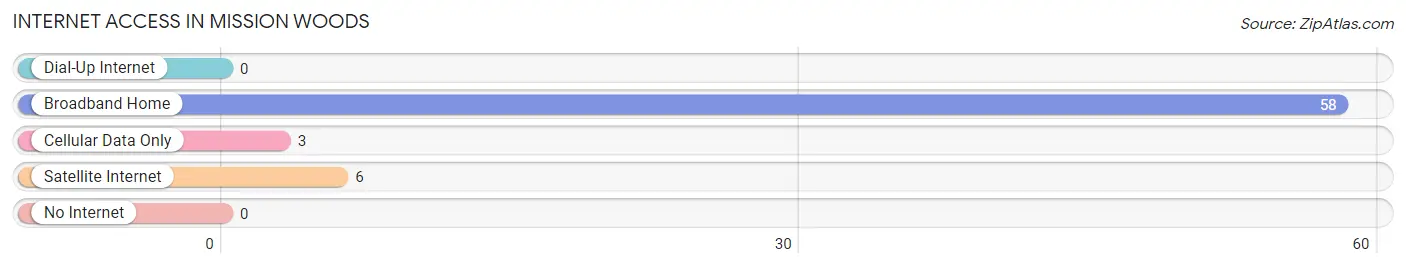
| Internet Type | # Households | % Households |
| Dial-Up Internet | 0 | 0.0% |
| Broadband Home | 58 | 95.1% |
| Cellular Data Only | 3 | 4.9% |
| Satellite Internet | 6 | 9.8% |
| No Internet | 0 | 0.0% |
| Total | 61 | 100.0% |
Mission Woods Summary
Woods, Kansas is a small city located in the northeastern corner of the state, just south of the Nebraska border. It is part of the Kansas City metropolitan area and is home to a population of just over 1,000 people. The city is known for its rural charm and its close proximity to the larger cities of Kansas City and Omaha.
History
Woods, Kansas was founded in 1887 by a group of settlers from the nearby town of Leavenworth. The settlers were looking for a place to settle and start a new life, and they chose the area that is now Woods. The town was named after the Woods family, who were among the first settlers.
The town grew slowly but steadily over the years, and by the early 1900s it had become a thriving community. The town was home to a variety of businesses, including a general store, a blacksmith shop, a hotel, and a post office. The town also had a school, a church, and a library.
In the 1920s, the town began to experience a decline in population as people moved away to larger cities. This trend continued until the 1950s, when the population began to slowly increase again. By the 1970s, the population had grown to over 1,000 people.
Geography
Woods, Kansas is located in the northeastern corner of the state, just south of the Nebraska border. The city is situated on the banks of the Missouri River, and is surrounded by rolling hills and farmland. The city is located about 25 miles from the larger cities of Kansas City and Omaha.
The climate in Woods is typical of the Midwest, with hot summers and cold winters. The average temperature in the summer is around 80 degrees Fahrenheit, and the average temperature in the winter is around 30 degrees Fahrenheit.
Economy
The economy of Woods, Kansas is largely based on agriculture. The city is home to several farms, and the surrounding area is known for its production of corn, soybeans, and wheat. The city also has a few small businesses, including a grocery store, a hardware store, and a few restaurants.
The city is also home to a few manufacturing companies, including a plastics factory and a metal fabrication plant. The city is also home to a few small technology companies, which provide jobs for many of the city’s residents.
Demographics
As of the 2010 census, the population of Woods, Kansas was 1,072. The population is mostly white, with a small percentage of African Americans, Hispanics, and Asians. The median household income in the city is $45,000, and the median home value is $125,000.
The city is served by the Woods-Omaha School District, which includes two elementary schools, a middle school, and a high school. The city also has a public library and a few parks.
Conclusion
Woods, Kansas is a small city located in the northeastern corner of the state, just south of the Nebraska border. The city is known for its rural charm and its close proximity to the larger cities of Kansas City and Omaha. The economy of Woods is largely based on agriculture, and the city is home to several small businesses and manufacturing companies. The population of Woods is mostly white, with a small percentage of African Americans, Hispanics, and Asians. The city is served by the Woods-Omaha School District, and has a public library and a few parks.
Common Questions
What is Per Capita Income in Mission Woods?
Per Capita income in Mission Woods is $166,879.
What is the Median Family Income in Mission Woods?
Median Family Income in Mission Woods is $250,001.
What is the Median Household income in Mission Woods?
Median Household Income in Mission Woods is $198,750.
What is Inequality or Gini Index in Mission Woods?
Inequality or Gini Index in Mission Woods is 0.54.
What is the Total Population of Mission Woods?
Total Population of Mission Woods is 155.
What is the Total Male Population of Mission Woods?
Total Male Population of Mission Woods is 80.
What is the Total Female Population of Mission Woods?
Total Female Population of Mission Woods is 75.
What is the Ratio of Males per 100 Females in Mission Woods?
There are 106.67 Males per 100 Females in Mission Woods.
What is the Ratio of Females per 100 Males in Mission Woods?
There are 93.75 Females per 100 Males in Mission Woods.
What is the Median Population Age in Mission Woods?
Median Population Age in Mission Woods is 46.2 Years.
What is the Average Family Size in Mission Woods
Average Family Size in Mission Woods is 2.8 People.
What is the Average Household Size in Mission Woods
Average Household Size in Mission Woods is 2.5 People.
How Large is the Labor Force in Mission Woods?
There are 86 People in the Labor Forcein in Mission Woods.
What is the Percentage of People in the Labor Force in Mission Woods?
71.7% of People are in the Labor Force in Mission Woods.
What is the Unemployment Rate in Mission Woods?
Unemployment Rate in Mission Woods is 5.8%.